Workshop QA/QC 2-3 Oct 2004 Copenhagen Comparing National GHG Inventories with Independent Estimates Including Inverse Monitoring Peter Bergamaschi, Frank Dentener, Adrian Leip, Frank Raes , European Commission, Joint Research Centre, Ispra, Italy
Transcript
Workshop QA/QC 2-3 Oct 2004 Copenhagen
Comparing National GHG Inventories with Independent Estimates Including Inverse Monitoring
Peter Bergamaschi, Frank Dentener, Adrian Leip, Frank Raes,
European Commission, Joint Research Centre, Ispra, Italy
Workshop QA/QC 2-3 Oct 2004 Copenhagen
VERIFICATION
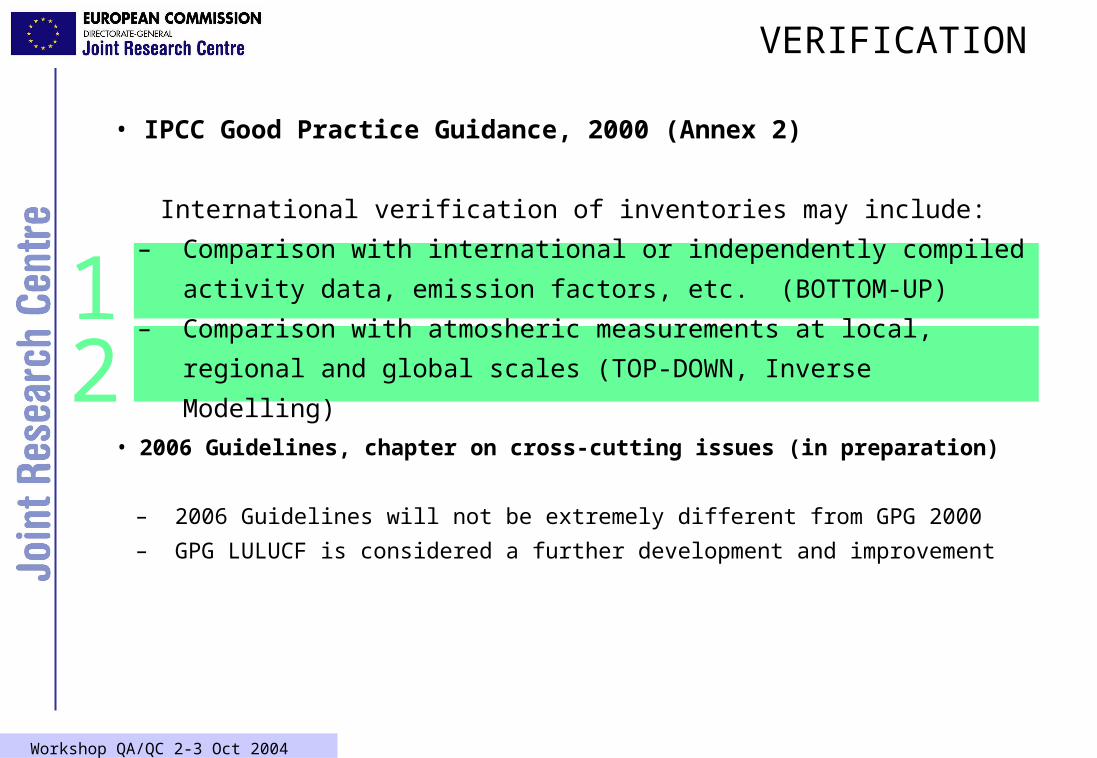
• IPCC Good Practice Guidance, 2000 (Annex 2)
International verification of inventories may include:
– Comparison with international or independently compiled activity data,
emission factors, etc. (BOTTOM-UP)
– Comparison with atmosheric measurements at local, regional and
global scales (TOP-DOWN, Inverse Modelling)
• 2006 Guidelines, chapter on cross-cutting issues (in preparation)
– 2006 Guidelines will not be extremely different from GPG 2000
– GPG LULUCF is considered a further development and improvement
12
Workshop QA/QC 2-3 Oct 2004 Copenhagen
Soil data
ESB (European Soil Bureau), IES JRC
• 1:1,000,000
• Italy 1:250k SOC
Land cover
• CORINE
Meteo
• MARS unit (monitoring Agriculture with remote sensing)
Atmospheric N deposition:
• EMEP -
Crop Data
• Eurostat (Farm Structure Survey)
• Disaggregated to lower level
• ISTAT crop data NUTS level 3(Nomenclature of territorial Units for statistics)
Fertiliser application
• International Fertiliser Industry Association (IFA)
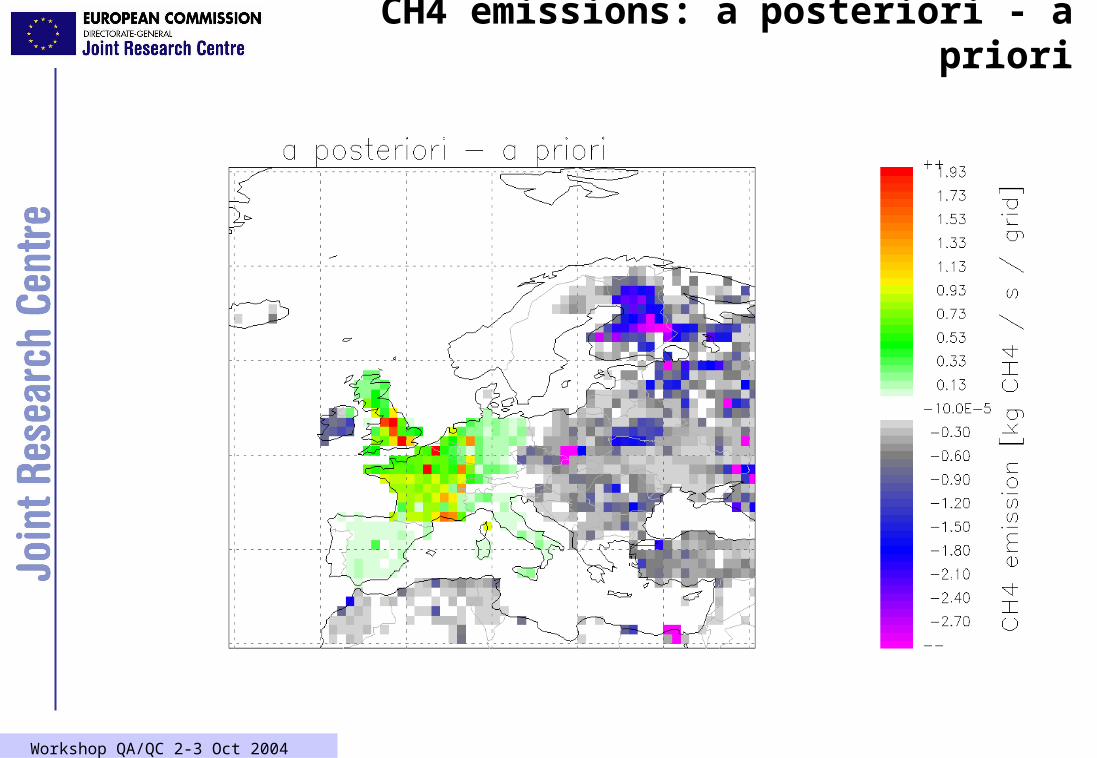
• IM gives emissions consistent with atmospheric concentrations!
• IM suggests higher CH4 emissions (year 2001) for some major EU-15 emitters compared to UNFCCC values (EU NIR 2003):
Germany +65 %
France + 46 %
UK +91%
• EU NIR 2004: Revision of German emission:
• lower CH4 emissions from Finland (wetlands)
• EU-15 totals close to UNFCCC (10-30 %), but …
Workshop QA/QC 2-3 Oct 2004 Copenhagen
General Conclusions: Verification
• BOTTOM-UP and TOP-DOWN Verification is feasible, and in some cases gives results that are robust and can be compared with official NIR’s
• Verification is swhown to:- provide inputs to improve inventories- build confidence in emissions estimates and trends- help to improve scientific understanding related to emission inventories
(IPCC GPG 2000)
Workshop QA/QC 2-3 Oct 2004 Copenhagen
Workshop QA/QC 2-3 Oct 2004 Copenhagen
CH4 measurements in Schauinsland
Workshop QA/QC 2-3 Oct 2004 Copenhagen
further European stations
complete set of stations ftp://ftp.ei.jrc.it/pub/bergamas/CH4BR/
Workshop QA/QC 2-3 Oct 2004 Copenhagen
top-down vs. bottom up (EU NIR 2003)
Workshop QA/QC 2-3 Oct 2004 Copenhagen
top-down vs. bottom up (EU NIR 2004)
Workshop QA/QC 2-3 Oct 2004 Copenhagen
• offline atmospheric transport model
• meteo from ECMWF
• global simulation 6o x 4o
• zooming 1o x 1o (Europe, …)
• http://www.phys.uu.nl/~tm5/
atmospheric transport model TM5
Workshop QA/QC 2-3 Oct 2004 Copenhagen
CH4 emission distribution - a posteriori
Workshop QA/QC 2-3 Oct 2004 Copenhagen
CH4 observations CH4 emissionsInverse model
In situ measurements
satellite measurements
meteoBottom-up inventories
4D VAR data assimilation
"big-region" inversion
Inverse modelling of CH4 emissions
Workshop QA/QC 2-3 Oct 2004 Copenhagen
Global and European regions
Workshop QA/QC 2-3 Oct 2004 Copenhagen
EU NIR 2004revision of German CH4 inventory
2.40 to 4.04 Tg CH4/yr (year 2001); revision of whole time series
• manure management (0.21 -> 1.31 Tg CH4/yr), mainly due to increased CH4 conversion factors from liquid manure management systems
• consideration of manure management systems by district
• incorporation of smaller Bundeslaender, which in previous reports had not been included
Workshop QA/QC 2-3 Oct 2004 Copenhagen
Forward simulation for Pallas (2002)
a priori emission inventory (3 Tg CH4/ yr from Finnish wetlands) yields much too high CH4 mixing ratios during summer