38
World Agricultural Outlook Board Interagency Commodity Estimates Committee Forecasts May 12, 2015
| Date post: | 26-Jul-2015 |
| Category: |
Data & Analytics |
| Upload: | medfordcooperative |
| View: | 61 times |
| Download: | 2 times |
World Agricultural Outlook BoardInteragency Commodity Estimates Committee Forecasts
May 12, 2015
May 12, 2015
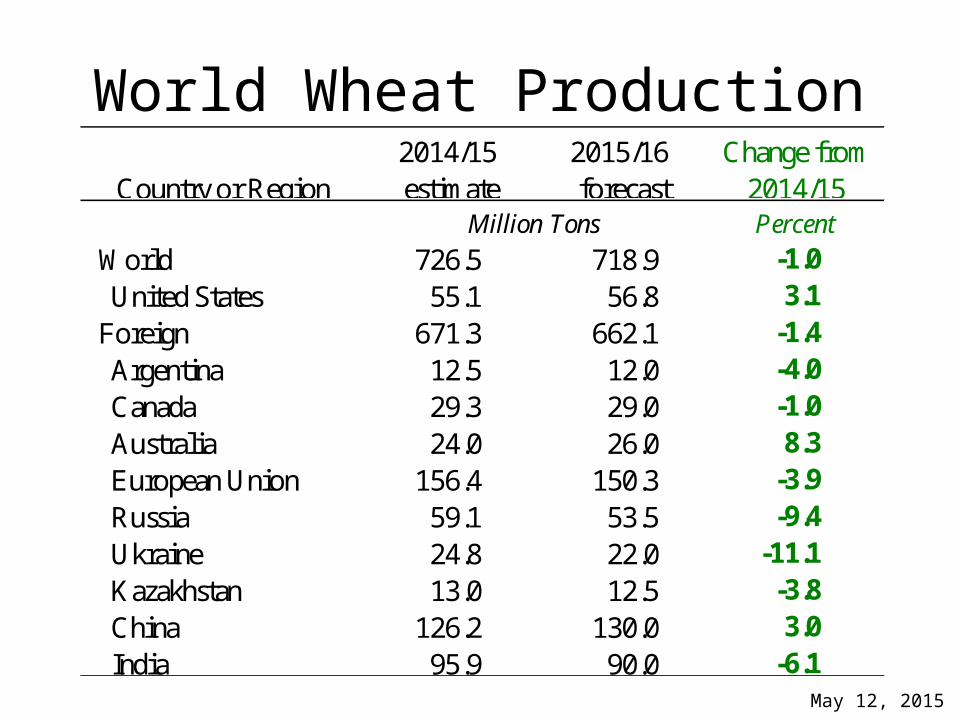
World Wheat Production
Country or Region2014/15 estimate
2015/16 forecast
Change from 2014/15
Million Tons Percent
World 726.5 718.9 -1.0United States 55.1 56.8 3.1
Foreign 671.3 662.1 -1.4Argentina 12.5 12.0 -4.0Canada 29.3 29.0 -1.0Australia 24.0 26.0 8.3European Union 156.4 150.3 -3.9Russia 59.1 53.5 -9.4Ukraine 24.8 22.0 -11.1Kazakhstan 13.0 12.5 -3.8China 126.2 130.0 3.0India 95.9 90.0 -6.1

1990 Analog: Year-to-Year production down 4.2 mmt.
May 12, 2015

2000
2001
2002
2003
2004
2005
2006
2007
2008
2009
2010
2011
2012
2013
2014
2015
0
10
20
30
40
50
60
70
0.0
0.5
1.0
1.5
2.0
2.5
3.0
Russia Wheat: Estimated Area, Yield, and Production
Harvested area Output Yield
Are
a (M
ha) a
nd O
utpu
t (M
MT)
Yiel
d (T
/Ha)
Output is forecast at 53.5 million tons against 59.1 million last year. Yield is down 14% from last year’s record but
essentially matches the 5-year average.
May 12, 2015

May 12, 2015
World Wheat Supply and Use
Country or Region2014/15 estimate
2015/16 forecast
Change from 2014/15
Million Tons Percent
Beginning stocks 190.0 201.0 5.8Production 726.5 718.9 -1.0Total Supply 916.4 919.9 0.4
Feed use 141.4 136.1 -3.8Total use 715.5 716.6 0.2
Trade 163.7 156.9 -4.1Ending Stocks 201.0 203.3 1.2

May 12, 2015
U.S. Wheat Supply and Demand2014/15 estimate
2015/16 forecast
Change from 2014/15Percent
Planted area (million acres) 56.8 55.4 -2.6Harvested area (million acres) 46.4 48.0 3.5Yield (bushels per acre) 43.7 43.5 -0.5
Million bushelsBeginning stocks 590 709 20.2Production 2,026 2,087 3.1Imports 150 140 -6.7Total supply 2,766 2,937 6.2
Food use 960 967 0.7Seed 77 72 -5.9Feed and residual 160 180 12.5Domestic use 1,197 1,219 1.9
Exports 860 925 7.6Total use 2,057 2,144 4.3
Ending stocks 709 793 11.8Percent
Stocks to use ratio 34.5 37.0Dollars per bushel
Average market price 6.00 4.50/5.50 -16.7
May 12, 2015
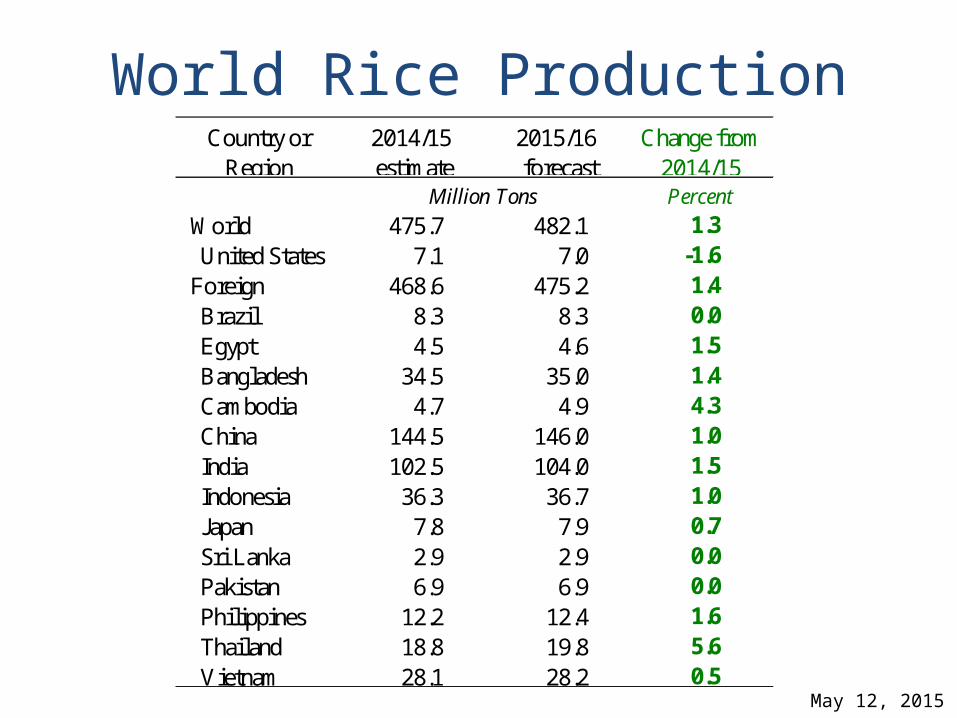
World Rice ProductionCountry or
Region2014/15 estimate
2015/16 forecast
Change from 2014/15
Million Tons Percent
World 475.7 482.1 1.3United States 7.1 7.0 -1.6
Foreign 468.6 475.2 1.4Brazil 8.3 8.3 0.0Egypt 4.5 4.6 1.5Bangladesh 34.5 35.0 1.4Cambodia 4.7 4.9 4.3China 144.5 146.0 1.0India 102.5 104.0 1.5Indonesia 36.3 36.7 1.0Japan 7.8 7.9 0.7Sri Lanka 2.9 2.9 0.0Pakistan 6.9 6.9 0.0Philippines 12.2 12.4 1.6Thailand 18.8 19.8 5.6Vietnam 28.1 28.2 0.5

0.0
1.0
2.0
3.0
4.0
5.0
6.0
7.0
94/9
595
/96
96/9
797
/98
98/9
999
/00
00/0
101
/02
02/0
303
/04
04/0
505
/06
06/0
707
/08
08/0
909
/10
10/1
111
/12
12/1
313
/14
14/1
5
Mill
ion
Hec
tare
s or
Ton
sArea Milled Production
0.0
2.0
4.0
6.0
8.0
10.0
12.0
14.0
16.0
18.0
94/9
595
/96
96/9
797
/98
98/9
999
/00
00/0
101
/02
02/0
303
/04
04/0
505
/06
06/0
707
/08
08/0
909
/10
10/1
111
/12
12/1
313
/14
14/1
5
Mill
ion
Hect
ares
or T
ons
Area Milled Production
THAILAND: Seasonal Rice Statistics
Wet Season: Rice Area & Production Dry Season: Rice Area & Production
Source: USDA/FAS/Bangkok
Foreign Agricultural ServiceOffice of Global Analysis
IPA Division
The reduction in 2014/15 dry season production is largely a result of an 24% drop inrice area owing to a government policy to restrict irrigation availability.
May 12, 2015

May 12, 2015
World Rice Supply and UseCountry or
Region2014/15 estimate
2015/16 forecast
Change from 2014/15
Million Tons Percent
Beginning stocks 107.3 98.4 -8.3Production 475.7 482.1 1.3Total Supply 583.0 580.5 -0.4Total use 484.6 489.0 0.9
Trade 43.7 42.4 -2.9Ending Stocks 98.4 91.5 -7.0

U.S. AVERAGE ALL RICE YIELDS
1/ 2015 forecast.May 12, 2015
May 12, 2015
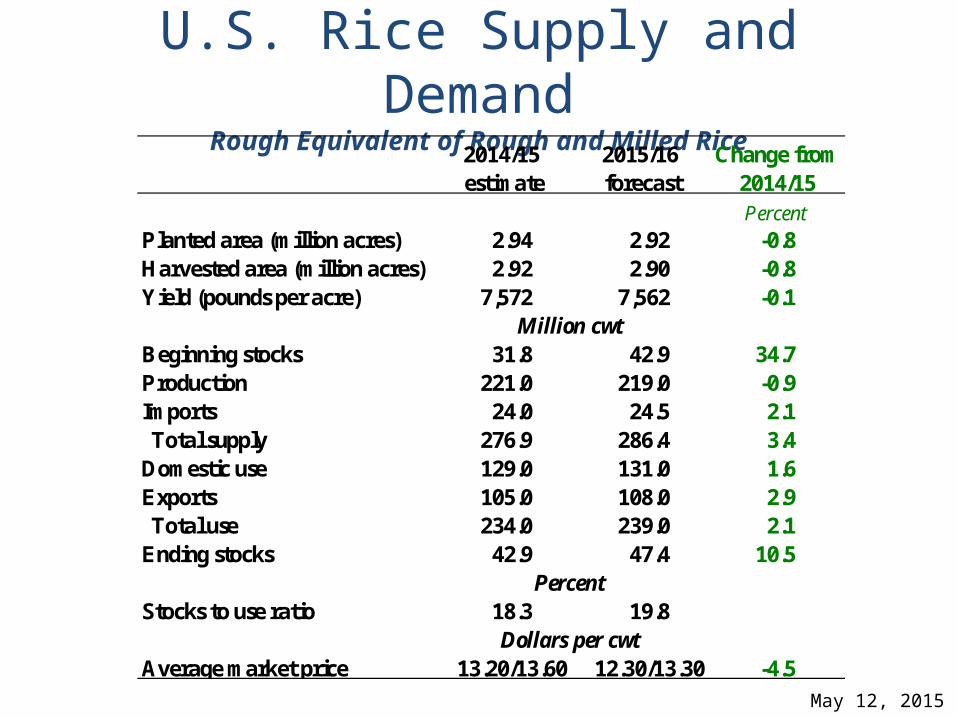
U.S. Rice Supply and DemandRough Equivalent of Rough and Milled Rice
2014/15 estimate
2015/16 forecast
Change from 2014/15Percent
Planted area (million acres) 2.94 2.92 -0.8Harvested area (million acres) 2.92 2.90 -0.8Yield (pounds per acre) 7,572 7,562 -0.1
Million cwtBeginning stocks 31.8 42.9 34.7Production 221.0 219.0 -0.9Imports 24.0 24.5 2.1Total supply 276.9 286.4 3.4
Domestic use 129.0 131.0 1.6Exports 105.0 108.0 2.9Total use 234.0 239.0 2.1
Ending stocks 42.9 47.4 10.5Percent
Stocks to use ratio 18.3 19.8Dollars per cwt
Average market price 13.20/13.60 12.30/13.30 -4.5

May 12, 2015
World Corn ProductionCountry or Region
2014/15 estimate
2015/16 forecast
Change from 2014/15
Million Tons Percent
World 996.1 989.8 -0.6United States 361.1 346.2 -4.1
Foreign 635.0 643.6 1.4Argentina 24.5 25.0 2.0Brazil 78.0 75.0 -3.8Mexico 24.0 23.5 -2.1Canada 11.5 12.3 7.0European Union 73.7 68.3 -7.2FSU-12 43.5 41.7 -4.2Ukraine 28.5 26.0 -8.6Russia 11.3 12.0 6.0
South Africa 11.3 13.5 19.5China 215.7 228.0 5.7India 22.5 23.5 4.4
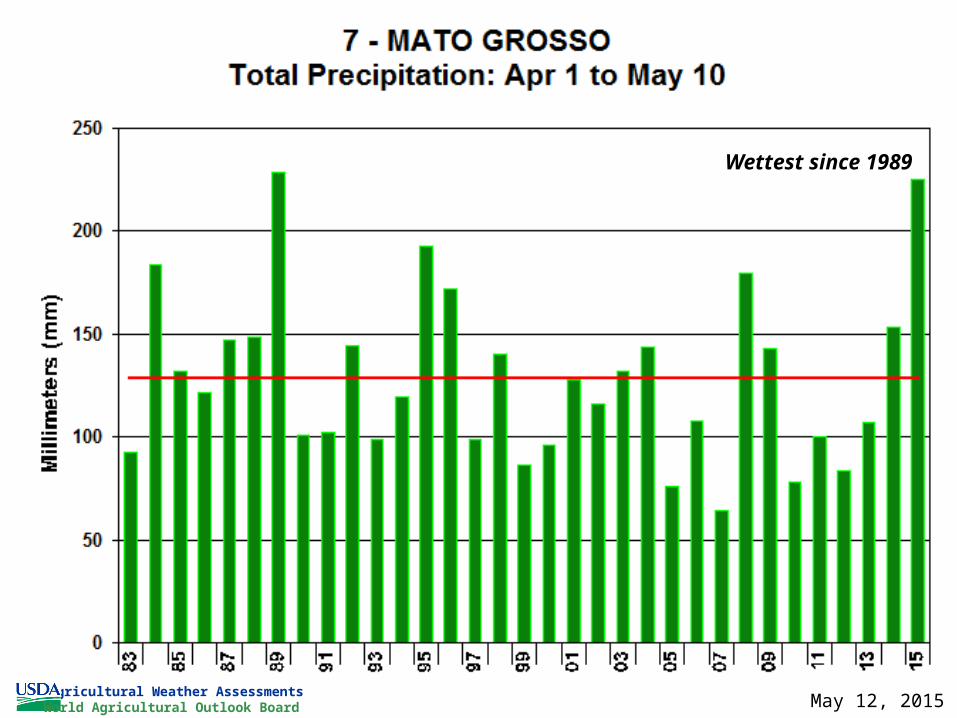
Wettest since 1989
Agricultural Weather AssessmentsWorld Agricultural Outlook Board May 12, 2015

May 12, 2015
World Corn Supply and Use
Country or Region2014/15 estimate
2015/16 forecast
Change from 2014/15
Million Tons Percent
Beginning stocks 173.8 192.5 10.8Production 996.1 989.8 -0.6Total Supply 1,169.9 1,182.3 1.1
Feed use 597.2 610.3 2.2Total use 977.4 990.4 1.3
Trade 121.0 120.9 -0.1Ending Stocks 192.5 191.9 -0.3

Corn Planting Progress May 10th
4/5
4/8
4/11
4/14
4/17
4/20
4/23
4/26
4/29 5/
25/
55/
85/
115/
145/
175/
205/
235/
265/
290
10
20
30
40
50
60
70
80
90
100
59
79
1980-2014 Avg. 2012 20132014 2015
Comparable weeks based on NASS reporting week number
Percent
Source: NASS Quick Stats 2.0 and May 11 Crop Progress
5/15
May 12, 2015

16
Mid-May Corn Planting Progress* and Final Yields
200020012002200320042005200620072008200920102011201220132014-40
-30
-20
-10
0
10
20
30
-40
-30
-20
-10
0
10
20
30
Deviation from avg. 5/15 progress Deviation from trend yield
Percentage points Bu./ac.
Source: NASS Quick Stats 2.0 and WAOB analysis* Weighted by acreage for IL, IN, IA, MN, MO, NE, OH, and SD.
May 12, 2015
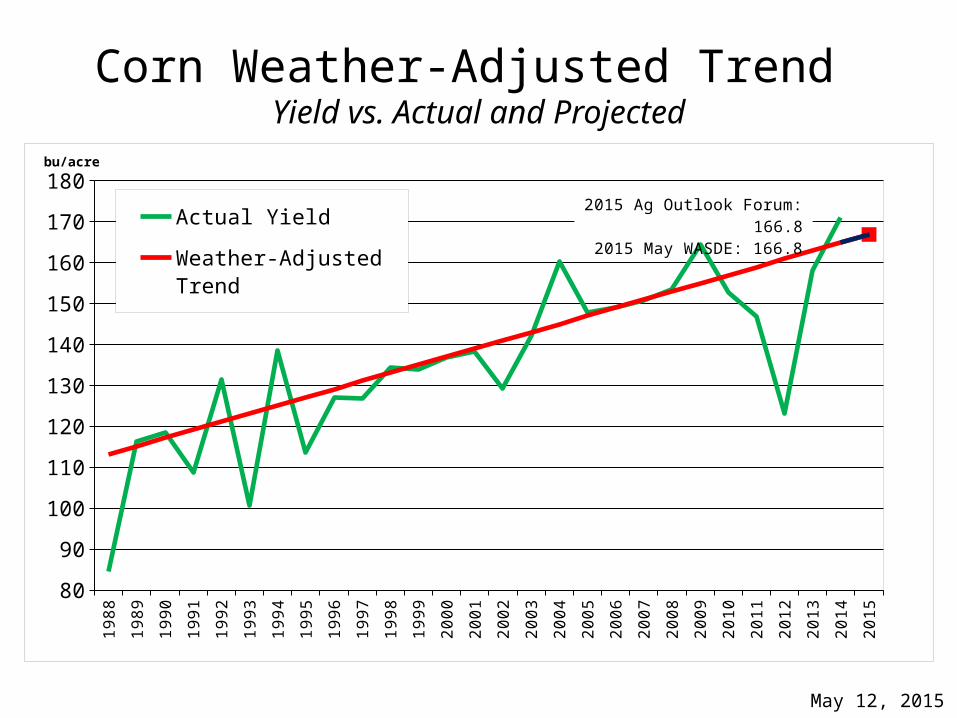
Corn Weather-Adjusted Trend Yield vs. Actual and Projected
1988
1989
1990
1991
1992
1993
1994
1995
1996
1997
1998
1999
2000
2001
2002
2003
2004
2005
2006
2007
2008
2009
2010
2011
2012
2013
2014
2015
80
90
100
110
120
130
140
150
160
170
180
Actual Yield
Weather-Adjusted Trend
May WASDE Projection
bu/acre
2015 Ag Outlook Forum: 166.82015 May WASDE: 166.8
May 12, 2015
May 12, 2015
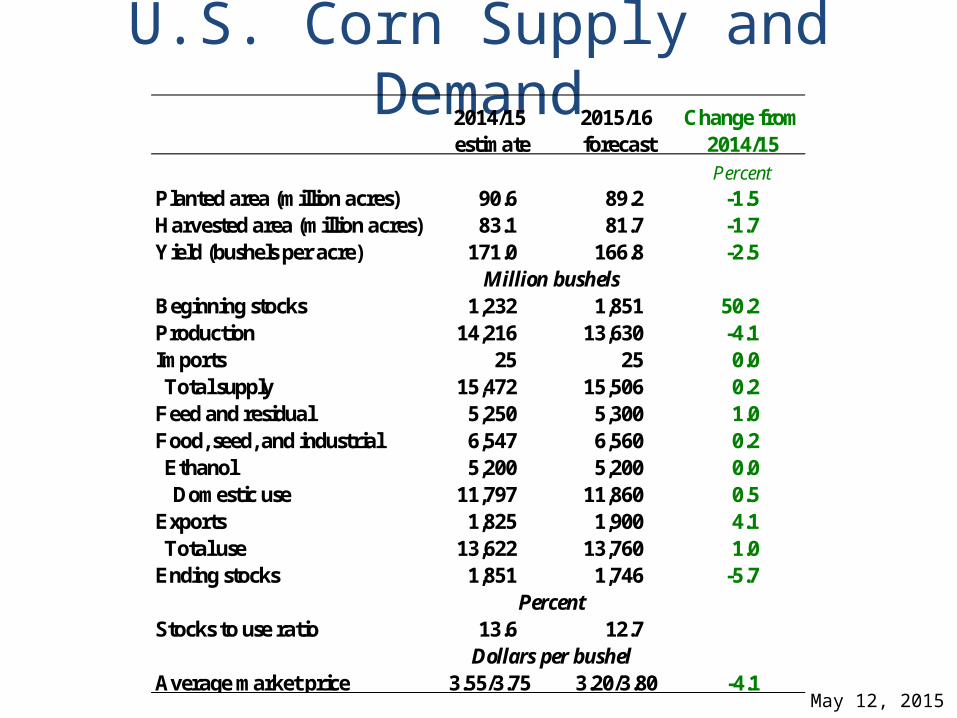
U.S. Corn Supply and Demand2014/15 estimate
2015/16 forecast
Change from 2014/15Percent
Planted area (million acres) 90.6 89.2 -1.5Harvested area (million acres) 83.1 81.7 -1.7Yield (bushels per acre) 171.0 166.8 -2.5
Million bushelsBeginning stocks 1,232 1,851 50.2Production 14,216 13,630 -4.1Imports 25 25 0.0Total supply 15,472 15,506 0.2
Feed and residual 5,250 5,300 1.0Food, seed, and industrial 6,547 6,560 0.2Ethanol 5,200 5,200 0.0Domestic use 11,797 11,860 0.5
Exports 1,825 1,900 4.1Total use 13,622 13,760 1.0
Ending stocks 1,851 1,746 -5.7Percent
Stocks to use ratio 13.6 12.7Dollars per bushel
Average market price 3.55/3.75 3.20/3.80 -4.1
May 12, 2015
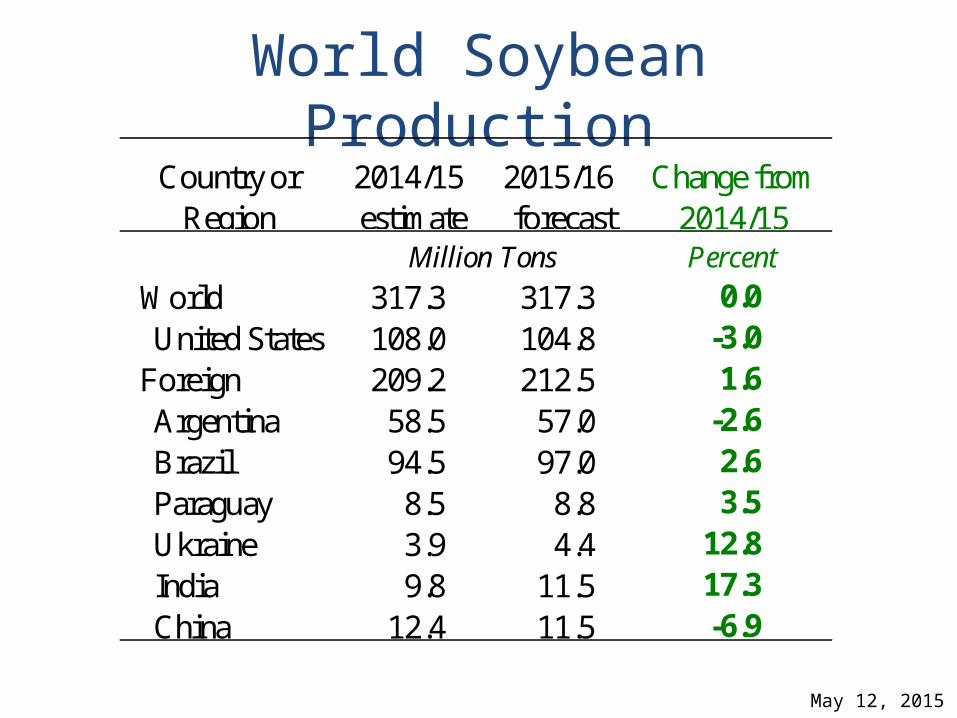
World Soybean ProductionCountry or
Region2014/15 estimate
2015/16 forecast
Change from 2014/15
Million Tons Percent
World 317.3 317.3 0.0United States 108.0 104.8 -3.0
Foreign 209.2 212.5 1.6Argentina 58.5 57.0 -2.6Brazil 94.5 97.0 2.6Paraguay 8.5 8.8 3.5Ukraine 3.9 4.4 12.8India 9.8 11.5 17.3China 12.4 11.5 -6.9

2000
/200
120
01/2
002
2002
/200
320
03/2
004
2004
/200
520
05/2
006
2006
/200
720
07/2
008
2008
/200
920
09/2
010
2010
/201
120
11/2
012
2012
/201
320
13/2
014
2014
/201
5 p
2015
/201
6 F
-10%
-5%
0%
5%
10%
15%
3.2%
Brazil's Soybean Area Year-to-year percent change
Per
cent
Cha
nge
Source: USDA
Brazil’s 2015/16 soybean area is expected to increase 3.2 percent to a record 32.5 million hectares.
Soybean area has increased 8 years in a row in Brazil; 2015/16 would be the 9th, if realized.
Although prices for soybeans are lower than last year, profitability remains high due to the devaluation of Brazil’s currency.
Soybeans’ profitability is high relative to first-season corn and to first-season cotton.
Brazil: Soybean Area Continues Growth
May 12, 2015
May 12, 2015
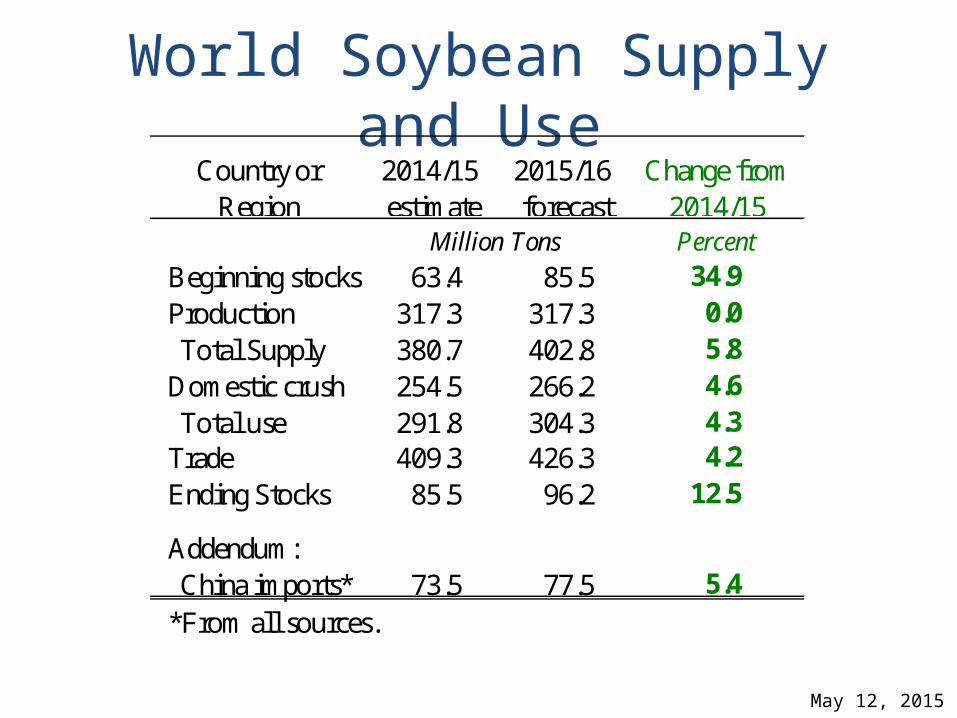
World Soybean Supply and UseCountry or
Region2014/15 estimate
2015/16 forecast
Change from 2014/15
Million Tons Percent
Beginning stocks 63.4 85.5 34.9Production 317.3 317.3 0.0Total Supply 380.7 402.8 5.8
Domestic crush 254.5 266.2 4.6Total use 291.8 304.3 4.3
Trade 409.3 426.3 4.2Ending Stocks 85.5 96.2 12.5
Addendum:China imports* 73.5 77.5 5.4
*From all sources.

Soybean Weather-Adjusted Trend Yield vs. Actual and Projected
May 12, 2015
1988
1989
1990
1991
1992
1993
1994
1995
1996
1997
1998
1999
2000
2001
2002
2003
2004
2005
2006
2007
2008
2009
2010
2011
2012
2013
2014
2015
25
30
35
40
45
50
Actual Yield
Weather-Adjusted Trend
May WASDE Projection
bu/acre
2015 Ag Outlook Forum: 46.02015 May WASDE: 46.0

May 12, 2015
U.S. Soybean Supply and Demand2014/15 estimate
2015/16 forecast
Change from 2014/15Percent
Planted area (million acres) 83.7 84.6 1.1Harvested area (million acres) 83.1 83.7 0.8Yield (bushels per acre) 47.8 46.0 -3.7
Million bushelsBeginning stocks 92 350 280.0Production 3,969 3,850 -3.0Imports 30 30 0.0Total supply 4,091 4,230 3.4
Crush 1,805 1,825 1.1Seed and residual 136 129 -5.0Domestic use 1,941 1,954 0.7
Exports 1,800 1,775 -1.4Total use 3,741 3,729 -0.3
Ending stocks 350 500 43.1Percent
Stocks to use ratio 9.3 13.4Dollars per bushel
Average market price 10.05 8.25/9.75 -10.4

May 12, 2015
World Cotton Production
Country or Region2014/15 estimate
2015/16 forecast
Change from 2014/15
Million Bales Percent
World 119.3 111.3 -6.7United States 16.3 14.5 -11.1
Foreign 103.0 96.8 -6.0Argentina 1.1 1.0 -11.1Brazil 7.0 6.8 -3.6Turkey 3.2 2.8 -12.5Syria 0.3 0.3 -8.3Australia 2.2 2.0 -9.1China 30.0 27.0 -10.0India 30.0 29.5 -1.7Pakistan 10.6 10.0 -5.7Uzbekistan 3.9 3.9 0.0African Franc Zone 4.8 4.5 -7.3

China Cotton ProductionXinjiang and Eastern Provinces
2011/12 – 2015/16 proj.
2011/12 2012/13 2013/14 2014/15 2015/16 proj.
0
5
10
15
20
25
30
35
40
EastXinjiang
mil
. bal
es

May 12, 2015
World Cotton Supply and Use
Country or Region2014/15 estimate
2015/16 forecast
Change from 2014/15
Million Bales Percent
Beginning stocks 102.4 110.3 7.6Production 119.3 111.3 -6.7Total Supply 221.7 221.5 -0.1
Consumption 111.5 115.3 3.4Trade 33.8 33.7 -0.4Ending Stocks 110.3 106.3 -3.6
Addendum:China Ending Stocks 65.3 62.3 -4.7

Texas Season Abandonment Ratesand Lubbock % of Normal Rainfall Nov-Apr
(arrayed by rainfall)
2011
1996
2006
1995
2009
2013
2008
2003
2012
2000
1999
2001
2015
1997
2002
2004
2007
2005
2010
0
15
30
45
60
75
0
50
100
150
200
250Texas aband. %
% abandonment % of normal
Projected
May 12, 2015
May 12, 2015
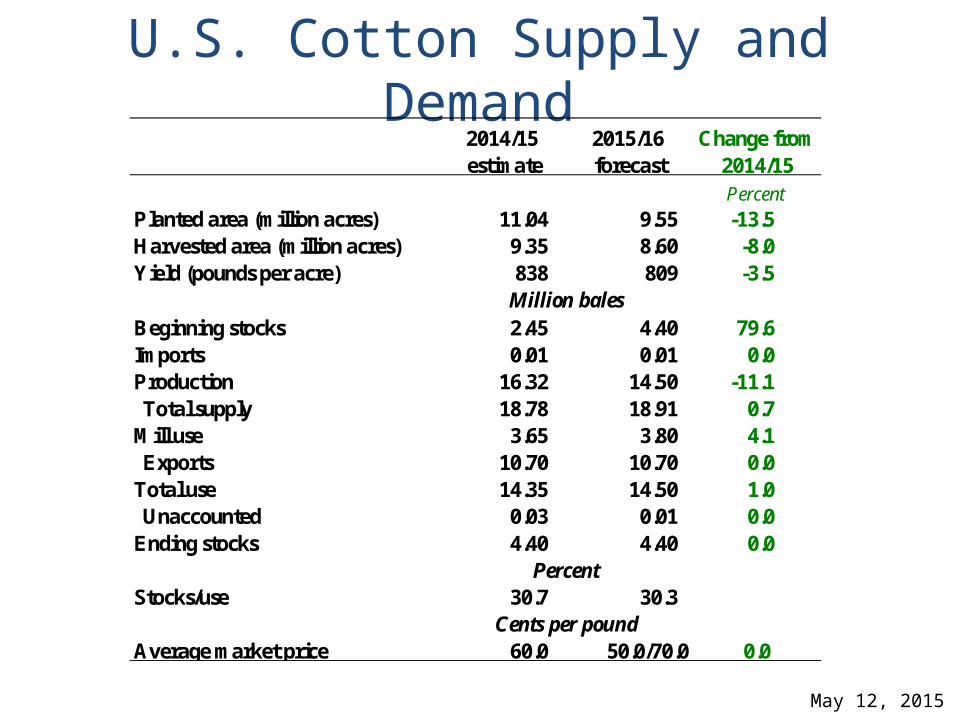
U.S. Cotton Supply and Demand2014/15 estimate
2015/16 forecast
Change from 2014/15Percent
Planted area (million acres) 11.04 9.55 -13.5Harvested area (million acres) 9.35 8.60 -8.0Yield (pounds per acre) 838 809 -3.5
Million balesBeginning stocks 2.45 4.40 79.6Imports 0.01 0.01 0.0Production 16.32 14.50 -11.1Total supply 18.78 18.91 0.7
Mill use 3.65 3.80 4.1Exports 10.70 10.70 0.0
Total use 14.35 14.50 1.0Unaccounted 0.03 0.01 0.0
Ending stocks 4.40 4.40 0.0Percent
Stocks/use 30.7 30.3Cents per pound
Average market price 60.0 50.0/70.0 0.0
May 12, 2015
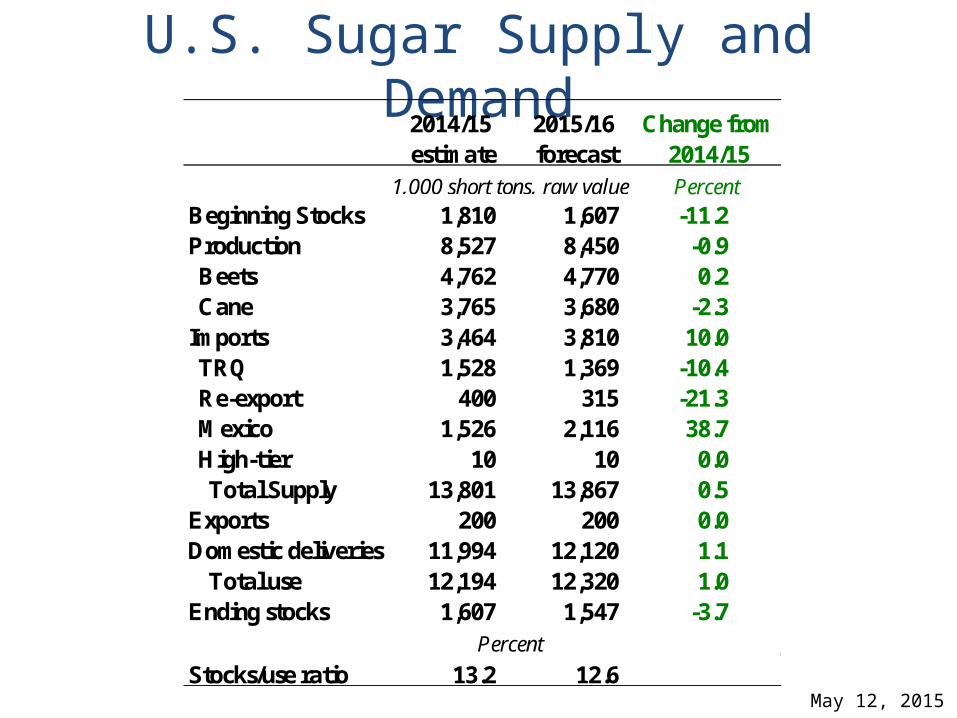
U.S. Sugar Supply and Demand2014/15 estimate
2015/16 forecast
Change from 2014/15
1,000 short tons, raw value PercentBeginning Stocks 1,810 1,607 -11.2Production 8,527 8,450 -0.9Beets 4,762 4,770 0.2Cane 3,765 3,680 -2.3
Imports 3,464 3,810 10.0TRQ 1,528 1,369 -10.4Re-export 400 315 -21.3Mexico 1,526 2,116 38.7High-tier 10 10 0.0Total Supply 13,801 13,867 0.5
Exports 200 200 0.0Domestic deliveries 11,994 12,120 1.1
Total use 12,194 12,320 1.0Ending stocks 1,607 1,547 -3.7
Percent
Stocks/use ratio 13.2 12.6

May 12, 2015
Mexico Sugar Supply and Demand2014/15 estimate
2015/16 forecast
Change from 2014/15
Thousand MT, raw value Percent
Beginning stocks 831 907 9.1Production 6,000 6,000 0.0Imports 155 155 0.0Total Supply 6,987 7,062 1.1
Domestic use 4,574 4,574 0.0Exports 1,506 1,821 20.9Total Use 6,080 6,395 5.2
Ending stocks 907 668 -26.4

May 12, 2015
U.S. Meat Production and Prices2015
forecast2016
forecastChange from
2015Production Billion pounds PercentBeef 24.27 24.51 1.0Pork 24.40 24.70 1.2Broilers 40.16 40.98 2.0Turkey 5.98 6.21 3.9Total meat 95.58 97.18 1.7
Prices Dollars/cwtSteers 162.36 162.50 0.1Hogs 48.87 46.25 -5.4
Cents/lbBroilers 101.0 103.3 2.2Turkey 105.9 108.3 2.2
May 12, 2015
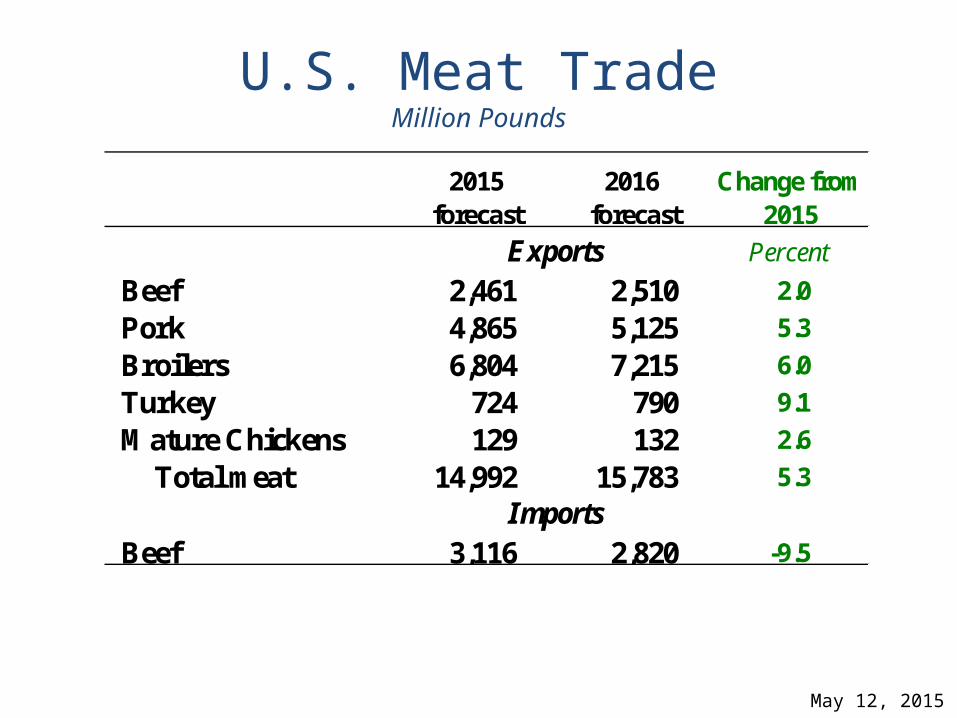
U.S. Meat TradeMillion Pounds
2015forecast
2016 forecast
Change from 2015
Exports Percent
Beef 2,461 2,510 2.0
Pork 4,865 5,125 5.3
Broilers 6,804 7,215 6.0
Turkey 724 790 9.1
Mature Chickens 129 132 2.6
Total meat 14,992 15,783 5.3
ImportsBeef 3,116 2,820 -9.5
May 12, 2015
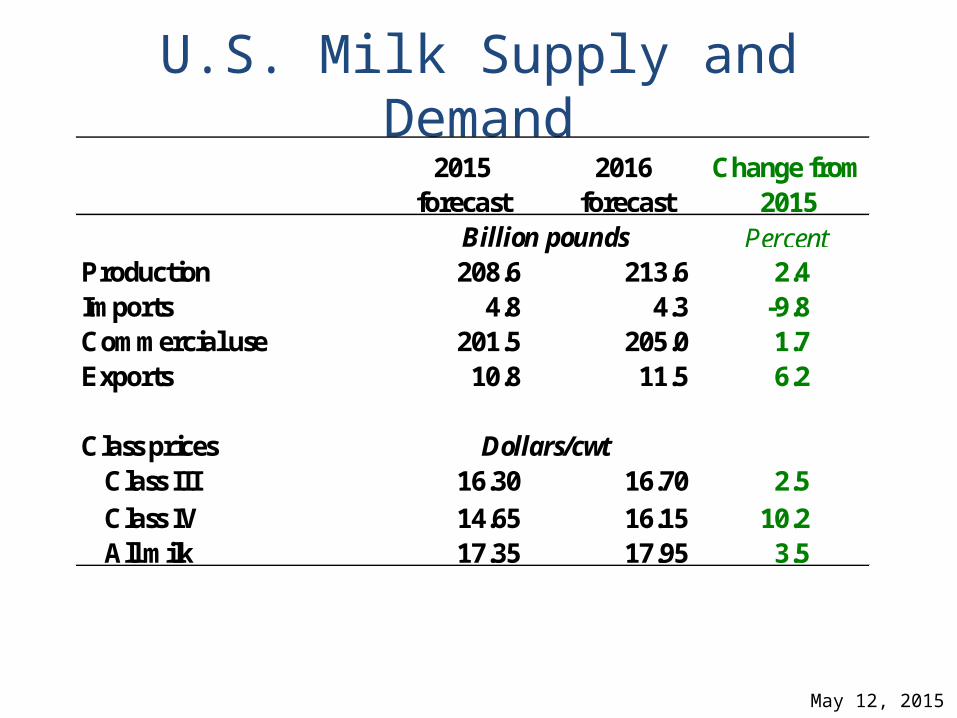
U.S. Milk Supply and Demand2015
forecast2016
forecastChange from
2015Billion pounds Percent
Production 208.6 213.6 2.4Imports 4.8 4.3 -9.8Commercial use 201.5 205.0 1.7Exports 10.8 11.5 6.2
Class prices Dollars/cwtClass III 16.30 16.70 2.5Class IV 14.65 16.15 10.2All milk 17.35 17.95 3.5
May 12, 2015
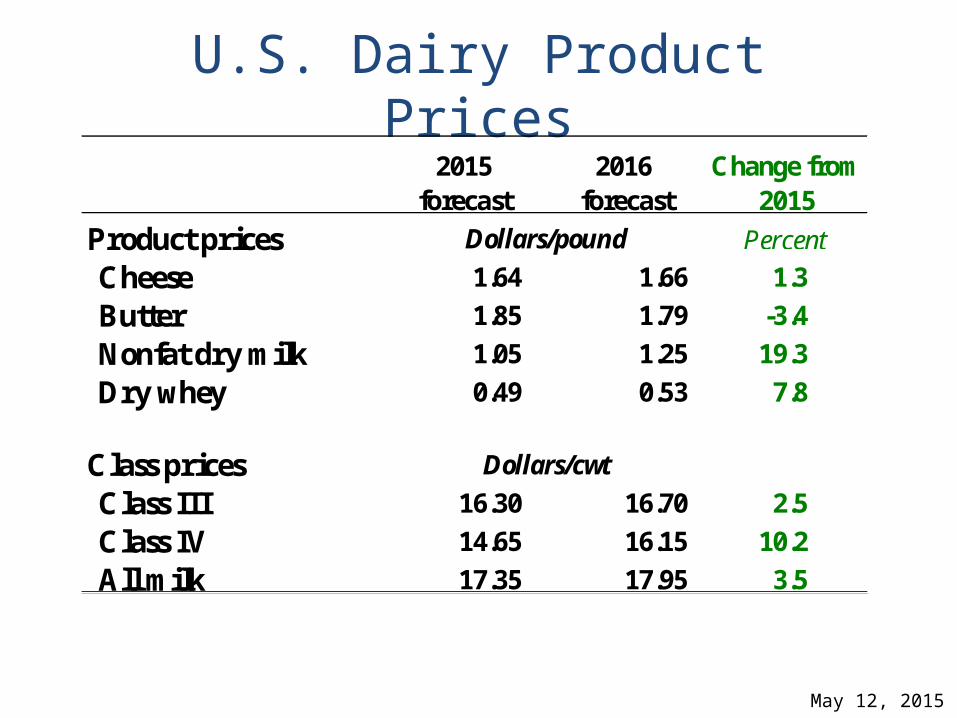
U.S. Dairy Product Prices2015
forecast2016
forecastChange from
2015
Product prices Dollars/pound Percent
Cheese 1.64 1.66 1.3
Butter 1.85 1.79 -3.4
Nonfat dry milk 1.05 1.25 19.3
Dry whey 0.49 0.53 7.8
Class prices Dollars/cwt
Class III 16.30 16.70 2.5
Class IV 14.65 16.15 10.2
All milk 17.35 17.95 3.5
May 12, 2015
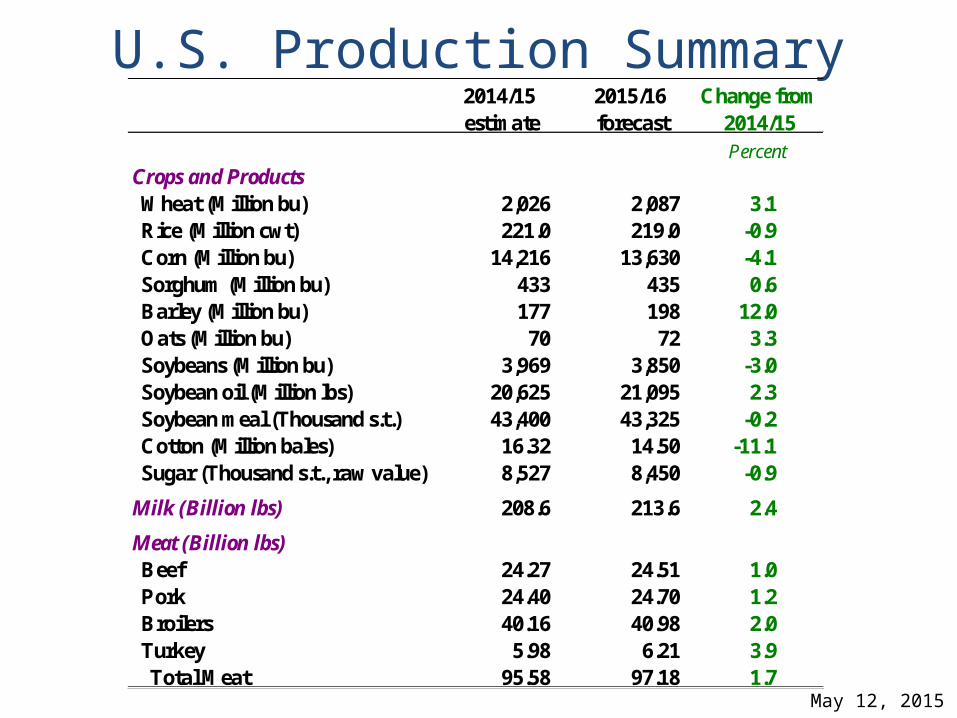
U.S. Production Summary2014/15 estimate
2015/16 forecast
Change from 2014/15Percent
Crops and ProductsWheat (Million bu) 2,026 2,087 3.1Rice (Million cwt) 221.0 219.0 -0.9Corn (Million bu) 14,216 13,630 -4.1Sorghum (Million bu) 433 435 0.6Barley (Million bu) 177 198 12.0Oats (Million bu) 70 72 3.3Soybeans (Million bu) 3,969 3,850 -3.0Soybean oil (Million lbs) 20,625 21,095 2.3Soybean meal (Thousand s.t.) 43,400 43,325 -0.2Cotton (Million bales) 16.32 14.50 -11.1Sugar (Thousand s.t., raw value) 8,527 8,450 -0.9
Milk (Billion lbs) 208.6 213.6 2.4
Meat (Billion lbs)Beef 24.27 24.51 1.0Pork 24.40 24.70 1.2Broilers 40.16 40.98 2.0Turkey 5.98 6.21 3.9Total Meat 95.58 97.18 1.7

May 12, 2015
Domestic Demand Summary2014/15 estimate
2015/16 forecast
Change from 2014/15Percent
Crops and ProductsWheat (Million bu) 1,197 1,219 1.9Rice (Million cwt) 129.0 131.0 1.6Corn (Million bu) 11,797 11,860 0.5Sorghum (Million bu) 100 100 0.0Barley (Million bu) 192 213 11.0Oats (Million bu) 162 172 6.2Soybeans (Million bu) 1,941 1,954 0.7Soybean oil (Million lbs) 18,850 19,100 1.3Soybean meal (Thousand s.t.) 30,900 31,900 3.2Cotton (Million bales) 3.65 3.80 4.1Sugar (Thousand s.t., raw value) 11,994 12,120 1.1
Milk (Billion lbs) 201.5 205.0 1.7
Meat (Billion lbs)Beef 25.03 24.88 -0.6Pork 20.68 20.61 -0.3Broilers 33.00 33.48 1.4Turkey 5.18 5.47 5.7Total meat 84.72 85.29 0.7

May 12, 2015
U.S. Export Summary2014/15 estimate
2015/16 forecast
Change from 2014/15Percent
Crops and productsWheat (Million bu) 860 925 7.6Rice (Million cwt) 105.0 108.0 2.9Corn (Million bu) 1,825 1,900 4.1Sorghum (Million bu) 350 335 -4.3Barley (Million bu) 14 10 -26.5Soybeans (Million bu) 1,800 1,775 -1.4Soybean oil (Million lbs) 1,900 2,000 5.3Soybean meal (Thousand s.t.) 12,800 11,750 -8.2Cotton (Million bales) 10.70 10.70 0.0
Meat (Million lbs)Beef 2,461 2,510 2.0Pork 4,865 5,125 5.3Broilers 6,804 7,215 6.0Turkey 724 790 9.1Mature Chickens 129 132 2.6Total meat 14,992 15,783 5.3

May 12, 2015
Price Summary2014/15 estimate
2015/16 forecast
Change from 2014/15Percent
Crops and productsWheat ($/bu) 6.00 5.00 -16.7Rice ($/cwt) 13.40 12.80 -4.5Corn ($/bu) 3.65 3.50 -4.1Soybeans ($/bu) 10.05 9.00 -10.4Soybean oil (¢/lb) 32.00 31.00 -3.1Soybean meal ($/s.t.) 365.00 325.00 -11.0Cotton (¢/lb) 60.00 60.00 0.0
LivestockSteers ($/cwt) 162.4 162.5 0.1Hogs ($/cwt) 48.9 46.3 -5.4Broilers (¢/lb) 101.0 103.3 2.2Turkeys (¢/lb) 105.9 108.3 2.2
Dairy productsCheese 1.64 1.66 1.3Butter 1.85 1.79 -3.4Nonfat dry milk 1.05 1.25 19.3Dry whey 0.49 0.53 7.8
Milk classesClass III ($/cwt) 16.30 16.70 2.5Class IV ($/cwt) 14.65 16.15 10.2All milk ($/cwt) 17.35 17.95 3.5


