Urban Studies, Vol. 38, No. 1, 23– 47, 2001 World Cities: A First Multivariate Analysis of their Service Complexes Peter J. Taylor and D. R. F. Walker [Paper rst received, October 1999; in nal form, May 2000] Summary. In consideration of the local– global nexus it is commonplace to emphasise multiple ‘locals’; in this paper, we introduce multiple ‘globals’ in the sense of differences in rm’s globalisation strategies. Building upon the collection of a unique set of data showing advanced producer service of ce networks for 46 major rms in 55 world cities, the major dimensions of variability in this geography are explored using principal components analyses. An R-mode analysis shows similarities in rm’s location patterns and 14 distinctive cross-city pro les of rms are identi ed. A key nding is that different producer services tend to have different cross-city pro les. A Q-mode analysis groups world cities in terms of similar corporate locations and 9 corporate service mixes are identi ed. A key nding is that most cities group into regional or interregional clusters; London and New York (but not Tokyo) are exceptional in forming their own distinctive ‘global city’ dimension. The overall conclusion is that world city formation, a core process of globalisation, has created a rich and informative geographical complexity. Since there is order to the complexity, the paper nishes with a multifarious research agenda derived from this rst comprehensive, comparative analysis of world cities. Globalization takes place in cities and cit- ies embody and re ect globalization (Short and Kim, 1998, p. 9) Short and Kim (1998, p. 9) have recently complained that much of the literature on globalisation is pitched at such a ‘strato- spheric level’ that it misses the actual activi- ties and practices which constitute social change. Hence, to understand how globalisa- tion takes place requires investigation of real places, in particular large metropolises. These are generally termed ‘world cities’, so-called because they function to provide services of control and organisation through which the contemporary world economy op- erates. It is these world cities which are the subject matter of this paper. Research on world cities has drawn signi cantly upon two seminal pieces of work. The foundation article by John Fried- mann (1986) set out his ‘world city hypoth- esis’ which provided a set of propositions about how the world’s major cities have become the ‘command centres’ of global capital. In the process, he identi es 30 cities as world cities—see also his slightly revised list in Friedmann (1995)—which are pre- sented as ‘the world city hierarchy’: cities are divided into primary and secondary world Peter J. Taylor and D. R. F. Walker are in the Department of Geography, Loughborough University, Loughborough, LE11 3TU, UK. Fax: 01509 223 930. E-mail: [email protected] and [email protected]. This research builds upon an ESRC-funded project “The geographical scope of London as a world city” (R000222050). The authors would like to thank Jon Beaverstock (co-applicant) and Richard Smith (research associate) for their contributions to the original project and Michael Hoyler for his contributions to the analysis. 0042-0980 Print/1360-063X On-line/01/010023-25 Ó 2001 The Editors of Urban Studies DOI: 10.1080/00420980020014794
Transcript
Urban Studies, Vol. 38, No. 1, 23– 47, 2001
World Cities: A First Multivariate Analysis oftheir Service Complexes
Peter J. Taylor and D. R. F. Walker
[Paper � rst received, October 1999; in � nal form, May 2000]
Summary. In consideration of the local–global nexus it is commonplace to emphasise multiple‘locals’; in this paper, we introduce multiple ‘globals’ in the sense of differences in � rm’sglobalisation strategies. Building upon the collection of a unique set of data showing advancedproducer service of� ce networks for 46 major � rms in 55 world cities, the major dimensions ofvariability in this geography are explored using principal components analyses. An R-modeanalysis shows similarities in � rm’s location patterns and 14 distinctive cross-city pro� les of � rmsare identi� ed. A key � nding is that different producer services tend to have different cross-citypro� les. A Q-mode analysis groups world cities in terms of similar corporate locations and 9corporate service mixes are identi� ed. A key � nding is that most cities group into regional orinterregional clusters; London and New York (but not Tokyo) are exceptional in forming theirown distinctive ‘global city’ dimension. The overall conclusion is that world city formation, a coreprocess of globalisation, has created a rich and informative geographical complexity. Since thereis order to the complexity, the paper � nishes with a multifarious research agenda derived fromthis � rst comprehensive, comparative analysis of world cities.
Globalization takes place in cities and cit-ies embody and re� ect globalization (Shortand Kim, 1998, p. 9)
Short and Kim (1998, p. 9) have recentlycomplained that much of the literature onglobalisation is pitched at such a ‘strato-spheric level’ that it misses the actual activi-ties and practices which constitute socialchange. Hence, to understand how globalisa-tion takes place requires investigation of realplaces, in particular large metropolises.These are generally termed ‘world cities’,so-called because they function to provideservices of control and organisation through
which the contemporary world economy op-erates. It is these world cities which are thesubject matter of this paper.
Research on world cities has drawnsigni� cantly upon two seminal pieces ofwork. The foundation article by John Fried-mann (1986) set out his ‘world city hypoth-esis’ which provided a set of propositionsabout how the world’s major cities havebecome the ‘command centres’ of globalcapital. In the process, he identi� es 30 citiesas world cities—see also his slightly revisedlist in Friedmann (1995)—which are pre-sented as ‘the world city hierarchy’: cities aredivided into primary and secondary world
Peter J. Taylor and D. R. F. Walker are in the Department of Geography, Loughborough University, Loughborough, LE11 3TU, UK.Fax: 01509 223 930. E-mail: [email protected] and [email protected]. This research builds upon an ESRC-funded project“The geographical scope of London as a world city” (R000222050). The authors would like to thank Jon Beaverstock (co-applicant)and Richard Smith (research associate) for their contributions to the original project and Michael Hoyler for his contributions tothe analysis.
0042-0980 Print/1360-063X On-line/01/010023-25 Ó 2001 The Editors of Urban StudiesDOI: 10.1080/00420980020014794
PETER J. TAYLOR AND D. R. F. WALKER24
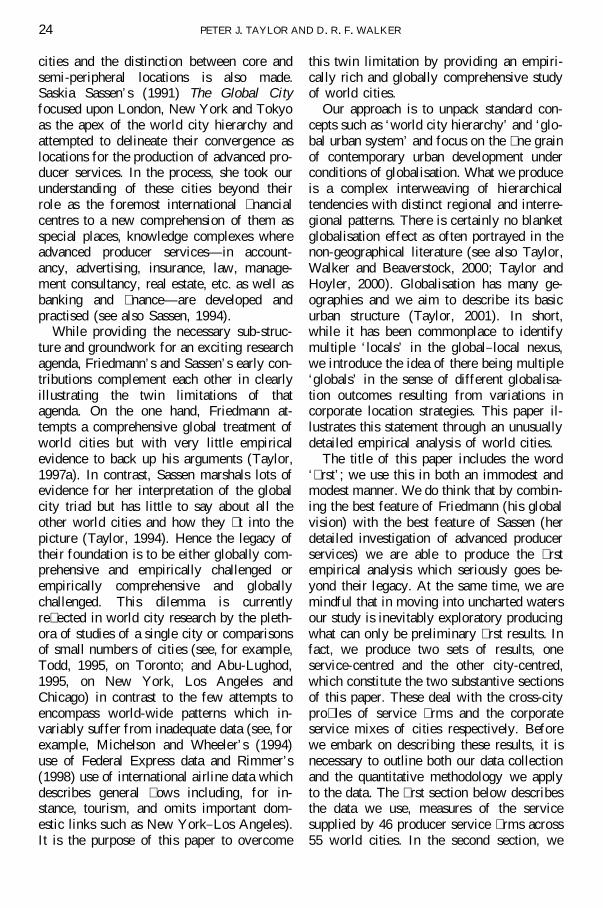
cities and the distinction between core andsemi-peripheral locations is also made.Saskia Sassen’s (1991) The Global Cityfocused upon London, New York and Tokyoas the apex of the world city hierarchy andattempted to delineate their convergence aslocations for the production of advanced pro-ducer services. In the process, she took ourunderstanding of these cities beyond theirrole as the foremost international � nancialcentres to a new comprehension of them asspecial places, knowledge complexes whereadvanced producer services—in account-ancy, advertising, insurance, law, manage-ment consultancy, real estate, etc. as well asbanking and � nance—are developed andpractised (see also Sassen, 1994).
While providing the necessary sub-struc-ture and groundwork for an exciting researchagenda, Friedmann’s and Sassen’s early con-tributions complement each other in clearlyillustrating the twin limitations of thatagenda. On the one hand, Friedmann at-tempts a comprehensive global treatment ofworld cities but with very little empiricalevidence to back up his arguments (Taylor,1997a). In contrast, Sassen marshals lots ofevidence for her interpretation of the globalcity triad but has little to say about all theother world cities and how they � t into thepicture (Taylor, 1994). Hence the legacy oftheir foundation is to be either globally com-prehensive and empirically challenged orempirically comprehensive and globallychallenged. This dilemma is currentlyre� ected in world city research by the pleth-ora of studies of a single city or comparisonsof small numbers of cities (see, for example,Todd, 1995, on Toronto; and Abu-Lughod,1995, on New York, Los Angeles andChicago) in contrast to the few attempts toencompass world-wide patterns which in-variably suffer from inadequate data (see, forexample, Michelson and Wheeler’s (1994)use of Federal Express data and Rimmer’s(1998) use of international airline data whichdescribes general � ows including, for in-stance, tourism, and omits important dom-estic links such as New York–Los Angeles).It is the purpose of this paper to overcome
this twin limitation by providing an empiri-cally rich and globally comprehensive studyof world cities.
Our approach is to unpack standard con-cepts such as ‘world city hierarchy’ and ‘glo-bal urban system’ and focus on the � ne grainof contemporary urban development underconditions of globalisation. What we produceis a complex interweaving of hierarchicaltendencies with distinct regional and interre-gional patterns. There is certainly no blanketglobalisation effect as often portrayed in thenon-geographical literature (see also Taylor,Walker and Beaverstock, 2000; Taylor andHoyler, 2000). Globalisation has many ge-ographies and we aim to describe its basicurban structure (Taylor, 2001). In short,while it has been commonplace to identifymultiple ‘locals’ in the global– local nexus,we introduce the idea of there being multiple‘globals’ in the sense of different globalisa-tion outcomes resulting from variations incorporate location strategies. This paper il-lustrates this statement through an unusuallydetailed empirical analysis of world cities.
The title of this paper includes the word‘� rst’; we use this in both an immodest andmodest manner. We do think that by combin-ing the best feature of Friedmann (his globalvision) with the best feature of Sassen (herdetailed investigation of advanced producerservices) we are able to produce the � rstempirical analysis which seriously goes be-yond their legacy. At the same time, we aremindful that in moving into uncharted watersour study is inevitably exploratory producingwhat can only be preliminary � rst results. Infact, we produce two sets of results, oneservice-centred and the other city-centred,which constitute the two substantive sectionsof this paper. These deal with the cross-citypro� les of service � rms and the corporateservice mixes of cities respectively. Beforewe embark on describing these results, it isnecessary to outline both our data collectionand the quantitative methodology we applyto the data. The � rst section below describesthe data we use, measures of the servicesupplied by 46 producer service � rms across55 world cities. In the second section, we
WORLD CITY SERVICES 25
show how this 46 3 55 data matrix is re-duced to basic dimensions—eight cross-citypro� les and nine corporate service mixes—by using the standard multivariate statisticaltechnique of principal components analysis.Hence our main general conclusion: howcomplex globalisation turns out to be whenstudied empirically through producer ser-vices in world cities. This is the theme of ourconcluding section where we draw on ourresults to suggest an enhanced agenda forworld city research set in an empirically richand globally comprehensive context.
Creating a Set of Global Data
A major reason why there has been a dearthof global-scale cross-city studies is becausethere are no easily accessible data availablefor analysis. Most published data are createdby states for states, one result of which is avery state-centric social science (Taylor,1997b). Even world city research has suc-cumbed to this debilitating bias (Taylor,1999). For sure there are census data andrelated materials collected by state agenciesto describe cities: some limited cross-citycomparisons are possible once allowance ismade for differences in measurement. Butthere is no comprehensive collection of pub-lished data on world cities: to do globalresearch on cities requires the creation ofglobal-scale data. This study is part of aresearch initiative which does just that (Tay-lor, Walker and Beaverstock, 2000).
The Globalisation and World Cities Re-search Group at Loughborough Universityhas collected comprehensive information onthe of� ces of 74 advanced producer service� rms in 263 cities. These of� ces are theoutcomes of location decision-making by� rms operating under conditions of globali-sation. Their cross-city patterns de� ne aworld city network (Taylor, 2001). This rep-resents the basic ‘skeleton’, as it were, ofglobalisation. However, because this infor-mation is largely obtained � rm by � rm, thereis no standardised composition of the data(Beaverstock, Lorimer et al., 2000). The kindof information we have on each � rm’s of� ces
varies from simple presence in a city throughto number of practitioners employed in eachcity. Turning this into a data-set for use inour analysis involved two stages, � rst select-ing cities and second selecting � rms.
The creation of a roster of world cities isdescribed in detail in another paper (Beaver-stock, 1999a). The basic method we haveused is to consider separately four servicesectors (accountancy, advertising, banking/� nance and law) and identify the leadingcities in each sector. Cities were scored 3, 2,1 depending on their importance in a givensector and combining these scores enabled usto produce an ordering of cities up to amaximum aggregate score of 12. From thislist, we derived our ‘inventory of world cit-ies’ using the threshold score of 4 to qualify.Of the initial 263, 142 cities appeared in thedifferent sector lists, but only 55 exceededthe threshold in the aggregate ordering. Cit-ies deemed to have world city status arelisted in the Appendix (Table A1) where theyare divided into three levels in terms ofoverall importance as service centres. Thereare no particular surprises in this roster:globalisation when viewed through cities isvery uneven. For this reason, we have foundit necessary to illustrate the spatial pattern ofthe cities in the form of a cartogram depict-ing the roster as three separate groupings: theAmericas, Europe and Paci� c Asia (Figure1).1 This schematic diagram is the key fordisplaying our results by cities below.
For this analysis, we focus upon the majorglobal � rms in our data. The threshold weuse is that a � rm must have of� ces in at least15 separate cities. Setting up an of� ce toprovide advanced producer services is a veryexpensive undertaking for a � rm since it isthe nature of service provision that it takestime to build up clienteles. Furthermore, op-erating in this many cities inevitably meansworking in different legal frameworks andcultural settings. In short, to have 15 or moreof� ces shows a � rm to be committed todeveloping a signi� cant cross-city provisionfor their particular producer service; we willcall these � rms global service � rms. Thereare 46 � rms in this category in our data and
26 PETER J. TAYLOR AND D. R. F. WALKER
Fig
ure
1.W
orld
citie
s:th
ree
maj
orzo
nes
(loc
atio
nco
defo
rci
tych
arts
,see
App
endi
xT
able
A2
for
list
ofci
ties
and
abbr
evia
tions
.
WORLD CITY SERVICES 27
they are listed in the Appendix (Table A1).The variations in information we have oneach of� ce are dealt with by converting allthe data into a simple ordinal scale (0, 1, 2,3) as described elsewhere (Taylor, Walkerand Beaverstock, 2000) where the higher thescore the larger the service provision by a� rm in a city for a given sector. For instance,New York and London have more scores of3 because most � rms have decided they needto locate one of their largest of� ces in thesevery important cities. Note that for 11 � rmswe have only presence/absence data (scored0, 1).
The end result of these operations is tocreate a data matrix of 46 global service� rms across 55 world cities in which eachcell records high (3), medium (2), low (orsimple presence) (1), or absence (0) for agiven � rm in a given city. This constitutesthe input to our analyses.
Methodology: Parsimony through Princi-pal Components Analyses
Faced with a matrix which contains 2530(55 3 46) pieces of information, we need toreduce the detail into a relatively small num-ber of common patterns for interpretation.Such parsimony is the basic purpose of thefactor analytic family of statistical techniquesof which the most straightforward (i.e. withleast axiomatic baggage attached) is principalcomponents analysis. This is the techniquewe apply to our cities–� rms matrix.
In principal components analysis, a datamatrix consisting of x variables is treated asan x-dimensional space to which each vari-able contributes an axis. Each axis is one unitin length which represents the spread of val-ues (variance) of a variable so that the totalvariance is x, the number of variables in thematrix. By analysing the covariance (corre-lation) amongst the variables, an alternativeset of axes of different lengths can be pro-duced ranked by size. These are principalcomponents, in which the � rst (largest) com-ponent describes the biggest cluster ofcovariance amongst the original variables,
the second component the next biggest ofcluster of covariance and so on, down to avery small � nal xth component. The idea isthat most of the variation in the data isrevealed in a relatively small number of largecomponents so that many small componentscan be discarded as unimportant. Theresult, therefore, is to transform an originalx-dimensional variable space into a muchsmaller y-dimensional component spacede� ned by selection of only the large andimportant principal components. This is theparsimony, converting a large number ofvariables x into a relatively small number ofrelevant components y which, nevertheless,between them account for a large proportionof the original variance. For example, a verysuccessful parsimonious analysis wouldtransform, say, 80 variables into just 6 princi-pal components which account for 75 percent of the original variation.
This is a standard statistical procedure; theskill is in the interpretation of the principalcomponents. The chief way of interpretingcomponents is to focus upon the location ofthese new component axes with respect tothe original variable axes. These relations aremeasured as ‘loadings’ which are the correla-tions between each component and each vari-able. By looking at the high correlations, thecluster of variables which a component rep-resents is revealed. In order to facilitate in-terpretation, the principal components areusually ‘rotated’ in order to maximise highloadings. The most common method is calledvarimax rotation which creates well-de� nedand orthogonal (independent) patterns ofvariability as new components. It is theserotated principal components which we usehere for parsimonious analysis of the cities–
� rms data matrix. In effect, these rotatedcomponents are new ‘supervariables’ and assuch they can be de� ned in terms of theoriginal objects over which the input vari-ables were measured. These ‘componentscores’ are like the original variable mea-sures and tell us about the differences be-tween objects for a given component.
There is one crucial decision which hasto be made in any principal components]
PETER J. TAYLOR AND D. R. F. WALKER28
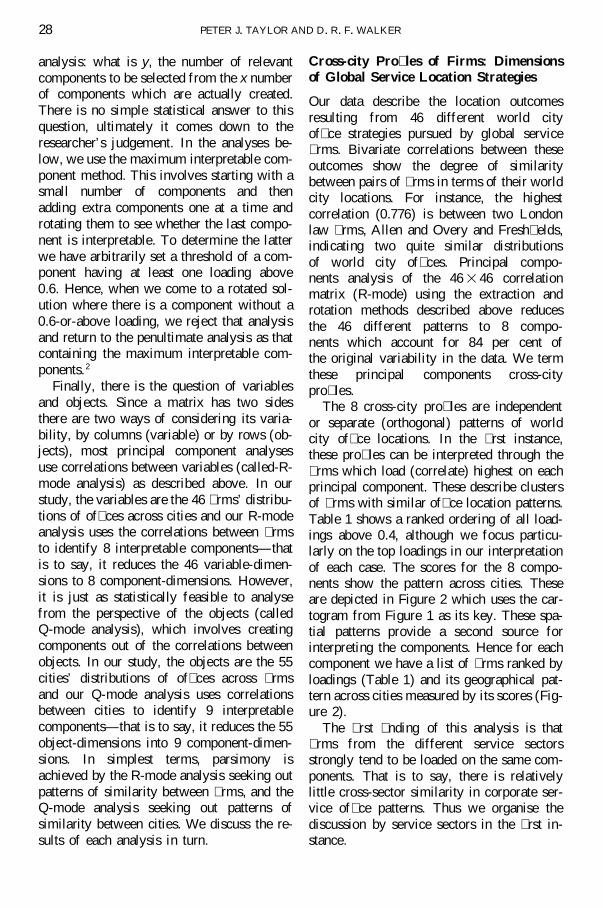
analysis: what is y, the number of relevantcomponents to be selected from the x numberof components which are actually created.There is no simple statistical answer to thisquestion, ultimately it comes down to theresearcher’s judgement. In the analyses be-low, we use the maximum interpretable com-ponent method. This involves starting with asmall number of components and thenadding extra components one at a time androtating them to see whether the last compo-nent is interpretable. To determine the latterwe have arbitrarily set a threshold of a com-ponent having at least one loading above0.6. Hence, when we come to a rotated sol-ution where there is a component without a0.6-or-above loading, we reject that analysisand return to the penultimate analysis as thatcontaining the maximum interpretable com-ponents.2
Finally, there is the question of variablesand objects. Since a matrix has two sidesthere are two ways of considering its varia-bility, by columns (variable) or by rows (ob-jects), most principal component analysesuse correlations between variables (called-R-mode analysis) as described above. In ourstudy, the variables are the 46 � rms’ distribu-tions of of� ces across cities and our R-modeanalysis uses the correlations between � rmsto identify 8 interpretable components—thatis to say, it reduces the 46 variable-dimen-sions to 8 component-dimensions. However,it is just as statistically feasible to analysefrom the perspective of the objects (calledQ-mode analysis), which involves creatingcomponents out of the correlations betweenobjects. In our study, the objects are the 55cities’ distributions of of� ces across � rmsand our Q-mode analysis uses correlationsbetween cities to identify 9 interpretablecomponents—that is to say, it reduces the 55object-dimensions into 9 component-dimen-sions. In simplest terms, parsimony isachieved by the R-mode analysis seeking outpatterns of similarity between � rms, and theQ-mode analysis seeking out patterns ofsimilarity between cities. We discuss the re-sults of each analysis in turn.
Cross-city Pro� les of Firms: Dimensionsof Global Service Location Strategies
Our data describe the location outcomesresulting from 46 different world cityof� ce strategies pursued by global service� rms. Bivariate correlations between theseoutcomes show the degree of similaritybetween pairs of � rms in terms of their worldcity locations. For instance, the highestcorrelation (0.776) is between two Londonlaw � rms, Allen and Overy and Fresh� elds,indicating two quite similar distributionsof world city of� ces. Principal compo-nents analysis of the 46 3 46 correlationmatrix (R-mode) using the extraction androtation methods described above reducesthe 46 different patterns to 8 compo-nents which account for 84 per cent ofthe original variability in the data. We termthese principal components cross-citypro� les.
The 8 cross-city pro� les are independentor separate (orthogonal) patterns of worldcity of� ce locations. In the � rst instance,these pro� les can be interpreted through the� rms which load (correlate) highest on eachprincipal component. These describe clustersof � rms with similar of� ce location patterns.Table 1 shows a ranked ordering of all load-ings above 0.4, although we focus particu-larly on the top loadings in our interpretationof each case. The scores for the 8 compo-nents show the pattern across cities. Theseare depicted in Figure 2 which uses the car-togram from Figure 1 as its key. These spa-tial patterns provide a second source forinterpreting the components. Hence for eachcomponent we have a list of � rms ranked byloadings (Table 1) and its geographical pat-tern across cities measured by its scores (Fig-ure 2).
The � rst � nding of this analysis is that� rms from the different service sectorsstrongly tend to be loaded on the same com-ponents. That is to say, there is relativelylittle cross-sector similarity in corporate ser-vice of� ce patterns. Thus we organise thediscussion by service sectors in the � rst in-stance.
29WORLD CITY SERVICES
Tab
le1.
Cro
ss-c
itypr
o�le
s(R
-mod
elo
adin
gs)
(inc
ludi
ngal
llo
adin
gsab
ove
0.4)
PC3
PC8
PC1
PC7
PC4
PC5
PC2
PC6
Loa
ding
US
Lon
don
Maj
orba
nk/
Min
orba
nk/
Eur
opea
nL
atin
Am
eric
anG
ener
alm
ixed
Paci
�cR
imle
vel
law
law
�nan
ce�n
ance
adve
rtis
ing
adve
rtis
ing
sect
ordu
al-s
ecto
r
Ove
r0.
80SQ
0.81
FF0.
87C
B0.
82A
M0.
80K
P0.
81D
E0.
82A
O0.
81C
C0.
80
0.70
–0.
79M
C0.
78D
R0.
70PU
0.77
TH
0.71
TM
0.74
SC0.
74B
C0.
77U
B0.
70L
H0.
71H
H0.
74C
S0.
70W
C0.
72
0.60
–0.
69D
W0.
68P
A0.
60Y
R0.
62O
M0.
68C
L0.
67H
S0.
64L
L0.
68B
T0.
61SS
0.68
WE
0.61
NW
0.61
CO
0.60
JD0.
61E
Y0.
60
0.50
–0.
59SK
0.52
BA
0.54
DM
0.52
SK0.
52W
E0.
50G
R0.
50
0.40
–0.
49G
J0.
48P
W0.
48M
O0.
47B
A0.
42Y
R0.
48M
O0.
46SS
0.41
CR
0.48
BB
0.44
NW
0.46
GJ
0.45
CS
0.41
BB
0.41
LL
0.45
CO
0.40
PW
0.40
Not
es:
Sect
ors
are
indi
cate
dby
font
styl
e:ac
coun
tanc
y,ad
vert
isin
g,ba
nkin
g/�n
ance
,law
.For
nam
esof
�rm
s,se
eT
able
A3.
PETER J. TAYLOR AND D. R. F. WALKER30
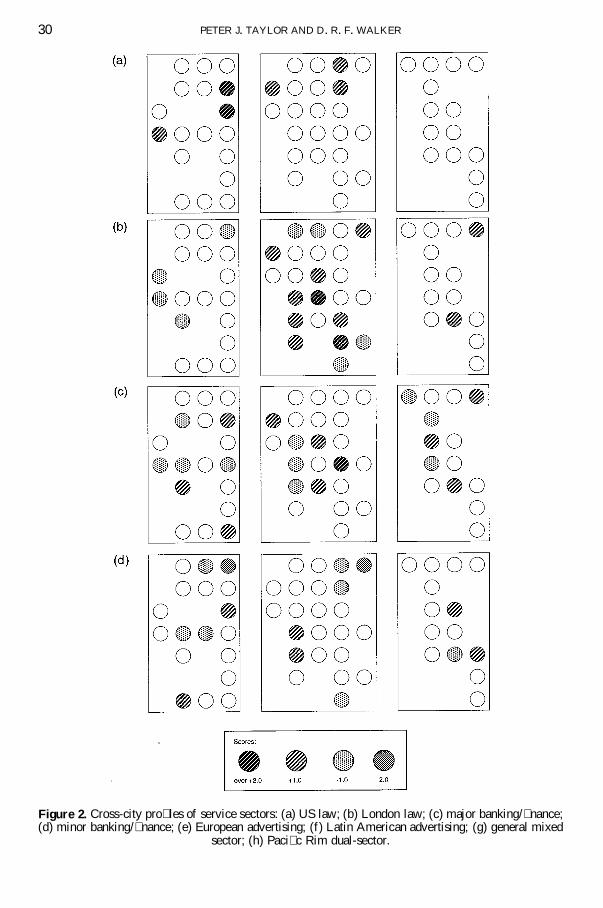
Figure 2. Cross-city pro� les of service sectors: (a) US law; (b) London law; (c) major banking/� nance;(d) minor banking/� nance; (e) European advertising; (f) Latin American advertising; (g) general mixed
sector; (h) Paci� c Rim dual-sector.
WORLD CITY SERVICES 31
Figure 2. Continued.
PETER J. TAYLOR AND D. R. F. WALKER32
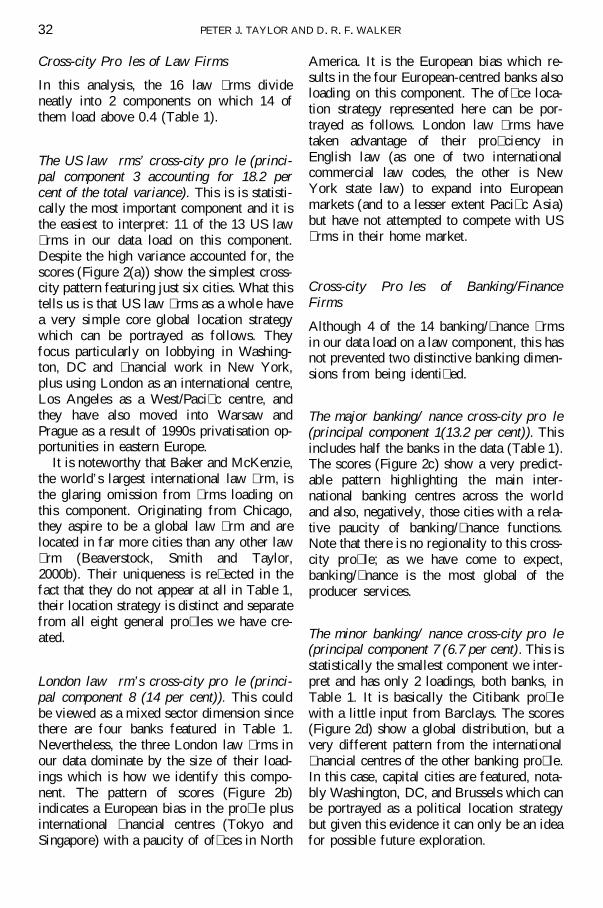
Cross-city Pro� les of Law Firms
In this analysis, the 16 law � rms divideneatly into 2 components on which 14 ofthem load above 0.4 (Table 1).
The US law � rms’ cross-city pro� le (princi-pal component 3 accounting for 18.2 percent of the total variance). This is is statisti-cally the most important component and it isthe easiest to interpret: 11 of the 13 US law� rms in our data load on this component.Despite the high variance accounted for, thescores (Figure 2(a)) show the simplest cross-city pattern featuring just six cities. What thistells us is that US law � rms as a whole havea very simple core global location strategywhich can be portrayed as follows. Theyfocus particularly on lobbying in Washing-ton, DC and � nancial work in New York,plus using London as an international centre,Los Angeles as a West/Paci� c centre, andthey have also moved into Warsaw andPrague as a result of 1990s privatisation op-portunities in eastern Europe.
It is noteworthy that Baker and McKenzie,the world’s largest international law � rm, isthe glaring omission from � rms loading onthis component. Originating from Chicago,they aspire to be a global law � rm and arelocated in far more cities than any other law� rm (Beaverstock, Smith and Taylor,2000b). Their uniqueness is re� ected in thefact that they do not appear at all in Table 1,their location strategy is distinct and separatefrom all eight general pro� les we have cre-ated.
London law � rm’s cross-city pro� le (princi-pal component 8 (14 per cent)). This couldbe viewed as a mixed sector dimension sincethere are four banks featured in Table 1.Nevertheless, the three London law � rms inour data dominate by the size of their load-ings which is how we identify this compo-nent. The pattern of scores (Figure 2b)indicates a European bias in the pro� le plusinternational � nancial centres (Tokyo andSingapore) with a paucity of of� ces in North
America. It is the European bias which re-sults in the four European-centred banks alsoloading on this component. The of� ce loca-tion strategy represented here can be por-trayed as follows. London law � rms havetaken advantage of their pro� ciency inEnglish law (as one of two internationalcommercial law codes, the other is NewYork state law) to expand into Europeanmarkets (and to a lesser extent Paci� c Asia)but have not attempted to compete with US� rms in their home market.
Cross-city Pro� les of Banking/FinanceFirms
Although 4 of the 14 banking/� nance � rmsin our data load on a law component, this hasnot prevented two distinctive banking dimen-sions from being identi� ed.
The major banking/� nance cross-city pro� le(principal component 1(13.2 per cent)). Thisincludes half the banks in the data (Table 1).The scores (Figure 2c) show a very predict-able pattern highlighting the main inter-national banking centres across the worldand also, negatively, those cities with a rela-tive paucity of banking/� nance functions.Note that there is no regionality to this cross-city pro� le; as we have come to expect,banking/� nance is the most global of theproducer services.
The minor banking/� nance cross-city pro� le(principal component 7 (6.7 per cent). This isstatistically the smallest component we inter-pret and has only 2 loadings, both banks, inTable 1. It is basically the Citibank pro� lewith a little input from Barclays. The scores(Figure 2d) show a global distribution, but avery different pattern from the international� nancial centres of the other banking pro� le.In this case, capital cities are featured, nota-bly Washington, DC, and Brussels which canbe portrayed as a political location strategybut given this evidence it can only be an ideafor possible future exploration.
WORLD CITY SERVICES 33
Cross-city Pro� les of Advertising Firms
The advertising � rms de� ne two dimensionswhich are particularly distinctive in their re-gionalities.
The European advertising cross-city pro� le(principal component 4 (10.6 per cent)). Thishas 5 advertising � rms loading on it in Table1. The scores (Figure 2e show a very distinc-tive geography which contrasts Europe (plusSydney and Toronto) with US and Japanesecities. This cross-city pro� le can be por-trayed as the outcome of locational strategieswhich have targeted European national mar-kets but have chosen not to compete in thetwo largest domestic markets, the US andJapan.
The Latin American advertising cross-citypro� le (principal component 5 (10.1 percent)). This has 4 advertising � rms contribut-ing to it (Table 1). We have called it LatinAmerican even though only 2 of the 6 citieswith positive scores in Figure 2f are strictlyLatin American (in addition, Buenos Airesjust misses the 0.4 threshold). However, 3 ofthe other cities have language and/or politi-cal-cultural links to Latin America: thehighest-scoring city Miami, Los Angeles andMadrid. European and northern US citiesdominate the negative scores. Hence thiscross-city pro� le may be reasonably por-trayed as the result of location policies forservicing Latin America.
Mixed Sector Cross-city Pro� les
There are two dimensions which featureprominently more than one sector, one isvery mixed, the other a dual-sector compo-nent.
The general mixed sector cross-city pro� le(principal component 2 (15.1 per cent)). Thisis statistically the second-most-importantcomponent; � rms from all 4 sectors are fea-tured in the loadings reported in Table1. Thisis where 4 of the 5 accountancy � rms appearin this analysis. (Arthur Anderson does not
appear in any of our components suggestinga unique cross-city pro� le like Baker andMcKenzie.) Accountancy is the most con-centrated of all producer service sectors re-sulting in very large � rms having the mostwidespread pattern of of� ces of all services.However, we should not treat this componentas an incipient ‘globalisation’ dimension asthe scores clearly show (Figure 2g. The posi-tive scores have a North American bias plusEurope’s two leading world cities (Londonand Paris) but it is the negative scores whichare particularly interesting in this case. Fea-turing eastern Europe and Paci� c Asia, theseare the two ‘frontier’ globalisation arenas ofthe 1990s—new opportunities but high risks.This cross-city pro� le may be portrayed,therefore, as bringing together � rms whoselocation strategies have avoided the newglobalisation arenas.
The Paci� c Rim dual-sector cross-city pro� le(principal component 6 (12.4 per cent). Thishas 2 services contributing to it, advertisingand banking. The key to this component liesin the scores (Figure 2h): they show a clearPaci� c Rim pattern plus the two leadingworld cities, London and New York. In manyways, this is the most regional of all thecross-city pro� les. It can be portrayed asthe result of location policies focusing uponthe Paci� c Rim.
Preliminary Conclusions
Beyond the intrinsic fascination of thespeci� cities of the cross-city pro� les, thereare two important empirical � ndings whichinform us about the geography of globalisa-tion. First, we have achieved only a relativelymodest parsimony: as just noted, there is thegreat variability which requires 8 compo-nents to summarise the of� ce geographies of46 � rms. But this is itself a very interesting� nding. The concept of globalisation, andwith it such notions as world city networkand hierarchy, are commonly viewed in thesingular as an all-encompassing process. Dis-cussion of the local–global nexus, for in-stance, implies many locals but only one
PETER J. TAYLOR AND D. R. F. WALKER34
global. This analysis shows globalisation tobe an immensely complex process or set ofprocesses. There is not a simple networkof world cities out there which global service� rms are attaching themselves to in apredictable manner. Even this one narrowelement of globalisation—the city-directedstrategies of just one group of � rms—hasindicated several layers and patterns ofoutcomes. Secondly, and closely related tothe variability, there is the high degree ofseparation in cross-city pro� les between the4 service sectors we are studying. Differentsectors have different of� ce geographieswhich means that researchers cannotuse their relatively extensive knowledge ofinternational � nancial centres to predictthe locational strategies of services for whichwe have much less knowledge such as law.In short, there are many geographies ofglobalisation and, until these are comprehen-sively and clearly delineated, our know-ledge of globalisation will be partial,dependent on either the geographical myth ofa singular pattern or on geographical specu-lation based upon case studies or even simplyanecdotes.
This analysis has done its job to the extentthat geographical complexity and sectorautonomy have been identi� ed. As a cross-sectional analysis of of� ce geographies pro-ducing cross-city pro� les at one point intime, there is a limit to how far our interpret-ation can be extended into explanations. Weadvocate combining an evolutionary ap-proach with a place-sensitive approach whichwe might call geohistorical. The differentservice sectors have different degrees ofglobalisation—among our four sectors, ac-countancy � rms are the most globalised, law� rms the least—and have different situatedinformation/knowledge needs—banks and� nancial � rms operate in largely trans-statemarkets whereas advertising is still closelybound to national markets, for instance.These are the sort of factors which geohistor-ical research would explore to make sense ofthe sort of results we have produced, but thatis for another project. Here we can usefullyaugment our cross-sectional � ndings by
focusing on the world cities themselves interms of the types of service mix to be foundwithin them.
Corporate Service Mixes of Cities: Group-ing World Cities by Corporate Locations
Looking at our data from the perspective ofthe 55 world cities, each one has a uniquecombination of service � rms located withinit. Bivariate correlations between these citymixtures of � rms show the degree of simi-larity between pairs of cities in terms of the� rms located in each of them. For instance,the highest correlation (0.863) in our data isbetween Amsterdam and Toronto indicatinga large overlap in the service � rms to befound in each city. Principal componentsanalysis of the 55 3 55 correlation matrix(Q-mode) using the extraction and rotationmethods described previously reduces the 55different city combinations of � rms to 9components which account for 80.1 per centof the original variability in the data. Weterm these principal components corporateservice mixes.
The nine global service mixes are indepen-dent or separate (orthogonal) patterns ofworld city of� ce combinations. In the � rstinstance, these mixes can be interpretedthrough the cities which load highest on eachprincipal component. Table 2 shows a rankedordering of all loadings above 0.4 althoughwe focus particularly on the top loadings ineach case. In this mode of analysis, it is theloadings themselves which can be directlymapped to show the geographical pattern ofthe various components. These are depictedin Figure 3, again using the cartogram ofcities in Figure 1 as the key.3
The � rst � nding of this analysis is that,despite globalisation, corporate service mixesare distinctly regional in nature. Hence thenine principal components can be classi� edby their geographical scope into interre-gional, regional and speci� c cities (Figure 3).We use this ordering to structure the dis-cussion below.
35WORLD CITY SERVICES
Tab
le2.
Cor
pora
tese
rvic
em
ixes
(Q-m
ode
load
ings
)(i
nclu
ding
all
citie
sw
ithlo
adin
gsab
ove
0.4)
Inte
rreg
iona
ldi
men
sion
sR
egio
nal
dim
ensi
ons
City
dim
ensi
ons
PC3
Maj
ortr
ansn
atio
nal
and
PC2
Min
orPC
5Fi
rst
east
ern
PC
6W
este
rnPC
8S
econ
dL
oadi
ngL
atin
Am
eric
anPC
1Pa
ci�c
Asi
anN
orth
Atla
ntic
PC9
US
wor
ldE
urop
ean
wor
ldE
urop
ean
wor
ldE
urop
ean
wor
ldle
vel
wor
ldci
ties
wor
ldci
ties
wor
ldci
ties
citie
sci
ties
citi
esci
ties
PC3
Glo
bal
city
PC7
Mia
mi
Ove
r0.
80Z
uric
h0.
84B
angk
ok0.
85H
ambu
rg0.
87Pr
ague
0.83
Mia
mi
0.80
Shan
ghai
0.84
Tai
pei
0.83
0.70
–0.
79Sa
oPa
ulo
0.79
Kua
laL
umpu
r0.
78M
unic
h0.
77W
ashi
ngto
n,D
C0.
76W
arsa
w0.
73B
russ
els
0.75
Mos
cow
0.74
New
Yor
k0.
74C
arac
as0.
76Se
oul
0.77
Cop
enha
gen
0.73
Dal
las
0.72
Ista
nbul
0.70
Fran
kfur
t0.
76B
eiji
ng0.
71D
usse
ldor
f0.
73C
hica
go0.
71M
exic
oC
ity
0.75
Bue
nos
Air
es0.
74
0.60
–0.
69T
okyo
0.69
Man
ila0.
69M
inne
apol
is0.
67Sa
nFr
anci
sco
0.60
Bud
apes
t0.
62B
arce
lona
0.63
Lon
don
0.69
Sant
iago
0.69
Jaka
rta
0.64
Mon
trea
l0.
65St
ockh
olm
0.61
Los
Ang
eles
0.64
Mad
rid
0.69
Sing
apor
e0.
64A
tlant
a0.
65M
ilan
0.67
Sydn
ey0.
60O
saka
0.64
Gen
eva
0.64
Ber
lin0.
63
0.50
–0.
59T
oron
to0.
52H
ong
Kon
g0.
54T
oron
to0.
52H
oust
on0.
58A
mst
erda
m0.
56Si
ngap
ore
0.50
Atla
nta
0.55
Mad
rid
0.51
0.40
–0.
49Ja
kart
a0.
43G
enev
a0.
44St
ockh
olm
0.46
Los
Ang
eles
0.45
Joha
nnes
burg
0.43
Pari
s0.
45R
ome
0.48
Bos
ton
0.45
Hon
gK
ong
0.42
Mel
bour
ne0.
41Jo
hann
esbu
rg0.
46C
open
hage
n0.
41M
elbo
urne
0.41
Ber
lin0.
45Sy
dney
0.42
Mel
bour
ne0.
44Sa
oPa
ulo
0.40
Tor
onto
0.40
War
saw
0.42
Hou
ston
0.42
Am
ster
dam
0.43
Lon
don
0.40
Man
ila0.
42B
osto
n0.
40B
arce
lona
0.40
PETER J. TAYLOR AND D. R. F. WALKER36
Figure 3. Cities with similar corporate service mixes (for city identi� cation, see Figure 1): (a) majortransnational and Latin American world cities; (b) minor Paci� c Asian world cities; (c) minor NorthAtlantic world cities; (d) US world cities; (e) � rst eastern European world cities; (f) western European
world cities; (g) second eastern European world cities; (h) global city; (i) Miami.
WORLD CITY SERVICES 37
Figure 3. Continued.
PETER J. TAYLOR AND D. R. F. WALKER38
Figure 3. Continued.
WORLD CITY SERVICES 39
Interregional Clusters of Cities
The corporate mix in major transnationaland Latin American world cities (principalcomponent 3 accounting for 22.3 per cent ofthe variance). This is in many ways the mostcomplicated partly because it is the mostglobal in its distribution (Table 2; Figure 3a).It consists of two distinct groups of cities.First, in terms of loadings it is headed byZurich, the archetypal transnational centre;Frankfurt and Tokyo are two other such ma-jor centres which load high. Secondly, all� ve Latin American world cities load high.The reason for these two distinctive sets ofcities coming together in a single componentis the particular role of Latin America inglobalisation. Previous related research(Beaverstock, Smith and Taylor, 1999b,2000b) has shown that in the late 1990s LatinAmerica was a relatively minor globalisationarena compared with south-east Asia, eastAsia, western Europe and eastern Europe.However, Latin America has featured in ear-lier ‘internationalisation’ of services, es-pecially by US � rms (see Beaverstock, Smithand Taylor, 2000b, for law � rms). Hence,their corporate mixes have been relativelystable recently and in this way they are simi-lar to the established transnational centres:well-established global service � rms willtend to be located in both groups of cities.Note the omission of the two major transna-tional centres from this component: Londonand New York have their own distinctivemix which we will come to below.
The corporate mix of minor Paci� c Asianworld cities (principal component 1 (18.1 percent)). This is is much more straightforwardwith most of the less-important Paci� c Asianworld cities from both south-east Asia andeast Asia (i.e. from Jakarta and Bangkok toSeoul and Beijing) loading particularly high(Table 2; Figure 3b). There are two interest-ing points here. First, the two regional cen-tres, Hong Kong and Singapore, haverelatively low loadings; their corporate mixshares some elements with the transnationalmix shown by the modest loadings on the
previous component (see Table 2). Secondly,the two Japanese world cities do not featurein this component; we have already seen thatTokyo belongs to the transnational group andOsaka will appear on a later component. This� nding is also consistent with previous re-lated research which showed that, althoughTokyo is the most important world city inPaci� c Asia, it does not appear to have de-veloped a leading regional role (Taylor,2000).
The corporate mix of minor North Atlanticworld cities (principal component 2 (16.3 percent)). This is dominated by northern Eu-ropean cities without major transnationallinkages which are combined here with someminor North American world cities (Table 2;Figure 3c). This is an unexpected cluster ofcities and seems to be bringing together thoseworld cities where banking/� nance is rela-tively unimportant (see negative scores inFigure 2d).
These are the three most important compo-nents and between them account for a littleover half the variation in combinations of� rms in cities.
Regional Clusters of Cities
The corporate mix of USA world cities (prin-cipal component 9 (9.5 per cent)). This hasthe political capital, Washington, DC, withthe highest loading in a selection of 8 UScities, out of a total of 11 US cities in thedata, loading above 0.4 (Table 2; Figure 3d).There is no internal regional bias in thisgrouping of cities: the top 4 loadings coverall major US regions: North (Washington,DC), South (Dallas), Central (Chicago) andWest (San Francisco). In addition, the 3missing US world cities are regionally spread(New York, Minneapolis and Miami).
The � rst corporate mix of eastern Europeanworld cities (principal component 5 (9.2 percent)). This is picking out the organisation
PETER J. TAYLOR AND D. R. F. WALKER40
centres—Prague, Warsaw, Budapest—of anew globalisation arena which has emergedin the post-Cold War world (Table 2; Figure3e). The inclusion of Istanbul in this group-ing, given its non-communist background buteastern European location, is quite interest-ing. The omission of Moscow is also note-worthy implying different � rms beingattracted to the ex-USSR than to its formersatellites.
The corporate mix of western European cit-ies (principal component 6 (8.5 per cent)).This only has partial coverage of the regionbecause of previous selections of Europeancities in other components (Table 2; Figure3f). Hence there is a southern bias but, likethe US component, this selection is headedby the political capital, Brussels, with thehighest loading.
The second corporate mix of eastern Eu-ropean world cities (principal component 8(5.1 per cent)). This con� rms the separatenature of Moscow’s attraction to service� rms compared with other eastern Europeancities (Table 2; Figure 3g) which have� gured previously (Figure 3e). In someways, this city’s role is similar to that ofTokyo, the leading city of its region butwithout regional leadership.
The addition of these four principal com-ponents means that all major globalisationarenas are covered in the clusters of citiesdealt with so far. However, there are stillsome important, indeed very important, citiesto be accounted for.
Speci� c City Dimensions
The � nal two components are relatively un-important in statistical terms but describecrucial elements of the world city network.
The global city corporate mix (principalcomponent 3 (5.1 per cent)). This highlightsNew York and London (Table 2; Figure 3h).These two cities appear at the top of therankings in almost all comparative studies ofworld cities (Beaverstock, Smith and Taylor,
1999b) and are clearly worthy of the titleglobal city as bequeathed by Saskia Sassen(1991). However, it is noteworthy that thethird of Sassen’s triad, Tokyo, does not loadon this component; we found it earlier as atransnational centre equivalent to Zurich andFrankfurt rather than to New York and Lon-don. The appearance of Los Angeles with ahigher loading on this component rather thanthe US component is interesting; this is con-sistent with other related work which showsLos Angeles to be more globally linked thanthe US’s other major world city below NewYork, Chicago (Beaverstock, Smith and Tay-lor, 2000b).
The Miami corporate mix (principal compo-nent 7 (4.3 per cent)). This is the smalleststatistically, but one of the most interestingof the components uncovered (Table 2; Fig-ure 3i). With only a single loading over 0.4,it shows this city to have a unique corporatemix. This is consistent with previous re-search which identi� es Miami as a very un-usual regional corporate centre (Taylor,2000). Unlike other key regional centres(London, New York, Singapore, HongKong), Miami is not of itself a high-rankingworld city but, nevertheless, it serves asheadquarters to many � rms’ Latin Americanbusiness. It does not load on the � rst interre-gional component with the Latin Americancities because it has the special and distinc-tive gateway role.
Preliminary Conclusions
From these results on corporate mixes ofgroups of cities, we can begin to infer some-thing of the roles and functions of worldcities within the overall context of a globalis-ing world economy. Certainly the regionalnature of our city groupings is instructive.Globalisation as evidenced by world city for-mation seems to be developing through asmall number globalisation arenas: it com-prises largely of a collection of distinct re-gional patterns rather than the general globalzones (such as core and semi-periphery).However, most comparative studies of world
WORLD CITY SERVICES 41
cities emphasise the hierarchical features ofthe system. Principal components analysis isnot designed to identify hierarchies but,nevertheless, our results do show featureswhich are consistent with such ordering. It isparticularly noteworthy that the speci� callyidenti� ed regional components are generallymissing their leading cities or else they haverelatively small loadings—for instance: Lon-don and Frankfurt are missing from ‘northernEurope’; Paris and Milan have small load-ings for ‘western Europe’; New York ismissing from both ‘northern America’ and‘US’, Los Angeles is missing from the for-mer and has a small loading on the latter;Tokyo is missing from Paci� c Asia, andHong Kong and Singapore have relativelysmall loadings on this component. These cit-ies are all what we have termed ‘alpha’world cities (Beaverstock, Smith and Taylor,1999a, and see Appendix (Table A1)).
Looking to where these alpha cities dofeature in our analysis, the speci� c globalcity component does imply that New Yorkand London are at the very top of the worldcity hierarchy. Obviously no surprise there,and similarly the same can be said of the � vealpha cities which occur in the largest com-ponent as transnational cities (Frankfurt,Tokyo, Milan, Singapore and Hong Kong).Of the other three alpha world cities, LosAngeles loads moderately on the global citycomponent and that leaves Chicago and Parisas the only alpha cities which appear solelyin their respective regional groupings.Paris is perhaps the most problematic,with its weak loading on ‘western Europe’perhaps preventing it having its ownunique component like Miami. Chicago isdifferent—despite its high world city status,it appears as a US world city no differentfrom lower-status cities.
What is clear is that our analysis andinterpretation, by combining regional andhierarchical elements, has found an orderwithin the corporate mixes of world cities butit is an order which is much more complexthan commonly supposed. We should be verysuspicious of presentations of simple worldcity hierarchies with neat national and
regional articulations nested under global cit-ies, as John Friedmann’s (1986, 1995) pio-neering and oft-quoted formulation tells it.
General Conclusions
These standard multivariate statistical analy-ses of of� ce geographies have produced twosets of intriguing results. As we emphasisedin the introduction, this is a � rst quantitativeanalysis of contemporary world cities at aglobal scale and therefore the � ndings arespeci� cally interesting as a comprehensiveempirical glimpse of the comparative rolesand functions of world cities. We invitereplications of this research using other � rms(and possibly other cities) to show which ofour results are reasonably robust and whichmay be speci� c artefacts of our particulardata-set. Here we will proceed on the as-sumption that our results are tolerably robust,thus allowing us to develop some generalconclusions. These come in two parts: � rst,we consider the complexity of globalisationas evidenced in our analyses; and, secondly,we suggest research agendas which derivefrom this work.
The Geographical Complexity of Globali-sation
This research challenges the idea of globali-sation as a single all-pervasive spatial pro-cess. Neither of our analyses produces alarge ‘� rst factor’ which we could label‘globalisation’ or ‘global hierarchy’. Rather,although we have used a technique whichsearches for parsimony, by producing resultsrequiring � rst eight and then nine inter-pretable components, we have been left witha representation of the real complexities ofglobalisation. Clearly, there is not a simplehierarchy of cities which of� ce network ge-ographies � t into.
Principal components analysis providesgroupings of like items but these are notdiscrete categories: there is always overlapbetween components. In Figure 4, the 9 citycomponents are depicted in venn-like dia-grams with sets de� ned by city loadings
PETER J. TAYLOR AND D. R. F. WALKER42
above 0.4. Cities with loadings above 0.7de� ne the ‘cores’ of the component-sets.This diagram divides the cities into 3 types:26 are component-core cities; 19 are overlapcities which lie between components; and 10are found in a single component-set but out-side its core. The overlap category is theinteresting one; it is neglected in our pre-vious component-by-component description.Here we see that, although the component-core cities de� ne the structure of the data(i.e. provide the basic identi� cations of com-ponents), the overlap cities reinforce themeanings of the components in terms ofwhich components are linked together: thereis an order to the complexity of Figure 4. Forinstance, the international/Latin Americacomponent is linked to other regional com-ponents through key important regional cit-ies: note Madrid and Milan for westernEurope, Singapore and Hong Kong forPaci� c Asia, Toronto for northern Atlantic,and Houston for the US. Similarly, the north-ern Atlantic component links to western Eu-rope through Amsterdam, to the US throughMinneapolis and Atlanta, and to the twoeastern Europe components through Stock-holm and Berlin. Two other features arenoteworthy: � rst, the relative isolation of theglobal city component linking only to the USthrough Los Angeles and Boston and, sec-ondly, the absolute isolation of Miami. Insummary, there is a meaningful pattern to thecomponents beyond the cores but this doesnot lessen our overall argument for geo-graphical complexity.
Further Research Agendas
Finding an order in the geographical com-plexity provides research leads to new ques-tions for investigation. As mentionedpreviously, there is a need for a geohistoricalapproach to supplement this cross-sectionalanalysis. For instance, looking at the twocentral sets in Figure 4, they both representestablished world cities but of differentstatuses (more alpha and beta cities in theinternational/Latin America component, seeAppendix, Table A1) whereas the other large
set, Paci� c Asia, is de� ned by relatively newworld cities. Hence the latter does not in-clude the two Japanese world cities in ourdata. This Asian component and the twoeastern European components represent the‘frontiers’ of expanding globalisation in re-cent decades. Such ideas can only be ex-plored with data which allow analysis overtime. However, perhaps the main bene� t ofsuch dynamic analysis would be to seewhether the complexity we have found at thevery end of the 1990s represents a dimin-ution of complexity compared with previousrecent times—say, 1990 and 1985. Is thecomplexity we have found an incompleteglobalisation as corporate service � rms movetowards similar city hierarchies in their of� cenetworks? We will only know the answerwhen the extra research is carried out.
These system-wide considerations can becomplemented by a more city-speci� c re-search agenda. We will conclude with somevery concrete suggestions to illustrate howour general analysis does inform our knowl-edges of speci� c cities. Here is a list of 10research leads which can be easily identi� edfrom our analyses. Some will be relativelyfamiliar where there has been research on thetopic, but other themes would seem to benew. The suggestions fall into 2 groups, 5concerning single cities and 5 concerningcomparisons between cities.
Particularly interesting single cities thatemerge from this work are as follows:
(1) Paris as a distinctive alpha world citybecause it hardly registers in our analy-ses.
(2) Istanbul as a link between east and west(resurrecting its traditional role) giventhat it is surprisingly grouped with post-communist eastern European cities.
(3) Johannesburg as the most isolatedworld city in that it has a continent toitself and no clear similarities withother world cities.
(4) Miami as the most peculiar world citybeing distinctive because it combineslow world city status with a major re-gional centre role.
WORLD CITY SERVICES 43
Figure 4. The complexity of globalisation
(5) Osaka as the most dif� cult city to inter-pret because it seems to be unlike otherPaci� c Asia cities and also unlike theother Japanese world city, Tokyo, withits transnational role.
Some particularly interesting city compari-sons to emerge from this work are as fol-lows:
(6) London and New York as the global city
duo given their unique similaritieswhich produce a distinctive and separ-ate city grouping.
(7) Washington, DC, and Brussels as pol-itical centres which lead regionalgroupings separate from the global andtransnational cities within their respect-ive world regions.
(8) Hong Kong and Singapore as Asiangateway cities with both cities exhibit-
PETER J. TAYLOR AND D. R. F. WALKER44
ing remarkably similar af� liations asboth Paci� c Asian and transnational cit-ies.
(9) Moscow and Tokyo as leading regionalcentres which do not lead their regions,an unlikely pairing but their commonfailures to have local regional domi-nation is clearly intriguing.
(10) Los Angeles and Chicago as US alphaworld cities but in the shadow of NewYork; it seems that the former is themore successful in expanding its rolebeyond the national scale.
No doubt, there are many more ‘looseends’ which can be identi� ed from our analy-ses but the point is that a new integratedworld city research agenda is in the processof being developed out of the geographicalcomplexity of globalisation.
Notes
1. It should be understood that this form ofdepicting the cities in no way impinges onour analysis. Like all mappings, we havemade decisions on portrayal to best displayour information. For instance, for carto-graphic convenience, we have located Johan-nesburg in the ‘Europe box’ but it can benoted that this has no in� uence on the sub-sequent input and output concerning this cityin our analysis.
2. This is the � nal decision of many which haveto be decided upon before a principal compo-nents analysis can be carried out. It is ourjudgement that this set of decisions providesthe best analysis of the data for the purposeswe have set ourselves here. Other decisionswill produce different speci� cs in the� ndings, but we think the overall generalpattern of results is reasonably robust. Forreaders who want to explore this matter fur-ther, the original data matrix is availablefrom the GaWC website.
3. In this particular analysis, the matrix hasmore intercorrelated ‘variables’ (the 55 cit-ies) than ‘objects’ upon which they are mea-sured (the 46 � rms) which means that scorescannot be generated in any case.
References
ABU-LUGHOD, J. L. (1995) Comparing Chicago,New York and Los Angeles: testing some
world city hypotheses, in: P. N. KNOX and P. J.TAYLOR (Eds) World Cities in a World-System,pp. 171–191. Cambridge: Cambridge Univer-sity Press.
BEAVERSTOCK, J. V., LORIMER, H., SMITH, R. G.ET AL. (2000) Globalization and world cities:some measurement methodologies, Applied Ge-ography , 20, pp. 43–63.
BEAVERSTOCK, J. V., SMITH, R. G. and TAYLOR, P.J. (1999a) A roster of world cities, Cities, 16,pp. 445–458.
BEAVERSTOCK, J. V., SMITH, R. G. and TAYLOR, P.J. (1999b) The long arm of the law: London’slaw � rms in a globalising world-economy, En-vironment and Planning A, 31, pp. 1857–1876.
BEAVERSTOCK, J. V., SMITH, R. G. and TAYLOR, P.J. (1999c) The global capacity of a world city:a relational study of London. GaWC Brie� ngPaper No. 7 (http:.//www.lboro.ac.uk/depart-ments/gy/research/gawc/rb/rb7.html).
BEAVERSTOCK, J. V., SMITH, R. G. and TAYLOR, P.J. (2000a) World city network: a new meta-geography?, Annals, Association of AmericanGeographers, 90, pp. 123–134.
BEAVERSTOCK, J. V., SMITH, R. G. and TAYLOR, P.J. (2000b) Geographies of globalization: USlaw � rms in world cities, Urban Geography,21, pp. 95–120.
FRIEDMANN, J. (1986) The world city hypothesis,Development and Change, 7, pp. 69–83.
FRIEDMANN, J. (1995) Where we stand: a decadeof world city research, in: P. N. KNOX and P. J.TAYLOR (Eds) World Cities in a World-System,pp. 21– 47. Cambridge: Cambridge UniversityPress.
MICHELSON, R. L. and WHEELER, J. O. (1994) The� ow of information in a global economy: therole of the American urban system in 1990,Annals of the Association of American Geogra-phers, 4, pp. 87–107.
RIMMER, P. J. (1998) Transport and telecommuni-cations among world cities, in: F.-C. LO andY.-M. YEUNG (Eds) Globalization and theWorld of Large Cities, pp. 433–470. Tokyo:United Nations University Press.
SASSEN, S. (1991) The Global City. Princeton, NJ:Princeton University Press.
SASSEN, S. (1994) Cities in a World Economy.Thousand Oaks, CA: Pine Forge.
SHORT, J. R. and KIm, Y.-H. (1998) Globalizationand the City. London: Longman.
TAYLOR, P. J. (1994) Understanding the 1980s,Part 1a, Review of International Political Econ-omy, 2, pp. 365–373.
TAYLOR, P. J. (1997a) Hierarchical tendenciesamongst world cities: a global research pro-posal, Cities, 4, pp. 323–332.
TAYLOR, P. J. (1997b) Embedded statism and thesocial sciences: opening up to new spaces, En-vironment and Planning A, 8, pp. 1917–1928.
WORLD CITY SERVICES 45
TAYLOR, P. J. (1999) So-called ‘world cities’: theevidential structure within a literature, Environ-ment and Planning A, 30, pp. 1901–1904.
TAYLOR, P. J. (2000) World cities and territorialstates under conditions of contemporary global-ization, Political Geography, 19, pp. 5–32.
TAYLOR, P. J. (2001) A speci� cation of the worldcity network, Geographical Analysis, 23 (forth-coming).
TAYLOR, P. J. and HOYLER, M. (2000) The spatialorder of European cities under conditions ofcontemporary globalization, Tidjschrift voorEconomische en Sociale Geogra� e, 91,pp. 176–189.
TAYLOR, P. J., DOEL, M. A., HOYLER, M, ET AL.
(2000) World cities in the Paci� c Rim: a newglobal test of regional coherence, SingaporeJournal of Tropical Geography, 34, pp. 33–45.
TAYLOR, P. J., WALKER, D. F. R. and BEAVER-STOCK, J. V. (2000) Introducing GaWC: re-searching world city network formation, in: S.SASSEN (Ed.) Cities and their Cross-borderNetworks. Oxford: Blackwell Publishers (forth-coming).
TODD, G. (1995) ‘Going global’ in the semi-pe-riphery: world cities as political projects: thecase of Toronto, in: P. N. KNOX and P. J.TAYLOR (Eds) World Cities in a World-System,pp. 192–214. Cambridge: Cambridge Univer-sity Press.
Appendix
World Cities
Table A1. World cities by strata (cities are ordered in terms of ‘worldcity-ness’ with a maximum value of 12)
Score Cities
Alpha world cities12 London, Paris, New York, Tokyo10 Chicago, Frankfurt, Hong Kong,
Los Angeles, Milan, Singapore
Beta world cities9 San Francisco, Sydney, Toronto, Zurich8 Brussels, Madrid, Mexico City, Sao Paulo7 Moscow, Seoul
Gamma world cities6 Amsterdam, Boston, Caracas, Dallas,
Dusseldorf, Geneva, Houston, Jakarta,Johannesburg, Melbourne, Osaka,Prague, Santiago, Taipei, Washington, DC
5 Bangkok, Beijing, Rome, Stockholm,Warsaw
4 Atlanta, Barcelona, Berlin, Buenos Aires,Budapest, Copenhagen, Hamburg,Istanbul, Kuala Lumpur, Manila, Miami,Minneapolis, Montreal, Munich, Shanghai
PETER J. TAYLOR AND D. R. F. WALKER46
Table A2. World cities listed alphabeti-cally, with abbreviations
Amsterdam AMSAtlanta ATLBangkok BANBarcelona BARBeijing BEIBerlin BERBoston BOSBrussels BRUBudapest BUDBuenos Aires BACaracas CARChicago CHICopenhagen COPDallas DALDusseldorf DUSFrankfurt FRAGeneva GENHamburg HAMHong Kong HKHouston HOUIstanbul ISTJakarta JAKJohannesburg JOHKuala Lumpur KALondon LONLos Angeles LAMadrid MADManila MANMelbourne MELMexico City MCMiami MIAMilan MILMinneapolis MINMontreal MONMoscow MOSMunich MUNNew York NYOsaka OSAParis PARPrague PRARome ROMSan Francisco SFSantiago SANSao Paulo SPSeoul SEOShanghai SHASingapore SINStockholm STOSydney SYDTaipei TAITokyo TOKToronto TPRWarsaw WARWashington, DC WDCZurich ZUR
WORLD CITY SERVICES 47
Advanced Producer Service Firms
Table A3. The 46 � rms with of� ces in 15 or more cities (� rms for whichwe have only presence/absence data are marked †)
Sector and code Name of � rm
AccountancyAA Arthur AndersonCL Coopers & LybrandKP KPMGEY Ernst & Young InternationalPW Price Waterhouse
PU PublicisSS Saatchi and Saatchi†TM TMPYR Young & Rubicon
Banking and � nanceAB ABN-AMRO†
BA BarclaysBB BBV GroupBT Banker’s TrustCB Citibank†
PA Compagnie Financiere de Paribas SaCS Credit SuisseCR Creditanstalt-BankvereinDR Dresdner Bank groupMO J P MorganHS HSBCNW NatWest GroupSC Standard Chartered GroupUB UBS