WORLD GOVERNANCE INDEX 1 - WGI – Why Should World Governance Be Evaluated, and for What Purpose? Renaud FRANÇOIS 2 January 2009 1 This paper is available and can be downloaded at the Web site of the Forum for a New World Governance, http://www.world-governance.org 2 Lieutenant Colonel (ret.) Renaud François held major posts in the General Staff or in high-level units (among others, at the African Unit of the Center for Planning and Command of the General Staff of the Armed Forces in Paris, at the Intelligence Office of the Inter-army Services General Staff for Operational Planning in Creil, and as Information Systems and Communications Officer of the General Staff of EUROFOR in Florence, Italy). He also held positions of responsibility for the United Nations (UNTSO mission in the Near East—Egypt, Israel, Jordan and Syria—and ONUVEH in Haiti), at the OSCE in Vienna (Conflict Prevention Centre, with special charge of the High Karabakh conflict), and for the European Union in Brussels (setting up military crisis-management centers within the framework of the European security and defense policy). Lieutenant Colonel François has a Humanities and Liberal Arts Masters in “Humanitarian aid and solidarity” from the University of Lyons 2. He is currently associate researcher for the European Strategic Intelligence & Security Center (ESISC) in Brussels.
Transcript
WORLD GOVERNANCE INDEX 1
- WGI –
Why Should World Governance Be Evaluated, and for What Purpose?
Renaud FRANÇOIS2
January 2009
1 This paper is available and can be downloaded at the Web site of the Forum for a New World Governance, http://www.world-governance.org 2 Lieutenant Colonel (ret.) Renaud François held major posts in the General Staff or in high-level units (among others, at the African Unit of the Center for Planning and Command of the General Staff of the Armed Forces in Paris, at the Intelligence Office of the Inter-army Services General Staff for Operational Planning in Creil, and as Information Systems and Communications Officer of the General Staff of EUROFOR in Florence, Italy). He also held positions of responsibility for the United Nations (UNTSO mission in the Near East—Egypt, Israel, Jordan and Syria—and ONUVEH in Haiti), at the OSCE in Vienna (Conflict Prevention Centre, with special charge of the High Karabakh conflict), and for the European Union in Brussels (setting up military crisis-management centers within the framework of the European security and defense policy). Lieutenant Colonel François has a Humanities and Liberal Arts Masters in “Humanitarian aid and solidarity” from the University of Lyons 2. He is currently associate researcher for the European Strategic Intelligence & Security Center (ESISC) in Brussels.
2
3
Contents WORLD GOVERNANCE INDEX - WGI – .................... ......................................................... 1
i. IGOs ........................................................................................................................ 8
ii. Civil-society representatives .................................................................................... 8
iii. Economic and international-finance actors .............................................................. 9
iv. States and informal groups ...................................................................................... 9
5. A SHARED DIAGNOSIS ............................................................................................. 9
6. INDICATORS AND WORLD GOVERNANCE: MAJOR STAKES ...............................10
CHAPTER 1 – WHY SHOULD WORLD GOVERNANCE BE EVALUATE D, AND FOR WHAT PURPOSE? ..................................... .........................................................................11
1. REFLECTIONS ON INDICATORS.............................................................................11
i. Indicators provide information .................................................................................12
ii. Indicators issue warnings ........................................................................................12
iii. Indicators enable action and guidance ....................................................................12
2. WHY SHOULD WORLD GOVERNANCE BE EVALUATED?.....................................13
i. Evaluation is necessary for understanding ..............................................................13
ii. The stakes are democratic and social .....................................................................14
3. EVALUATING WORLD GOVERNANCE: FOR WHAT PURPOSE? ...........................16
i. In order to act upon the actors … ............................................................................16
ii. … and to make the actors react ..............................................................................17
CHAPTER 2 - THE WORLD GOVERNANCE INDEX ............ ..............................................20
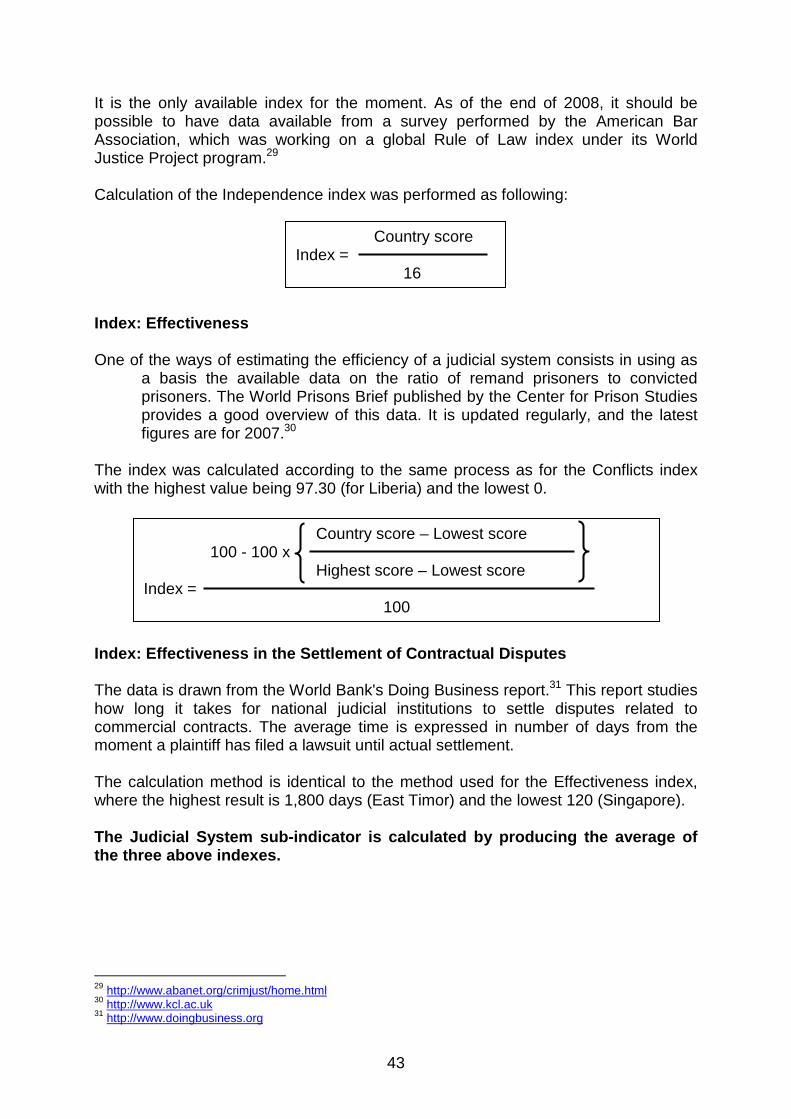
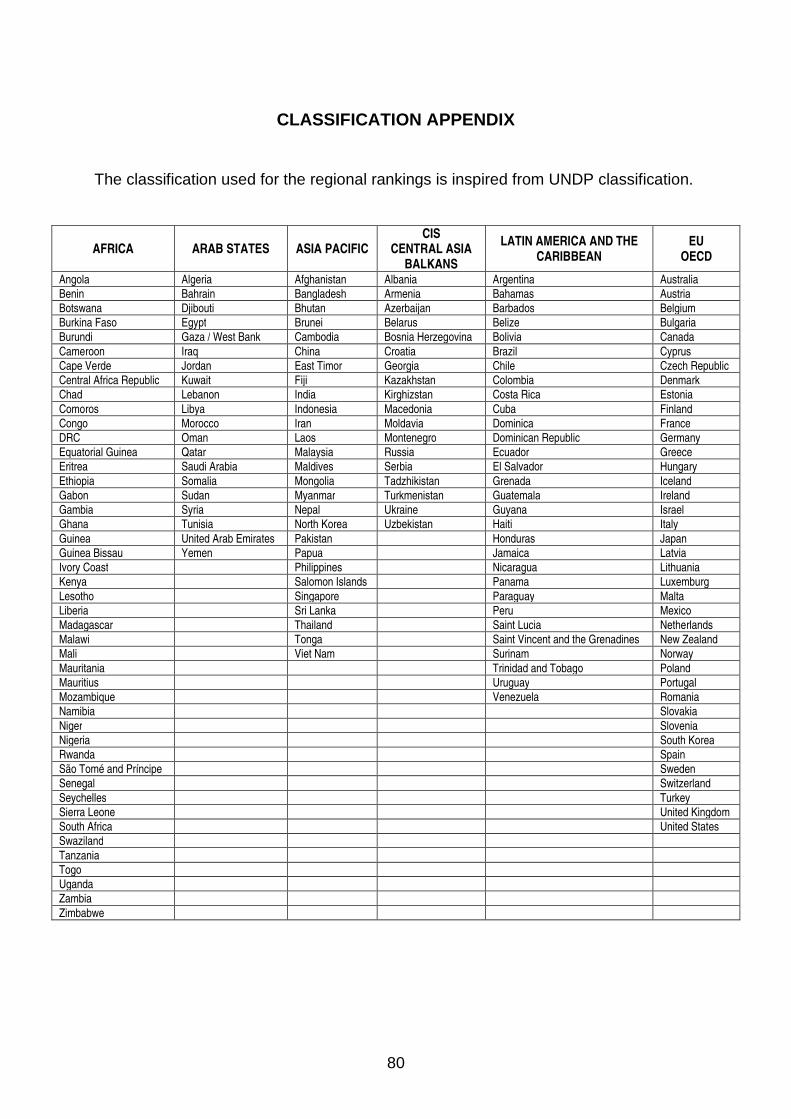
How can world governance, or global governance, be evaluated?3 How can it be measured? The purpose of this study is to answer these questions. Before launching into the examination of the types of indicator that could be used to evaluate world governance, however, two other essential questions need to be addressed previously: Why? For what purpose? Both are fundamental to producing a measurement index. Developing a set of indicators in order to produce a World Governance Index (WGI) is a long and complex undertaking. The idea is to contribute to the possibility of measuring a contemporary concept—world governance—which, in spite of the fact that it is historically rooted, that there are frameworks in which it is currently applied, that it is implemented by identified actors, and that there is agreement on the diagnosis of its afflictions, it is as of yet far from having been "stabilized."
1. A CURRENT TOPIC
If there is a topic that in the past 15 years has been extensively written about, it is certainly governance in general, and world governance in particular. The magnitude of the reality of world governance is widely reflected by the exponential multiplication of books, articles, symposia, debates, and summits on its subject, whether to explore the many paths to it, or to discuss the difficulties involved in it or the requirements it brings to light. The first initiative in this area was taken by the World Bank, which, in the late 1980s, began to develop and spread its own thinking and visions on governance. In the 1990s, the United Nations and a number of economic-cooperation agencies followed suit. Today, there is no article, book, or study involving capitalism, globalization, development, or international law that does not devote a specific chapter to governance. Such abundance of thinking and publication does, however, have a drawback. It can lead to some confusion, to the point that no one knows what, exactly, is covered by the concept. There are many calling for governance, but not everyone is designating the same thing.
2. HISTORIC ROOTS OF THE CONCEPT
Historians place the origins of the word “governance ” in the Middle Ages, when it designated the way feudal power was organized. Although the term itself fell into oblivion until the twentieth century, the concept did subsist. The work of the economist Ronald Coase (who in 1991 would receive the Nobel Prize in Economics) would bring the word back into the literature in the late 1930s At that time, the concept covered the set of coordination processes internal to a business firm, something that was seen as more effective than the market for organizing a number of transactions. What was then called “corporate governance " would become, starting in the 1980s, a management method very much in vogue in the business world. 3 More commonly known as "global governance" in English, in this paper we have also extensively used the term "world governance," which is increasingly in use.
6
It was not until the late 1980s that the concept of "good governance " appeared in the field of international relations. It described, for international financial agencies, the criteria for good public administration in the countries submitted to structural-adjustment programs. The success of economic programs was seen as depending on "good governance," and major donors began to require countries to undertake institutional reforms to achieve it as a condition for obtaining aid or loans. The latest—and most developed—form of the concept is "global governance ," or “world governance .” Departing from the confines of the economic field, it is no longer limited to exploring different forms of economic cooperation as related to the successive stages of economic globalization. Taking into account the consequences of conflicts, in particular those of World War II, which led to the creation of the vast institutional whole constituted by the UN, heir to the defunct League of Nations, the concept rose to the political level and put forward the need for political cooperation among states.
3. APPLICATION FRAMEWORK OF THE CONCEPT
Up until the early 1990s, the question of global governance was not raised explicitly under this term. The term used to define how relations among states were managed was “interdependence .” It was in the Post-Cold War context, in the 1990s, that a new vision appeared as a consequence of some questioning and observations:
First there were questions surrounding the rise of globalization and the consecutive weakening of nation-states. A logical consequence of this weakening was the perspective of transferring to the global level the instruments of regulation that had lost all or part of their effectiveness at the national or regional levels. Environmental concerns were what then received multilateral consecration at the Rio Earth Summit in 1992. The climate and biodiversity issues that were brought up on this occasion became symbolic of a new approach, which was soon to find its conceptual expression in the concept of “global commons .” The third set of questions was in fact contention hailing from two sources: from developing countries, who were finding it unacceptable to let developed and industrialized countries monopolize power and put their own interests first; and from civil society, for which the system of international governance had become the true seat of power, and which rose up against both its principles and its procedures. The conjunction of these two currents of contention led, for example, to the failure of the 1999 WTO ministerial meeting in Seattle.
The gap between the market and politics, and between the globalized economy and national interests appeared as an important constituent element of the concept of global governance. Consideration of this gap by different players, whether economic or political, and the appearance of new actors, public and private, has contributed to reinforcing the debate around this concept. For some, the future of the world will require setting up a world-governance system that will compensate for the inability of nation-states and the current international
7
organizations to meet society’s demands. Today, the issue is no longer to regulate and limit the individual power of states for the purpose of avoiding unbalances, the underlying idea being to not challenge the status quo. What is now at stake is to weigh collectively on the world’s destiny by instituting a system to regulate the many interactions that are beyond the reach of states. The concept of governance includes the concepts of democracy, development, transparency, participation, and responsibility. In June 1997, the UN General Assembly referred to it as follows:
Democracy, respect for all human rights and fundamental freedoms, including the right to development, transparent and accountable governance in all sectors of society, as well as effective participation of civil society, are also an essential part of the necessary foundations for the realization of social and people-centred sustainable development.4
At the Millennium Summit held in the United Nations headquarters in September 2000, heads of state, heads of government, and world leaders adopted the United Nations Millennium Declaration. The declaration, with a consensus unprecedented in the UN, presents a common vision of peace and security, development and poverty eradication, and respect of human rights and democracy. This declaration can be considered as the founding act that, by setting key goals to be reached by 2015, defined the application framework of world governance for the years to come. The fundamental values that had presided over the institution of the United Nations and had been eclipsed for some time by the pre-eminence of the economy were put back at the core of the debate. Facing the challenges of sustainable development, neither national sovereignties nor free-market globalization seem to be up to the task of providing satisfactory solutions. This is why world governance is at the core of progress toward sustainable development. Globalization of the market, the poor representation of stakeholders in the local, national, multilateral, and international regulation bodies, and global regulations hindered in their effectiveness by the absence of international sanctions all constitute the main obstacles to the performance of public decision centers in the area of regulation. World governance, in a sustainable-development perspective, is more demanding than the concept of good governance put at the front of the stage by certain financial institutions such as the World Bank. It requires working on promoting an ethics of behavior. It implies that all international institutions, financial ones in particular, factor in the stakes involved in sustainable development, hence that social and environmental dimensions be integrated into the practices of international, regional, and national financial backers. It imposes a change in the way public decisions are made and public action is implemented by including the voice of civil society and partnering with it. The rise in power of civil society, in particular since the Rio Summit, is gaining more and more strength, and international decision makers have a duty to listen to the expectations being expressed. The multiplication of "counter-summits" to the G7 4 UNHCHR (1998), "The right to development", Commission on Human Rights resolution 1998/72, http://www.unhchr.ch/Huridocda/Huridoca.nsf/0/f1108590029253708025667100324c12?Opendocument
8
meetings and the Davos World Economic Forum certainly expresses a desire for multilateral decisions to be reoriented in the direction of more equitable social progress and environmental respect. The citizen expression of a new human solidarity needs to be taken into better account by giving NGOs a place in international summits more systematically.
4. WORLD-GOVERNANCE ACTORS
From international organizations to nongovernmental organizations, from states to private regulation bodies, there is a big diversity of actors participating in the development of norms, rules, and codes intended to control a domain of activity at the international scale. At the end of World War II, a new world order appeared based on a new international system constituted of a network of IGOs, civil-society representatives, a set of economic and international-finance players, and, finally, states and informal groups.
i. IGOs
This type of organization comprises three distinct categories:
Organizations with a universal vocation: The United Nations with:
− its subsidiary bodies —the Security Council, the General Assembly, the Secretariat, the International Court of Justice, and ECOSOC;
− its operational agencies —UNDP, UNEP, UNHCR, UNICEF, WPF, and UNFPA—set up to allow direct intervention in countries, mainly developing countries, where urgent intervention is needed (although they are under the authority of the UN Secretary-General, they each have their own budget and decision-making body);
− its specialized institutions —ILO, WHO, FAO, and UNESCO—intergovernmental organizations working independently from one another with special collaboration agreements with the UN.
International institutions, which constitute what is commonly known as the Bretton Woods Institutions (the IMF, BIS, and World Bank) set up in 1944, before the end of World War II, to prevent monetary and trade conflicts, to finance the reconstruction of the countries destroyed by the war, etc. The WTO (set up in 1995 to replace the General Agreements on Tariffs and Trade—GATT—that had been set up in 1947) can also be connected to these institutions. Multilateral organizations and regional entities . These include the OECD, the European Union, Mercosur, NAFTA, etc.
ii. Civil-society representatives
The majority of these are embodied by the many NGOs that have imposed themselves as key spokespersons vis-à-vis states and international organizations.
9
Some are recognized as legitimate representatives by international institutions, are in session with them, and take part in the development of international conventions. They are active in many fields, such as the environment (the World Watch Fund and the International Union for Conservation of Nature, for instance, contribute to the work of UNEP, Greenpeace works with the World Business Council for Sustainable Development, etc.), human rights (Amnesty International, Reporters without Borders, etc.), and humanitarian action (the Red Cross, Doctors without Borders, OXFAM, etc.). Alterglobalization movements are also representative of civil society. They have imposed themselves as an incontrovertible component of globalization. The Landless Movement, ATTAC, etc. are among the main movements.
iii. Economic and international-finance actors
This is the category where multinational corporations are found (the UN has listed 60,000), along with cartels, market authorities, and private institutions contributing to the development of common norms and standards. It can be in the domain of accounting (Anglo-Saxon businesses such as Pricewaterhouse Coopers, Deloitte Touche Tohmatsu, KPMG, Ernst & Young, which dominate the multinational-auditing market), or in that of telecommunications or telecommunications regulation (Internet Corporation for Assigned Names and Numbers).
iv. States and informal groups
Although the decline of states is regularly announced, these remain in fact major actors in world governance. They do not all have the same freedom of action, however. Besides their role in the major international organizations and regional entities, some intervene through informal groups: the G7/8, set up in 1975 to coordinate the economic policies of the main industrialized countries after the oil shock, the G20 (set up in 1999), the G22 and the G33 (groups including the G7 and countries with emerging economies, dealing with problems related to the international financial system).
5. A SHARED DIAGNOSIS
Although many economists, thinkers, sociologists, and politicians defend their own vision of world governance, there is one area on which there seems to be general agreement: diagnosis. It can be summarized as follows. International relations are suffering today from serious deficiencies. Our planet is facing social, economic, financial, commercial, demographic, environmental, and security problems that individual states are unable to cope with other than collectively. In many areas the need for unity on a global scale is making itself felt, while awareness of the vulnerability of humankind is also growing continuously. The actions and interventions of the different existing international institutions (UN, IMF, WTO, World Bank, WHO, etc.), which are governed by different, sometimes even contradictory philosophies, principles, and objectives, are anything but consistent. A wide gap has appeared between, on the one hand, de facto interdependence among all the world’s peoples—economic integration, called globalization, tending to make of the planet a global village, is the
10
perfect illustration of this—and, on the other hand, de jure mechanisms, embodied by international organizations supposed to give shape to international relations and regulate them. A recent example amply illustrates and summarizes a certain form of deficiency. It took nearly one month of combat for the UN Security Council to finally adopt, on August 11, 2006, a cease-fire resolution (N° 1701) in Lebanon. The conflict will have revealed the failure, once again, of current world governance. It broke out while the major powers were meeting at the G8 summit in Moscow and had no effect on the meeting whatsoever. It went on, with its procession of horrors and civilian victims, while the United Nations remained unable to make a statement, not even call for a humanitarian truce limited in time. It is not the UN that is at fault. All it could do, as events and circumstances were unfolding, was to reflect the will or lack of will of its member states. In the past, the Cold War was the justification for the inability to take action to put out a regional fire such as the one opposing Israel and the Hezbollah. One of the founders of the United Nations, Brian Urquhart, explains that the ideal of collective conflict management and the will to go beyond strictly classic geopolitical visions only lasted a few months after World War II, before Soviet-American tensions threw a wrench in the works and stopped a machine that, today, is having a lot of trouble restarting.5
6. INDICATORS AND WORLD GOVERNANCE: MAJOR STAKES
The concept of world governance is therefore in full evolution, its application framework is vast, and its actors abound. This is what makes the development of indicators—intended to measure its state—difficult, delicate, and complex. The stakes are twofold. On the one hand, the idea is to find out whether it is possible to analyze and quantify evolutions, over time, in the founding principles or values that, individually or in interaction with one another, have as their purpose what could be called "the sustainability of humankind." On the other hand, this means assessing the actors of world governance, i.e. addressing the effectiveness of their action as implementing the values of world governance. In other words, it is about assessing the collective management of the planet with security, economic, political, environmental, etc. measurements, in order to draw elements for the development of an overall long-term strategy.
5 Urquhart, B (1987), A Life in Peace and War, Harper &Row, New York; Childers, E. and B. Urquhart (1994), Renewing the United Nations System, Dag Hammarskjold Foundation, Uppsala, Sweden.
11
CHAPTER 1 – WHY SHOULD WORLD GOVERNANCE BE EVALUATED, AND FOR WHAT PURPOSE?
The question of evaluating and measuring world governance begs three other questions:
First, there is the general question of indicators. What is their definition? What are their features? What is their purpose? This then raises the question of the need to evaluate. Can we abstain from measuring world governance? Or is it on the contrary indispensable to do so? The third question is about the purpose of this sort of evaluation. What should be done with its results? What consequences might they have on world-governance actors?
1. REFLECTIONS ON INDICATORS
Generally speaking, indicators can be said to enable a representation of complex reality. They play three main roles: a scientific one (in our case, by describing the state of world governance), a political one (by identifying priorities and evaluating the performances of actors involved in world governance), and a social one (by facilitating communication and pointing actions in the right direction). Indicators, by aggregating data that is sometimes abundant and incongruous, quantify information; they also simplify it, especially when illustrating complex realities. Indicators must meet a certain number of quality criteria, among which: political relevance and usefulness for users; robustness, reliability, and precision (they must effectively reflect the variations of what they are supposed to be summarizing); quality and availability of the data (data must be indisputable and easily accessible); comparability (year-on-year); legibility; and transparency. Indicators are also evaluation tools and are meant to assist in decision making (guidance, adjustments), thanks to which a situation, an activity, or a trend can be measured in a relatively objective light at a given point in time or in space. In a way, they constitute a summary of complex information offering different actors (scientists, administrators, policy makers, and citizens) the possibility of dialog with one another. Indicators, whether qualitative or quantitative, generally describe a situation that cannot be apprehended directly. There has to be a causal relation between the measured (indicated) fact and the indicator. Rather than trying, however, to give a specific theoretical definition, it is probably more useful to consider specific data, which will allow a quicker and more operational approach to the concept. An indicator can be considered as a signal in a system or in part of a system. This signal is to provide information about the system itself: its state or its evolution. This example provides three important terms directly related to indicators: signal, system, and information. Signal. This is data that is sought and judged to be important. System. Both within and outside the system; indicators can be external or internal. There are self-
12
indicators, managed by the actors themselves, or indicators provided by outside observers. In all cases, what is being approached is the system. Finally, information as measure or indication. Indicators or sets of indicators have a threefold role: to inform, to alert, and to enable guidance and action.
i. Indicators provide information
An approach relying on indicators provides information within a system, as well as outside it, because a good policy of indicators, therefore of evaluation, must indeed be a transparent policy. All the information provided by the indicators, whether internal or external, is to be returned to the actors of the system, who are directly concerned by what the indicators reveal regarding the state of the system for which they are responsible. Indicators must also, especially in a democracy, be used to inform citizens and public opinion in general. Furthermore, a policy of indicators or evaluation must be designed from the start as responding to a social demand. Such demand is indeed enormous with regard to the evaluation of world governance, and is set to grow. This very high demand for evaluation and for the indicators needed to perform it comes, quite paradoxically, with some reserve and skepticism, which reinforces the need for a rigorous approach, as much in the development of indicators as in how they are used.
ii. Indicators issue warnings
Beyond the information that they provide explicitly, indicators issue warnings. In this capacity, the information they supply can then lead to two results: deepening and action. After a set of indicators is applied to a system, the actors of the system should be induced to take things deeper, because self-evaluation is the necessary complement to a system of indicators. The world, as it is today, is a complex organism and its governance is complicated. An exhaustive description of its reality is unattainable, no matter the quality of the set of indicators developed to do so. When all is said and done, a system of indicators should be seen as an outline with one role to play: to alert. It provides indications, on the basis of which the actors who are directly involved and know the system well will be able to deepen their observations and get efficient answers to their questions: “Is it correct to say that …?” “Is it is true that …?”
iii. Indicators enable action and guidance
Action and guidance are the result of an instrumental vision of indicators. Indicators do not constitute scientific work, even when they are high-quality. Otherwise, there would be more than just skepticism about indicators, they would simply be rejected. This being said, the quality requirement must not cloud the fact that indicators are designed mainly to help organizations to clarify and deepen their thinking, and to act. This is where their political dimension comes into play, where indicators become instruments, or guidance tools. There are two main requirement to all modern democratic societies: evaluation, which is possible with a good set of indicators, and public debate on the quality and the perfectibility of world-governance actors. As mentioned in the introduction of this paper, the debate around the concept of world governance has been growing in scope over
13
the years. The view on world governance of different players, whether they are diplomatic or economic, or civil-society representatives, expresses just how much is expected from it. Like public service, which must be at the service of the public, world governance, to remain world governance, must truly be governance of the world, at the service of the world. More than simply an easy play on words, this is actually the core of the matter. If world governance does not fulfill this basic role, it runs the risk of bringing about a damaging setback or of accelerating into a road block on a path made of uncertainties.
In addition to feeding the public debate, systems of indicators also have an even more fundamental role, which is to provide guidance. World governance cannot be limited to no more than circular letters or top-down directives. Its success depends on the initiatives of actors. Having responsibilities, at whatever level, in the area of world governance, means giving rise to initiatives, framing them, and evaluating them, all at the same time. It is therefore useful for world-governance actors to have tools at their disposal that will allow them to take initiatives. Among such tools, indicators are indispensable.
2. WHY SHOULD WORLD GOVERNANCE BE EVALUATED?
i. Evaluation is necessary for understanding
The first explanation that comes to mind is that when a living organism—be it a human being or a society—suffers from significant deficiencies, whatever is wrong needs to be diagnosed. The first reflex should logically be to use the appropriate instruments, whether the most basic, such as a thermometer, or very elaborate ones, such as a medical-imaging instrument. This initial measurement, this first image, is what will make it possible to observe whether there is improvement or regression after some form of treatment has been implemented. World governance has become a current topic of interest that cannot be ignored. Everybody agrees that the world is in bad shape, and that this is because world governance is in bad shape. Before even defining a medical protocol, it is essential to know exactly what the patient is suffering from. Indicators, or systems of indicators, given their information role, seem to be the tools best adapted to get a clear picture of what world governance is afflicted with.
Over the years, all modern economies have taken up indicators as measuring instruments to allow them some form of definition in space (by comparing the respective performances of different countries) and in time (by tracking year-on-year evolution). Although the GDP, which measures a country’s production of economic wealth (goods and services), has long remained the undisputed reference to assess economic health, economists are now acknowledging that it simply does not reflect national “well-being." Even in his time, Robert Kennedy said, shortly before his assassination in 1968, “[GDP] measures everything, in short, except that which makes life worthwhile.”6 The GDP indicator is no longer the main compass used by policy makers: a true "political economy" is emerging, focused on the human factor, rather than on the production and consumption of countries and individuals. GDP growth, the be all and end all of political discourse that is so widespread, is a flawed and misleading thermometer.
6 Robert F Kennedy (1998), Address, University of Kansas, Lawrence, Kansas, March 18.
14
The world today is obviously no longer the world of the 1950s: its dimensions have changed (distances have been considerably shortened), as have its potentials (natural resources are at risk of depletion), its breathing space has been reduced (CO2 emissions are threatening the very balance of the planet), its sense of what is real is altered (the immaterial and the virtual have broken into our perception and our models), its technological capacities have grown, and its goals have shifted. It is no great gamble to state that our societies are going to have to cope, in the coming decades, with mutations comparable in magnitude to those that pushed them from the Middle Ages into the modern era. These mutations will not occur in just one area: they will involve values, forms of production, consumption, and trade, governance, and the relationship between humans and the biosphere. The present system of indicators can understandably be seen as unable to reflect these four main areas, and can hardy be expected to be of any use in appreciating the magnitude of these foreseeable mutations nor in tracking their evolution. Today’s social model—and hence the one (or those) toward which we are moving within a lifetime—is no longer that of the 1950s. Its evolution can therefore no longer be calculated with just the instruments developed in the 1960s. For new social models, we need new thermometers.
ii. The stakes are democratic and social
Indicators and indexes are increasingly a part of public life and should become more so in the coming years, at least if the commitments made at the 1992 Rio Conference on Environment and Development by our countries—in fact most countries of the planet—are complied with. Agenda 21, adopted at the conference, repeatedly underscores the need to embrace sustainable-development indicators to guide and evaluate policies in this area.7 Beyond the above-mentioned case of GDP, what is of interest here is the more general question of the status, both scientific and democratic, of indicators, whether they are meant to produce a World Governance Index (WGI), a Human Development Index (HDI, developed by the United Nations Development Programme—UNDP), a Genuine Progress Index (GPI), or any other type of index. These are all scientific objects built and circulated to be used in policy making. Their construction is submitted to three requirements that are sometimes hard to make compatible: scientific rigor, political effectiveness, and democratic legitimacy. To form an opinion on them, it is important to first examine how, concretely, these indexes are built and on what foundations. These building operations pose sometimes delicate technical problems regarding, for instance, how to translate abstract concepts into observable data or how to aggregate variables of different natures and metrics. Even if indicators and indexes were exclusively scientific constructs—which seems impossible, at least in the fields of world governance, human development, or any other social field—their use and interpretation would still be political, and social processes in which the beliefs, values, and strategies of the different actors would play a major role.
7 http://www.un.org/esa/dsd/agenda21/
15
Politics are therefore implicitly or explicitly at the core of the construction and use of indicators. How, then, can both the reliability and relevance of the tool, and its democratic legitimacy be guaranteed? For the specific issue of sustainable-development indicators, this is the question all countries have had to, or are having to grapple with. A quick review of practices in the area of systems of indicators shows that the participatory nature of this process is most often limited to no more than consulting with institutional advisory councils. Sometimes, in the best of cases, “the people” are also called upon to express themselves. Should this be taken further, and above all, can it be? Some do not think this would be a good idea because of people’s excessively individualistic nature, which would push them, out of selfishness, to not worry about the well-being of future generations and the means to guarantee it. Others believe it might be a good idea, but an unrealistic one because the issues would be out of the reach of “ordinary” citizens, who would be plainly unable to make a useful contribution. Nevertheless, the broadest possible involvement of the population in the construction of sustainable-development indicators seems both desirable and possible. Desirable, because such involvement constitutes a central element in world governance or sustainable development insofar as these concepts require democracy to be deepened in order to achieve greater authenticity. Possible because, through the virtues of deliberation, citizens can express real and informed concern for the common good, including that of the future of humankind.
To illustrate this with a recent example, it seems useful to turn to the OECD Metagora project and its Partnership in Statistics for Development in the 21st Century (PARIS21). Based on a North-South partnership, the aim of this project is to study methods, tools, and areas of measurement in democracy, human rights, and governance. Its strategic goal is to enable improvement in observation and evaluation in these fields. Its main goal is to develop tools based on well-established statistical methods to develop, on the basis of the collected data, indicators on which national policies can be formulated and evaluated. Their findings speak for themselves:
1. Measuring human rights and democratic governance is technically feasible and politically relevant. Sensitive data on human rights, democracy, and governance can be collected and analyzed using statistical tools. 2. On the basis of this information, indicators can be produced that are relevant and useful for political decision and action. 3. Quantitative data and qualitative information can and should interrelate to properly inform assessment of human rights and democratic governance. 4. Official Statistical Agencies can be efficiently involved in various forms in evidence-based assessment of human rights and democratic governance. . . . 5. Quantitative indicators and statistical analysis bring a significant value-added to the work of national Human Rights institutions. 6. Statistical methods can substantially enhance the research and advocacy of civil society organizations in the fields of human rights and democracy.8
8 Suesser, J.R. and R.S. de Miguel (2007), “Measuring Progress in Democracy and Human Rights: Why? How? To whom?”, Second UECD World Forum on Statistics, Knowledge and Policy: “Measuring and Fostering the Progress of Societies”, Istanbul, Turkey, July 27-30, www2.dpt.gov.tr/oecd_ing/anadolu/.../jean_Robert_Suesser.ppt
16
3. EVALUATING WORLD GOVERNANCE: FOR WHAT PURPOSE?
i. In order to act upon the actors …
This past decade has been the setting for a huge proliferation of systems of indicators and publication of indexes, many of which are directly related to the concept of governance. In 2003, there were nearly 50 projects in progress or published works. In the 2007 edition of the Governance Indicators Users’ Guide, written jointly by the European Union and the UNDP, there are no less than 100 of them. Since the UNDP’s first publication in 1990 of its report on human development, the HDI, which not only includes indicators for income and material well-being but also indicators for education and health, has contributed considerably to changing mindsets and ways of acting among the actors and international observers of human development. The best tribute to this considerable work could only have come from Amartya Sen, the distinguished economist who inspired the UNDP’s pioneering work. Initially, Sen was not favorable to publishing an HDI, which he deemed to be too “crude” and “summary” to reflect the enormous wealth of available information. In 1999, he changed his position and wrote, in reference to his previous discussions with the other “father” of UNDP reports and indicators, Mahbub ul Haq:
Mahbub got this exactly right, I have to admit, and I am very glad that we did not manage to deflect him from seeking a crude measure. By skilful use of the attracting power of the HDI, Mahbub got readers to take an involved interest in the large class of systematic tables and detailed critical analyses presented in the Human Development Report. The crude index spoke loud and clear and received intelligent attention and through that vehicle the complex reality contained in the rest of the Report also found an interested audience.9
Similarly, the Corruptions Perception Index produced by Transparency International is now taken into consideration as much by financial backers and other international players as by governments and civil-society groups. The same is true for many other indicators or indexes. Even the World Bank, whose work on governance indicators has often, and rightly, been criticized, has integrated into its indicators, since 2007, data and indexes on the perception of governance provided by about 30 civil-society organizations. This is remarkable progress, and it needs to be underscored, especially as the World Bank had refused for nearly 10 years to communicate on how it elaborated its Country Policy and Institutional Assessment (CPIA) index.
Through the publication of indicators, the debate on governance has enabled and favored significant progress: the idea of legitimacy entered into the debate and became more important than the idea of efficiency. For many, if not all, civil-society organizations, the World Bank cannot and should not lead the governance crusade. First, because its status as international institution “frees” it from direct control by the United Nations. In addition, its absence of transparency disqualifies it from leadership. Rising criticism, conveyed in September 2006 by the European
9 UNDP (1999), “Human Development Report 1999”, Oxford University Press, published for the UNDP, New York, Oxford, http://hdr.undp.org/en/media/hdr_1999_front.pdf
17
Commissioner for Development and Humanitarian Aid, Louis Michel, forced the World Bank in 2007 to review its corruption-related requisites for developing countries to be granted loans. The EU and civil society, represented by many organizations, by putting the debate on the floor drove the World Bank to consider governance from a much more political than a merely technical standpoint.
ii. … and to make the actors react
To illustrate the need for reaction and how urgent it is, here is an edifying, and unfortunately symptomatic testimony on a certain type of governance, or rather of non-governance. The scene is set in 2000, in Burundi, in the province of Karuzi. A team of 7 expatriate volunteers and 180 local staff of the Belgian branch of an internationally recognized French nongovernmental organization (NGO) was taking 150 persons into care at a Center for Nutrition and Treatment (CNT) and about 500 persons under a weekly food-ration distribution program at a Center for Nutritional Supplementation (CNS). The team was supported from the capital of Burundi, Bujumbura, by a coordination group (head of mission, logistics coordinator, accountant, and administrator, the latter two of which were on their very first mission). The administrative pair, entangled in wage calculations complicated by a complex system of bonuses, decided to suppress the bonuses and to level all wages to the top, which amounted to an average 40% wage increase for the local staff, and had a janitor, who was lowest on the wage scale, earning as much as a government-employed provincial physician. The raise was far from enough to unbalance the local economy of the province, with its 300,000 inhabitants. In late November of that year, a huge malaria epidemic broke out in the province. The epidemic, combined with a period of very poor crops, triggered a major humanitarian disaster. Four months later, the number of persons taken into care per month at the CNT had grown to 5,000 and to 30,000 at the CNS. The resources put to work by the NGO had become astronomical: 45 expats, 54 vehicles, 8 of which were trucks, 5 CNTs, 10 CNSs, 21 million Belgian francs in own funds, not to mention funding from the Humanitarian Aid Department of the European Commission (ECHO), and from the Office of US Foreign Disaster Assistance, OFDA, 150 tons of freight per week, and above all, a staff of 1,500 local employees, 15,000 under contract and 500 day workers. The mass of local employees began to pose serious problems. Everybody wanted to work for the NGO. Positions had to be distributed between Hutus and Tutsis. With such enormous staff, however, things got out of hand. The wages were so attractive that many of the country’s civil servants abandoned their government jobs and concealed their status to get hired by the NGO. Schools and public administrations were soon in trouble and the local economy was completely unbalanced. Price monitoring, organized by the NGO itself, showed a weekly increase of nearly 10%. Relations with the crippled local administration quickly deteriorated, which hindered the smooth running of aid operations. The end of the emergency mission was especially delicate and painful, with expats being held hostage by local employees who did not want to lose this important source of income. When all was said and done, there was no doubt that thousands of lives had been saved, but with much collateral damage: an atomized economy, a profoundly disorganized
18
education system, a local administration depleted of resources, and greater suspicion of humanitarian missions.
This example, deliberately taken at the bottom of the world-governance scale, clearly shows, like the aforementioned World Bank example, that it is necessary, indispensable, and vital for world-governance actors to collect their wits. Deep soul searching, questioning their working methods and ways, i.e. their own governance, is something they simply cannot avoid if they expect to acquire a new legitimacy more in agreement with the challenges of the twenty-first century. Fortunately, there are now many encouraging cases of ambitious questioning. Humanitarian aid is the area in which such experiences seem to have progressed the most. This questioning-based reaction usually follows a relatively simple process, which can be summed up into three main rules: understanding, evolution, and innovation. These three rules are aimed at reinforcing the competence of actors, at promoting the improvement of practices, at drawing lessons from experience, at capitalizing knowledge and circulating it, and at inventing methods and tools intended to encourage a "quality approach." The goal of this overall approach, involving humanitarian-aid beneficiaries, actors, and donors, is to put humanitarian aid back in what is its raison d’être: to help populations afflicted by crises. The guidance and the evaluation of an action also aim to give an NGO credence and reinforce trust. Responsibility and accountability cannot simply be decreed: they need to be shown and proven. That NGOs should have been the first to react is not surprising, as their structures allow it. On the other hand, there is no denying that in large international organizations, thinking is slower and reactions even slower than that. The United Nations, having become aware of its weaknesses, has launched since 1997 a vast program aiming to make it a more effective instrument to achieve important goals, in particular those set out in its Millennium Declaration. The questioning process regarding certain practices is similar, overall, to the process followed by NGOs. It has placed the accent on useful action, reorganizing the means of information, better service to the benefit of Member States, better coordination of actions, funding priorities, and seeking excellence in staff hiring.
In September 2002, the acting UN Secretary-General, Kofi Annan, noted that progress had been made on many fronts:
The reforms begun in 1997 were aimed at adapting the internal structures and culture of the United Nations to new expectations and new challenges. Since then, there have been some important achievements—not least the Millennium Declaration itself, which contains a clear set of priorities, including precise, time-bound development goals. These now serve as a common policy framework for the entire United Nations system. The United Nations has been in the forefront of the battle to eradicate poverty and fight the HIV/AIDS pandemic. The implementation of the report of the Panel on United Nations peace operations is improving the Organization's capacity to deploy and manage peacekeeping and peace-building operations, and it has responded well to novel and unexpected challenges in Sierra Leone, Kosovo and Timor-Leste. The United Nations is showing greater coherence, and its disparate elements are working better together. Fruitful partnerships have been built with a wide range of non-State actors. In short, the Organization is evolving with the times. It is more efficient, more open and more creative.
19
But more changes are needed. The present report suggests a number of improvements aimed at ensuring that the Organization devotes its attention to the priorities fixed by the Member States, and that the Secretariat gives better service. However, the intergovernmental organs must also change. The General Assembly and the Economic and Social Council both need to adapt in order to realize their potential, while the stalled process of Security Council reform needs new impetus. The work programme of the Organization as a whole should be better focused, with fewer but more productive meetings, and fewer but more useful documents.10
Obviously, the task is challenging and ambitious. It will take time to accomplish and will need to overcome the formidable inertia due to the size of the UN or that of the other large world-governance organizations. It will also have to overcome the many difficulties that will necessarily emerge from having to question certain habits. This is the price to pay to acquire the capacity essential for managing change in a rapidly evolving world. If the UN and, by extension, all large organizations with a universal vocation—international institutions and multilateral organizations, and regional organizations—do not modernize and develop their capacities in this area, they are likely to be outstripped and no longer be in a position to play a key role on the world stage. Both a photograph and a means to induce action/reaction, the WGI thus has a twofold dimension. An analytical dimension—it must provide as true a reflection as possible of the state of world governance—and an operational dimension—it must enable actors, whatever their level, to act or to react in the direction of a more efficient, more democratic world governance more in phase with the environment. On first impression, the first dimension seems relatively easy to measure, but the operational dimension seems more delicate to quantify. A study of this twofold dimension should make it possible to determine the constituent elements of a WGI that will respond to both the analytical and the operational need.
10 Annan, Kofi (2002), “Strengthening of the United Nations: an agenda for change”, Report of the Secretary-General to the United Nations General Assembly, Fifty-seventh session, United Nations, New York, September 9: http://www.centrodirittiumani.unipd.it/a_temi/riformanu/docs/StrengtheningUN.pdf
20
CHAPTER 2 - THE WORLD GOVERNANCE INDEX
In the preceding chapter, we underscored the exponential multiplication of systems of indicators. The major disadvantage of most of these systems is that they take into account only one of the domains of world governance. Although all these systems give excellent results, whether quantitative or qualitative, they cannot be said to provide a complete picture of the state of world governance. Monothematic research gives a monocolored picture. To get a precise picture of the state of world governance and of its evolution, the whole of the fundamental domains in which it is exercised needs to be taken into account.
1. BASIC TEXTS
These fundamental domains were originally written into two texts that are important for modern world governance: the Charter of the United Nations, signed on June 26, 1945, and the Universal Declaration of Human Rights of December 10, 1948. To “save succeeding generations from the scourge of war . . . and to reaffirm faith in the fundamental human rights, in the dignity and the worth of the human person, in the equal rights of men and women and of nations large, and to establish conditions under which justice and respect for the obligations arising from treaties and other sources of international law can be maintained, and to promote social progress and better standards in larger freedom”: these are, in the wake of World War II, the guidelines set by the UN Charter for world governance.11 Three years later, the Universal Declaration of Human Rights was to reinforce the Charter and constitute, in the minds of the leaders from all over the world who adopted it, the roadmap to ensuring every person's rights, in all places and at all times.
2. RIO DE JANEIRO: A NEW MOMENTUM
The Earth Summit, held in Rio de Janeiro in 1992, served to jump start awareness of the importance of the fundamental domains of world governance. At this international conference, sustained interest arose for the conservation of intangible assets, as precious as they were threatened: air, water, and forests. As months went by, as the idea of interdependence in the global village took hold, the thinking expanded from considering environmental assets to including the whole of humankind’s common goods, the global commons: health, education, human rights, etc. The concept of global commons being fuzzy, intellectuals and groups of experts set out to clear it up. It is the Italian Riccardo Petrella, former director of the Forecasting and Assessment in Science and Technology (FAST) program of the European Commission, Coordinator of the International Committee of the World Water Agreement set up in 1998 upon the launching of the "Water Manifesto," who can be attributed with what
can be considered the best definition of global commons as the goods and services that should be seen as essential to the security of living together at the global level.12
3. THE MILLENNIUM DECLARATION: A CONFIRMATION
Taking into account the geopolitical upheavals ensuing from the end of the Cold War and the major challenges being faced by humankind, the Millennium Declaration of the year 2000 confirmed the thinking on global governance and reinforced the view, which had arisen from the global-commons concept eight years earlier, that the different domains were all linked with one another. Aware of the complexity of the challenges to be met and of the emergency to act, the heads of state and heads of government gathered in New York from September 6 to 8, 2000 solemnly reaffirmed their faith in the United Nations Organization and its Charter “as indispensable foundations of a more peaceful, prosperous and just world,” and went on to recognize their “collective responsibility to uphold the principles of human dignity, equality and equity at the global level." “Determined to establish a just and lasting peace all over the world in accordance with the purposes and principles of the Charter," they rededicated themselves "to support all efforts to uphold the sovereign equality of all States, respect for their territorial integrity and political independence, resolution of disputes by peaceful means and in conformity with the principles of justice and international law, the right to self-determination of peoples which remain under colonial domination and foreign occupation, non-interference in the internal affairs of States, respect for human rights and fundamental freedoms, respect for the equal rights of all without distinction as to race, sex, language or religion and international cooperation in solving international problems of an economic, social, cultural or humanitarian character.” They committed openly to “ensure that globalization becomes a positive force for all the world’s people," and declared that this was possible “only through broad and sustained efforts to create a shared future, based upon our common humanity in all its diversity.” These efforts were to “include policies and measures, at the global level, which correspond to the needs of developing countries and economies in transition . . . formulated and implemented with their effective participation."13 These Millennium Development Goals constitute a blueprint for the advent of a better world.
4. THE JOHANNESBURG SUMMIT: AN URGENCY
The World Summit on Sustainable Development of Johannesburg in 2002, ten years after the Rio Summit, underscored the urgent need to take on the challenges of the twenty-first century in compliance with the fundamental principles of world governance, which were restated in the final declaration of the summit. Seeking the best road to follow for the principles of sustainable development to be respected and their implementation to lead to concrete results, the state representatives confirmed during the summit the considerable progress achieved in the direction of a world consensus and the construction of a partnership among all the populations of the planet. Recalling the indivisibility of human dignity, they urged "the promotion of dialogue and cooperation among the world’s civilizations and peoples, irrespective of race, disabilities, religion, language, culture or tradition." Sustainable development
became the common goal of all humanity and everything was to be put to work to achieve it: “constructive partnerships for change,” “decisions on targets [and] timetables,” “poverty eradication, changing consumption and production patterns and protecting and managing the natural resource base for economic and social development,” “the emergence of stronger regional groupings and alliances, such as the New Partnership for African Development,” “a long-term perspective and broad-based participation in policy formulation, decision-making and implementation at all levels,” and “strengthen[ing] and improve[ment of] governance at all levels."14
5. DOMAINS SELECTED FOR THE CALCULATION OF THE WGI:
The different concepts developed in the founding texts and the above-mentioned conferences clearly reveal that the first goal of world governance is to define new relations among human beings, among societies, and between humankind and the biosphere. Starting from this overall objective, the Proposal Paper "Redefining Global Governance to Meet the Challenges of the Twenty-first Century" expresses the three main objectives that international institutions need to adopt as guidelines:15
i. Establishing the conditions for sustainable deve lopment
The first duty of governance is to preserve the long term. The current mode of development has generated fundamental imbalances. The imbalances generated by the current form of development between humanity and the biosphere have put the lives of our children and grandchildren at risk. The first common objective is therefore to change the current development models to make them compatible with the limited resources of the biosphere in the long term. Material development must be subordinated to human development. The future of humankind cannot be guaranteed unless concern for the complete development of human beings—spiritual, intellectual, social, artistic, etc. development—becomes the primary development criterion.
ii. Reducing inequalities
Sustainable development cannot be achieved if the limited natural resources of the planet are confined to a small minority that has the economic means to acquire them and the military means to hold onto them. Reducing inequalities is therefore not only a moral duty or an act of compassion. It is also a duty of justice and a condition for long-term peace. Finding ways to conciliate the liberty of all with respect of the dignity of all is the second objective assigned to world governance.
iii. Establishing lasting peace while respecting di versity
Ecological diversity and cultural diversity are not only irreducible realities of today’s world, they are also humankind’s main wealth. Peace requires the recognition of a common belonging, the search for a common good, and awareness of unity, from grassroots communities to the entire human family. At every level of governance, it
is to achieve both greater unity and greater diversity. The idea is not to oppose unity and diversity, but instead to consider them as the two sides of the same coin, which constitutes, from managing a district or a village to managing the planet, the art of governance. It is the art that world governance needs to practice at a global scale and help to practice at the other levels.
These three objectives, as presented and stated here, are those most consistent with the big traditional fields of application of world governance: peace, security, democracy, freedom, and equity. It is therefore, in a straight line from these big domains that we have selected the specific following domains, the detailed study of which, in the form of indicators and composite indexes, should make it possible to develop the WGI:
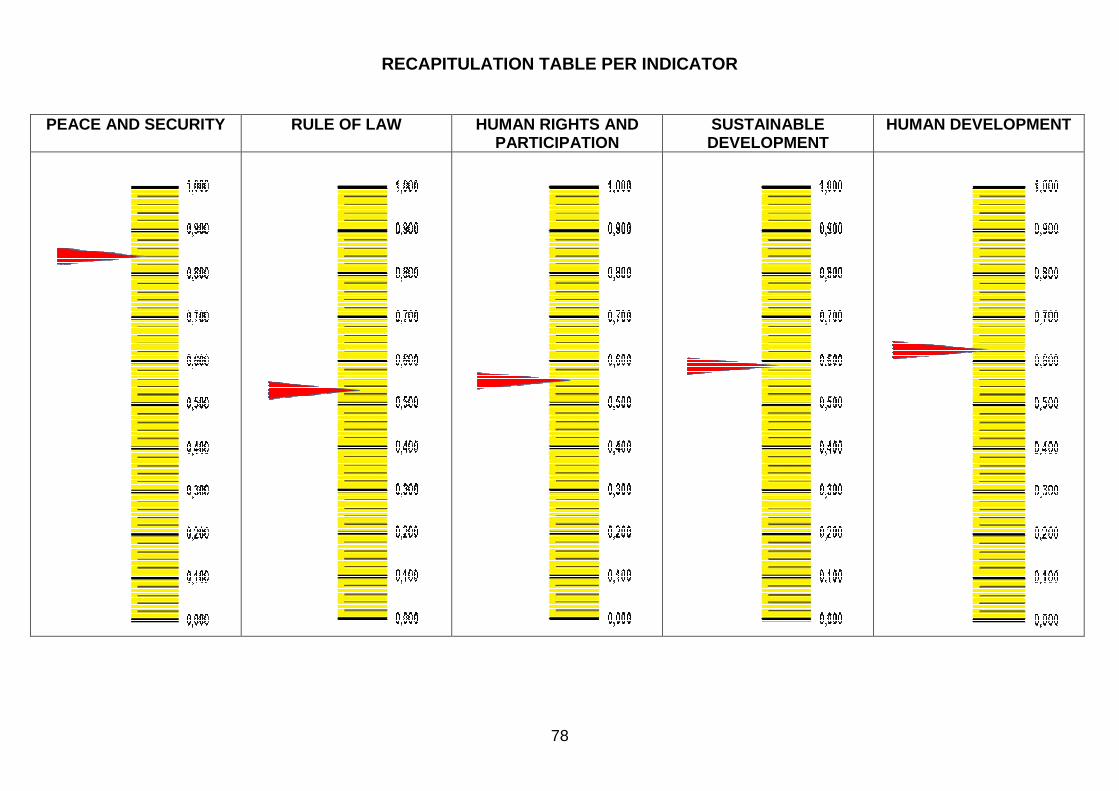
• Peace and Security • Rule of Law • Human Rights and Participation • Sustainable Development • Human Development
24
CHAPTER 3 - INDICATORS AND THEIR COMPOSITE INDEXES
1. PEACE AND SECURITY
For Kofi Annan, former Secretary-General of the United Nations, peace is essential to safeguarding all other global public goods. Without it, nothing that world governance is supposed to do is possible. In other words, being safe and secure is the first of all the principles of world governance. Overall, peace is based on two complementary and inseparable concepts: the concept of national security, involving the state as such, and the concept of public security, involving citizens and their protection. Defense and security, which constitute national security, are state prerogatives aiming to ensure, in all places, at all times, and in all circumstances, the integrity of a state’s territory, the protection of its population, and the preservation of its national interests against all types of outside threats and aggressions. They also involve respecting international alliances, treaties, and conventions.
The concept of public security, otherwise called human security, is relatively new and used extensively to deal with the complexity of threats weighing upon populations. Living in a secure state with regard to the outside does not necessarily mean that individuals are enjoying security within the state. Protecting citizens from an outside threat is without any doubt a necessary condition for public security, but it is far from being sufficient. It is therefore necessary to take into account everything related to the political climate within a state, to the protection of citizens against all forms of violence and theft, and to the means implemented to ensure this protection.
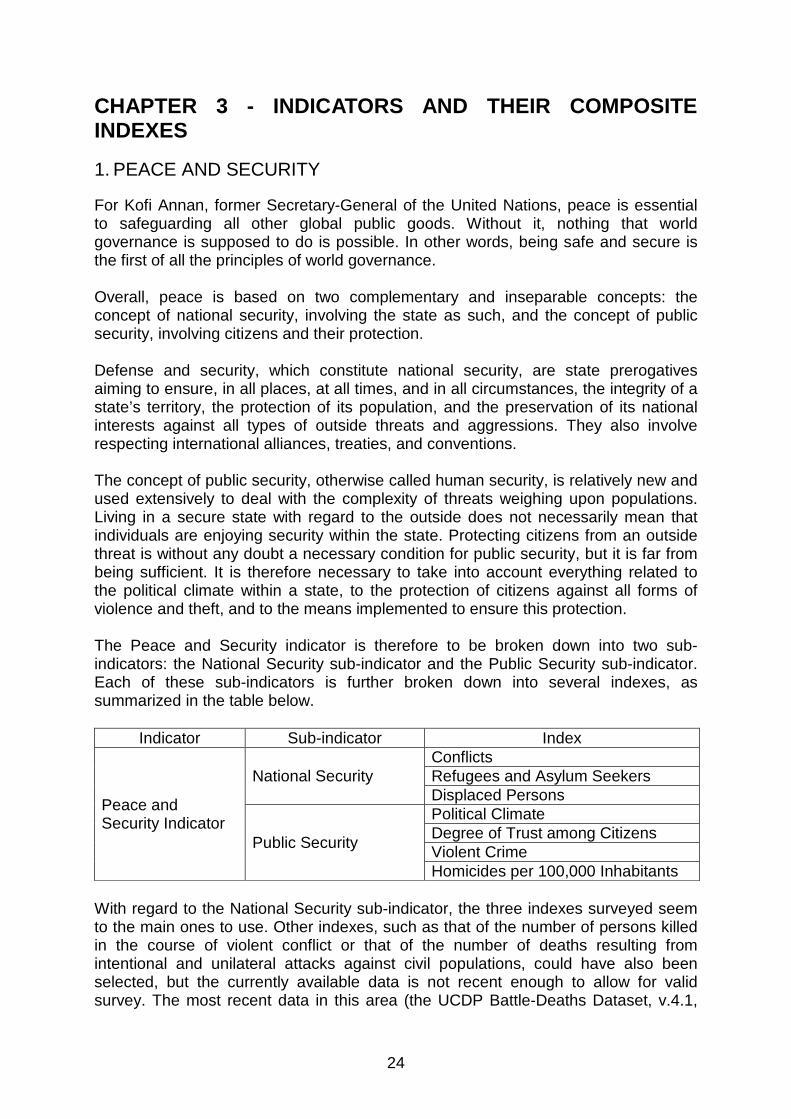
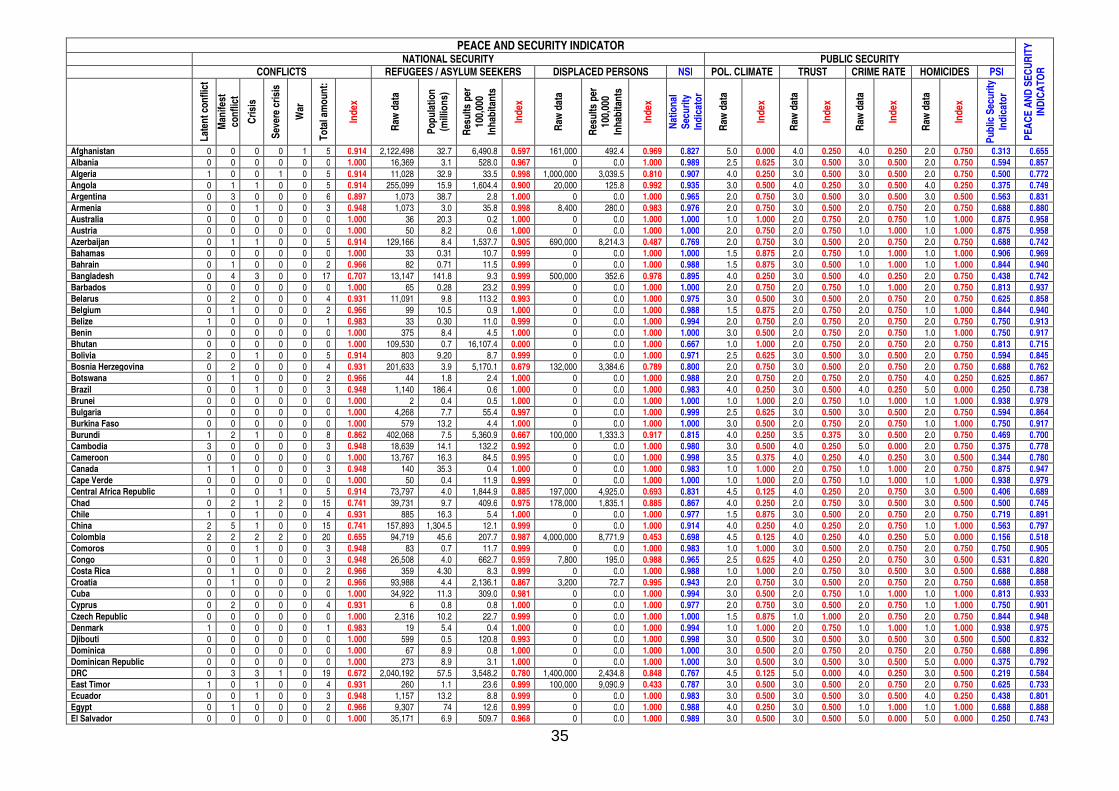
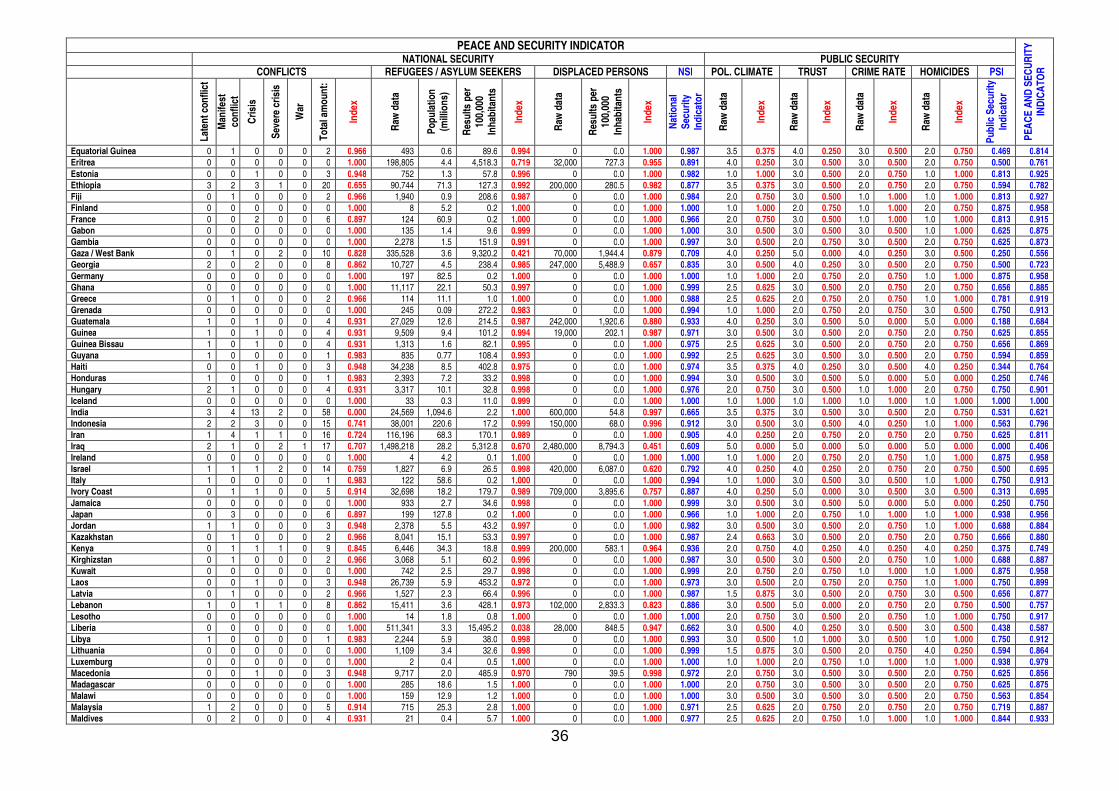
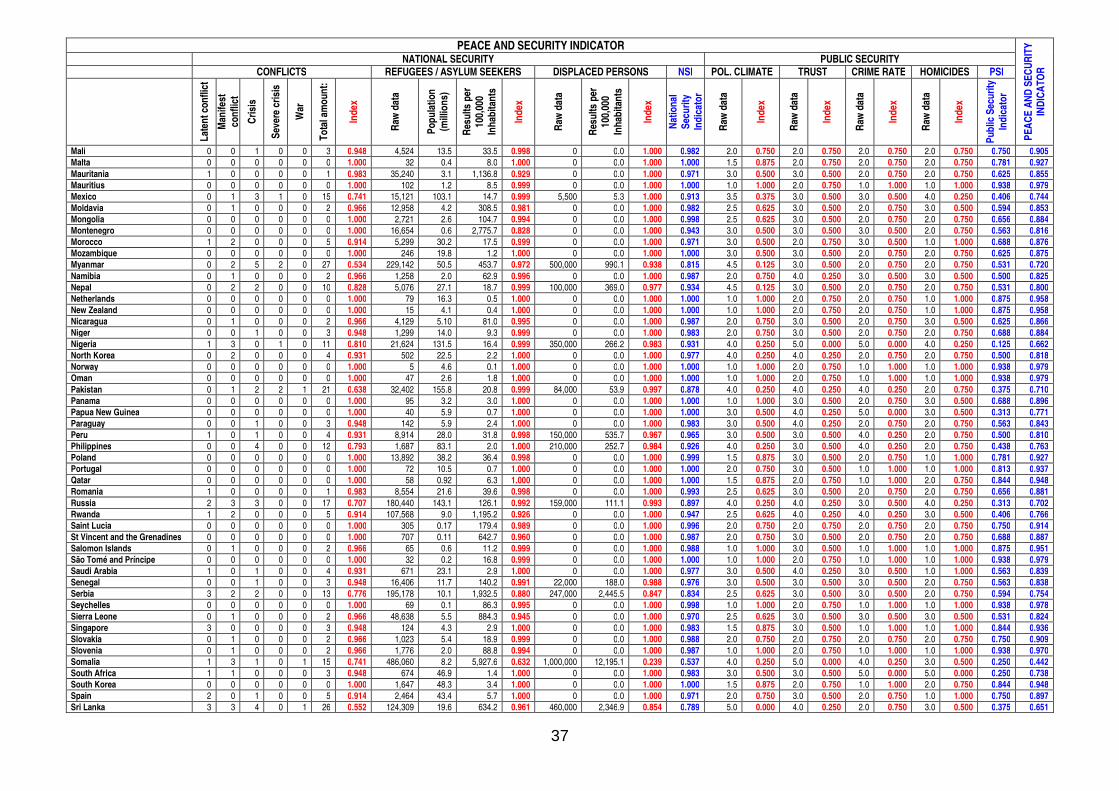
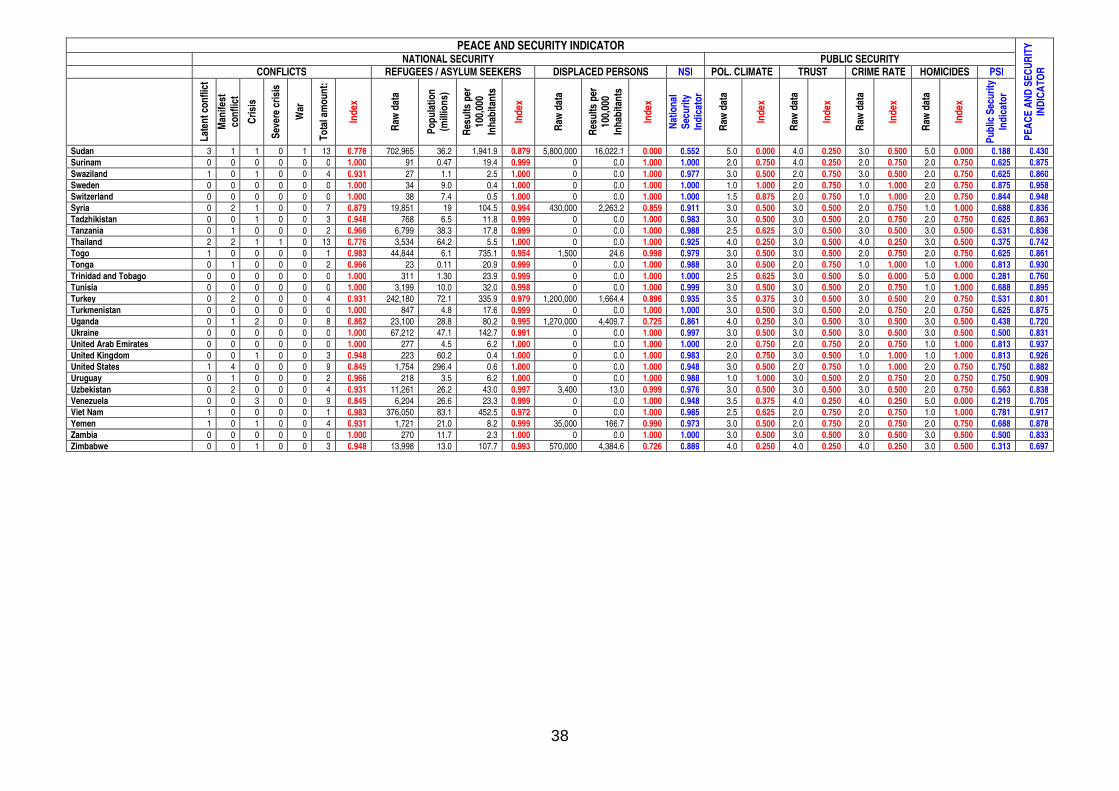
The Peace and Security indicator is therefore to be broken down into two sub-indicators: the National Security sub-indicator and the Public Security sub-indicator. Each of these sub-indicators is further broken down into several indexes, as summarized in the table below.
Indicator Sub-indicator Index
Peace and Security Indicator
National Security Conflicts Refugees and Asylum Seekers Displaced Persons
Public Security
Political Climate Degree of Trust among Citizens Violent Crime Homicides per 100,000 Inhabitants
With regard to the National Security sub-indicator, the three indexes surveyed seem to the main ones to use. Other indexes, such as that of the number of persons killed in the course of violent conflict or that of the number of deaths resulting from intentional and unilateral attacks against civil populations, could have also been selected, but the currently available data is not recent enough to allow for valid survey. The most recent data in this area (the UCDP Battle-Deaths Dataset, v.4.1,
25
2002-2005, the UCDP Non-State Conflict Dataset, v.1.1, 2002 - 2005 and the UCDP One-Sided Violence Dataset, v.1.2 1989 - 2005) dates back to 2005. This is why we shall limit our survey to the three above-mentioned indexes. Many other indexes could also be surveyed in the framework of the Public Security sub-indicator, in particular the one dealing with ease of access to handguns and light weapons, or that of the number of persons jailed per 100,000 inhabitants. On the one hand, the data currently available is not recent enough to be exploited usefully, and on the other hand, adding other indexes to those that have been selected does not seem to bring anything more to the survey.
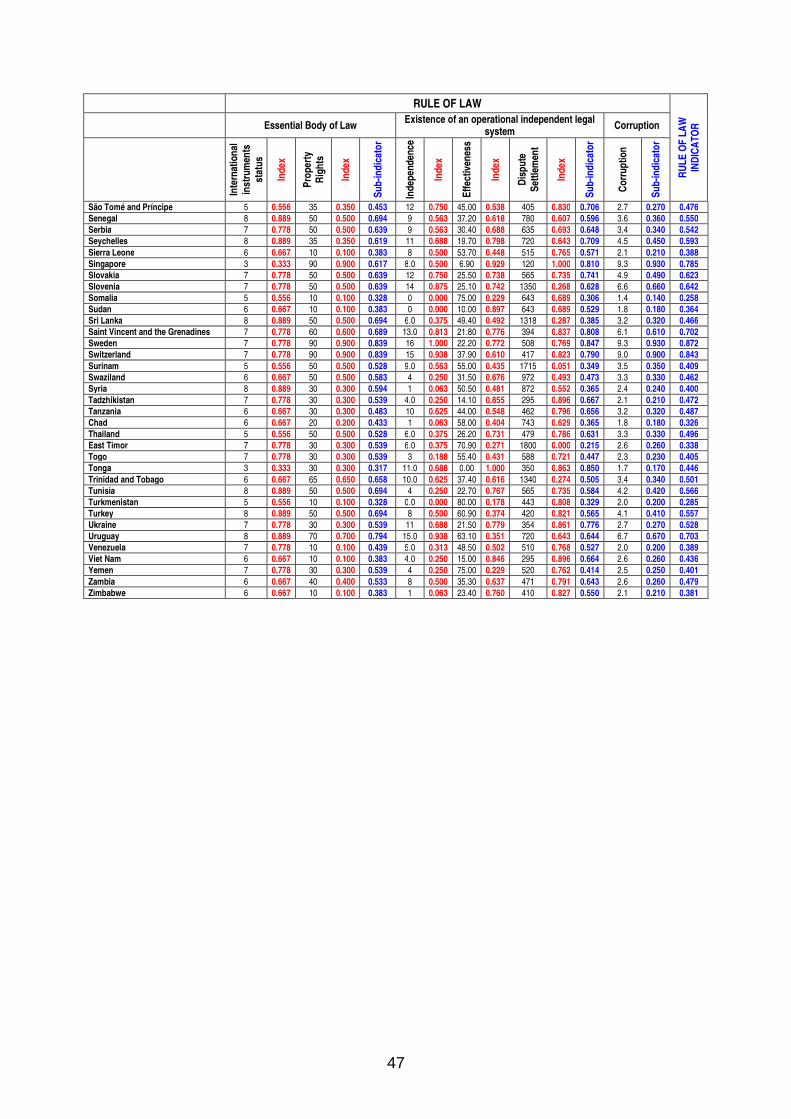
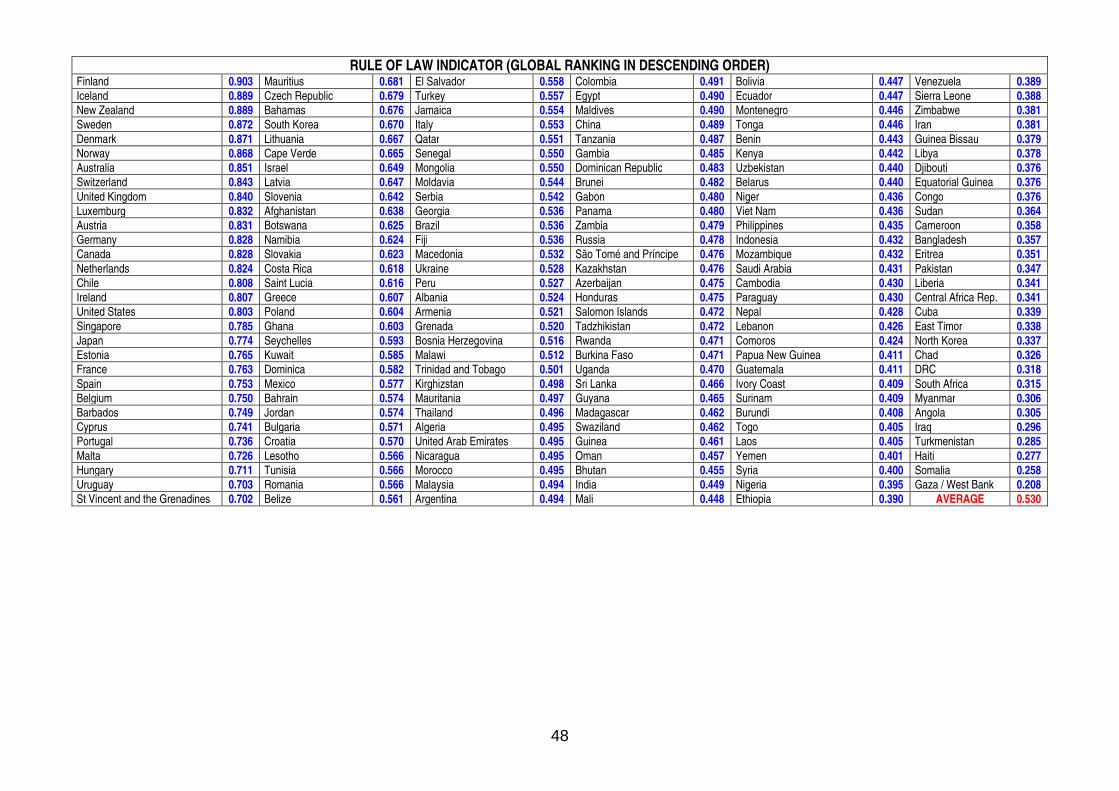
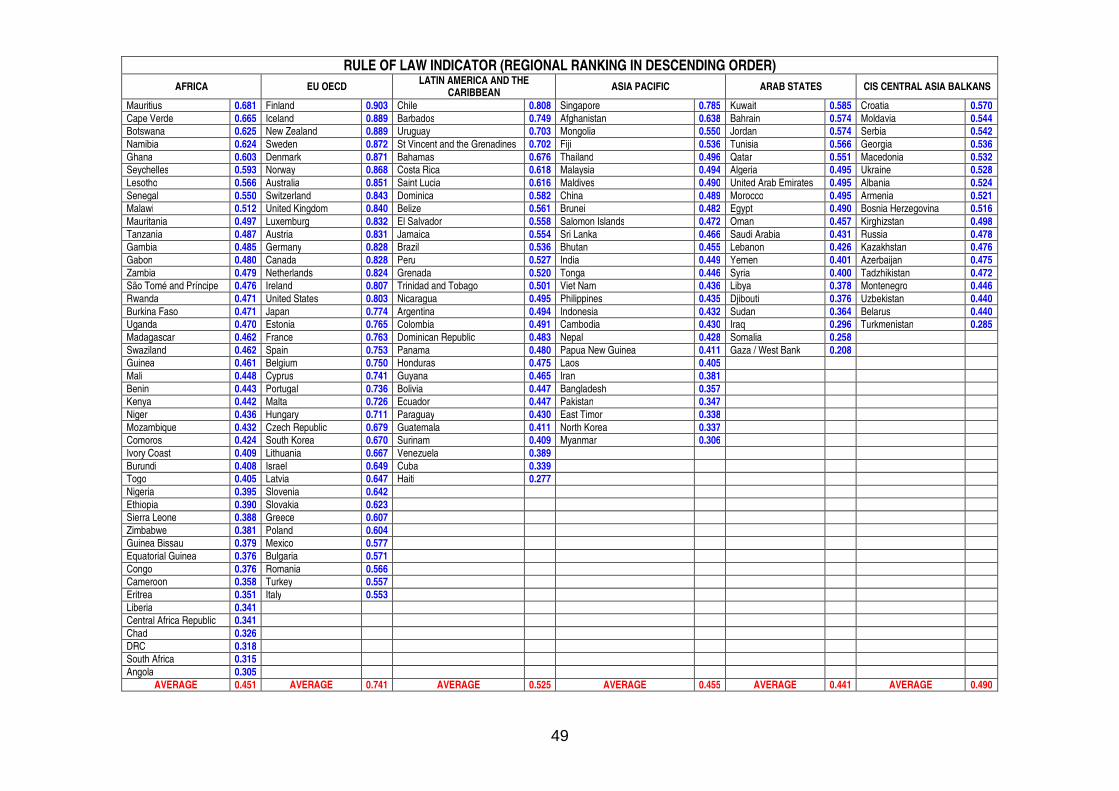
2. RULE OF LAW
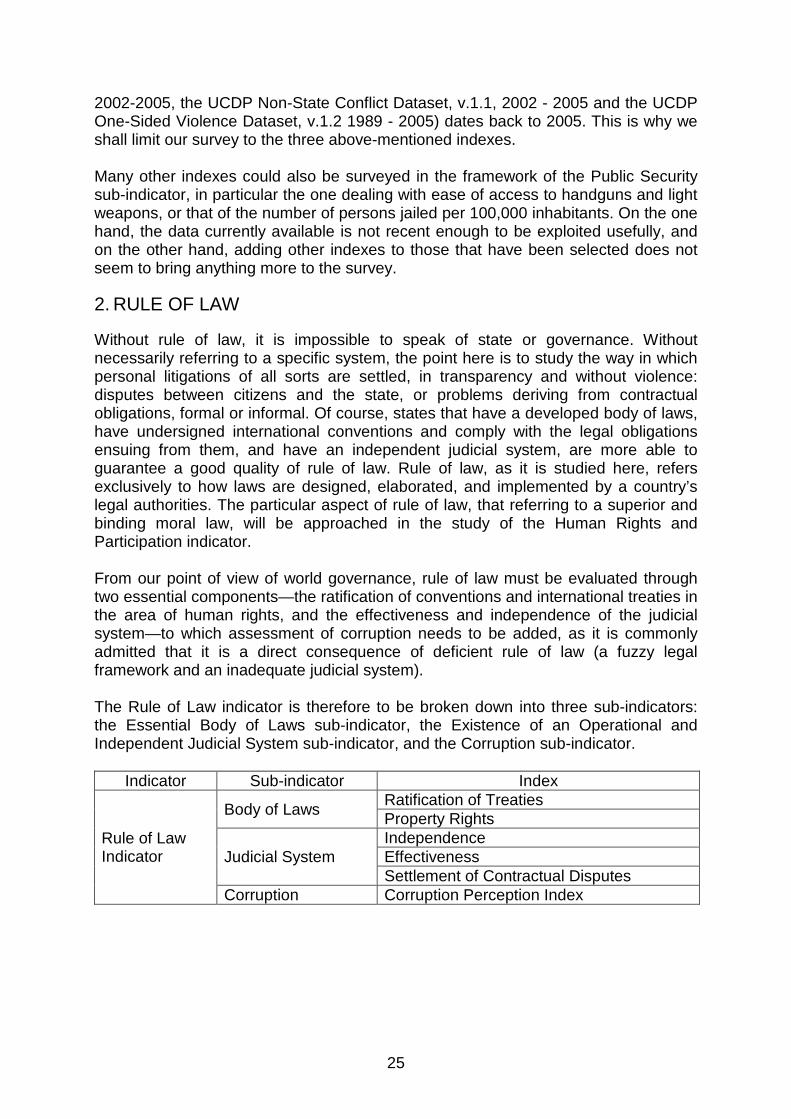
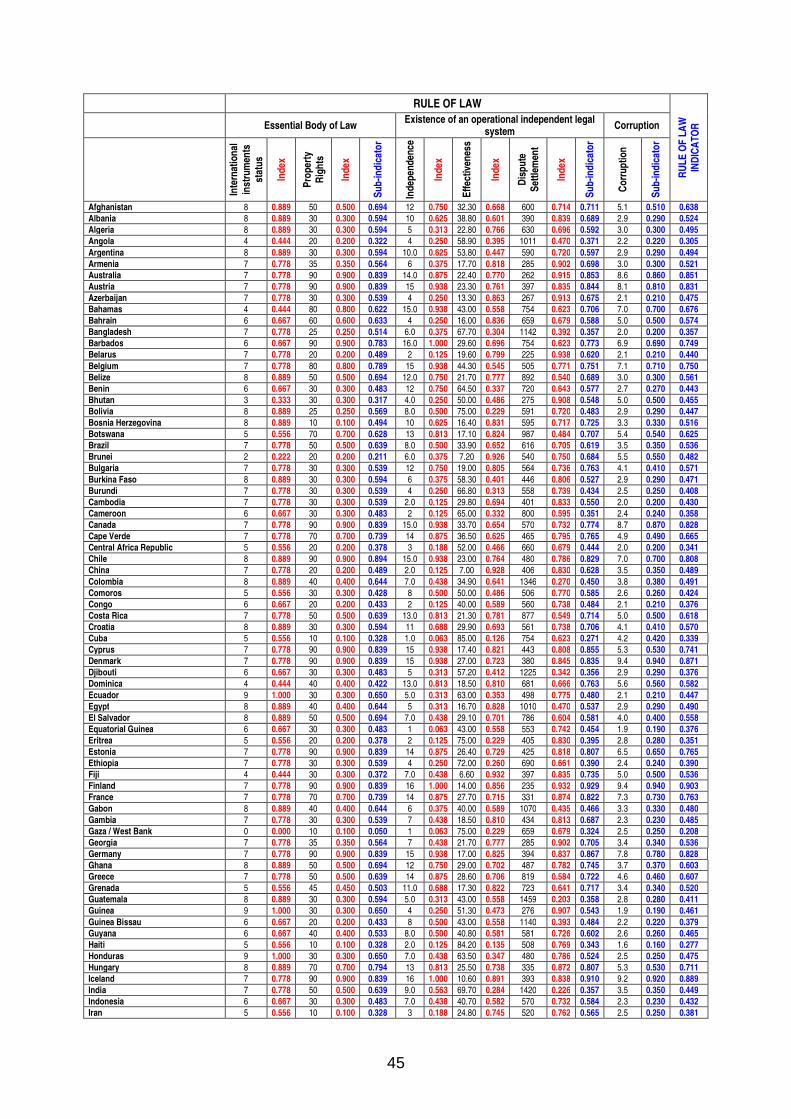
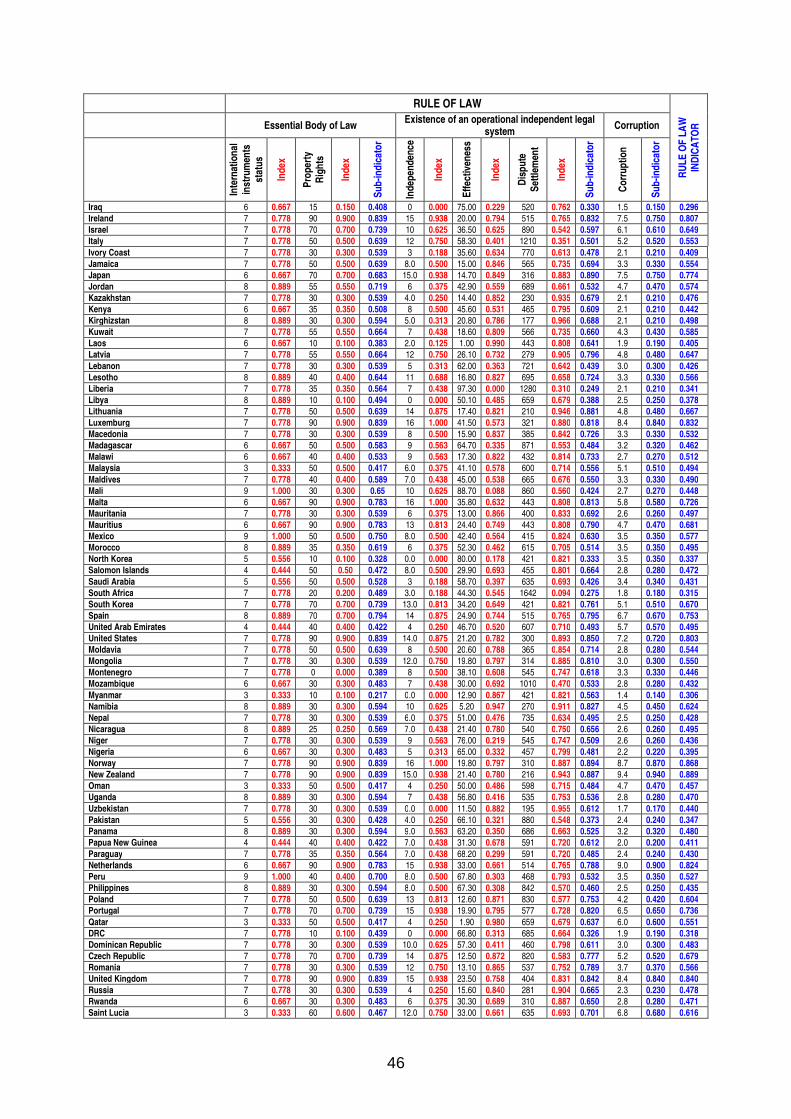
Without rule of law, it is impossible to speak of state or governance. Without necessarily referring to a specific system, the point here is to study the way in which personal litigations of all sorts are settled, in transparency and without violence: disputes between citizens and the state, or problems deriving from contractual obligations, formal or informal. Of course, states that have a developed body of laws, have undersigned international conventions and comply with the legal obligations ensuing from them, and have an independent judicial system, are more able to guarantee a good quality of rule of law. Rule of law, as it is studied here, refers exclusively to how laws are designed, elaborated, and implemented by a country’s legal authorities. The particular aspect of rule of law, that referring to a superior and binding moral law, will be approached in the study of the Human Rights and Participation indicator. From our point of view of world governance, rule of law must be evaluated through two essential components—the ratification of conventions and international treaties in the area of human rights, and the effectiveness and independence of the judicial system—to which assessment of corruption needs to be added, as it is commonly admitted that it is a direct consequence of deficient rule of law (a fuzzy legal framework and an inadequate judicial system). The Rule of Law indicator is therefore to be broken down into three sub-indicators: the Essential Body of Laws sub-indicator, the Existence of an Operational and Independent Judicial System sub-indicator, and the Corruption sub-indicator.
Indicator Sub-indicator Index
Rule of Law Indicator
Body of Laws Ratification of Treaties Property Rights
Judicial System Independence Effectiveness Settlement of Contractual Disputes
Corruption Corruption Perception Index
26
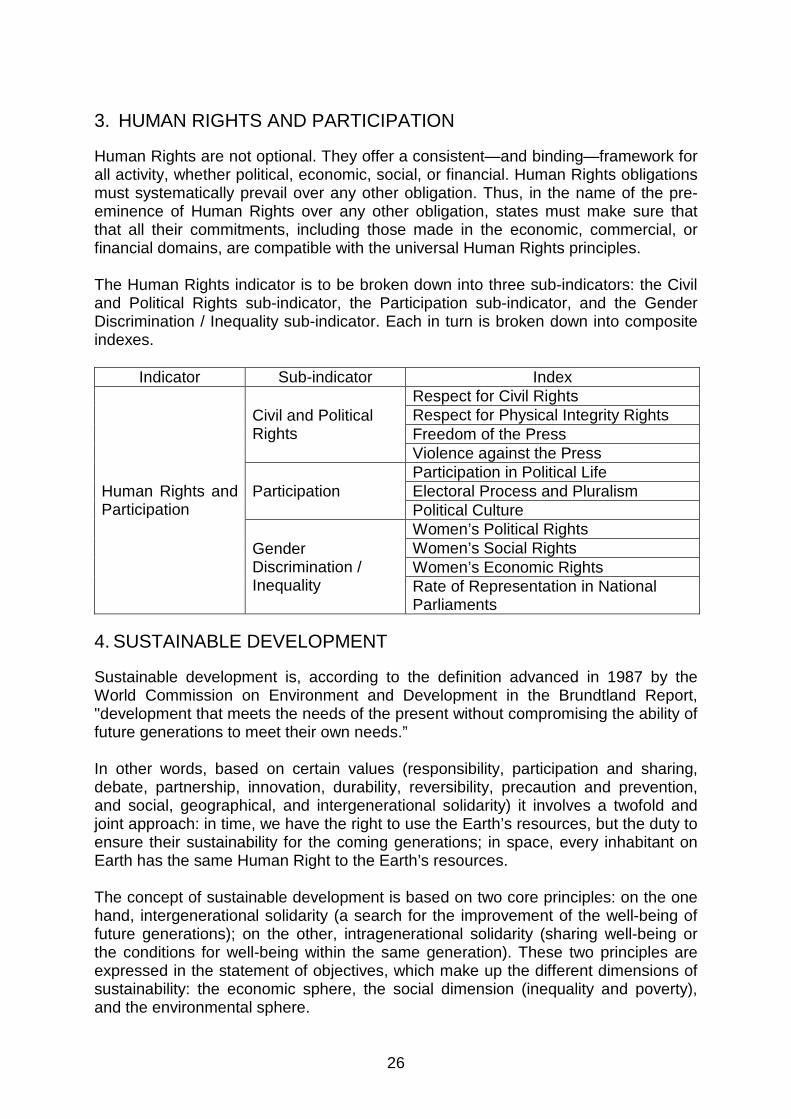
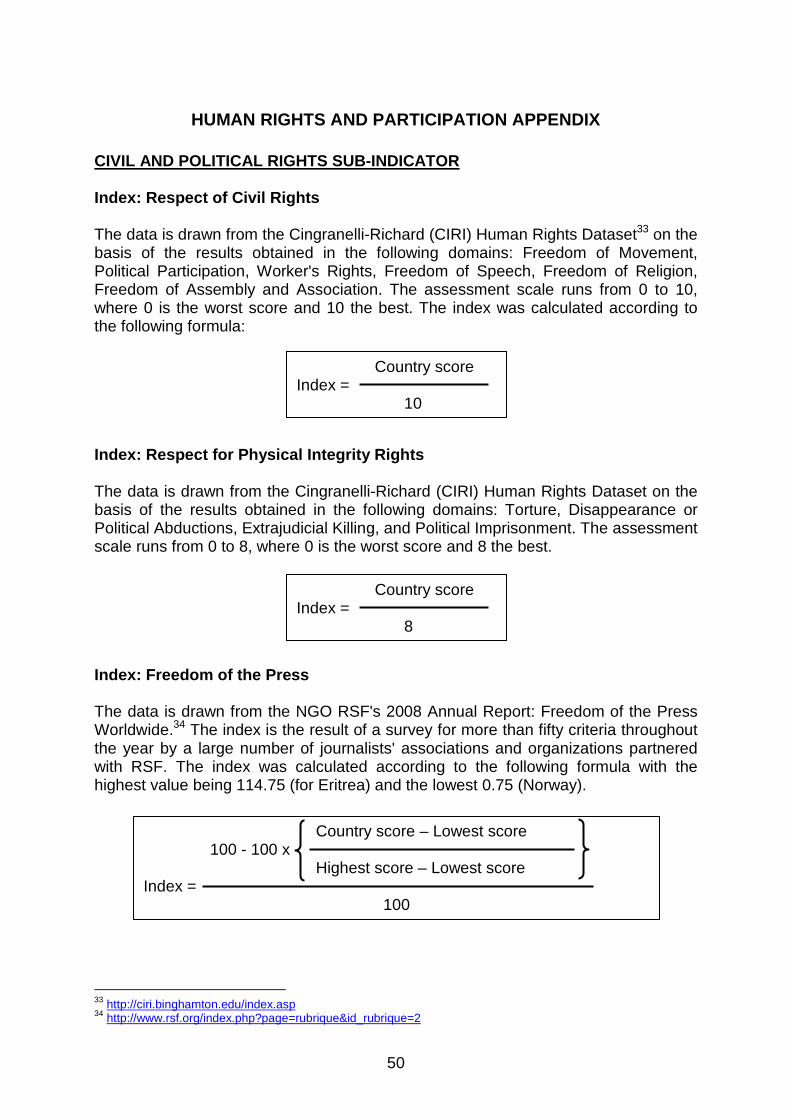
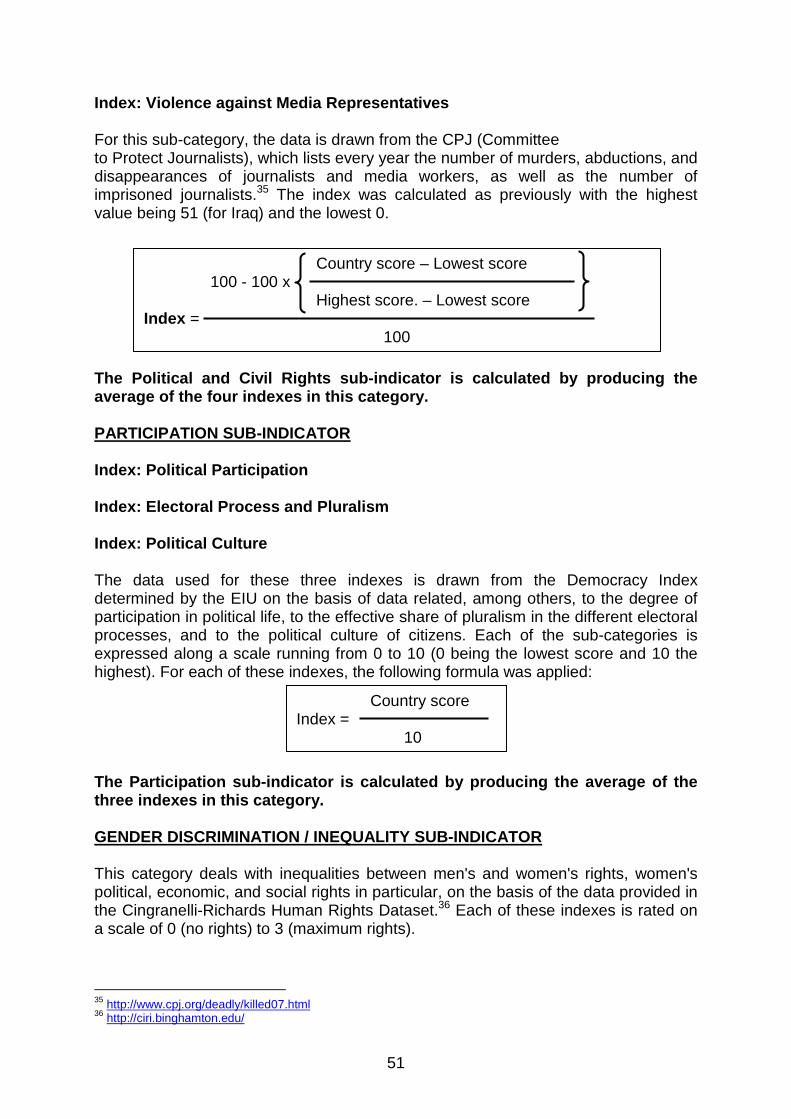
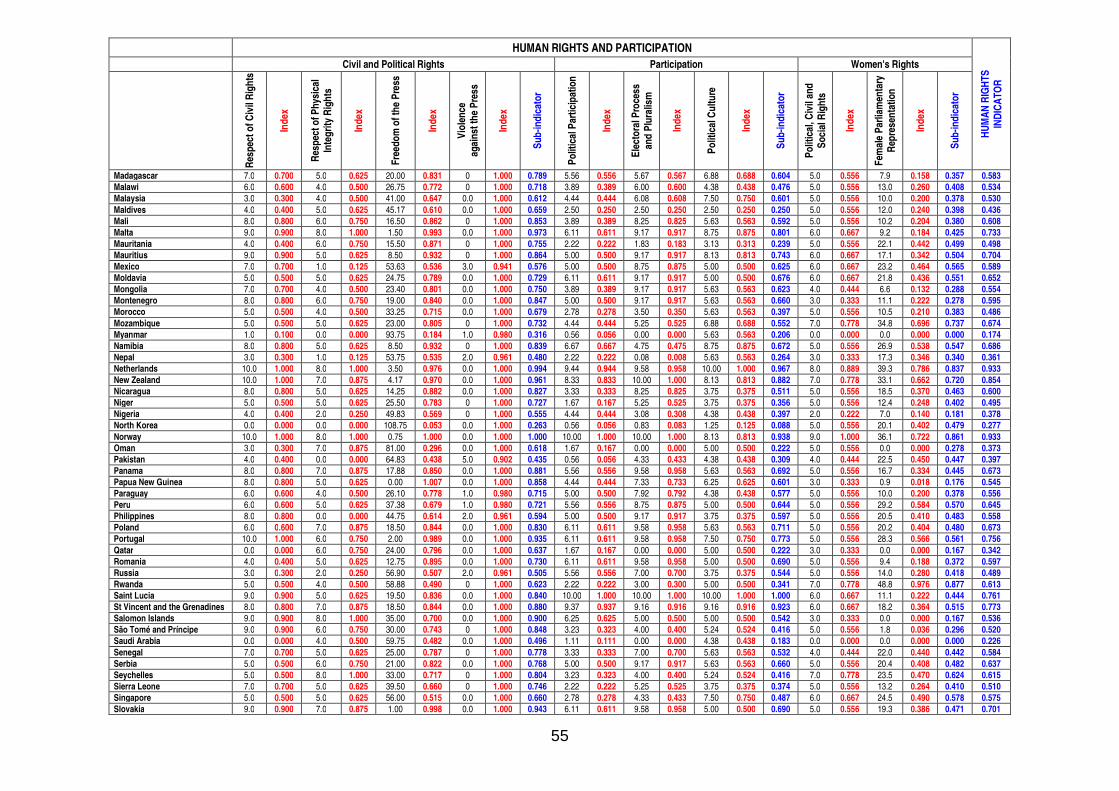
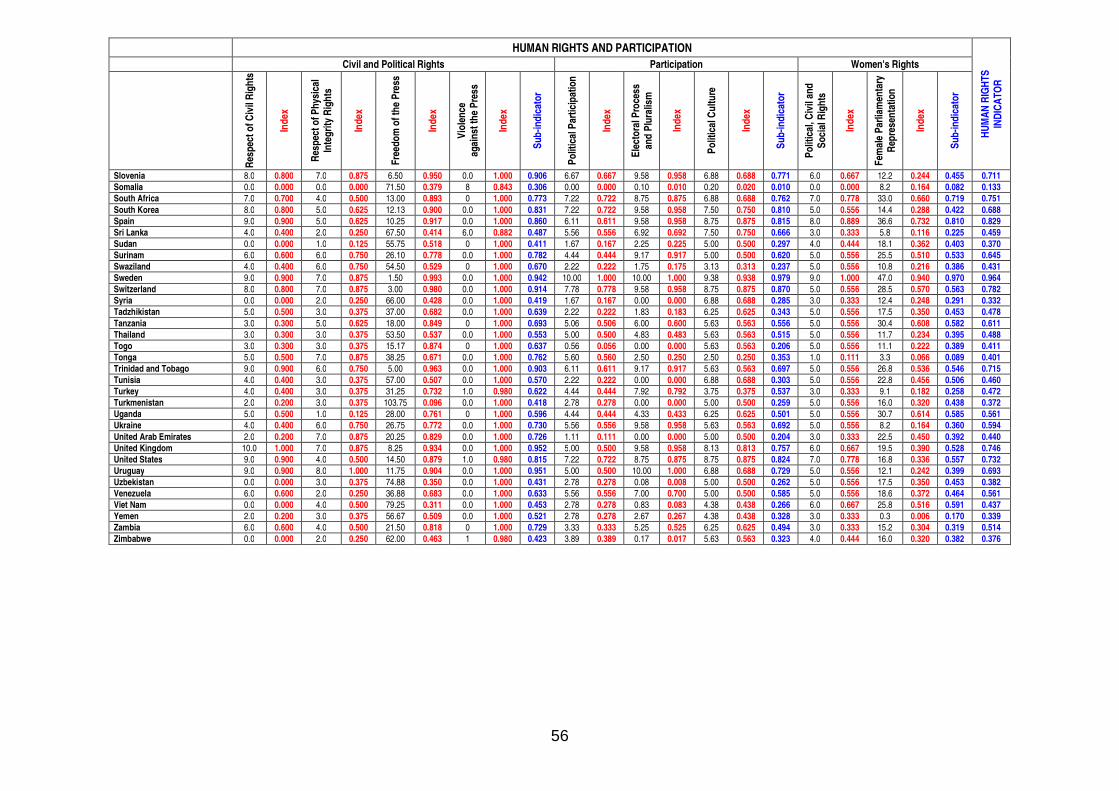
3. HUMAN RIGHTS AND PARTICIPATION
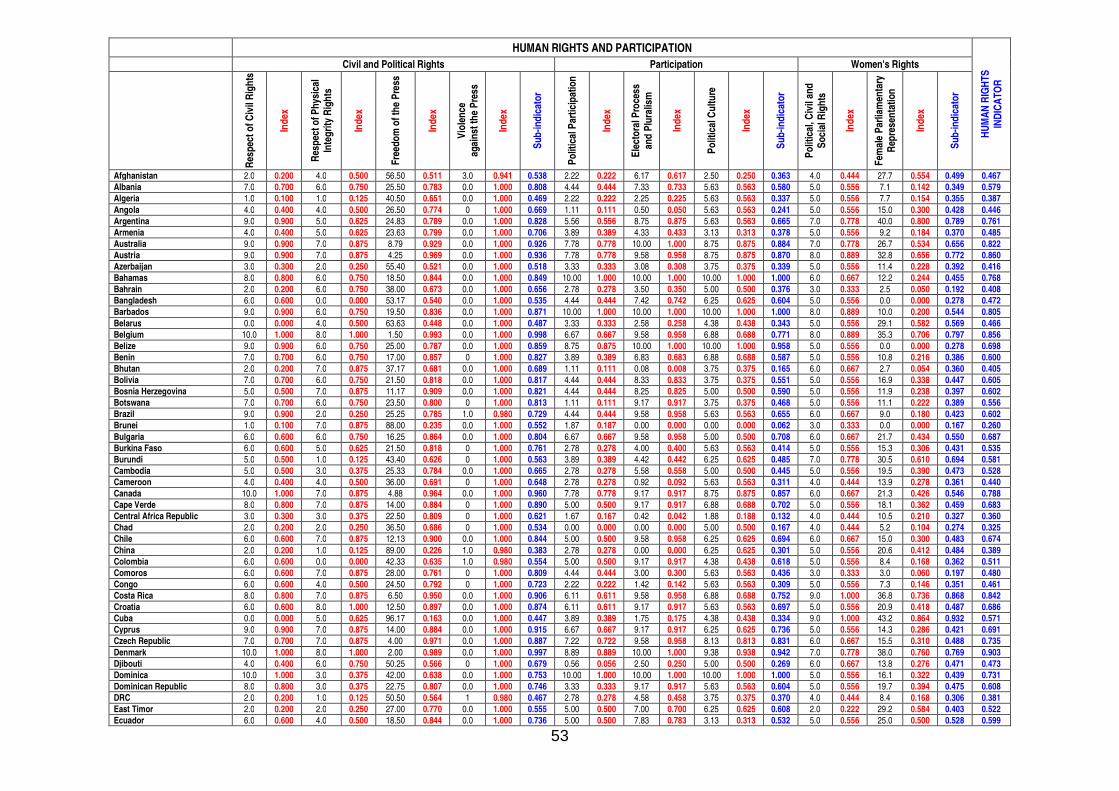
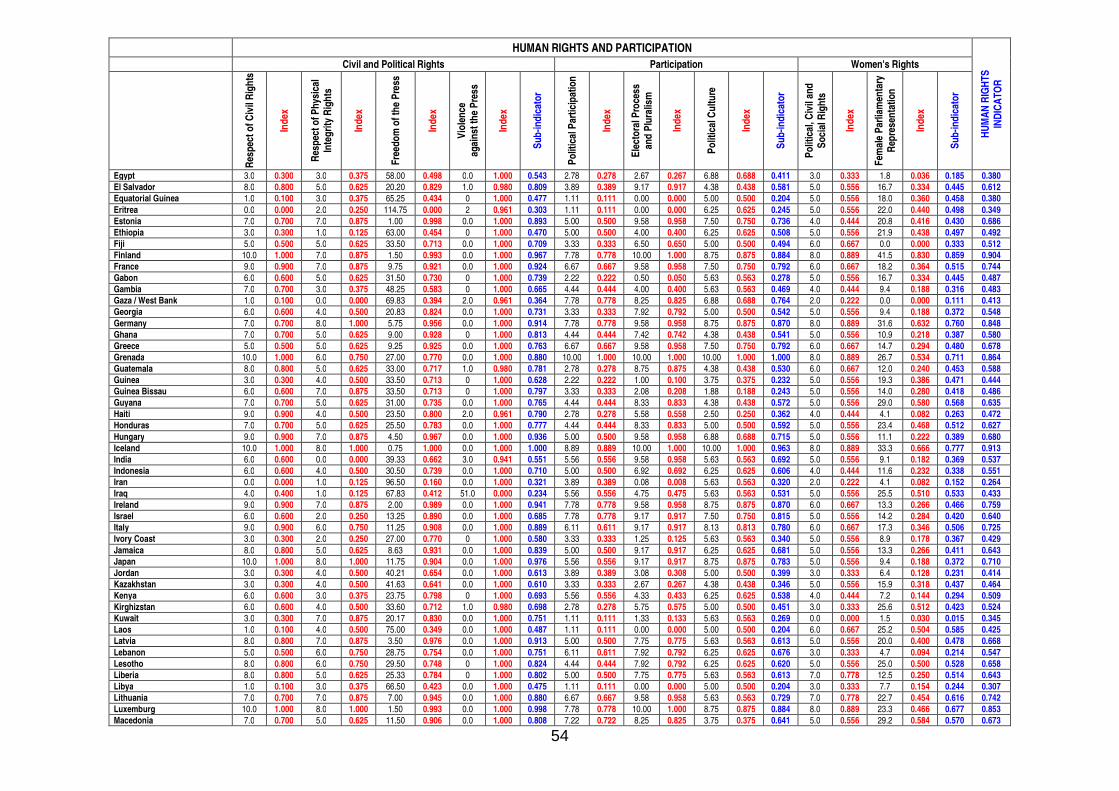
Human Rights are not optional. They offer a consistent—and binding—framework for all activity, whether political, economic, social, or financial. Human Rights obligations must systematically prevail over any other obligation. Thus, in the name of the pre-eminence of Human Rights over any other obligation, states must make sure that that all their commitments, including those made in the economic, commercial, or financial domains, are compatible with the universal Human Rights principles. The Human Rights indicator is to be broken down into three sub-indicators: the Civil and Political Rights sub-indicator, the Participation sub-indicator, and the Gender Discrimination / Inequality sub-indicator. Each in turn is broken down into composite indexes.
Indicator Sub-indicator Index
Human Rights and Participation
Civil and Political Rights
Respect for Civil Rights Respect for Physical Integrity Rights Freedom of the Press Violence against the Press
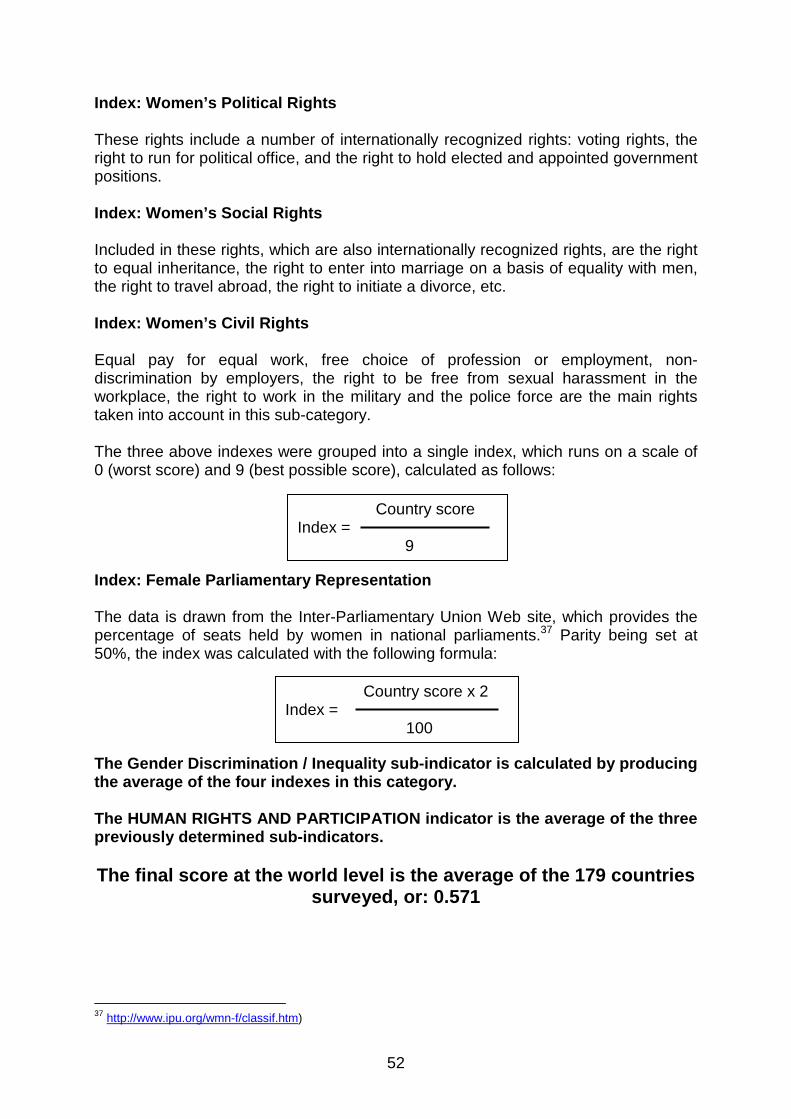
Participation Participation in Political Life Electoral Process and Pluralism Political Culture
Gender Discrimination / Inequality
Women’s Political Rights Women’s Social Rights Women’s Economic Rights Rate of Representation in National Parliaments
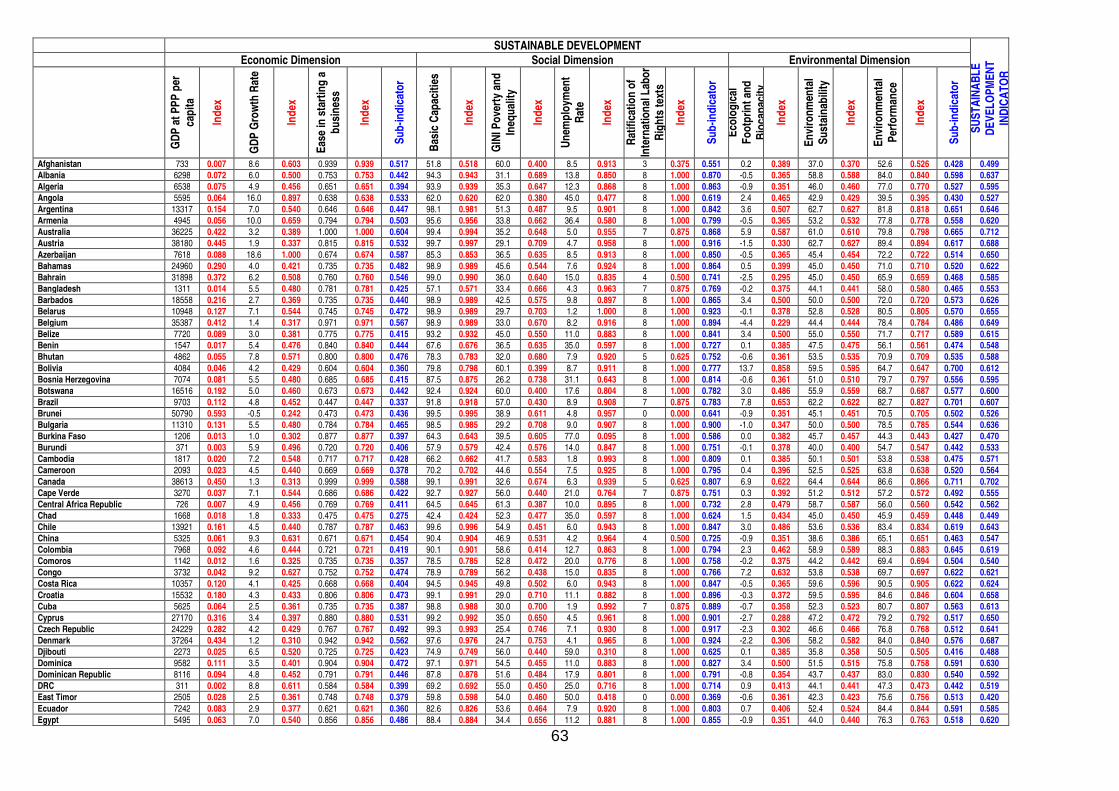
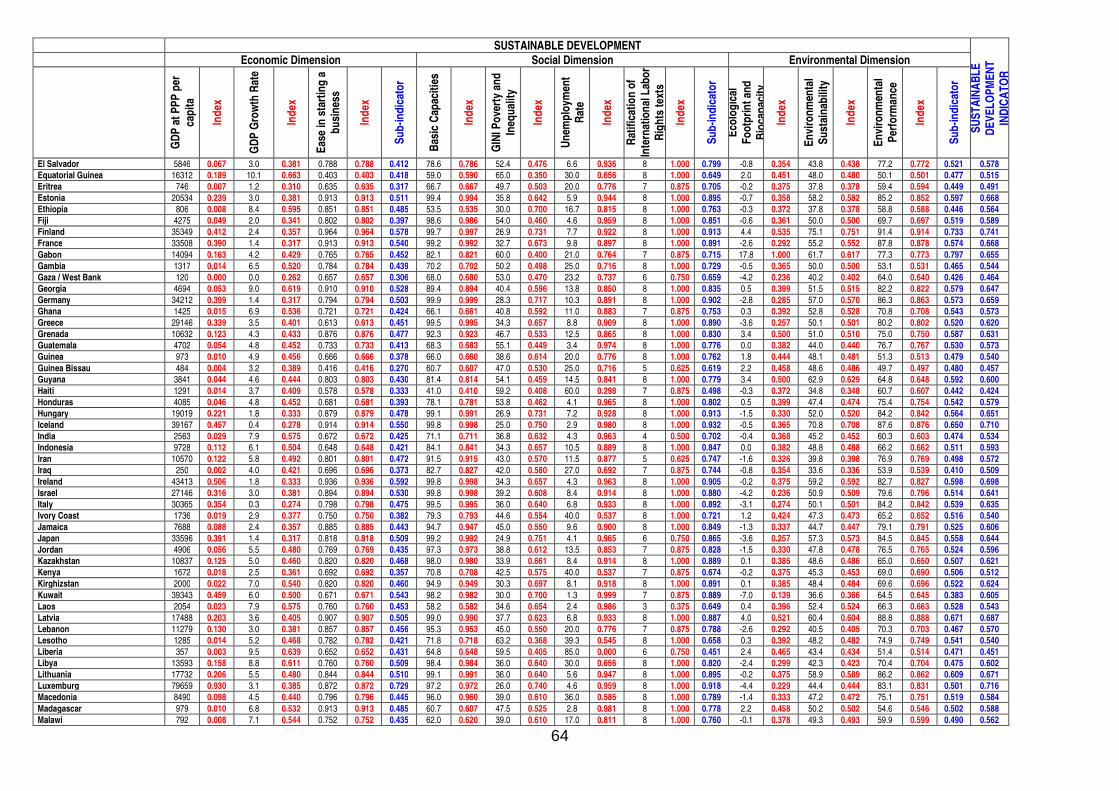
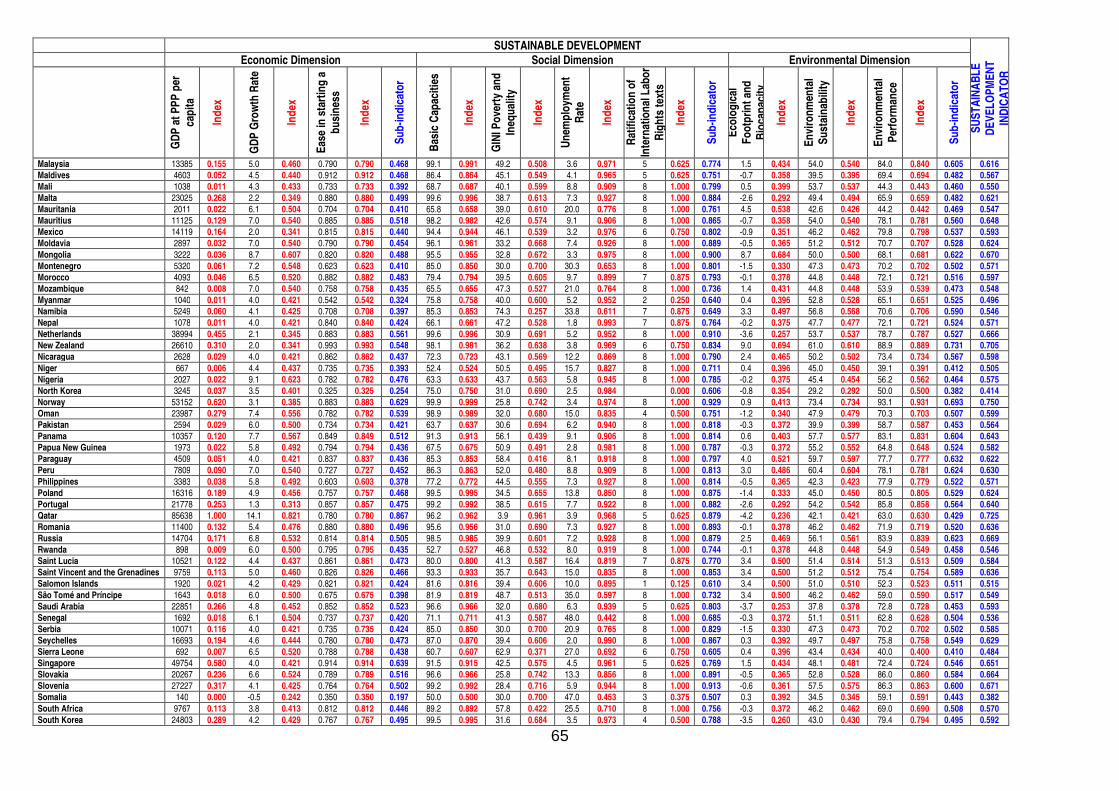
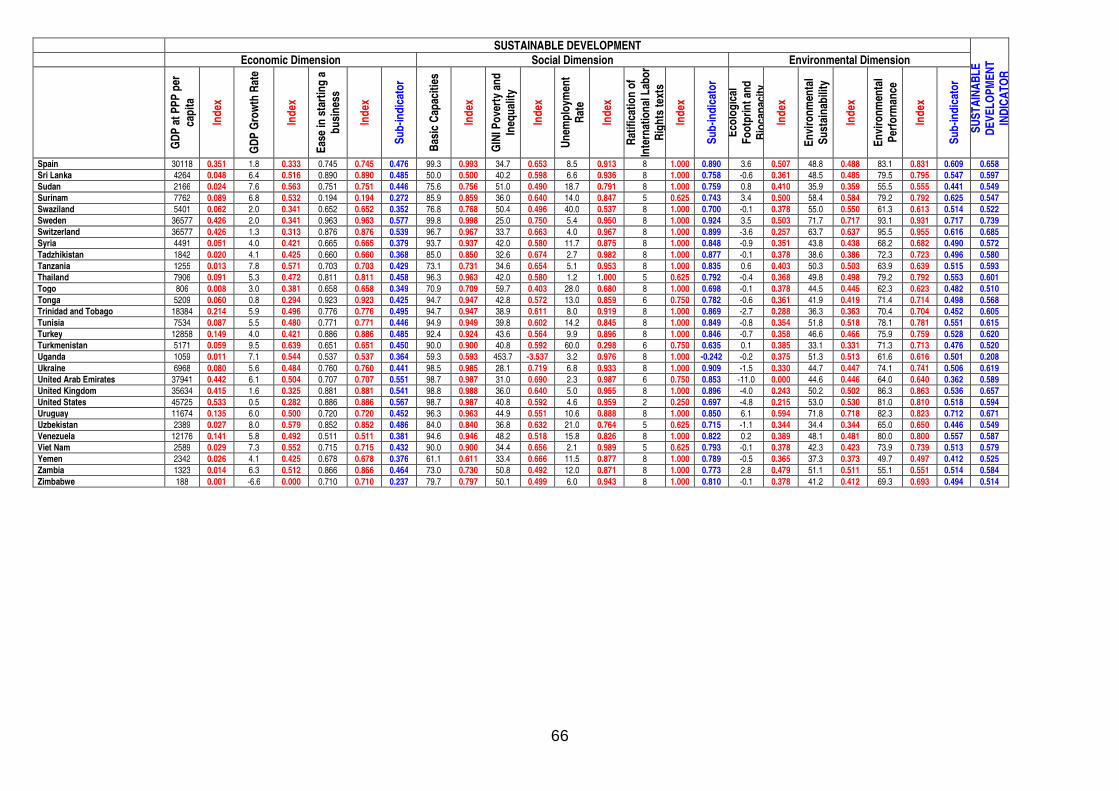
4. SUSTAINABLE DEVELOPMENT
Sustainable development is, according to the definition advanced in 1987 by the World Commission on Environment and Development in the Brundtland Report, "development that meets the needs of the present without compromising the ability of future generations to meet their own needs.” In other words, based on certain values (responsibility, participation and sharing, debate, partnership, innovation, durability, reversibility, precaution and prevention, and social, geographical, and intergenerational solidarity) it involves a twofold and joint approach: in time, we have the right to use the Earth’s resources, but the duty to ensure their sustainability for the coming generations; in space, every inhabitant on Earth has the same Human Right to the Earth’s resources. The concept of sustainable development is based on two core principles: on the one hand, intergenerational solidarity (a search for the improvement of the well-being of future generations); on the other, intragenerational solidarity (sharing well-being or the conditions for well-being within the same generation). These two principles are expressed in the statement of objectives, which make up the different dimensions of sustainability: the economic sphere, the social dimension (inequality and poverty), and the environmental sphere.
27
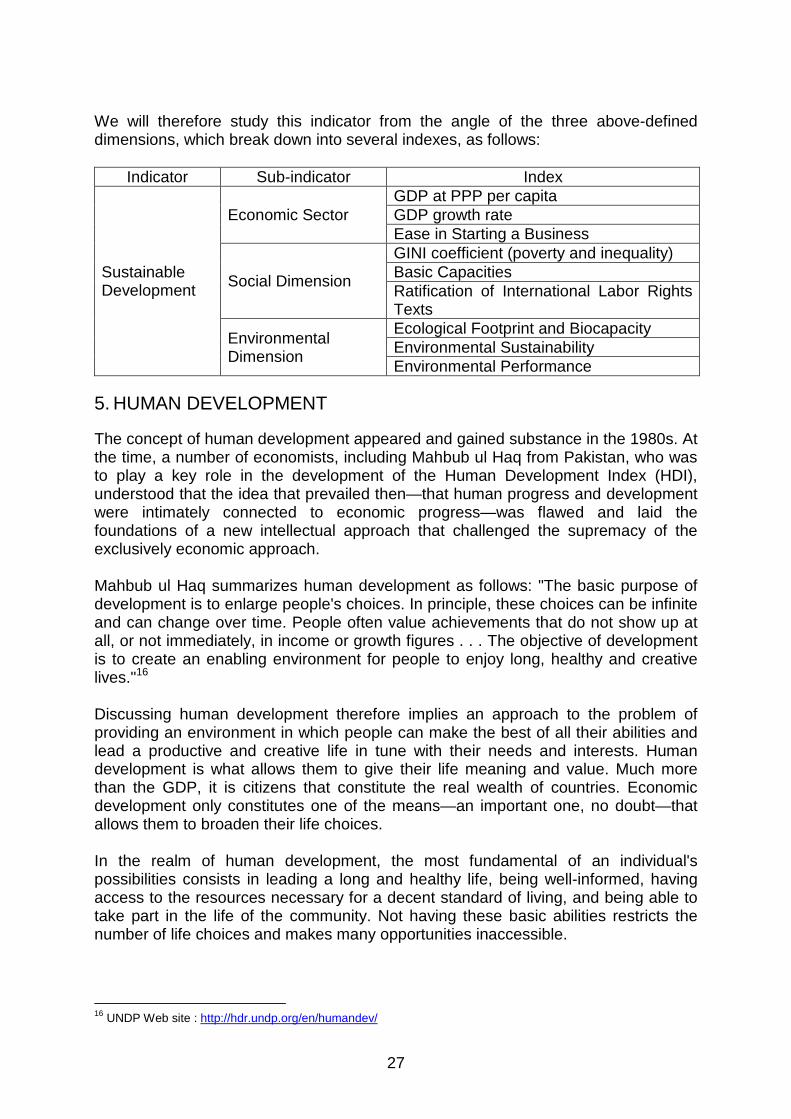
We will therefore study this indicator from the angle of the three above-defined dimensions, which break down into several indexes, as follows:
Indicator Sub-indicator Index
Sustainable Development
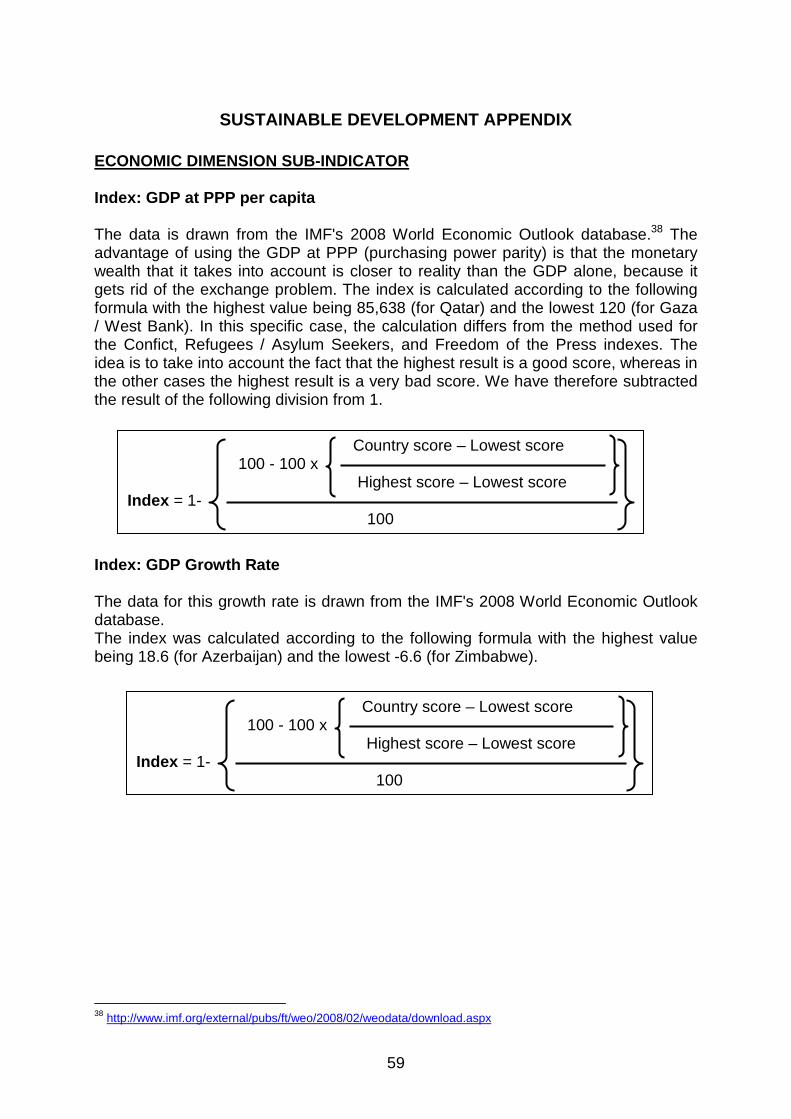
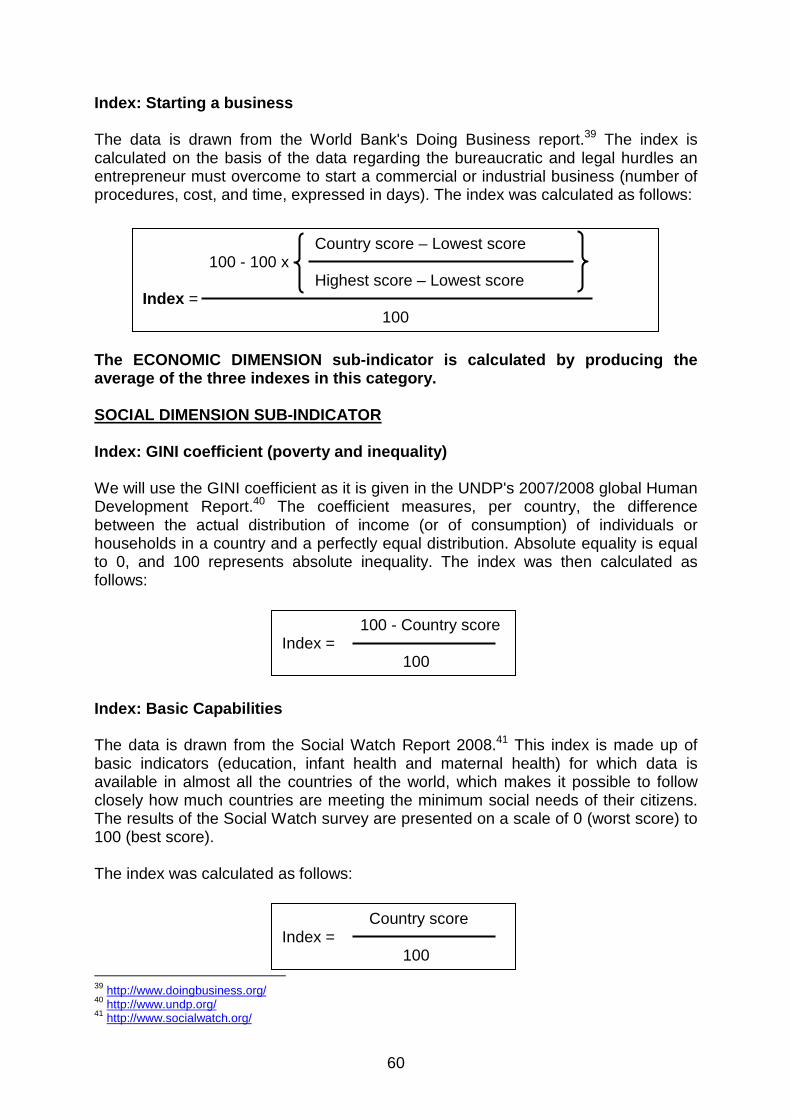
Economic Sector GDP at PPP per capita GDP growth rate Ease in Starting a Business
Social Dimension
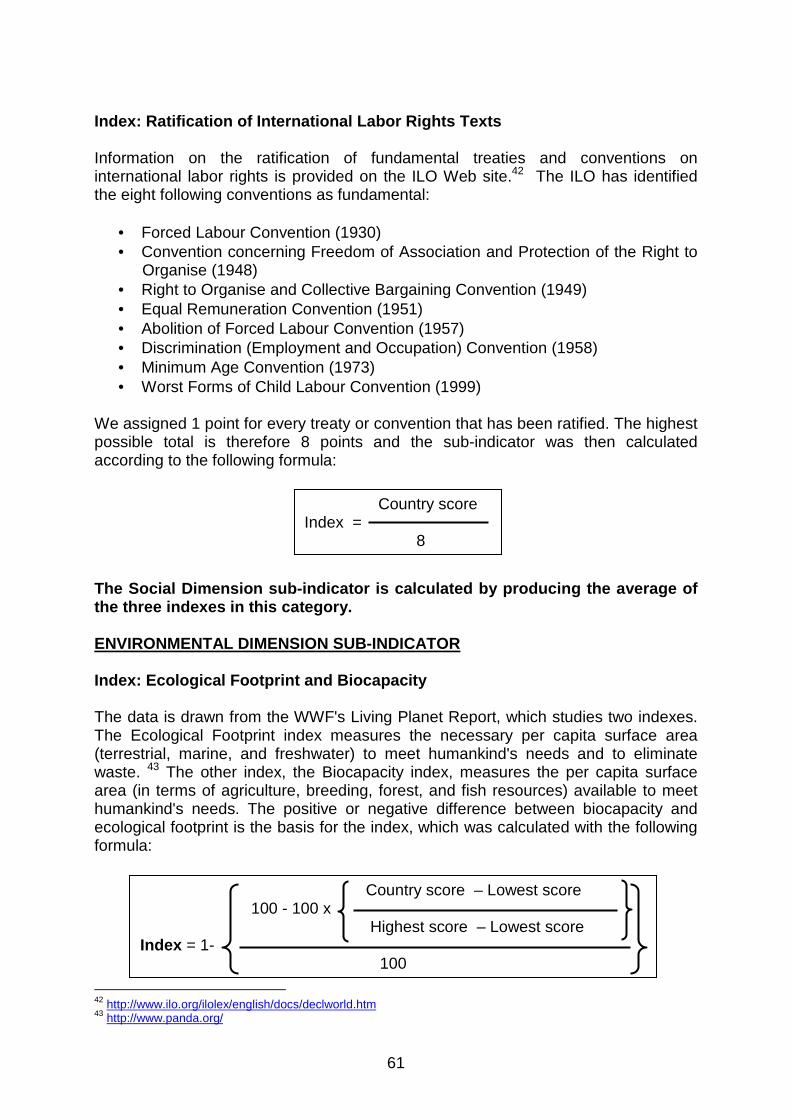
GINI coefficient (poverty and inequality) Basic Capacities Ratification of International Labor Rights Texts
Environmental Dimension
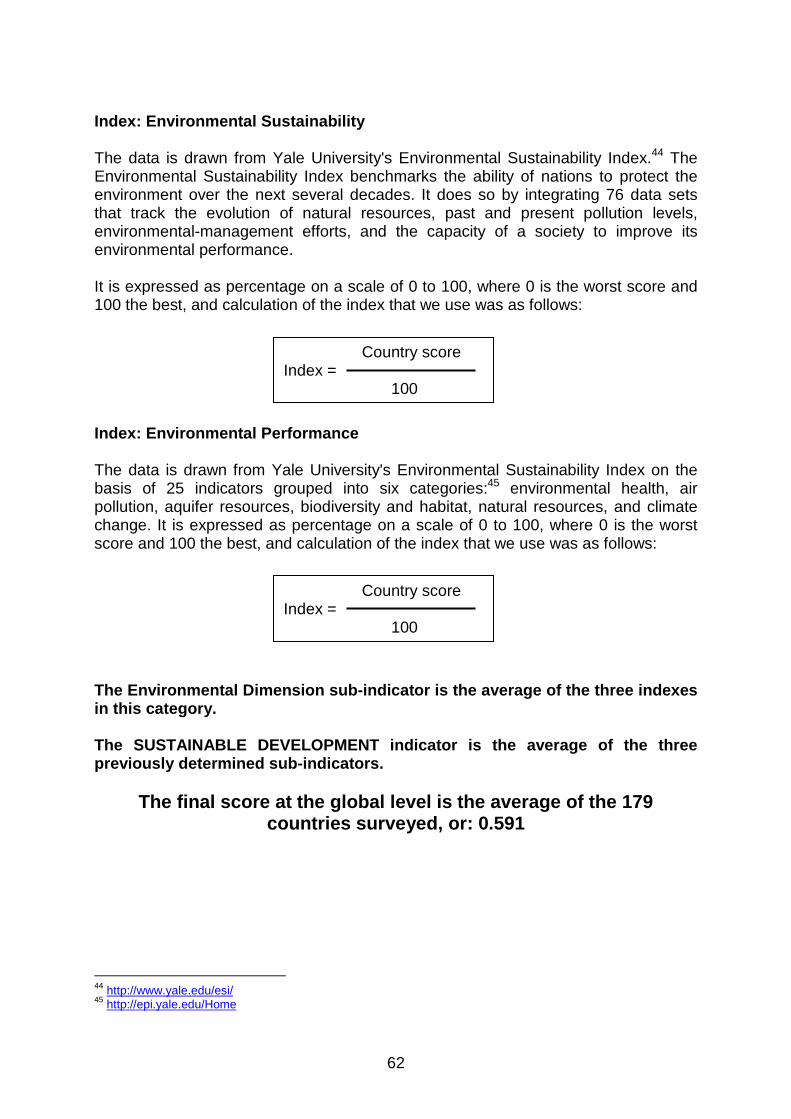
Ecological Footprint and Biocapacity Environmental Sustainability Environmental Performance
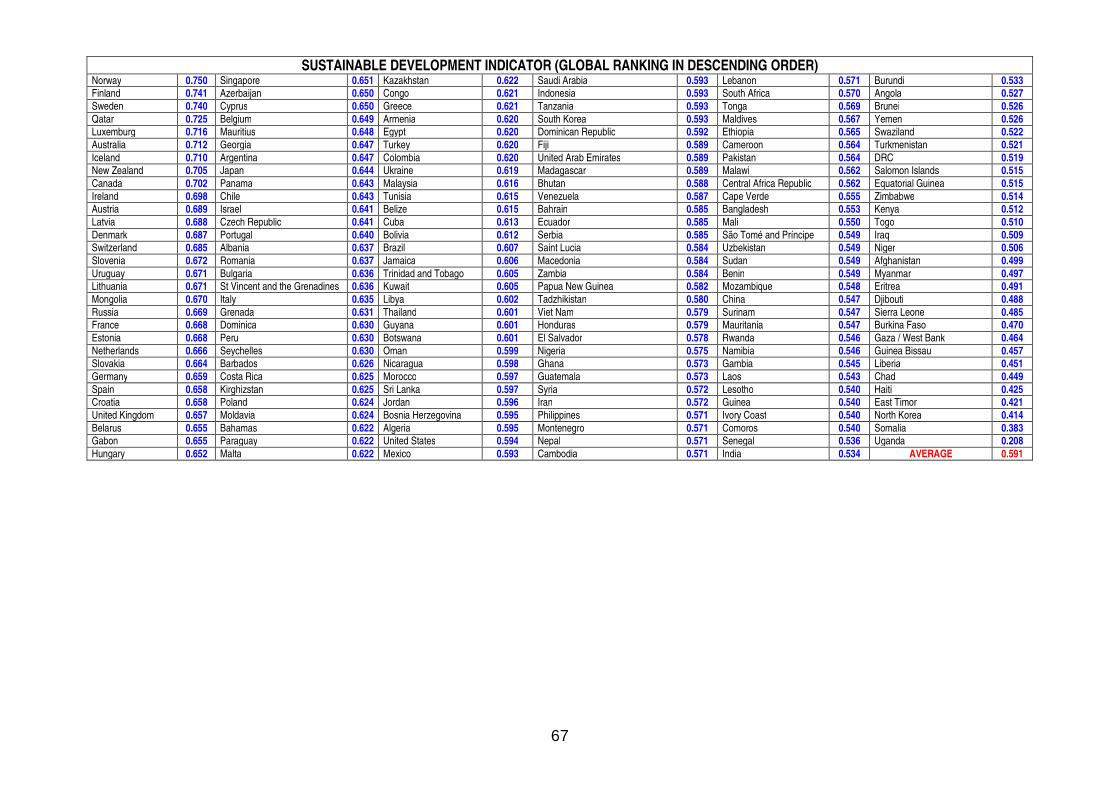
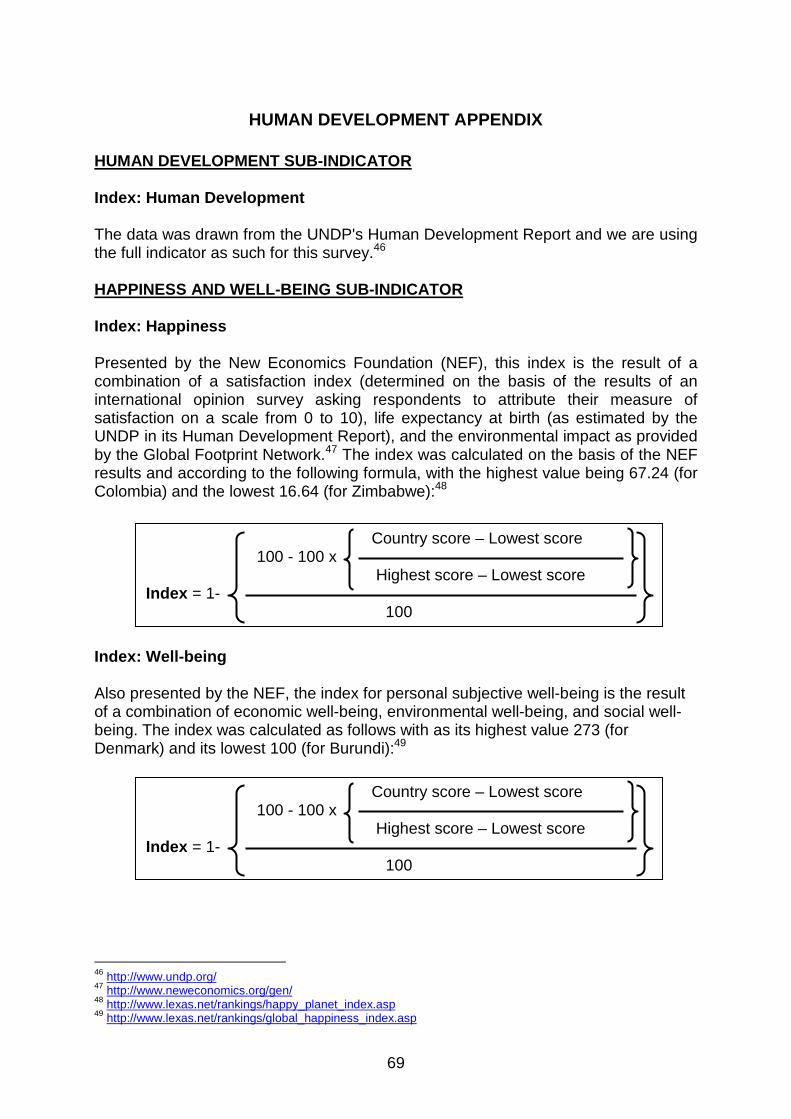
5. HUMAN DEVELOPMENT
The concept of human development appeared and gained substance in the 1980s. At the time, a number of economists, including Mahbub ul Haq from Pakistan, who was to play a key role in the development of the Human Development Index (HDI), understood that the idea that prevailed then—that human progress and development were intimately connected to economic progress—was flawed and laid the foundations of a new intellectual approach that challenged the supremacy of the exclusively economic approach. Mahbub ul Haq summarizes human development as follows: "The basic purpose of development is to enlarge people's choices. In principle, these choices can be infinite and can change over time. People often value achievements that do not show up at all, or not immediately, in income or growth figures . . . The objective of development is to create an enabling environment for people to enjoy long, healthy and creative lives."16 Discussing human development therefore implies an approach to the problem of providing an environment in which people can make the best of all their abilities and lead a productive and creative life in tune with their needs and interests. Human development is what allows them to give their life meaning and value. Much more than the GDP, it is citizens that constitute the real wealth of countries. Economic development only constitutes one of the means—an important one, no doubt—that allows them to broaden their life choices. In the realm of human development, the most fundamental of an individual's possibilities consists in leading a long and healthy life, being well-informed, having access to the resources necessary for a decent standard of living, and being able to take part in the life of the community. Not having these basic abilities restricts the number of life choices and makes many opportunities inaccessible.
16 UNDP Web site : http://hdr.undp.org/en/humandev/
28
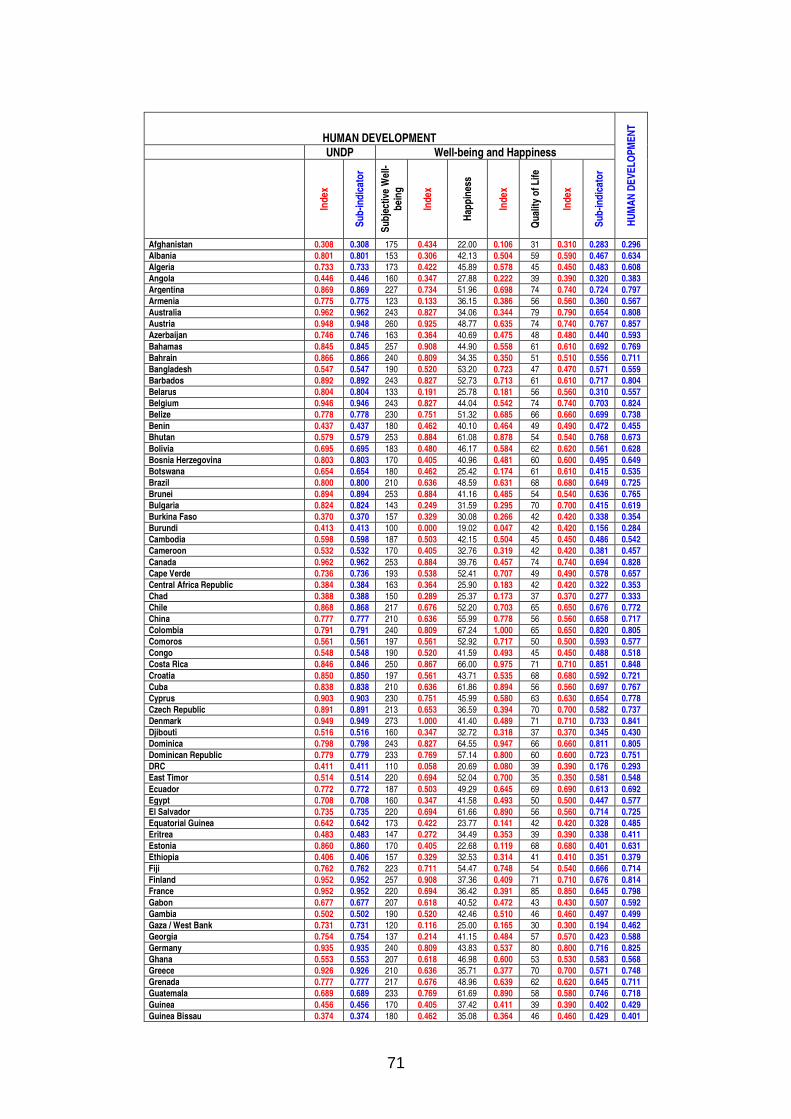
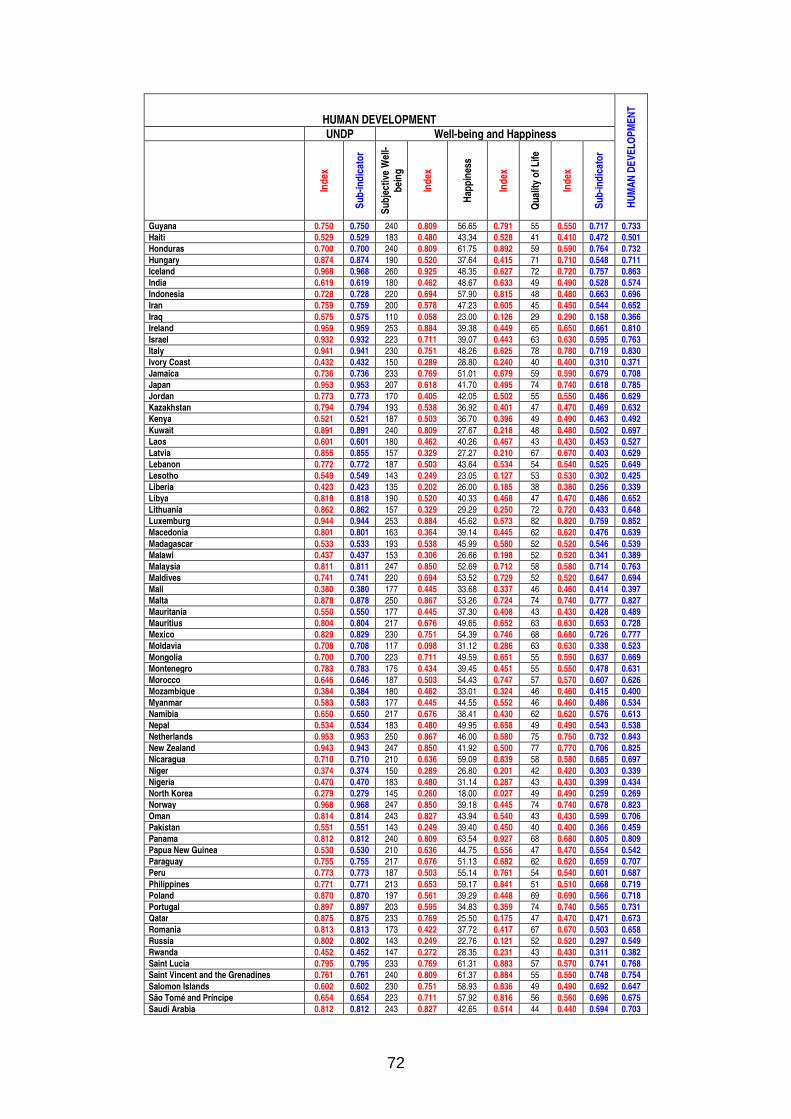
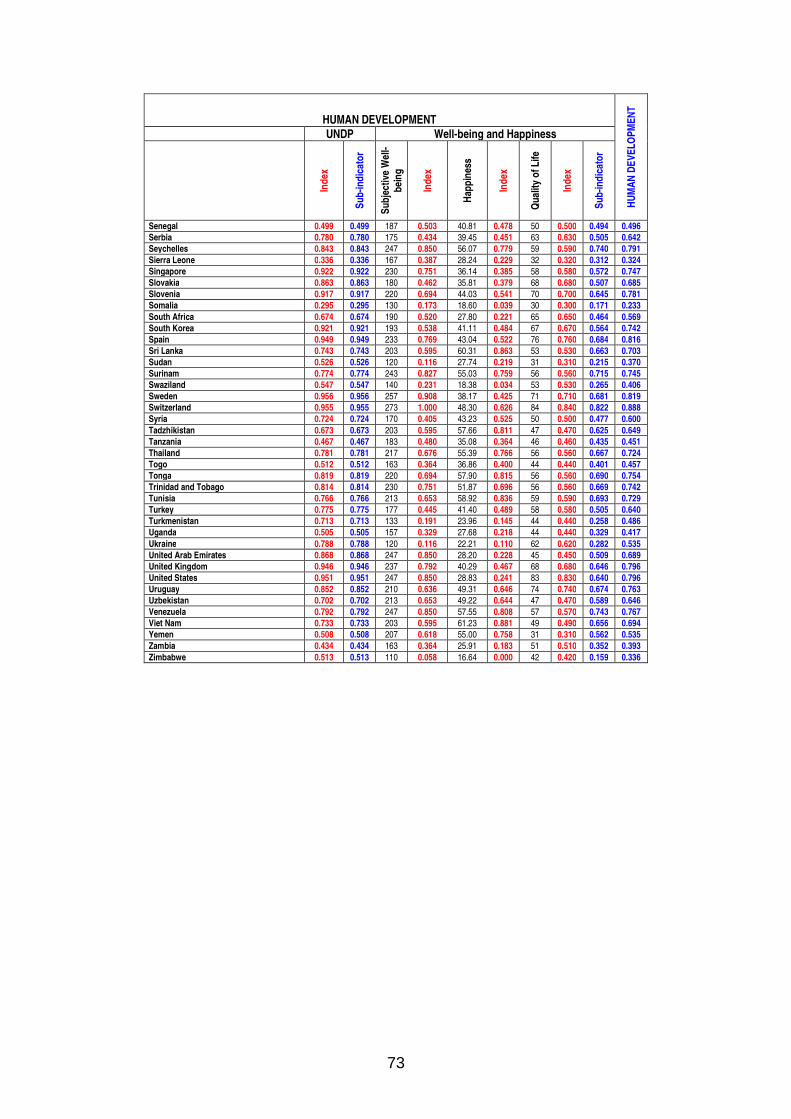
This way of considering development is not new. It has simply been concealed by the immediate concern of accumulating all sorts of material or financial wealth. As observed by Aristotle, wealth is obviously not the final end of our action on earth, although it does contribute to our happiness. By pursuing a goal other than material wealth, human development shares a common vision with the concept of Human Rights. The final end is human freedom. Peoples must be able to choose freely and to take part in the decision-making processes that affect their lives. Human Development and Human Rights reinforce one another in that they both contribute to the well-being of all and guarantee the dignity of peoples, in self-respect and in respect of others. We will study the Human Development indicator through the following sub-indicators and indexes:
Indicator Sub-indicator Index
Human Development
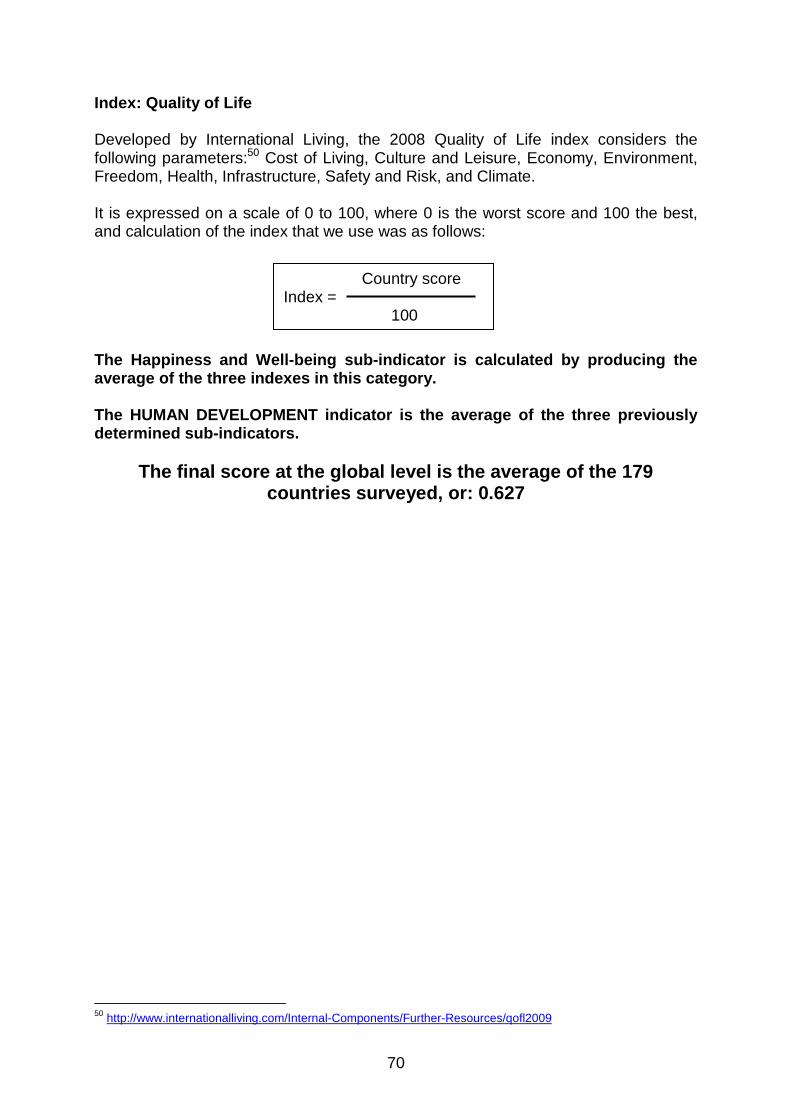
Development Human Development
Well-being and Happiness
Subjective Well-being Happiness Quality of life
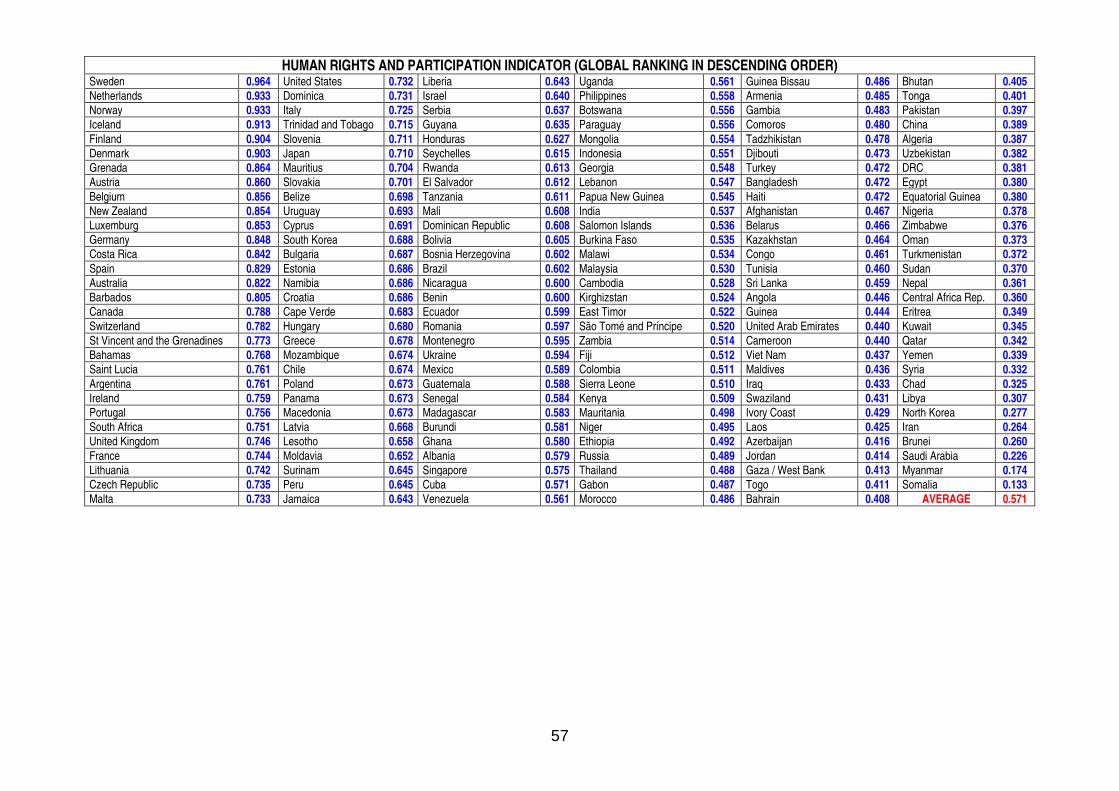
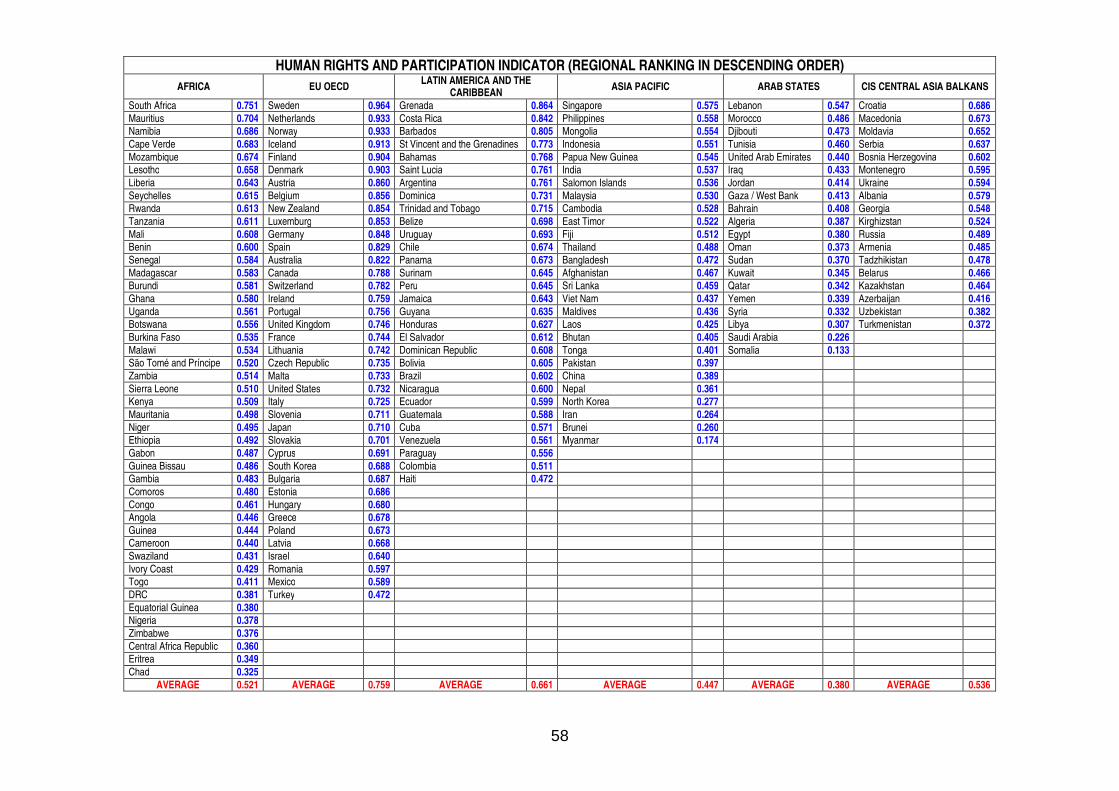
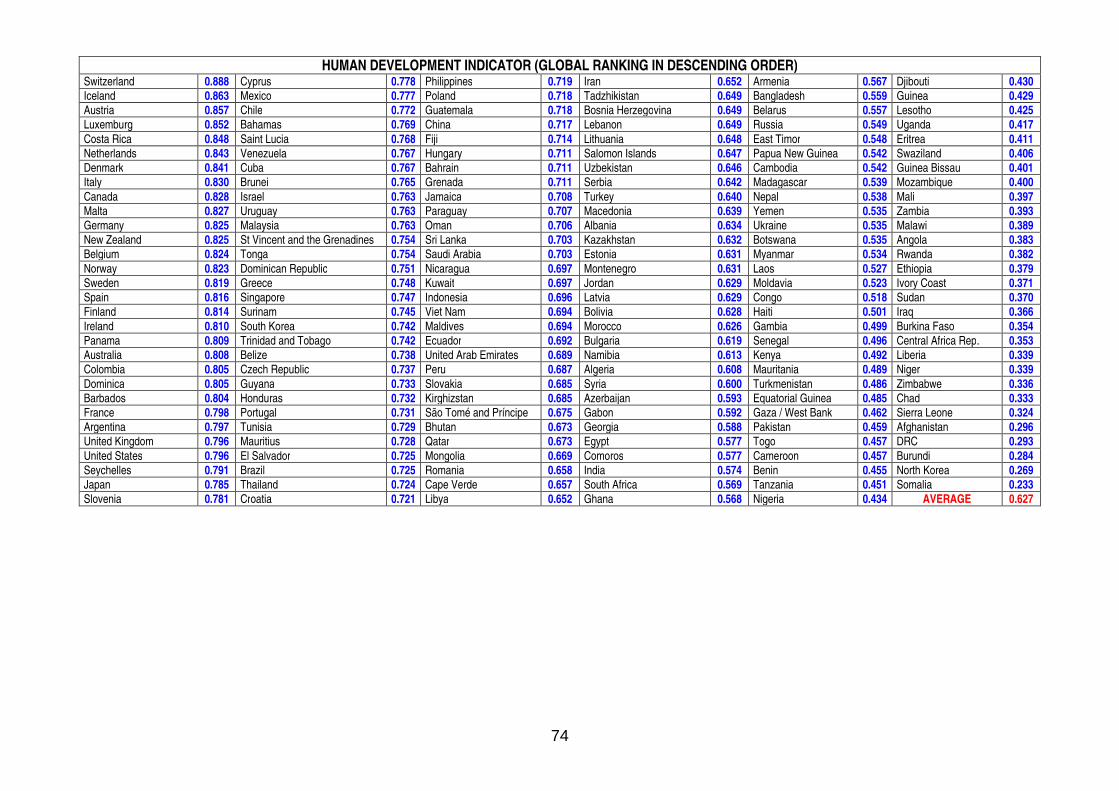
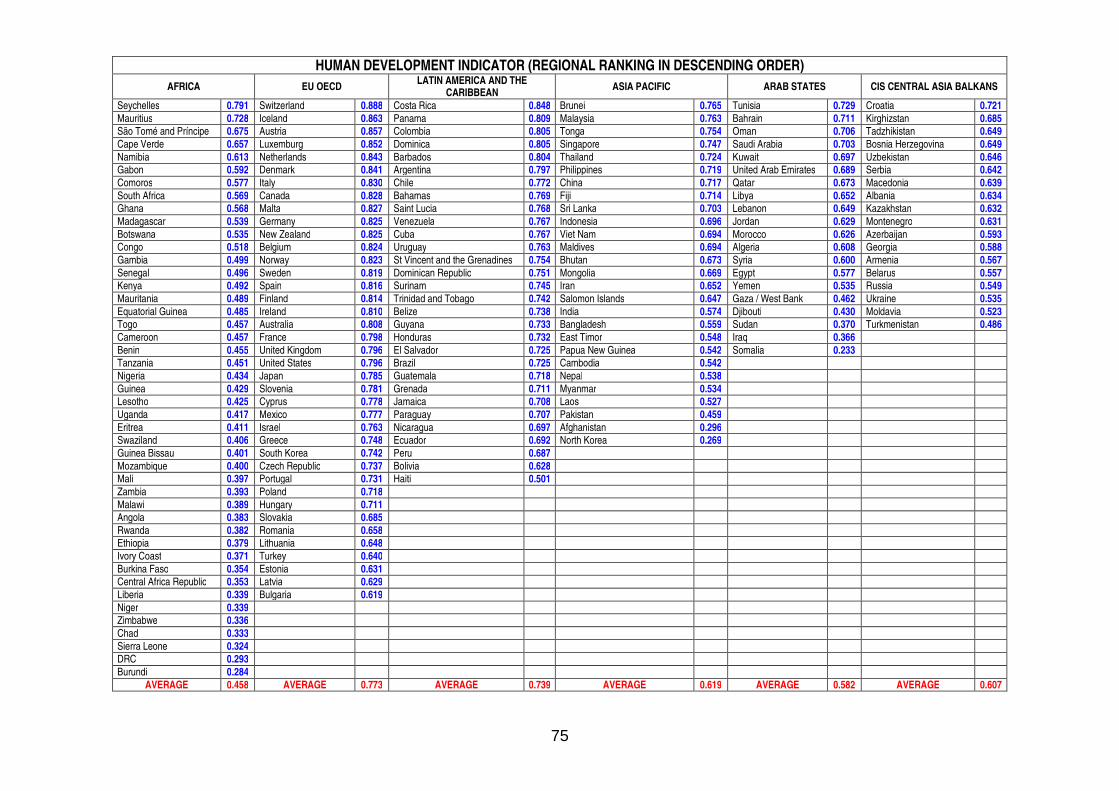
6. CALCULATING THE WGI
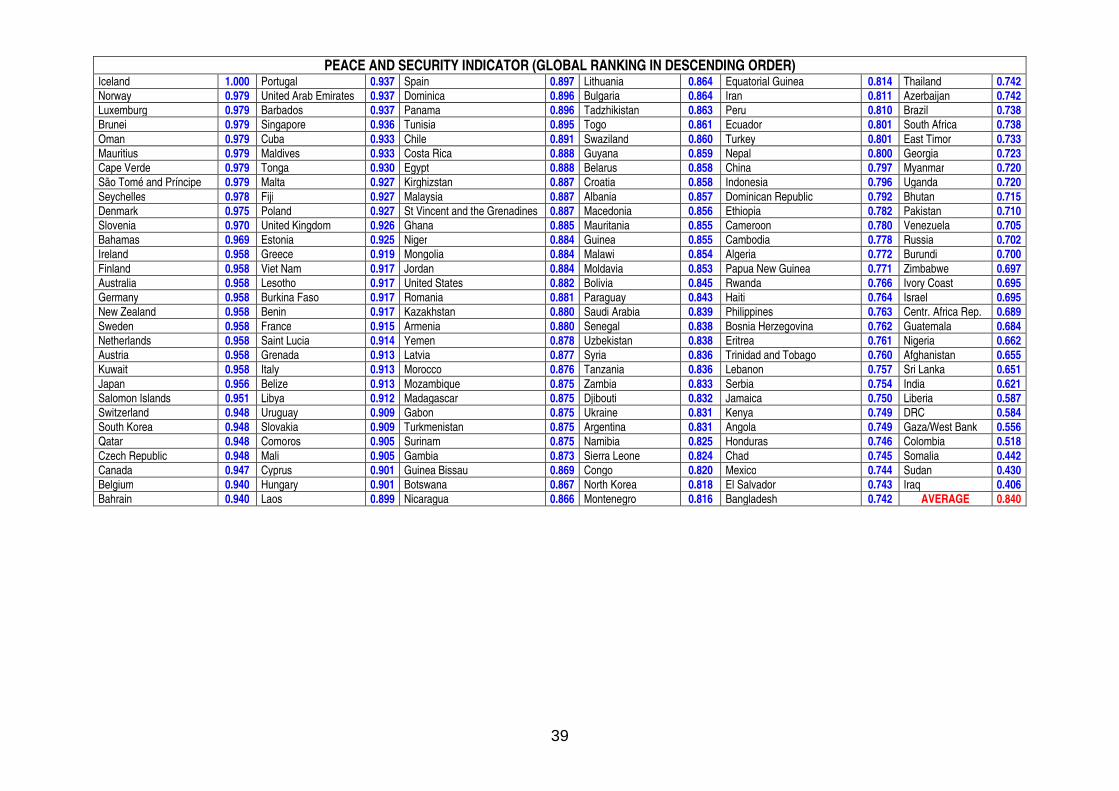
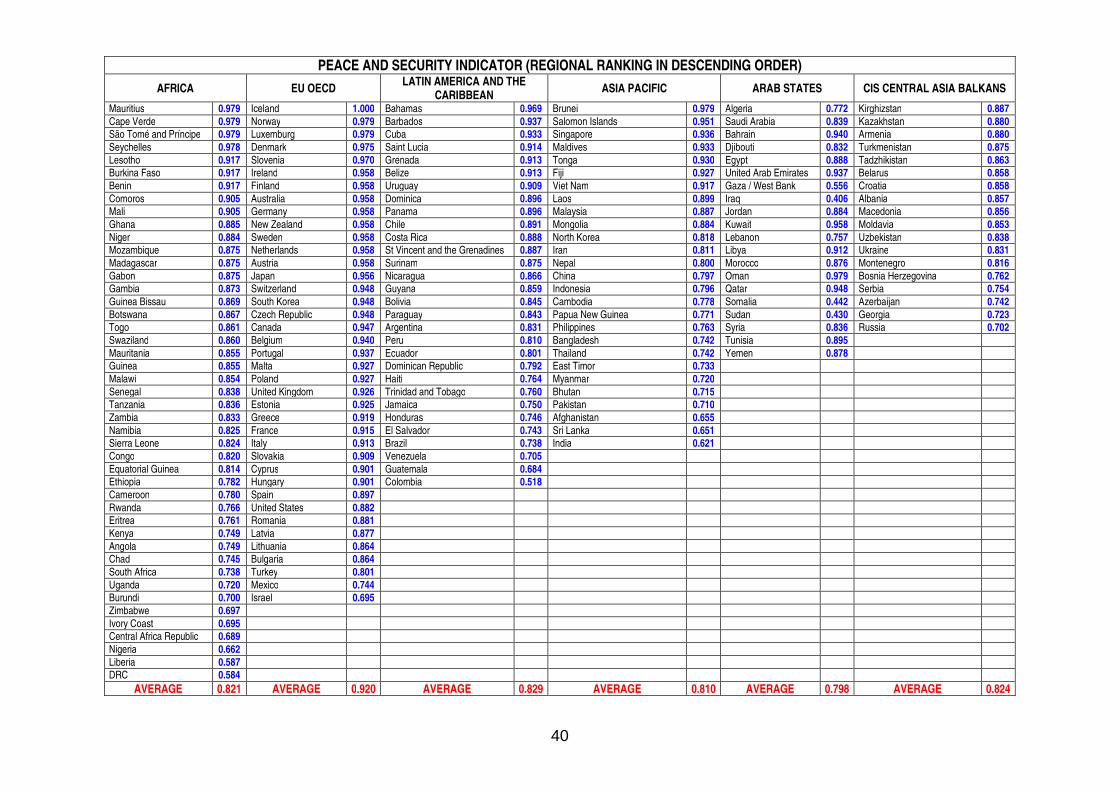
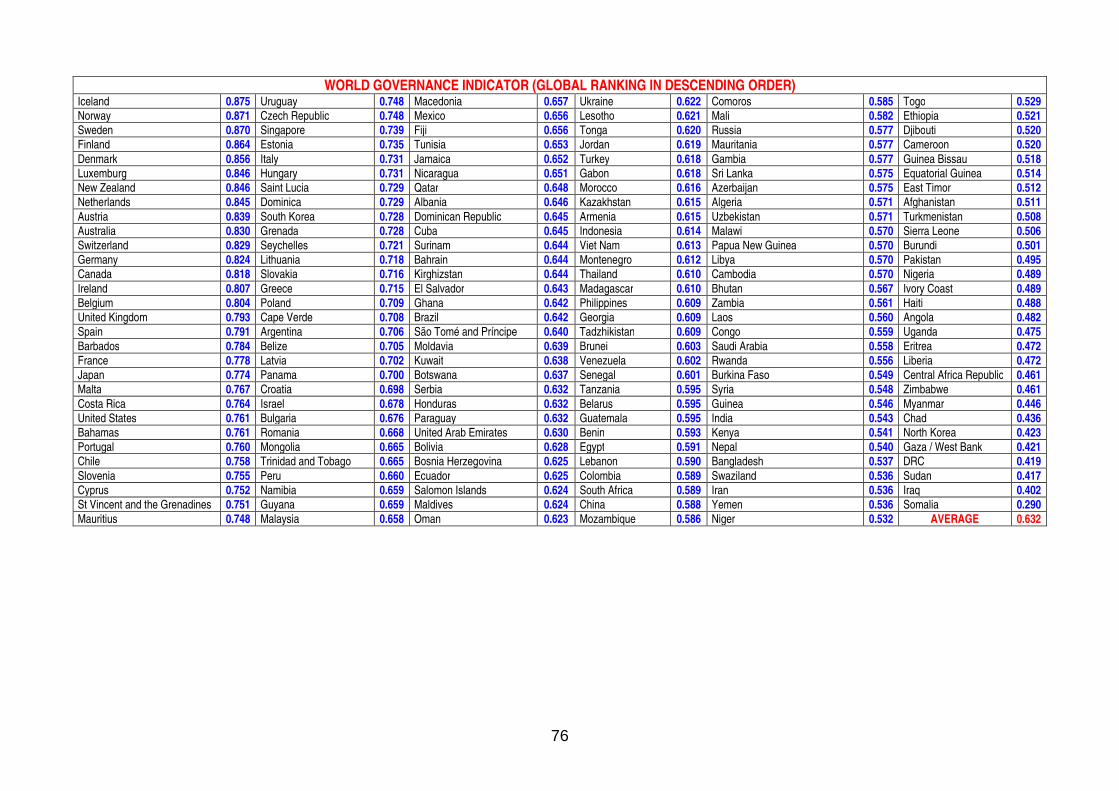
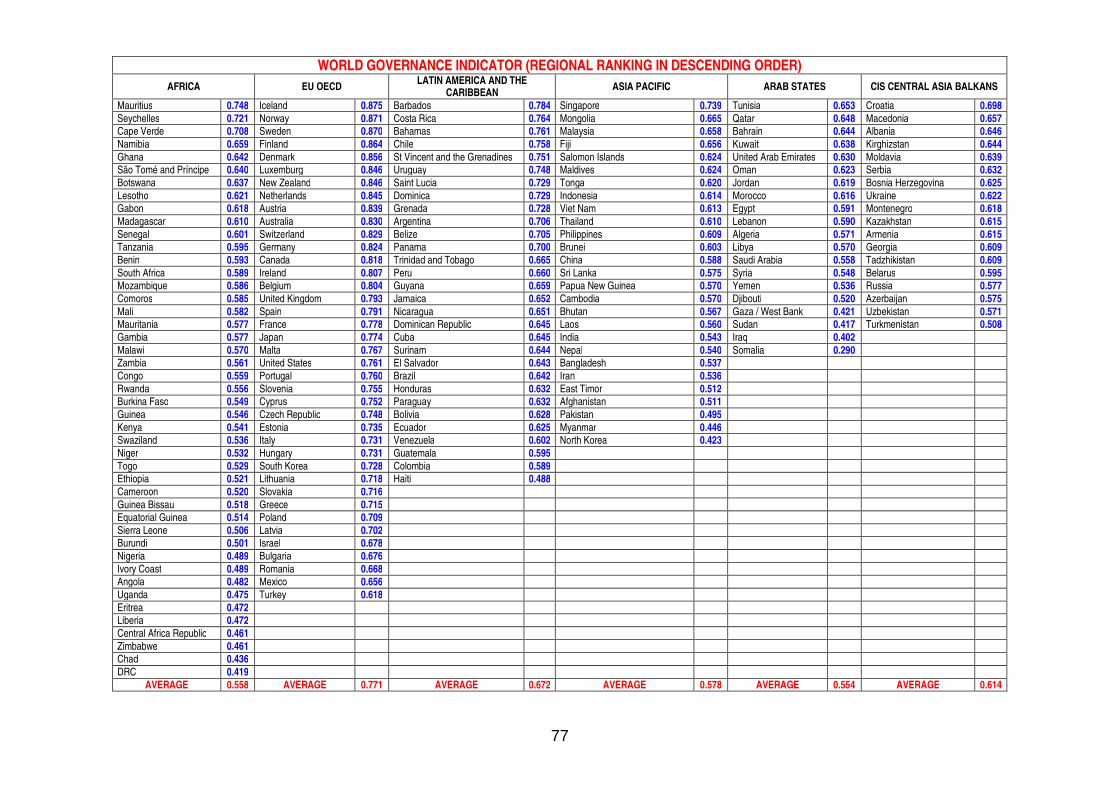
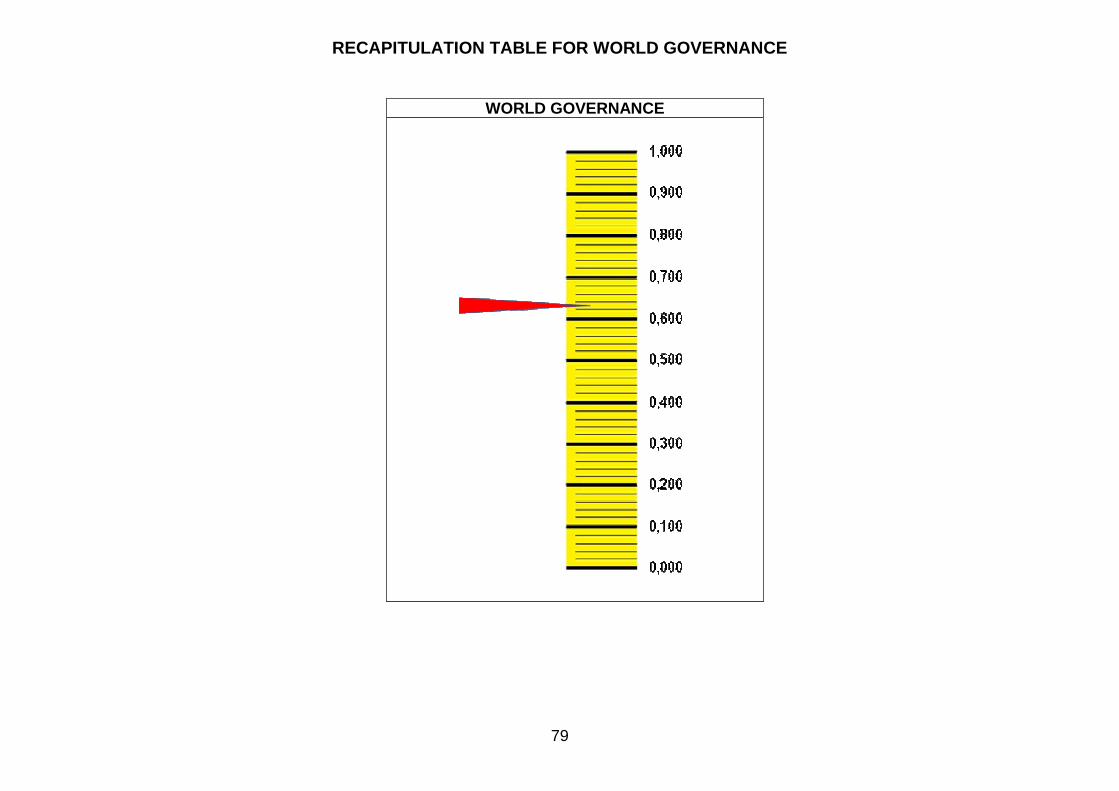
The approach taken to calculate the WGI is explained in detail in the appendices of this study. It is similar to the one used by the UNDP to establish its Human Development Index. The final score is expressed on a scale of 0 (worst score) to 1 (best possible score). There are three types of table illustrating each indicator: first, a general table in alphabetical order recapitulating the details of all the data that was used to calculate the indicator; second, a table showing the global ranking for the indicator in question; and third, a table showing the ranking per regional entity. The WGI is given in two different tables: global ranking and regional ranking.
29
CONCLUSION
The ultimate goal of this study on the WGI is part of a long-term process. On the basis of the situation described by the WGI and of its diagnosis, it must enable actors in charge of governance to raise the right questions in order to consider solutions. In the end, the idea is to materialize a world governance that is capable of taking up the global challenges of the coming years in compliance with the big principles defined in the Guide to Developing Proposals for World Governance.17 Producing the WGI is a first step in that direction. The indicators, sub-indicators, and indexes used for this study point exactly in the direction of these principles. The indexes that constitute the Peace and Security, Rule of Law, and Human Rights and Participation indicators, for instance, clearly refer to the Legitimacy of the exercise of power principle and to that of Conformity with the democratic ideal and with principles of citizenship . The deep consent of peoples to the way in which they are governed, the trust they place in those exercising authority, the importance given to the necessities of the common good, and an organization of society based on an ethical foundation that is recognized and respected are concepts that the indexes surveyed illustrate and evaluate. Those of Sustainable Development point to the principle of Competence and efficacy and survey public and private institutions in the way they are designed, their way of working, as well as the competence, the pertinence, and the capacities of those in charge of their operations. As for the indexes of the Human Development indicator, they underscore the principle of Cooperation and partnership . This survey is not exhaustive. The choices made led to selecting five areas of survey and to limiting their field of application to only nation-states as actors. Nation-states constitute a legal framework and a form of political and social organization inherited from a history and culture sometimes thousands of years old. It is hence in this capacity that they are among the most important actors in world governance and it is for this reason that the result of the present survey provides a good indication of the current state of world governance. Nonetheless, a number of other actors will also need to be surveyed. Identifying these actors is not a problem in itself: they are Intergovernmental Organizations (IGOs), NGOs and enterprises of global dimension. A more delicate aspect will be to determine what criteria to use. From the simple point of view of nation-states, it is relatively easy to define a number of general criteria common to all nation-states. Given their general and common character, there is plenty of easily exploitable data. The challenge will be different when it comes to other actors. In France, the recent and significant malfunctioning of a French NGO accused of trafficking children early in 2008, amply conveyed by the media, has contributed to rekindling the debate on the governance of non-state actors. It is therefore natural to raise the question of governance within this fuzzy mass of organizations.
In the same way that the five indicators of this survey make it possible to assess the performance of nation-states in the area of governance, other indicators should be able to make it possible to evaluate the impact of IGOs, NGOs and enterprises of global dimension. Evaluating the "responsibility and accountability" of these actors should not stop at theory. The idea is to assess the way in which these actors commit to factoring their beneficiaries’ needs into their decisions, and the way in which they fulfill this commitment. One of the perverse effects of indicators is that very often their purpose is eclipsed by a final ranking that for some becomes obsessive, whereas for others, it seems to have no value. The point is not, therefore, when this survey is complete, to establish a ranking of countries or actors, or to use the results to hand out good or bad points. What is essential is to show the state of world governance through the selected survey criteria and to rouse the actors into taking advantage of the educational value of the WGI in order to raise the questions that are fundamental to their governance. Beyond the ranking, what is of the essence is the questioning that ensues. The ranking, or rather its constituent elements, should lead to in-depth thinking on the strengths and weaknesses of this or that nation-state. This should then lead in turn to implementing measures, seeking initiatives, and changing behavior in order to achieve, in the end, a world that is better because it is governed better. At the end of this survey, it would be pretentious and dangerous to state that the WGI is finished and perfect. The WGI, as defined here, is the result of an initial approach. The process has not been simple. Between compiling reliable data, comparing it, and studying its relevance, there were choices to be made. These choices are not final. With the exponential growth of communication means and information sharing characteristic of today’s world, it is more than likely that, in the near future, new, even more relevant data will be available. Any suggestion or observation is welcome, because it is from confronting ideas that an even more effective WGI will spring.
31
ACRONYMS ADB Asian Development Bank
ATTAC Association pour la taxation des transactions pour l'aide aux citoyens (Association for the taxation of financial transactions for the benefit of citizens)
BIS Bank for International Settlements CIRI Cingranelli-Richards CNS Centre nutritionnel supplémentaire (Supplementary nutrition center) CNT Centre nutritionnel thérapeutjique (Therapeutical nutrition center) CPIA Country Policy and Institutional Assessment (World Bank) CPJ Committee to Protect Journalists CSD Commission on Sustainable Development DRC Democratic Republic of the Congo ECHO European Community Humanitarian Office ECOSOC Economic and Social Council EIU Economist Intelligence Unit FAO Food and Agriculture Organization (United Nations) FAST Forecasting and Assessment in the field of Science and Technology GDP Gross Domestic Product HDI Human Development Index ICPO (INTERPOL) International Criminal Police Organization (INTERPOL) IDMC Internal Displacement Monitoring Centre IDP Internally Displaced Person IGO Intergovernmental organization ILO International Labour Office ILO International Labour Organization IMF International Monetary Fund MERCOSUR Mercado Común del Cono Sur (Southern Cone common market) NAFTA North American Free Trade Agreement NEF New Economics Foundation NGO Nongovernmental organization OECD Organisation for Economic Co-operation and Development OFDA Office of Foreign Disaster Assistance (USAID) PRIO Peace Research Institute Oslo RSF Reporters sans frontières (Reporters without borders) UCDP Uppsala Conflict Data Program UN United Nations Organization UNDP United Nations Development Programme UNEP United Nations Environment Programme UNESCO United Nations Educational, Scientific and Cultural Organization UNFPA United Nations Population Fund UNHCHR United Nations High Commissioner for Human Rights UNHCR Office of the United Nations High Commissioner for Refugees UNICEF United Nations Children's Fund UNODC United Nations Office on Drugs and Crime USCRI US Committee for Refugees and Immigrants WFP World Food Programme WGI World Governance Index WHO World Health Organization WTO World Trade Organization:
32
PEACE AND SECURITY APPENDIX NATIONAL SECURITY SUB-INDICATOR Index: Conflicts The data is drawn from the Conflict Barometer 2007, published annually by the Heidelberg Institute for International Conflict Research of the Department of Political Sciences of the University of Heidelberg.18 The institute applies the following definition of conflicts: "Conflicts are clashes of interest . . . concerning national values . . . of a certain duration and scope, involving at least two parties (organized groups, states, groups of states, organizations of states) determined to pursue and to win their cases." The main factors taken as a starting point for these conflicts are: "territory, secession, decolonization, autonomy, system/ideology, national power, regional predominance, international power, resources, other." The Conflict Barometer ranks conflicts on a scale of 1 to 5 by order of increasing gravity according to their nature: Latent Conflict, Manifest Conflict, Crisis, Severe Crisis, and War. For each country, the score in the Total column is the number of points attributed according to the number and types of conflicts documented in the previous year. As the purpose is to take into account all the countries of the world, the index is calculated in such a way that the country that totals the highest number of points, in this case India with 58 points, is attributed a zero and those whose total is equal to zero—Benin, Austria, Germany, etc—are attributed the best score, 1.00. The calculation went as follows: Index: Refugees / Asylum seekers The data used comes from the UNHCR Statistical Online Population Database.19 For the purpose of comparison among the different countries, the raw data is converted into results per 100,000 inhabitants. The index is then calculated as for the Conflicts index. In the present case the highest score is 16,107.4 (Bhutan) and the lowest is 0.4 (Ireland).
Country score – Lowest score 100 - 100 x Highest score – Lowest score Index =
100
33
Index: Displaced Persons The survey is based on the data from the US Committee for Refugees and Immigrants, the USCRI's World Refugee Survey (2001 to 2007),20 and data from the IDP's Internal Displacement Monitoring Centre (IDMC) database (2007) of the Norwegian Refugee Council.21 The index is then calculated as previously. Here, the highest score is 16,022.1 (Sudan) and the lowest is 0. The National Security sub-indicator (NSI) is calcul ated by producing the average of the three indexes in this category. PUBLIC SECURITY SUB-INDICATOR Index: Political Climate The data used is that produced by the Political Terror Scale program, which has been measuring and assessing the levels of political violence annually since 1980.22 This assessment, from 1 to 5, is made by aggregating the data published annually by Amnesty International as well as by the US State Department in its Annual Report on Human Rights. Index: Trust among Citizens
The data used is that produced by the EIU, which assesses, on a scale of 1 to 5, the degree of trust observed among the citizens of a given country.23 Index: Violent Crime Rate The data in this area is open to doubt in a certain number of sectors (robberies, burglaries, etc.). The only data that can be properly exploited is the data on homicides. We have based our calculations on the data from the EIU and that from the United Nations Surveys on Crime Trends and the Operation of Criminal Justice Systems (Surveys 7, 8, and 9).24 Although it was once possible to access data from the ICPO, the organization has stopped publishing statistics since 2006, due to the lack of reliability of the data, which was provided under the responsibility of the states. Index: Homicides per 100,000 Inhabitants As for the previous sub-category, the data is drawn from the United Nations Surveys on Crime Trends and the Operation of Criminal Justice Systems (Surveys 7, 8, and 9) and from the EIU. Many experts agree that UNODC data is the most reliable,
because it is drawn from questionnaires sent to the authorities by the United Nations Statistics Division. For the four indexes in this category—Political Climate, Trust, Violent Crime Rate, and Homicides/100,000—the data used is from the EIU. The results are expressed on a scale of 1 to 5, where 1 is the best score and 5 the worst. The conversion into a sub-indicator used the following formula: The Public Security sub-indicator (PSI) is calculat ed by producing the average of the four indexes in this category. Due to the importance of the NSI, the final indicat or, PEACE AND SECURITY, is obtained by adding 2/3 of the NSI to 1/3 of the PSI .
The final score at the global level is the average of the 179 countries surveyed, or: 0.840
PEACE AND SECURITY INDICATOR (GLOBAL RANKING IN DESCENDING ORDER)
Iceland 1.000 Portugal 0.937 Spain 0.897 Lithuania 0.864 Equatorial Guinea 0.814 Thailand 0.742 Norway 0.979 United Arab Emirates 0.937 Dominica 0.896 Bulgaria 0.864 Iran 0.811 Azerbaijan 0.742 Luxemburg 0.979 Barbados 0.937 Panama 0.896 Tadzhikistan 0.863 Peru 0.810 Brazil 0.738 Brunei 0.979 Singapore 0.936 Tunisia 0.895 Togo 0.861 Ecuador 0.801 South Africa 0.738
Oman 0.979 Cuba 0.933 Chile 0.891 Swaziland 0.860 Turkey 0.801 East Timor 0.733 Mauritius 0.979 Maldives 0.933 Costa Rica 0.888 Guyana 0.859 Nepal 0.800 Georgia 0.723 Cape Verde 0.979 Tonga 0.930 Egypt 0.888 Belarus 0.858 China 0.797 Myanmar 0.720 São Tomé and Príncipe 0.979 Malta 0.927 Kirghizstan 0.887 Croatia 0.858 Indonesia 0.796 Uganda 0.720
Seychelles 0.978 Fiji 0.927 Malaysia 0.887 Albania 0.857 Dominican Republic 0.792 Bhutan 0.715 Denmark 0.975 Poland 0.927 St Vincent and the Grenadines 0.887 Macedonia 0.856 Ethiopia 0.782 Pakistan 0.710 Slovenia 0.970 United Kingdom 0.926 Ghana 0.885 Mauritania 0.855 Cameroon 0.780 Venezuela 0.705 Bahamas 0.969 Estonia 0.925 Niger 0.884 Guinea 0.855 Cambodia 0.778 Russia 0.702 Ireland 0.958 Greece 0.919 Mongolia 0.884 Malawi 0.854 Algeria 0.772 Burundi 0.700
Finland 0.958 Viet Nam 0.917 Jordan 0.884 Moldavia 0.853 Papua New Guinea 0.771 Zimbabwe 0.697 Australia 0.958 Lesotho 0.917 United States 0.882 Bolivia 0.845 Rwanda 0.766 Ivory Coast 0.695 Germany 0.958 Burkina Faso 0.917 Romania 0.881 Paraguay 0.843 Haiti 0.764 Israel 0.695 New Zealand 0.958 Benin 0.917 Kazakhstan 0.880 Saudi Arabia 0.839 Philippines 0.763 Centr. Africa Rep. 0.689
Sweden 0.958 France 0.915 Armenia 0.880 Senegal 0.838 Bosnia Herzegovina 0.762 Guatemala 0.684 Netherlands 0.958 Saint Lucia 0.914 Yemen 0.878 Uzbekistan 0.838 Eritrea 0.761 Nigeria 0.662 Austria 0.958 Grenada 0.913 Latvia 0.877 Syria 0.836 Trinidad and Tobago 0.760 Afghanistan 0.655 Kuwait 0.958 Italy 0.913 Morocco 0.876 Tanzania 0.836 Lebanon 0.757 Sri Lanka 0.651
Japan 0.956 Belize 0.913 Mozambique 0.875 Zambia 0.833 Serbia 0.754 India 0.621 Salomon Islands 0.951 Libya 0.912 Madagascar 0.875 Djibouti 0.832 Jamaica 0.750 Liberia 0.587 Switzerland 0.948 Uruguay 0.909 Gabon 0.875 Ukraine 0.831 Kenya 0.749 DRC 0.584 South Korea 0.948 Slovakia 0.909 Turkmenistan 0.875 Argentina 0.831 Angola 0.749 Gaza/West Bank 0.556 Qatar 0.948 Comoros 0.905 Surinam 0.875 Namibia 0.825 Honduras 0.746 Colombia 0.518
Czech Republic 0.948 Mali 0.905 Gambia 0.873 Sierra Leone 0.824 Chad 0.745 Somalia 0.442 Canada 0.947 Cyprus 0.901 Guinea Bissau 0.869 Congo 0.820 Mexico 0.744 Sudan 0.430 Belgium 0.940 Hungary 0.901 Botswana 0.867 North Korea 0.818 El Salvador 0.743 Iraq 0.406 Bahrain 0.940 Laos 0.899 Nicaragua 0.866 Montenegro 0.816 Bangladesh 0.742 AVERAGE 0.840
40
PEACE AND SECURITY INDICATOR (REGIONAL RANKING IN DESCENDING ORDER)
AFRICA EU OECD LATIN AMERICA AND THE
CARIBBEAN ASIA PACIFIC ARAB STATES CIS CENTRAL ASIA BALKANS
Benin 0.917 Finland 0.958 Uruguay 0.909 Viet Nam 0.917 Gaza / West Bank 0.556 Croatia 0.858
Comoros 0.905 Australia 0.958 Dominica 0.896 Laos 0.899 Iraq 0.406 Albania 0.857 Mali 0.905 Germany 0.958 Panama 0.896 Malaysia 0.887 Jordan 0.884 Macedonia 0.856
Niger 0.884 Sweden 0.958 Costa Rica 0.888 North Korea 0.818 Lebanon 0.757 Uzbekistan 0.838 Mozambique 0.875 Netherlands 0.958 St Vincent and the Grenadines 0.887 Iran 0.811 Libya 0.912 Ukraine 0.831
Madagascar 0.875 Austria 0.958 Surinam 0.875 Nepal 0.800 Morocco 0.876 Montenegro 0.816
Gabon 0.875 Japan 0.956 Nicaragua 0.866 China 0.797 Oman 0.979 Bosnia Herzegovina 0.762 Gambia 0.873 Switzerland 0.948 Guyana 0.859 Indonesia 0.796 Qatar 0.948 Serbia 0.754
Guinea Bissau 0.869 South Korea 0.948 Bolivia 0.845 Cambodia 0.778 Somalia 0.442 Azerbaijan 0.742
Botswana 0.867 Czech Republic 0.948 Paraguay 0.843 Papua New Guinea 0.771 Sudan 0.430 Georgia 0.723 Togo 0.861 Canada 0.947 Argentina 0.831 Philippines 0.763 Syria 0.836 Russia 0.702
Swaziland 0.860 Belgium 0.940 Peru 0.810 Bangladesh 0.742 Tunisia 0.895
Mauritania 0.855 Portugal 0.937 Ecuador 0.801 Thailand 0.742 Yemen 0.878 Guinea 0.855 Malta 0.927 Dominican Republic 0.792 East Timor 0.733
Malawi 0.854 Poland 0.927 Haiti 0.764 Myanmar 0.720
Senegal 0.838 United Kingdom 0.926 Trinidad and Tobago 0.760 Bhutan 0.715 Tanzania 0.836 Estonia 0.925 Jamaica 0.750 Pakistan 0.710
Rwanda 0.766 United States 0.882 Eritrea 0.761 Romania 0.881
Kenya 0.749 Latvia 0.877
Angola 0.749 Lithuania 0.864 Chad 0.745 Bulgaria 0.864
South Africa 0.738 Turkey 0.801
Uganda 0.720 Mexico 0.744 Burundi 0.700 Israel 0.695
Zimbabwe 0.697
Ivory Coast 0.695 Central Africa Republic 0.689
Nigeria 0.662
Liberia 0.587 DRC 0.584
AVERAGE 0.821 AVERAGE 0.920 AVERAGE 0.829 AVERAGE 0.810 AVERAGE 0.798 AVERAGE 0.824
41
RULE OF LAW APPENDIX ESSENTIAL BODY OF LAWS SUB-INDICATOR Index: Status of the main international instruments for the defense of Human Rights The United Nations High Commissioner for Human Rights (UNHCHR) identified the ten international conventions and treaties that constitute the core of the issue in this area. They are the following:
• 1948 Convention on the Prevention and Punishment of the Crime of Genocide
• International Convention on the Elimination of All Forms of Racial Discrimination (ICERD - December 21, 1965)
• International Covenant on Civil and Political Rights (ICCPR - December 16, 1966)
• International Covenant on Economic, Social and Cultural Rights (ICESCR - December 16, 1966)
• Convention on the Elimination of All Forms of Discrimination against Women (CEDAW - December 18, 1979)
• United Nations Convention against Torture and Other Cruel, Inhuman or Degrading Treatment or Punishment (UNCAT - December 10, 1984)
• Convention on the Rights of the Child (CRC - November 20, 1989) • International Convention on the Protection of the Rights of All Migrant
Workers and Members of Their Families (December 18, 1990) • Convention on the Rights of Persons with Disabilities (December 13,
2006) • International Convention for the Protection of All Persons from Enforced
Disappearance The purpose of this index is to determine the degree of ratification of these seven treaties and conventions currently in force. Ratification by a country is not an insignificant act. Indeed, after signing a treaty, a country must ratify it, often through its parliament's approval. This is no longer just interest in the treaty or convention as indicated by the signature, it implies transposing its principles and obligations into national legislation. The latest convention (the International Convention for the Protection of All Persons from Enforced Disappearance) is not yet in force, so the survey is limited to the first nine texts and is based on the data provided by the United Nations High Commissioner for Human Rights,25 and the UNDP's HDI tables.26
25 http://www.ohchr.org 26 http://hdr.undp.org
42
We have assigned 1 point for every treaty or convention that has been ratified. The highest possible total is therefore 9 points and the sub-indicator was then calculated according to the following formula: Index: Property Rights The purpose of this index is to assess a country's degree of commitment to the protection of private property and the way in which the authorities apply this right. The data is drawn from the Economic Freedom index as defined by the Heritage Foundation and the Wall Street Journal.27 Although most of the data provided in the Economic Freedom index is data considered from the point of view of economic liberalism, which is reminiscent of the one that drove the World Bank to produce questionable indicators, it seems nevertheless necessary to take this sub-indicator into account. Guaranteeing private property by law constitutes an important force in the framework of market economy. It gives citizens the necessary confidence to get involved in commercial activities, to live from them, and to consider the future in the long term. In this index, respect and guarantee of property rights are assessed on a scale of 0 (no guarantee) to 100 (guarantee insured and total respect). The sub-indicator was calculated according to the formula: The Essential Body of Laws sub-indicator is calcula ted by producing the average of the two above indexes. EXISTENCE OF AN OPERATIONAL INDEPENDENT JUDICIAL SY STEM SUB-INDICATOR Index: Independence The data is drawn from the Rule of Law section of the Civil Liberties index produced by Freedom House.28 This index is the result of a composite measurement that assesses, all together, the independence of the judicial system, the bodies that oversee the police force, legal protection, and the guarantee of equal treatment for all. The assessment is made on a scale of 1 to 16, where 1 is the worst score and 16 the best.
It is the only available index for the moment. As of the end of 2008, it should be possible to have data available from a survey performed by the American Bar Association, which was working on a global Rule of Law index under its World Justice Project program.29 Calculation of the Independence index was performed as following: Index: Effectiveness One of the ways of estimating the efficiency of a judicial system consists in using as
a basis the available data on the ratio of remand prisoners to convicted prisoners. The World Prisons Brief published by the Center for Prison Studies provides a good overview of this data. It is updated regularly, and the latest figures are for 2007.30
The index was calculated according to the same process as for the Conflicts index with the highest value being 97.30 (for Liberia) and the lowest 0. Index: Effectiveness in the Settlement of Contractu al Disputes The data is drawn from the World Bank's Doing Business report.31 This report studies how long it takes for national judicial institutions to settle disputes related to commercial contracts. The average time is expressed in number of days from the moment a plaintiff has filed a lawsuit until actual settlement. The calculation method is identical to the method used for the Effectiveness index, where the highest result is 1,800 days (East Timor) and the lowest 120 (Singapore). The Judicial System sub-indicator is calculated by producing the average of the three above indexes.
Country score – Lowest score 100 - 100 x Highest score – Lowest score Index =
100
44
CORRUPTION SUB-INDICATOR Index: Corruption The Corruption Perceptions Index produced by Transparency International is calculated from a dozen surveys conducted by nine institutions (World Bank, Economist Intelligence Unit, Freedom House, Nations in Transit, International Institute for Management Development, Merchant International Group, Political and Economic Risk Consultancy, United Nations Economic Commission for Africa, World Economic Forum, and the World Markets Research Center).32 It is established on the basis of observations made by the experts of these organizations assigned to study the results of the dozen surveys conducted. This index is expressed on a scale of 0 (total corruption) to 10 (no corruption). The index was calculated as follows: The Corruption sub-indicator is the result of this single index. The RULE OF LAW indicator is the average of the thr ee previously determined sub-indicators.
The final score at the global level is the average of the 179 countries surveyed, or: 0.530
32 www.transparency.org
Country score Index =
10
45
RULE OF LAW
RU
LE
OF
LA
W
IND
ICA
TO
R
Essential Body of Law Existence of an operational independent legal
United Kingdom 0.840 Slovenia 0.642 Serbia 0.542 Gabon 0.480 Niger 0.436 Congo 0.376 Luxemburg 0.832 Afghanistan 0.638 Georgia 0.536 Panama 0.480 Viet Nam 0.436 Sudan 0.364 Austria 0.831 Botswana 0.625 Brazil 0.536 Zambia 0.479 Philippines 0.435 Cameroon 0.358 Germany 0.828 Namibia 0.624 Fiji 0.536 Russia 0.478 Indonesia 0.432 Bangladesh 0.357 Canada 0.828 Slovakia 0.623 Macedonia 0.532 São Tomé and Príncipe 0.476 Mozambique 0.432 Eritrea 0.351
Netherlands 0.824 Costa Rica 0.618 Ukraine 0.528 Kazakhstan 0.476 Saudi Arabia 0.431 Pakistan 0.347 Chile 0.808 Saint Lucia 0.616 Peru 0.527 Azerbaijan 0.475 Cambodia 0.430 Liberia 0.341 Ireland 0.807 Greece 0.607 Albania 0.524 Honduras 0.475 Paraguay 0.430 Central Africa Rep. 0.341 United States 0.803 Poland 0.604 Armenia 0.521 Salomon Islands 0.472 Nepal 0.428 Cuba 0.339
Singapore 0.785 Ghana 0.603 Grenada 0.520 Tadzhikistan 0.472 Lebanon 0.426 East Timor 0.338 Japan 0.774 Seychelles 0.593 Bosnia Herzegovina 0.516 Rwanda 0.471 Comoros 0.424 North Korea 0.337 Estonia 0.765 Kuwait 0.585 Malawi 0.512 Burkina Faso 0.471 Papua New Guinea 0.411 Chad 0.326 France 0.763 Dominica 0.582 Trinidad and Tobago 0.501 Uganda 0.470 Guatemala 0.411 DRC 0.318
Spain 0.753 Mexico 0.577 Kirghizstan 0.498 Sri Lanka 0.466 Ivory Coast 0.409 South Africa 0.315 Belgium 0.750 Bahrain 0.574 Mauritania 0.497 Guyana 0.465 Surinam 0.409 Myanmar 0.306 Barbados 0.749 Jordan 0.574 Thailand 0.496 Madagascar 0.462 Burundi 0.408 Angola 0.305 Cyprus 0.741 Bulgaria 0.571 Algeria 0.495 Swaziland 0.462 Togo 0.405 Iraq 0.296 Portugal 0.736 Croatia 0.570 United Arab Emirates 0.495 Guinea 0.461 Laos 0.405 Turkmenistan 0.285
Malta 0.726 Lesotho 0.566 Nicaragua 0.495 Oman 0.457 Yemen 0.401 Haiti 0.277 Hungary 0.711 Tunisia 0.566 Morocco 0.495 Bhutan 0.455 Syria 0.400 Somalia 0.258 Uruguay 0.703 Romania 0.566 Malaysia 0.494 India 0.449 Nigeria 0.395 Gaza / West Bank 0.208 St Vincent and the Grenadines 0.702 Belize 0.561 Argentina 0.494 Mali 0.448 Ethiopia 0.390 AVERAGE 0.530
49
RULE OF LAW INDICATOR (REGIONAL RANKING IN DESCENDING ORDER)
AFRICA EU OECD LATIN AMERICA AND THE
CARIBBEAN ASIA PACIFIC ARAB STATES CIS CENTRAL ASIA BALKANS
Lesotho 0.566 Australia 0.851 Saint Lucia 0.616 Maldives 0.490 United Arab Emirates 0.495 Albania 0.524
Senegal 0.550 Switzerland 0.843 Dominica 0.582 China 0.489 Morocco 0.495 Armenia 0.521 Malawi 0.512 United Kingdom 0.840 Belize 0.561 Brunei 0.482 Egypt 0.490 Bosnia Herzegovina 0.516
Mauritania 0.497 Luxemburg 0.832 El Salvador 0.558 Salomon Islands 0.472 Oman 0.457 Kirghizstan 0.498
Tanzania 0.487 Austria 0.831 Jamaica 0.554 Sri Lanka 0.466 Saudi Arabia 0.431 Russia 0.478 Gambia 0.485 Germany 0.828 Brazil 0.536 Bhutan 0.455 Lebanon 0.426 Kazakhstan 0.476
Gabon 0.480 Canada 0.828 Peru 0.527 India 0.449 Yemen 0.401 Azerbaijan 0.475
Zambia 0.479 Netherlands 0.824 Grenada 0.520 Tonga 0.446 Syria 0.400 Tadzhikistan 0.472 São Tomé and Príncipe 0.476 Ireland 0.807 Trinidad and Tobago 0.501 Viet Nam 0.436 Libya 0.378 Montenegro 0.446
Rwanda 0.471 United States 0.803 Nicaragua 0.495 Philippines 0.435 Djibouti 0.376 Uzbekistan 0.440
Burkina Faso 0.471 Japan 0.774 Argentina 0.494 Indonesia 0.432 Sudan 0.364 Belarus 0.440 Uganda 0.470 Estonia 0.765 Colombia 0.491 Cambodia 0.430 Iraq 0.296 Turkmenistan 0.285
Congo 0.376 Romania 0.566 Cameroon 0.358 Turkey 0.557
Eritrea 0.351 Italy 0.553
Liberia 0.341 Central Africa Republic 0.341
Chad 0.326
DRC 0.318 South Africa 0.315
Angola 0.305
AVERAGE 0.451 AVERAGE 0.741 AVERAGE 0.525 AVERAGE 0.455 AVERAGE 0.441 AVERAGE 0.490
50
HUMAN RIGHTS AND PARTICIPATION APPENDIX CIVIL AND POLITICAL RIGHTS SUB-INDICATOR Index: Respect of Civil Rights The data is drawn from the Cingranelli-Richard (CIRI) Human Rights Dataset33 on the basis of the results obtained in the following domains: Freedom of Movement, Political Participation, Worker's Rights, Freedom of Speech, Freedom of Religion, Freedom of Assembly and Association. The assessment scale runs from 0 to 10, where 0 is the worst score and 10 the best. The index was calculated according to the following formula:
Index: Respect for Physical Integrity Rights The data is drawn from the Cingranelli-Richard (CIRI) Human Rights Dataset on the basis of the results obtained in the following domains: Torture, Disappearance or Political Abductions, Extrajudicial Killing, and Political Imprisonment. The assessment scale runs from 0 to 8, where 0 is the worst score and 8 the best.
Index: Freedom of the Press The data is drawn from the NGO RSF's 2008 Annual Report: Freedom of the Press Worldwide.34 The index is the result of a survey for more than fifty criteria throughout the year by a large number of journalists' associations and organizations partnered with RSF. The index was calculated according to the following formula with the highest value being 114.75 (for Eritrea) and the lowest 0.75 (Norway).
Country score – Lowest score 100 - 100 x Highest score – Lowest score Index =
100
51
Index: Violence against Media Representatives For this sub-category, the data is drawn from the CPJ (Committee to Protect Journalists), which lists every year the number of murders, abductions, and disappearances of journalists and media workers, as well as the number of imprisoned journalists.35 The index was calculated as previously with the highest value being 51 (for Iraq) and the lowest 0. The Political and Civil Rights sub-indicator is cal culated by producing the average of the four indexes in this category. PARTICIPATION SUB-INDICATOR Index: Political Participation Index: Electoral Process and Pluralism Index: Political Culture The data used for these three indexes is drawn from the Democracy Index determined by the EIU on the basis of data related, among others, to the degree of participation in political life, to the effective share of pluralism in the different electoral processes, and to the political culture of citizens. Each of the sub-categories is expressed along a scale running from 0 to 10 (0 being the lowest score and 10 the highest). For each of these indexes, the following formula was applied: The Participation sub-indicator is calculated by pr oducing the average of the three indexes in this category. GENDER DISCRIMINATION / INEQUALITY SUB-INDICATOR This category deals with inequalities between men's and women's rights, women's political, economic, and social rights in particular, on the basis of the data provided in the Cingranelli-Richards Human Rights Dataset.36 Each of these indexes is rated on a scale of 0 (no rights) to 3 (maximum rights).
Country score – Lowest score 100 - 100 x Highest score. – Lowest score Index =
100
52
Index: Women’s Political Rights These rights include a number of internationally recognized rights: voting rights, the right to run for political office, and the right to hold elected and appointed government positions. Index: Women’s Social Rights Included in these rights, which are also internationally recognized rights, are the right to equal inheritance, the right to enter into marriage on a basis of equality with men, the right to travel abroad, the right to initiate a divorce, etc. Index: Women’s Civil Rights Equal pay for equal work, free choice of profession or employment, non-discrimination by employers, the right to be free from sexual harassment in the workplace, the right to work in the military and the police force are the main rights taken into account in this sub-category. The three above indexes were grouped into a single index, which runs on a scale of 0 (worst score) and 9 (best possible score), calculated as follows: Index: Female Parliamentary Representation The data is drawn from the Inter-Parliamentary Union Web site, which provides the percentage of seats held by women in national parliaments.37 Parity being set at 50%, the index was calculated with the following formula: The Gender Discrimination / Inequality sub-indicato r is calculated by producing the average of the four indexes in this category. The HUMAN RIGHTS AND PARTICIPATION indicator is the average of the three previously determined sub-indicators. The final score at the world level is the average o f the 179 countries
surveyed, or: 0.571
37 http://www.ipu.org/wmn-f/classif.htm)
Country score Index =
9
Country score x 2 Index =
100
53
HUMAN RIGHTS AND PARTICIPATION
HU
MA
N R
IGH
TS
IN
DIC
AT
OR
Civil and Political Rights Participation Women's Rights
HUMAN RIGHTS AND PARTICIPATION INDICATOR (GLOBAL RANKING IN DESCENDING ORDER)
Sweden 0.964 United States 0.732 Liberia 0.643 Uganda 0.561 Guinea Bissau 0.486 Bhutan 0.405 Netherlands 0.933 Dominica 0.731 Israel 0.640 Philippines 0.558 Armenia 0.485 Tonga 0.401 Norway 0.933 Italy 0.725 Serbia 0.637 Botswana 0.556 Gambia 0.483 Pakistan 0.397 Iceland 0.913 Trinidad and Tobago 0.715 Guyana 0.635 Paraguay 0.556 Comoros 0.480 China 0.389
Finland 0.904 Slovenia 0.711 Honduras 0.627 Mongolia 0.554 Tadzhikistan 0.478 Algeria 0.387 Denmark 0.903 Japan 0.710 Seychelles 0.615 Indonesia 0.551 Djibouti 0.473 Uzbekistan 0.382 Grenada 0.864 Mauritius 0.704 Rwanda 0.613 Georgia 0.548 Turkey 0.472 DRC 0.381 Austria 0.860 Slovakia 0.701 El Salvador 0.612 Lebanon 0.547 Bangladesh 0.472 Egypt 0.380
Belgium 0.856 Belize 0.698 Tanzania 0.611 Papua New Guinea 0.545 Haiti 0.472 Equatorial Guinea 0.380 New Zealand 0.854 Uruguay 0.693 Mali 0.608 India 0.537 Afghanistan 0.467 Nigeria 0.378 Luxemburg 0.853 Cyprus 0.691 Dominican Republic 0.608 Salomon Islands 0.536 Belarus 0.466 Zimbabwe 0.376 Germany 0.848 South Korea 0.688 Bolivia 0.605 Burkina Faso 0.535 Kazakhstan 0.464 Oman 0.373 Costa Rica 0.842 Bulgaria 0.687 Bosnia Herzegovina 0.602 Malawi 0.534 Congo 0.461 Turkmenistan 0.372
Spain 0.829 Estonia 0.686 Brazil 0.602 Malaysia 0.530 Tunisia 0.460 Sudan 0.370 Australia 0.822 Namibia 0.686 Nicaragua 0.600 Cambodia 0.528 Sri Lanka 0.459 Nepal 0.361 Barbados 0.805 Croatia 0.686 Benin 0.600 Kirghizstan 0.524 Angola 0.446 Central Africa Rep. 0.360 Canada 0.788 Cape Verde 0.683 Ecuador 0.599 East Timor 0.522 Guinea 0.444 Eritrea 0.349
Switzerland 0.782 Hungary 0.680 Romania 0.597 São Tomé and Príncipe 0.520 United Arab Emirates 0.440 Kuwait 0.345 St Vincent and the Grenadines 0.773 Greece 0.678 Montenegro 0.595 Zambia 0.514 Cameroon 0.440 Qatar 0.342 Bahamas 0.768 Mozambique 0.674 Ukraine 0.594 Fiji 0.512 Viet Nam 0.437 Yemen 0.339 Saint Lucia 0.761 Chile 0.674 Mexico 0.589 Colombia 0.511 Maldives 0.436 Syria 0.332
Argentina 0.761 Poland 0.673 Guatemala 0.588 Sierra Leone 0.510 Iraq 0.433 Chad 0.325 Ireland 0.759 Panama 0.673 Senegal 0.584 Kenya 0.509 Swaziland 0.431 Libya 0.307 Portugal 0.756 Macedonia 0.673 Madagascar 0.583 Mauritania 0.498 Ivory Coast 0.429 North Korea 0.277 South Africa 0.751 Latvia 0.668 Burundi 0.581 Niger 0.495 Laos 0.425 Iran 0.264 United Kingdom 0.746 Lesotho 0.658 Ghana 0.580 Ethiopia 0.492 Azerbaijan 0.416 Brunei 0.260
France 0.744 Moldavia 0.652 Albania 0.579 Russia 0.489 Jordan 0.414 Saudi Arabia 0.226 Lithuania 0.742 Surinam 0.645 Singapore 0.575 Thailand 0.488 Gaza / West Bank 0.413 Myanmar 0.174 Czech Republic 0.735 Peru 0.645 Cuba 0.571 Gabon 0.487 Togo 0.411 Somalia 0.133 Malta 0.733 Jamaica 0.643 Venezuela 0.561 Morocco 0.486 Bahrain 0.408 AVERAGE 0.571
58
HUMAN RIGHTS AND PARTICIPATION INDICATOR (REGIONAL RANKING IN DESCENDING ORDER)
AFRICA EU OECD LATIN AMERICA AND THE
CARIBBEAN ASIA PACIFIC ARAB STATES CIS CENTRAL ASIA BALKANS
South Africa 0.751 Sweden 0.964 Grenada 0.864 Singapore 0.575 Lebanon 0.547 Croatia 0.686
Cape Verde 0.683 Iceland 0.913 St Vincent and the Grenadines 0.773 Indonesia 0.551 Tunisia 0.460 Serbia 0.637
Mozambique 0.674 Finland 0.904 Bahamas 0.768 Papua New Guinea 0.545 United Arab Emirates 0.440 Bosnia Herzegovina 0.602 Lesotho 0.658 Denmark 0.903 Saint Lucia 0.761 India 0.537 Iraq 0.433 Montenegro 0.595
Liberia 0.643 Austria 0.860 Argentina 0.761 Salomon Islands 0.536 Jordan 0.414 Ukraine 0.594
Seychelles 0.615 Belgium 0.856 Dominica 0.731 Malaysia 0.530 Gaza / West Bank 0.413 Albania 0.579 Rwanda 0.613 New Zealand 0.854 Trinidad and Tobago 0.715 Cambodia 0.528 Bahrain 0.408 Georgia 0.548
Tanzania 0.611 Luxemburg 0.853 Belize 0.698 East Timor 0.522 Algeria 0.387 Kirghizstan 0.524
Mali 0.608 Germany 0.848 Uruguay 0.693 Fiji 0.512 Egypt 0.380 Russia 0.489 Benin 0.600 Spain 0.829 Chile 0.674 Thailand 0.488 Oman 0.373 Armenia 0.485
Senegal 0.584 Australia 0.822 Panama 0.673 Bangladesh 0.472 Sudan 0.370 Tadzhikistan 0.478
Ivory Coast 0.429 Romania 0.597 Togo 0.411 Mexico 0.589
DRC 0.381 Turkey 0.472
Equatorial Guinea 0.380 Nigeria 0.378
Zimbabwe 0.376
Central Africa Republic 0.360 Eritrea 0.349
Chad 0.325
AVERAGE 0.521 AVERAGE 0.759 AVERAGE 0.661 AVERAGE 0.447 AVERAGE 0.380 AVERAGE 0.536
59
SUSTAINABLE DEVELOPMENT APPENDIX ECONOMIC DIMENSION SUB-INDICATOR Index: GDP at PPP per capita The data is drawn from the IMF's 2008 World Economic Outlook database.38 The advantage of using the GDP at PPP (purchasing power parity) is that the monetary wealth that it takes into account is closer to reality than the GDP alone, because it gets rid of the exchange problem. The index is calculated according to the following formula with the highest value being 85,638 (for Qatar) and the lowest 120 (for Gaza / West Bank). In this specific case, the calculation differs from the method used for the Confict, Refugees / Asylum Seekers, and Freedom of the Press indexes. The idea is to take into account the fact that the highest result is a good score, whereas in the other cases the highest result is a very bad score. We have therefore subtracted the result of the following division from 1. Index: GDP Growth Rate The data for this growth rate is drawn from the IMF's 2008 World Economic Outlook database. The index was calculated according to the following formula with the highest value being 18.6 (for Azerbaijan) and the lowest -6.6 (for Zimbabwe).
Country score – Lowest score 100 - 100 x Highest score – Lowest score Index = 1-
100
Country score – Lowest score 100 - 100 x Highest score – Lowest score Index = 1-
100
60
Index: Starting a business The data is drawn from the World Bank's Doing Business report.39 The index is calculated on the basis of the data regarding the bureaucratic and legal hurdles an entrepreneur must overcome to start a commercial or industrial business (number of procedures, cost, and time, expressed in days). The index was calculated as follows: The ECONOMIC DIMENSION sub-indicator is calculated by producing the average of the three indexes in this category. SOCIAL DIMENSION SUB-INDICATOR Index: GINI coefficient (poverty and inequality) We will use the GINI coefficient as it is given in the UNDP's 2007/2008 global Human Development Report.40 The coefficient measures, per country, the difference between the actual distribution of income (or of consumption) of individuals or households in a country and a perfectly equal distribution. Absolute equality is equal to 0, and 100 represents absolute inequality. The index was then calculated as follows: Index: Basic Capabilities The data is drawn from the Social Watch Report 2008.41 This index is made up of basic indicators (education, infant health and maternal health) for which data is available in almost all the countries of the world, which makes it possible to follow closely how much countries are meeting the minimum social needs of their citizens. The results of the Social Watch survey are presented on a scale of 0 (worst score) to 100 (best score). The index was calculated as follows:
Country score – Lowest score 100 - 100 x Highest score – Lowest score Index =
100
100 - Country score Index =
100
Country score Index =
100
61
Index: Ratification of International Labor Rights T exts Information on the ratification of fundamental treaties and conventions on international labor rights is provided on the ILO Web site.42 The ILO has identified the eight following conventions as fundamental:
• Forced Labour Convention (1930) • Convention concerning Freedom of Association and Protection of the Right to
Organise (1948) • Right to Organise and Collective Bargaining Convention (1949) • Equal Remuneration Convention (1951) • Abolition of Forced Labour Convention (1957) • Discrimination (Employment and Occupation) Convention (1958) • Minimum Age Convention (1973) • Worst Forms of Child Labour Convention (1999)
We assigned 1 point for every treaty or convention that has been ratified. The highest possible total is therefore 8 points and the sub-indicator was then calculated according to the following formula: The Social Dimension sub-indicator is calculated by producing the average of the three indexes in this category. ENVIRONMENTAL DIMENSION SUB-INDICATOR Index: Ecological Footprint and Biocapacity The data is drawn from the WWF's Living Planet Report, which studies two indexes. The Ecological Footprint index measures the necessary per capita surface area (terrestrial, marine, and freshwater) to meet humankind's needs and to eliminate waste. 43 The other index, the Biocapacity index, measures the per capita surface area (in terms of agriculture, breeding, forest, and fish resources) available to meet humankind's needs. The positive or negative difference between biocapacity and ecological footprint is the basis for the index, which was calculated with the following formula:
Country score – Lowest score 100 - 100 x Highest score – Lowest score Index = 1-
100
Country score Index =
8
62
Index: Environmental Sustainability The data is drawn from Yale University's Environmental Sustainability Index.44 The Environmental Sustainability Index benchmarks the ability of nations to protect the environment over the next several decades. It does so by integrating 76 data sets that track the evolution of natural resources, past and present pollution levels, environmental-management efforts, and the capacity of a society to improve its environmental performance. It is expressed as percentage on a scale of 0 to 100, where 0 is the worst score and 100 the best, and calculation of the index that we use was as follows: Index: Environmental Performance The data is drawn from Yale University's Environmental Sustainability Index on the basis of 25 indicators grouped into six categories:45 environmental health, air pollution, aquifer resources, biodiversity and habitat, natural resources, and climate change. It is expressed as percentage on a scale of 0 to 100, where 0 is the worst score and 100 the best, and calculation of the index that we use was as follows:
The Environmental Dimension sub-indicator is the av erage of the three indexes in this category. The SUSTAINABLE DEVELOPMENT indicator is the averag e of the three previously determined sub-indicators.
The final score at the global level is the average of the 179 countries surveyed, or: 0.591
Australia 0.712 Georgia 0.647 Turkey 0.620 Fiji 0.589 Cameroon 0.564 Turkmenistan 0.521
Iceland 0.710 Argentina 0.647 Colombia 0.620 United Arab Emirates 0.589 Pakistan 0.564 DRC 0.519 New Zealand 0.705 Japan 0.644 Ukraine 0.619 Madagascar 0.589 Malawi 0.562 Salomon Islands 0.515
Canada 0.702 Panama 0.643 Malaysia 0.616 Bhutan 0.588 Central Africa Republic 0.562 Equatorial Guinea 0.515
Ireland 0.698 Chile 0.643 Tunisia 0.615 Venezuela 0.587 Cape Verde 0.555 Zimbabwe 0.514 Austria 0.689 Israel 0.641 Belize 0.615 Bahrain 0.585 Bangladesh 0.553 Kenya 0.512
Latvia 0.688 Czech Republic 0.641 Cuba 0.613 Ecuador 0.585 Mali 0.550 Togo 0.510
Denmark 0.687 Portugal 0.640 Bolivia 0.612 Serbia 0.585 São Tomé and Príncipe 0.549 Iraq 0.509 Switzerland 0.685 Albania 0.637 Brazil 0.607 Saint Lucia 0.584 Uzbekistan 0.549 Niger 0.506
Mauritius 0.648 Finland 0.741 Argentina 0.647 Singapore 0.651 Egypt 0.620 Croatia 0.658 Seychelles 0.630 Sweden 0.740 Panama 0.643 Malaysia 0.616 Tunisia 0.615 Belarus 0.655
Botswana 0.601 Australia 0.712 St Vincent and the Grenadines 0.636 Sri Lanka 0.597 Libya 0.602 Georgia 0.647 Tanzania 0.593 Iceland 0.710 Grenada 0.631 Indonesia 0.593 Oman 0.599 Albania 0.637
Malawi 0.562 Slovenia 0.672 Belize 0.615 Cambodia 0.571 Lebanon 0.571 Macedonia 0.584 Central Africa Republic 0.562 Lithuania 0.671 Cuba 0.613 Tonga 0.569 Sudan 0.549 Tadzhikistan 0.580
Cape Verde 0.555 France 0.668 Bolivia 0.612 Maldives 0.567 Yemen 0.526 Montenegro 0.571
Mali 0.550 Estonia 0.668 Brazil 0.607 Pakistan 0.564 Iraq 0.509 Uzbekistan 0.549 São Tomé and Príncipe 0.549 Netherlands 0.666 Jamaica 0.606 Bangladesh 0.553 Djibouti 0.488 Turkmenistan 0.521
Benin 0.549 Slovakia 0.664 Trinidad and Tobago 0.605 China 0.547 Gaza / West Bank 0.464
Zimbabwe 0.514 Greece 0.621 Kenya 0.512 Turkey 0.620
Togo 0.510 United States 0.594
Niger 0.506 Mexico 0.593 Eritrea 0.491 South Korea 0.593
Sierra Leone 0.485
Burkina Faso 0.470 Guinea Bissau 0.457
Liberia 0.451
Chad 0.449 Uganda 0.208
AVERAGE 0.538 AVERAGE 0.664 AVERAGE 0.605 AVERAGE 0.559 AVERAGE 0.569 AVERAGE 0.612
69
HUMAN DEVELOPMENT APPENDIX HUMAN DEVELOPMENT SUB-INDICATOR Index: Human Development The data was drawn from the UNDP's Human Development Report and we are using the full indicator as such for this survey.46 HAPPINESS AND WELL-BEING SUB-INDICATOR Index: Happiness Presented by the New Economics Foundation (NEF), this index is the result of a combination of a satisfaction index (determined on the basis of the results of an international opinion survey asking respondents to attribute their measure of satisfaction on a scale from 0 to 10), life expectancy at birth (as estimated by the UNDP in its Human Development Report), and the environmental impact as provided by the Global Footprint Network.47 The index was calculated on the basis of the NEF results and according to the following formula, with the highest value being 67.24 (for Colombia) and the lowest 16.64 (for Zimbabwe):48 Index: Well-being Also presented by the NEF, the index for personal subjective well-being is the result of a combination of economic well-being, environmental well-being, and social well-being. The index was calculated as follows with as its highest value 273 (for Denmark) and its lowest 100 (for Burundi):49
Country score – Lowest score 100 - 100 x Highest score – Lowest score Index = 1-
100
Country score – Lowest score 100 - 100 x Highest score – Lowest score Index = 1-
100
70
Index: Quality of Life Developed by International Living, the 2008 Quality of Life index considers the following parameters:50 Cost of Living, Culture and Leisure, Economy, Environment, Freedom, Health, Infrastructure, Safety and Risk, and Climate. It is expressed on a scale of 0 to 100, where 0 is the worst score and 100 the best, and calculation of the index that we use was as follows: The Happiness and Well-being sub-indicator is calcu lated by producing the average of the three indexes in this category.
The HUMAN DEVELOPMENT indicator is the average of t he three previously determined sub-indicators.
The final score at the global level is the average of the 179
Costa Rica 0.848 Saint Lucia 0.768 Fiji 0.714 Lithuania 0.648 East Timor 0.548 Eritrea 0.411 Netherlands 0.843 Venezuela 0.767 Hungary 0.711 Salomon Islands 0.647 Papua New Guinea 0.542 Swaziland 0.406 Denmark 0.841 Cuba 0.767 Bahrain 0.711 Uzbekistan 0.646 Cambodia 0.542 Guinea Bissau 0.401 Italy 0.830 Brunei 0.765 Grenada 0.711 Serbia 0.642 Madagascar 0.539 Mozambique 0.400
Canada 0.828 Israel 0.763 Jamaica 0.708 Turkey 0.640 Nepal 0.538 Mali 0.397 Malta 0.827 Uruguay 0.763 Paraguay 0.707 Macedonia 0.639 Yemen 0.535 Zambia 0.393 Germany 0.825 Malaysia 0.763 Oman 0.706 Albania 0.634 Ukraine 0.535 Malawi 0.389 New Zealand 0.825 St Vincent and the Grenadines 0.754 Sri Lanka 0.703 Kazakhstan 0.632 Botswana 0.535 Angola 0.383 Belgium 0.824 Tonga 0.754 Saudi Arabia 0.703 Estonia 0.631 Myanmar 0.534 Rwanda 0.382
Norway 0.823 Dominican Republic 0.751 Nicaragua 0.697 Montenegro 0.631 Laos 0.527 Ethiopia 0.379 Sweden 0.819 Greece 0.748 Kuwait 0.697 Jordan 0.629 Moldavia 0.523 Ivory Coast 0.371 Spain 0.816 Singapore 0.747 Indonesia 0.696 Latvia 0.629 Congo 0.518 Sudan 0.370 Finland 0.814 Surinam 0.745 Viet Nam 0.694 Bolivia 0.628 Haiti 0.501 Iraq 0.366
Ireland 0.810 South Korea 0.742 Maldives 0.694 Morocco 0.626 Gambia 0.499 Burkina Faso 0.354 Panama 0.809 Trinidad and Tobago 0.742 Ecuador 0.692 Bulgaria 0.619 Senegal 0.496 Central Africa Rep. 0.353 Australia 0.808 Belize 0.738 United Arab Emirates 0.689 Namibia 0.613 Kenya 0.492 Liberia 0.339 Colombia 0.805 Czech Republic 0.737 Peru 0.687 Algeria 0.608 Mauritania 0.489 Niger 0.339
Dominica 0.805 Guyana 0.733 Slovakia 0.685 Syria 0.600 Turkmenistan 0.486 Zimbabwe 0.336 Barbados 0.804 Honduras 0.732 Kirghizstan 0.685 Azerbaijan 0.593 Equatorial Guinea 0.485 Chad 0.333 France 0.798 Portugal 0.731 São Tomé and Príncipe 0.675 Gabon 0.592 Gaza / West Bank 0.462 Sierra Leone 0.324 Argentina 0.797 Tunisia 0.729 Bhutan 0.673 Georgia 0.588 Pakistan 0.459 Afghanistan 0.296 United Kingdom 0.796 Mauritius 0.728 Qatar 0.673 Egypt 0.577 Togo 0.457 DRC 0.293
United States 0.796 El Salvador 0.725 Mongolia 0.669 Comoros 0.577 Cameroon 0.457 Burundi 0.284 Seychelles 0.791 Brazil 0.725 Romania 0.658 India 0.574 Benin 0.455 North Korea 0.269 Japan 0.785 Thailand 0.724 Cape Verde 0.657 South Africa 0.569 Tanzania 0.451 Somalia 0.233 Slovenia 0.781 Croatia 0.721 Libya 0.652 Ghana 0.568 Nigeria 0.434 AVERAGE 0.627
75
HUMAN DEVELOPMENT INDICATOR (REGIONAL RANKING IN DESCENDING ORDER)
AFRICA EU OECD LATIN AMERICA AND THE
CARIBBEAN ASIA PACIFIC ARAB STATES CIS CENTRAL ASIA BALKANS
Mauritius 0.728 Iceland 0.863 Panama 0.809 Malaysia 0.763 Bahrain 0.711 Kirghizstan 0.685 São Tomé and Príncipe 0.675 Austria 0.857 Colombia 0.805 Tonga 0.754 Oman 0.706 Tadzhikistan 0.649
Cape Verde 0.657 Luxemburg 0.852 Dominica 0.805 Singapore 0.747 Saudi Arabia 0.703 Bosnia Herzegovina 0.649
Namibia 0.613 Netherlands 0.843 Barbados 0.804 Thailand 0.724 Kuwait 0.697 Uzbekistan 0.646 Gabon 0.592 Denmark 0.841 Argentina 0.797 Philippines 0.719 United Arab Emirates 0.689 Serbia 0.642
Austria 0.839 South Korea 0.728 Dominican Republic 0.645 Armenia 0.615 Uzbekistan 0.571 Turkmenistan 0.508 Australia 0.830 Grenada 0.728 Cuba 0.645 Indonesia 0.614 Malawi 0.570 Sierra Leone 0.506 Switzerland 0.829 Seychelles 0.721 Surinam 0.644 Viet Nam 0.613 Papua New Guinea 0.570 Burundi 0.501 Germany 0.824 Lithuania 0.718 Bahrain 0.644 Montenegro 0.612 Libya 0.570 Pakistan 0.495 Canada 0.818 Slovakia 0.716 Kirghizstan 0.644 Thailand 0.610 Cambodia 0.570 Nigeria 0.489
Ireland 0.807 Greece 0.715 El Salvador 0.643 Madagascar 0.610 Bhutan 0.567 Ivory Coast 0.489 Belgium 0.804 Poland 0.709 Ghana 0.642 Philippines 0.609 Zambia 0.561 Haiti 0.488 United Kingdom 0.793 Cape Verde 0.708 Brazil 0.642 Georgia 0.609 Laos 0.560 Angola 0.482 Spain 0.791 Argentina 0.706 São Tomé and Príncipe 0.640 Tadzhikistan 0.609 Congo 0.559 Uganda 0.475
Barbados 0.784 Belize 0.705 Moldavia 0.639 Brunei 0.603 Saudi Arabia 0.558 Eritrea 0.472 France 0.778 Latvia 0.702 Kuwait 0.638 Venezuela 0.602 Rwanda 0.556 Liberia 0.472 Japan 0.774 Panama 0.700 Botswana 0.637 Senegal 0.601 Burkina Faso 0.549 Central Africa Republic 0.461 Malta 0.767 Croatia 0.698 Serbia 0.632 Tanzania 0.595 Syria 0.548 Zimbabwe 0.461
Costa Rica 0.764 Israel 0.678 Honduras 0.632 Belarus 0.595 Guinea 0.546 Myanmar 0.446 United States 0.761 Bulgaria 0.676 Paraguay 0.632 Guatemala 0.595 India 0.543 Chad 0.436 Bahamas 0.761 Romania 0.668 United Arab Emirates 0.630 Benin 0.593 Kenya 0.541 North Korea 0.423 Portugal 0.760 Mongolia 0.665 Bolivia 0.628 Egypt 0.591 Nepal 0.540 Gaza / West Bank 0.421 Chile 0.758 Trinidad and Tobago 0.665 Bosnia Herzegovina 0.625 Lebanon 0.590 Bangladesh 0.537 DRC 0.419
Slovenia 0.755 Peru 0.660 Ecuador 0.625 Colombia 0.589 Swaziland 0.536 Sudan 0.417 Cyprus 0.752 Namibia 0.659 Salomon Islands 0.624 South Africa 0.589 Iran 0.536 Iraq 0.402 St Vincent and the Grenadines 0.751 Guyana 0.659 Maldives 0.624 China 0.588 Yemen 0.536 Somalia 0.290 Mauritius 0.748 Malaysia 0.658 Oman 0.623 Mozambique 0.586 Niger 0.532 AVERAGE 0.632
77
WORLD GOVERNANCE INDICATOR (REGIONAL RANKING IN DESCENDING ORDER)
AFRICA EU OECD LATIN AMERICA AND THE
CARIBBEAN ASIA PACIFIC ARAB STATES CIS CENTRAL ASIA BALKANS
Ghana 0.642 Denmark 0.856 St Vincent and the Grenadines 0.751 Salomon Islands 0.624 United Arab Emirates 0.630 Moldavia 0.639 São Tomé and Príncipe 0.640 Luxemburg 0.846 Uruguay 0.748 Maldives 0.624 Oman 0.623 Serbia 0.632
Botswana 0.637 New Zealand 0.846 Saint Lucia 0.729 Tonga 0.620 Jordan 0.619 Bosnia Herzegovina 0.625
Lesotho 0.621 Netherlands 0.845 Dominica 0.729 Indonesia 0.614 Morocco 0.616 Ukraine 0.622 Gabon 0.618 Austria 0.839 Grenada 0.728 Viet Nam 0.613 Egypt 0.591 Montenegro 0.618
Madagascar 0.610 Australia 0.830 Argentina 0.706 Thailand 0.610 Lebanon 0.590 Kazakhstan 0.615
Benin 0.593 Canada 0.818 Trinidad and Tobago 0.665 China 0.588 Saudi Arabia 0.558 Tadzhikistan 0.609
South Africa 0.589 Ireland 0.807 Peru 0.660 Sri Lanka 0.575 Syria 0.548 Belarus 0.595 Mozambique 0.586 Belgium 0.804 Guyana 0.659 Papua New Guinea 0.570 Yemen 0.536 Russia 0.577
Gabon Sudan Myanmar Turkmenistan Guatemala Ireland
Gambia Syria Nepal Ukraine Guyana Israel
Ghana Tunisia North Korea Uzbekistan Haiti Italy
Guinea United Arab Emirates Pakistan Honduras Japan
Guinea Bissau Yemen Papua Jamaica Latvia
Ivory Coast Philippines Nicaragua Lithuania
Kenya Salomon Islands Panama Luxemburg
Lesotho Singapore Paraguay Malta
Liberia Sri Lanka Peru Mexico
Madagascar Thailand Saint Lucia Netherlands
Malawi Tonga Saint Vincent and the Grenadines New Zealand
Mali Viet Nam Surinam Norway
Mauritania Trinidad and Tobago Poland
Mauritius Uruguay Portugal
Mozambique Venezuela Romania
Namibia Slovakia
Niger Slovenia
Nigeria South Korea
Rwanda Spain
São Tomé and Príncipe Sweden
Senegal Switzerland
Seychelles Turkey
Sierra Leone United Kingdom
South Africa United States
Swaziland
Tanzania
Togo
Uganda
Zambia
Zimbabwe
81
COPYRIGHT APPENDIX
You are free:
to Share – to copy, distribute, display, and perform the work
to Remix – to make derivative works
Under the following conditions:
Attribution. You must attribute the work in the manner specified by the author or licensor (but not in any way that suggests that they endorse you or your use of the work).
Noncommercial. You may not use this work for commercial purposes.
Share Alike. If you alter, transform, or build upon this work, you may distribute the resulting work only under the same or similar license to this one.
• For any reuse or distribution, you must make clear to others the license terms of this work.
• Any of the above conditions can be waived if you get permission from the copyright holder.
• Nothing in this license impairs or restricts the author's moral rights.
This is a human-readable summary of the Legal Code. See the full license (in French): http://creativecommons.org/licenses/by-nc-sa/2.0/fr/legalcode