WORLD POPULATION & ENVIRONMENTAL IMPACT Thomas Robert Malthus (1766-1834) English Economist: Essay on the Principle of Population (1798) Population increases faster than food supply Poverty is Inevitable Great influence on Charles Darwin Origin of Species (1859) Survival of the Fittest Led to Social Darwinism- justification for social & economic stratification; racial supremacy Objections: New regions exist Scientific & technological progress Economists vs. Biologists Thomas Malthus 1766-1834 Wilkimedia Charles Darwin 1809-1882 Dibner Library
Transcript
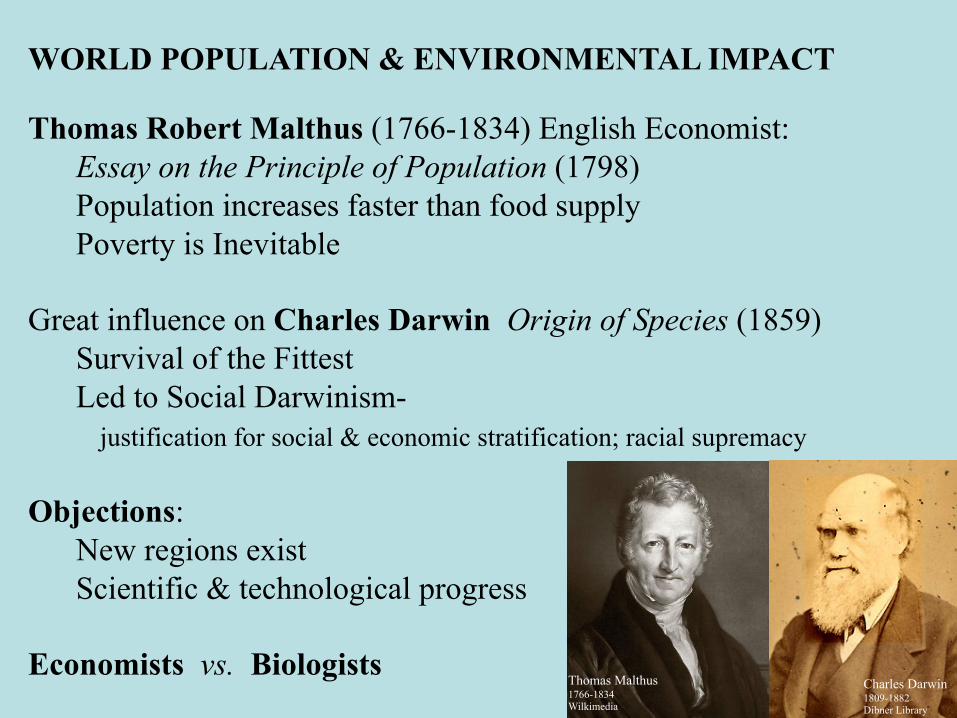
WORLD POPULATION & ENVIRONMENTAL IMPACT Thomas Robert Malthus (1766-1834) English Economist:
Essay on the Principle of Population (1798) Population increases faster than food supply Poverty is Inevitable
Great influence on Charles Darwin Origin of Species (1859)
Survival of the Fittest Led to Social Darwinism- justification for social & economic stratification; racial supremacy
Objections:
New regions exist Scientific & technological progress
Economists vs. Biologists
Thomas Malthus 1766-1834 Wilkimedia
Charles Darwin 1809-1882 Dibner Library
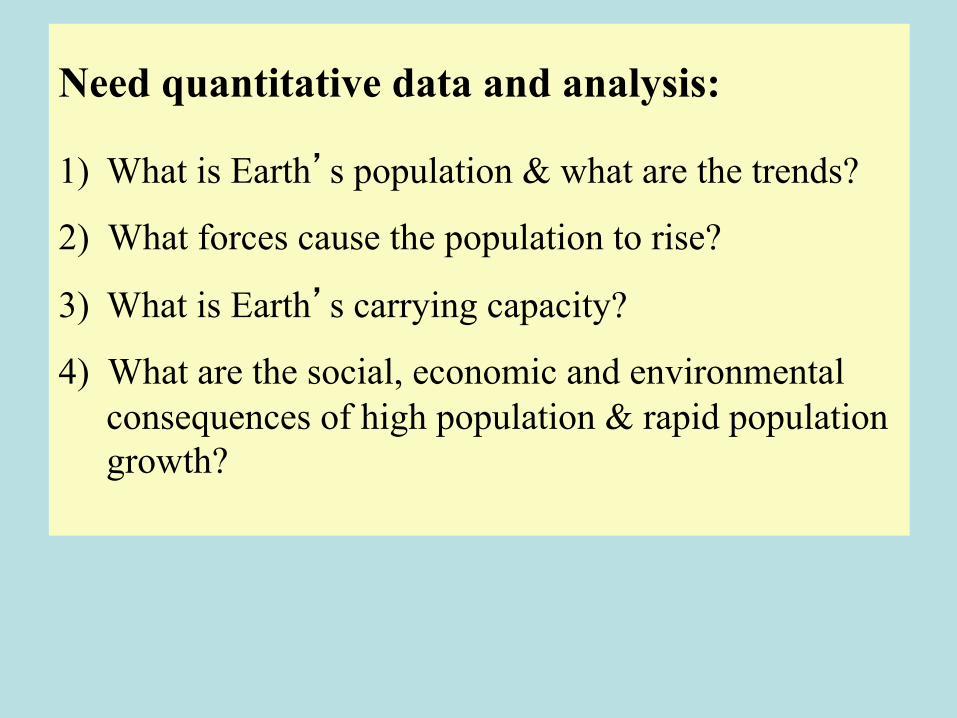
Need quantitative data and analysis:
1) What is Earth’s population & what are the trends?
2) What forces cause the population to rise?
3) What is Earth’s carrying capacity?
4) What are the social, economic and environmental consequences of high population & rapid population growth?
Jan 18, 2017 8:32A
Feb 1, 2017 8:32A
http://www.census.gov/popclock/
Need quantitative data and analysis:
1) What is Earth’s population & what are the trends? World USA
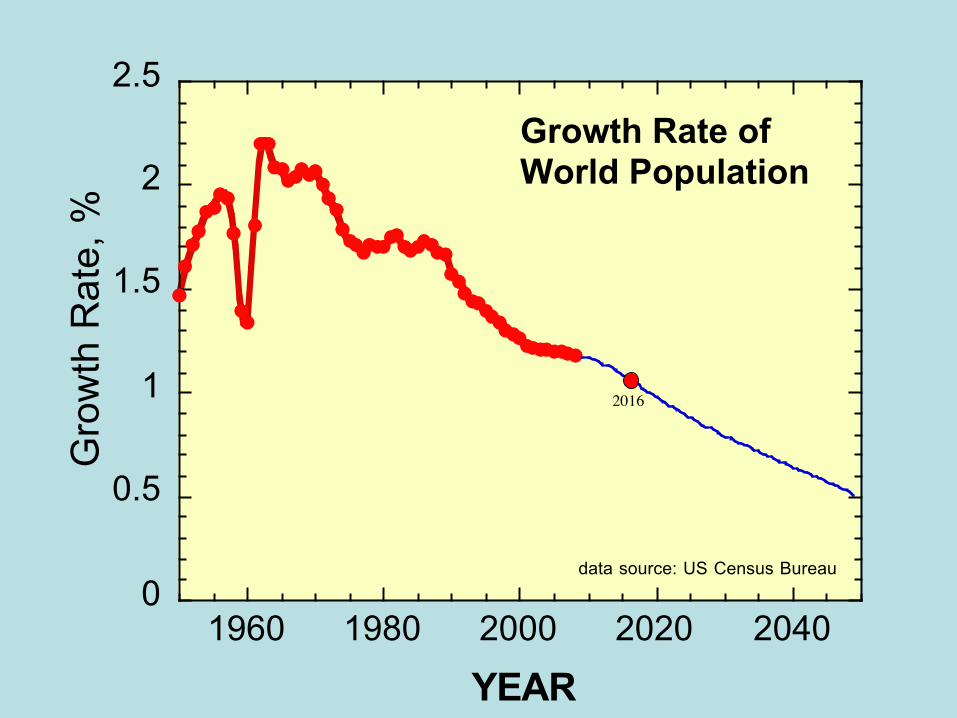
Food availability Death rates decline: Improved public health, sanitation, medical advance, declining infant mortality. Birth rates and death rates/1000 are both declining, but the far higher birth rate forces population to rise. 2016 World Birth Rate 18.5/1000 Death Rate 7.8/1000
0.00 ∞0.10 6930.25 277.0.50 139.0.75 92.41.00 69.31.07 64.8 World Average 20161.50 46.21.89 36.7 World Average 1950-1990
2.00 34.72.50 27.73.00 23.13.50 19.84.00 17.3
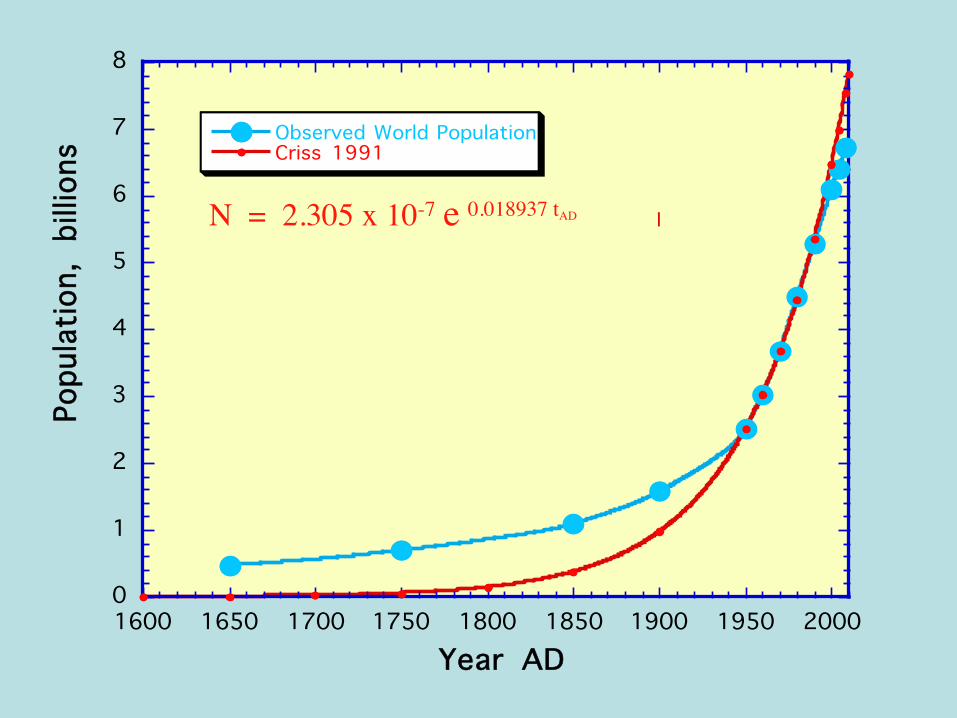
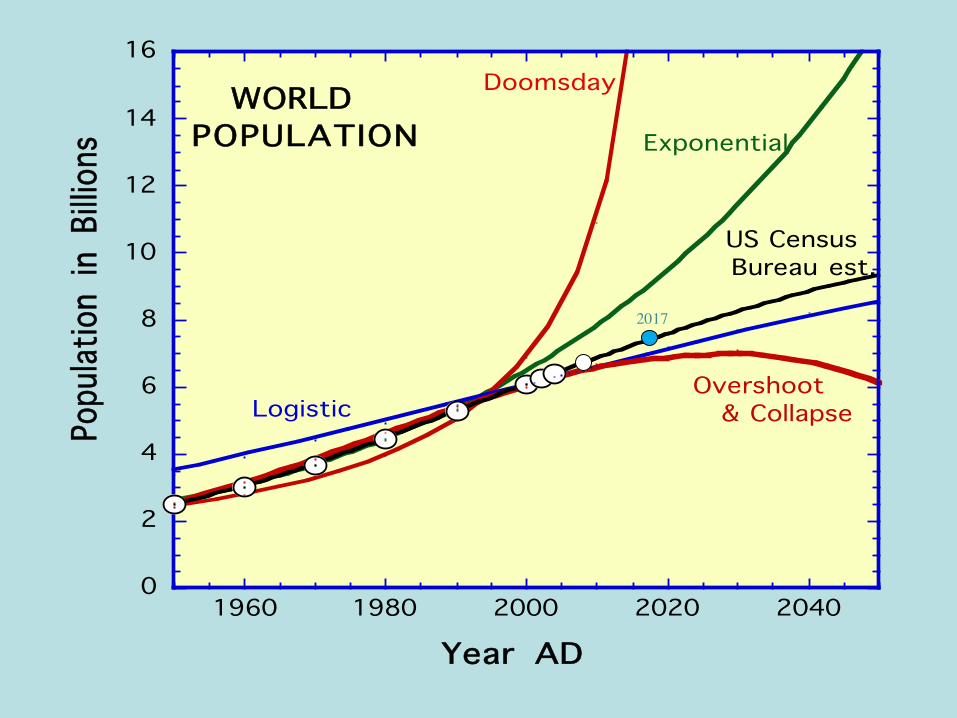
EXPONENTIAL N = No Exp(+bt)
€
N = 2.305×10⁻⁷( )Exp(+0.018937 × tAD ) Criss (1991, unpub.)
DOOMSDAY
€
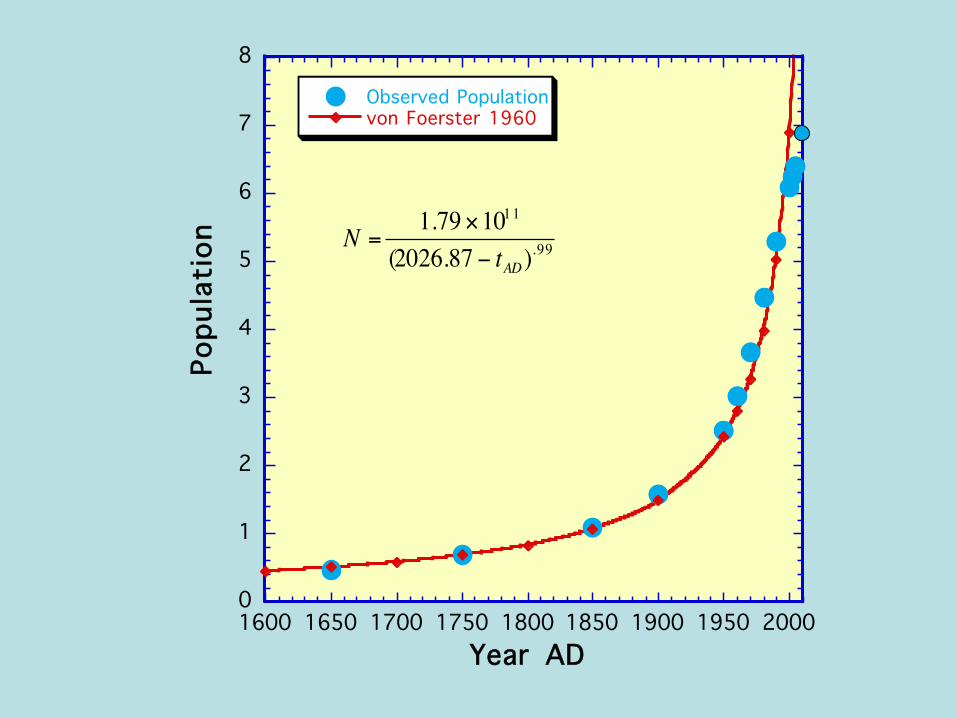
N =1.79 ×101 1
(2026.87 − tAD).99 von Foerster et al. (1960)
LOGISTIC
€
1N
=1No
−1Ncc
$
% &
'
( ) Exp(−bt)
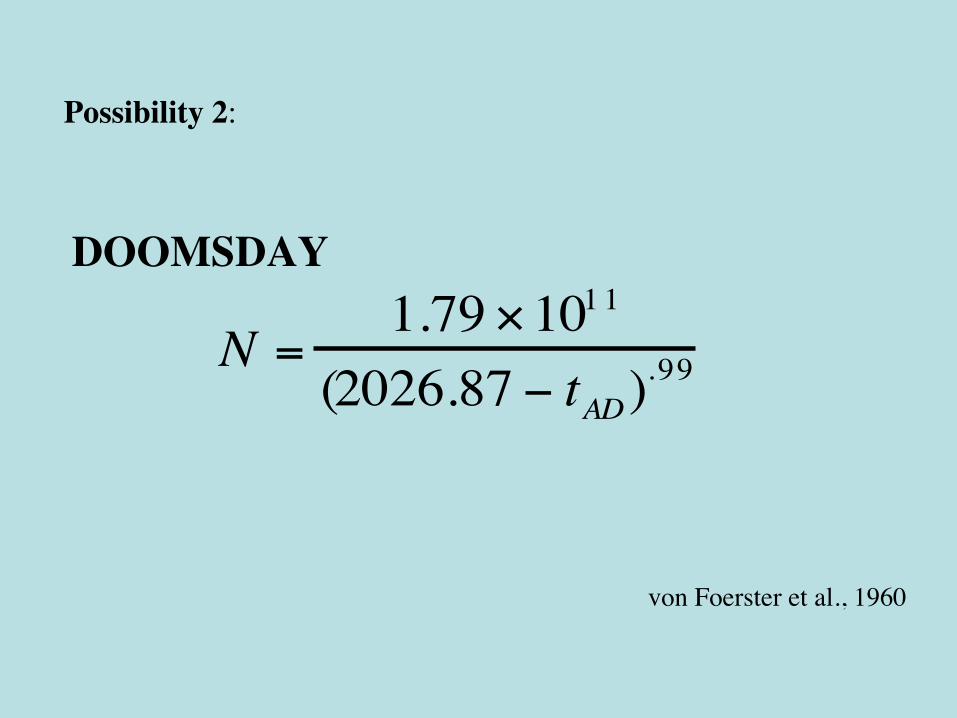
Possibility 2:
von Foerster et al., 1960
0
1
2
3
4
5
6
7
8
1600 1650 1700 1750 1800 1850 1900 1950 2000
Observed Populationvon Foerster 1960
Popu
lati
on
Year AD
€
N =1.79×10¹¹
(2026.87 − tAD).99
Possibility 2: Doomsday Best overall fit to historical human population. Predictions made 40 years ago exceed current observed population. Equation predicts infinite population in 2026.87 AD
= Friday, Nov. 13, 2026 !
EXPONENTIAL N = No Exp(+bt)
€
N = 2.305×10⁻⁷( )Exp(+0.018937 × tAD ) Criss (1991, unpub.)
DOOMSDAY
€
N =1.79 ×101 1
(2026.87 − tAD).99 von Foerster et al. (1960)
LOGISTIC
€
1N
=1No
−1Ncc
$
% &
'
( ) Exp(−bt)
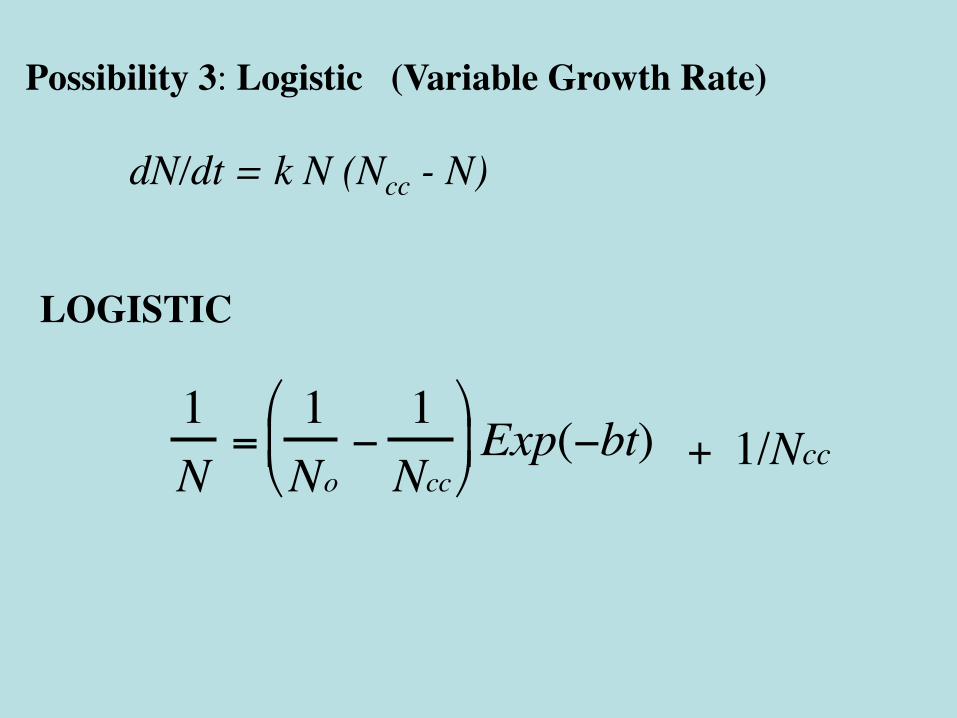
Possibility 3: Logistic (Variable Growth Rate)
dN/dt = k N (Ncc - N)
EXPONENTIAL N = No Exp(+bt)
€
N = 2.305×10⁻⁷( )Exp(+0.018937 × tAD ) Criss (1991, unpub.)
DOOMSDAY
€
N =1.79 ×101 1
(2026.87 − tAD).99 von Foerster et al. (1960)
LOGISTIC
€
1N
=1No
−1Ncc
$
% &
'
( ) Exp(−bt) + 1/Ncc
Carrying Capacity
Size of population that can be indefinitely sustained by the environment.
Not necessarily fixed Estimates can be based on: Cultivated land = 1.73 billion ha (CIA)
Arable land = 1.58 billion ha (CIA)
Arable land = 3.2 billion ha =7.9x10⁹ ac
Catholic Church => 40 billion (Cohen, p.188)
0
2
4
6
8
10
12
14
1600 1700 1800 1900 2000 2100 2200 2300
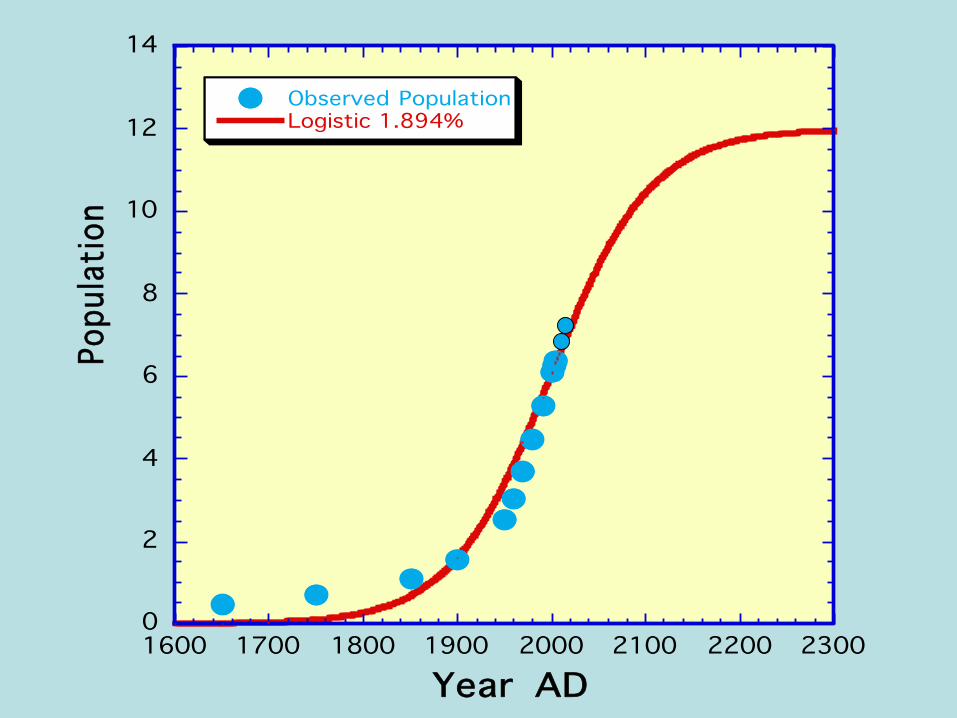
Observed PopulationLogistic 1.894%
Popu
latio
n
Year AD
Possibility 4: Overshoot & Collapse Degrade resource base => Lower standard of living
Delays in response
Meadows et al. 1992
EARTH’S POPULATION WILL Level off ? Logistic curve Undergo Overshoot & Collapse? due to delays in response Where are our leaders? cf. current political dialogue The population explosion is usually discussed as something that will occur in the future, but it is evident that it is upon us now!
June 26, 2008 Bush and the U.N. Population Fund By NICHOLAS D. KRISTOF
President Bush said today that he would withhold all U.S. funds for the U.N. Population Fund for the seventh straight year. …… Most important, UNFPA convinced China in 1992 to switch to a more effective but more expensive IUD, averting half a million abortions each year, 5 million abortions a decade. Does any anti-abortion group have that good a record? One of the major challenges around the world is the need for family planning, as well as assistance in fighting AIDS and maternal mortality. That’s UNFPA’s cause, and it’s appalling that the U.S. is for the seventh straight year boycotting this worthy effort.
NYT
Jan 24, 2017 Trump reverses abortion policy for aid to NGOs (=NGOs cannot receive funding) (CNN)
Jan 31, 2017 Neil Gorsuch, the Nominee for a Stolen Seat …... spells big trouble for public-sector labor unions, environmental regulations and women’s access to contraception NYT Editorial Board