13
2006 WORLD TRADE REPORT Exploring the links between subsidies, trade and the WTO

2006WORLD TRADE REPORT
Exploring the links between subsidies, trade and the WTO

i R
ECEN
T TR
AD
E D
EVEL
OPM
ENTS
A
ND
SEL
ECTE
D T
REN
DS
iN T
RA
DE
a
reC
eNt
treN
dS
IN IN
terN
atI
oN
al
tra
de
wo
rld
tr
ad
e r
epo
rt
200
6
1
i RECENT TRADE DEVELOPMENTS AND SELECTED TRENDS iN TRADE
A RECENT TRENDS iN iNTERNATiONAL TRADE
1. iNTRODUCTiON : TRADE AND OUTPUT GREW LESS RAPiDLY iN 2005 ThAN iN ThE PRECEDiNG YEAR
the world economy expanded by 3.3 per cent in 2005, less rapidly than in 2004, but still slightly faster than the decade average. economic growth remained strong in most regions although less buoyant than in the preceding year. only europe’s economy continued to record low Gdp growth – less than half the rate observed in North america. In contrast to europe, Japan experienced a strengthening of economic activity. In light of slower economic growth worldwide in 2005 and of oil market developments, merchandise trade growth – like Gdp growth – decelerated in real terms, but still exceeded the average for the last decade.
the trade deceleration was most pronounced in the developed, oil-importing regions. real merchandise imports of the United States, the european Union (25) and Japan grew at half the 2004 rate in 2005 and less than the global average. Most of the developing regions and the Commonwealth of Independent States (CIS) recorded real import growth rates above the global average and in excess of their export growth. oil price increases are a significant part of the explanation for this performance in many of the countries concerned.
Sharply higher crude oil prices pushed up energy costs worldwide but did not trigger a marked rise in consumer prices as it happened in the previous two major oil crisis in 1973/75 and 1979/81. Several factors contributed to this outcome. first, many developed countries today have a lower oil intensity of output than three decades ago, as the services sector accounts for a larger part of Gdp. Second, the slack in production capacity combined with moderate wage increases in many developed regions lowered the possibility of passing on higher energy costs to consumers. Core consumer price inflation – that is all items excluding energy and food – decreased in the euro area and the United States and stagnated in Japan in 2005.1
the maintenance of moderate consumer price inflation occurred in a policy environment in which monetary and fiscal policy continued to be stimulative. In a number of countries, however, inflationary tendencies could be observed in house prices and perhaps also in the stock market. the sharp rise in gold prices, to a 24 year peak level, might be also driven in part by demand from investors looking to hedge their assets against inflation.
fiscal deficits in major developed economies remained high in 2005. although the United States reduced somewhat its public sector deficit to Gdp ratio, at 3.5 per cent it was still larger than that of the euro area. Japan’s fiscal deficit, the largest among the major developed countries, stagnated at 6.5 per cent of Gdp in 2005.
the further increase in the US current account deficit, to a new peak level in absolute (US$805 billion) and relative terms (6.5 per cent of Gdp) was financed without any strains on international capital markets. oil market developments contributed significantly to the widening of the US external imbalance, while the impact of exchange rate developments were mixed. the moderate rise in US interest rates and the (at least temporarily) increased demand for dollars linked to higher oil prices led to an appreciation of the US dollar against the yen, the euro and the pound in the course of 2005. against a trade weighted group of seven major currencies, the US dollar depreciated 2 per cent on a yearly average basis in 2005, but it appreciated 7 per cent from december 2004 to december 2005.2 on balance, exchange rate developments in 2005 did not contribute to a reduction of the core element of the global imbalances, which are found in the trade flows between the United States and east asia. In late 2005 and early 2006, most trade and price indicators point to a further widening in the United States current account deficit in the coming year.
one of the most challenging questions in the current global economic situation is for how long the increase in the United States current account deficit can continue. Most observers agree that it would be preferable if existing imbalances could be stabilized and gradually reduced, as this would smoothen the inevitable adjustment process. a further rise in global external imbalances may be increasing the risk of a sudden
1 oeCd, Main economic Indicators.
2 US department of Commerce, Bea, News release March 14, 2006.

i R
ECEN
T TR
AD
E D
EVEL
OPM
ENTS
A
ND
SEL
ECTE
D T
REN
DS
iN T
RA
DE
a
reC
eNt
treN
dS
IN IN
terN
atI
oN
al
tra
de
wo
rld
tr
ad
e r
epo
rt
200
6
2
disruptive reduction in the imbalances. Such an abrupt adjustment, accompanied by large exchange rate variations would be more painful and generate larger welfare losses than a more gradual adjustment. In a scenario with disruptive adjustments, protectionist pressures are likely to increase, which if translated into restrictive measures would also have a negative affect on global economic activity.
2. TRADE AND OUTPUT GROWTh iN 2005
as already noted, despite an acceleration of global economic activity and trade in the course of the year, annual average changes in world output and trade were lower than in the preceding year although higher that the decade’s average. world economic output of goods and services is estimated to have expanded by 3.3 per cent and real merchandise exports rose by 6 per cent in 2005 (table 1). the year-to-year deceleration of global economic output and trade was rather close to the predictions made in early 2005. However, at the more disaggregated level the actual outcome deviated from projections, but the impact of these deviations on output and trade tended to offset each other. the negative impact of higher than predicted oil prices on global output and trade in 2005 was partly offset by more resilience than expected to the oil price hikes, illustrated, for example, by the stronger than projected economic activity in Japan.
a regional breakdown of the world economy reveals that the sluggishness of the european economy constituted the major drag on world trade and output growth as europe continued to report the weakest trade and output expansion of all regions. the four largest economies in europe (Germany, france, the United Kingdom and Italy) all recorded Gdp growth below
2 per cent, while the new Members of the european Union continued to grow faster than the old Members, with a combined Gdp growth up by 4 per cent in 2005.
North america’s Gdp growth of 3.4 per cent continued to exceed slightly global economic growth (measured at market exchange rates). within the region, the US economy recorded the strongest growth.
economic growth in the developing regions remained robust in 2005, though somewhat less dynamic than in the preceding year. In South and Central america (including the Caribbean), africa and the Middle east, Gdp growth averaged between 4 and 5 per cent. for each region these growth rates in 2005 exceeded their respective short-term (2000-05) and the medium term (1995-05) growth performance. developing asia did not escape the global trend to more moderate growth in 2005. However, with regional Gdp growth up by 6.5 per cent, developing asia again recorded the highest growth of all developing regions. China and India, the two countries with the largest populations in the world, again reported outstandingly high Gdp growth in 2005 – at 9.9 per cent and 7.1 per cent respectively.
the strongest economic growth of all regions in 2005 was reported by the Commonwealth of Independent States (CIS). Substantial gains from sharply higher export earnings stimulated public and private expenditure and led to Gdp growth of 6.6 per cent in 2005, twice the global average. Since the financial crisis of 1998, the annual economic growth of the region exceeded that of the world economy and averaged at nearly 7 per cent over this six-year period. the marked expansion in the output of the region’s energy sector contributed much to this development.
Table 1Worldtradeandoutputdevelopments,2002-05(At constant prices, annual percentage change)
2002 2003 2004 2005
Merchandise exports 3.5 5.0 9.5 6.0Merchandise production
0.8 3.5 4.0 ...
Gdp at market exchange rates
1.7 2.6 4.0 3.1
Gdp at ppp 3.0 4.0 5.1 4.3
Source: wto; IMf, world economic outlook.

i R
ECEN
T TR
AD
E D
EVEL
OPM
ENTS
A
ND
SEL
ECTE
D T
REN
DS
iN T
RA
DE
a
reC
eNt
treN
dS
IN IN
terN
atI
oN
al
tra
de
wo
rld
tr
ad
e r
epo
rt
200
6
3
developments in the world energy markets not only impacted on regional economic growth, but also shaped global trade flows.3 the most visible sign of the change in global energy markets is the substantial rise in fuel prices and, in particular, the price of crude oil since 2003. these price developments are caused by major shifts in global oil demand. following the recession of 2001/02, a strong increase in global oil demand could be observed. robust economic growth in the United States and vigorous energy-intensive growth in major emerging economies (especially China) were key factors.4 Strong oil demand in the US economy led to a sharp rise in its oil imports, as domestic crude oil production continued to shrink. the strength of oil demand in many emerging markets was underpinned by the high energy intensity of this growth. recently, oil demand has been artificially sustained in some of these markets as end user prices were not fully adjusted to reflect the rise of energy prices in international markets.
High global oil demand growth quickly absorbed the existing excess oil extraction capacity, located mainly in the Middle east. production capacity problems were not limited to the production of crude oil but occurred also at the refinery level. even a doubling of oil prices between 2003 and 2005 did not lead to a significant increase in global oil production capacity. the low short-term price elasticity of oil supplies is due to the fact that additions of new capacity require an increase in drilling activities and investments in oilfield developments which need a lead time of several years before production capacity goes up. In addition, declining yields in operational oilfields have been observed in the United States and the North Sea. Investment plans in new oilfields might also have been delayed due to oil price volatility over the past few years.
exceptional temporary factors also contributed to oil price developments in 2005. Hurricanes in the Gulf of Mexico (especially rita and Katrina) damaged oil industry installations in the region and according to oeCd estimates, led to the temporary closure of 3 per cent of global oil production capacity and 2 per cent of the world’s oil refinery capacity.5 the repercussions of this severe disruption in production, refining and distribution could be contained by releasing oil from the strategic petroleum reserves and opeC’s offer to make all its spare production capacity available to meet market demand.
what have been the major consequences of these oil market developments for output on trade? the further sharp rise in oil prices in 2005 occurred at a time of generally low inflation. this meant that changes in the nominal price of oil were reflected in higher real and relative prices. Chart 1 illustrates this situation. prices of fuels and other mining products in each of the three economies depicted in Chart 1 rose by more than one-third, while the import prices of agricultural and manufactured goods nearly stagnated or increased moderately in 2005.
the negative impact of the oil price hike on world economic growth has so far been less far-reaching than observed in the past and predicted by most model simulations.6 four explanations can be offered for this more benign outcome: first, the recent oil price hikes originate from the strength of oil demand and not from a disruption of oil supplies, which is considered to be less damaging to economic activity. a second factor is the reduced oil-intensity of Gdp growth in oeCd countries caused by efficiency improvements in energy use and a shift in output towards services, which are less energy intensive than other sectors. this was not fully taken into account in the simulations. the third proposition is that the oil exporters spend their increased export earnings faster on imports of goods and services than in previous oil crises. finally, it is suggested that the oil exporters have invested their increased net wealth in US corporate and government bonds, and not in more liquid assets, which has helped to limit the rise in long-term interest rates and thereby sustained investment and consumption.7
3 for a more detailed review of oil market developments see Iea, world energy outlook.
4 International energy agency, oil Market report. a monthly oil market and stocks assessment.
5 Calculations provided in oeCd, oeCd economic outlook, december 2005 p.6.
6 IMf (2000) The impact of higher oil prices on the global economy; Iea (2004) Analysis of the impact of high oil prices on the global economy in IEA, Energy Prices and Taxes, 2nd quarter 2004 and IMf (2003) world economic outlook, april 2003.
7 oeCd, oeCd economic outlook, december 2005.

i R
ECEN
T TR
AD
E D
EVEL
OPM
ENTS
A
ND
SEL
ECTE
D T
REN
DS
iN T
RA
DE
a
reC
eNt
treN
dS
IN IN
terN
atI
oN
al
tra
de
wo
rld
tr
ad
e r
epo
rt
200
6
4
the repercussion of oil market developments on international trade flows are large in terms both of the sectoral composition of merchandise trade and regional trade flows. the share of fuels in world merchandise exports rose to a twenty-year high and oil exporting countries and regions have recorded double-digit export increases over the last three years (Chart 2).
the dynamic growth in nominal exports of the oil exporting regions over the last three years resulted in a much larger share of these countries in world trade. It is striking to see how closely the share of these countries/regions is linked to oil price developments over the last 35 years. Chart 3 reveals that the peak of the real oil prices in 1974, 1990 and 2005 match closely the peak levels of the share of both the Middle east and africa in world merchandise exports. the trough levels of oil prices in 1978, 1988 and 1998 coincide also with those in these regions’ export shares.
Chart 1Importpricesofmajorproductgroupsinselectedeconomies,2005(Annual percentage change)
Source: wto.
-5
0
5
10
15
20
25
30
35
Fuels and other mining products Agricultural products Manufactures
United States
Germany
Japan
Chart 2Shareoffuelsandotherminingproductsinworldmerchandiseexports,1970-2005(Percentages)
Source: wto.
0
5
10
15
20
25
30
1970 1975 1980 1985 1990 1995 2000 2005

i R
ECEN
T TR
AD
E D
EVEL
OPM
ENTS
A
ND
SEL
ECTE
D T
REN
DS
iN T
RA
DE
a
reC
eNt
treN
dS
IN IN
terN
atI
oN
al
tra
de
wo
rld
tr
ad
e r
epo
rt
200
6
5
the counterpart of the oil exporters’ gains from higher oil prices are found in higher fuel import values of the net oil importing countries. However, as fuels account for a far lower share in their imports than in the exports of fuels exporting countries, the repercussion is more prominently seen in the evolution of the trade balances. the largest net importers of fuels are the european Union (25), Japan, the Unites States, the republic of Korea and China. all these economies recorded a larger deficit or a reduced surplus in their current account as the value of their imports rose faster than exports, with the notable exception of China.
as energy is an important input in the production process, higher oil prices are passed on to other product groups and services in varying degrees, depending mainly on the energy intensity of these goods and services. prices of steel and petrochemicals rose faster than those of less energy-intensive manufactured goods. prices for transportation services also increased faster than those for travel and other commercial services over the last two years.
while higher trade prices tend to lead to a larger value share in the short run, the adverse effect on demand growth is likely to erode these gains in the medium and longer term. the impact of oil market developments is not limited to the sectoral and regional distribution of trade. the rise in transportation costs also has an overall impact on global trade. products and services with a high freight cost component in their value will be more affected than other goods and services. therefore, long distance trade flows and low value-added goods are in general more vulnerable to the rise in transportation costs.
3. REAL MERChANDiSE TRADE DEVELOPMENTS BY REGiON iN 2005
all regions participated in the deceleration of world merchandise trade, as each major region expanded its real merchandise imports in 2005 less rapidly than in 2004. the expansion of imports of the oil-importing developed countries – Japan, the european Union (25) and the United States in 2005 was less than half the rate recorded in 2004. while US imports rose less than world trade they still expanded twice as fast as those of the european Union (table 2).
linked to its sluggish economic performance, europe’s trade growth was sharply reduced in 2005. although the depreciation of the euro, the British pound and the Swiss franc in the course of 2005 improved somewhat the price competitiveness of european exporters in markets outside europe, the expansion of real merchandise exports was limited to 3.5 per cent in 2005. However, as three-quarters of europe’s exports are destined to european countries, trade growth can only recover with stronger intra-european trade flows.
Chart 3RealoilpriceandsharesofAfricaandMiddleEastinworldmerchandiseexports,1970-2005(Dollars and percentage shares)
Note: real price is obtained by deflating the nominal IMf crude oil spot price by the wto world export unit value index.Source: IMf and wto calculations.
0
10
20
30
40
50
60
70
1970 1975 1980 1985 1990 1995 2000 2005
0
2
4
6
8
10
12
14
Middle East
Africa
$/barrel %
Real price (at 1990$) (left hand scale)
i R
ECEN
T TR
AD
E D
EVEL
OPM
ENTS
A
ND
SEL
ECTE
D T
REN
DS
iN T
RA
DE
a
reC
eNt
treN
dS
IN IN
terN
atI
oN
al
tra
de
wo
rld
tr
ad
e r
epo
rt
200
6
6
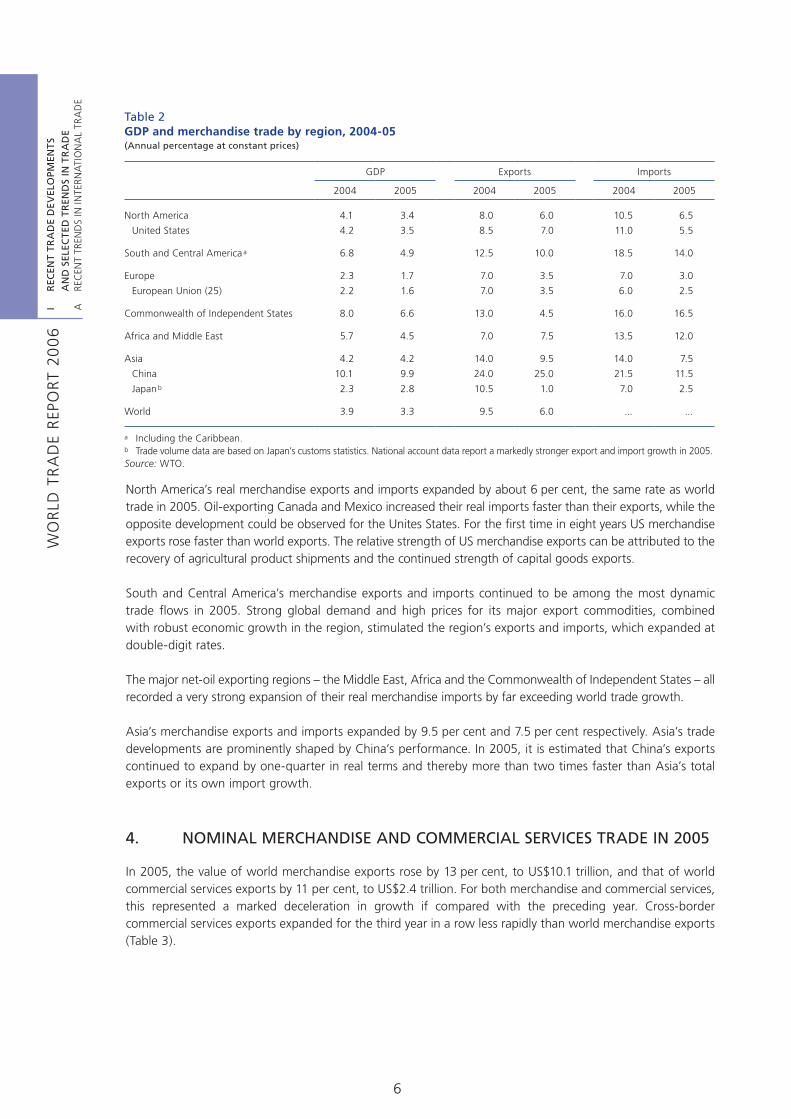
North america’s real merchandise exports and imports expanded by about 6 per cent, the same rate as world trade in 2005. oil-exporting Canada and Mexico increased their real imports faster than their exports, while the opposite development could be observed for the Unites States. for the first time in eight years US merchandise exports rose faster than world exports. the relative strength of US merchandise exports can be attributed to the recovery of agricultural product shipments and the continued strength of capital goods exports.
South and Central america’s merchandise exports and imports continued to be among the most dynamic trade flows in 2005. Strong global demand and high prices for its major export commodities, combined with robust economic growth in the region, stimulated the region’s exports and imports, which expanded at double-digit rates.
the major net-oil exporting regions – the Middle east, africa and the Commonwealth of Independent States – all recorded a very strong expansion of their real merchandise imports by far exceeding world trade growth.
asia’s merchandise exports and imports expanded by 9.5 per cent and 7.5 per cent respectively. asia’s trade developments are prominently shaped by China’s performance. In 2005, it is estimated that China’s exports continued to expand by one-quarter in real terms and thereby more than two times faster than asia’s total exports or its own import growth.
4. NOMiNAL MERChANDiSE AND COMMERCiAL SERViCES TRADE iN 2005
In 2005, the value of world merchandise exports rose by 13 per cent, to US$10.1 trillion, and that of world commercial services exports by 11 per cent, to US$2.4 trillion. for both merchandise and commercial services, this represented a marked deceleration in growth if compared with the preceding year. Cross-border commercial services exports expanded for the third year in a row less rapidly than world merchandise exports (table 3).
Table 2GDPandmerchandisetradebyregion,2004-05(Annual percentage at constant prices)
Gdp exports Imports
2004 2005 2004 2005 2004 2005
North america 4.1 3.4 8.0 6.0 10.5 6.5
United States 4.2 3.5 8.5 7.0 11.0 5.5
South and Central america a 6.8 4.9 12.5 10.0 18.5 14.0
europe 2.3 1.7 7.0 3.5 7.0 3.0
european Union (25) 2.2 1.6 7.0 3.5 6.0 2.5
Commonwealth of Independent States 8.0 6.6 13.0 4.5 16.0 16.5
africa and Middle east 5.7 4.5 7.0 7.5 13.5 12.0
asia 4.2 4.2 14.0 9.5 14.0 7.5
China 10.1 9.9 24.0 25.0 21.5 11.5
Japan b 2.3 2.8 10.5 1.0 7.0 2.5
world 3.9 3.3 9.5 6.0 ... ...
a Including the Caribbean.b trade volume data are based on Japan’s customs statistics. National account data report a markedly stronger export and import growth in 2005.Source: wto.

i R
ECEN
T TR
AD
E D
EVEL
OPM
ENTS
A
ND
SEL
ECTE
D T
REN
DS
iN T
RA
DE
a
reC
eNt
treN
dS
IN IN
terN
atI
oN
al
tra
de
wo
rld
tr
ad
e r
epo
rt
200
6
7
trade value developments by sector showed a large variation in their expansion rates in 2005, largely due to relative price developments. weak and stagnating prices for food, agricultural raw materials and manufactured goods contrasted with a further sharp rise in the prices for metals and fuels. as shown above in Chart 2, the share of fuels and other mining products in world merchandise trade rose sharply to 16 per cent, the highest level since 1985 and matching the level recorded in 1970. on the other hand, the share of agricultural products in world merchandise exports decreased to a historic record low of less than 9 per cent. although recent oil price developments played a major role in the further relative decline of agricultural products in world merchandise exports, they only accentuated an existing long-term downward trend. the share of agricultural products (including processed products) in world merchandise exports has decreased steadily over the last six decades, from more than 40 per cent in the early 1950s to 10 per cent in the late 1990s, as both volume and price trends have been less favourable than for other merchandise products (Chart 4).8
among manufactured goods it is estimated that the largest value increases were for iron and steel products, as well as for chemicals. although there was a recovery in the global demand for computers and other electronic products, the trade value of these categories expanded no faster than the rate for manufactured goods in general. In other words, electronic products have not yet regained the dynamic role they played in the expansion of trade in manufactures throughout the 1990s. In the 1990s the export value of electronic goods rose on average by 12 per cent or two times faster than all other manufactured goods. available information in early 2006 also points to a below-average expansion of global trade in textiles and clothing in 2005.
among the broad commercial services categories (transportation, travel and other commercial services), expansion rates have been similar, ranging from nearly 10 per cent for travel to 12 per cent for transportation services. the relative strength in the export value of transportation services is largely linked to price developments.
8 the decline in the share of agricultural products should not obscure the fact that trade in agricultural produce is growing. Indeed, the value of world exports in agricultural products increased 30 fold between 1950 and 2005.
Table 3Worldexportsofmerchandiseandcommercialservices,2005(Billion dollars and percentage)
Value annual percentage change
2005 2000-05 2003 2004 2005
Merchandise 10120 10 17 21 13
Commercial services 2415 10 15 19 11
Source: wto.
Chart 4Shareofagriculturalproductsinworldmerchandiseexports,1950-2005(Percentage, period averages)
Note: agricultural products are defined according to wto, ItS which differs somewhat from that used in the wto agreement on agriculture (aoa).Source: wto.
26.8
18.2
14.1
11.5
9.0
37.6
0
5
10
15
20
25
30
35
40
1950-59 1960-69 1970-79 1980-89 1990-99 2000-05

i R
ECEN
T TR
AD
E D
EVEL
OPM
ENTS
A
ND
SEL
ECTE
D T
REN
DS
iN T
RA
DE
a
reC
eNt
treN
dS
IN IN
terN
atI
oN
al
tra
de
wo
rld
tr
ad
e r
epo
rt
200
6
8
regional trade flows measured in dollar values reflect volume, price and exchange rate changes which sometimes work out in a cumulative manner and sometimes offset each other.
europe, the largest trader among the major geographic regions, recorded the lowest export and import growth for both merchandise and commercial services of all regions in 2005 (appendix Chart 1). It was also europe which experienced the steepest deceleration among all regions in dollar trade growth in 2005. Most of this deceleration can be attributed to exchange rate developments. Measured in euro terms europe’s merchandise and commercial services both expanded by about 7 per cent in 2005, only moderately less than in 2004 (Chart 5).
North america’s merchandise and commercial services exports rose by 12 per cent and 10 per cent respectively, which was somewhat less than the corresponding global averages. Imports of services expanded in line with the region’s exports but merchandise import growth exceeded export growth. over the last five years, the growth of North america’s merchandise and commercial services exports was about half the 10 per cent average annual growth observed globally. although North america’s merchandise imports expanded one and a half times faster (at 6 per cent) than its own exports over this five-year period, they still lagged the expansion of world trade, estimated at 10 per cent (appendix tables 1 and 2).
the Middle east, africa and the CIS, the world’s largest net exporters of fuels, benefited from the further rise in fuel prices and increased their merchandise exports between 29 per cent and 36 per cent in 2005. the sharply rising export revenues in 2004 and 2005 enabled these regions to expand their merchandise and services imports faster than the global average.9
the importance of product structure as a determinant of the export performance in 2005 is highlighted if one distinguishes between the oil exporting african countries and the non-oil exporting african countries. Merchandise exports of South africa and the other non-oil exporting countries in africa have seen an increase of about 12 per cent – on a par with world merchandise trade growth. exports of the oil exporting african countries had been far more dynamic surging by 45 per cent, through a combination of larger export volumes and higher prices. the oil exporting african countries recorded a merchandise trade surplus (f.o.b.- c.i.f.) in excess of US$100 billion, while the oil importing african countries record a deficit of US$40 billion in 2005 (appendix table 1).
South and Central america and the Caribbean region not only recorded very high merchandise trade of nearly one-quarter in 2005, but also the strongest expansion in commercial services trade of all regions. Strong economic growth, favourable commodity price developments and exchange rate appreciations contributed to these outstanding developments in the region’s nominal trade values in 2005.
9 according to preliminary data, services imports of the Middle east are estimated to have grown by 11 per cent and to have matched the increase in world services trade.
Chart 5Europe’snominalmerchandiseandcommercialservicesexportsineuroanddollarvalues,2003-05(Percentage changes)
Source: wto.
26.8
18.2
14.1
11.5
9.0
37.6
0
5
10
15
20
25
30
35
40
1950-59 1960-69 1970-79 1980-89 1990-99 2000-05
Merchandise
-5
0
5
10
15
20
25
2003 2004 2005Dollars
Euros
Commercial services
-5
0
5
10
15
20
25
2003 2004 2005

i R
ECEN
T TR
AD
E D
EVEL
OPM
ENTS
A
ND
SEL
ECTE
D T
REN
DS
iN T
RA
DE
a
reC
eNt
treN
dS
IN IN
terN
atI
oN
al
tra
de
wo
rld
tr
ad
e r
epo
rt
200
6
9
there was a sharp deceleration in asia’s nominal merchandise export and import growth but the expansion rate remained – at 15 per cent and 16 per cent respectively – somewhat stronger than global trade growth in 2005. trade performance varied a good deal among asian merchandise exporters. China, the leading trader in the region, reported export growth of 28 per cent and accounted for the first time for more than one-quarter of asia’s merchandise exports.10 other asian countries’ exports increased by 11 per cent in 2005, less than global merchandise exports. one of the weakest export growth rates in asia was reported by Japan (5 per cent) and for the four east asian traders (comprising Chinese taipei; Hong Kong, China; the republic of Korea and Singapore), export expansion in 2005 was limited to 12 per cent, less than half the rate observed in 2004. despite its strong economy, China’s import growth slowed down sharply in 2005. Under the impact of higher fuel prices, Japan’s merchandise imports rose by 14 per cent, nearly three times faster than its exports. India reported import growth of 35 per cent, one of the highest rates among asian traders (appendix table 1).
asia’s commercial services exports and imports have been far more dynamic than world commercial services trade. China’s and India’s services trade expansion exceeded that of other asian countries by a large margin, although incomplete information (China) and methodological changes in recording (India) exclude a precise year-to-year comparison at this moment. asia’s largest services importer, Japan, saw a near stagnation of its total commercial services imports, largely due to a contraction of its travel services expenditures abroad.
as the summary review of regional trade developments above has shown, there can be as much variation in the trade performance within a region as among the major geographic regions. this observation argues for cautious use to be made of regional trade aggregates in the analysis of trade flows, and to complement it whenever feasible with more disaggregated data.
10 there is an element of double counting in China’s merchandise trade returns as some shipments recorded as exports return afterwards to China and are recorded as imports. excluding these flows (of US$55 billion) from the reported numbers shown in appendix table 1 would lower China’s trade expansion by about 1 percentage point in 2005. for more details see, wto, International trade Statistics 2005 (Box 2).

i R
ECEN
T TR
AD
E D
EVEL
OPM
ENTS
A
ND
SEL
ECTE
D T
REN
DS
iN T
RA
DE
a
reC
eNt
treN
dS
IN IN
terN
atI
oN
al
tra
de
wo
rld
tr
ad
e r
epo
rt
200
6
10
Appendix Chart 1Shareinworldmerchandiseandcommercialservicestradebyregion,2005(Percentage share)
Source: wto.
0
20
40
60
80
100
EU (15) USA Japan Korea, Rep.of
Switzerland-Liechtenstein
Brazil Norway Canada Thailand Cuba
Green Box AMS Blue Box De Minimis Article 6.2
Merchandise
Commercial services
Exports
3%3%
5%
3%27%
15%
44%
Imports
2%2%
3%
3%
22%25%
43%
Exports
2%2%2%
3%
52%
22%17%
Imports
2%3%
3%
16%25%
48%
3%
North America South and Central America
CIS Africa Middle East Asia
Europe

i R
ECEN
T TR
AD
E D
EVEL
OPM
ENTS
A
ND
SEL
ECTE
D T
REN
DS
iN T
RA
DE
a
reC
eNt
treN
dS
IN IN
terN
atI
oN
al
tra
de
wo
rld
tr
ad
e r
epo
rt
200
6
11
Appendix Table 1Worldmerchandisetradebyregionandselectedcountry,2005(Billion dollars and percentage)
exports Imports
Value annual percentage change Value annual percentage change
2005 2000-05 2003 2004 2005 2005 2000-05 2003 2004 2005
world 10121 10 17 21 13 10481 10 17 22 13
North america 1478 4 5 14 12 2285 6 8 16 14
United States 904 3 5 13 10 1733 7 9 17 14
Canada 360 5 8 16 14 320 6 8 14 14
Mexico 214 5 3 14 14 232 5 1 15 12
South and Central america a 351 13 15 29 25 294 7 6 28 22
Brazil 118 17 21 32 23 78 6 3 31 17
other South and Central america a 232 11 12 28 26 216 8 7 27 24
europe 4353 11 19 20 8 4521 10 20 20 9
european Union (25) 3988 10 19 19 7 4120 10 20 20 8
Germany 971 12 22 21 7 774 9 23 18 8
france 459 7 18 15 2 496 8 21 18 5
United Kingdom 378 6 9 14 9 501 8 13 20 6
Italy 367 9 18 18 4 380 10 20 19 7
other western europe 233 10 14 18 14 182 8 15 16 10
Switzerland 126 9 15 18 6 121 8 15 16 9
South-east europe 132 21 29 34 17 219 19 33 36 18
CIS 342 19 27 36 29 216 21 27 31 25
russian federation 245 18 27 35 34 125 23 25 28 28
africa 296 15 26 30 29 248 14 21 29 16
South africa 52 12 23 26 13 67 17 40 39 16
africa less South africa 244 16 26 31 33 181 13 16 26 16
oil exporters b 166 18 33 41 45 63 17 17 34 17
Non oil exporters 78 11 18 18 12 118 11 15 22 16
Middle east 529 15 20 30 36 318 15 15 26 19
asia 2773 11 19 25 15 2599 12 20 27 16
Japan 596 4 13 20 5 516 6 14 19 14
China 762 25 35 35 28 660 24 40 36 18
four east asian traders c 731 9 19 25 12 676 8 15 27 14
India 90 16 16 33 19 132 21 26 37 35
Memorandum items:
MerCoSUr (4) 163 14 19 28 20 113 5 11 38 18
aSeaN (10) 653 9 16 20 14 593 9 13 25 16
eU (25) extra-trade 1328 11 17 21 10 1460 10 19 21 14
eU (15) 3679 10 19 18 6 ... ... ... ... ...
eU (new members, 10) 309 20 29 34 16 ... ... ... ... ...
developing economies 3443 13 19 27 22 3024 12 17 28 17
developing asia 2050 13 21 27 18 1932 13 22 30 17
a Includes the Caribbean.b algeria, angola, Chad, Congo, equatorial Guinea, Gabon, libya, Nigeria, Sudan.c Chinese taipei; Hong Kong, China; republic of Korea and Singapore.Note: for the composition of country groups see the technical Notes.Source: wto.

i R
ECEN
T TR
AD
E D
EVEL
OPM
ENTS
A
ND
SEL
ECTE
D T
REN
DS
iN T
RA
DE
a
reC
eNt
treN
dS
IN IN
terN
atI
oN
al
tra
de
wo
rld
tr
ad
e r
epo
rt
200
6
12
Appendix Table 2Worldtradeofcommercialservicesbyregionandselectedcountry,2005(Billion dollars and percentage)
exports Imports
Value annual percentage change Value annual percentage change
2005 2000-05 2003 2004 2005 2005 2000-05 2003 2004 2005
world 2415 10 15 19 11 2361 10 14 18 11
North america 420 5 5 11 10 373 7 9 15 10
United States 353 5 5 11 10 289 7 8 15 10
Canada 51 5 7 11 9 62 7 14 13 10
Mexico 16 3 0 12 12 22 5 3 10 12
South and Central america a 68 8 10 16 20 70 5 4 14 22
Brazil 15 11 9 21 28 22 7 6 12 38
other South and Central america a 53 7 10 14 17 48 4 3 15 15
europe 1233 11 19 19 7 1119 11 19 16 8
european Union (25) 1104 11 19 19 7 1034 10 19 16 7
Germany 143 12 20 15 7 199 8 19 13 4
United Kingdom 183 9 15 23 -1 150 9 13 20 4
france 114 7 15 12 4 103 11 20 18 7
Italy 93 11 19 17 13 92 11 20 10 15
other western europe 77 11 16 23 12 57 13 15 23 14
Switzerland 45 10 15 24 9 25 10 11 25 7
South-east europe 52 12 35 23 15 29 13 27 30 19
CIS 40 18 16 23 20 58 20 17 24 18
russian federation 24 20 20 25 20 38 18 16 23 15
africa 57 13 26 20 12 66 12 16 19 15
South africa 10 16 69 14 17 12 16 52 26 19
Middle east 54 11 27 14 12 80 11 19 20 11
asia 543 12 10 26 19 595 10 10 25 15
Japan 107 8 8 25 12 136 3 3 22 1
China 81 22 18 34 ... 85 19 19 31 ...
four east asian traders b 175 8 9 18 9 165 8 8 21 10
India 68 33 21 66 ... 67 29 23 53 ...
Memorandum items:
MerCoSUr (4) 23 8 13 21 25 31 4 8 15 32
aSeaN (10) 104 8 2 22 10 132 9 9 21 14
a Includes the Caribbean.b Chinese taipei; Hong Kong, China; republic of Korea and Singapore.Note: for the composition of country groups see the technical Notes.Source: wto.


