32
Banking Sector Reforms and NPA: A study of Indian Commercial Banks Meenakshi Rajeev H P Mahesh
| Date post: | 15-May-2017 |
| Category: |
Documents |
| Upload: | akshay-agarwal |
| View: | 215 times |
| Download: | 0 times |

Banking Sector Reforms and NPA: A study ofIndian Commercial Banks
Meenakshi RajeevH P Mahesh

ISBN 978-81-7791-108-4
© 2010, Copyright
ReservedThe Institute for Social and Economic Change,Bangalore
Institute for Social and Economic Change (ISEC) is engaged in interdisciplinary research in analytical and applied areas of the social sciences, encompassing diverse aspects of development. ISEC works with central, state and local governments as well as international agencies by undertaking systematic studies of resource potential, identifying factors influencing growth and examining measures for reducing poverty. The thrust areas of research include state and local economic policies, issues relating to sociological and demographic transition, environmental issues and fiscal, administrative and political decentralization and governance. It pursues fruitful contacts with other institutions and scholars devoted to social science research through collaborative research programmes, seminars, etc.
The Working Paper Series provides an opportunity for ISEC faculty, visiting fellows and PhD scholars to discuss their ideas and research work before publication and to get feedback from their peer group. Papers selected for publication in the series present empirical analyses and generally deal with wider issues of public policy at a sectoral, regional or national level. These working papers undergo review but typically do not present final research results, and constitute works in progress.

BANKING SECTOR REFORMS AND NPA:
A STUDY OF INDIAN COMMERCIAL BANKS
Meenakshi Rajeev and H P Mahesh 1
Abstract
The issue of non-performing assets (NPA), the root cause of the recent global financial crisis , has been drawing the attention of the policy makers and academicians alike. The problem of NPAs, which was ignored till recently,has been given considerable attention after liberalisation of the financial sector in India. This exploratory paper examines the trends of NPAs in India from various dimensions and explains how mere recognition of the problem and self -monitoring has been able to reduce it to a great extent. It also shows that public sector banks in India, which function to some extent with welfare motives , have as good a record in reducing NPAs as their counterparts in the private sector. The paper also discusses the role of joint liability groups (JLGs) or self help groups (SHGs) in enhancing the loan recovery rate.
Introduction
It has been argued by a number of economists that a well-developed financial
system enables smooth flow of savings and investments and hence, supports
economic growth (see King and Levine, 1993, Goldsmith, 1969). A healthy
financial system can help achieve efficient allocation of resources across time
and space by reducing inefficiencies arising out of market frictions and other
socio -economic factors. Amongst the various desirable characteristics of a
well-functioning financial system, the maintenance of a few non-performing
assets (NPA) is an important one. NPAs beyond a certain level are indeed cause
for concern for everyone involved because credit is essential for economic
growth and NPAs affect the smooth flow of credit. Banks raise resources not just
on fresh deposits, but also by recycling the funds received from the borrowers.
Thus, when a loan becomes non-performing, it affects recycling of credit and
credit creation. Apart from this, NPAs affect profitability as well, since higher
NPAs require higher provisioning, which means a large part of the profits needs
to be kept aside as provision against bad loans. Therefore, the problem of NPAs
is not the concern of the lenders alone but is, indeed , a concern for policy
makers as well who are involved in putting economic growth on the fast
track.

In India due to the so cial banking motto, the problem of bad loans did not
receive priority from policy makers initially. However, with the reform of the
financial sector and the adoption of international banking practices the issue of
NPAs received due focus. Thus, in India, the concept of NPA came into the
reckoning after reforms in the financial sector were introduced on the
recommendations of the Report of the Committee on the Financial System
(Narasimham, 1991) and an appropriate accounting system was put in place.
1 Professor and Head, CESP, Institute for Social and Economic Change, Bangalore-72. E-mail: [email protected]; and Senior Analyst, Economic Research and Consulting Unit of the Swiss Re Shared Services (India) Pvt. Ltd. (The views expressed by the author do not represent those of the institution where he is currently working.)This paper has benefited from an earlier project carried out under SANEI. The authors are grateful to SANEI for its support.

Broadly speaking, NPA is defined as an advance where payment of
interest or repayment of installment of principal (in case of term loans) or both
remains unpaid for a certain period2. In India, the definition of NPAs has
changed over time. According to the Narasim ham Committee Report (1991),
those assets (advances, bills discounted, overdrafts, cash credit etc.) for which
the interest remain s due for a period of four quarters (180 days) should be
considered as NPAs. Subsequently , this period was reduced, and from March
1995 onwards the assets for which the interest has remained unpaid for 90
days were considered as NPAs.
Though the NPA issue has received considerable attention in the post
reform period, academic work on the subject in not adequate (Ghosh, 2005,
Mor and Sharma, 2003, Rajaraman et al, 1999). This paper attempts to
provide an overview of the NPA problem in India concentrating on the various
dimensions involved. Against this backdrop, the paper is arranged as
follows. The next section compares India wit h few other countries across
the globe. Reform measures and the consequent change s in NPA norms are
discussed in Section 3. The next two sections look at the loan recovery
mechanisms that are in place, including the legal reforms and the recovery
trends. T rends in NPAs both at the bank level and at the sector level are
analysed in the penultimate section. The paper ends with a concluding
section.
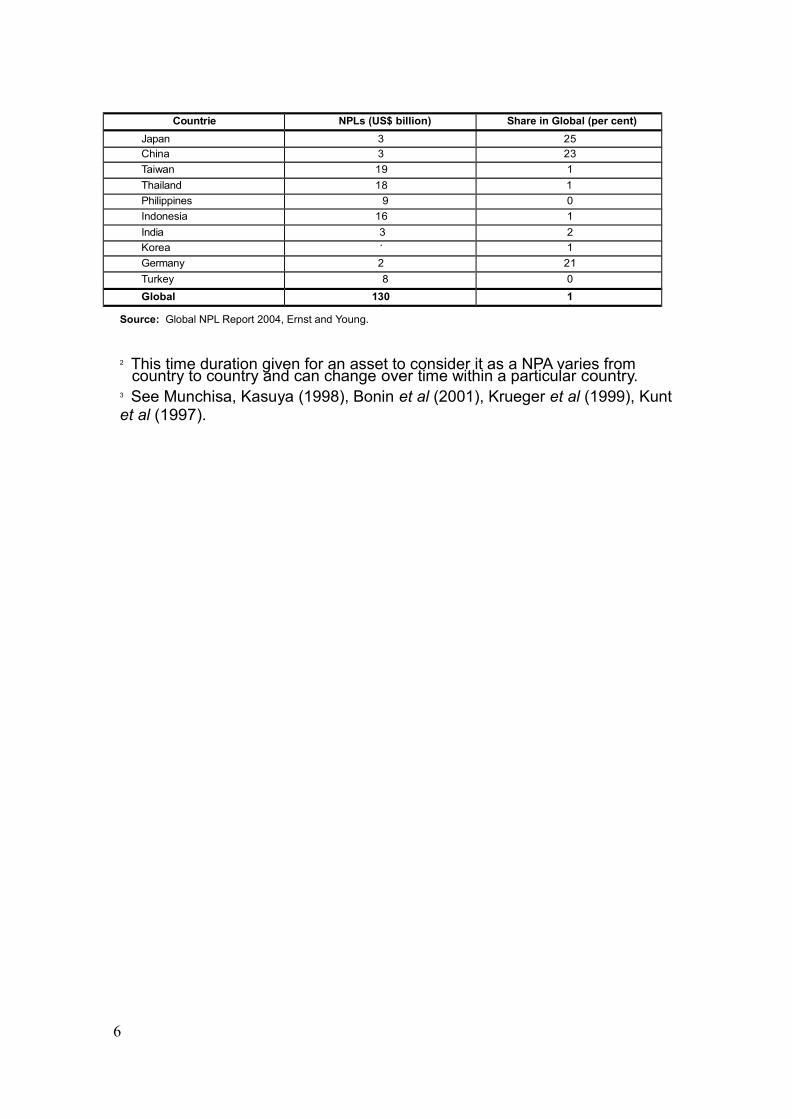
NPAs at the Global Level
In order to get a global picture 3 it is essential to look at the NPAs in the different countries of the world. Since the concept of NPA developed in India only in the post -reform era, it would be useful to look at recent figures rather than adhere to a historical account. A closer look at the Non -performing Loans
(NPL), as they are called ni many nations, reveals that in 2003 the NPL at the global level was US$
1,300 billion. India ranks fourth with NPL of around US$ 30 billion (2.3 per
cent of the global NPL), while Japan has the highest NPL of US$ 330 billion
(25.4 per cent of the global NPL) and Turkey has the lowest NPL of US$ 8
billion (0.6 percent of global NPL, Table 1).
Table 1: Global Non-performing Loans: 20035
Countries
NPLs (US$ billion) Share in Global (per cent)
Japan 33
25.4China 3
023.6Taiwan 19
.11.Thailand 18
.81.Philippines 9 0.Indonesia 16
.91.India 3
02.Korea 1
51.Germany 2
821.8Turkey 8 0.Global 130
010
Source: Global NPL Report 2004, Ernst and Young.
2 This time duration given for an asset to consider it as a NPA varies from country to country and can change over time within a particular country.
3 See Munchisa, Kasuya (1998), Bonin et al (2001), Krueger et al (1999), Kunt et al (1997).
6
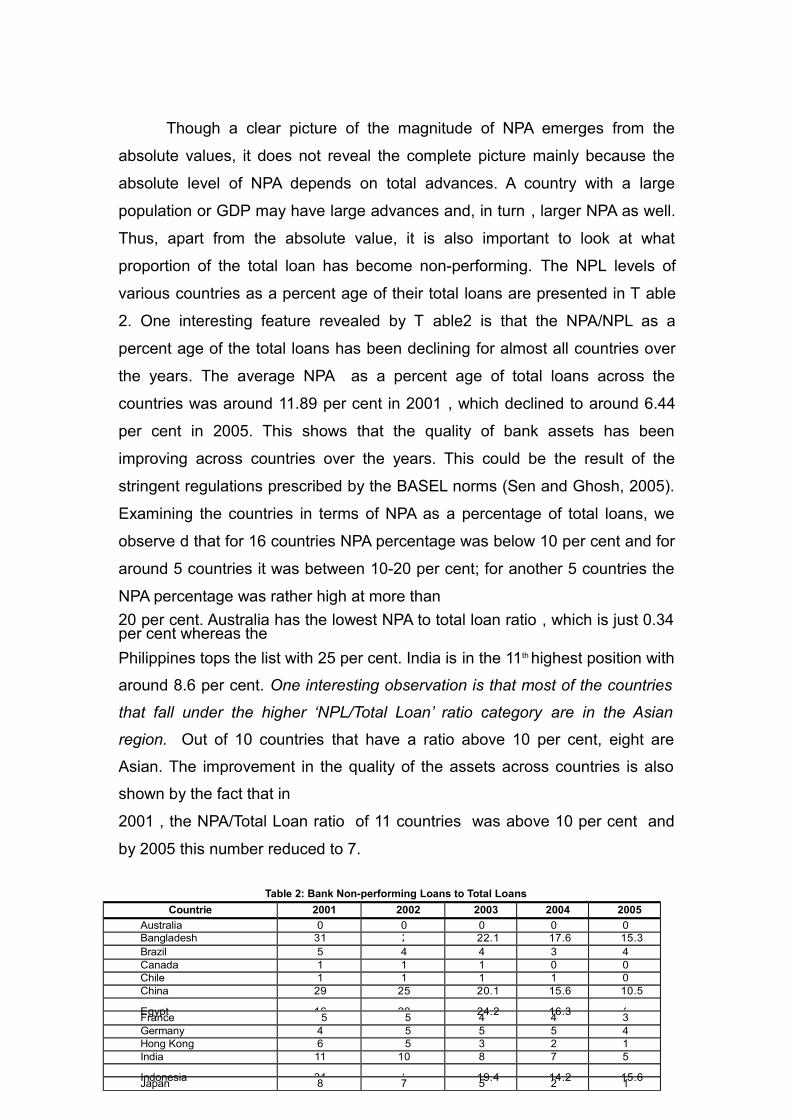
Though a clear picture of the magnitude of NPA emerges from the
absolute values, it does not reveal the complete picture mainly because the
absolute level of NPA depends on total advances. A country with a large
population or GDP may have large advances and, in turn , larger NPA as well.
Thus, apart from the absolute value, it is also important to look at what
proportion of the total loan has become non-performing. The NPL levels of
various countries as a percent age of their total loans are presented in T able
2. One interesting feature revealed by T able2 is that the NPA/NPL as a
percent age of the total loans has been declining for almost all countries over
the years. The average NPA as a percent age of total loans across the
countries was around 11.89 per cent in 2001 , which declined to around 6.44
per cent in 2005. This shows that the quality of bank assets has been
improving across countries over the years. This could be the result of the
stringent regulations prescribed by the BASEL norms (Sen and Ghosh, 2005).
Examining the countries in terms of NPA as a percentage of total loans, we
observe d that for 16 countries NPA percentage was below 10 per cent and for
around 5 countries it was between 10-20 per cent; for another 5 countries the
NPA percentage was rather high at more than
20 per cent. Australia has the lowest NPA to total loan ratio , which is just 0.34 per cent whereas the
Philippines tops the list with 25 per cent. India is in the 11th highest position with
around 8.6 per cent. One interesting observation is that most of the countries
that fall under the higher ‘NPL/Total Loan’ ratio category are in the Asian
region. Out of 10 countries that have a ratio above 10 per cent, eight are
Asian. The improvement in the quality of the assets across countries is also
shown by the fact that in
2001 , the NPA/Total Loan ratio of 11 countries was above 10 per cent and
by 2005 this number reduced to 7.
Table 2: Bank Non-performing Loans to Total Loans
Countries
2001 2002 2003 2004 2005
Australia 0.
0.
0.
0.
0.Bangladesh 31
.528
22.1 17.6 15.3Brazil 5
.4.
4.
3.
4.Canada 1
.1.
1.
0.
0.Chile 1
.1.
1.
1.
0.China 29
.825.6
20.1 15.6 10.5
Egypt 16.9
20.2
24.2 16.3 25France 5 5 4
.4.
3.Germany 4
.5 5
.5.
4.Hong Kong 6
.5 3
.2.
1.India 11
.410.4
8.
7.
5.
Indonesia 31.9
24
19.4 14.2 15.6Japan 8
.7.
5.
2.
1.

Korea 3.
2.
2.
1.
1.Malaysia 17
.815.8
13.9 11.8 9.Mexico 5
.4.
3.
2.
1.
Pakistan 23.4
21.8
17
11.6 10.6Philippines 27
.726.5
26.1 24.7 20Russia 6
.5.
5 3.
3.Singapore 8 7
.6.
5 3.Sri Lanka 15
.315.3
13.7 9.
9.Switzerland 2
.1.
1.
0.
0.Thailand 11
.516.5
13.5 11.8 11.1Turkey 29
.317.6
11.5 6 4.United Kingdom 2
.2.
2.
1.
1United States 1
.1.
1.
0.
0.Source: Global Financial Stability Report, May 2006, IMF
While comparing the NPA levels of different countries, it should be remembered that the
features relating to NPA reporting/evaluation practices are not uniform across the globe. In some
countries, the NPA level may be low because losses are written off at an early stage. In some of the
developing countries belonging to the Asia-Pacific Economic Co-operation (APEC), a loan is classified as
non-performing only after it has been in arrears for at least six months. In India, currently, an asset is
considered NPA if it is due for 90 days. Besides, in India due to the lengthy legal process, a considerably
longer time is taken to recover the loan and due to many safeguards/procedures even after a NPA is
written off, banks continue to hold them in their books often with the provisions made for those loans.
Even the classification of NPA into Gross NPA and Net NPA is not uniform because in some countries
general provisions are made, whereas in India, NPAs are considered GNPA for some time even after
making provisions. Thus, while comparing the NPA of India with other countries one should keep in mind
that in many respect s asset classification norms in India are considerably more stringent than the best of
international practices.
In addition, countries also do differ in various other respects, so a strict comparison across
countries cannot be made. Nonetheless, the global picture reflect s a comprehensive view of NPAs
across the world.
NPA Norms
Though the issue of NPA was given more importance after the Narasimham Committee Report (1991)
highlighted its impact on the financial health of the commercial banks and, subsequently, various asset
classification norms were introduced, the concept of classifying bank assets based on its quality began
during 1985-86. A critical analysis to monitor credit comprehensively and uniformly was introduced in
1985 -86 by the RBI by way of the Health Code System in banks. This system, inter alia, provided
information regarding the health of individual advances, the quality of the credit portfolio and the extent of
advances causing concern in relation to total advances. It was considered that such information would be
of immense use to banks for control purposes. The RBI advised all commercial banks (excluding foreign
banks, most of which had simila r coding system) on November 7, 1985, to introduce the Health Code
System indicating the quality (or health) of individual advances under the following eight categories, with
a health code assigned to each borrowal account (source: RBI):
1. Satisfactory - conduct is satisfactory; all terms and conditions are complied with; all accounts
are in order and safety of the advance is not in doubt.
2. Irregular- the safety of the advance is not suspected, though there may be occasional
irregularities, which may be considered as a short term phenomenon.
3. Sick, viable - advances to units that are sick but viable - under nursing and units for which
nursing/revival programmes are taken up.
4. Sick: nonviable/sticky - the irregularities continue to persist and there are no immediate
prospects of regularisation and the accounts could throw up some of the usual signs of
incipient sickness
5. Advances recalled - accounts where the repayment is highly doubtful and nursing is not
considered worthwhile and where decision has been taken to recall the advance

6. Suit filed accounts - accounts where legal action or recovery proceedings have been initiated
7. Decreed debts - where decrees (verdict) have been obtained.
8. Bad and Doubtful debts - where the recoverability of the bank's dues has become doubtful on
account of short -fall in value of security, difficulty in enforcing and realising the securities or
inability/unwillingness of the borrowers to repay the bank's dues partly or wholly
Under the above Health Code System, the RBI classif ied problem loans of each bank into three
categories: i) advances classified as bad and doubtful by the bank (Health Code No.8) (ii) advances
where suits were filed/decrees obtained (Health Codes No.6 and 7) and (iii) those advances with major
undesirable features (Health Codes No.4 and 5).
The Narasimham Committee (1991) felt that the classification of assets according to the health
codes was not in accordance with international standards. It believed that a policy of income recognition
should be objective and based on the record of recovery rather than on subjective considerations. In
addition, before the Indian banks complied with the capital adequacy norms, their assets had to be
revalued on a more realistic basis of their realisable value. Thus, the Narasimham Committee (1991)
believed a system of income recognition and provisioning is fundamental to preserve the strength and
stability of the banking system.
The international practice is that an asset is treated as non -performing when interest is due for
at least two quarters. In respect of such non-performing assets, interest is not recognised on accrual
basis but is booked as income only when it is actually received. The committee suggested that a similar
practice be followed by banks in financial institutions in India and recommended that interest on NPAs be
booked as income on accrual basis. The NPA would be defined as advance, as on the balance sheet
date in the following circumstances:
1. In respect of overdraft and cash credits, accounts remain out of order for a period of more than
180 days,
2. In respect of bills purchased and discounted, the bill remains overdue4 and unpaid for a
period of more than 180 days,
3. In respect of other accounts, any account to be received remains past
due for a period of more than 180 days.
As mentioned earlier, the grace period was reduced and from March
1995 onwards assets for which interest has unpaid for 90 days were
considered as NPAs. Provisions need to be made for the NPAs and total NPA
(gross) minus the provisions is defined as net NPA.
Besides providing a detailed definition of NPA, the Narasimham
Committee (1991) also suggested that for the purpose of provisioning, banks
and financial institutions should classify their assets by compressing the health
codes into four broad groups; (i) Standard (ii) Sub-standard, (iii) Doubtful and
(iv) Loss. Broadly, sub-standard assets would exhibit problems and
include assets classified as non-performing for a period not exceeding two
years. Doubtful assets are those that remain as such for more than two years
and include loans that are overdue for more than two years.

4 An amount is considered overdue when it remains outstanding 30 days beyond the due date.

Loss assets are accounts where loss has been identified but amounts have
not been written off. According to international norms, commercial banks need
to keep aside a portion of their income as a provision against bad loans. The
amount of the provision depends on the type of NPAs and the time duration.
Now Indian banks need to make provisions for all bad loans.
Recovery Mechanism of NPA
T he Government of India felt that the usual recovery measures like issue of
notices for enforcement of securities and recovery of dues was a time
consuming process. Thus, in order to speed up the recovery of NPAs, the
government constituted a committee under the chairmanship of late Shri Tiwari
in 1981. The committee examined the ways and means of recovering NPAs
and recommended, inter alia, the setting up of ‘Special Tribunals’ to expedite
the recovery process. Later the Narasimham Committee (1991) endorsed this
recommendation, and, suggested setting up of the Asset Reconstruction Fund
(ARF). It was suggested that the Government of India, if necessary, should
establish this fund by special legislation to take over the NPAs from banks and
financial institutions at a discount and recover the dues owed by the primary
borrowers.
Based on the recommendations of the Tiwari and the Narasimham
Committees, Debt Recovery Tribunals were established in various parts of the
country. An Asset Reconstruction Company was also established. The various
measures taken to reduce NPAs include rescheduling and restructuring of
banks, corporate debt restructuring and recovery through Lok Adalats, Civil
Courts, Debt Recovery Tribunals and compromise settlement . In addition,
some legal reforms were introduced to speed up recovery.
1. SARFAESI Act
The legal mechanism for recovery of default loans was so far cumbersome
and time -consuming. Thus, it was felt that banks and financial institutions
shou ld be given the power to sell securities to recover dues. In this regard,
the Government of India appointed a committee under the chairmanship of
Shri T R Andhyarujina, senior Supreme Court advocate and former Solicitor
General of India, in 1999 to look into these matters. The Committee submitted
four reports. One of them is related to securitisation.
Based on the recommendations of the Andhyarujina Committee,

The Securitisation and
Reconstruction of Financial Assets and Enforcement of Security Interest
(SARFAESI) Act, 2002, was passed on December 17, 2002. The act provides
enforcement of the security factor without recourse to civil suits. This act was
passed with the aim of enabling banks and financial institutions to realise long-
term assets, manage the problem of liquidity, reduce asset liability mismatches
and improve recovery by taking possession of securities, selling them and
reducing NPAs. The ordinance also allows banks and financial institutions to
utilise the services of ARCs/SCs for speedy recovery of dues from defaulters
and to reduce their NPAs. The ordinance contains provisions that would make
it possible for ARCs/SCs to take possession directly of the secured assets
and/or the management of the defaulting borrower companies without
resorting to the time -consuming process of litigation and without allowing
borrowers to take shelter under the provisions of SICA/BIFR. In addition to
passing the SARFAESI Act , certain other legal reforms were also introduced
to speed up the loan recovery process.

2. Other Legal Reforms
One of the important factors responsible for the ever-increasing level of NPAs
in the Indian banking industry is the weak legal system. According to an
international rating agency called FITCHIBCA , “The Indian legal system is
sympathetic towards the borrowers and works against the banks’ interest.
Despite most of their loans being backed by security, banks are unable to
enforce their claims on the collateral when the loans turn non -performing, and
therefore, loan recoveries have been insignificant .”
However, efforts have been made to rectify these problems through the
judicial process as well as by enacting laws. In 1999, a standing committee
under the aegis of Industrial Development Bank of India (IDBI) was constituted
to initiate a co-ordinated approach to the recovery of large NPA accounts and
for institutionalising an arrangement between banks and financial institutions
for the systematic exchange of information in respect of large borrowers
(including defaulters and NPAs). Moreover, as mentioned above, in 2002 the
SARFAESI Act was passed and it empowered the creditors to foreclose non-
performing loans and the underlying collateral without going through a lengthy
judicial or tribunal process (Basu, 2005). All these efforts improved the
recovery of NPAs by commercial banks, which in turn has helped in reducing
the NPA level. The total worth of NPAs recovered through various channels
was around Rs 4,039 crore during 2003-04, which increased many fold to Rs
20,578 crore during 2004-
05.
Recovery of NPA
Using the new institutions and legal options, banks and financial institutions
accelerated their recovery of NPAs. The NPAs recovered by scheduled
commercial banks through various channels is presented in T able 3 and Fig1.
Between 2003-04 and 2005-06, the total cases referred to various institutions
was
93,2377 which was worth about Rs 70,226 crores. Out of this, around Rs
19,075 crore was recovered. In terms of cases, the highest number (5 ,53,042)
was referred to the Lok Adalats and the lowest (15,812) to the DRTs. In terms
of the amount involved, the DRTs recovered the highest amount of around Rs
32,745 crore and Lok Adalats the least, around Rs 2,965 crore. In terms of the
recovery, 58 per cent of the amount involved was recovered through one-time
settlement/compromise schemes. DRTs recovered around 29 per cent and Lok
Adalats recovered around 16 per cent , while 22 per cent of the amount was
recovered under the SARFAESI Act.

Table 3: NPAs Recovered by SCBs t hrough Various Channels (Rs crores)
One-time Settlement/compromise Scheme
Lok Adalats
DRTs SARFAESI Act
2003-04
No of cases referred 139,562
186,100 7,544
2,661Amount involved 1,5
101,063 12,305 7,8
47Amount recovered 61
14
2,117
1,156
2004-05
No of cases referred 132,781
185,395 4,744
39,288
Amount involved 1,332
80
14,317 13,224
Amount recovered 88
11
2,688
2,391
2005-06
No of cases referred 10,262
2,68,090 3,534
41,180
Amount involved 77
2,144 6,273
8,517Amount recovered 6
026
4,735
3,363
2006-07
No of cases referred — 1,60,368 4,028
60,178
Amount involved — 75
9,156
9,058Amount recovered — 1
03,463
3,749
2007-08
No of cases referred — 1,86,535 3,728
83,942
Amount involved — 2,142 5,819
7,263Amount recovered — 1
73,020
4,429
2008-09
No of cases referred — 5,48,308 2,004
61,760
Amount involved — 4,023 4,130
12,067
Amount recovered — 96
3,348
3,982
Source: RBI
Figure 1: NPA Recovered through Various Channels
Source: Computed using RBI data

Thus, we observe that considerable attention has been paid to the NPA
issue and various regulatory as well as institutional mechanisms are put in
place. How effective are these changes? This calls for a closer look at the NPA
trends in the recent past.
NPA Trends
While efforts are on for NPA classifications, refinement of the accounting
system and measures to reduce NPA in the decade of 1990s, proper
implementation of these norms took time. Systematic data on NPAs started
to become available in a usable form from 1998 only. Though the total
GNPA increased significantly between 1998 and 2002, it started to decline after
that (Table 4). During
1998 the total Gross NPA and Net NPA of the total banking sector was Rs
34,428 crore (around 14.4 per cent of gross advance) and Rs 16,098 crore
(around 7 per cent of net advance) respectively. During
2005, the GNPA increased even in real terms to Rs 38,558 crore (around 5.2 per cent of gross advance)
whereas NNPA reduced to Rs 14,181 crore (around 2 per cent of net
advance). The growth rate of GNPA was about 11 per cent in 1999, which
started to fall drastically and became negative after 2002. The growth rate
becoming negative implies that there is a substantial decline in the
GNPA of commercial banks showing some impact of the sensitisation and
regulatory changes. A similar trend is observed in the case of Net NPA
(NNPA). The decline in the NNPA is sharper than GNPA, mainly because of
the increasing level of provisions, as shown in the last three rows of Table 4.
Thus it is clear that sensitisation to the problem has helped to tackle it.
Table 4: Non Performing Assets of Total Banking Sector (Rs Crore, Real Values)
2002 2003 2004 2005
2006
2007
2008 2009
Gross NPA 41430
39012 35007 38558
38817
36568
38117
46689
Change 2602
-2418
-4006
3551
259 -224
1549
8573
Percentage growth 6.7 -5.8 -10.3
10.1
0.7 -5.8
4.2 22.5
Percent to Gross Advance 10.4 8.9 7.2 5.3 3.3 2.5 2.3 2.3
Net NPA 20787
18548 13302 14181
14087
14560
16740
21272
Change 1013
-2240
-5246
879 -94 473 2181
4531
Percentage growth 5.1 -10.8
-28.3
6.6 -0.7
3.4 15.0
27.1
Percent to Net Advance 5.5 4.4 2.9 1.9 1.2 1.0 1.0 1.1
Source: Computed by authors using RBI data.
At the bank group level, when we compare the public sector banks with private banks in terms of

NPA as a perce ntage of total lending (Table 5) we observe that the public sector banks are as good as or
as bad as their counterparts in the private sector. Sometimes, public sector banks are indeed doing better
that the old Indian private sector banks. However, when compared with the foreign banks they do not fare
well. This may be partly because foreign banks are already accustomed to NPA norms in their parent
country. Further, various credit related welfare programmes are carried out through public sector banks.
They also have maximum reach in the rural areas. One feature , however, is worth taking note of –
growth rate of gross NPAs of the old private sector banks are higher than the public sector banks while
growth of advances of public sector banks are at par with the private banks. It, thus,

appears that after reforms, the public sector banks were able to tackle the NPA problem more
effectively than the Indian private banks (Table 5 ). However, one important observation from T able 5 is
that GNPA as a percent age of gross advances has been declining over time across all bank groups.
Table 5: Gross and Net NPAs of Scheduled Commercial Banks (Nominal Values, Rs Crore)
2002 2003 2004 2005 2006 2007 2008 2009
Public Sector Banks
Gross NPAs 56473
54090
51538
47325
41358
38968
40452
45156
Percent to Gross Advance 11.1 9.4 7.8 5.7 3.6 2.7 2.2 2.0
Old Private Banks
Gross NPAs 4851
4550
4392
4206
3759
2969
2557
3072
Percent to Gross Advance 11.0 8.9 7.6 6.0 4.4 3.1 2.3 2.4
New Private Banks
Gross NPAs 6811 7232
5963
4576
4052
6287
10440
13911
Percent to Gross Advance 8.9 7.6 5.0 3.6 1.7 1.9 2.5 3.1
Foreign Banks
Gross NPAs 2726
2845
2894
2192
1928
2263
2859
6833
Percent to Gross Advance 5.4 5.3 4.6 2.8 1.9 1.8 1.8 4.0
Source: Computed using RBI data
The above statistics shows the NPA problem at the aggregate level. In order to tackle the
problem a disaggregated analysis is necessary to examine what type of loans lead to more NPAs. This
necessitates an an alysis of sector-wise NPAs.
1. Sector -wise NPAs
One of the important issues raised in the case of the NPAs of Indian commercial banks is that the credit
policy followed by the RBI under the social banking motto of the government led to increase in NPAs. To
examine this we first look at the NPAs of the priority sector vis-à-vis non-priority sector loans. Table
6 reveals that the NPA of the priority sector is indeed higher than the NPA of non-priority sector and this
trend has been continuing over the years (see also Fig.2).
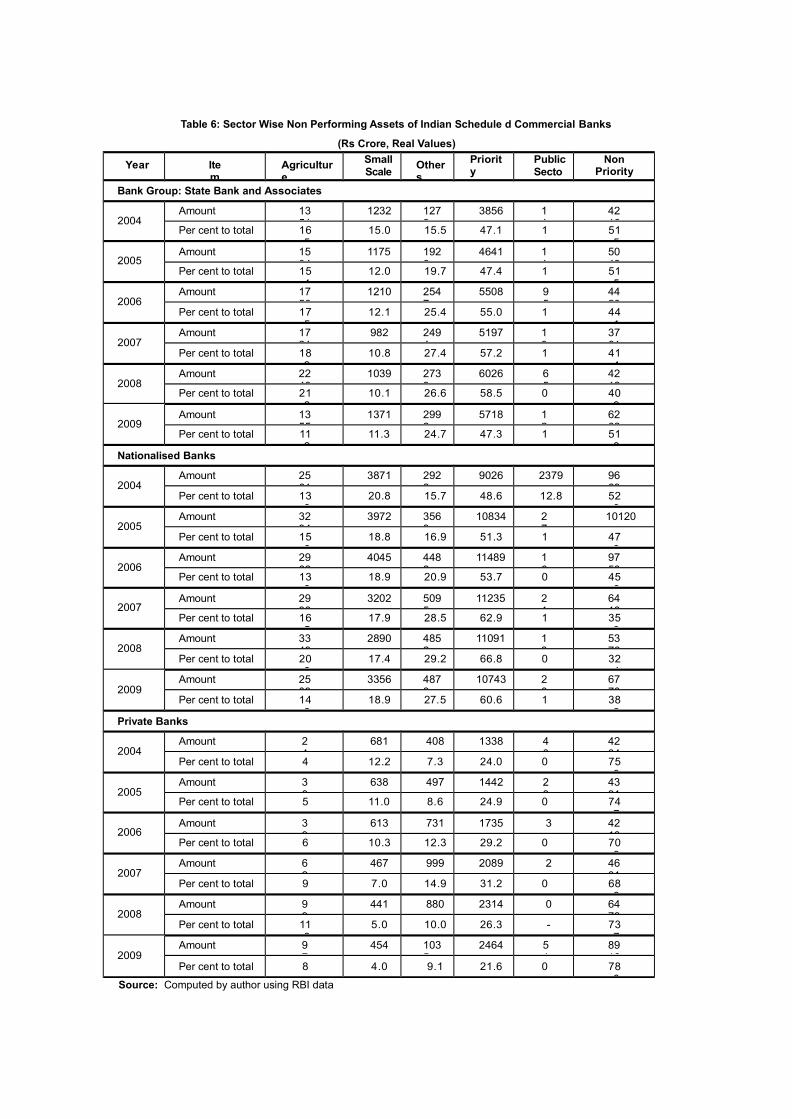
Table 6: Sector Wise Non Performing Assets of Indian Schedule d Commercial Banks
(Rs Crore, Real Values)
Year Item
Agriculture
SmallScale
Others
PrioritySecto
PublicSector
Non Priority
SectBank Group: State Bank and Associates
2004Amount 13
511232 127
23856 1
14216
Per cent to total 16.5
15.0 15.5 47.1 1.
51.5
2005Amount 15
041175 192
64641 1
15042
Per cent to total 15.4
12.0 19.7 47.4 1.
51.5
2006Amount 17
501210 254
75508 9
54420
Per cent to total 17.5
12.1 25.4 55.0 1.
44.1
2007Amount 17
21982 249
45197 1
33761
Per cent to total 18.9
10.8 27.4 57.2 1.
41.4
2008Amount 22
481039 273
96026 6
54212
Per cent to total 21.8
10.1 26.6 58.5 0.
40.9
2009Amount 13
551371 299
25718 1
26262
Per cent to total 11.2
11.3 24.7 47.3 1.
51.8
Nationalised Banks
2004Amount 25
613871 292
29026 2379 96
69Per cent to total 13
.820.8 15.7 48.6 12.8 52
.0
2005Amount 32
943972 356
910834 2
710120
Per cent to total 15.6
18.8 16.9 51.3 1.
47.9
2006Amount 29
624045 448
211489 1
69758
Per cent to total 13.8
18.9 20.9 53.7 0.
45.6
2007Amount 29
383202 509
511235 2
16418
Per cent to total 16.5
17.9 28.5 62.9 1.
35.9
2008Amount 33
492890 485
211091 1
35376
Per cent to total 20.2
17.4 29.2 66.8 0.
32.4
2009Amount 25
093356 487
810743 2
06770
Per cent to total 14.2
18.9 27.5 60.6 1.
38.2
Private Banks
2004Amount 2
4681 408 1338 4
04204
Per cent to total 4.
12.2 7.3 24.0 0.
75.3
2005Amount 3
0638 497 1442 2
84331
Per cent to total 5.
11.0 8.6 24.9 0.
74.7
2006Amount 3
9613 731 1735 3 42
10Per cent to total 6
.10.3 12.3 29.2 0
.70.8
2007Amount 6
2467 999 2089 2 46
01Per cent to total 9
.7.0 14.9 31.2 0
.68.8
2008Amount 9
9441 880 2314 0 64
70Per cent to total 11
.35.0 10.0 26.3 - 73
.7
2009Amount 9
7454 103
52464 5
18916
Per cent to total 8.
4.0 9.1 21.6 0.
78.0
Source: Computed by author using RBI data
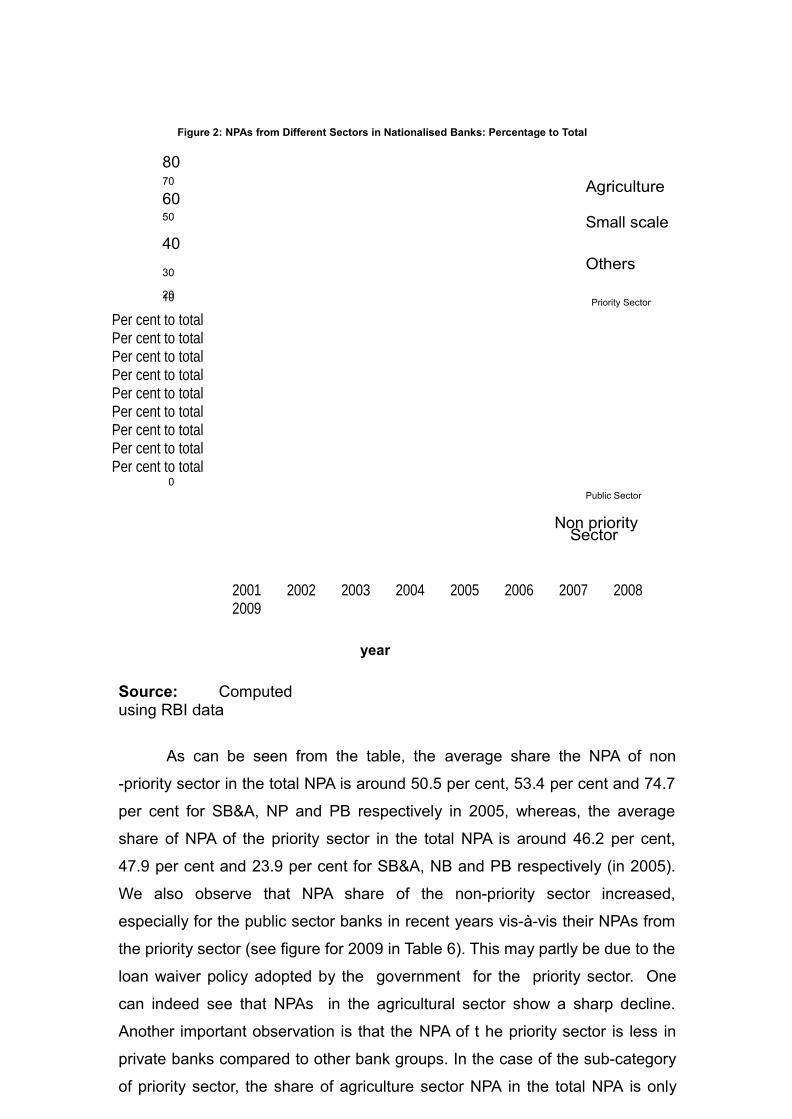
Figure 2: NPAs from Different Sectors in Nationalised Banks: Percentage to Total
8070 Agriculture6050 Small scale40
30 Others
20Priority Sector10
Per cent to totalPer cent to totalPer cent to totalPer cent to totalPer cent to totalPer cent to totalPer cent to totalPer cent to totalPer cent to total
0 Public Sector
Non prioritySector
2001 2002 2003 2004 2005 2006 2007 2008 2009
year
Source: Computed using RBI data
As can be seen from the table, the average share the NPA of non
-priority sector in the total NPA is around 50.5 per cent, 53.4 per cent and 74.7
per cent for SB&A, NP and PB respectively in 2005, whereas, the average
share of NPA of the priority sector in the total NPA is around 46.2 per cent,
47.9 per cent and 23.9 per cent for SB&A, NB and PB respectively (in 2005).
We also observe that NPA share of the non-priority sector increased,
especially for the public sector banks in recent years vis-à-vis their NPAs from
the priority sector (see figure for 2009 in Table 6). This may partly be due to the
loan waiver policy adopted by the government for the priority sector. One
can indeed see that NPAs in the agricultural sector show a sharp decline.
Another important observation is that the NPA of t he priority sector is less in
private banks compared to other bank groups. In the case of the sub-category
of priority sector, the share of agriculture sector NPA in the total NPA is only

around 4.61 per cent for private banks whereas it is around 16 per cent for
SB&A and 13 per cent for NB.
While it has been often highlighted in the literature whenever NPA in the priority sector is less
than that of the non-priority sector, a point often missed is that the priority
sector constitute s about 40 per cent of total lending. Therefore, it is important
to examine NPA figures in proportion to the advances made in that particular
sector. Computation of sector-wise NPAs indeed reveals that NPA from the SSI
sector is much higher that the other sectors. While NPAs from the agricultural
sector was about
12.7 per cent in 2002 for the nationalised banks, it was as high as 18.8 per
cent for the SSI sector in the same year. For the non-priority sectors together,
the NPA as a percentage of total advances declined from about 8 per cent to 4
per cent from 2002 to 2005. This percentage however declined to 6 per cent
for the agriculture sector and to 11 per cent for the SSI sector in 2005. Thus,
the declining trend is prominent ly uniform across all sectors. While the
problem of non-recovery of agricultural loans is a well-discussed issue
(Bardhan, 1989, Bell and Srinivasan, 1989, Rajeev and Dev, 2007), not many
studies in India have focused on the non -recovery of loans in the SSI sector (see Gang, 1995 and
Rajeev, 2008).
The above figures reveal that even though the SSI sector currently has
a higher NPA to total advance ratio there is an improvement in recovery rates
and NPA from this sector shows a declining trend even in real terms.
An important question arises at this juncture. While it is essential to
reduce NPA to sustain banks, will such an endeavour have an adverse effect
on the poor, especially poor farmers and small entrepreneurs? The issue
assumes importance as this group constitute s more than 60 per cent of the
population of India.
Self Help Groups: An Institution that makes the Poor Bankable
Potential borrowers in the priority sector (both agriculture and SSI) are mostly
poor. Banks, in an attempt to reduce their NPAs, often shun these borrowers.
These borrowers then turn to the informal lenders with unfavourable terms
such as high rates of interest. These lenders, however, do not face the risk of
default from these poor borrowers. This shows that poor are somehow able to
repay, which is an important message for the formal banking sector. The self-
help group is an institution, which has, indeed proved to the banks that the
poor are bankable.
A self-help group in India refers to a small group of 10 to 20 individuals
who come together to carry out saving and lending activities amongst
themselves. They are usually informal organisations and are not legally
incorporated. According to the National Bank for Agriculture and Rural
Development (NABARD), SHGs are , “small, economically homogenous
affinity groups of usually rural poor, voluntarily formed to save and mutually
contribute to a common fund to be lent to its members as per the group
members’ decision.” Saving is collected in small amounts at frequent intervals
usually once a week or a fortnight during group meetings. The group meeting
is also the forum in which it is decided who gets credit and how much, usually
in a collaborative process. The most important feature is that the group takes
joint liability for recovery of the loan.
The provision of hassle-free access to the financial services and
products through the formal sector at low rates of interest has a number of
benefits for the poor. In addition, the programme fulfills several other

objectives. First, it provides consumption as well as production loan without
any collateral. Secondly, it enables SHG members to reap economic benefit
out of mutual help, solidarity and joint responsibility. The programme also
ensures long-term help for a number of activities, most notably income
-generating activities. Constant dealing with the banking sector helps the
members to be at ease with the formal lending institutions. It also helps the
formal banking sector to identify rural needs and provide assistance
accordingly. In other words, capacity-building takes place at both ends.
Maintenance of accounts on a regular basis helps the group members to
understand how to handle financial resources.
Currently , SHGs in India are formed mainly by women. NABARD is presently in the process of
forming farmers groups on the same principle. If such endeavours become
successful, it will not only solve the problem of non -repayment of loans but
also the improve accessibility to credit for the poor.

Conclusion
The NPA is the root cause of the global financial crisis that we observed
recently. The world is still trying to recover from the after-effects of the crisis.
The problem of NPA has received considerable attention after the
liberalisation of the financial sector in India. Accounting norms have
been modified substantially and mechanisms are in place for reduction of bad
loans. Our discussions with banks, however, show that such decline is mainly
due to the awareness of the problem of bad loans at the bank level (see
Rajeev and Mahesh, 2007). It remains true that NPA jn the priority sector is still
higher than that of the non-priority sector. Within the priority sector, the SSI’s
performance is the worst. However, even this sector has shown reduction in
bad loans over time. In the process of reducing NPAs, will banks shun the poor
borrowers? In this context , the self-help group model can be applied to some
of the sectors to help the poor access loans and ensure repayment for the
banks.
References
Bardhan, P (1989). The Economic Theory of Agrarian Institutions. Oxford, NY: Claredon Press.
Bell, C and T N Srinivasan (1989 ). Some Aspects of Linked Products and
Credit Market Contracts Among Risk Neutral Agents. In Pranab K
Bardhan (ed), The Economic Theory of Agrarian Institutions. Oxford:
Oxford University Press.
Battese, G E and T J Coelli (1995). A Model for Technical Inefficiency Effects in a Stochastic Frontier
Production Function for Panel Data. Empirical Economics, 20 (2): 325-32.
Bonin J P and Yiping H (2001). Dealing with Bad Loans of the Chinese Banks.
Workin g paper No. 357.
http://www.wdi.umich.edu/files/Publications/WorkingPapers/wp357.pdf
Chaitanya V Krishna (2004). Causes of Non-performing Assets in Public Sector Banks. Economic
Research, 17 (1) : 16-30.
Chakravarty, S (1985). Report of the Committee to Review the Working of the Monetary System.
Mumbai: Reserve Bank of India.
Das Abhiman (2002). Risk and Productivity Change of Public Sector Banks. Economic and Political
Weekly, 37 (5): 437-48.
Gang, I N (1995). Small Firms in India: A Discussion of Some Issues. In Mookherjee, D (eds) , Indian
Industry: Policies and Performance. New Delhi: Oxford University Press.
Ghosh, S (2005). Does Leverage Influence Bank’s Non-Performing Loan?: Evidences from India. Applied
Economic Letters, 12 (15): 913-18.
Goldsmith, Raymond W (1969). Financial Structure and Development . Yale University Press.
King, R G and R Levine (1993). Finance and Growth: Schumpeter Might Be Right. Quarterly Journal of
Economic , 108 (3): 717-37.
Krueger Anne and A Tornell (1999). The Role of Bank Restructuring in Recovering from Crises: Mexico
1995 -98. NBER Working pare 7042 . Cambridge, MA : National Bureau
of Economic Research. Kunt D A and E Detragiache (1997). The
Determinants of Banking Crises: Evidences from Developed
and Developing Countries. IMF Staff Papers, 45 (1): 81-109.
Mor N and B Sharma (2003). Rooting out Non-performing Assets. Paper
presented at the 5th annual conference on Money and Finance in the
Indian Economy, at IGIDR, Mumbai.
Munehisa, Kasuya (1998). Non-performing Assets of Banks and Financial Intermediation: Experinecs of
Japan in the Inter-War Period. Kobe Economic and Business Review, 43: 119-46.
Narasimham, M (1998). Report of the Committee on Banking Sector Reform. Mumbai: Reserve Bank of
India.
Rajaraman I, S Bhaoumik and N Bhatia (1999). NPA Variations Across Indian Commercial Banks: Some
Findings. Economic and Political Weekly , 34 (3/4): 161 -68.
Rajeev, Meenakshi and H P Mahesh (2007). Assets as Liabilities: Non Performing Assets in Commercial
Banks of India. Research Monitor, Global Development Network, 3: 17-19.
Rajeev, Meenakshi and Shamistha Deb (2007a). Banking on Baniyas for Credit . Economic Political
Weekly, 42 (4): 280-83,
Rajeev, Meenakshi and Sharmistha Dev (2007b). Capitalising on Credit: The
Extracting Baniya as Symbiotic Entrepreneur. In Amandio F C da Silva
(eds), Social Banking: Perspectives and Experiences. Hyderabad: The
ICFAI University Press.
Rajeev, Meenakshi (2008) . Small Scale Industries Sector in India. In Prof Nelson Ndubisi (ed), SME
Development and Practices in Asia Pacific RIM.
Malaysia: Arah Publishers. Reserve Bank of India (Various
Issues). Statistical Tables Relating to Banks in India.
Sen Sunanda and S K Ghosh (2005). Basel Norms, Indian Banking Sector
and Impact on Credit to SMEs and the Poor. Economic and Political
Weekly, 14 (12): 1167-80.
Recent Working Papers190 Social Capital in Forest Governance
RegimesSangita S N
191 Agriculture in Karnataka: A Historical View After the Fall of Serirangapatana R S Deshpande and Malini Tantri
192 Personality Traits and Administrators
Anitha V
193 Sustainability of Indian Agriculture: Towards an AssessmentV M Rao
194 Emerging Development Issues of Greater
BangaloreG S Sastry
195 Rural Infrastructure Development Fund: Need for a Track ChangeMeenakshi Rajeev
196 Emerging Ground Water Crisis in Urban Areas — A Case Study of Ward No. 39, Bangalore CityK V Raju, S Manasi and N Latha
197 In Pursuit of India’s Export earning advantage: An Assessment of IT-Enabled Services IndustryMeenakshi Rajeev
198 A Patriarchal Link to HIV/AIDS in India
Skylab Sahu
199 Collective Action and Property Rights: Some Critical Issues in the Context of KarnatakaK G Gayathri Devi
200 State, Society and Inclusive Governance: Community Forests in Andhra Pradesh, Karnataka and OrissaS N Sangita
201 Urban Poverty and Links with the
Environment: An ExplorationK G Gayathri Devi
202 Groundwater Over-
exploitation, Costs and Adoption Measures in the Central Dry Zone of KarnatakaAnantha K H and K V Raju
203 Changing Child Population: Growth, Trends and Levels in KarnatakaC M Lakshmana
204 Awareness About HIV/AIDS Among
Karnataka Woment: An Analysis of RCH2002-04 DataK S Umamani
205 The Microfinance Promise in Financial Inclusion and Welfare of the Poor: Evidence from Karnataka, IndiaNaveen K Shetty
206 Structure of Central Himalayan Forests Under Different Management Regimes: An Empirical StudySunil Nautiyal
207 Poverty and Natural Resources: Measuring the Links (Some Issues in the Context of Karnataka)K G Gayathri Devi
208 Federalism and Decentralisation in India: Andhra Pradesh and Tamil NaduV Anil Kumar

209 Capital, ‘Development’ and Canal
Irrigation in Colonial IndiaPatric McGinn
210 Gender, Ecology and Development in Karnataka: Situation and Tasks Ahead K G Gayathri Devi
211 Greenhouse Gases Emission and Potential Corbon Sequestration: A Case Study of Semi-Arid Area in South India Lenin Babu and K V Raju
212 Emerging Trends in Managing Drinking Water – Case Studies of Coastal Villages in KarnatakaManasi S, Latha N and K V Raju
213 Spatio-Temporal Analysis of Forests Under Different Management Regimes Using Landsat and IRS ImagesSunil Nautiyal
214 Traditional Knowledge System (Medicine): A Case Study of Arakalgud Taluk, Karnataka, IndiaB K Harish, K Lenin Babu
215 Tribal Movement in Orissa: A Struggle
Against Modernisation?Patibandla Srikant
216 Technological Progress, Scale Effect and Total Factor Productivity Growth in Indian Cement Industry: Panel Estimation of Stochastic Production FrontierSabuj Kumar Mandal and S Madheswaran
217 Fisheries and Livelihoods in Tungabhadra Basin, India:
Current Status and Future PossibilitiesManasi S, Latha N and K V Raju
218 Economics of Shrimp Farming: A Comparative Study of Traditional Vs. Scientific Shrimp Farming in West Bengal Poulomi Bhattacharya
219 Output and Input Efficiency of Manufacturing Firms in India: A Case of the Indian Pharmaceutical Sector Mainak Mazumdar, Meenakshi Rajeevand Subhash C Ray
220 Panchayats, Hariyali Guidelines and Watershed Development: Lessons from KarnatakaN Sivanna
221 Gender Differential in Disease Burden: It’s Role to Explain Gender Differential in MortalityBiplab Dhak and Mutharayappa R
222 Sanitation Strategies in Karnataka: A ReviewVeerashekharappa and Shashanka Bhide
223 A Comparative Analysis of Efficiency and productivity of the Indian Pharmaceutical Firms: A Malmquist-Meta-Frontier ApproachMainak Mazumdar and Meenakshi Rajeev
224 Local Governance, Patronage and Accountability in Karnataka and Kerala Anand Inbanathan
225 Downward Dividends of Groundwater Irrigation in Hard Rock Areas of Southern Peninsular IndiaAnantha K H
226 Trends and Patterns of Private Investment in IndiaJagannath Mallick
227 Environmental Efficiency of the Indian Cement Industry: An Interstate Analysis Sabuj Kumar Mandal and S Madheswaran
228 Determinants of Living Arrangements of
Elderly in Orissa: An AnalysisAkshaya Kumar Panigrahi
229 Fiscal Empowerment of Panchayats in
India: Real or Rhetoric?M Devendra Babu
230 Energy Use Efficiency in Indian Cement Industry: Application of Data Envelopment Analysis and Directional Distance FunctionSabuj Kumar Mandal and S Madheswaran
231 Ethnicity, Caste and Community in a
Disaster Prone Area of OrissaPriya Gupta
232 Koodankulam Anti-Nuclear Movement: A Struggle for Alternative Development? Patibandla Srikant
233 History Revisited: Narratives on Political and Constitutional Changes in Kashmir (1947-1990)Khalid Wasim Hassan
234 Spatial Heterogeneity and Population
Mobility in IndiaJajati Keshari Parida and S Madheswaran
235 Measuring Energy Use Efficiency in Presence of Undesirable Output: An Application of Data Envelopment Analysis (DEA) to Indian Cement IndustrySabuj Kumar Mandal and S Madheswaran
236 Increasing trend in Caesarean Section Delivery in India: Role of Medicalisation of Maternal HealthSancheetha Ghosh
237 Migration of Kashmiri Pandits: Kashmiriyat Challenged?Khalid Wasim Hassan
238 Causality Between Energy Consumption and Output Growth in Indian Cement Industry: An Application of Panel Vector Error Correction ModelSabuj Kumar Mandal and S Madheswaran

239 Conflict Over Worship:A Study of the Sri Guru Dattatreya Swami Bababudhan Dargah in South IndiaSudha Sitharaman
240 Living Arrangement Preferences of the
Elderly in Orissa, IndiaAkshaya Kumar Panigrahi
241 Challenges and Pospects in the Measurement of Trade in Services Krushna Mohan Pattanaik
242 Dalit Movement and Emergence of the Bahujan Samaj Party in Uttar Pradesh: Politics and PrioritiesShyam Singh
243 Globalisation, Democratic Decentralisation and Social Secutiry in IndiaS N Sangita and T K Jyothi
244 Health, Labour Supply and Wages: A Critical Review of LiteratureAmrita Ghatak
245 Is Young Maternal Age A Risk Factor for Sexually Transmitted Diseases and Anemia in India? An Examination in Urban and Rural AreasKavitha N
246 Patterns and Determinants of Female Migration in India: Insights from Census Sandhya Rani Mahapatro
247 Spillover Effects from Multinational Corporations: Evidence From West Bengal Engineering IndustriesRajdeep Singha and K Gayithri
248 Effectiveness of SEZs Over EPZs Structure: The Performance at Aggregate LevelMalini L Tantri
249 Income, Income Inequality
and Mortality An empirical investigation of the relationship in India, 1971-2003K S James and T S Syamala
250 Institutions and their Interactions: An Economic Analysis of Irrigation Institutions in the Malaprabha Dam Project Area, Karnataka, IndiaDurba Biswas and L Venkatachalam
251 Performance of Indian SEZs: A Disaggregated Level Analysis Malini L Tantri

Price: Rs. 30.00 ISBN 978-81-7791-108-4
INSTITUTE FOR SOCIAL AND ECONOMIC CHANGE
Dr V K R V Rao Road, Nagarabhavi P.O., Bangalore - 560 072, India
Phone: 0091-80-23215468, 23215519, 23215592; Fax: 0091-80-23217008
E-mail: [email protected] ; Web: www.isec.ac.in


