www.dw-1.com Russian Oilfield Services “a $23 billion market by 2011” London Home Counties Branch – 25 th June 2007 Steve Robertson Assistant Director, Manager Oil & Gas Rod Westwood Analyst, Oil & Gas
Transcript
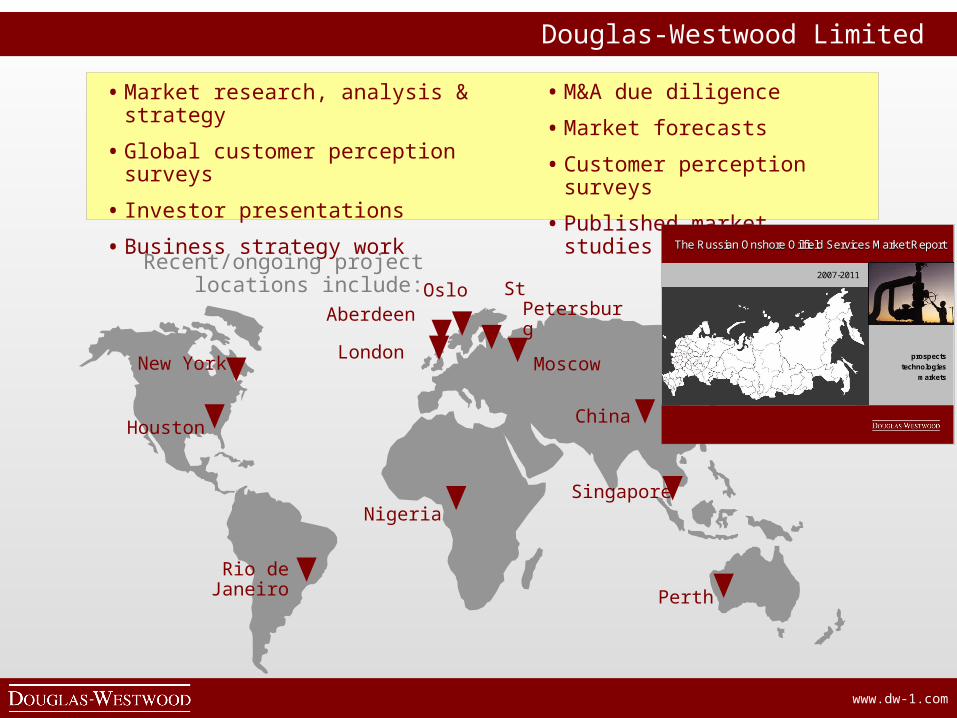
www.dw-1.com
Russian Oilfield Services “a $23 billion market by 2011”
London Home Counties Branch – 25th June 2007
Steve RobertsonAssistant Director, Manager Oil & Gas
Demand – EIA forecast 118 million barrels per day by 2030
www.dw-1.com
• “The peak oil theory is flawed…..production is more likely to trace an undulating plateau that will last for a decade or more beyond 2030” Review of CERA report, Oil & Gas Journal Nov 27th, 2006
• “production will plateau at above 118 million b/d…..in 2031” Prof. H. R. Linden, Oil & Gas Journal Nov 27 th, 2006
• “CERA’s report contends that it is not reservoir constraints but aboveground factors such as geopolitics, conflict, economics, and
technology that will dictate future oil supply.” Review of CERA report, Oil & Gas Journal Nov 27th, 2006
Global oil reserves are not the issue. The key issue is our ability to produce them.
Longer term….limits of supply could come into play
• An oil supply peak? • Massive increases in oil prices could
result until alternatives are found• How long might that take? Some
think 20 years!
Near term…. Political influences could support prices
• OPEC gains influence over another 1.4 mm bpd via Angola
• Underpinning? The Saudi Arabian economy needs $45 oil
• OPEC would like $60 target price?• Oil supplies look set to remain
tight, supporting prices
www.dw-1.com
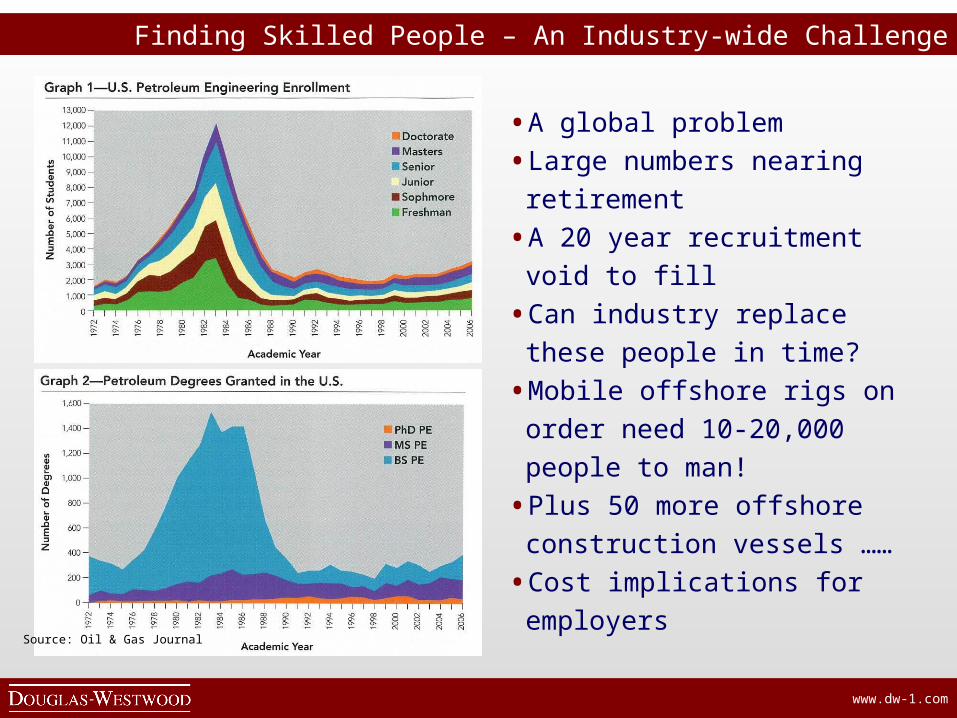
• A global problem
• Large numbers nearing retirement
• A 20 year recruitment void to fill
• Can industry replace these
people in time?
• Mobile offshore rigs on order
need 10-20,000 people to man!
• Plus 50 more offshore
construction vessels ……
• Cost implications for employers
Source: Oil & Gas Journal
Finding Skilled People – An Industry-wide Challenge
www.dw-1.com
•Arctic
•HPHT
•H2S
•Deepwater
•Politically unstable
The Easy Oil has been Found – the future?...Harsh Environments
www.dw-1.com
Oil & Gas Industry Cost Escalation
www.dw-1.com
Source: Lehman Brothers survey of 325 oil & gas companies E&P spend, 2006
0
50
100
150
200
250
300
350
Dec-04 Jun-05 Dec-05 Jun-06 Dec-06 07e
E&
P S
pend
($b
illion
s)
Oil Producers’ Equipment Expenditure
• Worldwide expenditure increasing year on year, $267 billion expenditure in 2006• Survey excludes some big spending state NOCs (e.g. Saudi Aramco)• Oil co. budgets based on oil price of $55.50 & gas $6.70 • “Companies would only reduce spend if oil prices fell to $42”• Investment decision threshold “in $20’s range”
www.dw-1.com
• A major power shift is underway
• 75% of oil reserves now held by NOCs
• Only 4% now controlled by the oil majors
• NOCs need technology & need the know-how
(But do they need / trust the oil majors?)
• NOCs are cooperating with each other
• NOCs governments want local content
“National oil companies will lead the 2007 increase in international spending with the largest spending growth among the Russian oil companies” Lehman Bros. Dec ’06 Survey
The Rise of the NOCs
www.dw-1.com
• Gazprom holds 16% of the world’s
gas reserves
• 2/3rd of Gazprom revenues are
from gas exports ($39 billion)
• Jan 1, 2006, supplies cut to
Ukraine (and parts of Europe)
• Jan 1 2007, doubles gas price to
Belarus & Georgia
• Wants to set up a “gas OPEC”?
• Jan 8 2007, Russia halts oil
exports via Belarus (to Europe!)
• “A giant aware of its power”
Sources: ISN Security Watch, 10 July 2006
Financial Times, 14 & 15 December 2006
Houston Chronicle, 8 Jan 2006
The Russian NOCs
www.dw-1.com
Source: Douglas-Westwood
0.0 0.1 0.2 0.3 0.4 0.5 0.6 0.7 0.8 0.9 1.0
Kazakhstan
Algeria
Mexico
Nigeria
India
Iran
Venezuela
China
Canada
Russia
USA
Index Relative to USA
2005
2010
Russia ranks third overall in the world for onshore expenditure throughout 2001-2005 and will continue to hold this position until 2010.
Although not included in this analysis, Saudi Arabia ranks second in the world for total onshore expenditure.
Onshore expenditure in Russia is increasing year on year compared with the US index.
Strong growth can be expected in Kazakhstan as this country continues to develop.
Russian Expenditure Comparison
www.dw-1.com
Douglas-Westwood Overview
Macro-economic trends
Russian regional overview
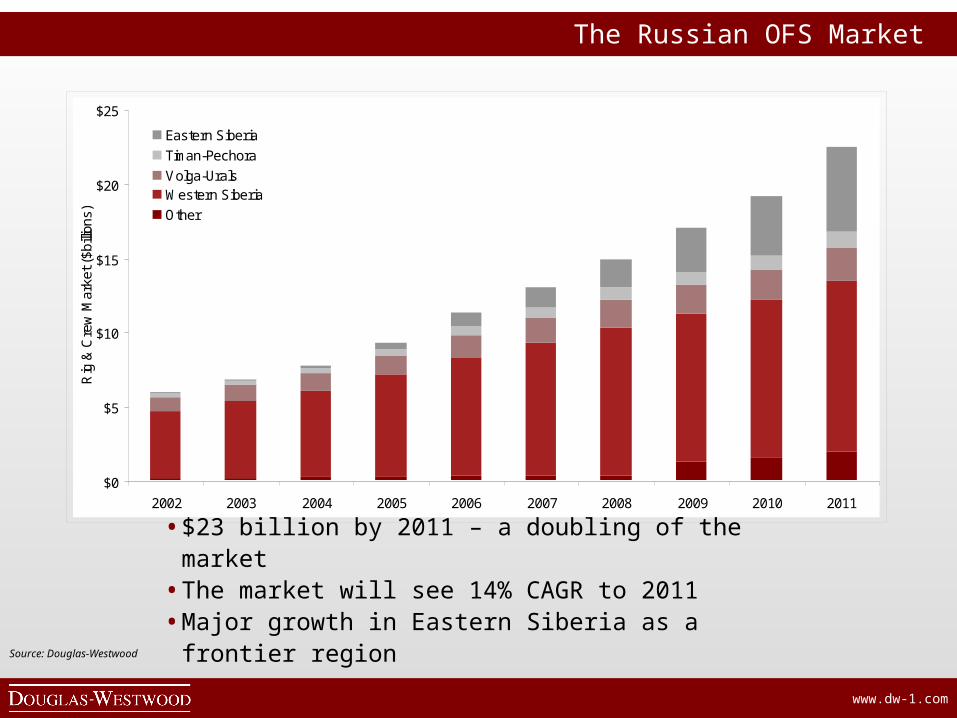
The Russian OFS Market
Conclusions
www.dw-1.com
Russian Oil Production
0
1
2
3
4
5
6
7
8
9
1019
30
1935
1940
1945
1950
1955
1960
1965
1970
1975
1980
1985
1990
1995
2000
2005
2010
2015
2020
2025
2030
2035
2040
2045
2050
Ann
ual O
il &
Gas
Pro
duct
ion
(billi
on b
oe)
Gas
Oil
• Production recovered since post-Soviet trough
• Major drilling & workover efforts – recent gains in production forecast to continue through to 2035
• Gas to play increasingly prominent role
www.dw-1.com
Russian Oil & Gas Production
Western Siberia
0
1
2
3
4
5
6
7
2002 2003 2004 2005 2006 2007 2008 2009 2010 2011
Tot
al O
nsho
re P
rodu
ctio
n (b
nboe
)
Gas
Oil
• Mature region• Accounts for 60% of production• Samotlor (Russia’s largest oilfield)
peaked at 3.5 mboe/day and is now in decline
www.dw-1.com
Russian Oil Production
0
100
200
300
400
500
600
700
800
900
1,000
2002 2003 2004 2005 2006 2007 2008 2009 2010 2011
Tot
al O
nsho
re P
rodu
ctio
n (m
mbo
e)
Gas
Oil
Volga Urals
• Most mature Russian region• Major EOR efforts underway• Romashkino oilfield now in decline
www.dw-1.com
Russian Oil Production
0
50
100
150
200
250
300
350
2002 2003 2004 2005 2006 2007 2008 2009 2010 2011
Tot
al O
nsho
re P
rodu
ctio
n (m
mbo
e)
Gas
Oil
Timan-Pechora• Mainly a post-Soviet region• Strong growth forecast• Holds 8% of Russian reserves
www.dw-1.com
Russian Oil Production
0
50
100
150
200
250
2002 2003 2004 2005 2006 2007 2008 2009 2010 2011
Tot
al O
nsho
re P
rodu
ctio
n (m
mbo
e)
Gas
Oil
Eastern Siberia
• A region in its infancy• Strong growth forecast• Lack of infrastructure in place• ‘Difficult’ geology – impact on cost• A major future OFS opportunity
www.dw-1.com
Douglas-Westwood Overview
Macro-economic trends
Russian regional overview
The Russian OFS Market
Conclusions
www.dw-1.com
Methodology – Challenges relating to Data Access
• Very little public-domain data• Small independent companies have very little public visibility• Few requirements to record information, companies now moving to western
business practices (but slowly!)• Reluctance of operators to release data, particularly with regards pricing• No rig count exists for Russia• Inactive rig cannibalisation
• Face-to-face meetings with major operators and drilling contractors• Evaluation and appraisal of Russian sources (e.g. Ministry information)• Sense-checking on multiple levels• Input and feedback from DWL’s due-diligence experience
Ch
alle
ng
esW
ork
aro
un
ds
www.dw-1.com
.
In-House Service Company
Oil Major
SpecialistSubsidiary
SpecialistSubsidiary
SpecialistSubsidiary
State Bodies
Service Teams
Development of the Russian OFS Industry
Soviet Post-Soviet
IndependentIndependentIndependent
www.dw-1.com
0%
10%
20%
30%
40%
50%
60%
70%
80%
90%
100%
2002 2003 2004 2005 2006 2007 2008 2009 2010 2011
Indigenous
Western
In-House
Source: Douglas-Westwood
Development of the Russian OFS Industry
Development of the Russian OFS Industry
www.dw-1.com
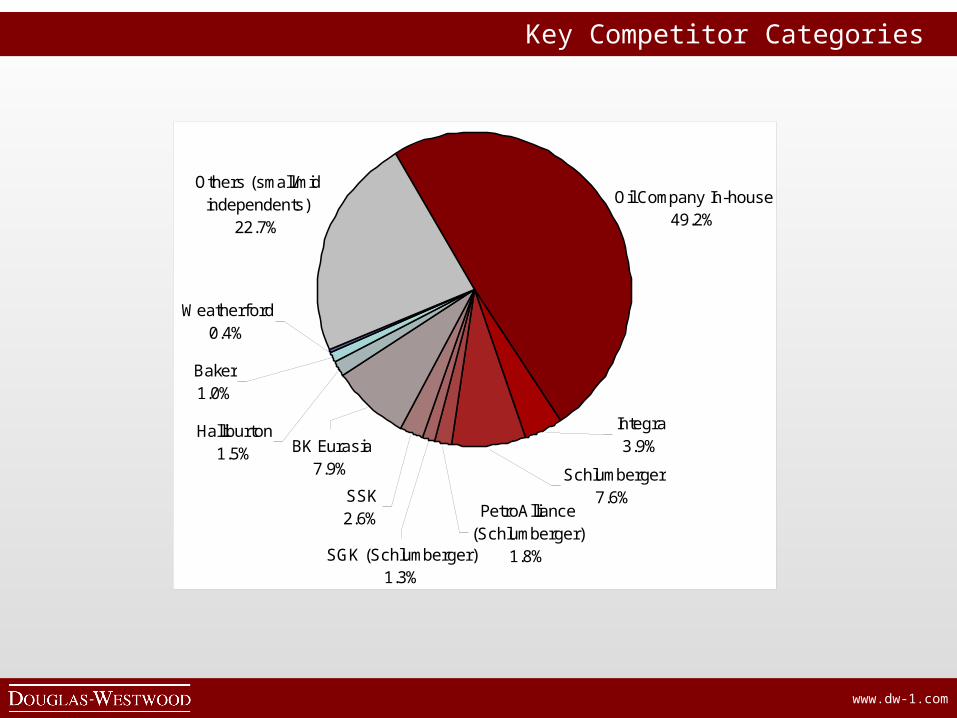
SSK2.6%
Integra3.9%
Schlumberger7.6%
PetroAlliance (Schlumberger)
1.8%SGK (Schlumberger)1.3%
BK Eurasia7.9%
Halliburton1.5%
Baker1.0%
Weatherford0.4%
Others (small/mid independents)
22.7%
Oil Company In-house49.2%
Key Competitor Categories
www.dw-1.com
Qua
lity,
Tec
hno
logy
Price
Russian independent service providers
Russian oil company in-house & affiliates
International service providers
SSK
Key Competitor Categories
www.dw-1.com
Decrease in Downhole Pressure
Maturing Regions
Increase inSand Production
Increase inWater-Cut
ProductionDecrease
TechnologyPush
3D
Se
ism
ic
Art
ifici
al L
ift
San
d C
ontr
ol
Inte
llig
en
t C
om
ple
tions
Dire
ctio
nal
Dri
lling
Hyd
rau
lic F
ract
urin
g
Wat
er
Co
ntr
ol
Res
erv
oir
En
gin
ee
rin
g
Production Increase
Increasing Technology Requirements
• Russian technology is fit-for-purpose• Westerners bring advanced tooling,
downhole technology, EOR methods and project management