1 X-ray CT observations of methane hydrate distribution changes over time in a natural sediment core from the BPX-DOE-USGS Mount Elbert Gas Hydrate Stratigraphic Test Well Timothy J. Kneafsey Emily V. L. Rees Lawrence Berkeley National Laboratory March 31, 2010
Transcript
1
X-ray CT observations of methane hydrate distribution changes
over time in a natural sediment core from the
BPX-DOE-USGS Mount Elbert Gas Hydrate Stratigraphic Test Well
Timothy J. Kneafsey
Emily V. L. Rees
Lawrence Berkeley National Laboratory
March 31, 2010
2
Introduction
When maintained under hydrate-stable conditions, methane hydrate in laboratory samples is often
considered a stable and immobile solid material. Currently, there do not appear to be any studies in
which the long-term redistribution of hydrates in sediments has been investigated in the laboratory.
These observations are important because if the location of hydrate in a sample were to change over
time (e.g. by dissociating at one location and reforming at another), the properties of the sample
that depend on hydrate saturation and pore space occupancy would also change. Observations of
hydrate redistribution under stable conditions are also important in understanding natural hydrate
deposits, as these may also change over time. The processes by which solid hydrate can move
include dissociation, hydrate-former and water migration in the gas and liquid phases, and hydrate
formation. Chemical potential gradients induced by temperature, pressure, and pore water or host
sediment chemistry can drive these processes.
A series of tests were performed on a formerly natural methane-hydrate-bearing core sample from
the BPX-DOE-USGS Mount Elbert Gas Hydrate Stratigraphic Test Well, in order to observe hydrate
formation and morphology within this natural sediment, and changes over time using X-ray
computed tomography (CT). Long-term observations (over several weeks) of methane hydrate in
natural sediments were made to investigate spatial changes in hydrate saturation in the core. During
the test sequence, mild buffered thermal and pressure oscillations occurred within the sample in
response to laboratory temperature changes. These oscillations were small in magnitude, and
conditions were maintained well within the hydrate stability zone.
Sample Description and Laboratory Methods
The natural sediment used in the test sequence was received from BPXA-DOE-USGS Mount Elbert
Gas Hydrate Stratigraphic Test Well. The Mount Elbert site is located in the Milne Point oil field, on
the Alaska North slope. The core used in this series of tests came from 660m below surface level;
part of Unit “C” of the reservoirs sands prevalent in the Milne Point region (Sample HYPV3 in
Kneafsey et al, 2009). After collection, the sample was placed in a pressure vessel and pressurized
with methane to maintain hydrate stability. The vessel was stored under pressure outdoors in the
arctic winter, and later moved to a freezer. Prior to shipment, the pressure vessel was rapidly vented
and the sample was removed and placed in liquid nitrogen (LN – normal boiling point -196°C). After
shipment, the core was removed from liquid nitrogen and the ends were rapidly cut flat. A belt
sander was used to remove the outer layer of the sample in many steps with sequential cooling by
submersion in LN to keep the sample cold. Similarly, holes were drilled in the ends of the sample to
accommodate the thermocouples. The tests described here follow a depressurization test in which
the sample was slowly warmed to 4°C and the hydrate originally present in the sample was
dissociated by depressurization under controlled conditions.
The core sample was encased in a custom-manufactured nitrile butadiene rubber sleeve and placed
in an X-ray transparent aluminium pressure vessel so that the core could be monitored via CT
scanning throughout the tests with little or no disturbance (Figure 1). Thermocouples were inserted
into the ends of the sample, and into the confining fluid surrounding the sample to monitor
temperatures at those locations. Pressure and temperature were continuously monitored and
logged.
3
CT scanning was performed using a modified Siemens Somatom HiQ medical x-ray CT scanner.
Resolution of each scan resulted in voxel dimensions of 195µm x 195µm x 3000µm (x-y-z). Scans
produced 54 x-y cross sectional slices which could then be projected to give a three dimensional
volume of the core sample. Figures presented here show various cross sectional slices of the core
volume. Initial X-Ray CT scanning of the core sample showed two distinct regions having different
density (Figure 2), with 70mm of the core having an average density slightly less of the remaining
92mm. The initial water saturations of each section of the core were slightly different also. The
bottom 70mm (Part A) was calculated to have an initial saturation before hydrate formation of 0.59,
whereas the portion of core from 70-162mm (Part B) had an initial saturation of 0.75. Water
saturations were calculated retrospectively via calibrated CT scans of the core by taking density
values at the condition of interest, when the core was fully water saturated, and also when the core
was fully dried. Further statistics obtained from CT scanning results showed the porosities of Parts A
and B to be 0.29 and 0.28 respectively, with the grain densities of each part found to be 2.65 for Part
A and 2.67 for Part B. Further information of the core sample is awaiting the results of ongoing index
property testing.
Figure 1. Schematic of X-ray transparent pressure vessel used in the test sequence.
4
Figure 2. Z slice through Mount Elbert core sample with no gas hydrate content, before start of test sequence
Test Sequences
The test sequence consisted of two phases. The first phase involved making hydrate through
pressurization. The temperature of the core was initially lowered from laboratory ambient
temperature to 4°C with the pore pressure of the system at 2.9MPa (methane hydrate unstable) and
confining fluid pressure at 4MPa. Hydrate formation was initiated by increasing the pore pressure to
4.8MPa and the confining pressure to 5.5MPa so as to place the core inside the stability zone for
methane hydrate. Formation initiated after only 9 minutes inside the stability zone, noted by an
increase in internal temperature of more than 1°C. Internal temperature inside the core returned to
the applied temperature (~4°C) after 10 hours, and hydrate formation was considered complete. The
core sample remained in the hydrate stability zone for 60 days during which time X-ray CT scans
were conducted at intervals of 3 to 10 days.
After approximately 60 days, dissociation of the hydrate was initiated by a power failure that caused
the temperature of the sample to increase. We assume the core sample warmed to room
temperature (approximately 20°C) but remained at about 4.8MPa, since the produced methane
vented to a large, pressurized bottle. These conditions are outside of the stability zone for methane
hydrate. After an unknown period of time (less than 4 days), power was restored and the
temperature of the system returned to 4°C, thereby reforming methane gas hydrate in the core via
cooling. X-ray CT scanning revealed hydrate had formed inside the core, and the sample was allowed
to remain under hydrate stable conditions for 41 days for continued observation, and creating the
second phase of the test sequence.
5
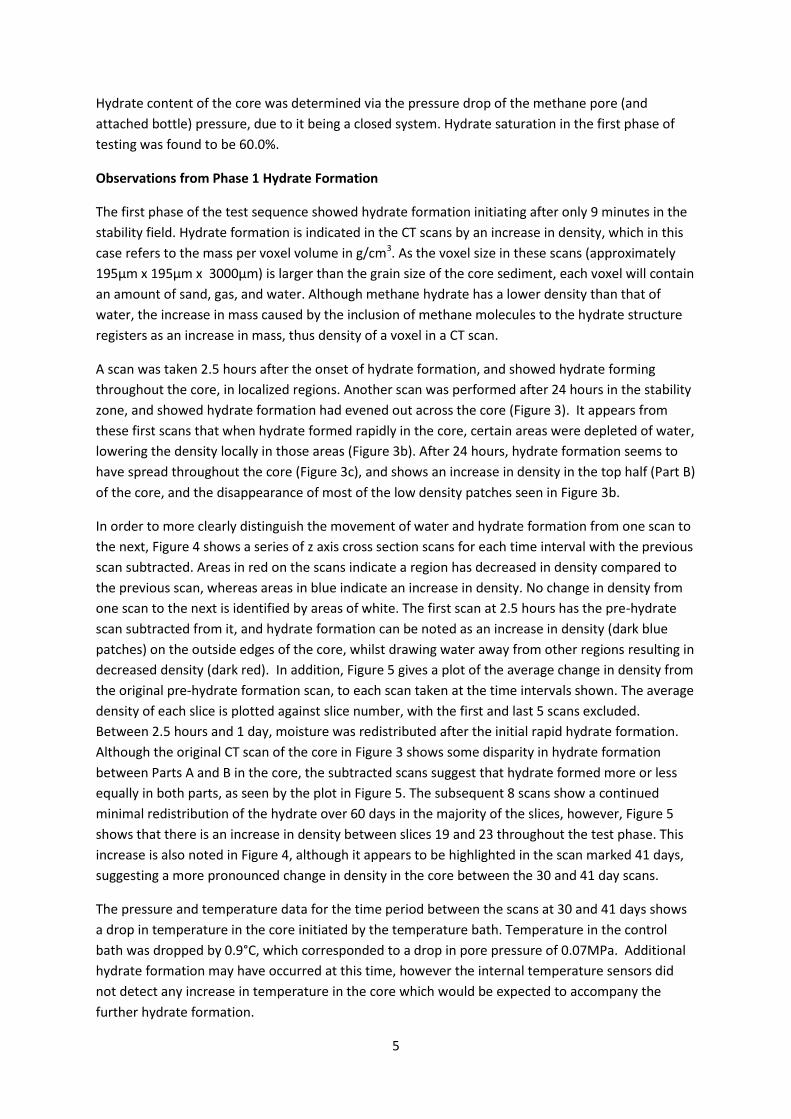
Hydrate content of the core was determined via the pressure drop of the methane pore (and
attached bottle) pressure, due to it being a closed system. Hydrate saturation in the first phase of
testing was found to be 60.0%.
Observations from Phase 1 Hydrate Formation
The first phase of the test sequence showed hydrate formation initiating after only 9 minutes in the
stability field. Hydrate formation is indicated in the CT scans by an increase in density, which in this
case refers to the mass per voxel volume in g/cm3. As the voxel size in these scans (approximately
195µm x 195µm x 3000µm) is larger than the grain size of the core sediment, each voxel will contain
an amount of sand, gas, and water. Although methane hydrate has a lower density than that of
water, the increase in mass caused by the inclusion of methane molecules to the hydrate structure
registers as an increase in mass, thus density of a voxel in a CT scan.
A scan was taken 2.5 hours after the onset of hydrate formation, and showed hydrate forming
throughout the core, in localized regions. Another scan was performed after 24 hours in the stability
zone, and showed hydrate formation had evened out across the core (Figure 3). It appears from
these first scans that when hydrate formed rapidly in the core, certain areas were depleted of water,
lowering the density locally in those areas (Figure 3b). After 24 hours, hydrate formation seems to
have spread throughout the core (Figure 3c), and shows an increase in density in the top half (Part B)
of the core, and the disappearance of most of the low density patches seen in Figure 3b.
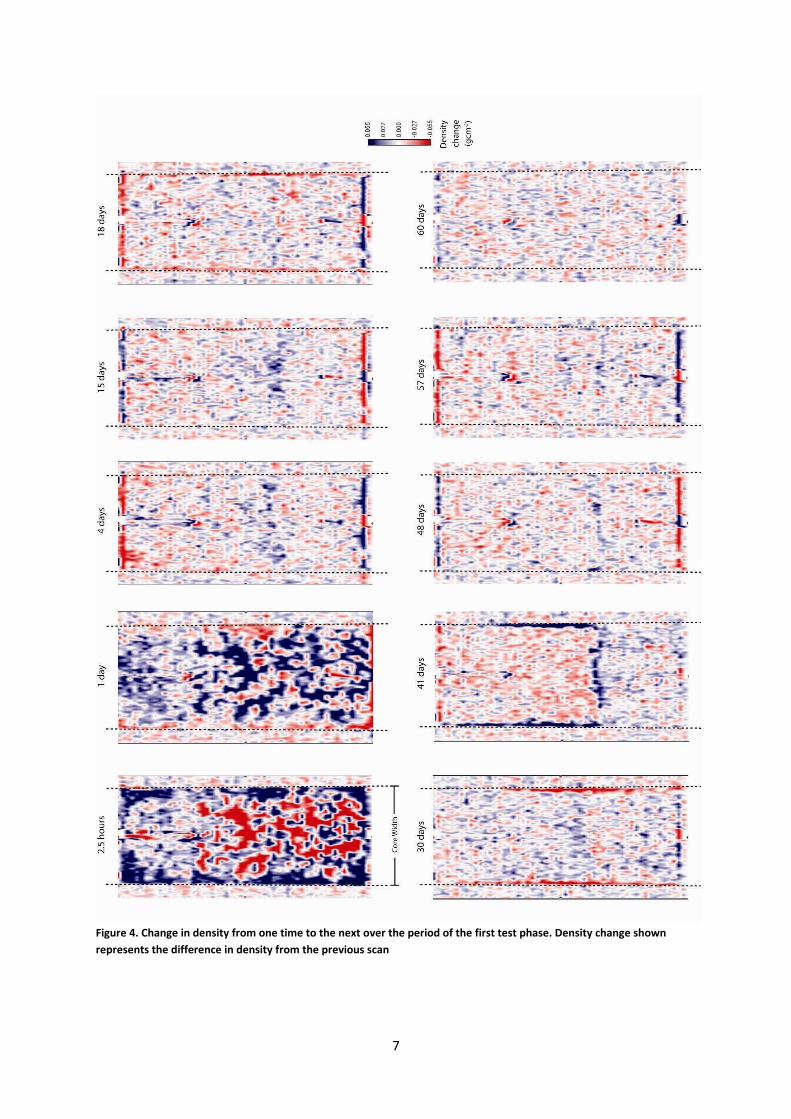
In order to more clearly distinguish the movement of water and hydrate formation from one scan to
the next, Figure 4 shows a series of z axis cross section scans for each time interval with the previous
scan subtracted. Areas in red on the scans indicate a region has decreased in density compared to
the previous scan, whereas areas in blue indicate an increase in density. No change in density from
one scan to the next is identified by areas of white. The first scan at 2.5 hours has the pre-hydrate
scan subtracted from it, and hydrate formation can be noted as an increase in density (dark blue
patches) on the outside edges of the core, whilst drawing water away from other regions resulting in
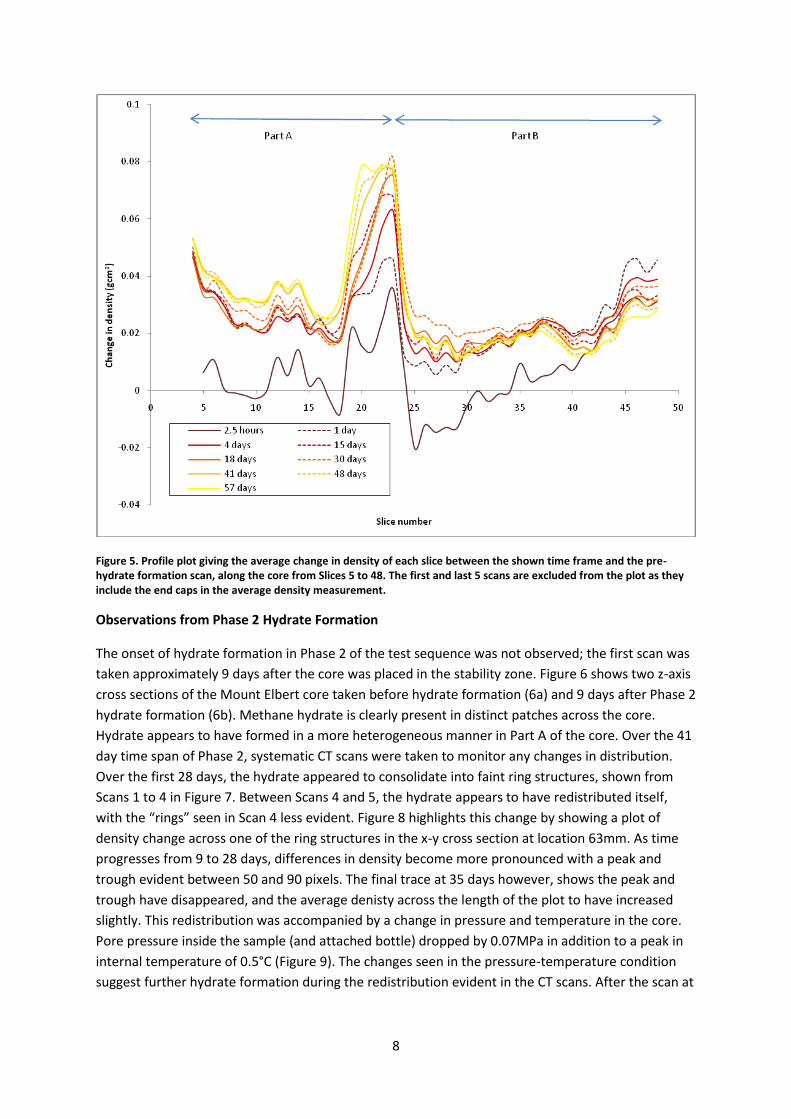
decreased density (dark red). In addition, Figure 5 gives a plot of the average change in density from
the original pre-hydrate formation scan, to each scan taken at the time intervals shown. The average
density of each slice is plotted against slice number, with the first and last 5 scans excluded.
Between 2.5 hours and 1 day, moisture was redistributed after the initial rapid hydrate formation.
Although the original CT scan of the core in Figure 3 shows some disparity in hydrate formation
between Parts A and B in the core, the subtracted scans suggest that hydrate formed more or less
equally in both parts, as seen by the plot in Figure 5. The subsequent 8 scans show a continued
minimal redistribution of the hydrate over 60 days in the majority of the slices, however, Figure 5
shows that there is an increase in density between slices 19 and 23 throughout the test phase. This
increase is also noted in Figure 4, although it appears to be highlighted in the scan marked 41 days,
suggesting a more pronounced change in density in the core between the 30 and 41 day scans.
The pressure and temperature data for the time period between the scans at 30 and 41 days shows
a drop in temperature in the core initiated by the temperature bath. Temperature in the control
bath was dropped by 0.9°C, which corresponded to a drop in pore pressure of 0.07MPa. Additional
hydrate formation may have occurred at this time, however the internal temperature sensors did
not detect any increase in temperature in the core which would be expected to accompany the
further hydrate formation.
6
Figure 3. Z-axis cross sections from X-ray CT scans of Mount Elbert core before, during and after hydrate formation in Phase 1 of the test sequence.
7
Figure 4. Change in density from one time to the next over the period of the first test phase. Density change shown
represents the difference in density from the previous scan
8
Figure 5. Profile plot giving the average change in density of each slice between the shown time frame and the pre-hydrate formation scan, along the core from Slices 5 to 48. The first and last 5 scans are excluded from the plot as they include the end caps in the average density measurement.
Observations from Phase 2 Hydrate Formation
The onset of hydrate formation in Phase 2 of the test sequence was not observed; the first scan was
taken approximately 9 days after the core was placed in the stability zone. Figure 6 shows two z-axis
cross sections of the Mount Elbert core taken before hydrate formation (6a) and 9 days after Phase 2
hydrate formation (6b). Methane hydrate is clearly present in distinct patches across the core.
Hydrate appears to have formed in a more heterogeneous manner in Part A of the core. Over the 41
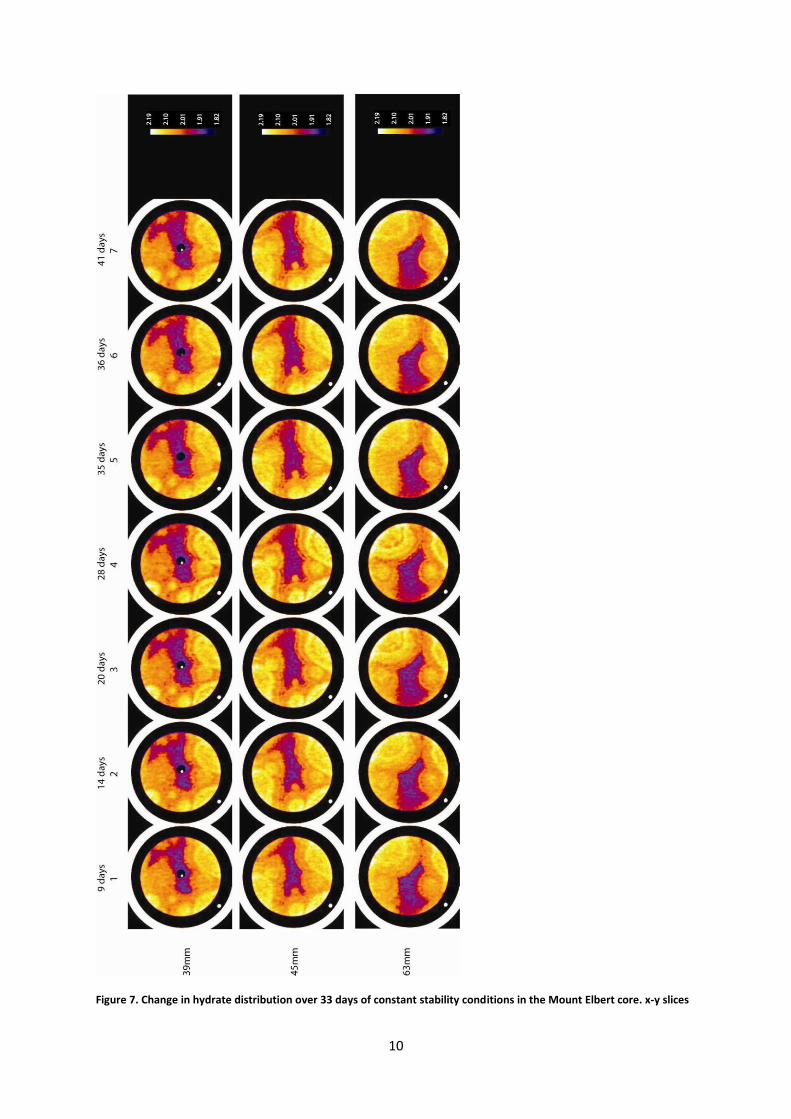
day time span of Phase 2, systematic CT scans were taken to monitor any changes in distribution.
Over the first 28 days, the hydrate appeared to consolidate into faint ring structures, shown from
Scans 1 to 4 in Figure 7. Between Scans 4 and 5, the hydrate appears to have redistributed itself,
with the “rings” seen in Scan 4 less evident. Figure 8 highlights this change by showing a plot of
density change across one of the ring structures in the x-y cross section at location 63mm. As time
progresses from 9 to 28 days, differences in density become more pronounced with a peak and
trough evident between 50 and 90 pixels. The final trace at 35 days however, shows the peak and
trough have disappeared, and the average denisty across the length of the plot to have increased
slightly. This redistribution was accompanied by a change in pressure and temperature in the core.
Pore pressure inside the sample (and attached bottle) dropped by 0.07MPa in addition to a peak in
internal temperature of 0.5°C (Figure 9). The changes seen in the pressure-temperature condition
suggest further hydrate formation during the redistribution evident in the CT scans. After the scan at
9
36 days, the ring structures again began to become more distinct. The test sequence was ended
after 42 days.
Figure 6. Comparison of Mount Elbert core pre hydrate formation and 9 days after formation in Phase 2. y-z slice.
10
Figure 7. Change in hydrate distribution over 33 days of constant stability conditions in the Mount Elbert core. x-y slices
11
Figure 8. Density plot across the line A-B on a x-y slice at 63mm on Figure 7.
Figure 9. Plot of pore pressure and internal temperature of Mount Elbert core shown in Figure 7. Numbers correspond to scan numbers given in Figure 7.
Discussion
Both phases of the test sequence show redistribution of methane hydrate in the core over time. In
Phase 1, rapid hydrate formation after 2.5 hours showed a patchy and localized distribution in the
sediment, only to homogenize over 24 hours and with full hydrate formation. Over the longer term,
12
hydrate redistributed itself over the scale of several centimeters, with a large hydrate accumulation
occurring near the interface between the two regions in the sample, primarily on the Part A side.
Although the initial stages of hydrate formation were not observed in Phase 2, distribution appeared
to be patchy, particularly in the less dense half of the core, Part A. It is not known whether the same
rapid hydrate formation was followed by redistribution over 24 hours in Phase 2, as this part of the
experiment was not observed. The redistibution of moisture during hydrate formation in the first 24
hours of Phase 1 may have been due to capillary pressure changes that occur during the hydrate
formation process in a porous medium. The rapid placement of the Mount Elbert core sample into
the hydrate stability zone, may have caused hydrate nucleation to occur within 9 minutes in many
locations throughout the sample. This newly forming hydrate will have drawn water towards itself,
causing the localized reduction in density seen in the first scans as water was removed from these
locations (e.g. Figure 4). As hydrate gradually formed across the rest of the core, moisture was
redistributed, as seen in the second image in Figure 4, and the plot in Figure 5.
The redistribution in Phase 2 of the test sequence maybe due to a different mechanism. Over a
period of 28 days, the bulk mass of methane hydrate in the core appeared to change. In the first
scans, methane hydrate formed in localized patches, with faint “rings” within the larger hydrate
masses. Over the first 28 days, the rings agglomerate and become more defined, as shown in Figure
8. Between the scans made on day 28 and 35 however, the “rings” become more diffuse, and more
hydrate has formed spontaneously in the core.
The characteristic of hydrate redistribution has been observed at the grain scale in other
experiments (Katsuki et al., 2005; Katsuki et al., 2006; Tohidi et al., 2001). When plunged into the
hydrate stability zone, hydrate will first form at the methane-water interface, either as a film on a
methane gas bubble or on the surface of water at the grain contacts. After this initial formation
however, hydrate has been observed to agglomerate into larger crystal masses rather than remain
as dispersed smaller crystals (Katsuki et al., 2005; Tohidi et al., 2001). This redistribution reduces the
surface area and energy of the hydrate mass (Clennell et al., 1999; Tohidi et al., 2001). With regard
to Phase 2 of the test sequence, methane hydrate may have formed quickly into relatively dispersed
crystal masses with high surface areas. Over time, the hydrate sought to reduce the energy of the
crystal mass and agglomerated into more dense “rings”.
During the slow redistribution of the hydrate mass, it appears that more hydrate was formed, due to
the peak in internal temperature and the drop in pore pressure seen in Figure 9. Anomolies such as
this have been recorded in previous hydrate formation tests (Kneafsey et al., 2007; Linga et al.,
2009), where inital hydrate formation isolates gas and water supply, ceasing hydrate formation until
there is “punch through” and water and methane components come into contact once more. The
agglomeration of hydrate in Phase 2 may have allowed for previously trapped water to become
available, and additional hydrate was formed in the pore space.
The results from both Phases 1 and 2 of the test sequence have a number of implications with
regard to forming hydrate in the laboratory, as well as our understanding of natural hydrate
deposits. Previous assumptions that methane hydrate is an immoble mass in porous media must be
reconsidered. Scans 1 to 4 in Figure 7 clearly show redistribution of methane hydrate without
accompanying changes in pressure and temperature that would indicate dissociation or further
formation. The processes that could be causing this redistribution must therefore be a
13
rearrangement of the hydrate crystal structure that is caused by the need for the hydrate mass to
adopt an energy efficient configuration. Although the changes in hydrate form are small, they will
have an impact on the way hydrate effects the properties (seismic, thermal, electrical, and
hydrologic) of the host sediment.
In natural hydrate-bearing deposits, hydrate may not be a stagnant phase, and is likely to
redistribute in response to stimuli. These stimuli include the thermal gradient changes that could
occur from wells or pipelines carrying fluid at a different temperature than the ambient or fluid
flows through fractures, changes in the geothermal gradient, pressure changes resulting from tides
and changing sea level, fluid chemistry from flow in fractures, and different mineralogies.
14
References
Clennell, M.B., Hovland, M., Booth, J.S., Henry, P. and Winters, W.J., 1999. Formation of natural gas hydrates in marine sediments. 1. Conceptual model of gas hydrate growth conditioned by host sediment properties. Journal of Geophysical Research, 104(B10): 22985--23003.
Katsuki, D., Ohmura, R., Ebinuma, T. and Narita, H., 2005. Formation, growth and ageing of clathrate hydrate crystals in a porous media. Philosophical Magazine, 86(12): 1753-1761.
Katsuki, D., Ohmura, R., Ebinuma, T. and Narita, H., 2006. Methane hydrate crystal growth in a porous medium filled with methane-saturated liquid water. Philosophical Magazine, 87(7): 1057-1069.
Kneafsey, T.J. et al., 2007. Methane hydrate formation and dissociation in a partially saturated core-scale sand sample. Journal of Petroleum Science and Engineering, 56(1-3): 108-126.
Linga, P., Haligva, C., Chan Nam, S., Ripmeester, J.A. and Englezos, P., 2009. Gas hydrate formation in a variable volume bed of silica sand particles. Energy and Fuels, 23: 5496-5507.
Tohidi, B., Anderson, R., Clennell, M.B., Burgass, R.W. and Biderkab, A.B., 2001. Visual observation of gas--hydrate formation and dissociation in synthetic porous media by means of glass micromodels. Geology, 29(9): 867--870.


![Hydrate thermal dissociation behavior and dissociation enthalpies in methane … · mole basis, methane hydrate consists of 85.69(± 0.14)% water and 14.31(± 0.14)% methane [2].](https://static.documents.pub/doc/80x56/5fbd4df89eb682309316b186/hydrate-thermal-dissociation-behavior-and-dissociation-enthalpies-in-methane-mole.jpg)


