research papers Acta Cryst. (2013). B69, 465–473 doi:10.1107/S2052519213021155 465 Acta Crystallographica Section B Structural Science, Crystal Engineering and Materials ISSN 2052-5192 X-ray diffraction: a powerful tool to probe and understand the structure of nanocrystalline calcium silicate hydrates Sylvain Grangeon, a * Francis Claret, a Yannick Linard b and Christophe Chiaberge a a BRGM, 3 avenue Claude Guillemin, Orle ´ans, 45060, France, and b ANDRA, Centre de Meuse/ Haute Marne, 55290 Bure, France Correspondence e-mail: [email protected]X-ray diffraction (XRD) patterns were calculated and compared to literature data with the aim of investigating the crystal structure of nanocrystalline calcium silicate hydrates (C-S-H), the main binding phase in hydrated Portland cement pastes. Published XRD patterns from C-S-H of Ca/Si ratios ranging from 0.6 to 1.7 are fully compatible with nanocrystalline and turbostratic tobermorite. Even at a ratio close or slightly higher than that of jennite (Ca/Si = 1.5) this latter mineral, which is required in some models to describe the structure of C-S-H, is not detected in the experimental XRD patterns. The 001 basal reflection from C-S-H, positioned at 13.5 A ˚ when the C-S-H structural Ca/Si ratio is low (< 0.9), shifts towards smaller d values and sharpens with increasing Ca/Si ratio, to reach 11.2 A ˚ when the Ca/Si ratio is higher than 1.5. Calculations indicate that the sharpening of the 001 reflection may be related to a crystallite size along c*(i.e. a mean number of stacked layers) increasing with the C-S-H Ca/Si ratio. Such an increase would contribute to the observed shift of the 001 reflection, but fails to quantitatively explain it. It is proposed that the observed shift could result from interstratification of at least two tober- morite-like layers, one having a high and the other a low Ca/Si ratio with a basal spacing of 11.3 and 14 A ˚ , respectively. Received 7 June 2013 Accepted 29 July 2013 1. Introduction Nanocrystalline calcium silicate hydrates (C-S-H), synthetic phases, are the major hydration products and the main binding phases in Portland cement (Richardson, 2008; Richardson et al., 1994). Their chemical composition is variable. In parti- cular, the structural calcium-to-silicon ratio (Ca/Si) is commonly assumed to vary from 0.6 to 2.3, the highest ratio being found in neat Portland cement, and lowest in cements containing products such as fly ash or metakaolin (Gira ˜o et al. , 2010; Richardson, 1999). As C-S-H control cement mechanical and chemical properties (Blanc et al., 2010; Manzano et al. , 2007), they have been the subject of consid- erable amounts of work for decades (Richardson, 2008). Using a wide variety of physical methods (for example: NMR, IR, Raman and extended X-ray absorption fine structure spec- troscopies, small-angle neutron scattering, X-ray diffraction, atomic pair distribution function or transmission electron microscopy), several research groups have investigated the C- S-H crystal structure (Allen & Thomas, 2007; Cong & Kirk- patrick, 1996a,b; Groves et al. , 1986; Kirkpatrick et al., 1997; Lequeux et al., 1999; Nonat, 2004; Rejmak et al., 2012; Soyer- Uzun et al., 2012; Yu et al., 1999). All support the currently held view that C-S-H has a crystal structure close to tober- morite [Ca 4 Si 6 O 15 (OH) 2 2H 2 O for the 11 A ˚ variant studied by Merlino et al. , 1999, but the actual chemistry is variable] and/or
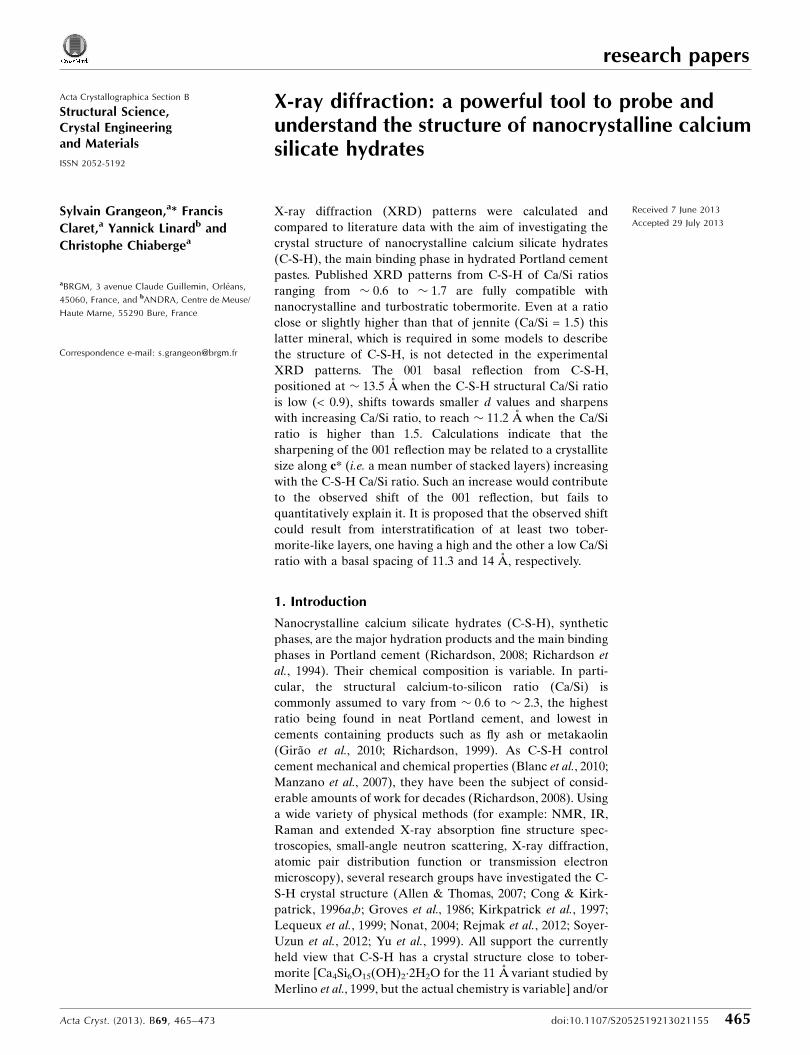
Figure 2Calculated XRD patterns of (a) jennite and (b) tobermorite. Indexing(non-exhaustive) was performed using models from Bonaccorsi et al.(2004) and Merlino et al. (2001). Basal reflections are omitted. For eachmineral, the theoretical XRD patterns (from top to bottom) of anordered form having a mean CSDab size of 20 nm, and from disorderedvariations having a CSDab size of 20, 10 and 3 nm are presented. Greyareas correspond to the regions where Taylor (1986) identified theoverlapping tobermorite and jennite diffraction maxima.
(1960) which exhibited diffraction maxima compatible with
ordered jennite (Gard & Taylor, 1976). Although the original
synthesis procedure has been reported, Taylor (1997) stated
that ‘attempts to repeat these preparations [ . . . ] have failed,
and the conditions under which the product is formed are
obscure’. It is thus unclear how representative this sample is of
a product that can actually be found in hydrated pastes, and
this questions the validity of the model from Taylor (1986).
Acquisition of XRD patterns from portlandite-free C-S-H
samples having a Ca/Si ratio 1.7 would be mandatory to gain
better insight into the validity of this model. Nevertheless,
from the proposed calculations it is clear that for a Ca/Si ratio
ranging between � 0.6 and � 1.7 solely tobermorite is needed
to describe C-S-H crystal structure, even for a Ca/Si ratio close
to jennite. The almost systematic presence of portlandite in
samples having a high Ca/Si ratio ( 1.7) may indicate that the
tobermorite/CH (CH standing for calcium hydroxide) model
from Richardson most adequately describes the evolution of
C-S-H structure as a function of Ca/Si ratio.
4. Description of layer stacking
At least two research groups have conducted insightful
discussion on the evolution of C-S-H XRD patterns as a
function of the C-S-H Ca/Si ratio (Garbev, Beuchle et al., 2008;
Renaudin et al., 2009). In these articles the diffraction
maximum exhibiting the strongest variation in position is the
reflection between � 13.5 and � 11.2 A (6.5–7.9� 2� Cu K�),
which corresponds to the C-S-H 001 reflection, i.e. to the layer-
to-layer distance (Grangeon et al., 2013). Data from Garbev,
Beuchle et al. (2008) and Renaudin et al. (2009) compare well
with other published data (Alizadeh, 2009; Cong & Kirkpa-
trick, 1995; Gmira, 2003; Grangeon et al., 2013; Minet, 2004;
Minet et al., 2006; Nonat & Lecoq, 1996; Stumm et al., 2005;
Sugiyama, 2008), as illustrated in Fig. 3. At low Ca/Si ratio
(< 0.9), the basal distance is close to 13.5 A. With increasing
Ca/Si ratio, this distance reduces down to� 11.2 A for Ca/Si =
1.7.
Note that when C-S-H of the Ca/Si ratio = 1.19 is heated at
473 K for 3 h, the basal distance further reduces to 9.6 A
(Cong & Kirkpatrick, 1995). The � 11 and 14 A basal
distances are also observed in natural tobermorite (Bonac-
corsi et al., 2005; Merlino et al., 2001), and a� 11 A variant has
also been observed to collapse to 9.6 A upon heating at 498 K
for 3 h (Merlino et al., 1999). The 14, 11 and 9 A distances for
Figure 3Variation in the position of the C-S-H basal reflection as a function ofstructural Ca/Si ratio. Published XRD patterns having too weak adiffraction intensity or showing the presence of high amounts ofportlandite were excluded. Note that the actual Ca/Si ratio may beslightly overestimated for samples from Renaudin et al. (2009) that haveCa/Si > 1.5, because of the presence of portlandite in their XRD pattern.
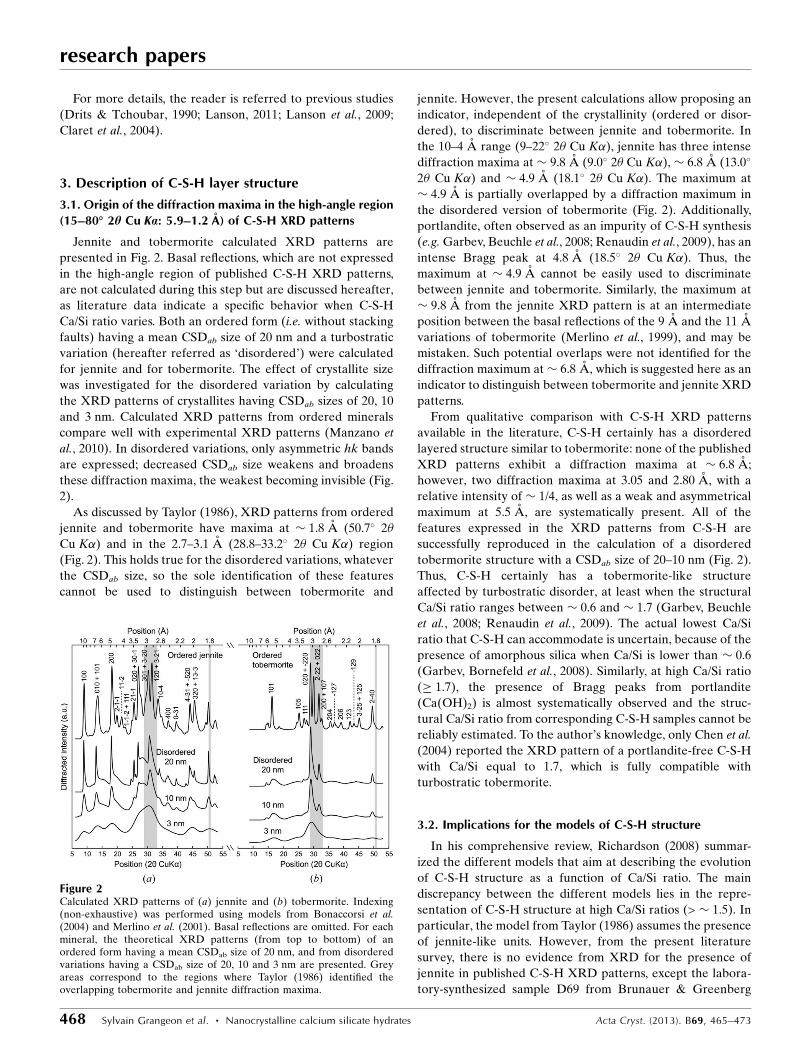
Figure 4Schematic view of the three main variations of tobermorite, as defined by their layer-to-layer distance,equal to (from left to right): 9, 11 and 14 A. Interlayer water molecules omitted for clarity in 9 and 11 Avariations, but represented in the coordination sphere of interlayer Ca in the 14 A variation to highlightlayer-to-layer connectivity.
the interlayer space, thus allowing a reduction of the layer-to-
layer distance through the action of interlayer calcium brid-
ging two adjacent layers. For more details, the reader is
referred to Fig. 8 from Garbev, Bornefeld et al. (2008).
The second phenomenon is a decrease in the crystallite size
along c*, i.e. a decrease in the mean number of stacked layers.
Such a decrease leads to a shift of the 001 reflection towards
the low-angle region is exacerbated for particles such as C-S-H
having sizes in the nanometer range (e.g. Skinner et al., 2010;
Grangeon et al., 2013), and it has already been observed in
other lamellar structures (Drits & Tchoubar, 1990; Grangeon
et al., 2012; Lanson et al., 2008). It mainly originates from the
fact that in the low-angle region of XRD patterns, the Lorentz
polarization factor is strongly rising towards the low-angle
part and thus this artificially displaces the diffraction maxima
(Reynolds, 1968, 1986), although other minor effects are also
involved (e.g. Truntz, 1976). This is illustrated in Fig. 5, taking
tobermorite as a model structure. The deviation from the
theoretical position is as large as 2.5 A when the mean number
of stacked layers is reduced from 10 to 2.5. The shift towards
low angles is accompanied by a broadening of the Bragg peak.
Thus, if this phenomenon was responsible for the shift
observed in the literature data (Fig. 3), an increase in the
FWHM of the 001 reflection should be observed when the
Ca/Si ratio decreases. FWHM was measured by Garbev,
Beuchle et al. (2008), who observed an increase of this para-
meter from 0.72� to � 0.85–1.5� when the Ca/Si ratio
decreased from 1.33 to 0.66–0.75. A FWHM of 0.72� is close, in
Fig. 5, to the calculation performed with a mean number of 10
stacked layers (FWHM = 0.61�). Assuming that the shift of the
001 reflection is only due to a decrease in the mean number of
stacked layers with decreasing Ca/Si ratio and using Fig. 5, the
� 2.3 A shift (from � 11.2 to � 13.5 A) would mean that at
low Ca/Si, the mean number of stacked layers is equal to� 2.5
and the FWHM is 1.81�, about twice the FWHM measured by
Figure 5Theoretical intensity and position from the basal reflection of a samplebuilt up of 11 A tobermorite having a mean number of n = 10 (solid line),6 (dashed line), 4 (dashed-dotted line) and 2.5 (long-dashed line) stackedlayers. Distribution is log-normal.
Figure 6Impact of interstratification on the 00l reflections from a theoreticalmixed-layer tobermorite XRD pattern. (top) Different interstratificationmodes for a binary system containing tobermorite-like layers having 14and 11 A basal distances, plotted in a PT14-T14 versus WT14 graph. Thestructure of the 14 A layer is that of plombierite, and the structure of the11 A layer is that from a MDO2 sample from Urals where all bridgingtetrahedra are omitted. Solid line: field of R1 maximum possible degreeof order (R1 MDPO), dotted line: field of R0 (random interstratification).Between these two lines lies the field of partial ordering, and above theR0 field lies the partial segregation field. Segregation is reached whenPT14-T14 = 1. The area below the MPDO field is a non-physical field. Dotslabelled 1–9 represent the nine calculations performed in the bottomfigure: 1–3 are calculations performed in the R0 hypothesis (b in thebottom figure, with WT14 = 0.2, 0.5 and 0.8 for calculations 1 – solid line, 2– dashed line and 3 – dash-dotted line), 4–6 calculations in the R1 MPDOhypothesis (c in the bottom figure, WT14 = 0.5, 0.7 and 0.9 for 4 – solid line,5 – dashed line and 6 – dash–dotted line) and 7–9 calculations performedin the R1 non-MDPO hypothesis (d in the bottom figure, WT14 = 0.4 andPT14-T14 equal to 0.2, 0.5 and 1 for 7 – solid line, 8 – dashed line and 9 –dash–dotted line); (a) in the bottom figure presents the theoretical basalreflections from pure 11 and 14 A tobermorite (solid and dashed lines,respectively).
Garbev, Beuchle et al. (2008) for C-S-H samples with low Ca/
Si (0.85–1.05�). Thus, even if a decrease in the mean number of
layers stacked coherently with decreasing structural Ca/Si
contributes to the observed shift of the 001 reflection (Gran-
geon et al., 2013), it cannot quantitatively account for the
magnitude of the shift observed by Garbev and coworkers,
and another hypothesis has to be formulated. This conclusion
is obvious when looking at data from Renaudin et al. (2009) as,
from their Fig. 3, the FWHM does not evolve significantly with
the C-S-H Ca/Si ratio. Note, however, that variation in the
mean number of stacked layers certainly explains the data
dispersion observed in Fig. 3 (at a similar Ca/Si ratio different
samples can have a different mean number of stacked layers,
leading to data scattering along the y axis), although an effect
of the synthesis protocol and of sample preservation may be a
factor.
The third hypothesis that may explain the shift of the 001
reflection as a function of Ca/Si ratio is the interstratification
from a layer of low Ca/Si ratio with one of high Ca/Si ratio, the
first being dominant for C-S-H of low structural Ca/Si ratio,
and vice versa. To illustrate this effect, calculations were
performed using a theoretical 14 A tobermorite (plombierite)
with interlayer calcium omitted as the low Ca/Si end-member,
and a theoretical 11 A tobermorite MDO2 from Ural with all
bridging Si tetrahedra omitted as the high Ca/Si end-member.
All main interstratification hypotheses were tested (Fig. 6):
random interstratification of 11 and 14 A layers (R0 inter-
stratification), R1 interstratification and interstratification
with the maximum possible degree of ordering (R1-MPDO;
PT14-T14 = 0 if WT14 0.5). In the R0 case, the shift of the 001
reflection towards 14 A with decreasing Ca/Si ratio is accom-
panied by an increase of the FWHM compared with end-
members, which is not the case in the R1-MPDO hypothesis,
where the 001 reflection remains very sharp. Note the
presence of a reflection at � 25 A in the R1-MPDO case,
when WT14 = 0.5. This superstructure results from the regular
alternation of 11 and 14 A layers. In the R1 (non-MPDO)
hypothesis, the 001 reflection is highly asymmetrical when the
calculations lie in the partial order range, and two peaks,
corresponding to the 001 reflection from 11 and 14 A species,
are resolved when the calculations lie in the segregation range.
If the observed shift from the 001 reflection results from
interstratification, then it most likely is a R0 interstratification,
because in the R1 hypothesis peaks are too sharp (and when
WT14 = 0.5, a maximum at � 25 A is present), and in the R1-
MPDO hypothesis the 001 is either too asymmetric or split
into two maxima occurring at � 11 and 14 A. Such a
hypothesis is reinforced with the good agreement obtained
between the evolution of the calculated position from the
maximum of the 001 reflection, assuming a R0 inter-
stratification, and literature data (Fig. 7). Note that using the
structural model of tobermorite MDO2 from Urals, removing
all bridging tetrahedra and increasing the occupancy of
interlayer calcium to the highest possible value (according to
Merlino et al., 2001) did not achieve a Ca/Si ratio higher than
5/4. This may indicate that C-S-H of a higher ratio have an
additional crystallographic site for calcium and/or that Si
monomers are present. The R0 interstratification has also
been invoked by Taylor and coworkers (Heller & Taylor, 1956;
Taylor & Howison, 1956). Finally, the 11 A layer used for this
calculation, in which all bridging Si tetrahedra are omitted and
which contains interlayer Ca, presents some structural simi-
larity with a 11 A layer, with all Si bridging tetrahedra
omitted, sandwiched between Ca(OH)2 sheets, which is
compatible with the T/CH model from Richardson which
assumes that tobermorite layers are interstratified with
Ca(OH)2 sheets (Girao et al., 2010).
5. Summary
Despite only a few broad diffraction maxima in C-S-H XRD
patterns, meaningful and accurate structural information can
be extracted. The present study indicates C-S-H has a struc-
ture close to tobermorite, whatever the Ca/Si ratio. A jennite
component does not need to be invoked to explain the
experimental XRD patterns. This does not mean, however,
that a jennite-like structure does not exist at Ca/Si� 1.7, but
rather that more XRD data from samples having these ratios
must be acquired.
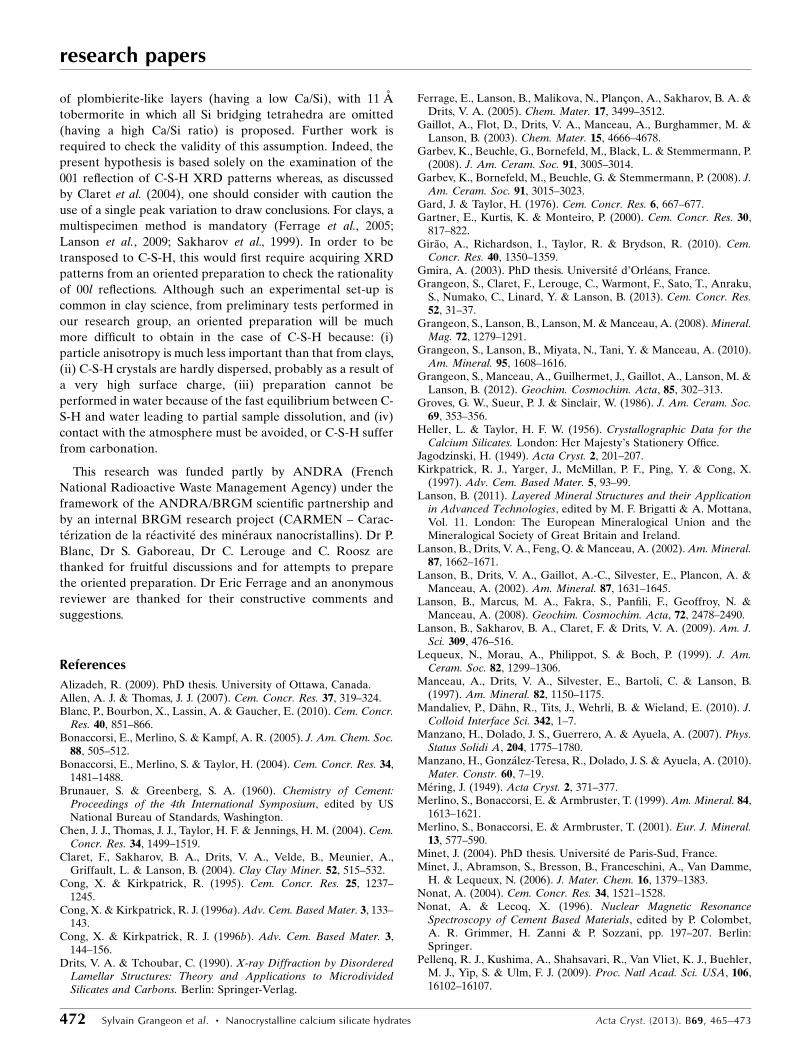
Variation in the position of the 001 reflection, from
� 13.5 A at low Ca/Si to � 11.2 A at high Ca/Si ratio, cannot
be quantitatively accounted for by an increase in crystallite
size along c* with increasing Ca/Si ratio, although it does
certainly contribute. In addition to the mechanism proposed
by Garbev and coworkers (Garbev, Beuchle et al., 2008;
Garbev, Bornefeld et al., 2008), the random interstratification
Figure 7Evolution of the position from the 001 reflection in experimental data(dots, same data as in Fig. 3) and in a hypothetical random (R0)interstratified structure (solid line) built of layers of plombierite-likelayers [d(001) = 14 A] with interlayer calcium omitted yielding a Ca/Siratio of 2/3 and of layers of tobermorite MDO2 from Urals [d(001) =11.3 A] with the occupancy of interlayer calcium (Ca2 in Merlino et al.,2001) increased to 0.5 and all Si bridging tetrahedra omitted, yielding aCa/Si ratio of 5/4.
of plombierite-like layers (having a low Ca/Si), with 11 A
tobermorite in which all Si bridging tetrahedra are omitted
(having a high Ca/Si ratio) is proposed. Further work is
required to check the validity of this assumption. Indeed, the
present hypothesis is based solely on the examination of the
001 reflection of C-S-H XRD patterns whereas, as discussed
by Claret et al. (2004), one should consider with caution the
use of a single peak variation to draw conclusions. For clays, a
multispecimen method is mandatory (Ferrage et al., 2005;
Lanson et al., 2009; Sakharov et al., 1999). In order to be
transposed to C-S-H, this would first require acquiring XRD
patterns from an oriented preparation to check the rationality
of 00l reflections. Although such an experimental set-up is
common in clay science, from preliminary tests performed in
our research group, an oriented preparation will be much
more difficult to obtain in the case of C-S-H because: (i)
particle anisotropy is much less important than that from clays,
(ii) C-S-H crystals are hardly dispersed, probably as a result of
a very high surface charge, (iii) preparation cannot be
performed in water because of the fast equilibrium between C-
S-H and water leading to partial sample dissolution, and (iv)
contact with the atmosphere must be avoided, or C-S-H suffer
from carbonation.
This research was funded partly by ANDRA (French
National Radioactive Waste Management Agency) under the
framework of the ANDRA/BRGM scientific partnership and
by an internal BRGM research project (CARMEN – Carac-
terization de la reactivite des mineraux nanocristallins). Dr P.
Blanc, Dr S. Gaboreau, Dr C. Lerouge and C. Roosz are
thanked for fruitful discussions and for attempts to prepare
the oriented preparation. Dr Eric Ferrage and an anonymous
reviewer are thanked for their constructive comments and
suggestions.
References
Alizadeh, R. (2009). PhD thesis. University of Ottawa, Canada.Allen, A. J. & Thomas, J. J. (2007). Cem. Concr. Res. 37, 319–324.Blanc, P., Bourbon, X., Lassin, A. & Gaucher, E. (2010). Cem. Concr.
Res. 40, 851–866.Bonaccorsi, E., Merlino, S. & Kampf, A. R. (2005). J. Am. Chem. Soc.
88, 505–512.Bonaccorsi, E., Merlino, S. & Taylor, H. (2004). Cem. Concr. Res. 34,
1481–1488.Brunauer, S. & Greenberg, S. A. (1960). Chemistry of Cement:
Proceedings of the 4th International Symposium, edited by USNational Bureau of Standards, Washington.
Chen, J. J., Thomas, J. J., Taylor, H. F. & Jennings, H. M. (2004). Cem.Concr. Res. 34, 1499–1519.
Claret, F., Sakharov, B. A., Drits, V. A., Velde, B., Meunier, A.,Griffault, L. & Lanson, B. (2004). Clay Clay Miner. 52, 515–532.
Cong, X. & Kirkpatrick, R. J. (1996a). Adv. Cem. Based Mater. 3, 133–143.
Cong, X. & Kirkpatrick, R. J. (1996b). Adv. Cem. Based Mater. 3,144–156.
Drits, V. A. & Tchoubar, C. (1990). X-ray Diffraction by DisorderedLamellar Structures: Theory and Applications to MicrodividedSilicates and Carbons. Berlin: Springer-Verlag.
Ferrage, E., Lanson, B., Malikova, N., Plancon, A., Sakharov, B. A. &Drits, V. A. (2005). Chem. Mater. 17, 3499–3512.
Gaillot, A., Flot, D., Drits, V. A., Manceau, A., Burghammer, M. &Lanson, B. (2003). Chem. Mater. 15, 4666–4678.
Garbev, K., Beuchle, G., Bornefeld, M., Black, L. & Stemmermann, P.(2008). J. Am. Ceram. Soc. 91, 3005–3014.
Garbev, K., Bornefeld, M., Beuchle, G. & Stemmermann, P. (2008). J.Am. Ceram. Soc. 91, 3015–3023.
Gard, J. & Taylor, H. (1976). Cem. Concr. Res. 6, 667–677.Gartner, E., Kurtis, K. & Monteiro, P. (2000). Cem. Concr. Res. 30,
817–822.Girao, A., Richardson, I., Taylor, R. & Brydson, R. (2010). Cem.
S., Numako, C., Linard, Y. & Lanson, B. (2013). Cem. Concr. Res.52, 31–37.
Grangeon, S., Lanson, B., Lanson, M. & Manceau, A. (2008). Mineral.Mag. 72, 1279–1291.
Grangeon, S., Lanson, B., Miyata, N., Tani, Y. & Manceau, A. (2010).Am. Mineral. 95, 1608–1616.
Grangeon, S., Manceau, A., Guilhermet, J., Gaillot, A., Lanson, M. &Lanson, B. (2012). Geochim. Cosmochim. Acta, 85, 302–313.
Groves, G. W., Sueur, P. J. & Sinclair, W. (1986). J. Am. Ceram. Soc.69, 353–356.
Heller, L. & Taylor, H. F. W. (1956). Crystallographic Data for theCalcium Silicates. London: Her Majesty’s Stationery Office.
Jagodzinski, H. (1949). Acta Cryst. 2, 201–207.Kirkpatrick, R. J., Yarger, J., McMillan, P. F., Ping, Y. & Cong, X.
(1997). Adv. Cem. Based Mater. 5, 93–99.Lanson, B. (2011). Layered Mineral Structures and their Application
in Advanced Technologies, edited by M. F. Brigatti & A. Mottana,Vol. 11. London: The European Mineralogical Union and theMineralogical Society of Great Britain and Ireland.
Lanson, B., Drits, V. A., Feng, Q. & Manceau, A. (2002). Am. Mineral.87, 1662–1671.
Lanson, B., Drits, V. A., Gaillot, A.-C., Silvester, E., Plancon, A. &Manceau, A. (2002). Am. Mineral. 87, 1631–1645.
Lanson, B., Marcus, M. A., Fakra, S., Panfili, F., Geoffroy, N. &Manceau, A. (2008). Geochim. Cosmochim. Acta, 72, 2478–2490.
Lanson, B., Sakharov, B. A., Claret, F. & Drits, V. A. (2009). Am. J.Sci. 309, 476–516.
Lequeux, N., Morau, A., Philippot, S. & Boch, P. (1999). J. Am.Ceram. Soc. 82, 1299–1306.
Manceau, A., Drits, V. A., Silvester, E., Bartoli, C. & Lanson, B.(1997). Am. Mineral. 82, 1150–1175.
Mandaliev, P., Dahn, R., Tits, J., Wehrli, B. & Wieland, E. (2010). J.Colloid Interface Sci. 342, 1–7.
Manzano, H., Dolado, J. S., Guerrero, A. & Ayuela, A. (2007). Phys.Status Solidi A, 204, 1775–1780.
Manzano, H., Gonzalez-Teresa, R., Dolado, J. S. & Ayuela, A. (2010).Mater. Constr. 60, 7–19.
Mering, J. (1949). Acta Cryst. 2, 371–377.Merlino, S., Bonaccorsi, E. & Armbruster, T. (1999). Am. Mineral. 84,
1613–1621.Merlino, S., Bonaccorsi, E. & Armbruster, T. (2001). Eur. J. Mineral.
13, 577–590.Minet, J. (2004). PhD thesis. Universite de Paris-Sud, France.Minet, J., Abramson, S., Bresson, B., Franceschini, A., Van Damme,
H. & Lequeux, N. (2006). J. Mater. Chem. 16, 1379–1383.Nonat, A. (2004). Cem. Concr. Res. 34, 1521–1528.Nonat, A. & Lecoq, X. (1996). Nuclear Magnetic Resonance
Spectroscopy of Cement Based Materials, edited by P. Colombet,A. R. Grimmer, H. Zanni & P. Sozzani, pp. 197–207. Berlin:Springer.
Pellenq, R. J., Kushima, A., Shahsavari, R., Van Vliet, K. J., Buehler,M. J., Yip, S. & Ulm, F. J. (2009). Proc. Natl Acad. Sci. USA, 106,16102–16107.
Plancon, A. (1981). J. Appl. Cryst. 14, 300–304.Plancon, A. (2002). J. Appl. Cryst. 35, 377.Rejmak, P., Dolado, J. S., Stott, M. J. & Ayuela, A. (2012). J. Phys.
Chem. C, 116, 9755–9761.Renaudin, G., Russias, J., Leroux, F., Frizon, F. & Cau-dit-Coumes, C.
(2009). J. Solid State Chem. 182, 3312–3319.Reynolds, R. C. (1968). Acta Cryst. A24, 319–320.Reynolds, R. C. (1986). Clays Clay Miner. 34, 359–367.Richardson, I. (1999). Cem. Concr. Res. 29, 1131–1147.Richardson, I. (2008). Cem. Concr. Res. 38, 137–158.Richardson, I. G. (2013). Acta Cryst. B69, 150–162.Richardson, I., Brough, A., Groves, G. & Dobson, C. (1994). Cem.
Concr. Res. 24, 813–829.Sakharov, B. A., Lindgreen, H., Salyn, A. & Drits, V. A. (1999). Clays
Clay Miner. 47, 555–566.
Skinner, L. B., Chae, S. R., Benmore, C. J., Wenk, H. R. & Monteiro,P. J. (2010). Phys. Rev. Lett. 104, 195502.
Soyer-Uzun, S., Chae, S. R., Benmore, C. J., Wenk, H.-R. & Monteiro,P. J. M. (2012). J. Am. Ceram. Soc. 95, 793–798.
Stumm, A., Garbev, K., Beuchle, G., Black, L., Stemmermann, P. &Nuesch, R. (2005). Cem. Concr. Res. 35, 1665–1675.
Sugiyama, D. (2008). Cem. Concr. Res. 38, 1270–1275.Taylor, H. F. (1986). J. Am. Ceram. Soc. 69, 464–467.Taylor, H. F. W. (1997). Cement Chemistry. New York: Thomas
Telford.Taylor, H. F. W. & Howison, J. W. (1956). Clay Miner. 3, 98–111.Truntz, V. (1976). Clays Clay Miner. 24, 84–87.Warren, B. (1941). Phys. Rev. 59, 693–698.Yu, P., Kirkpatrick, R. J., Poe, B., McMillan, P. F. & Cong, X. (1999). J.