Date post: | 09-Sep-2018 |
Category: |
Documents |
Upload: | hoanghuong |
View: | 214 times |
Download: | 0 times |
BIOLOGY HIGHER
©
X007/301
Fill in these boxes and read what is printed below.
Full name of centre Town
Forename(s) Surname
Date of birth
SECTION A—Questions 1–30 (30 marks)
Instructions for completion of Section A are given on page two.
For this section of the examination you must use an HB pencil.
SECTIONS B AND C (100 marks)
1 (a) All questions should be attempted.
(b) It should be noted that in Section C questions 1 and 2 each contain a choice.
2 The questions may be answered in any order but all answers are to be written in the spacesprovided in this answer book, and must be written clearly and legibly in ink.
3 Additional space for answers will be found at the end of the book. If further space is required,supplementary sheets may be obtained from the invigilator and should be inserted inside the frontcover of this book.
4 The numbers of questions must be clearly inserted with any answers written in the additional space.
5 Rough work, if any should be necessary, should be written in this book and then scored throughwhen the fair copy has been written. If further space is required a supplementary sheet for roughwork may be obtained from the invigilator.
6 Before leaving the examination room you must give this book to the invigilator. If you do not, youmay lose all the marks for this paper.
Day Month Year Number of seat Scottish candidate number
FOR OFFICIAL USE
Total forSectionsB and C
N A T I O N A L T H U R S D A Y , 2 8 M A YQ U A L I F I C A T I O N S 1 . 0 0 P M – 3 . 3 0 P M2 0 0 9
L I X 0 0 7 / 3 0 1 6 / 1 3 8 2 0 *X007/301*
Page two[X007/301]
Read carefully
1 Check that the answer sheet provided is for Biology Higher (Section A).
2 For this section of the examination you must use an HB pencil, and where necessary, an eraser.
3 Check that the answer sheet you have been given has your name, date of birth, SCN (Scottish
Candidate Number) and Centre Name printed on it.
Do not change any of these details.
4 If any of this information is wrong, tell the Invigilator immediately.
5 If this information is correct, print your name and seat number in the boxes provided.
6 The answer to each question is either A, B, C or D. Decide what your answer is, then, using
your pencil, put a horizontal line in the space provided (see sample question below).
7 There is only one correct answer to each question.
8 Any rough working should be done on the question paper or the rough working sheet, not on
your answer sheet.
9 At the end of the exam, put the answer sheet for Section A inside the front cover of this
answer book.
Sample Question
The apparatus used to determine the energy stored in a foodstuff is a
A calorimeter
B respirometer
C klinostat
D gas burette.
The correct answer is A—calorimeter. The answer A has been clearly marked in pencil with a
horizontal line (see below).
Changing an answer
If you decide to change your answer, carefully erase your first answer and using your pencil fill in the
answer you want. The answer below has been changed to D.
A B C D
A B C D
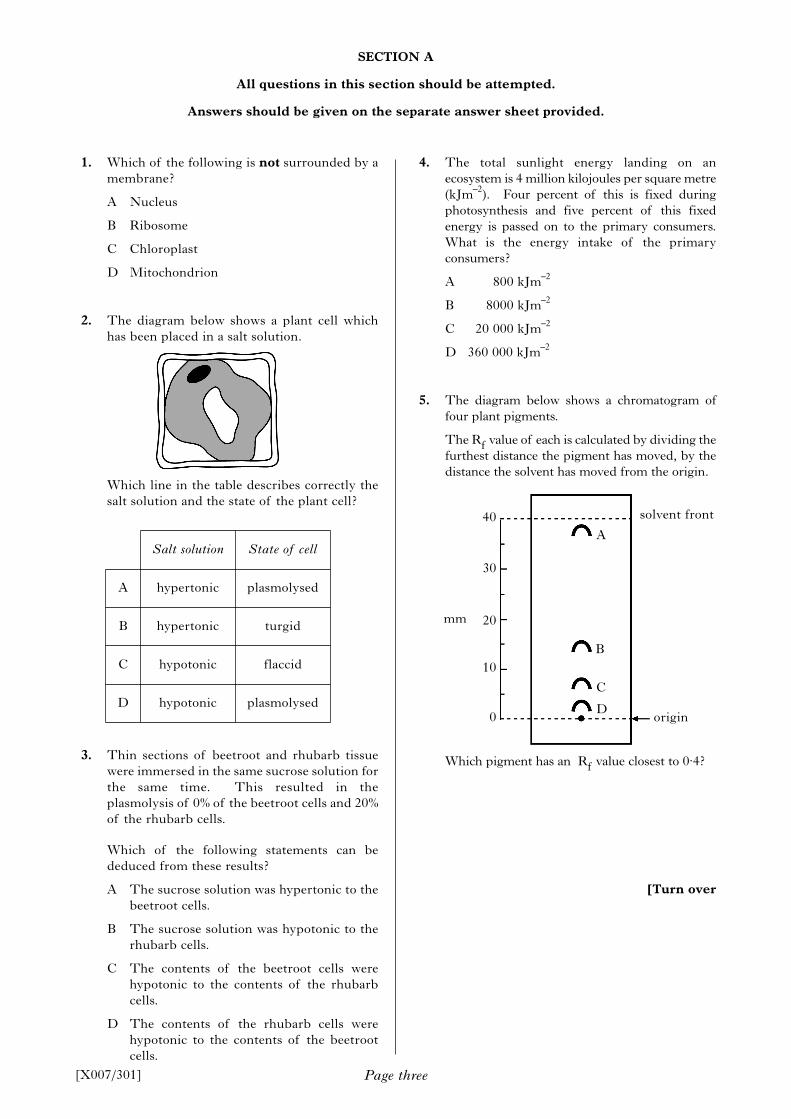
4. The total sunlight energy landing on an
ecosystem is 4 million kilojoules per square metre
(kJm–2
). Four percent of this is fixed during
photosynthesis and five percent of this fixed
energy is passed on to the primary consumers.
What is the energy intake of the primary
consumers?
A 800 kJm–2
B 8000 kJm–2
C 20 000 kJm–2
D 360 000 kJm–2
5. The diagram below shows a chromatogram of
four plant pigments.
The Rf value of each is calculated by dividing the
furthest distance the pigment has moved, by the
distance the solvent has moved from the origin.
Which pigment has an Rf value closest to 0.4?
Page three
SECTION A
All questions in this section should be attempted.
Answers should be given on the separate answer sheet provided.
[X007/301]
[Turn over
1. Which of the following is not surrounded by a
membrane?
A Nucleus
B Ribosome
C Chloroplast
D Mitochondrion
2. The diagram below shows a plant cell which
has been placed in a salt solution.
Which line in the table describes correctly the
salt solution and the state of the plant cell?
3. Thin sections of beetroot and rhubarb tissue
were immersed in the same sucrose solution for
the same time. This resulted in the
plasmolysis of 0% of the beetroot cells and 20%
of the rhubarb cells.
Which of the following statements can be
deduced from these results?
A The sucrose solution was hypertonic to the
beetroot cells.
B The sucrose solution was hypotonic to the
rhubarb cells.
C The contents of the beetroot cells were
hypotonic to the contents of the rhubarb
cells.
D The contents of the rhubarb cells were
hypotonic to the contents of the beetroot
cells.
solvent front
origin
A
B
C
D
40
30
20
10
0
mm
Salt solution State of cell
A hypertonic plasmolysed
B hypertonic turgid
C hypotonic flaccid
D hypotonic plasmolysed
Page four[X007/301]
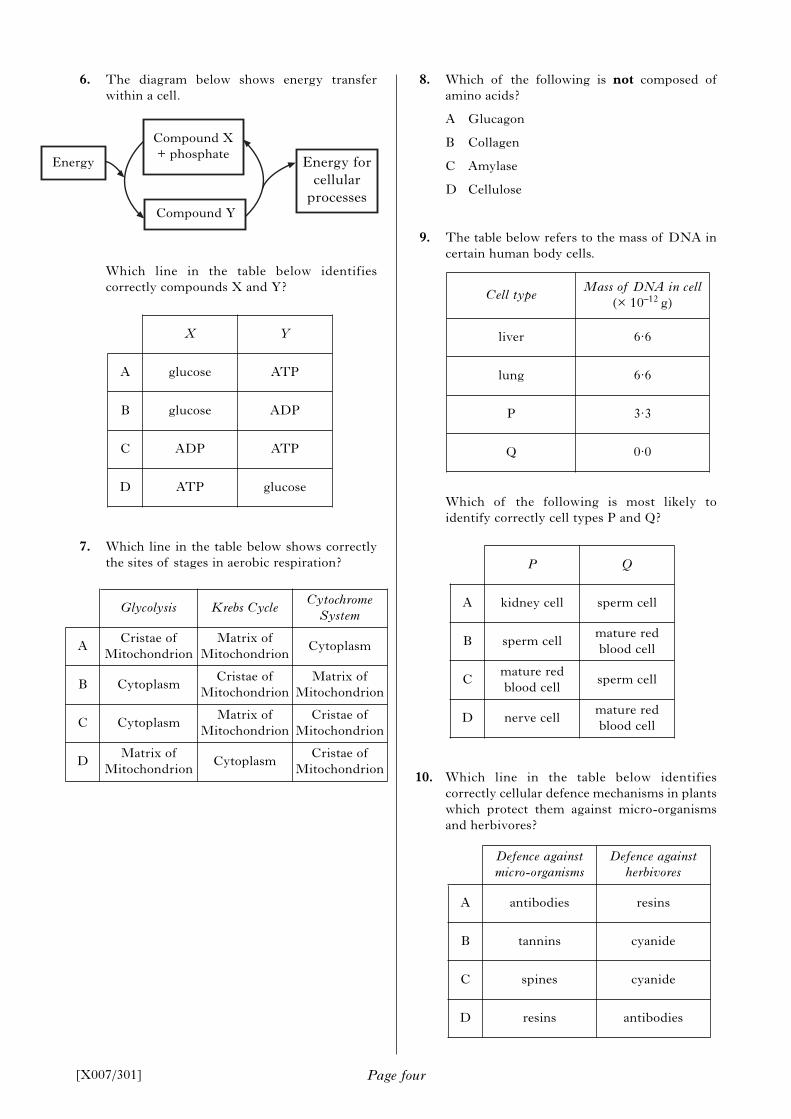
8. Which of the following is not composed of
amino acids?
A Glucagon
B Collagen
C Amylase
D Cellulose
9. The table below refers to the mass of DNA in
certain human body cells.
Which of the following is most likely to
identify correctly cell types P and Q?
10. Which line in the table below identifies
correctly cellular defence mechanisms in plants
which protect them against micro-organisms
and herbivores?
6. The diagram below shows energy transfer
within a cell.
Which line in the table below identifies
correctly compounds X and Y?
7. Which line in the table below shows correctly
the sites of stages in aerobic respiration?
Compound X
+ phosphateEnergy for
cellular
processes Compound Y
Energy
Cell typeMass of DNA in cell
(× 10–12 g)
liver 6.6
lung 6.6
P 3.3
Q 0.0
X Y
A glucose ATP
B glucose ADP
C ADP ATP
D ATP glucose
Glycolysis Krebs CycleCytochrome
System
ACristae of
Mitochondrion
Matrix of
MitochondrionCytoplasm
B CytoplasmCristae of
Mitochondrion
Matrix of
Mitochondrion
C CytoplasmMatrix of
Mitochondrion
Cristae of
Mitochondrion
DMatrix of
MitochondrionCytoplasm
Cristae of
Mitochondrion
P Q
A kidney cell sperm cell
B sperm cellmature red
blood cell
Cmature red
blood cellsperm cell
D nerve cellmature red
blood cell
Defence againstmicro-organisms
Defence againstherbivores
A antibodies resins
B tannins cyanide
C spines cyanide
D resins antibodies
[X007/301] Page five
11. In poultry, males have two X chromosomes
and females have one X chromosome and one
Y chromosome.
The gene for feather-barring is sex-linked.
The allele for barred feathers is dominant to
the allele for non-barred feathers.
A non-barred male is crossed with a barred
female.
What ratio of offspring would be expected?
A 1 barred male : 1 barred female
B 1 non-barred male : 1 non-barred female
C 1 barred male : 1 non-barred female
D 1 non-barred male : 1 barred female
12. The table below shows some genotypes and
phenotypes associated with a form of anaemia.
A person with sickle cell trait and an
unaffected person have a child together.
What are the chances of the child having acute
sickle cell anaemia?
A none
B 1 in 4
C 1 in 2
D 1 in 1
13. Which of the following statements refers to a
gene mutation?
A A change in the chromosome number
caused by non-disjunction.
B A change in the number of genes on a
chromosome caused by duplication.
C A change in the structure of a chromosome
caused by translocation.
D A change in the base sequence of DNA
caused by substitution.
14. Polyploidy in plants may result from
A total spindle failure during meiosis
B hybridisation between varieties of the same
species
C homologous chromosomes binding at
chiasmata
D the failure of linked genes to separate.
15. Which of the following is an example of
artificial selection?
A Industrial melanism in moths
B DDT resistance in mosquitoes
C Increased milk yield in dairy cattle
D Decreasing effect of antibiotics on bacteria
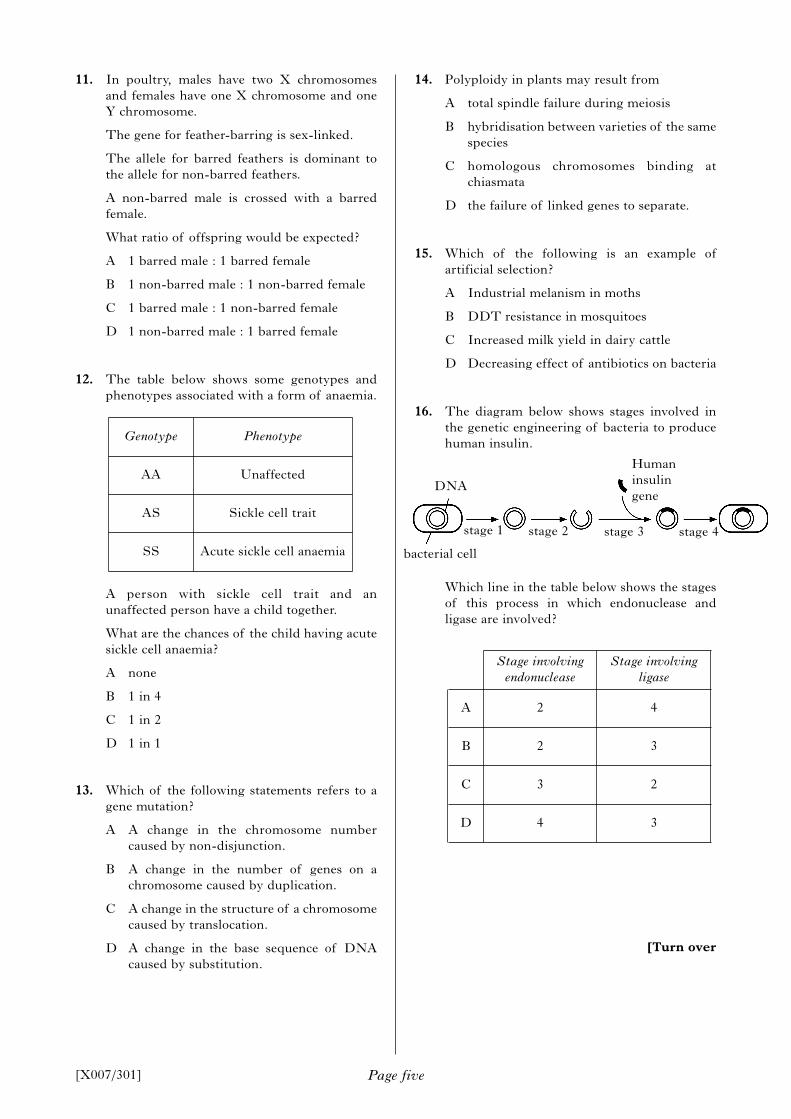
16. The diagram below shows stages involved in
the genetic engineering of bacteria to produce
human insulin.
Which line in the table below shows the stages
of this process in which endonuclease and
ligase are involved?
[Turn over
Genotype Phenotype
AA Unaffected
AS Sickle cell trait
SS Acute sickle cell anaemia bacterial cell
stage 1 stage 2 stage 3 stage 4
DNA
Human
insulin
gene
Stage involvingendonuclease
Stage involvingligase
A 2 4
B 2 3
C 3 2
D 4 3
Page six[X007/301]
19. Which of the following statements about
habituation is correct?
A It is a temporary change in behaviour.
B It occurs only in young animals.
C It is a social mechanism for defence.
D It is a permanent change in behaviour.
20. Some animal species live in social groups for
defence.
Which of the following statements describes a
change which could result from an increase in
the size of such a social group?
A Individuals are able to spend less time
feeding.
B There are fewer times when more than one
animal is looking for predators.
C Each animal can spend more time looking
for predators than foraging.
D Individuals are able to spend less time
looking for predators.
21. Phenylketonuria is a condition that results
from
A differential gene expression
B chromosome non-disjunction
C a vitamin deficiency
D an inherited gene mutation.
22. The plant growth substance indole acetic acid
(IAA) is of benefit to humans because it can
function
A as a herbicide and to break dormancy
B as a herbicide and as a rooting powder
C in the germination of barley and to break
dormancy
D as a rooting powder and in the germination
of barley.
17. The statements below describe methods of
maintaining a water balance in fish.
1 Salts actively absorbed by chloride
secretory cells
2 Salts actively secreted by chloride
secretory cells
3 Low rate of kidney filtration
4 High rate of kidney filtration
Which of these are used by freshwater bony
fish?
A 1 and 3 only
B 2 and 4 only
C 1 and 4 only
D 2 and 3 only
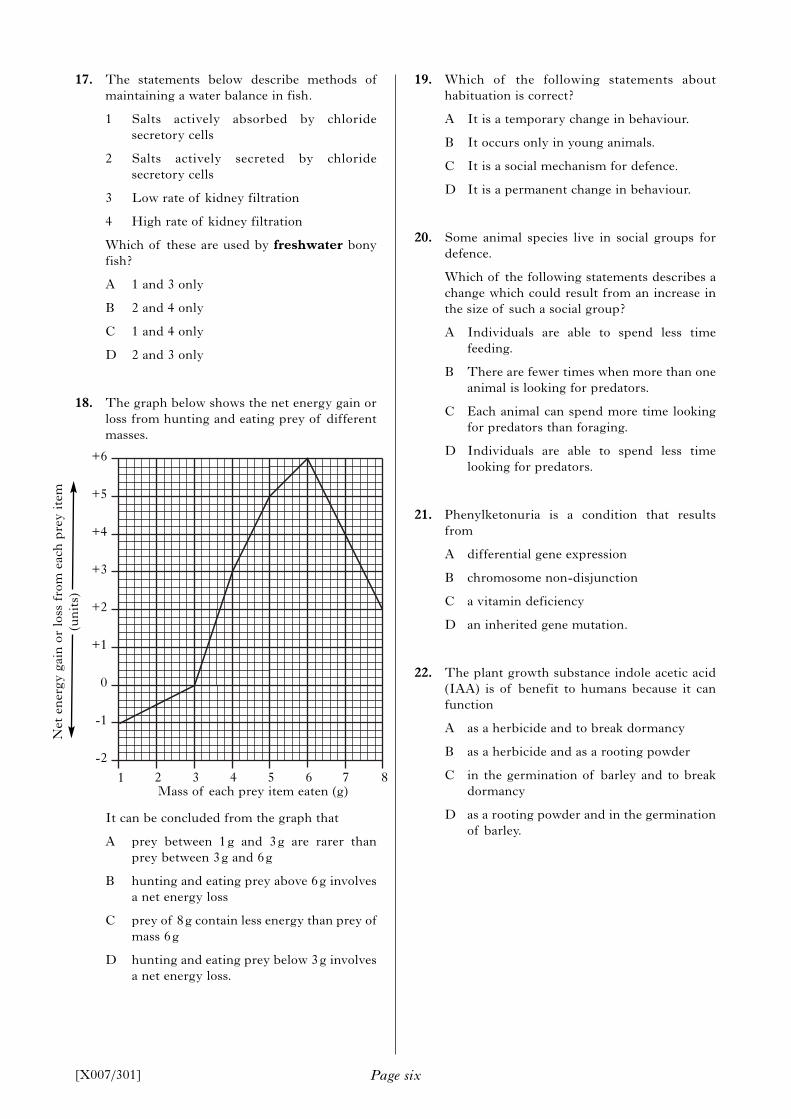
18. The graph below shows the net energy gain or
loss from hunting and eating prey of different
masses.
It can be concluded from the graph that
A prey between 1g and 3g are rarer than
prey between 3g and 6g
B hunting and eating prey above 6g involves
a net energy loss
C prey of 8g contain less energy than prey of
mass 6g
D hunting and eating prey below 3g involves
a net energy loss.
+6
+5
+4
+3
+2
+1
0
-1
-2
2 3 4 5 6 7 8
Net
en
erg
y g
ain
or
loss
fro
m e
ach
pre
y i
tem
(un
its)
Mass of each prey item eaten (g)1
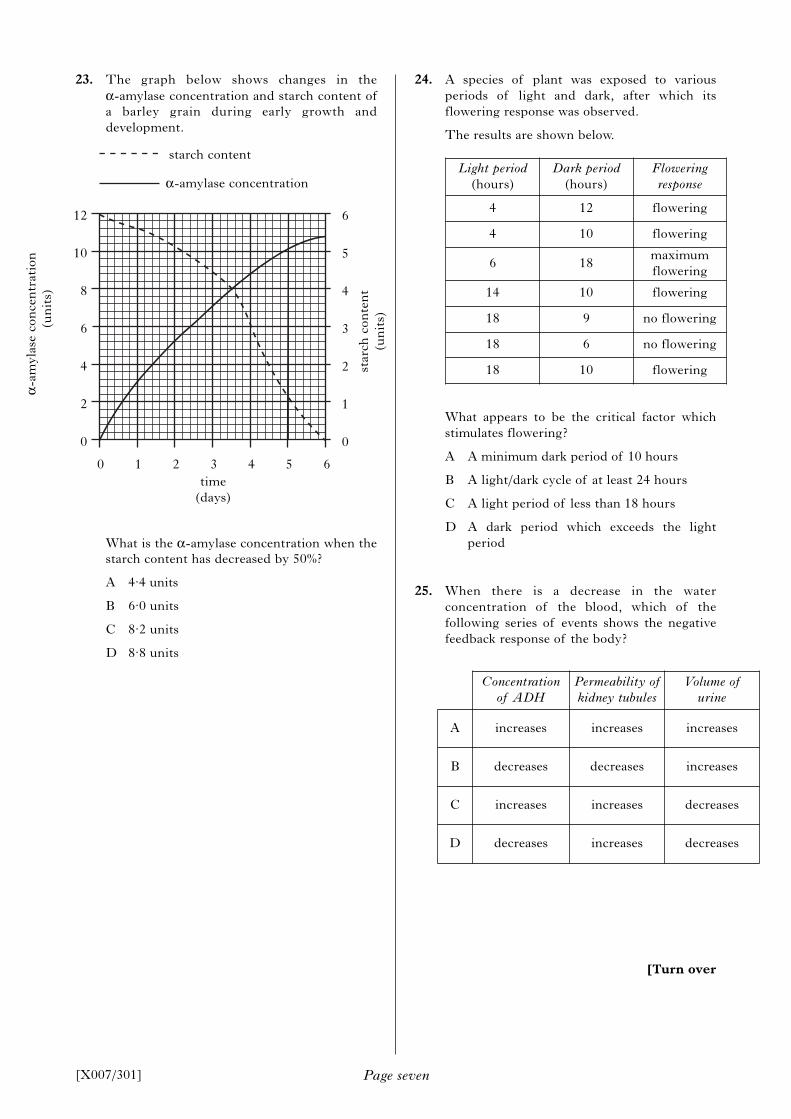
23. The graph below shows changes in the
α-amylase concentration and starch content of
a barley grain during early growth and
development.
What is the α-amylase concentration when the
starch content has decreased by 50%?
A 4.4 units
B 6.0 units
C 8.2 units
D 8.8 units
Page seven[X007/301]
24. A species of plant was exposed to various
periods of light and dark, after which its
flowering response was observed.
The results are shown below.
What appears to be the critical factor which
stimulates flowering?
A A minimum dark period of 10 hours
B A light/dark cycle of at least 24 hours
C A light period of less than 18 hours
D A dark period which exceeds the light
period
25. When there is a decrease in the water
concentration of the blood, which of the
following series of events shows the negative
feedback response of the body?
[Turn over
starch content
α-amylase concentration
α-am
yla
se c
on
cen
trati
on
(un
its)
12
10
8
6
4
2
0
0 1 2 3 4 5 6
6
5
4
3
2
1
0
starc
h c
on
ten
t
(un
its)
Light period(hours)
Dark period(hours)
Floweringresponse
4 12 flowering
4 10 flowering
6 18maximum
flowering
14 10 flowering
18 9 no flowering
18 6 no flowering
18 10 flowering
time
(days)
Concentrationof ADH
Permeability ofkidney tubules
Volume ofurine
A increases increases increases
B decreases decreases increases
C increases increases decreases
D decreases increases decreases
Page eight[X007/301]
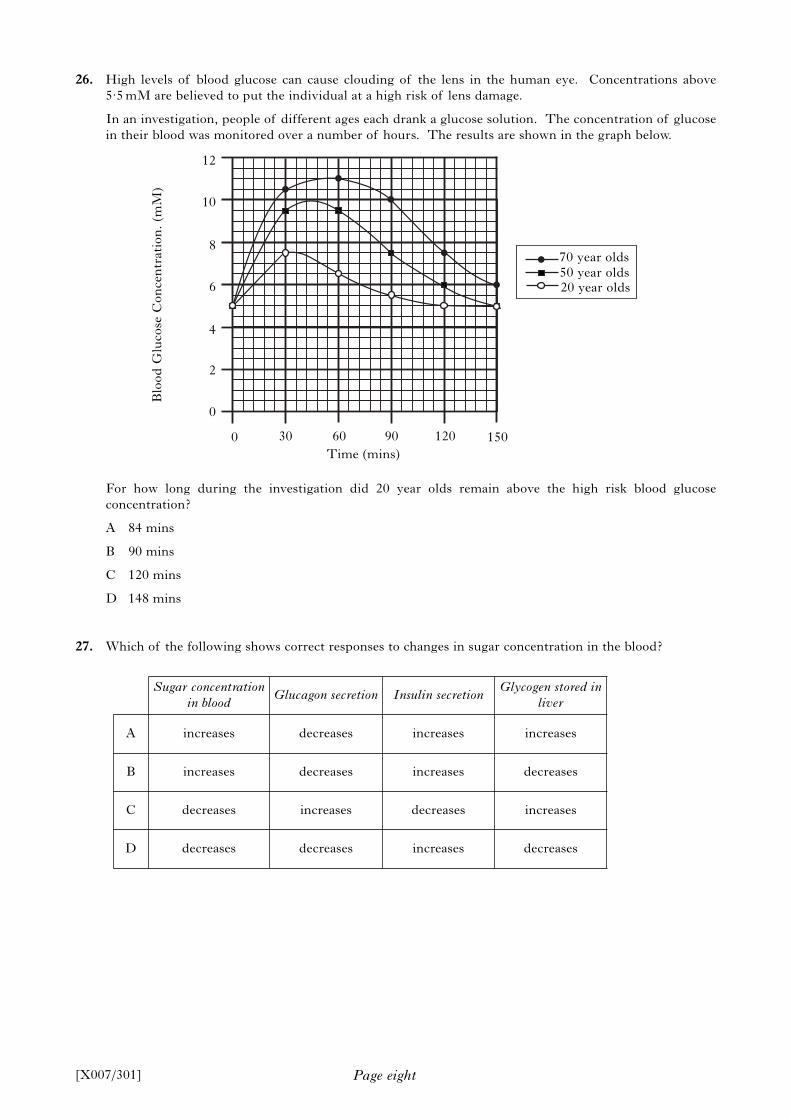
26. High levels of blood glucose can cause clouding of the lens in the human eye. Concentrations above
5.5 mM are believed to put the individual at a high risk of lens damage.
In an investigation, people of different ages each drank a glucose solution. The concentration of glucose
in their blood was monitored over a number of hours. The results are shown in the graph below.
For how long during the investigation did 20 year olds remain above the high risk blood glucose
concentration?
A 84 mins
B 90 mins
C 120 mins
D 148 mins
27. Which of the following shows correct responses to changes in sugar concentration in the blood?
70 year olds
50 year olds
20 year olds
Blo
od
Glu
cose
Con
cen
trati
on
. (m
M)
12
10
8
6
4
2
0
0 30 60 90 120 150
Time (mins)
Sugar concentrationin blood
Glucagon secretion Insulin secretionGlycogen stored in
liver
A increases decreases increases increases
B increases decreases increases decreases
C decreases increases decreases increases
D decreases decreases increases decreases
Page nine[X007/301]
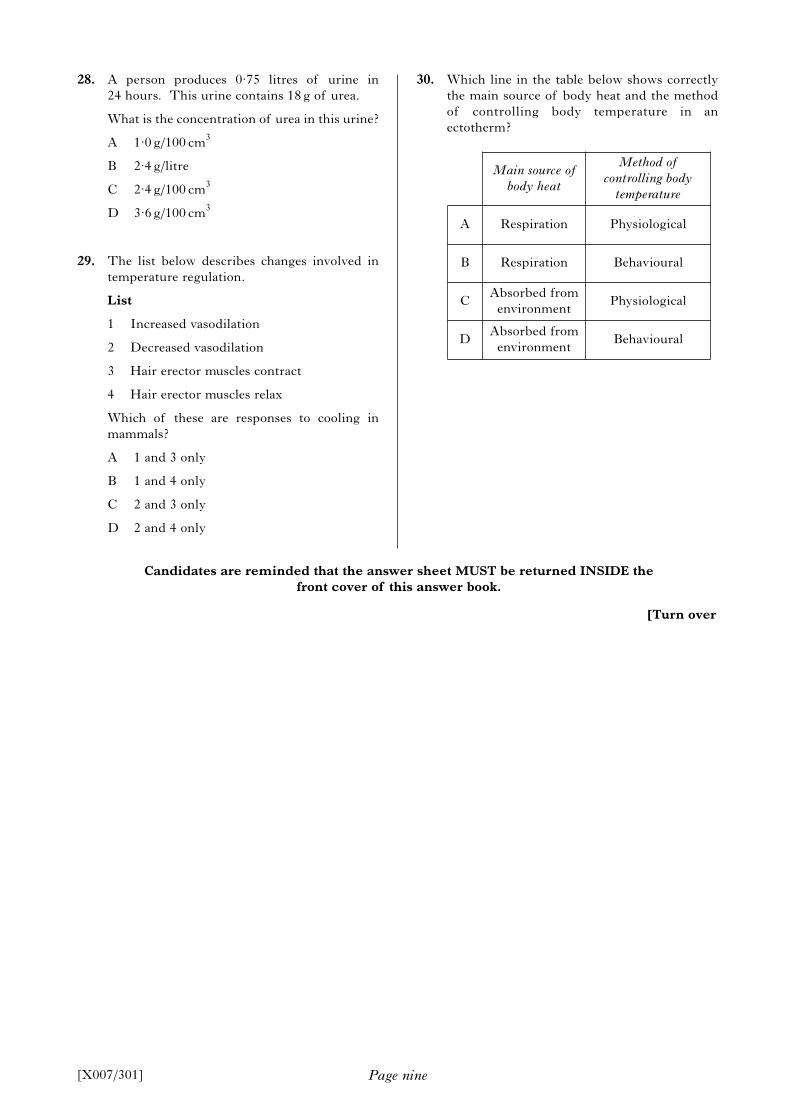
30. Which line in the table below shows correctly
the main source of body heat and the method
of controlling body temperature in an
ectotherm?
28. A person produces 0·75 litres of urine in
24 hours. This urine contains 18 g of urea.
What is the concentration of urea in this urine?
A 1.0 g/100 cm3
B 2.4 g/litre
C 2.4 g/100 cm3
D 3.6 g/100 cm3
29. The list below describes changes involved in
temperature regulation.
List
1 Increased vasodilation
2 Decreased vasodilation
3 Hair erector muscles contract
4 Hair erector muscles relax
Which of these are responses to cooling in
mammals?
A 1 and 3 only
B 1 and 4 only
C 2 and 3 only
D 2 and 4 only
Candidates are reminded that the answer sheet MUST be returned INSIDE the
front cover of this answer book.
[Turn over
Main source ofbody heat
Method ofcontrolling body
temperature
A Respiration Physiological
B Respiration Behavioural
CAbsorbed from
environmentPhysiological
DAbsorbed from
environmentBehavioural
SECTION B
All questions in this section should be attempted.
All answers must be written clearly and legibly in ink.
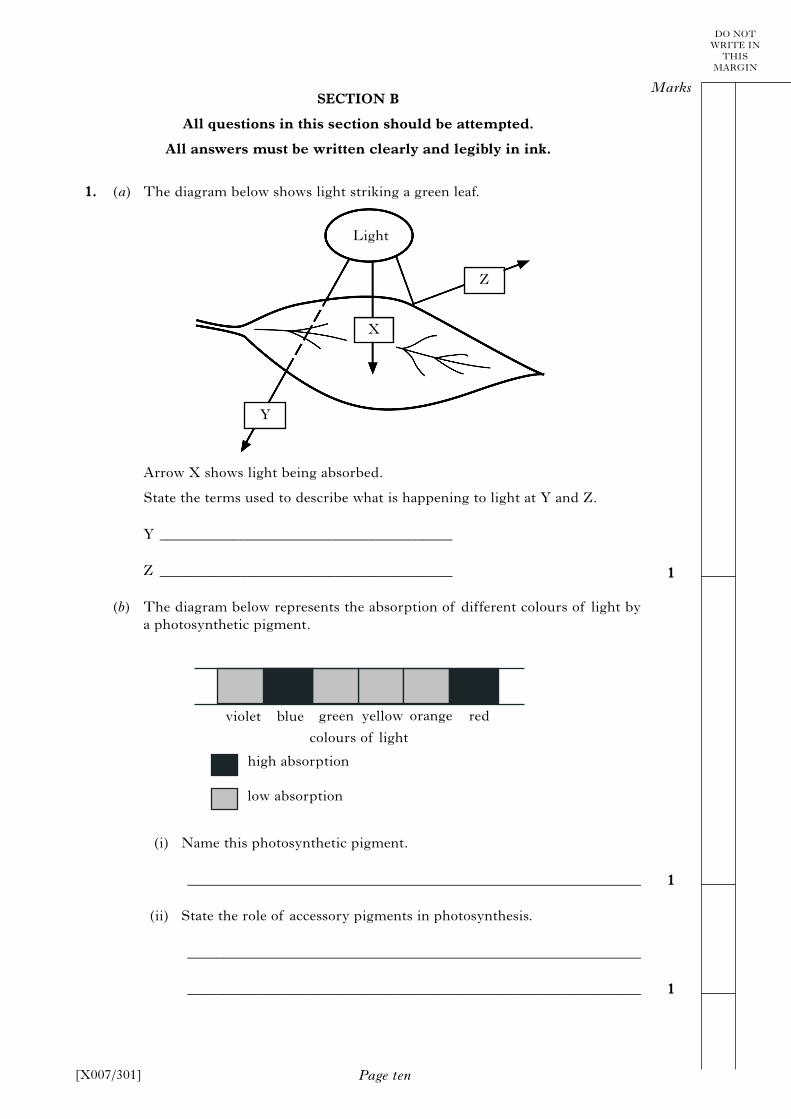
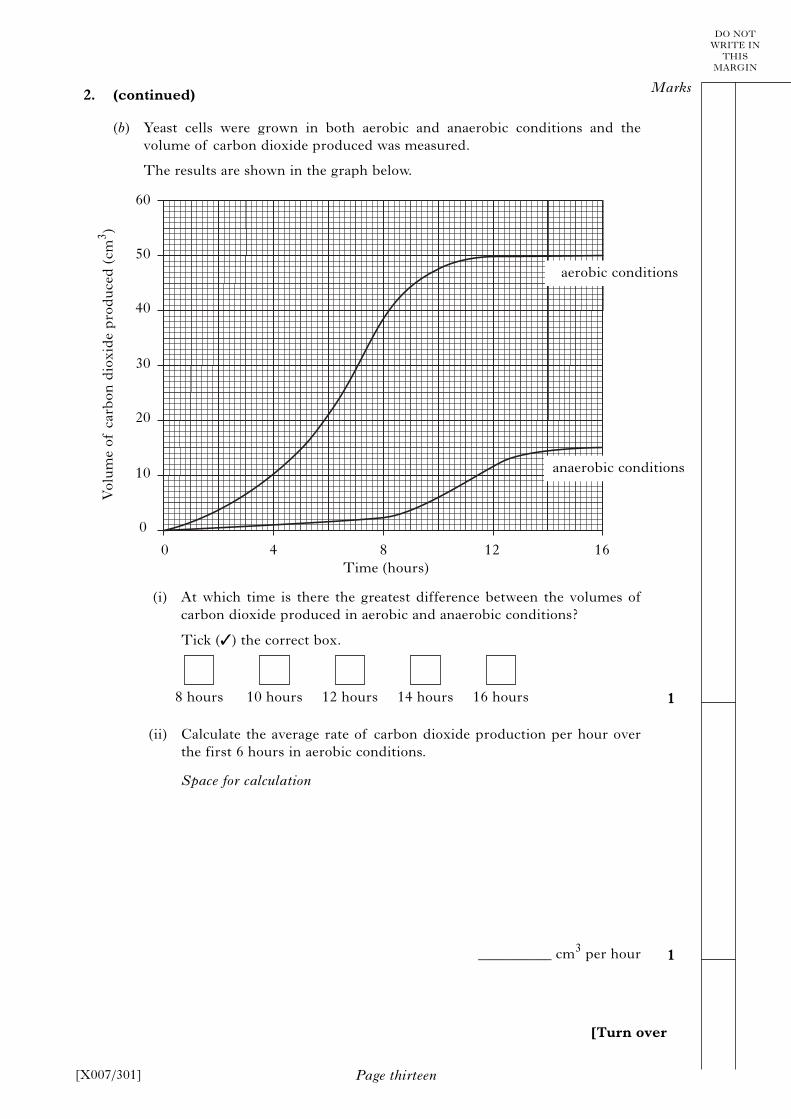
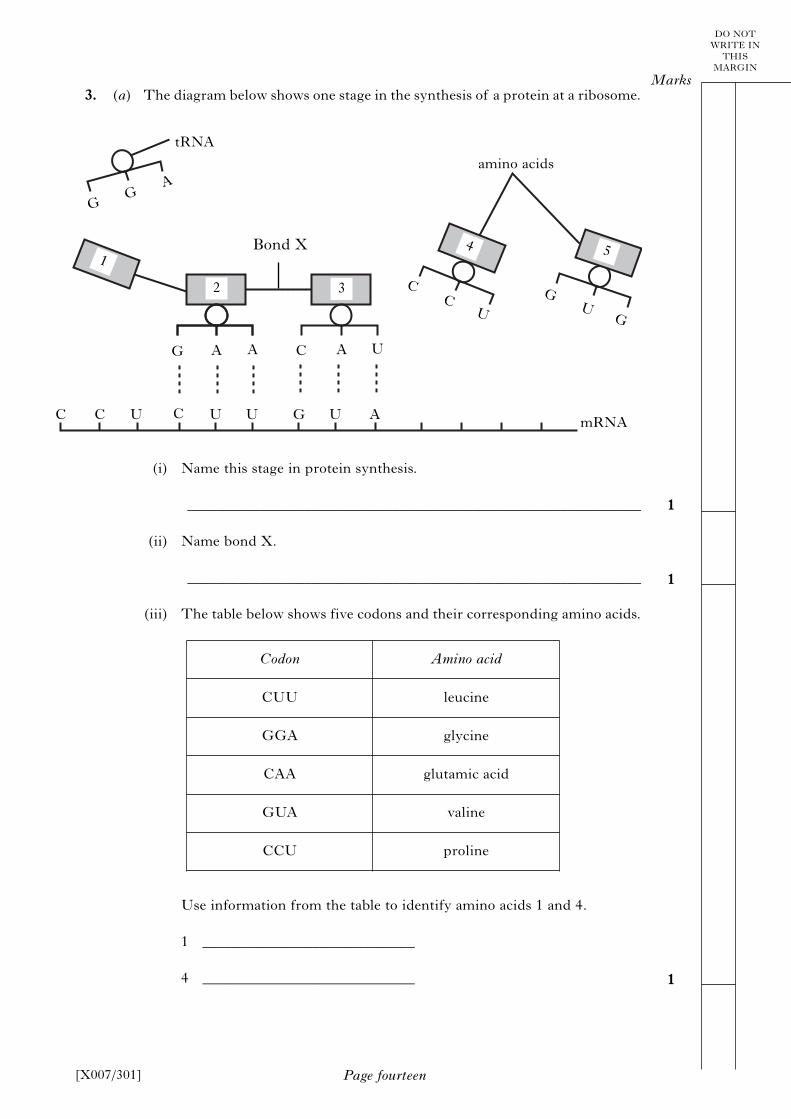
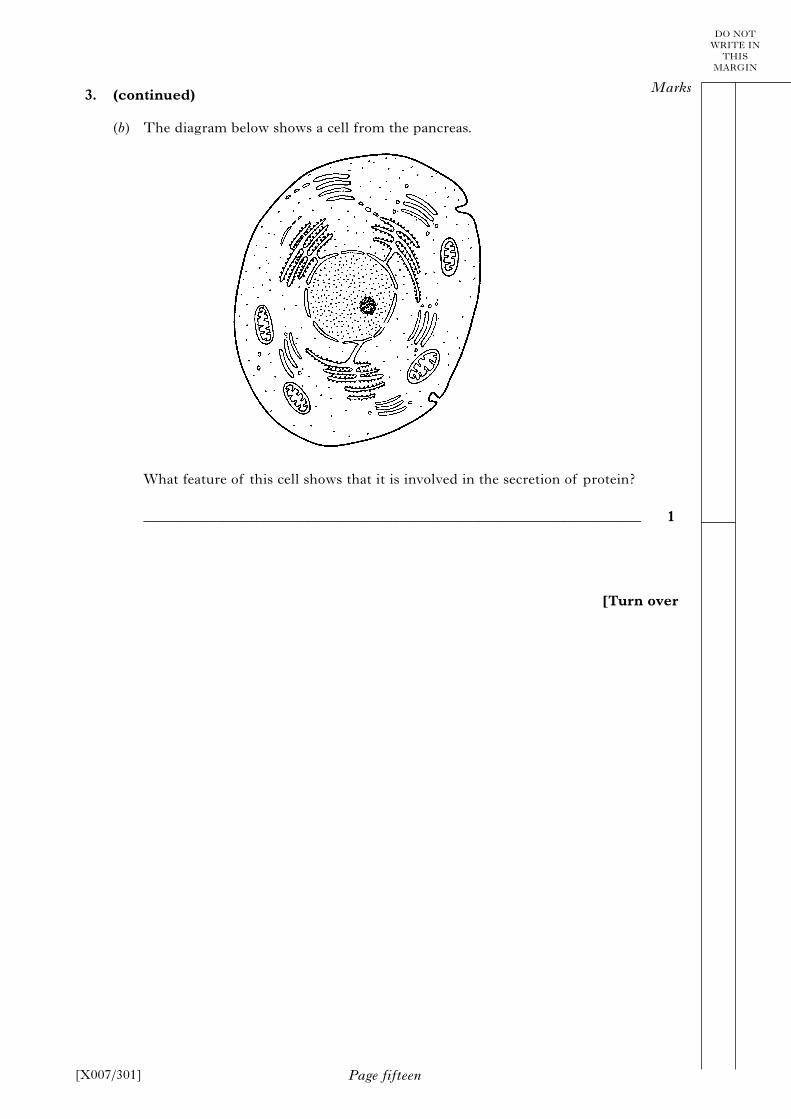
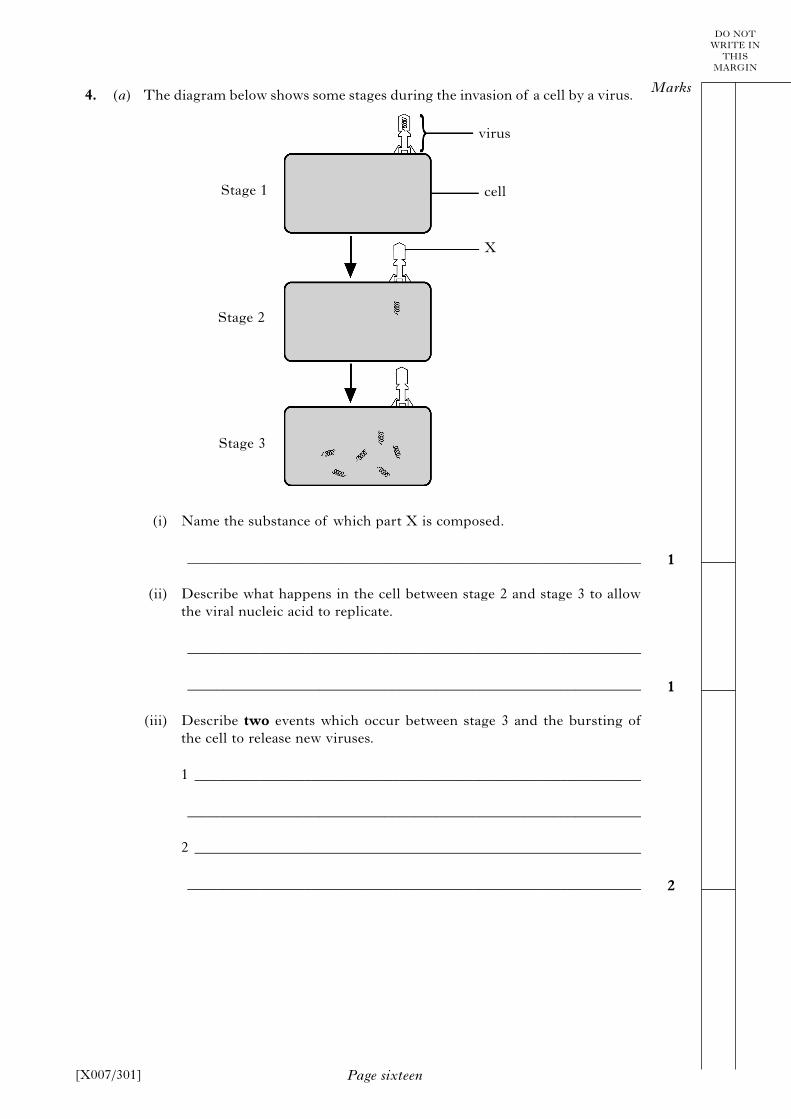
1. (a) The diagram below shows light striking a green leaf.
Arrow X shows light being absorbed.
State the terms used to describe what is happening to light at Y and Z.
Y ________________________________________
Z ________________________________________
(b) The diagram below represents the absorption of different colours of light by
a photosynthetic pigment.
(i) Name this photosynthetic pigment.
______________________________________________________________
(ii) State the role of accessory pigments in photosynthesis.
______________________________________________________________
______________________________________________________________
Page ten
DO NOT
WRITE IN
THIS
MARGIN
Marks
1
1
1
[X007/301]
Light
Y
violet blue green yellow orange red
high absorption
low absorption
colours of light
X
Z
1. (continued)
(c) The diagram below shows an outline of the carbon fixation stage of
photosynthesis.
(i) State the exact location of this stage in a plant cell.
______________________________________________________________
(ii) Describe the role of hydrogen in the carbon fixation stage.
______________________________________________________________
______________________________________________________________
(d) The graph below shows the effect of increasing the concentration of carbon
dioxide on the rate of photosynthesis by a plant at different temperatures.
Light intensity was kept constant.
Using the information in the graph, identify the factor which is limiting
the rate of photosynthesis at each of the points P, Q and R.
P
Q
R
Page eleven
DO NOT
WRITE IN
THIS
MARGIN
Marks
1
1
2
[X007/301] [Turn over
hydrogen
glucoseRuBP
GP
carbon dioxide
40
20
0
0 0.02 0.04 0.06 0.08
P
20 °C
10 °C
R
Q
Rate
of
ph
oto
syn
thesi
s
(mm
ole
s carb
on
dio
xid
e
taken
up
per
m2
leaf
per
s)
Concentration of carbon dioxide (%)
2. (a) The diagram below shows some of the steps in respiration.
(i) Complete the table below by naming substances W, X and Y.
(ii) State the number of carbon atoms present in a molecule of substance Z.
__________________________
Page twelve
Marks
2
1
[X007/301]
DO NOT
WRITE IN
THIS
MARGIN
glucose pyruvic acid substance X
substance Y acetyl–CoACoA
4–carboncompound
substance Y
substance Z
hydrogen
cytochrome system
substance W water
Substance Name
W
X
Y
2. (continued)
(b) Yeast cells were grown in both aerobic and anaerobic conditions and the
volume of carbon dioxide produced was measured.
The results are shown in the graph below.
(i) At which time is there the greatest difference between the volumes of
carbon dioxide produced in aerobic and anaerobic conditions?
Tick (✓) the correct box.
(ii) Calculate the average rate of carbon dioxide production per hour over
the first 6 hours in aerobic conditions.
Space for calculation
__________ cm3
per hour
Page thirteen[X007/301]
[Turn over
Marks
1
1
DO NOT
WRITE IN
THIS
MARGIN
8 hours 10 hours 12 hours 14 hours 16 hours
0 4 8 12 16
40
50
60
30
20
10
0
aerobic conditions
anaerobic conditions
Time (hours)
Volu
me o
fcarb
on
dio
xid
e p
rod
uced
(cm
3)
3. (a) The diagram below shows one stage in the synthesis of a protein at a ribosome.
(i) Name this stage in protein synthesis.
______________________________________________________________
(ii) Name bond X.
______________________________________________________________
(iii) The table below shows five codons and their corresponding amino acids.
Use information from the table to identify amino acids 1 and 4.
1 _____________________________
4 _____________________________
Page fourteen
DO NOT
WRITE IN
THIS
MARGIN
Marks
1
1
1
[X007/301]
tRNA
GG
A
G
GUU
CC
G A A C A U
C C U C U U G U AmRNA
amino acids
Codon Amino acid
CUU leucine
GGA glycine
CAA glutamic acid
GUA valine
CCU proline
1
2 3
4 5Bond X
3. (continued)
(b) The diagram below shows a cell from the pancreas.
What feature of this cell shows that it is involved in the secretion of protein?
____________________________________________________________________
[X007/301] Page fifteen
DO NOT
WRITE IN
THIS
MARGIN
Marks
1
[Turn over
4. (a) The diagram below shows some stages during the invasion of a cell by a virus.
(i) Name the substance of which part X is composed.
______________________________________________________________
(ii) Describe what happens in the cell between stage 2 and stage 3 to allow
the viral nucleic acid to replicate.
______________________________________________________________
______________________________________________________________
(iii) Describe two events which occur between stage 3 and the bursting of
the cell to release new viruses.
1 _____________________________________________________________
______________________________________________________________
2 _____________________________________________________________
______________________________________________________________
Page sixteen
DO NOT
WRITE IN
THIS
MARGIN
Marks
1
1
2
[X007/301]
virus
cell
X
Stage 1
Stage 2
Stage 3
4. (continued)
(b) The presence of viruses in the human body triggers antibody production by
lymphocytes.
(i) What name is given to any substance that triggers this response?
______________________________________________________________
(ii) A person was injected with a vaccine on day 1 and again on day 36 of
a 70 day study. The table below shows the concentration of antibodies
to this vaccine in this person’s blood at the end of each 7 day period
during the study.
1 How many times greater was the maximum antibody concentration
following the second injection compared with the maximum
concentration following the first?
Space for calculation
_______ times
2 The second injection caused a higher concentration of antibody to be
produced than the first injection.
Identify two other differences in the response to the second
injection.
1 __________________________________________________________
2 __________________________________________________________
Page seventeen
DO NOT
WRITE IN
THIS
MARGIN
Marks
1
1
1
[X007/301]
Day 7 14 21 28 35 42 49 56 63 70
Concentration ofantibody
(mg/100 ml blood)
3 15 28 32 10 80 102 112 120 118
1st injection 2nd injection
[Turn over
5. Mexican spotted owls are territorial and prey on several species of small mammal.
Three pairs of owls were studied over a two year period.
The table below shows the number of each prey species eaten by each pair of owls.
The graph below shows the average number and average total biomass of deer mice
and woodrats living in the study area in different seasons.
(a) (i) What percentage of the total number of prey eaten by owl pair A were
deer mice?
Space for calculation
_______ %
Page eighteen
DO NOT
WRITE IN
THIS
MARGIN
[X007/301]
Prey speciesNumber of each prey species eaten by each pair of owls
Owl pair A Owl pair B Owl pair C
deer mouse 484 528 515
woodrat 29 144 141
brush mouse 15 114 118
rock squirrel 22 24 23
deer mice
woodrats
A Autumn
W Winter
Sp Spring
S Summer
14
12
10
8
6
4
2
0
300
200
100
0
A W Sp S A W Sp S
YEAR 1 YEAR 2
Avera
ge t
ota
l b
iom
ass
(g p
er
hecta
re)
Avera
ge n
um
ber
per
hecta
re
Marks
1
Key
5. (a) (continued)
(ii) Express as the simplest whole number ratio the numbers of deer mice,
brush mice and rock squirrels eaten by owl pair B.
Space for calculation
(b) Use evidence from the table to identify the owl pair that foraged in a different
habitat to the other two pairs of owls.
Justify your answer.
Pair ____________________________
Justification ________________________________________________________
____________________________________________________________________
____________________________________________________________________
(c) (i) Use values from the graph to describe the change in average number
of woodrats per hectare from spring of Year 1 until spring of Year 2.
______________________________________________________________
______________________________________________________________
(ii) Calculate the percentage decrease in the average total biomass of
woodrats between summer of Year 1 and winter of Year 2.
Space for calculation
_______ %
(d) Calculate the average biomass of one deer mouse in summer of Year 1.
Space for calculation
______ g
(e) The size of the territory of a pair of Mexican spotted owls is different in
winter and summer. Give an explanation of this observation which can be
supported by evidence from the graph.
____________________________________________________________________
____________________________________________________________________
____________________________________________________________________
Page nineteen
DO NOT
WRITE IN
THIS
MARGIN
Marks
1
1
2
1
1
1
[X007/301]
deer mice brush mice rock squirrels
__________ __________ ____________
: :
: :
[Turn over
6. The diagram below shows a pair of homologous chromosomes in a mouse cell
during meiosis. The positions of three genes R, S and T are also shown.
(a) Name an organ in mice where meiosis occurs.
____________________________________________________________________
(b) (i) Name point X where crossing over may occur.
______________________________________________________________
(ii) Crossing over leads to recombination of genes.
Between which two genes in the diagram would the greatest frequency of
recombination take place?
and
(iii) Crossing over is a source of genetic variation.
Name one other feature of meiosis which leads to genetic variation.
______________________________________________________________
(c) A mouse egg contains 20 chromosomes.
State the number of chromosomes present in a mouse gamete mother cell.
__________ chromosomes
Page twenty[X007/301]
DO NOT
WRITE IN
THIS
MARGINMarks
1
1
1
1
1
R
R
R
R
S
S
S
S
T
T
T
T
X
7. In Labrador dogs, the alleles B and b and alleles E and e are involved in the
determination of coat colour.
• Labradors with alleles B and E are always black.
• Labradors with alleles bb and E are always chocolate coloured.
• Labradors with alleles ee are always yellow.
(a) A male black Labrador of genotype BbEe was crossed with a yellow female of
the genotype bbee.
(i) Complete the table below to show the genotypes of the gametes of the
male.
(ii) Give the expected phenotype ratio of the offspring from this cross.
Space for calculation
(b) Give the genotype of a male Labrador which could be crossed with a female of
genotype bbee to ensure that all the offspring produced would be chocolate
coloured.
Space for calculation
Genotype ___________________
Page twenty-one
DO NOT
WRITE IN
THIS
MARGIN
Marks
1
1
1
[X007/301]
Black : Chocolate : Yellow
Genotypes of male gametes
[Turn over
Page twenty-two
8. Cuticles are waxy layers on the surfaces of the leaves of many plant species.
The table below shows the average cuticle thickness of the leaves of five plant
species and the rates of water loss through their cuticles at 20 °C with no air
movement.
(a) (i) Describe the relationship between average cuticle thickness and rate of
water loss through the cuticles in these plant species.
______________________________________________________________
______________________________________________________________
______________________________________________________________
(ii) Leaves lose most water through their open stomata.
Give the term used to describe the condition of the guard cells when
stomata are open.
______________________________________________________________
(iii) State two changes to environmental conditions which could lead to an
increase in water loss from leaves.
1 _____________________________________________________________
2 _____________________________________________________________
DO NOT
WRITE IN
THIS
MARGIN
[X007/301]
Marks
2
1
1
SpeciesAverage cuticle thickness
(micrometres)
Rate of water loss through cuticle (cubic micrometres per cm
2per hour)
A 1.4 36.7
B 2.8 25.8
C 4.2 18.1
D 5.6 8.5
E 7.0 8.4
Page twenty-three
8. (continued)
(b) Plants which grow in extremely dry conditions have leaf adaptations which
reduce water loss.
(i) Complete the table below to explain how each leaf adaptation reduces
water loss.
(ii) What term describes plants that have adaptations to reduce water loss?
______________________________________________________________
DO NOT
WRITE IN
THIS
MARGIN
[X007/301]
Marks
2
1
Leaf adaptationExplanation of how the adaptation
reduces water loss from leaves
Presence of hairs on leaf surface
Leaves small and few in number
[Turn over
9. (a) In an investigation into the effects of grazing, the total biomass of grass species
and the diversity of all plant species in a field was monitored over a period of
four years. The field was not grazed in years 1 and 2. Sheep grazed the field
in years 3 and 4.
The results are shown on the graph below.
(i) Explain the effects of grazing by sheep on the total biomass of grass
species and the diversity of plant species during year 3.
Total biomass of grass species.
______________________________________________________________
Diversity of all plant species
______________________________________________________________
______________________________________________________________
(ii) The number of sheep grazing the field was increased after year 4.
Suggest how this would affect the diversity of plant species in the field.
Justify your answer.
Effect on diversity
______________________________________________________________
Justification
______________________________________________________________
______________________________________________________________
Page twenty-four[X007/301]
DO NOT
WRITE IN
THIS
MARGIN
Marks
1
1
1
In
cre
asi
ng t
ota
l b
iom
ass
of
gra
ss
In
cre
asi
ng d
ivers
ity o
fp
lan
t sp
ecie
s
Year 1 Year 2 Year 3 Year 4
diversity biomass
Page twenty-five
9. (continued)
(b) The table below contains statements describing plant adaptations.
Complete the table by ticking (✓) the boxes to show the adaptations that help
the plants tolerate the effects of grazing.
DO NOT
WRITE IN
THIS
MARGIN
Marks
2
[X007/301]
Plant adaptation Tick (✓)
Dandelions have deep roots
Wild roses have thorns
Couch grass has underground stems
Nettles have stings
Tobacco plants produce nicotine
[Turn over
Page twenty-six
10. Catechol oxidase is an enzyme found in apple tissue. It is involved in the reaction
which produces the brown pigment that forms in cut or damaged apples.
The effect of the concentration of lead ethanoate on this reaction was investigated.
10 g of apple tissue was cut up, added to 10 cm3
of distilled water and then
liquidised and filtered. This produced an extract containing both catechol and
catechol oxidase.
Test tubes were set up as described in Table 1 and kept at 20 ºC in a water bath.
Every 10 minutes, the tubes were placed in a colorimeter which measured how
much brown pigment was present.
The more brown pigment present the higher the colorimeter reading.
The results are shown in Table 2.
(a) (i) Identify two variables not already mentioned that would have to be kept
constant.
1 _____________________________________________________________
2 _____________________________________________________________
DO NOT
WRITE IN
THIS
MARGINMarks
1
1
[X007/301]
catechol
(colourless substance
in apple tissue)
brown pigmentscatechol oxidase
Tube Contents of tubes
A sample of extract + 1 cm3
distilled water
B sample of extract + 1 cm3
0.01% lead ethanoate solution
C sample of extract + 1 cm3
0.1% lead ethanoate solution
Time(minutes)
Colorimeter reading (units)
Tube A Tube B Tube C
sample of extract +distilled water
sample of extract +0.01% lead ethanoate
sample of extract +0.1% lead ethanoate
0 1.6 1.8 1.6
10 7.0 5.0 2.0
20 9.0 6.0 2.2
30 9.6 6.4 2.4
40 10.0 7.0 2.4
50 10.0 7.6 2.4
60 10.0 7.6 2.4
Table 1
Table 2
10. (a) (continued)
(ii) Describe how tube A acts as a control in this investigation.
______________________________________________________________
______________________________________________________________
(b) Explain why the initial colorimeter readings were not 0.0 units.
____________________________________________________________________
____________________________________________________________________
(c) The results for the extract with 0.1% lead ethanoate are shown in the graph
below.
Use information from Table 2 to complete the graph by:
(i) adding the scale and label to each axis;
(ii) presenting the results for the extract + 0.01% lead ethanoate solution
and labelling the line.
(Additional graph paper, if required, will be found on page 40.)
(d) State the effect of the concentration of lead ethanoate solution on the activity
of catechol oxidase.
____________________________________________________________________
____________________________________________________________________
(e) The experiment was repeated with the 0.1% lead ethanoate solution at 60 °C.
Predict the colorimeter reading at 10 minutes and justify your answer.
Prediction _____________ units
Justification ________________________________________________________
____________________________________________________________________Page twenty-seven
DO NOT
WRITE IN
THIS
MARGIN
Marks
1
1
1
1
1
1[X007/301] [Turn over
extract +0.1% leadethanoate
Page twenty-eight
11. Many species of cichlid fish are found in Lake Malawi in Africa.
The diagram below shows the heads of three different cichlid fish and gives
information on their feeding methods.
These species have evolved from a single species.
(a) Describe how the information given about these fish illustrates adaptive
radiation.
____________________________________________________________________
____________________________________________________________________
____________________________________________________________________
(b) What evidence would confirm that the cichlids are different species?
____________________________________________________________________
____________________________________________________________________
(c) The evolution of these cichlid fish has involved geographical isolation.
(i) Name another type of isolating mechanism.
______________________________________________________________
(ii) State the importance of isolating mechanisms in the evolution of new
species.
______________________________________________________________
______________________________________________________________
DO NOT
WRITE IN
THIS
MARGIN
[X007/301]
Marks
2
1
1
1
Sucks in microscopic
organisms from the waterScrapes algae from the
surfaces of rocks
Crushes snail shells and
extracts flesh
12. Diagram A shows a section through a woody stem. Diagram B shows a magnified
view of the area indicated on the section.
(a) Which letter on diagram B shows the position of a lateral meristem?
Letter _________________________
(b) Name the tissue of which annual rings are composed.
____________________________________________________________________
(c) In which season was the woody stem cut?
Explain your choice.
Season _________________________
Explanation ________________________________________________________
____________________________________________________________________
____________________________________________________________________
Page twenty-nine
DO NOT
WRITE IN
THIS
MARGIN
Marks
1
1
1
1
[X007/301]
Diagram A Diagram B
J K M N
[Turn over
L
Page thirty
13. The diagram below shows information relating to the Jacob–Monod hypothesis of
the control of gene action in the bacterium Escherichia coli.
(a) Name gene 1.
__________________________________________
(b) Name the substance which acts as the inducer.
__________________________________________
(c) (i) Describe the sequence of events that occurs in the absence of the
inducer.
______________________________________________________________
______________________________________________________________
______________________________________________________________
______________________________________________________________
(ii) Explain why it is important for E. coli to control gene action.
______________________________________________________________
______________________________________________________________
DO NOT
WRITE IN
THIS
MARGIN
Marks
1
1
2
1
[X007/301]
Section of bacterial
chromosome
β−galactosidase
gene 1
operator
gene 2
inducer
repressor molecule
Page thirty-one
14. Environmental factors influence growth and development in animals.
(a) (i) Explain the importance of iron in the growth and development of
humans.
_______________________________________________________________
_______________________________________________________________
(ii) Describe the effects of nicotine on growth and development of a human
fetus.
_______________________________________________________________
_______________________________________________________________
(b) Breeding behaviour in red deer starts in autumn.
(i) Describe the environmental influence that triggers the start of breeding
at this time of year.
_______________________________________________________________
_______________________________________________________________
(ii) Suggest an advantage to red deer of starting to breed at this time of year.
_______________________________________________________________
_______________________________________________________________
DO NOT
WRITE IN
THIS
MARGIN
Marks
1
1
1
1
[X007/301]
[Turn over
Page thirty-two
15. The diagram below shows the plant communities that have developed around a
fresh water loch.
(a) What term describes the process of gradual formation of a climax community?
____________________________________________________________________
(b) Suggest a modification that community X may make to its habitat which
allows colonisation by community Y.
____________________________________________________________________
____________________________________________________________________
(c) Underline one alternative in each pair to make the sentences correct.
The complexity of the food web in the climax community will be
that in the pioneer community.
Greater species diversity will exist in
DO NOT
WRITE IN
THIS
MARGIN
Marks
1
1
1
[X007/301]
Fresh water
loch
soil
Pioneer community Community X Community Y Climax community
Increasing age of communities
greater than
less than{ {community X
community Y{ {.
Page thirty-three[X007/301]
DO NOT
WRITE IN
THIS
MARGIN
SECTION C
Both questions in this section should be attempted.
Note that each question contains a choice.
Questions 1 and 2 should be attempted on the blank pages which follow.
Supplementary sheets, if required, may be obtained from the invigilator.
All answers must be written clearly and legibly in ink.
Labelled diagrams may be used where appropriate.
1. Answer either A or B.
A. Write notes on:
(i) structure of the plasma membrane;
(ii) function of the plasma membrane in active transport;
(iii) structure and function of the cell wall.
OR
B. Write notes on :
(i) the structure of DNA;
(ii) DNA replication and its importance.
In question 2, ONE mark is available for coherence and ONE mark is available
for relevance.
2. Answer either A or B.
A. Give an account of the importance of nitrogen, phosphorus and magnesium in
plant growth and describe the symptoms of their deficiency.
OR
B. Give an account of how animal populations are regulated by
density-dependent and by density-independent factors.
[END OF QUESTION PAPER]
Marks
4
3
3
(10)
6
4
(10)
(10)
(10)
[Turn over