Page 1
Vital Events Reference Tables 2016
Section 1: Summary
Table 1.1(a)Table 1.1(b)Table 1.2Table 1.3Table 1.4Table 1.5Table 1.6Table 1.7
Section 2: Adoptions and re-registrations
Table 2.01:Table 2.02:Table 2.03:
Section 3: Births
Table 3.1(a)Table 3.1(b)Table 3.2Table 3.3Table 3.4Table 3.5Table 3.6Table 3.7(a)Table 3.7(b)Table 3.7(c)Table 3.8Table 3.9Table 3.10Table 3.11Table 3.12Table 3.13Table 3.14
Table 3.15Table 3.16
All Tables for Section 4: Stillbirths and infant deaths
Table 4.1Table 4.2Table 4.3Table 4.4Table 4.5Table 4.6Table 4.7
Section 5: Death rates, by sex and age, Scotland
Table 5.01(a)Table 5.01(b)Table 5.02
Population and vital events, Scotland, annual averages 1855-60 to 2011-15 Population and vital events, Scotland, 1971 to 2016Births, stillbirths, deaths, marriages and civil partnerships, numbers and rates, Scotland, quarterly, 2002 to 2016Estimated population, births, stillbirths, deaths, marriages and civil partnerships, numbers and rates, by administrative area, Scotland, 2016Births, deaths and death rates by administrative area, resident and not resident in Scotland, 2016Standardised mortality ratios (based on Scotland experience) for selected causes, by administrative area, Scotland, 2016International populations and vital statistics rates, selected countries, latest available figuresSummary comparisons with other countries of the United Kingdom
Adoptions, Scotland, 1930 - 2016Adoptions by age of child and relationship of the adopter(s), 2016Adoptions by type of adoption and by type of adopter(s), 1999 - 2016
Live births, numbers and percentages, by age of mother and marital status of parents, Scotland, 1946-50 to 2011-15Live births, numbers and percentages, by age of mother and marital status of parents, Scotland, 2000 to 2016Live births, numbers and percentages, by marital status of parents and type of registration, Scotland, 1974 to 2016Live births outside marriage, numbers and percentages, age of mother and type of registration, Scotland, 1974 to 2016Birth rate, gross and net reproduction rates and general and total fertility rates, Scotland, 1971 to 2016Fertility rates by age of mother and marital status of parents, Scotland, 1971 to 2016Age-specific birth rates, per 1,000 female population, Scotland, 1951 to 2016Cumulative fertility, by (assumed) birth cohort and selected age, Scotland, up to 2016Cumulative fertility, for selected (assumed) birth cohorts, Scotland, up to 2016Cumulative fertility, 1935-1999 (assumed) birth cohorts, Scotland, up to 2016Live births, numbers and fertility rates by marital status of parents, type of registration and administrative area, Scotland, 2016Live births, by country of birth of mother and administrative area, Scotland, 2016Live births, country of birth of mother by country of birth of father, Scotland, 2015Live births, stillbirths and maternities, by sex of child, marital status of parents and age of mother, Scotland, 2015Live birth, stillbirth and maternity rates per 1,000 women, by sex of child and age of mother, Scotland, 2016Live births by country of birth of mother, Scotland, 2004, 2009, 2012 to 2016Live Births, Stillbirths and Maternities, by sex of child, marital status of parents and age of mother, Scotland and administrative areas, 2012 - Multi-sheet Excel workbook, available separatelyLive births, numbers by age of mother and age of father, and the average ages of mothers and fathers, Scotland, 2016Fertility rates (per 1,000 women) by age group and administrative area Scotland, 2016
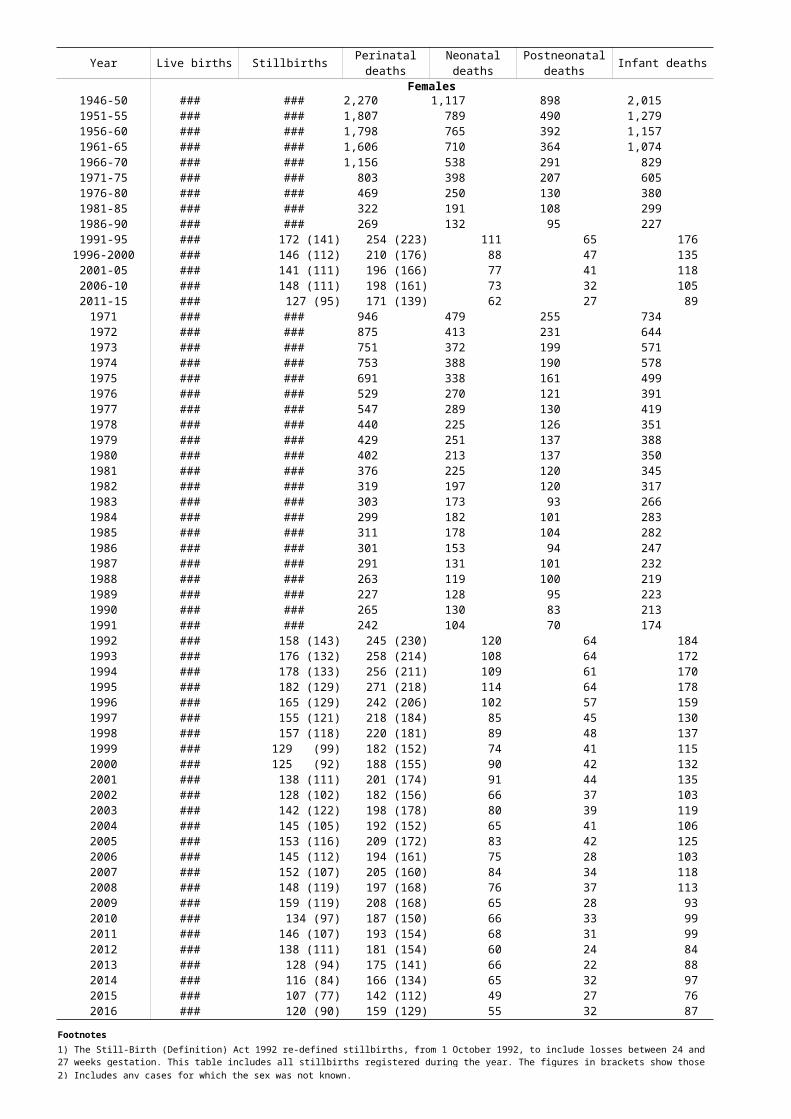
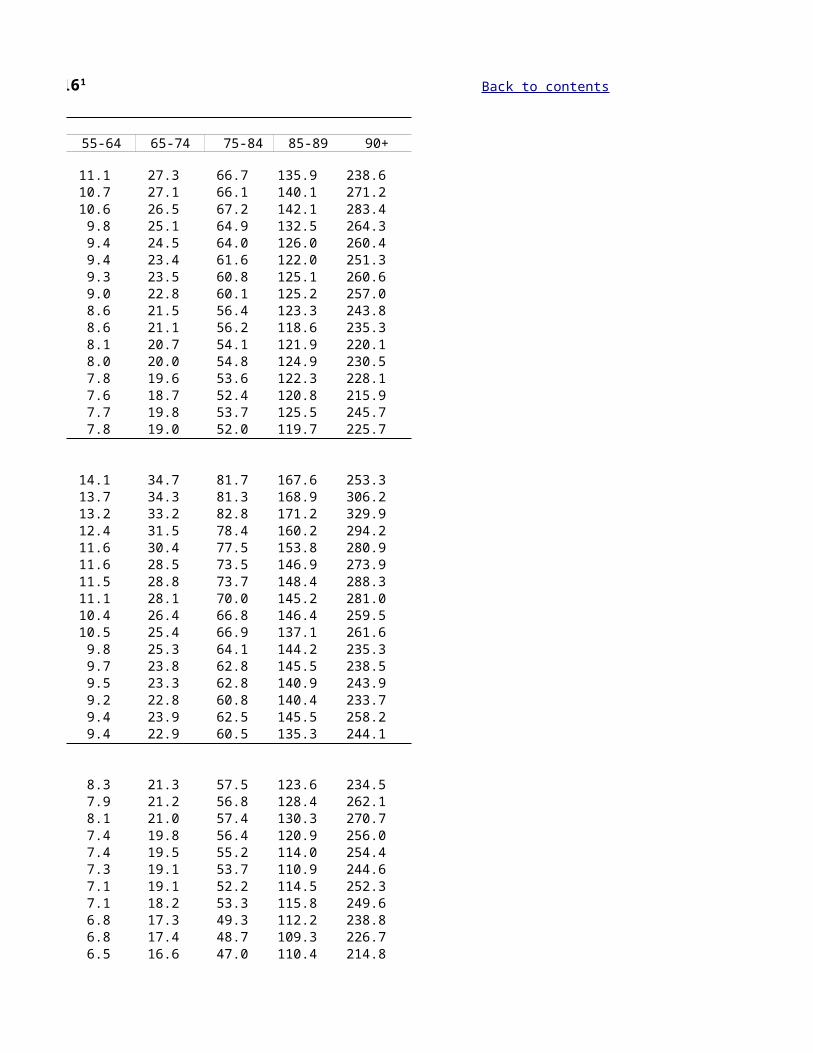
Live births, stillbirths, perinatal, neonatal, postneonatal and infant deaths, Scotland, 1946 to 2016Stillbirth,perinatal, neonatal, postneonatal and infant death rates, Scotland, 1946 to 2016Infant death rates, by age, Scotland, 1946 to 2016Stillbirths, by sex and cause, Scotland, 2005 to 2016Infant deaths, by sex and cause, Scotland, 2005 to 2016Stillbirth rates, by sex and cause, Scotland, 2005 to 2016Infant death rates, by sex and cause, Scotland, 2005 to 2016
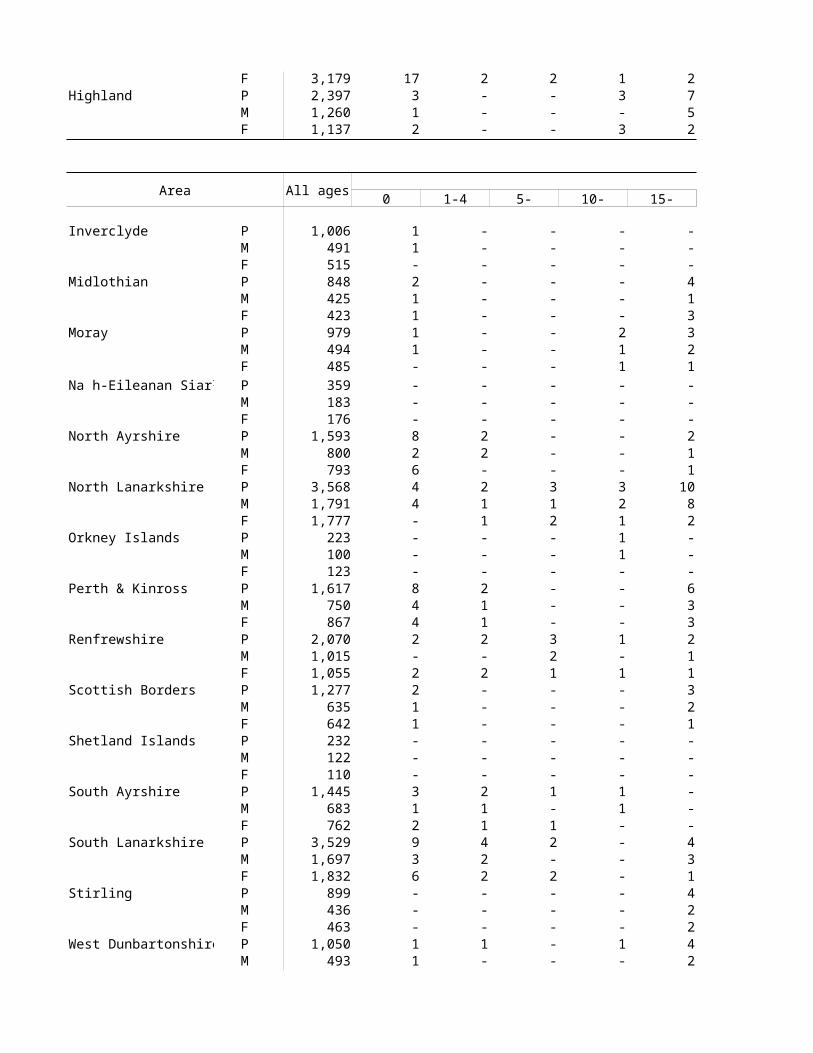
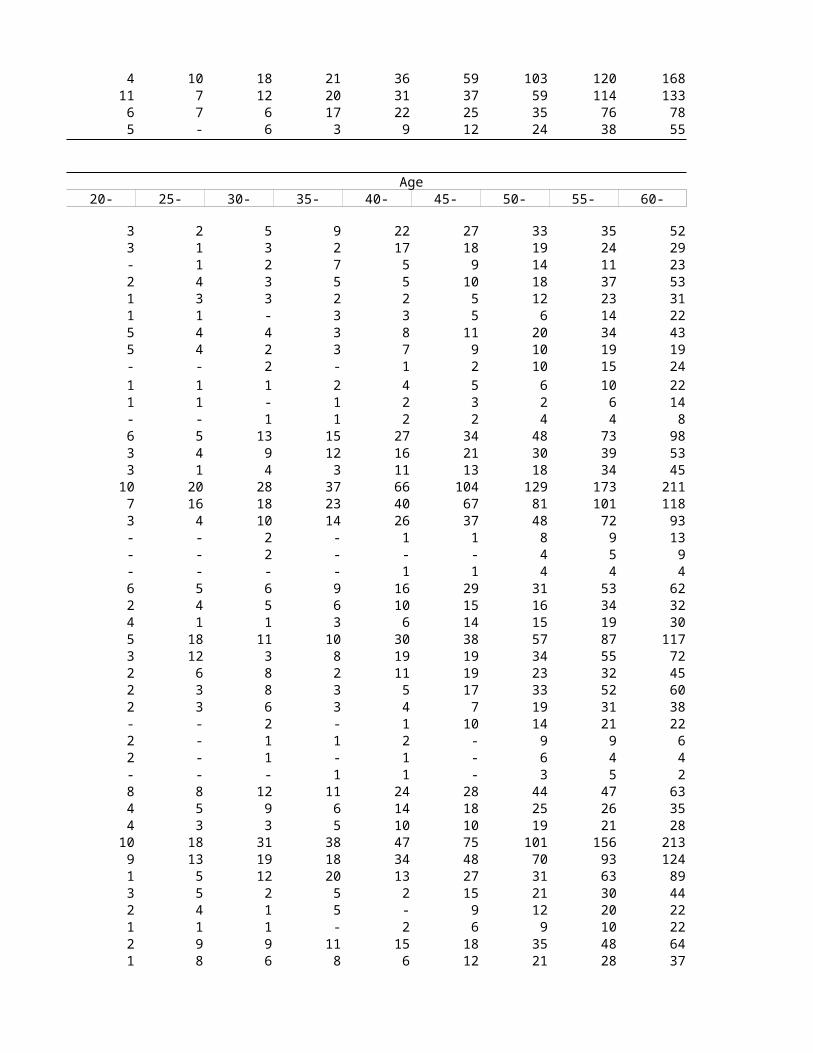
Death rates, by sex and age, Scotland, 1946-50 to 2011-2015Death rates, by sex and age, Scotland, 2001 to 2016Deaths, by sex, age, and administrative area, Scotland, 2016
Page 2
Table 5.03Table 5.04
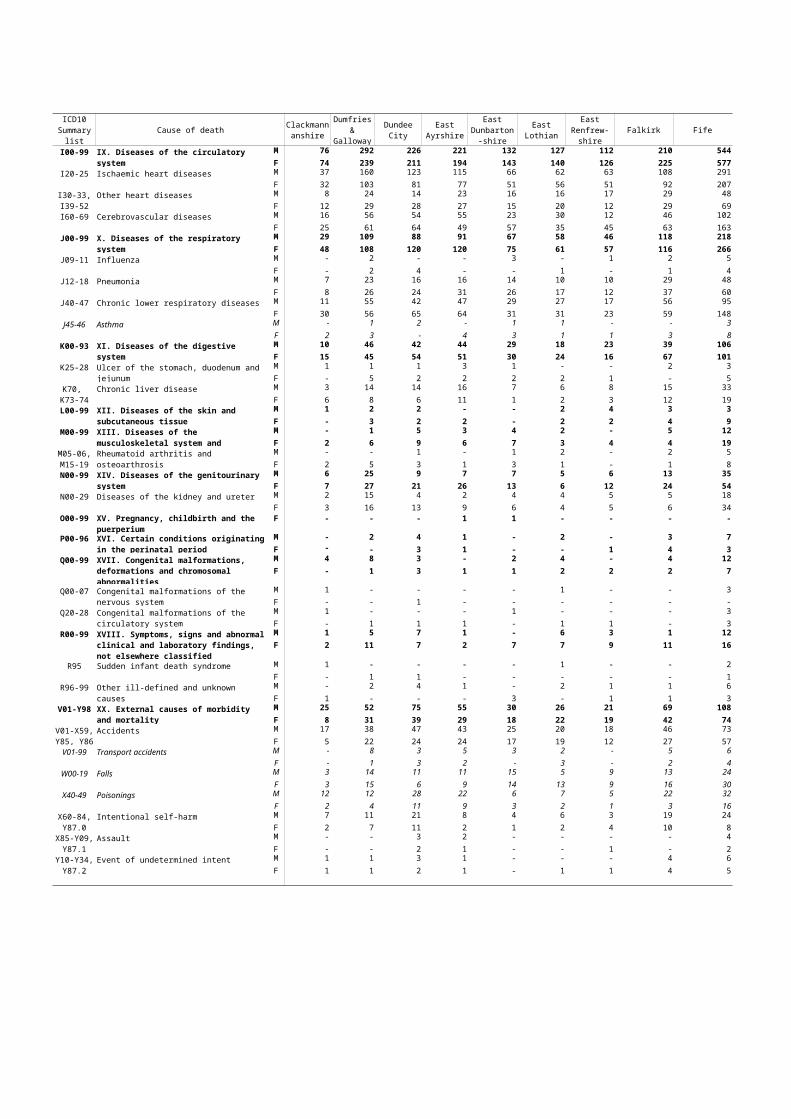
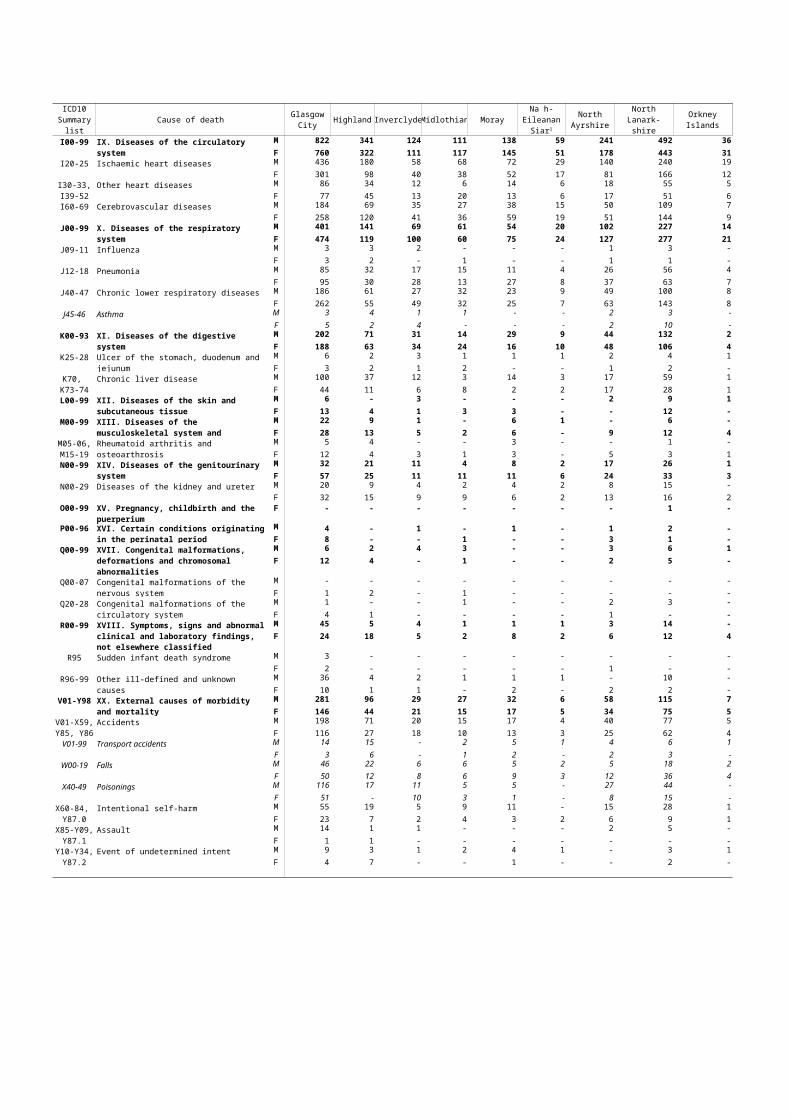
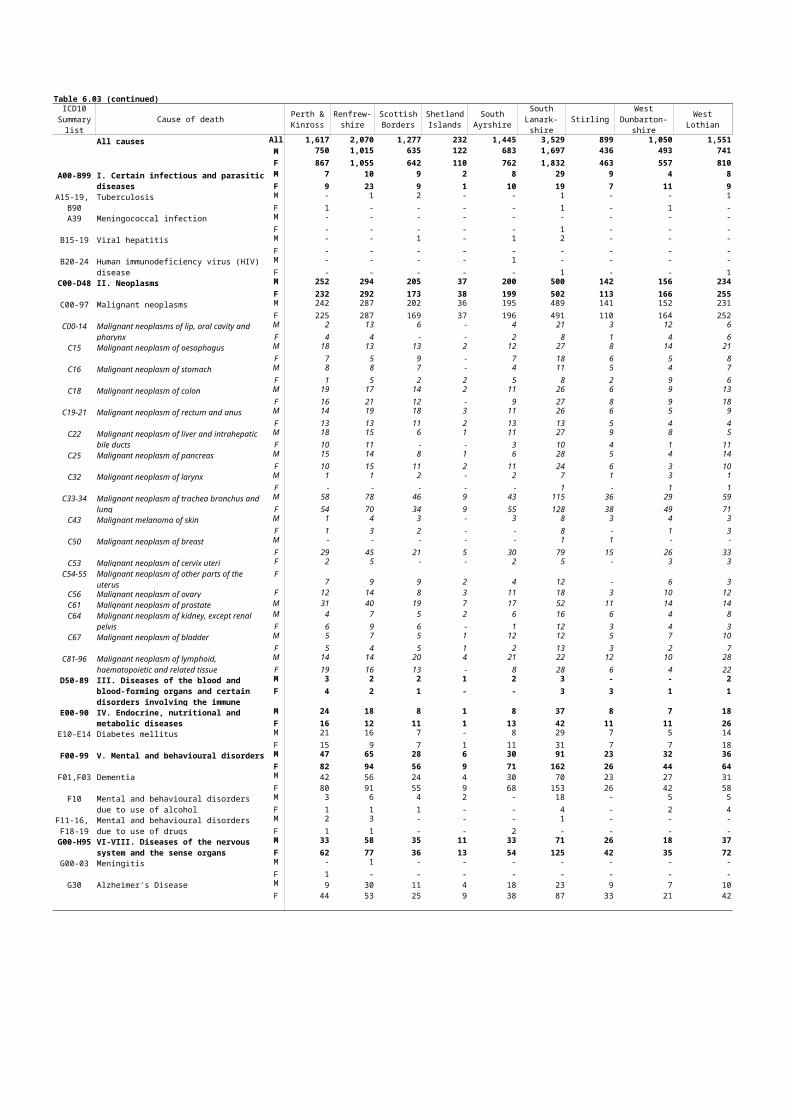
Section 6: Deaths – causes
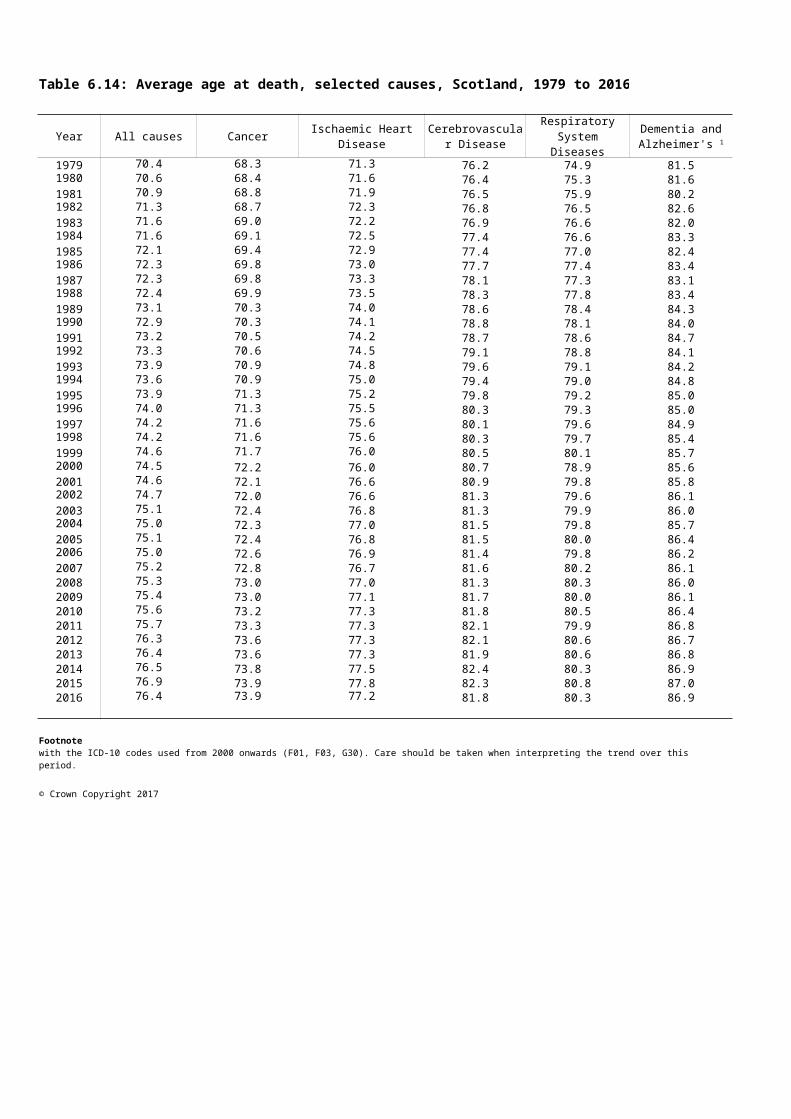
Table 6.1Table 6.2Table 6.3Table 6.4Table 6.5Table 6.6Table 6.7Table 6.8Table 6.9Table 6.10Table 6.11Table 6.12Table 6.13Table 6.14
Section 7: Marriages and Civil Partnerships
Table 7.01(a):Table 7.01(b):Table 7.02:Table 7.03(a):Table 7.03(b):Table 7.04:Table 7.05:Table 7.06:Table 7.07:Table 7.08:Table 7.09:Table 7.10:Table 7.11:
© Crown Copyright 2017
Deaths, by country of birth of deceased, Scotland, 1971 to 2016Deaths, by sex, age, and ethnic group, Scotland, 2016
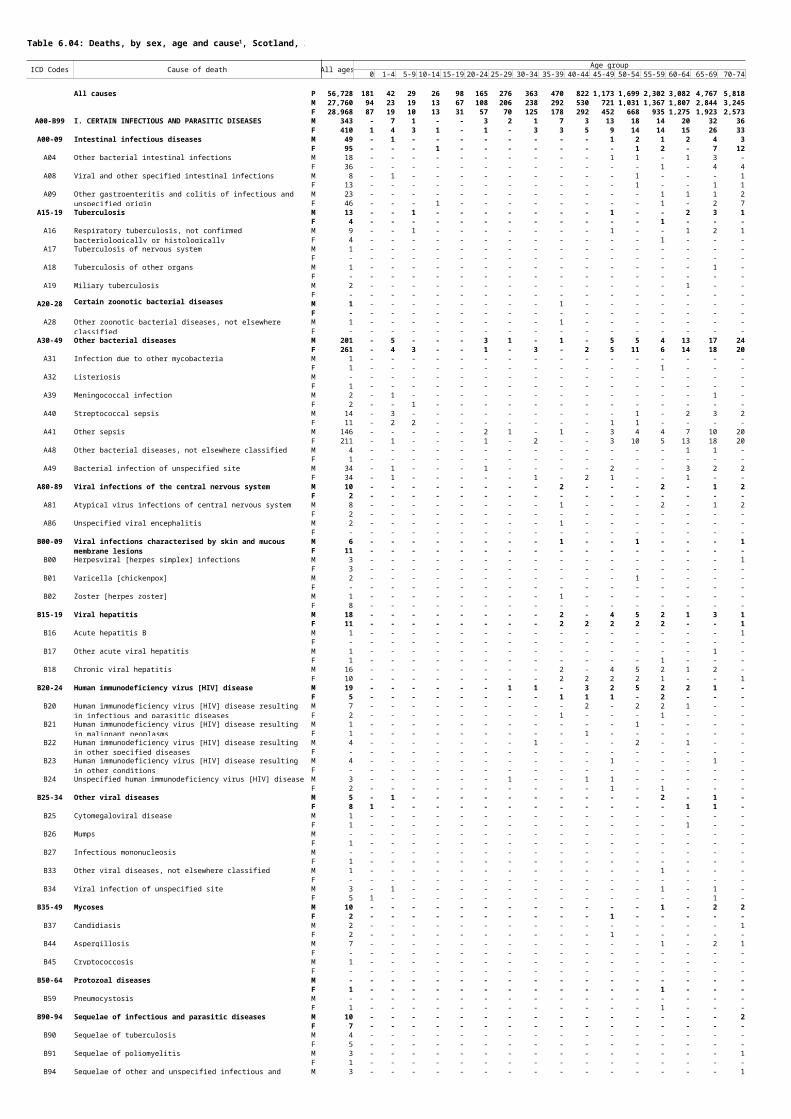
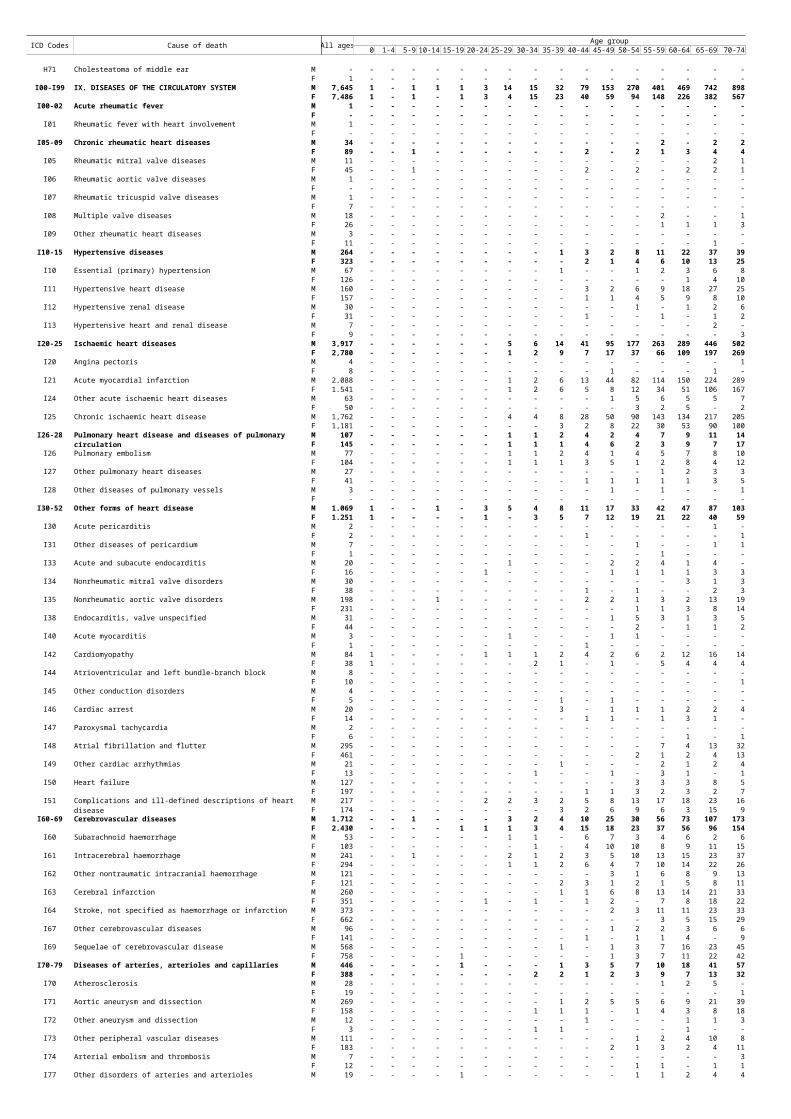
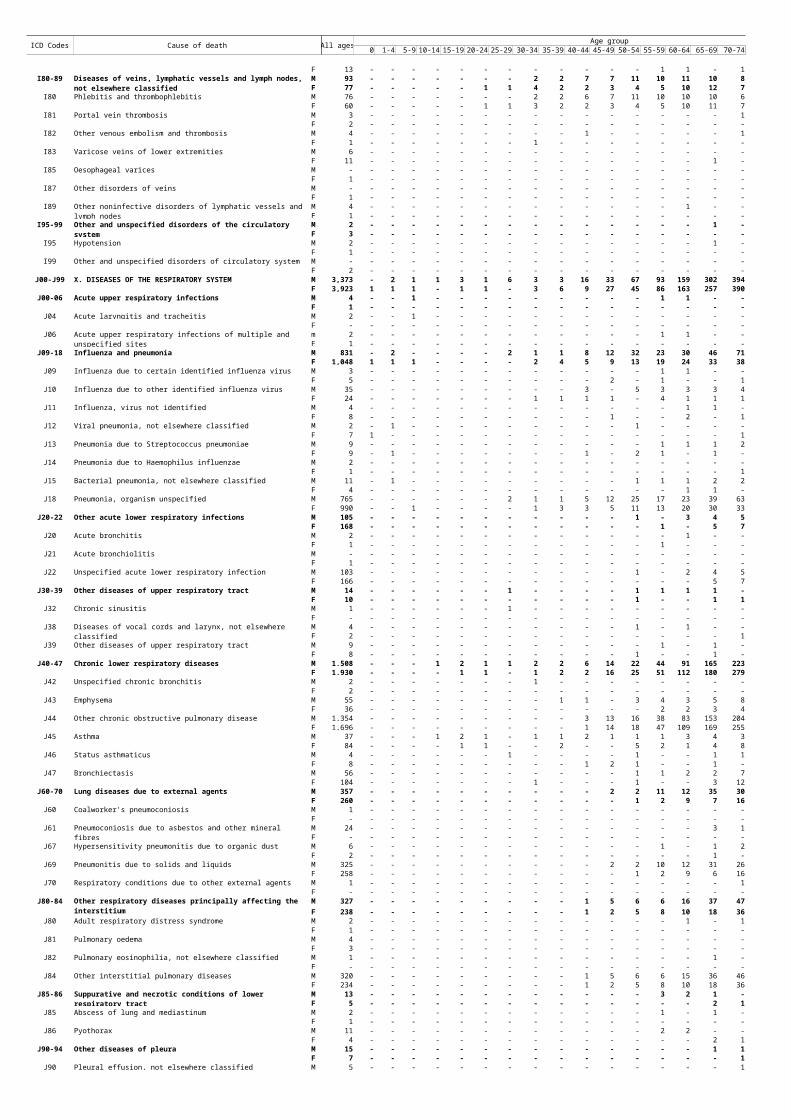
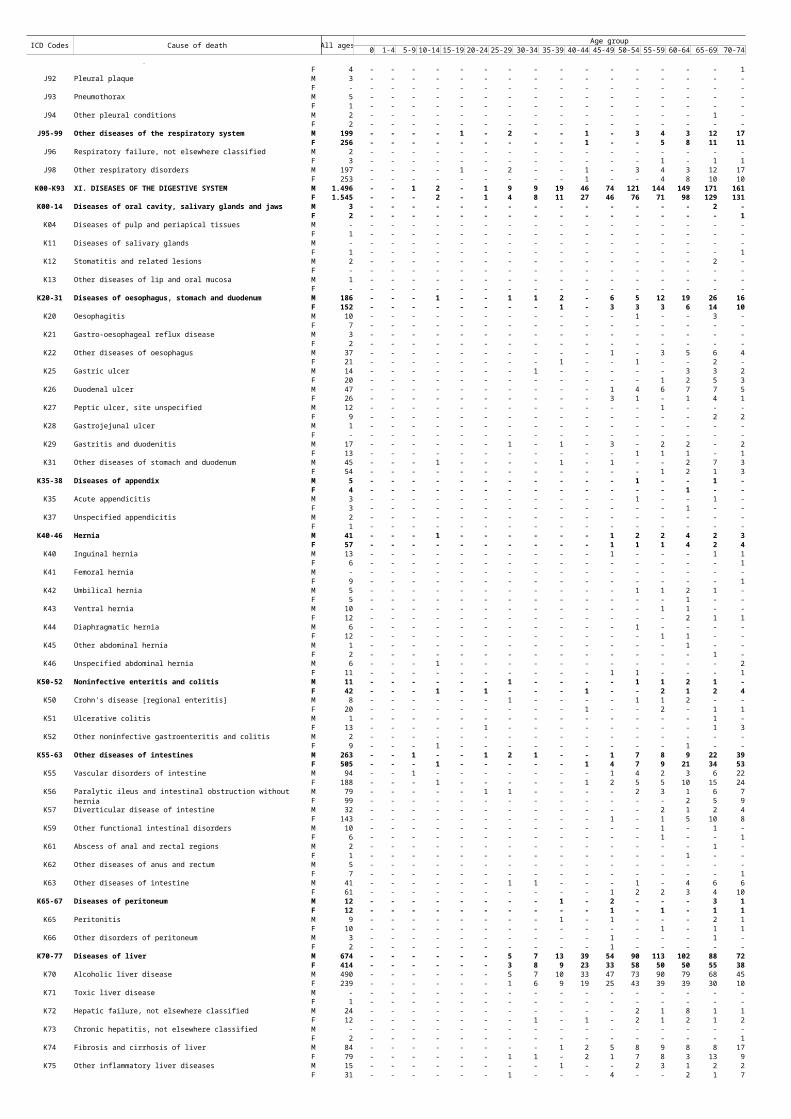
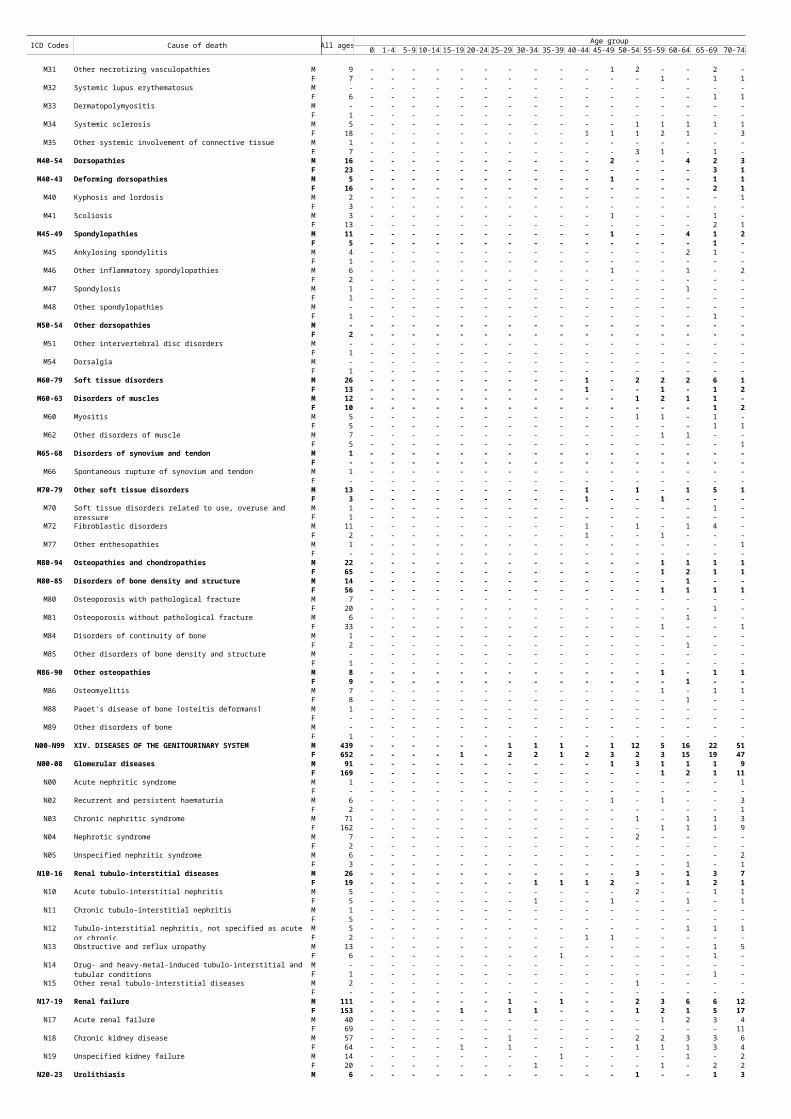
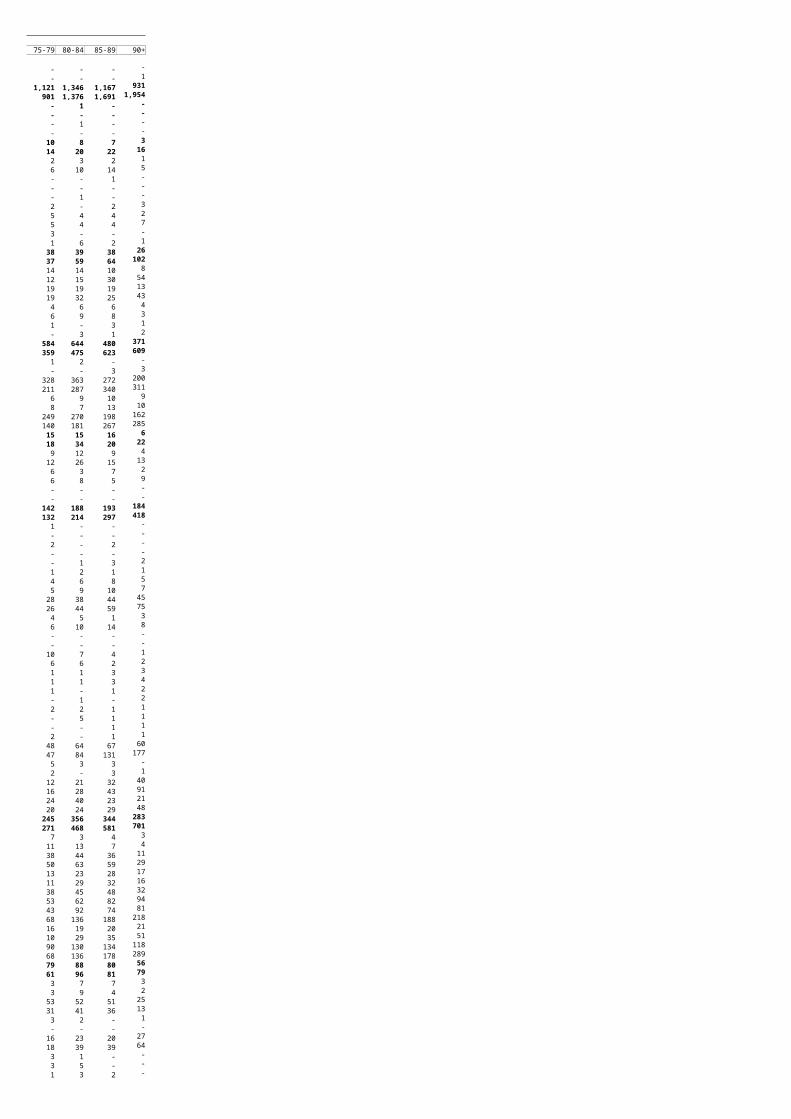
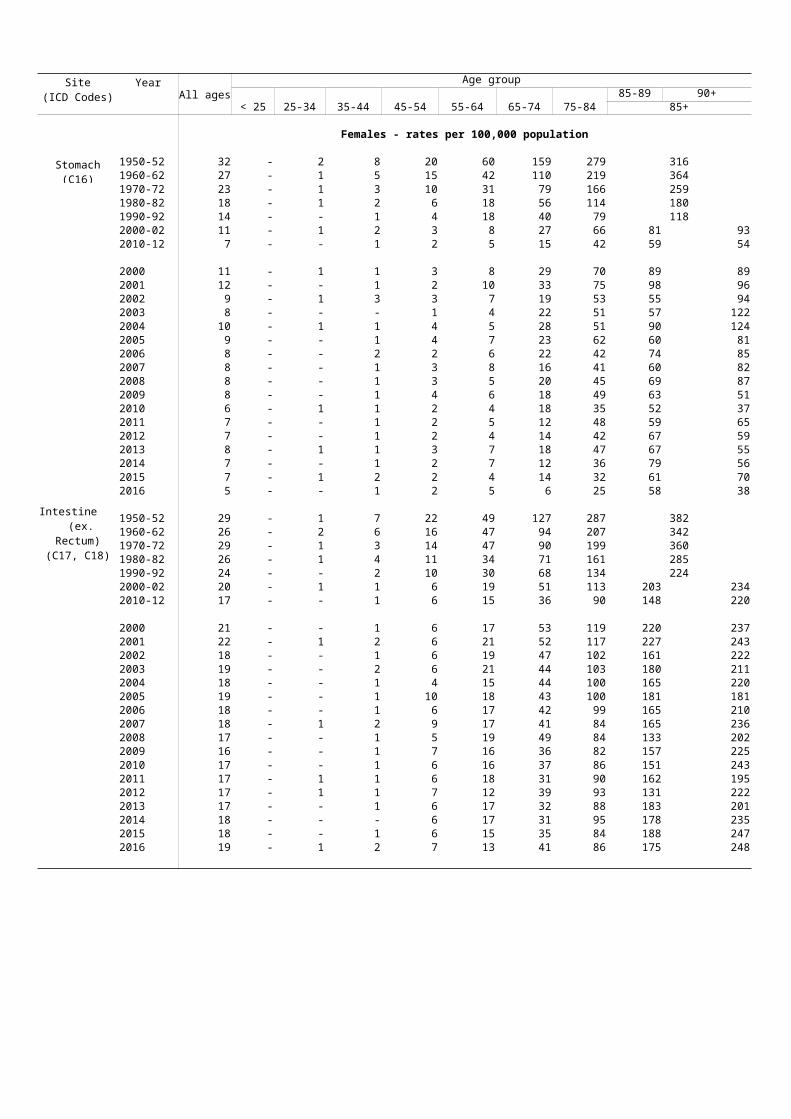
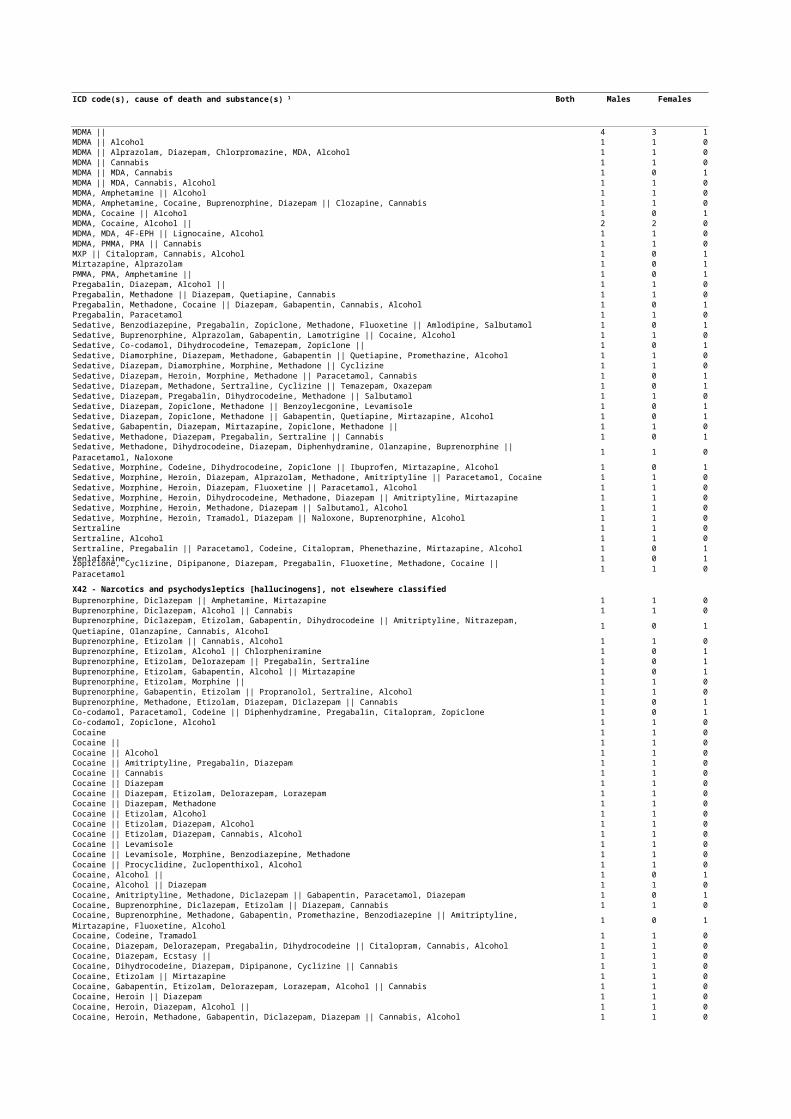
Deaths, by sex and cause, Scotland, 2006 to 2016Deaths, numbers and rates, by sex, age and cause, Scotland, 2016Deaths, by sex, cause and administartive area, Scotland, 2016Deaths, by sex, age and cause, Scotland, 2016Deaths by frequency of cause by sex, numbers and percentages, Scotland, 1986 to 2016Death rates from malignant neoplasms (all sites), by sex and age, Scotland, 1950 to 2016Death rates from malignant neoplasms, by sex, age and selected sites, Scotland, 1950 to 2016Death rates from ischaemic heart disease, by sex and age, Scotland, 1950 to 2016Death rates from cerebrovascular disease, by sex and age, Scotland, 1950 to 2016Deaths from road transport accidents, by sex and age, Scotland, 1946 to 2016Intentional self-harm and events of undetermined intent¹, Scotland, 1981 to 2016Deaths from poisoning, by sex and cause, Scotland, 2016Deaths aged under 90, years of 'working life' lost and years of 'life to age 90' lost due to mortality from selected causes, per 10,000 population, Scotland, 2016Average age at death, selected causes, Scotland, 1979 to 2016
Marriages, by sex and age, Scotland, 1946-50 to 2011-15Marriages, by sex and age, Scotland, 1974 to 2016Same-sex marriages, by sex and marital status, Scotland, 2016Mean age at marriage, by sex and marital status, Scotland, 1855 to 2016Marriages, by sex and marital status, Scotland, 1974 to 2016Marriages, percentages by marital status of persons marrying, Scotland, 1855 to 2016Marriages, religious forms and other beliefs, by selected denomination, 2006 to 2016Marriages, numbers and percentages, by method of celebration, Scotland, 1946 to 2016Marriages, by denomination, Scotland, 2016Marriages, by country of birth, Scotland, 2016Marriages, by country of residence, Scotland, 2016Civil Partnerships, by sex, Scotland, 2005 to 2016Civil Partnerships, sex and age groups in combination of younger partner and older partner, 2016
Page 3
Births, stillbirths, deaths, marriages and civil partnerships, numbers and rates, Scotland, quarterly, 2002 to 2016Estimated population, births, stillbirths, deaths, marriages and civil partnerships, numbers and rates, by administrative area, Scotland, 2016Births, deaths and death rates by administrative area, resident and not resident in Scotland, 2016Standardised mortality ratios (based on Scotland experience) for selected causes, by administrative area, Scotland, 2016International populations and vital statistics rates, selected countries, latest available figures
Live births, numbers and percentages, by age of mother and marital status of parents, Scotland, 1946-50 to 2011-15Live births, numbers and percentages, by age of mother and marital status of parents, Scotland, 2000 to 2016Live births, numbers and percentages, by marital status of parents and type of registration, Scotland, 1974 to 2016Live births outside marriage, numbers and percentages, age of mother and type of registration, Scotland, 1974 to 2016Birth rate, gross and net reproduction rates and general and total fertility rates, Scotland, 1971 to 2016Fertility rates by age of mother and marital status of parents, Scotland, 1971 to 2016Age-specific birth rates, per 1,000 female population, Scotland, 1951 to 2016Cumulative fertility, by (assumed) birth cohort and selected age, Scotland, up to 2016Cumulative fertility, for selected (assumed) birth cohorts, Scotland, up to 2016Cumulative fertility, 1935-1999 (assumed) birth cohorts, Scotland, up to 2016Live births, numbers and fertility rates by marital status of parents, type of registration and administrative area, Scotland, 2016Live births, by country of birth of mother and administrative area, Scotland, 2016Live births, country of birth of mother by country of birth of father, Scotland, 2015Live births, stillbirths and maternities, by sex of child, marital status of parents and age of mother, Scotland, 2015Live birth, stillbirth and maternity rates per 1,000 women, by sex of child and age of mother, Scotland, 2016Live births by country of birth of mother, Scotland, 2004, 2009, 2012 to 2016Live Births, Stillbirths and Maternities, by sex of child, marital status of parents and age of mother, Scotland and administrative
Live births, numbers by age of mother and age of father, and the average ages of mothers and fathers, Scotland, 2016Fertility rates (per 1,000 women) by age group and administrative area Scotland, 2016
Live births, stillbirths, perinatal, neonatal, postneonatal and infant deaths, Scotland, 1946 to 2016Stillbirth,perinatal, neonatal, postneonatal and infant death rates, Scotland, 1946 to 2016
Page 4
Deaths by frequency of cause by sex, numbers and percentages, Scotland, 1986 to 2016Death rates from malignant neoplasms (all sites), by sex and age, Scotland, 1950 to 2016Death rates from malignant neoplasms, by sex, age and selected sites, Scotland, 1950 to 2016
Deaths aged under 90, years of 'working life' lost and years of 'life to age 90' lost due to mortality from selected causes, per 10,000 population, Scotland, 2016
Civil Partnerships, sex and age groups in combination of younger partner and older partner, 2016
Page 5
Table 1.01(a): Population and vital events, Scotland, annual averages 1855-60 to 2011-15
Year
Estimated population ('000s) Live births
Males Females Males FemalesNumber %
1855-60 3,018.4 1,433.3 1,585.1 102,462 34.1 52,655 49,807 1,057 8,953 8.7 1861-65 3,127.1 1,483.2 1,644.0 109,764 35.1 56,336 53,428 1,054 10,742 9.8 1866-70 3,275.6 1,559.6 1,716.0 114,394 34.9 58,676 55,718 1,053 11,270 9.9 1871-75 3,441.4 1,645.6 1,795.8 120,376 35.0 61,964 58,412 1,061 10,941 9.1 1876-80 3,628.7 1,743.5 1,885.2 126,086 34.8 64,648 61,438 1,052 10,711 8.5 1881-85 3,799.2 1,830.9 1,968.3 126,409 33.3 64,805 61,604 1,052 10,453 8.3 1886-90 3,943.9 1,902.3 2,041.6 123,977 31.4 63,674 60,303 1,056 9,973 8.0 1891-95 4,122.5 1,992.7 2,129.8 125,800 30.5 64,558 61,242 1,054 9,326 7.4
1896-1900 4,345.1 2,107.9 2,237.2 130,209 30.0 66,554 63,655 1,046 8,870 6.8 1901-05 4,535.7 2,203.5 2,332.2 132,399 29.2 67,565 64,834 1,042 8,609 6.5 1906-10 4,679.9 2,271.0 2,408.9 128,987 27.6 65,811 63,176 1,042 9,125 7.1 1911-15 4,748.3 2,301.3 2,447.0 120,654 25.4 61,607 59,047 1,043 8,698 7.2 1916-20 4,823.8 2,318.7 2,505.1 109,750 22.8 56,269 53,481 1,052 8,315 7.6 1921-25 4,879.6 2,344.3 2,535.3 112,245 23.0 57,516 54,729 1,051 7,606 6.8 1926-30 4,845.1 2,323.5 2,521.6 96,674 20.0 49,419 47,255 1,046 7,059 7.3 1931-35 4,905.1 2,359.6 2,545.5 89,306 18.2 45,739 43,567 1,050 6,195 6.9 1936-40 4,956.8 2,365.2 2,591.5 87,734 17.6 44,945 42,789 1,050 5,397 6.2 1941-45 4,711.9 2,086.8 2,625.1 91,593 19.4 47,055 44,538 1,056 6,964 7.6 1946-50 5,054.3 2,409.3 2,644.9 101,222 20.0 52,146 49,076 1,063 5,819 5.7 1951-55 5,103.6 2,437.8 2,665.8 91,366 17.9 46,952 44,414 1,057 4,259 4.7 1956-60 5,145.2 2,461.6 2,683.6 98,663 19.2 50,677 47,986 1,056 4,140 4.2 1961-65 5,201.0 2,496.4 2,704.5 102,642 19.7 52,862 49,780 1,062 5,304 5.2 1966-70 5,204.3 2,500.0 2,704.2 93,033 17.9 47,996 45,037 1,066 6,653 7.2 1971-75 5,234.7 2,516.0 2,718.7 75,541 14.4 38,838 36,703 1,058 6,575 8.7 1976-80 5,213.9 2,509.3 2,704.5 65,758 12.6 33,860 31,898 1,061 6,587 10.0 1981-85 5,151.9 2,481.1 2,670.8 66,422 12.9 34,023 32,399 1,050 10,085 15.2 1986-90 5,089.5 2,449.8 2,639.7 65,544 12.9 33,661 31,882 1,056 15,849 24.2 1991-95 5,093.5 2,449.0 2,644.5 63,571 12.5 32,491 31,081 1,045 19,762 31.1
1996-2000 5,077.5 2,439.4 2,638.1 56,856 11.2 29,195 27,660 1,055 22,283 39.2 2001-05 5,078.6 2,443.1 2,635.6 52,914 10.4 27,152 25,762 1,054 23,995 45.3 2006-10 5,200.0 2,513.4 2,686.6 58,270 11.2 29,755 28,515 1,043 28,851 49.5 2011-15 5,332.4 2,588.3 2,744.1 56,891 10.7 29,212 27,678 1,055 29,106 51.1
Footnotes
2) Refer to Notes and Definitions for change in definition of stillbirth that took place in 1992.
3) Rate per 1,000 population.4) Rate per 1,000 live and stillbirths.5) Rate per 1,000 live births.
6) The Civil Partnership Act 2004 came into force in the UK on 5 December 2005, so annual averages for 2001-05 would be meaningless.7) Same sex marriages came into effect on 16 December 2014, so annual averages for 2011-15 would be meaningless.
© Crown Copyright 2017
Both sexes
Both sexes Rate3
Males per 1,000
females
To unmarried parents
1) Live births only, prior to 1939. Multiple births figures for twins and triplets etc are the numbers of multiple birth events rather than the number of babies who were live born and/or stillborn. Refer to the more detailed footnote on this matter in Table 1.01(b).
Page 6
Table 1.01(a): Population and vital events, Scotland, annual averages 1855-60 to 2011-15
Year
Infant deaths Deaths
Twins Number NumberBoth sexes Males Females
Number Number Number1855-60 1,282 16 1.26 - - 12,250 119.6 62,644 20.8 31,139 21.7 31,505 19.8 1861-65 1,298 13 1.21 - - 13,166 119.9 69,265 22.1 34,380 23.2 34,885 21.2 1866-70 1,393 13 1.24 - - 13,971 122.1 71,974 22.0 35,823 23.0 36,151 21.1 1871-75 1,416 13 1.20 - - 15,314 127.2 77,988 22.7 38,961 23.7 39,027 21.7 1876-80 1,430 14 1.16 - - 14,921 118.3 74,801 20.6 37,463 21.5 37,338 19.8 1881-85 1,417 14 1.15 - - 14,864 117.6 74,396 19.6 37,041 20.2 37,355 19.0 1886-90 1,378 13 1.13 - - 14,943 120.5 74,320 18.8 36,729 19.3 37,591 18.4 1891-95 1,420 13 1.15 - - 15,895 126.4 78,350 19.0 38,797 19.5 39,553 18.6
1896-1900 1,465 16 1.15 - - 16,857 129.5 78,021 17.9 39,070 18.5 38,951 17.4 1901-05 1,599 17 1.24 - - 15,881 119.9 77,313 17.1 38,716 17.6 38,597 16.6 1906-10 1,609 14 1.27 - - 14,501 112.4 75,534 16.1 37,596 16.6 37,938 15.8 1911-15 1,538 15 1.30 - - 13,604 112.8 74,466 15.7 37,253 16.2 37,213 15.2 1916-20 1,491 10 1.39 - - 10,869 99.0 72,365 15.0 36,455 15.7 35,910 14.3 1921-25 1,459 10 1.33 - - 10,299 91.8 67,652 13.9 33,843 14.4 33,809 13.3 1926-30 1,228 11 1.30 - - 8,260 85.4 66,017 13.6 33,106 14.3 32,911 13.1 1931-35 1,076 12 1.23 - - 7,212 80.8 64,839 13.2 32,498 13.8 32,341 12.7 1936-40 1,118 8 1.28 - - 6,650 75.8 67,166 13.5 34,259 14.4 32,907 12.7 1941-45 1,263 15 1.36 3,393 35.7 6,202 67.7 66,302 13.8 34,230 15.7 32,072 12.2 1946-50 1,413 17 1.39 3,047 29.2 4,789 47.3 63,854 12.6 32,281 13.4 31,573 11.9 1951-55 1,272 12 1.39 2,390 25.5 3,009 32.9 61,838 12.1 31,533 12.9 30,305 11.4 1956-60 1,291 11 1.31 2,307 22.9 2,755 27.9 61,965 12.0 31,835 12.9 30,130 11.2 1961-65 1,219 12 1.19 2,000 19.1 2,568 25.0 63,309 12.2 32,786 13.1 30,523 11.3 1966-70 983 10 1.06 1,415 15.0 1,970 21.2 62,797 12.1 32,069 12.8 30,728 11.4 1971-75 751 6 0.99 939 12.3 1,421 18.8 63,808 12.2 32,529 12.9 31,279 11.5 1976-80 614 6 0.94 529 8.0 900 13.7 64,343 12.3 32,250 12.9 32,094 11.9
1981-85 647 7 0.99 389 5.8 695 10.5 63,723 12.4 31,315 12.6 32,408 12.1 1986-90 711 12 1.11 350 5.3 550 8.4 62,796 12.3 30,466 12.4 32,330 12.2 1991-95 778 20 1.26 382 6.0 418 6.6 61,171 12.0 29,271 12.0 31,900 12.1
1996-2000 775 20 1.41 327 5.7 316 5.6 59,478 11.7 28,352 11.6 31,126 11.8 2001-05 786 10 1.52 297 5.6 275 5.2 57,178 11.3 27,239 11.1 29,939 11.4 2006-10 907 11 1.59 311 5.3 245 4.2 54,920 10.6 26,288 10.5 28,632 10.7 2011-15 841 11 1.51 249 4.4 205 3.6 55,023 10.3 26,489 10.2 28,534 10.4
6) The Civil Partnership Act 2004 came into force in the UK on 5 December 2005, so annual averages for 2001-05 would be meaningless.
Back to contents
Multiple births1 Stillbirths2
Trip-lets etc.
% of mater-nities
Rate4 Rate5
Rate3 Rate3 Rate3
Page 7
Year YearTotal Opposite sex Same sexMale Female
Number Number Number1855-60 20,645 6.8 ... ... ... ... ... ... 1855-601861-65 22,013 7.0 ... ... ... ... ... ... 1861-651866-70 22,832 7.0 ... ... ... ... ... ... 1866-701871-75 25,754 7.5 ... ... ... ... ... ... 1871-751876-80 24,956 6.9 ... ... ... ... ... ... 1876-801881-85 26,176 6.9 ... ... ... ... ... ... 1881-851886-90 25,702 6.5 ... ... ... ... ... ... 1886-901891-95 27,962 6.8 ... ... ... ... ... ... 1891-95
1896-1900 31,771 7.3 ... ... ... ... ... ... 1896-19001901-05 31,838 7.0 ... ... ... ... ... ... 1901-051906-10 31,811 6.8 ... ... ... ... ... ... 1906-101911-15 33,857 7.1 ... ... ... ... ... ... 1911-151916-20 37,437 7.8 ... ... ... ... ... ... 1916-201921-25 34,720 7.1 ... ... ... ... ... ... 1921-251926-30 32,605 6.7 ... ... ... ... ... ... 1926-301931-35 34,986 7.1 ... ... ... ... ... ... 1931-351936-40 42,941 8.6 ... ... ... ... ... ... 1936-401941-45 43,772 8.5 ... ... ... ... ... ... 1941-451946-50 43,206 8.5 ... ... ... ... ... ... 1946-501951-55 41,718 8.2 ... ... ... ... ... ... 1951-551956-60 41,671 8.1 ... ... ... ... ... ... 1956-601961-65 40,235 7.7 ... ... ... ... ... ... 1961-651966-70 42,832 8.2 ... ... ... ... ... ... 1966-701971-75 41,404 7.9 ... ... ... ... ... ... 1971-751976-80 37,801 7.3 ... ... ... ... ... ... 1976-801981-85 35,756 6.9 ... ... ... ... ... ... 1981-851986-90 35,440 7.0 ... ... ... ... ... ... 1986-901991-95 32,866 6.5 ... ... ... ... ... ... 1991-95
1996-2000 29,965 5.9 ... ... ... ... ... ... 1996-2000 2001-05 30,648 6.0 ... ... ... ... ... ... 2001-052006-10 28,934 5.6 ... ... ... ... 316 329 2006-102011-15 29,195 5.5 ... ... ... ... 186 246 2011-15
Marriages 7 Civil Partnerships 6
Rate3 Rate3 Rate3
Page 8
Table 1.01(b): Population and vital events, Scotland, 1971 to 2016
Year
Estimated population ('000s) Live births
Males Females Males FemalesNumber %
1971 5,235.6 2,515.7 2,719.9 86,728 16.6 44,467 42,261 1,052 7,029 8.1 1972 5,230.6 2,513.3 2,717.3 78,550 15.0 40,280 38,270 1,053 6,661 8.5 1973 5,233.9 2,515.4 2,718.5 74,392 14.2 38,601 35,791 1,079 6,520 8.8 1974 5,240.8 2,519.3 2,721.5 70,093 13.4 35,824 34,269 1,045 6,349 9.1 1975 5,232.4 2,516.3 2,716.1 67,943 13.0 35,017 32,926 1,064 6,314 9.3 1976 5,233.4 2,517.3 2,716.1 64,895 12.4 33,501 31,394 1,067 6,025 9.3 1977 5,226.2 2,514.8 2,711.4 62,342 11.9 31,993 30,349 1,054 5,968 9.6 1978 5,212.3 2,508.7 2,703.6 64,295 12.3 33,059 31,236 1,058 6,304 9.8 1979 5,203.6 2,505.0 2,698.6 68,366 13.1 35,351 33,015 1,071 6,960 10.2 1980 5,193.9 2,500.9 2,693.0 68,892 13.3 35,395 33,497 1,057 7,678 11.1 1981 5,180.2 2,494.9 2,685.3 69,054 13.3 35,283 33,771 1,045 8,447 12.2 1982 5,164.5 2,487.3 2,677.2 66,196 12.8 33,911 32,285 1,050 9,395 14.2 1983 5,148.1 2,479.1 2,669.0 65,078 12.6 33,656 31,422 1,071 9,581 14.7 1984 5,138.9 2,474.6 2,664.3 65,106 12.7 33,144 31,962 1,037 10,640 16.3 1985 5,127.9 2,469.5 2,658.4 66,676 13.0 34,120 32,556 1,048 12,362 18.5 1986 5,111.8 2,462.3 2,649.4 65,812 12.9 33,874 31,938 1,061 13,547 20.6 1987 5,099.0 2,455.4 2,643.6 66,241 13.0 33,970 32,271 1,053 15,125 22.8 1988 5,077.4 2,444.3 2,633.1 66,212 13.0 34,060 32,152 1,059 16,224 24.5 1989 5,078.2 2,443.2 2,635.0 63,480 12.5 32,504 30,976 1,049 16,476 26.0 1990 5,081.3 2,443.9 2,637.4 65,973 13.0 33,898 32,075 1,057 17,873 27.1 1991 5,083.3 2,444.5 2,638.8 67,024 13.2 34,419 32,605 1,056 19,517 29.1 1992 5,085.6 2,445.3 2,640.3 65,789 12.9 33,610 32,179 1,044 19,950 30.3 1993 5,092.5 2,448.4 2,644.0 63,337 12.4 32,374 30,963 1,046 19,855 31.3 1994 5,102.2 2,453.3 2,648.9 61,656 12.1 31,399 30,257 1,038 19,224 31.2 1995 5,103.7 2,453.4 2,650.3 60,051 11.8 30,652 29,399 1,043 20,266 33.7 1996 5,092.2 2,447.0 2,645.2 59,296 11.6 30,523 28,773 1,061 21,360 36.0 1997 5,083.3 2,442.3 2,641.0 59,440 11.7 30,516 28,924 1,055 22,388 37.7 1998 5,077.1 2,439.0 2,638.1 57,319 11.3 29,496 27,823 1,060 22,319 38.9 1999 5,072.0 2,436.5 2,635.4 55,147 10.9 28,246 26,901 1,050 22,722 41.2 2000 5,062.9 2,431.9 2,631.0 53,076 10.5 27,196 25,880 1,051 22,625 42.6 2001 5,064.2 2,433.7 2,630.5 52,527 10.4 26,786 25,741 1,041 22,760 43.3 2002 5,066.0 2,435.6 2,630.4 51,270 10.1 26,218 25,052 1,047 22,534 44.0 2003 5,068.5 2,438.1 2,630.4 52,432 10.3 26,906 25,526 1,054 23,864 45.5 2004 5,084.3 2,446.6 2,637.7 53,957 10.6 27,769 26,188 1,060 25,202 46.7 2005 5,110.2 2,461.3 2,648.9 54,386 10.6 28,083 26,303 1,068 25,617 47.1 2006 5,133.1 2,475.1 2,658.0 55,690 10.8 28,473 27,217 1,046 26,584 47.7 2007 5,170.0 2,496.6 2,673.4 57,781 11.2 29,694 28,087 1,057 28,377 49.1 2008 5,202.9 2,515.3 2,687.6 60,041 11.5 30,570 29,471 1,037 30,055 50.1 2009 5,231.9 2,532.0 2,699.9 59,046 11.3 30,165 28,881 1,044 29,710 50.3 2010 5,262.2 2,548.2 2,714.0 58,791 11.2 29,872 28,919 1,033 29,528 50.2 2011 5,299.9 2,570.3 2,729.6 58,590 11.1 30,111 28,479 1,057 29,888 51.0 2012 5,313.6 2,577.3 2,736.3 58,027 10.9 29,713 28,314 1,049 29,795 51.3 2013 5,327.7 2,586.7 2,741.0 56,014 10.5 28,828 27,186 1,060 28,816 51.4 2014 5,347.6 2,596.5 2,751.1 56,725 10.6 29,056 27,669 1,050 28,821 50.8 2015 5,373.0 2,610.5 2,762.5 55,098 10.3 28,354 26,744 1,060 28,210 51.2 2016 5,404.7 2,627.5 2,777.2 54,488 10.1 28,236 26,252 1,076 27,727 50.9
Footnotes
2) Refer to Notes and Definitions for change in definition of stillbirth that took place in 1992.3) Rate per 1,000 population.4) Rate per 1,000 live and stillbirths.
5) Rate per 1,000 live births.6) Same sex marriages came into effect on 16 December 2014.
© Crown Copyright 2017
Both sexes
Both sexes Rate3
Males per 1,000
females
To unmarried parents
1) Multiple births figures for twins and triplets etc are the numbers of multiple birth events rather than the number of babies born. A multiple birth may involve both live births and stillbirths. For example, a 'twin' birth could involve two live births, one live birth and one stillbirth, or two stillbirths. The separate figures for 'Live births' and 'Stillbirths' count the numbers of babies who were born alive and who were stillborn, respectively. For example, a 'triplet' birth in which two babies were born alive and one was stillborn would be counted as two under 'Live births' and one under 'Stillbirths'.
Page 9
Year
Infant deaths Deaths
Twins Number NumberBoth sexes Males Females
Number Number Number
1971 903 4 1.04 1,155 13.1 1,722 19.9 61,614 11.8 31,585 12.6 30,029 11.0 1972 801 9 1.03 1,053 13.2 1,477 18.8 65,017 12.4 33,215 13.2 31,802 11.7 1973 747 9 1.08 873 11.6 1,412 19.0 64,545 12.3 32,954 13.1 31,591 11.6 1974 677 5 0.98 850 12.0 1,326 18.9 64,740 12.4 32,722 13.0 32,018 11.8 1975 625 3 0.92 765 11.1 1,168 17.2 63,125 12.1 32,168 12.8 30,957 11.4 1976 595 8 0.93 629 9.6 959 14.8 65,253 12.5 32,983 13.1 32,270 11.9 1977 589 3 1.00 553 8.8 1,004 16.1 62,294 11.9 31,280 12.4 31,014 11.4 1978 589 7 0.93 524 8.1 830 12.9 65,123 12.5 32,432 12.9 32,691 12.1 1979 638 7 0.95 475 6.9 878 12.8 65,747 12.6 32,884 13.1 32,863 12.2 1980 658 4 1.02 463 6.7 831 12.1 63,299 12.2 31,669 12.7 31,630 11.7 1981 611 7 0.90 436 6.3 780 11.3 63,828 12.3 31,700 12.7 32,128 12.0 1982 603 7 0.92 386 5.8 753 11.4 65,022 12.6 31,801 12.8 33,221 12.4 1983 676 3 1.05 379 5.8 646 9.9 63,454 12.3 31,196 12.6 32,258 12.1 1984 665 10 1.04 379 5.8 672 10.3 62,345 12.1 30,731 12.4 31,614 11.9 1985 682 9 1.04 366 5.5 624 9.4 63,967 12.5 31,147 12.6 32,820 12.3 1986 721 10 1.12 385 5.8 581 8.8 63,467 12.4 31,111 12.6 32,356 12.2 1987 721 10 1.11 339 5.1 563 8.5 62,014 12.2 30,384 12.4 31,630 12.0 1988 706 10 1.09 357 5.4 543 8.2 61,957 12.2 30,195 12.4 31,762 12.1 1989 677 15 1.10 319 5.0 554 8.7 65,017 12.8 31,025 12.7 33,992 12.9 1990 731 17 1.14 349 5.3 510 7.7 61,527 12.1 29,617 12.1 31,910 12.1 1991 709 26 1.10 369 5.5 473 7.1 61,041 12.0 29,312 12.0 31,729 12.0 1992 808 15 1.26 356 5.4 449 6.8 60,937 12.0 29,334 12.0 31,603 12.0 1993 780 10 1.26 409 6.4 412 6.5 64,049 12.6 30,504 12.5 33,545 12.7 1994 778 17 1.30 381 6.1 382 6.2 59,328 11.6 28,416 11.6 30,912 11.7 1995 816 30 1.42 397 6.6 375 6.2 60,500 11.9 28,791 11.7 31,709 12.0 1996 800 29 1.41 381 6.4 365 6.2 60,654 11.9 29,209 11.9 31,445 11.9 1997 791 21 1.38 319 5.3 316 5.3 59,494 11.7 28,305 11.6 31,189 11.8 1998 810 20 1.46 351 6.1 320 5.6 59,164 11.7 28,132 11.5 31,032 11.8 1999 738 12 1.37 286 5.2 276 5.0 60,281 11.9 28,605 11.7 31,676 12.0 2000 737 19 1.44 298 5.6 305 5.7 57,799 11.4 27,511 11.3 30,288 11.5 2001 776 16 1.52 301 5.7 290 5.5 57,382 11.3 27,324 11.2 30,058 11.4 2002 742 10 1.48 278 5.4 270 5.3 58,103 11.5 27,743 11.4 30,360 11.5 2003 810 8 1.58 296 5.6 265 5.1 58,472 11.5 27,832 11.4 30,640 11.6 2004 757 8 1.43 317 5.8 266 4.9 56,187 11.1 26,775 10.9 29,412 11.2 2005 843 8 1.58 292 5.3 284 5.2 55,747 10.9 26,522 10.8 29,225 11.0 2006 858 10 1.58 296 5.3 248 4.5 55,093 10.7 26,251 10.6 28,842 10.9 2007 882 11 1.56 327 5.6 272 4.7 55,986 10.8 26,895 10.8 29,091 10.9 2008 953 9 1.62 325 5.4 253 4.2 55,700 10.7 26,504 10.5 29,196 10.9 2009 922 15 1.60 317 5.3 235 4.0 53,856 10.3 25,828 10.2 28,028 10.4 2010 919 12 1.60 291 4.9 218 3.7 53,967 10.3 25,963 10.2 28,004 10.3 2011 852 10 1.49 299 5.1 238 4.1 53,661 10.1 25,913 10.1 27,748 10.2 2012 866 8 1.52 274 4.7 217 3.7 54,937 10.3 26,015 10.1 28,922 10.6 2013 822 12 1.50 234 4.2 186 3.3 54,700 10.3 26,325 10.2 28,375 10.4 2014 863 11 1.56 228 4.0 207 3.6 54,239 10.1 26,289 10.1 27,950 10.2 2015 803 16 1.50 211 3.8 175 3.2 57,579 10.7 27,905 10.7 29,674 10.7 2016 804 11 1.51 236 4.3 181 3.3 56,728 10.5 27,760 10.6 28,968 10.4
Back to contents
Multiple births1
(live births and/or stillbirths)
Stillbirths2
Triplets etc
% of mater-nities
Rate4 Rate5
Rate3 Rate3 Rate3
Page 10
Year
Civil Partnerships
Total Opposite sex Same sexMale FemaleNumber Number Number
1971 42,500 8.1 42,500 8.1 ... ... ... ...1972 42,139 8.1 42,139 8.1 ... ... ... ...1973 42,018 8.0 42,018 8.0 ... ... ... ...1974 41,174 7.9 41,174 7.9 ... ... ... ...1975 39,191 7.5 39,191 7.5 ... ... ... ...1976 37,543 7.2 37,543 7.2 ... ... ... ...1977 37,288 7.1 37,288 7.1 ... ... ... ...1978 37,814 7.3 37,814 7.3 ... ... ... ...1979 37,860 7.3 37,860 7.3 ... ... ... ...1980 38,501 7.4 38,501 7.4 ... ... ... ...1981 36,237 7.0 36,237 7.0 ... ... ... ...1982 34,942 6.8 34,942 6.8 ... ... ... ...1983 34,962 6.8 34,962 6.8 ... ... ... ...1984 36,253 7.1 36,253 7.1 ... ... ... ...1985 36,385 7.1 36,385 7.1 ... ... ... ...1986 35,790 7.0 35,790 7.0 ... ... ... ...1987 35,813 7.0 35,813 7.0 ... ... ... ...1988 35,599 7.0 35,599 7.0 ... ... ... ...1989 35,326 7.0 35,326 7.0 ... ... ... ...1990 34,672 6.8 34,672 6.8 ... ... ... ...1991 33,762 6.6 33,762 6.6 ... ... ... ...1992 35,057 6.9 35,057 6.9 ... ... ... ...1993 33,366 6.6 33,366 6.6 ... ... ... ...1994 31,480 6.2 31,480 6.2 ... ... ... ...1995 30,663 6.0 30,663 6.0 ... ... ... ...1996 30,241 5.9 30,241 5.9 ... ... ... ...1997 29,611 5.8 29,611 5.8 ... ... ... ...1998 29,668 5.8 29,668 5.8 ... ... ... ...1999 29,940 5.9 29,940 5.9 ... ... ... ...2000 30,367 6.0 30,367 6.0 ... ... ... ...2001 29,621 5.8 29,621 5.8 ... ... ... ...2002 29,826 5.9 29,826 5.9 ... ... ... ...2003 30,757 6.1 30,757 6.1 ... ... ... ...2004 32,154 6.3 32,154 6.3 ... ... ... ...2005 30,881 6.0 30,881 6.0 ... ... 53 312006 29,898 5.8 29,898 5.8 ... ... 578 4692007 29,866 5.8 29,866 5.8 ... ... 340 3482008 28,903 5.6 28,903 5.6 ... ... 245 2802009 27,524 5.3 27,524 5.3 ... ... 219 2792010 28,480 5.4 28,480 5.4 ... ... 197 2682011 29,135 5.5 29,135 5.5 ... ... 229 3252012 30,534 5.7 30,534 5.7 ... ... 257 3172013 27,547 5.2 27,547 5.2 ... ... 217 3132014 29,069 5.4 28,702 5.4 367 0.0 193 2432015 29,691 5.5 28,020 5.2 1,671 0.3 33 312016 29,229 5.4 28,231 5.2 998 0.2 42 28
Marriages6
Rate3 Rate3 Rate3
Page 11
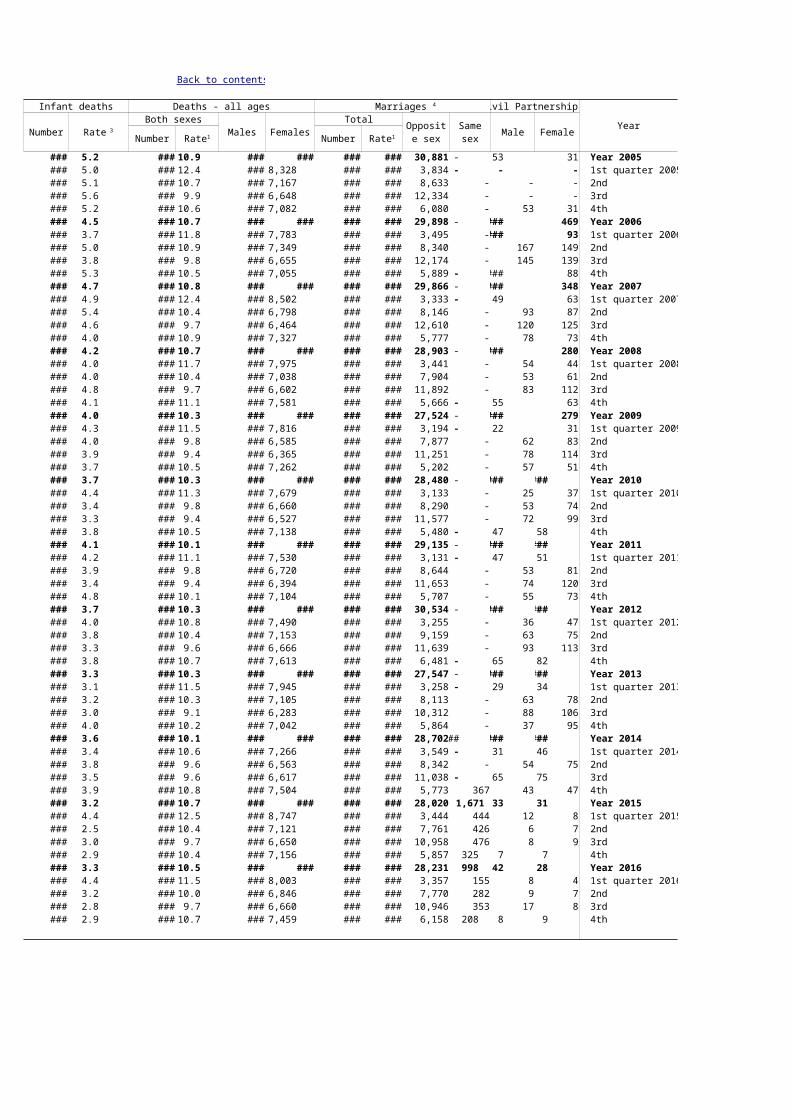
Table 1.02: Births, stillbirths, deaths, marriages and civil partnerships, numbers and rates, Scotland, quarterly, 2005 to 2016
Year
Live births Stillbirths Perinatal deaths Neonatal deathsBoth sexes
Males Females To unmarried parents
Number Number NumberNumber Number
Year 2005 54,386 10.6 28,083 26,303 1,068 25,617 47.1 292 5.3 423 7.7 190 3.5 1st quarter 2005 13,356 10.6 6,852 6,504 1,054 6,191 46.4 65 4.8 94 7.0 44 3.3 2nd 13,557 10.6 7,075 6,482 1,091 6,405 47.2 88 6.4 125 9.2 46 3.4 3rd 14,226 11.0 7,319 6,907 1,060 6,697 47.1 77 5.4 109 7.6 55 3.9 4th 13,247 10.3 6,837 6,410 1,067 6,324 47.7 62 4.7 95 7.1 45 3.4
Year 2006 55,690 10.8 28,473 27,217 1,046 26,584 47.7 296 5.3 415 7.4 172 3.1 1st quarter 2006 13,568 10.7 6,844 6,724 1,018 6,608 48.7 71 5.2 92 6.7 33 2.4 2nd 14,039 11.0 7,218 6,821 1,058 6,666 47.5 55 3.9 90 6.4 46 3.3 3rd 14,181 11.0 7,256 6,925 1,048 6,672 47.0 87 6.1 111 7.8 41 2.9 4th 13,902 10.7 7,155 6,747 1,060 6,638 47.7 83 5.9 122 8.7 52 3.7
Year 2007 57,781 11.2 29,694 28,087 1,057 28,377 49.1 327 5.6 456 7.8 188 3.3 1st quarter 2007 14,209 11.1 7,342 6,867 1,069 7,115 50.1 88 6.2 116 8.1 51 3.6 2nd 14,270 11.1 7,311 6,959 1,051 6,884 48.2 89 6.2 124 8.6 49 3.4 3rd 14,929 11.5 7,675 7,254 1,058 7,236 48.5 73 4.9 106 7.1 45 3.0 4th 14,373 11.0 7,366 7,007 1,051 7,142 49.7 77 5.3 110 7.6 43 3.0
Year 2008 60,041 11.5 30,570 29,471 1,037 30,055 50.1 325 5.4 447 7.4 168 2.8 1st quarter 2008 15,106 11.7 7,661 7,445 1,029 7,697 51.0 76 5.0 107 7.0 43 2.8 2nd 14,875 11.5 7,559 7,316 1,033 7,255 48.8 83 5.5 112 7.5 37 2.5 3rd 15,520 11.9 7,912 7,608 1,040 7,732 49.8 70 4.5 108 6.9 53 3.4 4th 14,540 11.1 7,438 7,102 1,047 7,371 50.7 96 6.6 120 8.2 35 2.4
Year 2009 59,046 11.3 30,165 28,881 1,044 29,710 50.3 317 5.3 437 7.4 165 2.8 1st quarter 2009 14,505 11.2 7,499 7,006 1,070 7,431 51.2 71 4.9 98 6.7 42 2.9 2nd 14,866 11.4 7,570 7,296 1,038 7,361 49.5 100 6.7 133 8.9 48 3.2 3rd 15,258 11.6 7,768 7,490 1,037 7,607 49.9 68 4.4 99 6.5 39 2.6 4th 14,417 10.9 7,328 7,089 1,034 7,311 50.7 78 5.4 107 7.4 36 2.5
Year 2010 58,791 11.2 29,872 28,919 1,033 29,528 50.2 291 4.9 409 6.9 150 2.6 1st quarter 2010 14,669 11.3 7,437 7,232 1,028 7,516 51.2 77 5.2 115 7.8 45 3.1 2nd 14,742 11.2 7,441 7,301 1,019 7,369 50.0 68 4.6 95 6.4 34 2.3 3rd 14,910 11.2 7,688 7,222 1,065 7,305 49.0 78 5.2 105 7.0 33 2.2 4th 14,470 10.9 7,306 7,164 1,020 7,338 50.7 68 4.7 94 6.5 38 2.6
Year 2011 58,590 11.1 30,111 28,479 1,057 29,888 51.0 299 5.1 409 6.9 159 2.7 1st quarter 2011 14,613 11.2 7,494 7,119 1,053 7,515 51.4 87 5.9 115 7.8 40 2.7 2nd 14,708 11.1 7,571 7,137 1,061 7,374 50.1 82 5.5 110 7.4 43 2.9 3rd 15,216 11.4 7,853 7,363 1,067 7,747 50.9 59 3.9 86 5.6 36 2.4 4th 14,053 10.5 7,193 6,860 1,049 7,252 51.6 71 5.0 98 6.9 40 2.8
Year 2012 58,027 10.9 29,713 28,314 1,049 29,795 51.3 274 4.7 379 6.5 148 2.6 1st quarter 2012 14,772 11.2 7,580 7,192 1,054 7,711 52.2 67 4.5 96 6.5 43 2.9 2nd 14,345 10.9 7,433 6,912 1,075 7,231 50.4 73 5.1 98 6.8 37 2.6 3rd 14,687 11.0 7,478 7,209 1,037 7,487 51.0 73 4.9 97 6.6 32 2.2 4th 14,223 10.6 7,222 7,001 1,032 7,366 51.8 61 4.3 88 6.2 36 2.5
Year 2013 56,014 10.5 28,828 27,186 1,060 28,816 51.4 234 4.2 327 5.8 131 2.3 1st quarter 2013 13,862 10.6 7,166 6,696 1,070 7,425 53.6 54 3.9 78 5.6 30 2.2 2nd 13,909 10.5 7,097 6,812 1,042 7,059 50.8 55 3.9 79 5.7 33 2.4 3rd 14,508 10.8 7,430 7,078 1,050 7,310 50.4 66 4.5 90 6.2 37 2.6 4th 13,735 10.2 7,135 6,600 1,081 7,022 51.1 59 4.3 80 5.8 31 2.3
Year 2014 56,725 10.6 29,056 27,669 1,050 28,821 50.8 228 4.0 334 5.9 137 2.4 1st quarter 2014 13,930 10.6 7,109 6,821 1,042 7,153 51.3 73 5.2 96 6.9 30 2.2 2nd 14,021 10.5 7,216 6,805 1,060 7,039 50.2 51 3.6 85 6.0 40 2.9 3rd 14,929 11.1 7,644 7,285 1,049 7,494 50.2 45 3.0 70 4.7 34 2.3 4th 13,845 10.3 7,087 6,758 1,049 7,135 51.5 59 4.2 83 6.0 33 2.4
Year 2015 55,098 10.3 28,354 26,744 1,060 28,210 51.2 211 3.8 291 5.3 112 2.0 1st quarter 2015 13,319 10.1 6,813 6,506 1,047 6,917 51.9 50 3.7 71 5.3 34 2.6 2nd 13,717 10.2 7,101 6,616 1,073 6,846 49.9 56 4.1 74 5.4 23 1.7 3rd 14,610 10.8 7,498 7,112 1,054 7,410 50.7 57 3.9 75 5.1 26 1.8 4th 13,452 9.9 6,942 6,510 1,066 7,037 52.3 48 3.6 71 5.3 29 2.2
Year 2016 54,488 10.1 28,236 26,252 1,076 27,727 50.9 236 4.3 326 6.1 121 2.3 1st quarter 2016 13,307 9.9 6,938 6,369 1,089 6,962 52.3 61 4.6 99 7.5 41 3.2 2nd 13,930 10.4 7,201 6,729 1,070 7,027 50.4 67 4.8 89 6.4 30 2.2 3rd 14,258 10.5 7,435 6,823 1,090 7,029 49.3 64 4.5 81 5.9 26 1.8 4th 12,993 9.6 6,662 6,331 1,052 6,709 51.6 44 3.4 57 4.8 24 1.8
Footnotes1) Rate per 1,000 population.2) Rate per 1,000 live and stillbirths.3) Rate per 1,000 live births.4) Same sex marriages came into effect on 16 December 2014.
© Crown Copyright 2017
Males per 1,000 females Rate 2 Rate 2 Rate 3
Rate1 % of live births
Page 12
Table 1.02: Births, stillbirths, deaths, marriages and civil partnerships, numbers and rates, Scotland, quarterly, 2005 to 2016
Infant deaths Deaths - all ages Civil Partnerships
YearNumber
Both sexesMales Females
TotalMale Female
Number Number
284 5.2 55,747 10.9 26,522 29,225 30,881 6.0 30,881 - 53 31 Year 200567 5.0 15,617 12.4 7,289 8,328 3,834 3.0 3,834 - - - 1st quarter 200569 5.1 13,673 10.7 6,506 7,167 8,633 6.8 8,633 - - - 2nd79 5.6 12,811 9.9 6,163 6,648 12,334 9.6 12,334 - - - 3rd69 5.2 13,646 10.6 6,564 7,082 6,080 4.7 6,080 - 53 31 4th
248 4.5 55,093 10.7 26,251 28,842 29,898 5.8 29,898 - 578 469 Year 200650 3.7 14,876 11.8 7,093 7,783 3,495 2.8 3,495 - 166 93 1st quarter 200670 5.0 13,940 10.9 6,591 7,349 8,340 6.5 8,340 - 167 149 2nd54 3.8 12,671 9.8 6,016 6,655 12,174 9.4 12,174 - 145 139 3rd74 5.3 13,606 10.5 6,551 7,055 5,889 4.6 5,889 - 100 88 4th
272 4.7 55,986 10.8 26,895 29,091 29,866 5.8 29,866 - 340 348 Year 200770 4.9 15,820 12.4 7,318 8,502 3,333 2.6 3,333 - 49 63 1st quarter 200777 5.4 13,400 10.4 6,602 6,798 8,146 6.4 8,146 - 93 87 2nd68 4.6 12,614 9.7 6,150 6,464 12,610 9.7 12,610 - 120 125 3rd57 4.0 14,152 10.9 6,825 7,327 5,777 4.5 5,777 - 78 73 4th
253 4.2 55,700 10.7 26,504 29,196 28,903 5.6 28,903 - 245 280 Year 200860 4.0 15,073 11.7 7,098 7,975 3,441 2.7 3,441 - 54 44 1st quarter 200859 4.0 13,493 10.4 6,455 7,038 7,904 6.2 7,904 - 53 61 2nd74 4.8 12,626 9.7 6,024 6,602 11,892 9.2 11,892 - 83 112 3rd60 4.1 14,508 11.1 6,927 7,581 5,666 4.4 5,666 - 55 63 4th
235 4.0 53,856 10.3 25,828 28,028 27,524 5.3 27,524 - 219 279 Year 200962 4.3 14,830 11.5 7,014 7,816 3,194 2.5 3,194 - 22 31 1st quarter 200960 4.0 12,770 9.8 6,185 6,585 7,877 6.0 7,877 - 62 83 2nd60 3.9 12,427 9.4 6,062 6,365 11,251 8.5 11,251 - 78 114 3rd53 3.7 13,829 10.5 6,567 7,262 5,202 3.9 5,202 - 57 51 4th
218 3.7 53,967 10.3 25,963 28,004 28,480 5.4 28,480 - 197 268 Year 201064 4.4 14,690 11.3 7,011 7,679 3,133 2.4 3,133 - 25 37 1st quarter 201050 3.4 12,812 9.8 6,152 6,660 8,290 6.3 8,290 - 53 74 2nd49 3.3 12,506 9.4 5,979 6,527 11,577 8.7 11,577 - 72 99 3rd55 3.8 13,959 10.5 6,821 7,138 5,480 4.1 5,480 - 47 58 4th
238 4.1 53,661 10.1 25,913 27,748 29,135 5.5 29,135 - 229 325 Year 201162 4.2 14,535 11.1 7,005 7,530 3,131 2.4 3,131 - 47 51 1st quarter 201158 3.9 12,971 9.8 6,251 6,720 8,644 6.5 8,644 - 53 81 2nd51 3.4 12,618 9.4 6,224 6,394 11,653 8.7 11,653 - 74 120 3rd67 4.8 13,537 10.1 6,433 7,104 5,707 4.3 5,707 - 55 73 4th
217 3.7 54,937 10.3 26,015 28,922 30,534 5.7 30,534 - 257 317 Year 2012 59 4.0 14,220 10.8 6,730 7,490 3,255 2.5 3,255 - 36 47 1st quarter 201255 3.8 13,700 10.4 6,547 7,153 9,159 6.9 9,159 - 63 75 2nd49 3.3 12,761 9.6 6,095 6,666 11,639 8.7 11,639 - 93 113 3rd54 3.8 14,256 10.7 6,643 7,613 6,481 4.9 6,481 - 65 82 4th
186 3.3 54,700 10.3 26,325 28,375 27,547 5.2 27,547 - 217 313 Year 201343 3.1 15,091 11.5 7,146 7,945 3,258 2.5 3,258 - 29 34 1st quarter 201344 3.2 13,735 10.3 6,630 7,105 8,113 6.1 8,113 - 63 78 2nd44 3.0 12,224 9.1 5,941 6,283 10,312 7.7 10,312 - 88 106 3rd55 4.0 13,650 10.2 6,608 7,042 5,864 4.4 5,864 - 37 95 4th
207 3.6 54,239 10.1 26,289 27,950 29,069 5.4 28,702 367 193 243 Year 201448 3.4 13,959 10.6 6,693 7,266 3,549 2.7 3,549 - 31 46 1st quarter 201453 3.8 12,846 9.6 6,283 6,563 8,342 6.3 8,342 - 54 75 2nd52 3.5 12,938 9.6 6,321 6,617 11,038 8.2 11,038 - 65 75 3rd54 3.9 14,496 10.8 6,992 7,504 6,140 4.6 5,773 367 43 47 4th
175 3.2 57,579 10.7 27,905 29,674 29,691 5.5 28,020 1,671 33 31 Year 201558 4.4 16,525 12.5 7,778 8,747 3,888 2.9 3,444 444 12 8 1st quarter 201534 2.5 13,903 10.4 6,782 7,121 8,187 6.1 7,761 426 6 7 2nd44 3.0 13,086 9.7 6,436 6,650 11,434 8.4 10,958 476 8 9 3rd39 2.9 14,065 10.4 6,909 7,156 6,182 4.6 5,857 325 7 7 4th
181 3.3 56,728 10.5 27,760 28,968 29,229 5.4 28,231 998 42 28 Year 201658 4.4 15,488 11.5 7,485 8,003 3,512 2.6 3,357 155 8 4 1st quarter 201645 3.2 13,466 10.0 6,620 6,846 8,052 6.0 7,770 282 9 7 2nd40 2.8 13,202 9.7 6,542 6,660 11,299 8.3 10,946 353 17 8 3rd38 2.9 14,572 10.7 7,113 7,459 6,366 4.7 6,158 208 8 9 4th
Back to contents
Marriages 4
Rate 3 Opposite sex
Same sexRate1 Rate1
Page 13
Table 1.03: Estimated population, births, stillbirths, deaths, marriages and civil partnerships, numbers and rates, by administrative area, Scotland, 2016
AreaEstimated population at 30 June Live births Stillbirths Perinatal deaths
Both sexes Males FemalesBoth sexes
Males Females Number NumberNumber
SCOTLAND 5,404,700 2,627,503 2,777,197 54,488 10.1 10.1 28,236 26,252 236 4.3 326 6.1Council areasAberdeen City 229,840 114,121 115,719 2,521 11.0 8.5 1,285 1,236 13 5.1 16 6.7Aberdeenshire 262,190 130,371 131,819 2,811 10.7 12.2 1,475 1,336 11 3.9 16 5.7Angus 116,520 56,769 59,751 1,025 8.8 10.8 540 485 3 2.9 5 4.9Argyll & Bute 87,130 43,319 43,811 699 8.0 11.7 356 343 1 1.4 2 2.9
507,170 246,778 260,392 5,300 10.5 7.6 2,716 2,584 13 2.4 23 4.3Clackmannanshire 51,350 25,167 26,183 505 9.8 11.4 268 237 5 9.8 5 9.8Dumfries & Galloway 149,520 72,533 76,987 1,318 8.8 11.5 655 663 10 7.5 13 9.8Dundee City 148,270 71,432 76,838 1,576 10.6 9.0 842 734 10 6.3 19 12.0East Ayrshire 122,200 59,273 62,927 1,275 10.4 11.6 669 606 3 2.3 5 3.9East Dunbartonshire 107,540 52,014 55,526 951 8.8 11.7 490 461 3 3.1 3 3.1East Lothian 104,090 49,830 54,260 1,041 10.0 11.4 555 486 6 5.7 9 8.6East Renfrewshire 93,810 44,620 49,190 861 9.2 11.5 442 419 4 4.6 5 5.8Falkirk 159,380 78,026 81,354 1,565 9.8 10.5 832 733 12 7.6 15 9.5Fife 370,330 179,552 190,778 3,739 10.1 11.0 1,930 1,809 19 5.1 34 9.0Glasgow City 615,070 299,035 316,035 6,833 11.1 8.4 3,505 3,328 49 7.1 60 8.9Highland 234,770 114,846 119,924 2,150 9.2 11.0 1,129 1,021 8 3.7 9 4.2Inverclyde 79,160 37,836 41,324 706 8.9 10.2 376 330 - - - -Midlothian 88,610 42,579 46,031 1,088 12.3 13.0 563 525 3 2.7 4 3.7Moray 96,070 47,653 48,417 939 9.8 11.4 498 441 1 1.1 1 1.1
26,900 13,269 13,631 238 8.8 11.9 126 112 1 4.2 1 4.2North Ayrshire 135,890 64,655 71,235 1,244 9.2 10.8 651 593 4 3.2 6 4.8North Lanarkshire 339,390 164,242 175,148 3,511 10.3 10.6 1,824 1,687 21 5.9 21 5.9Orkney Islands 21,850 10,880 10,970 178 8.1 10.0 89 89 - - - -Perth & Kinross 150,680 73,962 76,718 1,325 8.8 10.6 673 652 4 3.0 7 5.3Renfrewshire 175,930 84,692 91,238 1,773 10.1 10.7 929 844 4 2.3 4 2.3Scottish Borders 114,530 55,516 59,014 1,005 8.8 12.0 522 483 2 2.0 2 2.0Shetland Islands 23,200 11,783 11,417 266 11.5 13.3 141 125 - - - -South Ayrshire 112,470 53,674 58,796 976 8.7 11.0 502 474 3 3.1 6 6.1South Lanarkshire 317,100 152,995 164,105 3,315 10.5 11.5 1,740 1,575 8 2.4 14 4.2Stirling 93,750 45,081 48,669 807 8.6 8.8 404 403 7 8.6 7 8.6West Dunbartonshire 89,860 42,747 47,113 958 10.7 11.1 487 471 4 4.2 5 5.2West Lothian 180,130 88,253 91,877 1,989 11.0 11.4 1,022 967 4 2.0 9 4.5NHS Board areasAyrshire & Arran 370,560 177,602 192,958 3,495 9.4 11.1 1,822 1,673 10 2.9 17 4.9Borders 114,530 55,516 59,014 1,005 8.8 12.0 522 483 2 2.0 2 2.0Dumfries & Galloway 149,520 72,533 76,987 1,318 8.8 11.5 655 663 10 7.5 13 9.8Fife 370,330 179,552 190,778 3,739 10.1 11.0 1,930 1,809 19 5.1 34 9.0Forth Valley 304,480 148,274 156,206 2,877 9.4 10.1 1,504 1,373 24 8.3 27 9.3Grampian 588,100 292,145 295,955 6,271 10.7 10.3 3,258 3,013 25 4.0 33 5.2Greater Glasgow & Clyde 1,161,370 560,944 600,426 12,082 10.4 9.4 6,229 5,853 64 5.3 77 6.3Highland 321,900 158,165 163,735 2,849 8.9 11.1 1,485 1,364 9 3.1 11 3.8Lanarkshire 656,490 317,237 339,253 6,826 10.4 11.0 3,564 3,262 29 4.2 35 5.1Lothian 880,000 427,440 452,560 9,418 10.7 9.0 4,856 4,562 26 2.8 45 4.8Orkney 21,850 10,880 10,970 178 8.1 10.0 89 89 - - - -Shetland 23,200 11,783 11,417 266 11.5 13.3 141 125 - - - -Tayside 415,470 202,163 213,307 3,926 9.4 9.9 2,055 1,871 17 4.3 31 7.9Western Isles 26,900 13,269 13,631 238 8.8 11.9 126 112 1 4.2 1 4.2
Footnotes
3) Rate per 1,000 live births.4) Same sex marriages came into effect on 16 December 2014.
Standard-ised rate Rate 2 Rate 2
Rate 1
City of Edinburgh5
Na h-Eileanan Siar5
1) Rate per 1,000 population.2) Rate per 1,000 live and stillbirths.
5) The alphabetical order of the council areas has changed due to adoption of the preferred forms of reference to the Edinburgh and Western Isles council areas. Previous versions of this table used the forms 'Edinburgh, City of' and 'Eilean Siar'.
Page 14
Table 1.03: Estimated population, births, stillbirths, deaths, marriages and civil partnerships, numbers and rates, by administrative area, Scotland, 2016
Neonatal deaths Infant deaths Deaths Civil Partnerships Area
Number NumberBoth sexes
Males Females Total Male FemaleNumber
121 2.2 181 3.3 56,728 10.5 10.5 27,760 28,968 29,229 28,231 998 42 28 SCOTLANDCouncil areas
5 2.0 8 3.2 2,129 9.3 10.6 1,024 1,105 846 811 35 2 - Aberdeen City6 2.1 7 2.5 2,360 9.0 9.3 1,170 1,190 1,240 1,224 16 - - Aberdeenshire4 3.9 5 4.9 1,433 12.3 10.2 693 740 495 482 13 - - Angus1 1.4 1 1.4 1,110 12.7 10.1 560 550 1,133 1,088 45 - - Argyll & Bute
17 3.2 20 3.8 4,361 8.6 9.8 2,092 2,269 2,873 2,680 193 17 4- - 1 2.0 546 10.6 10.9 263 283 182 178 4 1 - Clackmannanshire3 2.3 6 4.6 1,858 12.4 9.6 971 887 4,575 4,459 116 8 5 Dumfries & Galloway
11 7.0 12 7.6 1,691 11.4 11.5 822 869 496 468 28 2 1 Dundee City2 1.6 2 1.6 1,453 11.9 11.7 709 744 516 501 15 - - East Ayrshire- - 2 2.1 1,114 10.4 8.7 514 600 232 224 8 - - East Dunbartonshire3 2.9 4 3.8 1,001 9.6 9.1 476 525 592 571 21 - 1 East Lothian1 1.2 1 1.2 883 9.4 8.5 397 486 343 329 14 - - East Renfrewshire5 3.2 8 5.1 1,734 10.9 11.3 844 890 762 745 17 1 1 Falkirk
17 4.5 24 6.4 4,091 11.0 10.6 1,967 2,124 1,623 1,587 36 - 1 Fife15 2.2 29 4.2 6,321 10.3 13.0 3,142 3,179 2,556 2,406 150 6 9 Glasgow City
2 0.9 3 1.4 2,397 10.2 9.1 1,260 1,137 1,556 1,521 35 - - Highland1 1.4 1 1.4 1,006 12.7 11.5 491 515 208 203 5 - - Inverclyde1 0.9 2 1.8 848 9.6 10.0 425 423 369 359 10 - - Midlothian1 1.1 1 1.1 979 10.2 9.3 494 485 349 336 13 2 - Moray- - - - 359 13.3 10.1 183 176 118 114 4 - -3 2.4 8 6.4 1,593 11.7 10.7 800 793 666 647 19 - 2 North Ayrshire1 0.3 4 1.1 3,568 10.5 12.1 1,791 1,777 910 894 16 - 2 North Lanarkshire- - - - 223 10.2 8.6 100 123 112 111 1 - - Orkney Islands5 3.8 8 6.0 1,617 10.7 8.7 750 867 1,090 1,056 34 - 1 Perth & Kinross- - 2 1.1 2,070 11.8 11.7 1,015 1,055 759 730 29 1 - Renfrewshire1 1.0 2 2.0 1,277 11.1 9.0 635 642 626 614 12 1 - Scottish Borders- - - - 232 10.0 10.0 122 110 89 88 1 - - Shetland Islands3 3.1 3 3.1 1,445 12.8 10.1 683 762 851 829 22 1 - South Ayrshire7 2.1 9 2.7 3,529 11.1 11.1 1,697 1,832 1,116 1,086 30 - 1 South Lanarkshire- - - - 899 9.6 9.7 436 463 724 700 24 - - Stirling1 1.0 1 1.0 1,050 11.7 12.1 493 557 352 338 14 - - West Dunbartonshire5 2.5 7 3.5 1,551 8.6 10.4 741 810 870 852 18 - - West Lothian
NHS Board areas8 2.3 13 3.7 4,491 12.1 10.8 2,192 2,299 2,033 1,977 56 1 2 Ayrshire & Arran1 1.0 2 2.0 1,277 11.1 9.0 635 642 626 614 12 1 - Borders3 2.3 6 4.6 1,858 12.4 9.6 971 887 4,575 4,459 116 8 5 Dumfries & Galloway
17 4.5 24 6.4 4,091 11.0 10.6 1,967 2,124 1,623 1,587 36 - 1 Fife5 1.7 9 3.1 3,179 10.4 10.7 1,543 1,636 1,668 1,623 45 2 1 Forth Valley
12 1.9 16 2.6 5,468 9.3 9.8 2,688 2,780 2,435 2,371 64 4 - Grampian18 1.5 36 3.0 12,444 10.7 11.6 6,052 6,392 4,450 4,230 220 7 9 Greater Glasgow & Clyde
3 1.1 4 1.4 3,507 10.9 9.4 1,820 1,687 2,689 2,609 80 - - Highland8 1.2 13 1.9 7,097 10.8 11.5 3,488 3,609 2,026 1,980 46 - 3 Lanarkshire
26 2.8 33 3.5 7,761 8.8 9.8 3,734 4,027 4,704 4,462 242 17 5 Lothian- - - - 223 10.2 8.6 100 123 112 111 1 - - Orkney- - - - 232 10.0 10.0 122 110 89 88 1 - - Shetland
20 5.1 25 6.4 4,741 11.4 10.0 2,265 2,476 2,081 2,006 75 2 2 Tayside- - - - 359 13.3 10.1 183 176 118 114 4 - - Western Isles
Back to contents
Marriages 4
Rate 3 Rate 3 Standard-ised rate
Opposite sex
Same sexRate 1
City of Edinburgh5
Na h-Eileanan Siar5
Page 15
Area
NumbersLive births Deaths
Resident in Scotland Resident in Scotland Resident in Scotland
Males Females Males Females Crude
SCOTLAND 54,217 28,091 26,126 271 56,439 27,580 28,859 289 10.4 10.4Council areasAberdeen City 2,513 1,280 1,233 8 2,111 1,011 1,100 18 9.2 10.5Aberdeenshire 2,804 1,472 1,332 7 2,354 1,165 1,189 6 9.0 9.2Angus 1,025 540 485 - 1,433 693 740 - 12.3 10.2Argyll & Bute 697 356 341 2 1,102 554 548 8 12.6 10.0
5,279 2,705 2,574 21 4,318 2,070 2,248 43 8.5 9.7Clackmannanshire 505 268 237 - 546 263 283 - 10.6 10.9Dumfries & Galloway 1,312 651 661 6 1,837 955 882 21 12.3 9.5Dundee City 1,570 838 732 6 1,684 819 865 7 11.4 11.4East Ayrshire 1,263 661 602 12 1,450 708 742 3 11.9 11.6East Dunbartonshire 951 490 461 - 1,114 514 600 - 10.4 8.7East Lothian 1,040 554 486 1 994 470 524 7 9.5 9.0East Renfrewshire 861 442 419 - 883 397 486 - 9.4 8.4Falkirk 1,556 829 727 9 1,724 837 887 10 10.8 11.2Fife 3,727 1,921 1,806 12 4,078 1,962 2,116 13 11.0 10.5Glasgow City 6,798 3,488 3,310 35 6,294 3,124 3,170 27 10.2 12.9Highland 2,121 1,116 1,005 29 2,359 1,233 1,126 38 10.0 8.9Inverclyde 704 374 330 2 1,004 490 514 2 12.7 11.4Midlothian 1,086 562 524 2 844 423 421 4 9.5 9.9Moray 937 496 441 2 977 492 485 2 10.2 9.3
237 126 111 1 358 183 175 1 13.3 10.1North Ayrshire 1,242 650 592 2 1,593 800 793 - 11.7 10.6North Lanarkshire 3,502 1,822 1,680 9 3,557 1,784 1,773 11 10.5 12.0Orkney Islands 177 89 88 1 220 99 121 3 10.1 8.5Perth & Kinross 1,319 672 647 6 1,608 744 864 9 10.7 8.7Renfrewshire 1,766 923 843 7 2,065 1,011 1,054 5 11.7 11.7Scottish Borders 929 479 450 76 1,254 627 627 23 10.9 8.9Shetland Islands 266 141 125 - 232 122 110 - 10.0 10.0South Ayrshire 975 501 474 1 1,438 678 760 7 12.8 10.0South Lanarkshire 3,310 1,737 1,573 5 3,518 1,690 1,828 11 11.1 11.0Stirling 807 404 403 - 896 434 462 3 9.6 9.6West Dunbartonshire 956 486 470 2 1,046 489 557 4 11.6 12.0West Lothian 1,982 1,018 964 7 1,548 739 809 3 8.6 10.4NHS Board areasAyrshire & Arran 3,480 1,812 1,668 15 4,481 2,186 2,295 10 12.1 10.7Borders 929 479 450 76 1,254 627 627 23 10.9 8.9Dumfries & Galloway 1,312 651 661 6 1,837 955 882 21 12.3 9.5Fife 3,727 1,921 1,806 12 4,078 1,962 2,116 13 11.0 10.5Forth Valley 2,868 1,501 1,367 9 3,166 1,534 1,632 13 10.4 10.7Grampian 6,254 3,248 3,006 17 5,442 2,668 2,774 26 9.3 9.7Greater Glasgow & Clyde 12,036 6,203 5,833 46 12,406 6,025 6,381 38 10.7 11.6Highland 2,818 1,472 1,346 31 3,461 1,787 1,674 46 10.8 9.3Lanarkshire 6,812 3,559 3,253 14 7,075 3,474 3,601 22 10.8 11.5Lothian 9,387 4,839 4,548 31 7,704 3,702 4,002 57 8.8 9.7Orkney 177 89 88 1 220 99 121 3 10.1 8.5Shetland 266 141 125 - 232 122 110 - 10.0 10.0Tayside 3,914 2,050 1,864 12 4,725 2,256 2,469 16 11.4 10.0Western Isles 237 126 111 1 358 183 175 1 13.3 10.1
Footnote
Table 1.04: Births, deaths and death rates by administrative area, resident and not resident in Scotland, 2016
Death rates per 1,000 population
Not resident in Scotland
Not resident in Scotland
Both sexes
Both sexes
Standardised for age & sex
City of Edinburgh1
Na h-Eileanan Siar1
1) The alphabetical order of the council areas has changed due to adoption of the preferred forms of reference to the Edinburgh and Western Isles council areas. Previous versions of this table used the forms 'Edinburgh, City of' and 'Eilean Siar'.
Page 16
Area
Malignant neoplasms
Pneu-moniaAll sites Stomach
(C00-97) (C16) (C18) (C33-34) (C50) (I20-25) (I60-69) (J12-18)
SCOTLAND 100 100 100 100 100 100 100 100 100 100
Council areas
Aberdeen City 101 103 81 98 120 80 94 93 116 104Aberdeenshire 88 85 81 101 64 97 91 118 79 92Angus 97 104 123 116 76 98 94 96 76 96Argyll & Bute 96 96 72 86 77 104 102 99 127 88
93 94 80 104 90 95 92 94 81 103Clackmannanshire 104 95 155 89 82 104 110 111 94 113Dumfries & Galloway 92 90 88 99 90 88 108 78 75 92Dundee City 109 108 92 74 113 125 113 102 78 100East Ayrshire 111 107 166 134 131 72 123 111 116 93East Dunbartonshire 83 84 93 97 68 93 73 79 91 92East Lothian 86 94 96 87 78 91 86 76 73 92East Renfrewshire 81 84 92 82 72 126 89 69 60 92Falkirk 107 104 59 102 115 92 104 94 132 108Fife 101 104 92 106 106 98 103 89 84 113Glasgow City 124 124 161 115 151 88 126 120 112 113Highland 87 88 70 83 72 124 84 93 70 86Inverclyde 109 97 77 45 108 106 90 111 151 124Midlothian 95 95 61 99 86 105 100 99 102 85Moray 89 88 63 107 85 99 94 119 108 72
96 114 114 80 91 110 104 121 98 51North Ayrshire 101 103 157 115 107 113 118 88 129 81North Lanarkshire 115 108 131 100 118 66 111 116 129 113Orkney Islands 82 58 50 0 45 44 95 81 128 76Perth & Kinross 83 87 65 107 82 87 78 96 83 86Renfrewshire 112 110 97 121 112 133 109 111 111 128Scottish Borders 86 88 84 103 74 83 80 89 99 78Shetland Islands 96 105 112 48 102 119 107 104 134 115South Ayrshire 96 93 84 78 91 115 97 117 98 100South Lanarkshire 105 103 78 93 101 128 98 106 135 103Stirling 92 91 99 84 105 86 87 84 111 96West Dunbartonshire 115 122 197 116 118 150 106 94 116 110West Lothian 99 106 111 116 112 113 94 104 94 105
NHS Board areas
Ayrshire & Arran 102 101 135 108 109 101 113 105 114 91Borders 86 88 84 103 74 83 80 89 99 78Dumfries & Galloway 92 90 88 99 90 88 108 78 75 92Fife 101 104 92 106 106 98 103 89 84 113Forth Valley 102 98 88 94 106 92 100 94 119 105Grampian 93 92 78 101 87 91 93 109 98 92Greater Glasgow & Clyde 111 110 132 105 120 106 108 105 108 112Highland 89 90 70 84 73 118 89 95 87 87Lanarkshire 110 106 104 96 109 98 104 111 132 108Lothian 94 97 86 103 92 99 93 94 84 100Orkney 82 58 50 0 45 44 95 81 128 76Shetland 96 105 112 48 102 119 107 104 134 115Tayside 95 98 91 100 90 102 94 98 80 93Western Isles 96 114 114 80 91 110 104 121 98 51
Footnotes1) Ratios may vary significantly from year to year, particularly those based on small numbers. Ratios based on fewer than 20 deaths are shown in italics.
Table 1.05: Standardised mortality ratios1 (based on Scotland experience) for selected causes, by administrative area, Scotland, 2016
All deaths
Ischaemic heart
diseases
Cerebro-vascular diseases
Dementia and Alzheimer's
DiseaseLarge
intestine
Trachea, bronchus &
lung
Breast (female)
(F01, F03, G30)
City of Edinburgh2
Na h-Eileanan Siar2
2) The alphabetical order of the council areas has changed due to adoption of the preferred forms of reference to the Edinburgh and Western Isles council areas. Previous versions of this table used the forms 'Edinburgh, City of' and 'Eilean Siar'.
Page 17
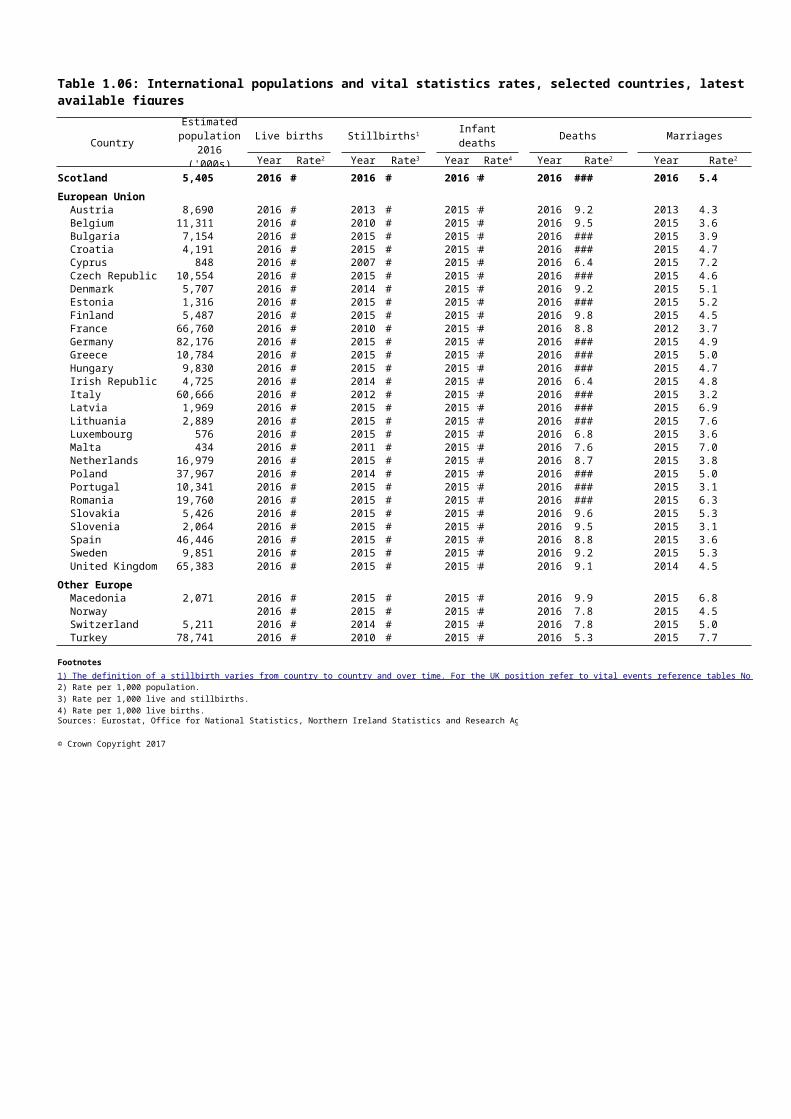
Table 1.06: International populations and vital statistics rates, selected countries, latest available figures
CountryLive births Infant deaths Deaths Marriages
Year Year Year Year Year
Scotland 5,405 2016 10.1 2016 4.3 2016 3.3 2016 10.5 2016 5.4
European Union Austria 8,690 2016 10.0 2013 3.4 2015 3.1 2016 9.2 2013 4.3 Belgium 11,311 2016 10.8 2010 4.9 2015 3.3 2016 9.5 2015 3.6 Bulgaria 7,154 2016 9.1 2015 6.3 2015 6.6 2016 15.1 2015 3.9 Croatia 4,191 2016 9.0 2015 4.3 2015 4.1 2016 12.4 2015 4.7 Cyprus 848 2016 11.1 2007 3.1 2015 2.7 2016 6.4 2015 7.2 Czech Republic 10,554 2016 10.7 2015 2.7 2015 2.5 2016 10.2 2015 4.6 Denmark 5,707 2016 10.8 2014 4.1 2015 3.7 2016 9.2 2015 5.1 Estonia 1,316 2016 10.7 2015 1.4 2015 2.5 2016 11.7 2015 5.2 Finland 5,487 2016 9.6 2015 2.1 2015 1.7 2016 9.8 2015 4.5 France 66,760 2016 11.7 2010 10.4 2015 3.7 2016 8.8 2012 3.7 Germany 82,176 2016 9.3 2015 3.8 2015 3.3 2016 11.2 2015 4.9 Greece 10,784 2016 8.6 2015 3.4 2015 4.0 2016 11.0 2015 5.0 Hungary 9,830 2016 9.7 2015 4.4 2015 4.2 2016 13.0 2015 4.7 Irish Republic 4,725 2016 13.5 2014 2.4 2015 3.4 2016 6.4 2015 4.8 Italy 60,666 2016 7.8 2012 2.7 2015 2.9 2016 10.1 2015 3.2 Latvia 1,969 2016 11.2 2015 3.3 2015 4.1 2016 14.6 2015 6.9 Lithuania 2,889 2016 10.7 2015 4.0 2015 4.2 2016 14.3 2015 7.6 Luxembourg 576 2016 10.4 2015 8.1 2015 2.8 2016 6.8 2015 3.6 Malta 434 2016 10.2 2011 4.3 2015 5.8 2016 7.6 2015 7.0 Netherlands 16,979 2016 10.1 2015 2.9 2015 3.3 2016 8.7 2015 3.8 Poland 37,967 2016 10.1 2014 2.5 2015 4.0 2016 10.2 2015 5.0 Portugal 10,341 2016 8.4 2015 2.3 2015 2.9 2016 10.7 2015 3.1 Romania 19,760 2016 9.6 2015 3.7 2015 7.6 2016 13.0 2015 6.3 Slovakia 5,426 2016 10.6 2015 3.3 2015 5.1 2016 9.6 2015 5.3 Slovenia 2,064 2016 9.9 2015 2.7 2015 1.6 2016 9.5 2015 3.1 Spain 46,446 2016 8.7 2015 3.1 2015 2.7 2016 8.8 2015 3.6 Sweden 9,851 2016 11.8 2015 3.7 2015 2.5 2016 9.2 2015 5.3 United Kingdom 65,383 2016 11.8 2015 4.4 2015 3.9 2016 9.1 2014 4.5
Other Europe Macedonia 2,071 2016 11.1 2015 8.0 2015 8.6 2016 9.9 2015 6.8 Norway 2016 11.2 2015 2.9 2015 2.3 2016 7.8 2015 4.5 Switzerland 5,211 2016 10.5 2014 4.3 2015 3.9 2016 7.8 2015 5.0 Turkey 78,741 2016 16.5 2010 8.8 2015 10.7 2016 5.3 2015 7.7
Footnotes
2) Rate per 1,000 population.3) Rate per 1,000 live and stillbirths.4) Rate per 1,000 live births.Sources: Eurostat, Office for National Statistics, Northern Ireland Statistics and Research Agency.
© Crown Copyright 2017
Estimated population
2016 ('000s)
Stillbirths1
Rate2 Rate3 Rate4 Rate2 Rate2
1) The definition of a stillbirth varies from country to country and over time. For the UK position refer to vital events reference tables Notes and Definitions.
Page 18
Table 1.7: Summary comparisons with other countries of the United Kingdom
(a) Total population, 1981 to 2015Population (thousands) % change
1981 1991 2001 2015 1991 - 2001 2001 - 2015Scotland 5,180.2 5,083.3 5,064.2 5,373.0 -0.4 6.1 England 46,820.8 47,875.0 49,449.7 54,786.3 3.3 10.8 Wales 2,813.5 2,873.0 2,910.2 3,099.1 1.3 6.5
1,543.0 1,607.3 1,688.8 1,851.6 5.1 9.6 United Kingdom 56,357.5 57,438.7 59,113.0 65,110.0 2.9 10.1
(b) Population, by broad age group and sex, 2015 (Percentages)
All ages ('000s) 0-4 5-15 16-44 45-64M/59F 65M/60F-79 80 & over
PersonsScotland 5,373,000 291,174 621,088 1,996,811 1,318,178 895,601 250,148 England 54,786,327 3,434,680 6,970,434 20,786,238 12,401,364 8,572,022 2,621,589 Wales 3,099,086 175,922 379,367 1,103,171 721,197 556,194 163,235 Northern Ireland 1,851,621 125,316 259,884 706,319 420,626 265,082 74,394 United Kingdom 65,110,034 4,027,092 8,230,773 24,592,539 14,861,365 10,288,899 3,109,366
MalesScotland 2,610,469 149,284 317,186 988,213 720,105 342,112 93,569 England 27,029,286 1,760,388 3,568,432 10,449,737 6,849,528 3,376,912 1,024,289 Wales 1,525,561 90,078 194,690 556,467 398,938 221,768 63,620 Northern Ireland 909,129 63,979 133,432 350,723 230,987 102,372 27,636 United Kingdom 32,074,445 2,063,729 4,213,740 12,345,140 8,199,558 4,043,164 1,209,114
FemalesScotland 2,762,531 141,890 303,902 1,008,598 598,073 553,489 156,579 England 27,757,041 1,674,292 3,402,002 10,336,501 5,551,836 5,195,110 1,597,300 Wales 1,573,525 85,844 184,677 546,704 322,259 334,426 99,615 Northern Ireland 942,492 61,337 126,452 355,596 189,639 162,710 46,758 United Kingdom 33,035,589 1,963,363 4,017,033 12,247,399 6,661,807 6,245,735 1,900,252
(c) Births, 1981 to 2015
Number of live births (thousands) Birth rate per 1,000 population
1981 1991 2001 2015 1981 1991 2001 2015 2015 2015Scotland 69.1 67.0 52.5 55.1 13.3 13.2 10.4 10.3 53.2 1.6England 598.2 660.8 563.7 664.4 12.8 13.8 11.5 12.1 62.5 1.8Wales 35.8 38.1 30.6 33.3 12.7 13.3 10.5 10.7 59.1 1.8Northern Ireland 27.2 26.0 22.0 24.2 17.6 16.2 13.0 13.1 66.0 2.0
730.7 792.3 669.0 777.2 13.0 13.8 11.4 11.9 61.7 1.8
Back to contents
Northern Ireland 1
General fertility rate 2
Total fertility rate 1
United Kingdom 3
Page 19
(d) Stillbirth, perinatal mortality and infant mortality rates, 1981 to 2015
1981 2001 2015 1981 2001 2015 1981 1993 2001 2015Scotland 6.3 4.8 6.4 5.7 3.8 11.6 8.0 9.6 8.5 5.3 11.3 6.5 5.5 3.2England 6.5 4.3 5.7 5.3 4.4 11.7 7.6 8.9 8.0 6.5 10.9 6.3 5.4 3.9Wales 7.3 4.5 5.8 5.0 4.7 14.1 7.0 8.3 7.5 6.5 12.6 5.6 5.4 3.7Northern Ireland 8.8 4.1 5.2 5.1 3.1 15.3 7.7 8.8 8.5 6.9 13.2 7.1 6.1 5.1United Kingdom 6.6 4.4 5.7 5.3 4.4 12.0 7.6 9.0 8.0 6.5 11.2 6.4 5.5 3.9
(e) Deaths, 1981 to 2015Number of deaths Death rate per 1,000 population
1981 1991 2001 2015 1981 1991 2001 2015 Persons Males FemalesScotland 63.8 61.0 57.4 57.6 12.3 12.0 11.3 10.7 117 119 116 England 541.0 534.0 496.1 495.3 11.6 11.2 10.1 9.0 98 97 98 Wales 35.0 34.1 33.0 33.2 12.4 11.9 11.4 10.7 105 105 105 Northern Ireland 16.3 15.1 14.5 15.5 10.5 9.4 9.6 8.4 104 106 103
658.0 646.2 602.3 602.8 11.7 11.2 10.2 9.3 100 100 100
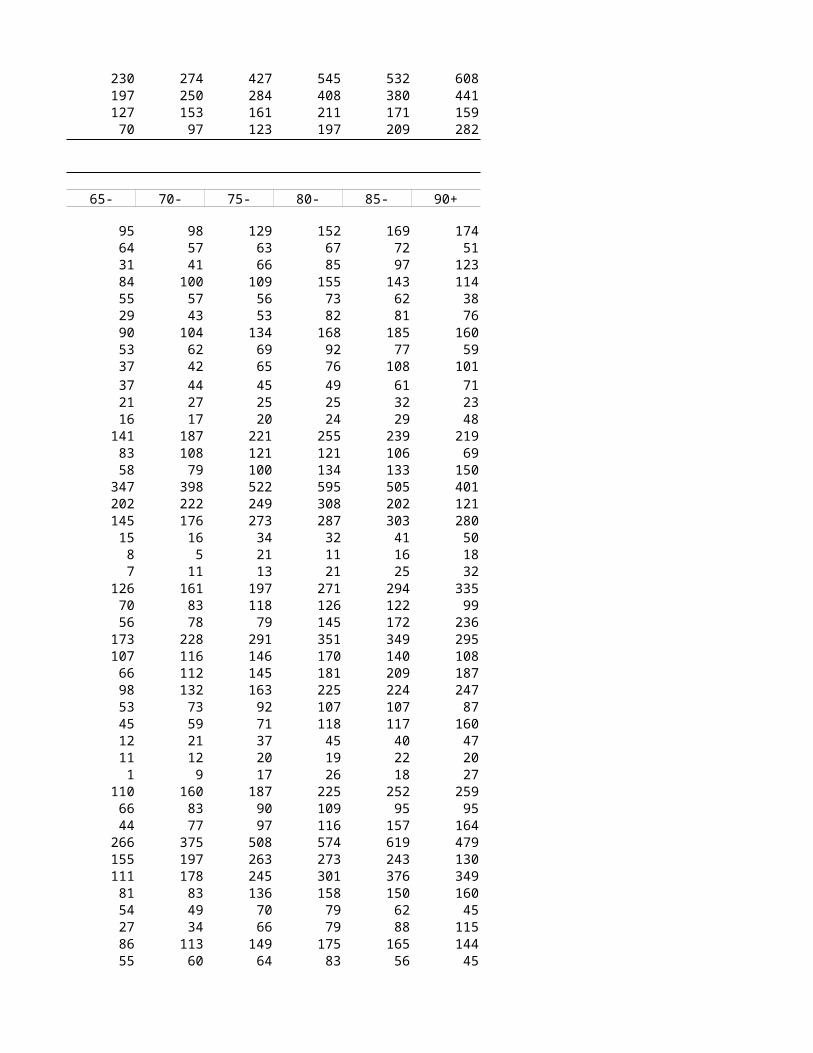
(f) Age standardised mortality rates by selected cause and sex, 2015
Male Female Male Female Male Female Male Female Male FemaleRates per 100,000 population
Scotland 391 271 203 102 92 88 186 143 108 131England 331 227 162 75 67 63 169 122 104 122Wales 337 238 182 88 68 70 202 152 95 115Northern Ireland 365 235 173 87 76 64 190 134 111 133United Kingdom 338 232 167 78 70 65 173 125 104 123
Footnotes1) Refer to Notes and Definitions.2) Live births per 1,00 women aged 15-44.
4) Rates based on old definition of stillbirths. Refer to Notes and Definitions.5) Rates based on new definition of stillbirths. Refer to Notes and Definitions.
7) ICD10 Codes C00-97.8) ICD10 Codes I20-25.9) ICD10 Codes I60-69.10) ICD10 Codes J00-J9911) ICD10 Codes F01,F03,G30Note: The age standardised mortality rates are based on the 2013 version of the European Standard Population. Previous versions of this table were based on the 1976 version.
© Crown Copyright 2017
Stillbirth rate 1 Perinatal mortality rate 1 Infant mortality rate 1
1993 4 1993 5 1993 4 1993 5
SMR1 2015 (UK=100)
United Kingdom 6
Cancer 7 Ischaemic heart disease 8 Cerebrovascular disease 9 Respiratory diseases10 Dementia/Alzheimer's11
3) Births to a country's non-residents are included in the figures for Scotland, Northen Ireland and the UK total, but excluded from the figures for the four countries and the total for the UK as a whole. The UK totals also include Isle of Man and Channel Islands, so may differ from those in Table 1.6.
6) Deaths of a country's non-residents are included in the figures for Scotland, Northern Ireland and the UK total, but excluded from the figures for England and Wales. As a results, there is a slight difference between the sum of the figures for the four countries and the total for the UK as a whole.
Page 20
Table 2.01: Adoptions, Scotland, 1930 - 2016
Year Year
1931-35 512 1951 1,562 1991 8151936-40 972 1952 1,523 1992 8231941-45 1,618 1953 1,486 1993 8051946-50 1,862 1954 1,343 1994 6641951-55 1,453 1955 1,352 1995 640
1956-60 1,364 1956 1,358 1996 5801961-65 1,775 1957 1,405 1997 4701966-70 2,129 1958 1,365 1998 4901971-75 1,768 1959 1,236 1999 4861976-80 1,423 1960 1,457 2000 391
1981-85 1,080 1961 1,609 2001 4701986-90 932 1962 1,621 2002 3851991-95 749 1963 1,683 2003 467
1996-2000 483 1964 1,945 2004 3932001-05 431 1965 2,018 2005 439
2006-10 440 1966 2,040 2006 4182011-2015 488 1967 2,140 2007 441
1968 2,155 2008 4211969 2,268 2009 455
1930 3 1970 2,040 2010 466
1931 347 1971 1,904 2011 4961932 492 1972 1,691 2012 4951933 437 1973 1,900 2013 4891934 602 1974 1,664 2014 4551935 683 1975 1,680 2015 504
1936 704 1976 1,612 2016 5231937 820 1977 1,6041938 812 1978 1,3561939 1,100 1979 1,1441940 1,424 1980 1,400
1941 1,222 1981 1,1161942 1,563 1982 1,2121943 1,747 1983 1,1641944 1,681 1984 9721945 1,876 1985 936
1946 2,292 1986 1,0681947 1,890 1987 1,0561948 2,073 1988 8681949 1,764 1989 8481950 1,289 1990 821
Footnote1) Figures in five year groups are yearly averages.
© Crown Copyright 2017
Year1 Number of adoptions
Number of adoptions
Number of adoptions
Page 21
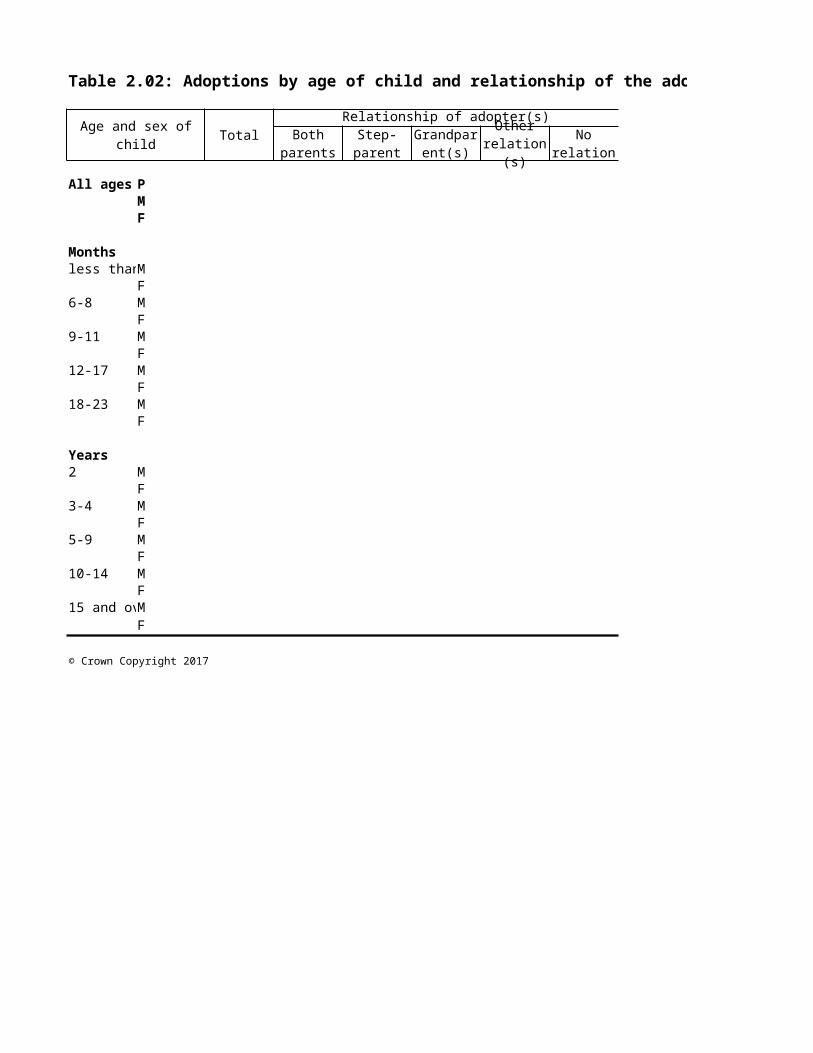
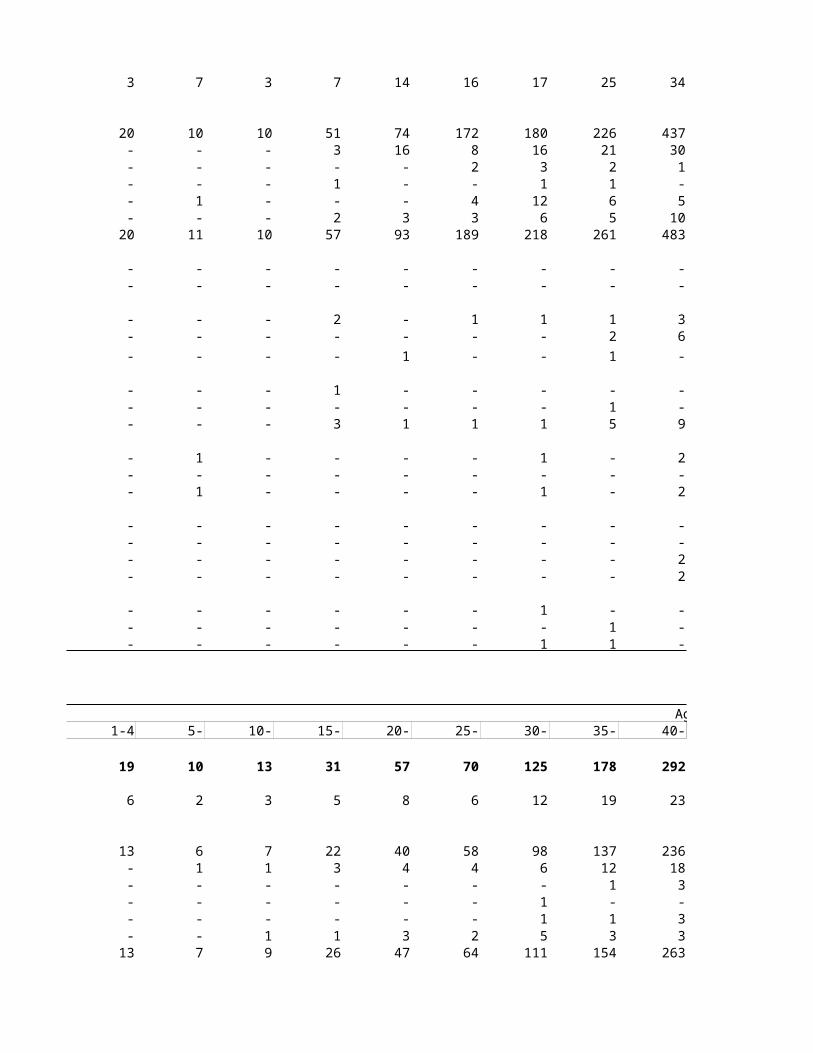
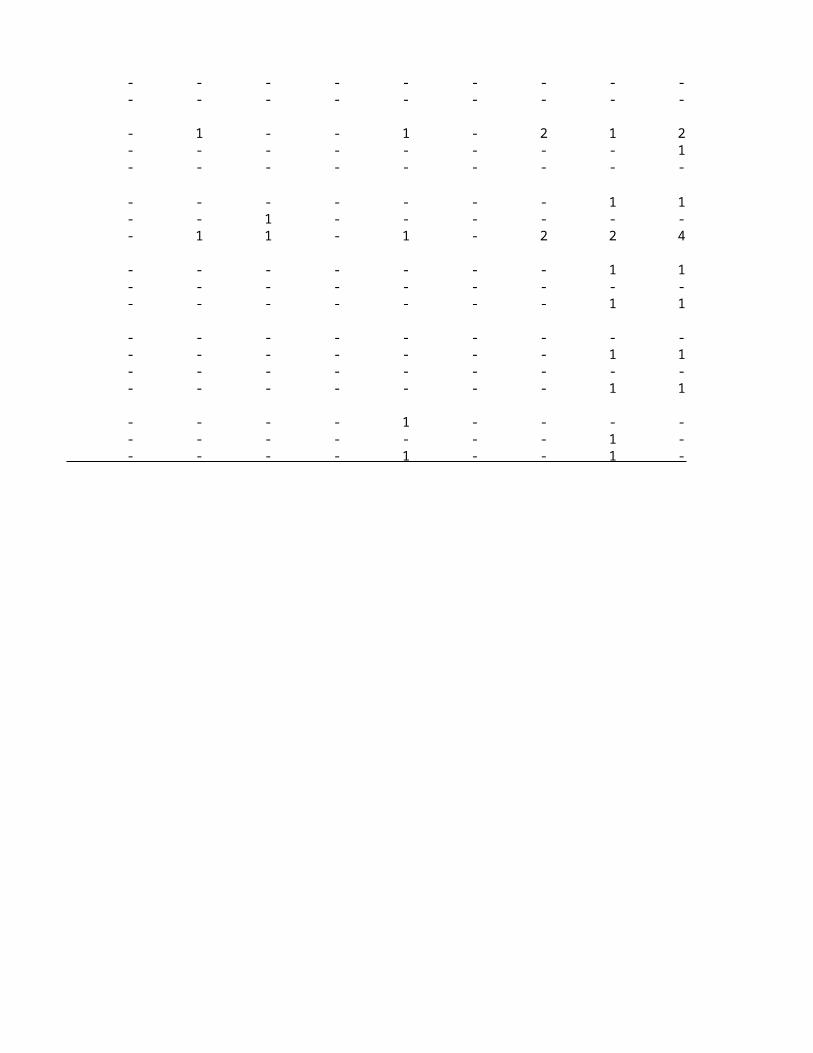
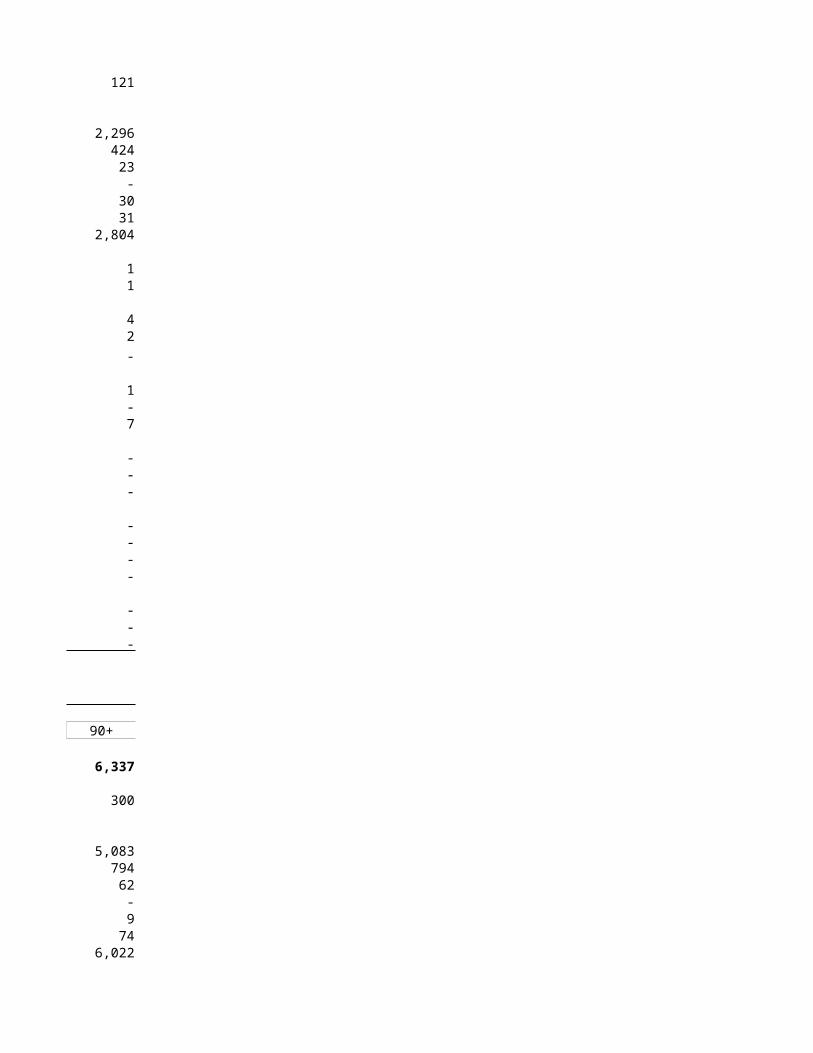
Table 2.02: Adoptions by age of child and relationship of the adopter(s), 2016
Age and sex of child TotalRelationship of adopter(s)
All ages P 523 14 102 6 11 390M 264 10 41 4 2 207F 259 4 61 2 9 183
Monthsless than 6M 4 3 1 - - -
F 2 - 2 - - -6-8 M 6 3 2 - - 1
F 7 2 2 - - 39-11 M 6 1 - - - 5
F 6 - 2 - - 412-17 M 10 - 1 - - 9
F 11 - 3 - - 818-23 M 19 1 - - - 18
F 23 - - - 1 22
Years2 M 60 - 1 3 1 55
F 37 1 2 - 1 333-4 M 68 1 3 1 1 62
F 55 - 3 - 4 485-9 M 58 - 11 - - 47
F 82 1 20 2 2 5710-14 M 23 1 14 - - 8
F 23 - 16 - 1 615 and oveM 10 - 8 - - 2
F 13 - 11 - - 2
© Crown Copyright 2017
Both parents
Step-parent
Grandparent(s)
Other relation(s)
No relation
Page 23
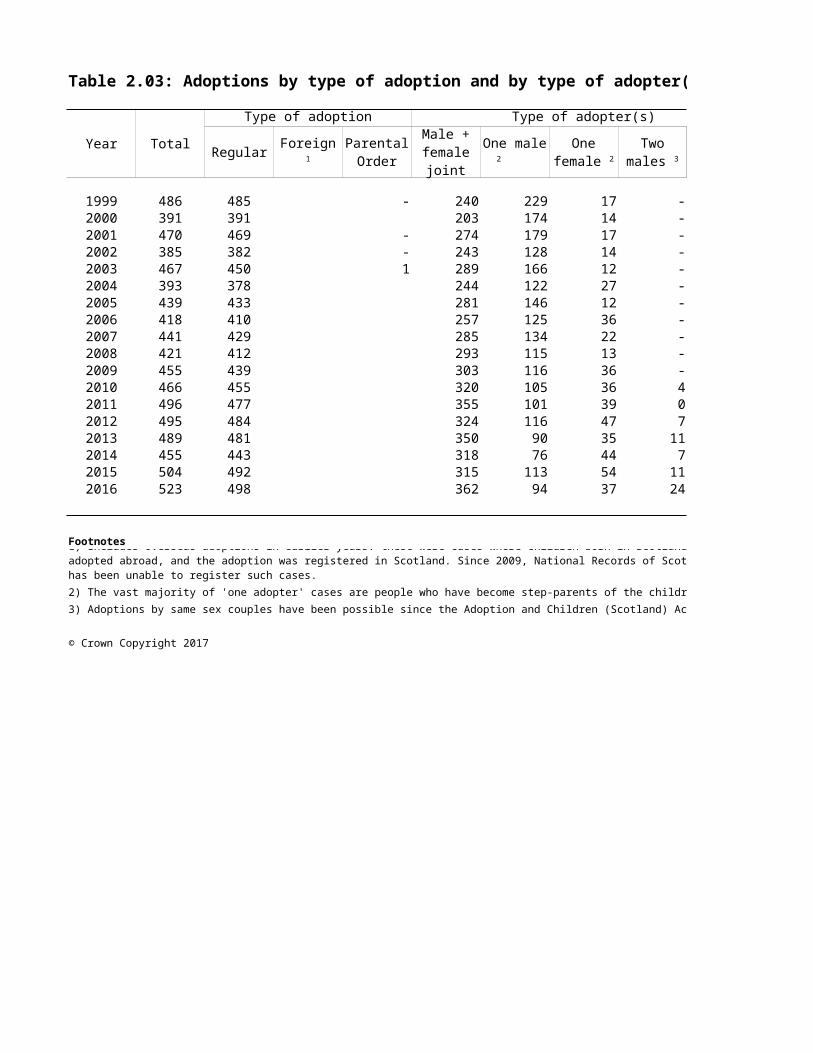
Table 2.03: Adoptions by type of adoption and by type of adopter(s), 1999 - 2016
Year Total
Type of adoption Type of adopter(s)
Regular
1999 486 485 1 - 240 229 17 - -2000 391 391 - - 203 174 14 - -2001 470 469 1 - 274 179 17 - -2002 385 382 3 - 243 128 14 - -2003 467 450 16 1 289 166 12 - -2004 393 378 11 4 244 122 27 - -2005 439 433 4 2 281 146 12 - -2006 418 410 5 3 257 125 36 - -2007 441 429 9 3 285 134 22 - -2008 421 412 7 2 293 115 13 - -2009 455 439 10 6 303 116 36 - -2010 466 455 3 8 320 105 36 4 12011 496 477 4 15 355 101 39 0 12012 495 484 2 9 324 116 47 7 12013 489 481 3 5 350 90 35 11 32014 455 443 3 9 318 76 44 7 102015 504 492 3 9 315 113 54 11 112016 523 498 7 18 362 94 37 24 6
Footnotes
2) The vast majority of 'one adopter' cases are people who have become step-parents of the children of their spouses or partners.
3) Adoptions by same sex couples have been possible since the Adoption and Children (Scotland) Act 2007 came into force on 28 Sept
© Crown Copyright 2017
Foreign 1 Parental Order
Male + female
joint
One male
2 One
female 2Two
males 3Two
females 3
1) Includes overseas adoptions in earlier years: these were cases where children born in Scotland were adopted abroad, and the adoption was registered in Scotland. Since 2009, National Records of Scotland (NRS) has been unable to register such cases.
Page 25
YearLive births by age of mother
All agesNumbers Percentages
<20 20-24 25-29 30-34 35-39 40-44 45+ NS <20 20-24 25-29 30-34 35-39 40-44 45+
All1946-50 101,222 3,921 25,658 31,500 21,987 13,764 3,904 255 232 3.9 25.3 31.1 21.7 13.6 3.9 0.3 1951-55 91,366 3,888 25,723 28,491 19,690 10,198 3,077 191 108 4.3 28.2 31.2 21.6 11.2 3.4 0.2 1956-60 98,663 5,381 29,870 30,997 19,419 10,226 2,569 160 41 5.5 30.3 31.4 19.7 10.4 2.6 0.2 1961-65 102,642 7,480 31,931 31,746 19,044 9,554 2,662 157 69 7.3 31.1 30.9 18.6 9.3 2.6 0.2 1966-70 93,033 9,170 31,707 27,672 15,089 7,284 1,960 126 27 9.9 34.1 29.7 16.2 7.8 2.1 0.1 1971-75 75,541 8,884 26,055 24,563 10,618 4,207 1,064 57 94 11.8 34.5 32.5 14.1 5.6 1.4 0.1 1976-80 65,758 7,191 21,489 22,733 10,655 2,920 592 31 148 10.9 32.7 34.6 16.2 4.4 0.9 0.0 1981-85 66,422 6,571 21,526 22,720 11,488 3,473 537 25 81 9.9 32.4 34.2 17.3 5.2 0.8 0.0 1986-90 65,544 6,050 18,452 23,565 12,978 3,827 563 23 87 9.2 28.2 36.0 19.8 5.8 0.9 0.0 1991-95 63,571 4,812 14,120 22,548 16,155 5,132 721 26 58 7.6 22.2 35.5 25.4 8.1 1.1 0.0
1996-2000 56,856 4,707 9,968 17,291 16,931 6,838 1,017 33 71 8.3 17.5 30.4 29.8 12.0 1.8 0.1 2001-05 52,914 4,227 9,594 13,108 16,075 8,366 1,450 48 45 8.0 18.1 24.8 30.4 15.8 2.7 0.1 2006-10 58,270 4,092 10,907 15,459 15,958 9,778 1,959 86 33 7.0 18.7 26.5 27.4 16.8 3.4 0.1 2011-15 56,891 2,759 9,715 15,636 17,252 9,286 2,075 131 35 4.8 17.1 27.5 30.3 16.3 3.6 0.2
Married parents1946-50 95,403 3,062 23,781 30,053 21,128 13,223 3,717 245 194 3.2 24.9 31.5 22.1 13.9 3.9 0.3 1951-55 87,106 3,216 24,406 27,527 18,980 9,772 2,935 181 89 3.7 28.0 31.6 21.8 11.2 3.4 0.2 1956-60 94,522 4,617 28,552 30,122 18,770 9,829 2,446 153 33 4.9 30.2 31.9 19.9 10.4 2.6 0.2 1961-65 97,338 6,228 30,226 30,663 18,379 9,122 2,517 148 54 6.4 31.1 31.5 18.9 9.4 2.6 0.2 1966-70 86,380 7,300 29,405 26,463 14,373 6,879 1,827 117 16 8.5 34.0 30.6 16.6 8.0 2.1 0.1 1971-75 68,967 6,645 23,828 23,425 10,040 3,915 982 54 78 9.6 34.5 34.0 14.6 5.7 1.4 0.1 1976-80 59,171 4,848 19,191 21,653 10,102 2,700 526 29 123 8.2 32.4 36.6 17.1 4.6 0.9 0.0 1981-85 56,337 3,329 17,781 20,886 10,661 3,145 468 21 45 5.9 31.6 37.1 18.9 5.6 0.8 0.0 1986-90 49,695 1,604 12,478 20,294 11,505 3,300 468 19 27 3.2 25.1 40.8 23.2 6.6 0.9 0.0 1991-95 43,809 603 7,082 17,724 13,618 4,177 561 22 22 1.4 16.2 40.5 31.1 9.5 1.3 0.1
1996-2000 34,573 264 3,214 11,710 13,347 5,254 723 25 35 0.8 9.3 33.9 38.6 15.2 2.1 0.1 2001-05 28,919 182 2,221 7,579 11,842 6,078 972 32 14 0.6 7.7 26.2 40.9 21.0 3.4 0.1 2006-10 29,419 109 1,977 7,987 11,167 6,865 1,251 55 8 0.4 6.7 27.1 38.0 23.3 4.3 0.2 2011-15 27,785 61 1,438 7,293 11,435 6,208 1,260 83 7 0.2 5.2 26.2 41.2 22.3 4.5 0.3
Unmarried parents1946-50 5,819 859 1,877 1,448 858 541 186 10 38 14.8 32.3 24.9 14.7 9.3 3.2 0.2 1951-55 4,259 672 1,317 964 710 426 142 9 19 15.8 30.9 22.6 16.7 10.0 3.3 0.2 1956-60 4,140 764 1,318 875 649 397 123 7 8 18.5 31.8 21.1 15.7 9.6 3.0 0.2 1961-65 5,304 1,252 1,705 1,083 664 432 145 9 14 23.6 32.1 20.4 12.5 8.1 2.7 0.2 1966-70 6,653 1,871 2,302 1,208 715 405 132 9 11 28.1 34.6 18.2 10.7 6.1 2.0 0.1 1971-75 6,575 2,239 2,227 1,138 578 292 82 3 16 34.1 33.9 17.3 8.8 4.4 1.2 0.0 1976-80 6,587 2,343 2,299 1,079 553 221 66 2 25 35.6 34.9 16.4 8.4 3.4 1.0 0.0 1981-85 10,085 3,243 3,745 1,834 827 328 69 3 36 32.2 37.1 18.2 8.2 3.3 0.7 0.0 1986-90 15,849 4,446 5,975 3,271 1,473 526 94 3 60 28.1 37.7 20.6 9.3 3.3 0.6 0.0 1991-95 19,762 4,210 7,038 4,823 2,537 955 160 4 36 21.3 35.6 24.4 12.8 4.8 0.8 0.0
1996-2000 22,283 4,443 6,754 5,581 3,584 1,583 293 8 37 19.9 30.3 25.0 16.1 7.1 1.3 0.0 2001-05 23,995 4,046 7,373 5,530 4,234 2,288 478 17 31 16.9 30.7 23.0 17.6 9.5 2.0 0.1 2006-10 28,851 3,983 8,930 7,472 4,791 2,913 707 31 24 13.8 31.0 25.9 16.6 10.1 2.5 0.1 2011-15 29,106 2,699 8,277 8,343 5,818 3,078 816 48 28 9.3 28.4 28.7 20.0 10.6 2.8 0.2
© Crown Copyright 2017
Table 3.01(a): Live births, numbers and percentages, by age of mother and marital status of parents, Scotland, 1946-50 to 2011-15
Page 26
YearLive births by age of mother
All agesNumbers Percentages
<20 20-24 25-29 30-34 35-39 40-44 45+ NS <20 20-24 25-29 30-34 35-39 40-44 45+
All2000 53,076 4,599 8,962 14,676 16,233 7,395 1,133 29 49 8.7 16.9 27.7 30.6 13.9 2.1 0.1 2001 52,527 4,444 9,121 13,763 16,206 7,701 1,224 40 28 8.5 17.4 26.2 30.9 14.7 2.3 0.1 2002 51,270 4,195 9,267 12,694 16,038 7,727 1,267 47 35 8.2 18.1 24.8 31.3 15.1 2.5 0.1 2003 52,432 4,155 9,626 12,725 16,085 8,310 1,432 39 60 7.9 18.4 24.3 30.7 15.8 2.7 0.1 2004 53,957 4,172 9,950 13,131 16,085 8,912 1,631 50 26 7.7 18.4 24.3 29.8 16.5 3.0 0.1 2005 54,386 4,171 10,008 13,229 15,962 9,179 1,694 66 77 7.7 18.4 24.3 29.3 16.9 3.1 0.1 2006 55,690 4,130 10,399 13,876 15,878 9,535 1,775 58 39 7.4 18.7 24.9 28.5 17.1 3.2 0.1 2007 57,781 4,304 10,913 14,918 15,622 10,035 1,849 83 57 7.4 18.9 25.8 27.0 17.4 3.2 0.1 2008 60,041 4,279 11,373 16,171 16,028 10,025 2,044 95 26 7.1 18.9 26.9 26.7 16.7 3.4 0.2 2009 59,046 3,990 11,188 16,178 15,835 9,695 2,045 95 20 6.8 18.9 27.4 26.8 16.4 3.5 0.2 2010 58,791 3,755 10,660 16,152 16,426 9,599 2,080 98 21 6.4 18.1 27.5 27.9 16.3 3.5 0.2 2011 58,590 3,387 10,619 15,879 16,868 9,513 2,155 123 46 5.8 18.1 27.1 28.8 16.2 3.7 0.2 2012 58,027 3,074 10,272 16,028 17,262 9,147 2,093 106 45 5.3 17.7 27.6 29.7 15.8 3.6 0.2 2013 56,014 2,763 9,767 15,228 17,032 8,973 2,098 136 17 4.9 17.4 27.2 30.4 16.0 3.7 0.2 2014 56,725 2,446 9,273 15,731 17,647 9,345 2,075 148 60 4.3 16.3 27.7 31.1 16.5 3.7 0.3 2015 55,098 2,126 8,643 15,315 17,453 9,454 1,956 143 8 3.9 15.7 27.8 31.7 17.2 3.6 0.3 2016 54,488 1,974 8,282 14,976 17,490 9,556 2,056 137 17 3.6 15.2 27.5 32.1 17.5 3.8 0.3
Married parents2000 30,451 202 2,295 9,213 12,374 5,552 765 24 26 0.7 7.5 30.3 40.6 18.2 2.5 0.1 2001 29,767 218 2,311 8,394 12,215 5,749 846 20 14 0.7 7.8 28.2 41.0 19.3 2.8 0.1 2002 28,736 178 2,297 7,589 12,019 5,714 891 33 15 0.6 8.0 26.4 41.8 19.9 3.1 0.1 2003 28,568 161 2,248 7,311 11,810 6,064 928 29 17 0.6 7.9 25.6 41.3 21.2 3.2 0.1 2004 28,755 181 2,150 7,300 11,627 6,387 1,072 34 4 0.6 7.5 25.4 40.4 22.2 3.7 0.1 2005 28,769 171 2,101 7,300 11,537 6,475 1,121 43 21 0.6 7.3 25.4 40.1 22.5 3.9 0.1 2006 29,106 130 2,160 7,486 11,358 6,791 1,144 31 6 0.4 7.4 25.7 39.0 23.3 3.9 0.1 2007 29,404 134 2,043 7,861 11,042 7,059 1,202 50 13 0.5 6.9 26.7 37.6 24.0 4.1 0.2 2008 29,986 98 2,021 8,354 11,163 7,002 1,279 61 8 0.3 6.7 27.9 37.2 23.4 4.3 0.2 2009 29,336 94 1,939 8,164 10,977 6,786 1,303 65 8 0.3 6.6 27.8 37.4 23.1 4.4 0.2 2010 29,263 88 1,722 8,069 11,295 6,687 1,328 68 6 0.3 5.9 27.6 38.6 22.9 4.5 0.2 2011 28,702 76 1,666 7,644 11,318 6,552 1,358 78 10 0.3 5.8 26.6 39.4 22.8 4.7 0.3 2012 28,232 57 1,599 7,618 11,439 6,135 1,311 63 10 0.2 5.7 27.0 40.5 21.7 4.6 0.2 2013 27,198 58 1,441 7,078 11,302 5,981 1,249 84 5 0.2 5.3 26.0 41.6 22.0 4.6 0.3 2014 27,904 57 1,291 7,279 11,746 6,173 1,248 100 10 0.2 4.6 26.1 42.1 22.1 4.5 0.4 2015 26,888 55 1,194 6,846 11,369 6,201 1,133 89 1 0.2 4.4 25.5 42.3 23.1 4.2 0.3 2016 26,761 46 1,165 6,653 11,343 6,254 1,212 81 7 0.2 4.4 24.9 42.4 23.4 4.5 0.3
Unmarried parents2000 22,625 4,397 6,667 5,463 3,859 1,843 368 5 23 19.4 29.5 24.1 17.1 8.1 1.6 0.0 2001 22,760 4,226 6,810 5,369 3,991 1,952 378 20 14 18.6 29.9 23.6 17.5 8.6 1.7 0.1 2002 22,534 4,017 6,970 5,105 4,019 2,013 376 14 20 17.8 30.9 22.7 17.8 8.9 1.7 0.1 2003 23,864 3,994 7,378 5,414 4,275 2,246 504 10 43 16.7 30.9 22.7 17.9 9.4 2.1 0.0 2004 25,202 3,991 7,800 5,831 4,458 2,525 559 16 22 15.8 30.9 23.1 17.7 10.0 2.2 0.1 2005 25,617 4,000 7,907 5,929 4,425 2,704 573 23 56 15.6 30.9 23.1 17.3 10.6 2.2 0.1 2006 26,584 4,000 8,239 6,390 4,520 2,744 631 27 33 15.0 31.0 24.0 17.0 10.3 2.4 0.1 2007 28,377 4,170 8,870 7,057 4,580 2,976 647 33 44 14.7 31.3 24.9 16.1 10.5 2.3 0.1 2008 30,055 4,181 9,352 7,817 4,865 3,023 765 34 18 13.9 31.1 26.0 16.2 10.1 2.5 0.1 2009 29,710 3,896 9,249 8,014 4,858 2,909 742 30 12 13.1 31.1 27.0 16.4 9.8 2.5 0.1 2010 29,528 3,667 8,938 8,083 5,131 2,912 752 30 15 12.4 30.3 27.4 17.4 9.9 2.5 0.1 2011 29,888 3,311 8,953 8,235 5,550 2,961 797 45 36 11.1 30.0 27.6 18.6 9.9 2.7 0.2 2012 29,795 3,017 8,673 8,410 5,823 3,012 782 43 35 10.1 29.1 28.2 19.5 10.1 2.6 0.1 2013 28,816 2,705 8,326 8,150 5,730 2,992 849 52 12 9.4 28.9 28.3 19.9 10.4 2.9 0.2 2014 28,821 2,389 7,982 8,452 5,901 3,172 827 48 50 8.3 27.7 29.3 20.5 11.0 2.9 0.2 2015 28,210 2,071 7,449 8,469 6,084 3,253 823 54 7 7.3 26.4 30.0 21.6 11.5 2.9 0.2 2016 27,727 1,928 7,117 8,323 6,147 3,302 844 56 10 7.0 25.7 30.0 22.2 11.9 3.0 0.2
© Crown Copyright 2017
Table 3.01(b): Live births, numbers and percentages, by age of mother and marital status of parents, Scotland, 2000 to 2016
Page 27
Year
Number Percentages
To unmarried parents To unmarried parents
Joint registration Joint registrationSame address Same address
1974 70,092 63,743 2,755 3,594 90.9 3.9 5.1 1975 67,943 61,636 2,863 3,444 90.7 4.2 5.1 1976 64,895 58,870 2,816 3,209 90.7 4.3 4.9 1977 62,342 56,374 2,950 3,018 90.4 4.7 4.8 1978 64,294 57,991 3,232 3,071 90.2 5.0 4.8 1979 68,366 61,406 3,654 3,306 89.8 5.3 4.8 1980 68,890 61,212 4,308 3,370 88.9 6.3 4.9 1981 69,054 60,607 4,848 3,599 87.8 7.0 5.2 1982 66,196 56,801 5,476 3,919 85.8 8.3 5.9 1983 65,078 55,497 5,766 3,815 85.3 8.9 5.9 1984 65,106 54,466 6,688 3,952 83.7 10.3 6.1 1985 66,676 54,314 7,959 4,403 81.5 11.9 6.6 1986 65,812 52,265 9,060 4,487 79.4 13.8 6.8 1987 66,241 51,116 10,479 4,646 77.2 15.8 7.0 1988 66,212 49,988 11,472 4,752 75.5 17.3 7.2 1989 63,480 47,004 11,919 4,557 74.0 18.8 7.2 1990 65,973 48,100 13,134 4,739 72.9 19.9 7.2 1991 67,024 47,507 14,589 4,928 70.9 21.8 7.4 1992 65,789 45,839 15,272 4,678 69.7 23.2 7.1 1993 63,337 43,482 15,560 4,295 68.7 24.6 6.8 1994 61,656 42,432 15,085 4,139 68.8 24.5 6.7 1995 60,051 39,785 16,207 4,059 66.3 27.0 6.8 1996 59,296 37,936 11,706 5,458 4,196 64.0 19.7 9.2 7.1 1997 59,440 37,052 12,809 5,354 4,225 62.3 21.5 9.0 7.1 1998 57,319 35,000 13,085 5,156 4,078 61.1 22.8 9.0 7.1 1999 55,147 32,425 13,722 5,069 3,931 58.8 24.9 9.2 7.1 2000 53,076 30,451 14,040 4,841 3,744 57.4 26.5 9.1 7.1 2001 52,527 29,767 14,384 4,834 3,542 56.7 27.4 9.2 6.7 2002 51,270 28,736 14,435 4,845 3,254 56.0 28.2 9.4 6.3 2003 52,432 28,568 15,420 5,122 3,322 54.5 29.4 9.8 6.3 2004 53,957 28,755 16,480 5,364 3,358 53.3 30.5 9.9 6.2 2005 54,386 28,769 16,692 5,736 3,189 52.9 30.7 10.5 5.9 2006 55,690 29,106 17,498 5,827 3,259 52.3 31.4 10.5 5.9 2007 57,781 29,404 18,774 6,215 3,388 50.9 32.5 10.8 5.9 2008 60,041 29,986 20,180 6,564 3,311 49.9 33.6 10.9 5.5 2009 59,046 29,336 19,840 6,652 3,218 49.7 33.6 11.3 5.4 2010 58,791 29,263 19,695 6,711 3,122 49.8 33.5 11.4 5.3 2011 58,590 28,702 19,884 6,881 3,123 49.0 33.9 11.7 5.3 2012 58,027 28,232 19,729 7,057 3,009 48.7 34.0 12.2 5.2 2013 56,014 27,198 19,330 6,701 2,785 48.6 34.5 12.0 5.0 2014 56,725 27,904 19,754 6,464 2,603 49.2 34.8 11.4 4.6 2015 55,098 26,888 19,351 6,342 2,517 48.8 35.1 11.5 4.6 2016 54,488 26,761 19,394 6,012 2,321 49.1 35.6 11.0 4.3
Footnote
© Crown Copyright 2017
Table 3.02: Live births, numbers and percentages, by marital status of parents and type of registration1, Scotland, 1974 to 2016
All live births
To married parents
To married parentsSole
reg'nSole reg'nDifferent
addressDifferent address
1) Refer to the vital events reference tables Notes and Definitions.
Page 28
Year
Live births by age of motherNumbers Percentages
All ages 20-24 25-29 30-34 20-24 25-29 30-34
1974 Total 6,349 2,313 2,115 1,058 521 342 100.0 100.0 100.0 100.0 100.0 100.0 Joint 2,755 569 892 677 383 234 43.4 24.6 42.2 64.0 73.5 68.4 Sole 3,594 1,744 1,223 381 138 108 56.6 75.4 57.8 36.0 26.5 31.6
1975 Total 6,307 2,297 2,066 1,107 480 357 100.0 100.0 100.0 100.0 100.0 100.0 Joint 2,863 635 931 701 348 248 45.4 27.6 45.1 63.3 72.5 69.5 Sole 3,444 1,662 1,135 406 132 109 54.6 72.4 54.9 36.7 27.5 30.5
1976 Total 6,025 2,191 2,047 963 483 341 100.0 100.0 100.0 100.0 100.0 100.0 Joint 2,816 623 998 629 339 227 46.7 28.4 48.8 65.3 70.2 66.6 Sole 3,209 1,568 1,049 334 144 114 53.3 71.6 51.2 34.7 29.8 33.4
1977 Total 5,968 2,181 2,042 939 497 309 100.0 100.0 100.0 100.0 100.0 100.0 Joint 2,950 707 1,033 655 348 207 49.4 32.4 50.6 69.8 70.0 67.0 Sole 3,018 1,474 1,009 284 149 102 50.6 67.6 49.4 30.2 30.0 33.0
1978 Total 6,303 2,237 2,261 1,000 527 278 100.0 100.0 100.0 100.0 100.0 100.0 Joint 3,232 772 1,191 671 385 213 51.3 34.5 52.7 67.1 73.1 76.6 Sole 3,071 1,465 1,070 329 142 65 48.7 65.5 47.3 32.9 26.9 23.4
1979 Total 6,960 2,464 2,441 1,142 600 313 100.0 100.0 100.0 100.0 100.0 100.0 Joint 3,654 896 1,304 786 454 214 52.5 36.4 53.4 68.8 75.7 68.4 Sole 3,306 1,568 1,137 356 146 99 47.5 63.6 46.6 31.2 24.3 31.6
1980 Total 7,678 2,642 2,702 1,352 659 323 100.0 100.0 100.0 100.0 100.0 100.0 Joint 4,308 1,076 1,493 970 521 248 56.1 40.7 55.3 71.7 79.1 76.8 Sole 3,370 1,566 1,209 382 138 75 43.9 59.3 44.7 28.3 20.9 23.2
1981 Total 8,447 2,685 3,144 1,508 726 384 100.0 100.0 100.0 100.0 100.0 100.0 Joint 4,848 1,121 1,834 1,070 540 283 57.4 41.8 58.3 71.0 74.4 73.7 Sole 3,599 1,564 1,310 438 186 101 42.6 58.2 41.7 29.0 25.6 26.3
1982 Total 9,395 3,100 3,462 1,639 789 405 100.0 100.0 100.0 100.0 100.0 100.0 Joint 5,476 1,403 2,032 1,150 594 297 58.3 45.3 58.7 70.2 75.3 73.3 Sole 3,919 1,697 1,430 489 195 108 41.7 54.7 41.3 29.8 24.7 26.7
1983 Total 9,581 3,141 3,576 1,685 737 442 100.0 100.0 100.0 100.0 100.0 100.0 Joint 5,766 1,499 2,153 1,193 576 345 60.2 47.7 60.2 70.8 78.2 78.1 Sole 3,815 1,642 1,423 492 161 97 39.8 52.3 39.8 29.2 21.8 21.9
1984 Total 10,640 3,409 3,880 2,018 876 457 100.0 100.0 100.0 100.0 100.0 100.0 Joint 6,688 1,784 2,434 1,473 653 344 62.9 52.3 62.7 73.0 74.5 75.3 Sole 3,952 1,625 1,446 545 223 113 37.1 47.7 37.3 27.0 25.5 24.7
1985 Total 12,362 3,879 4,663 2,320 1,006 494 100.0 100.0 100.0 100.0 100.0 100.0 Joint 7,959 2,117 2,999 1,698 788 357 64.4 54.6 64.3 73.2 78.3 72.3 Sole 4,403 1,762 1,664 622 218 137 35.6 45.4 35.7 26.8 21.7 27.7
1986 Total 13,547 4,221 5,097 2,547 1,158 524 100.0 100.0 100.0 100.0 100.0 100.0 Joint 9,060 2,457 3,435 1,878 895 395 66.9 58.2 67.4 73.7 77.3 75.4 Sole 4,487 1,764 1,662 669 263 129 33.1 41.8 32.6 26.3 22.7 24.6
1987 Total 15,125 4,493 5,758 2,902 1,351 621 100.0 100.0 100.0 100.0 100.0 100.0 Joint 10,479 2,713 4,046 2,182 1,070 468 69.3 60.4 70.3 75.2 79.2 75.4 Sole 4,646 1,780 1,712 720 281 153 30.7 39.6 29.7 24.8 20.8 24.6
1988 Total 16,224 4,558 6,117 3,377 1,462 710 100.0 100.0 100.0 100.0 100.0 100.0 Joint 11,472 2,870 4,325 2,570 1,160 547 70.7 63.0 70.7 76.1 79.3 77.0 Sole 4,752 1,688 1,792 807 302 163 29.3 37.0 29.3 23.9 20.7 23.0
1989 Total 16,476 4,459 6,171 3,513 1,568 765 100.0 100.0 100.0 100.0 100.0 100.0 Joint 11,919 2,791 4,523 2,762 1,260 583 72.3 62.6 73.3 78.6 80.4 76.2 Sole 4,557 1,668 1,648 751 308 182 27.7 37.4 26.7 21.4 19.6 23.8
1990 Total 17,873 4,500 6,730 4,016 1,826 801 100.0 100.0 100.0 100.0 100.0 100.0 Joint 13,134 2,802 5,035 3,193 1,452 652 73.5 62.3 74.8 79.5 79.5 81.4 Sole 4,739 1,698 1,695 823 374 149 26.5 37.7 25.2 20.5 20.5 18.6
Table 3.03: Live births outside marriage, numbers and percentages, age of mother and type of registration1, Scotland, 1974 to 2016
Type of Registration (sole or joint) Under
2035 and over 2
All ages
Under 20
35 and over 2
Page 29
Year
Live births by age of motherNumbers Percentages
All ages 20-24 25-29 30-34 20-24 25-29 30-34
Type of Registration (sole or joint) Under
2035 and over 2
All ages
Under 20
35 and over 2
1991 Total 19,517 4,625 7,357 4,446 2,126 963 100.0 100.0 100.0 100.0 100.0 100.0 Joint 14,589 2,931 5,541 3,581 1,759 777 74.8 63.4 75.3 80.5 82.7 80.7 Sole 4,928 1,694 1,816 865 367 186 25.2 36.6 24.7 19.5 17.3 19.3
1992 Total 19,950 4,449 7,255 4,785 2,378 1,083 100.0 100.0 100.0 100.0 100.0 100.0 Joint 15,272 2,978 5,538 3,912 1,957 887 76.6 66.9 76.3 81.8 82.3 81.9 Sole 4,678 1,471 1,717 873 421 196 23.4 33.1 23.7 18.2 17.7 18.1
1993 Total 19,855 4,200 7,018 4,881 2,612 1,144 100.0 100.0 100.0 100.0 100.0 100.0 Joint 15,560 2,865 5,500 4,036 2,184 975 78.4 68.2 78.4 82.7 83.6 85.2 Sole 4,295 1,335 1,518 845 428 169 21.6 31.8 21.6 17.3 16.4 14.8
1994 Total 19,224 3,844 6,687 4,866 2,641 1,186 100.0 100.0 100.0 100.0 100.0 100.0 Joint 15,085 2,606 5,241 4,018 2,227 993 78.5 67.8 78.4 82.6 84.3 83.7 Sole 4,139 1,238 1,446 848 414 193 21.5 32.2 21.6 17.4 15.7 16.3
1995 Total 20,266 3,930 6,872 5,139 2,930 1,395 100.0 100.0 100.0 100.0 100.0 100.0 Joint 16,207 2,710 5,548 4,268 2,474 1,207 80.0 69.0 80.7 83.1 84.4 86.5 Sole 4,059 1,220 1,324 871 456 188 20.0 31.0 19.3 16.9 15.6 13.5
1996 Total 21,360 4,228 6,792 5,538 3,164 1,638 100.0 100.0 100.0 100.0 100.0 100.0 Joint 17,164 2,993 5,421 4,610 2,729 1,411 80.4 70.8 79.8 83.2 86.3 86.1 Sole 4,196 1,235 1,371 928 435 227 19.6 29.2 20.2 16.8 13.7 13.9
1997 Total 22,388 4,529 6,884 5,710 3,463 1,802 100.0 100.0 100.0 100.0 100.0 100.0 Joint 18,163 3,205 5,535 4,843 3,030 1,550 81.1 70.8 80.4 84.8 87.5 86.0 Sole 4,225 1,324 1,349 867 433 252 18.9 29.2 19.6 15.2 12.5 14.0
1998 Total 22,319 4,538 6,651 5,588 3,606 1,936 100.0 100.0 100.0 100.0 100.0 100.0 Joint 18,241 3,270 5,373 4,788 3,134 1,676 81.7 72.1 80.8 85.7 86.9 86.6 Sole 4,078 1,268 1,278 800 472 260 18.3 27.9 19.2 14.3 13.1 13.4
1999 Total 22,722 4,521 6,774 5,607 3,828 1,992 100.0 100.0 100.0 100.0 100.0 100.0 Joint 18,791 3,333 5,548 4,857 3,333 1,720 82.7 73.7 81.9 86.6 87.1 86.3 Sole 3,931 1,188 1,226 750 495 272 17.3 26.3 18.1 13.4 12.9 13.7
2000 Total 22,625 4,397 6,667 5,463 3,859 2,239 100.0 100.0 100.0 100.0 100.0 100.0 Joint 18,881 3,214 5,565 4,748 3,399 1,955 83.5 73.1 83.5 86.9 88.1 87.3 Sole 3,744 1,183 1,102 715 460 284 16.5 26.9 16.5 13.1 11.9 12.7
2001 Total 22,760 4,226 6,810 5,369 3,991 2,364 100.0 100.0 100.0 100.0 100.0 100.0 Joint 19,218 3,152 5,710 4,690 3,561 2,105 84.4 74.6 83.8 87.4 89.2 89.0 Sole 3,542 1,074 1,100 679 430 259 15.6 25.4 16.2 12.6 10.8 11.0
2002 Total 22,534 4,017 6,970 5,105 4,019 2,423 100.0 100.0 100.0 100.0 100.0 100.0 Joint 19,280 3,059 5,940 4,531 3,593 2,157 85.6 76.2 85.2 88.8 89.4 89.0 Sole 3,254 958 1,030 574 426 266 14.4 23.8 14.8 11.2 10.6 11.0
2003 Total 23,864 3,994 7,378 5,414 4,275 2,803 100.0 100.0 100.0 100.0 100.0 100.0 Joint 20,542 3,039 6,292 4,822 3,860 2,529 86.1 76.1 85.3 89.1 90.3 90.2 Sole 3,322 955 1,086 592 415 274 13.9 23.9 14.7 10.9 9.7 9.8
2004 Total 25,202 3,991 7,800 5,831 4,458 3,122 100.0 100.0 100.0 100.0 100.0 100.0 Joint 21,844 3,029 6,713 5,230 4,040 2,832 86.7 75.9 86.1 89.7 90.6 90.7 Sole 3,358 962 1,087 601 418 290 13.3 24.1 13.9 10.3 9.4 9.3
2005 Total 25,617 4,000 7,907 5,929 4,425 3,356 100.0 100.0 100.0 100.0 100.0 100.0 Joint 22,428 3,104 6,879 5,335 4,041 3,069 87.6 77.6 87.0 90.0 91.3 91.4 Sole 3,189 896 1,028 594 384 287 12.4 22.4 13.0 10.0 8.7 8.6
2006 Total 26,584 4,000 8,239 6,390 4,520 3,435 100.0 100.0 100.0 100.0 100.0 100.0 Joint 23,325 3,199 7,152 5,759 4,092 3,123 87.7 80.0 86.8 90.1 90.5 90.9 Sole 3,259 801 1,087 631 428 312 12.3 20.0 13.2 9.9 9.5 9.1
2007 Total 28,377 4,170 8,870 7,057 4,580 3,700 100.0 100.0 100.0 100.0 100.0 100.0 Joint 24,989 3,318 7,746 6,367 4,172 3,386 88.1 79.6 87.3 90.2 91.1 91.5 Sole 3,388 852 1,124 690 408 314 11.9 20.4 12.7 9.8 8.9 8.5
2008 Total 30,055 4,181 9,352 7,817 4,865 3,840 100.0 100.0 100.0 100.0 100.0 100.0 Joint 26,744 3,347 8,286 7,082 4,510 3,519 89.0 80.1 88.6 90.6 92.7 91.6 Sole 3,311 834 1,066 735 355 321 11.0 19.9 11.4 9.4 7.3 8.4
2009 Total 29,710 3,896 9,249 8,014 4,858 3,693 100.0 100.0 100.0 100.0 100.0 100.0 Joint 26,492 3,119 8,233 7,282 4,468 3,390 89.2 80.1 89.0 90.9 92.0 91.8 Sole 3,218 777 1,016 732 390 303 10.8 19.9 11.0 9.1 8.0 8.2
Page 30
Year
Live births by age of motherNumbers Percentages
All ages 20-24 25-29 30-34 20-24 25-29 30-34
Type of Registration (sole or joint) Under
2035 and over 2
All ages
Under 20
35 and over 2
2010 Total 29,528 3,667 8,938 8,083 5,131 3,709 100.0 100.0 100.0 100.0 100.0 100.0 Joint 26,406 2,933 7,964 7,419 4,717 3,373 89.4 80.0 89.1 91.8 91.9 90.9 Sole 3,122 734 974 664 414 336 10.6 20.0 10.9 8.2 8.1 9.1
2011 Total 29,888 3,311 8,953 8,235 5,550 3,839 100.0 100.0 100.0 100.0 100.0 100.0 Joint 26,765 2,651 7,952 7,549 5,126 3,487 89.6 80.1 88.8 91.7 92.4 90.8 Sole 3,123 660 1,001 686 424 352 10.4 19.9 11.2 8.3 7.6 9.2
2012 Total 29,795 3,017 8,673 8,410 5,823 3,872 100.0 100.0 100.0 100.0 100.0 100.0 Joint 26,786 2,425 7,757 7,708 5,346 3,550 89.9 80.4 89.4 91.7 91.8 91.7 Sole 3,009 592 916 702 477 322 10.1 19.6 10.6 8.3 8.2 8.3
2013 Total 28,816 2,705 8,326 8,150 5,730 3,905 100.0 100.0 100.0 100.0 100.0 100.0 Joint 26,031 2,159 7,527 7,499 5,284 3,562 90.3 79.8 90.4 92.0 92.2 91.2 Sole 2,785 546 799 651 446 343 9.7 20.2 9.6 8.0 7.8 8.8
2014 Total 28,821 2,389 7,982 8,452 5,901 4,097 100.0 100.0 100.0 100.0 100.0 100.0 Joint 26,218 1,931 7,216 7,849 5,468 3,754 91.0 80.8 90.4 92.9 92.7 91.6 Sole 2,603 458 766 603 433 343 9.0 19.2 9.6 7.1 7.3 8.4
2015 Total 28,210 2,071 7,449 8,469 6,084 4,137 100.0 100.0 100.0 100.0 100.0 100.0 Joint 25,693 1,640 6,709 7,877 5,652 3,815 91.1 79.2 90.1 93.0 92.9 92.2 Sole 2,517 431 740 592 432 322 8.9 20.8 9.9 7.0 7.1 7.8
2016 Total 27,727 1,928 7,117 8,323 6,147 4,212 100.0 100.0 100.0 100.0 100.0 100.0 Joint 25,406 1,564 6,478 7,769 5,710 3,885 91.6 81.1 91.0 93.3 92.9 92.2 Sole 2,321 364 639 554 437 327 8.4 18.9 9.0 6.7 7.1 7.8
Footnotes
2) Includes age not stated.
© Crown Copyright 2017
1) Refer to the vital events reference tables Notes and Definitions.
Page 31
Year Crude birth rate Total fertility rate
1971 16.6 1.230 1.196 85.8 2.531972 15.0 1.109 1.079 77.7 2.271973 14.2 1.026 0.998 73.1 2.131974 13.4 0.966 0.940 68.2 1.971975 13.0 0.920 0.897 65.8 1.901976 12.4 0.864 0.844 62.2 1.801977 11.9 0.831 0.812 59.1 1.701978 12.3 0.851 0.832 60.3 1.741979 13.1 0.891 0.872 63.4 1.841980 13.3 0.895 0.877 63.3 1.841981 13.3 0.893 0.877 63.1 1.841982 12.8 0.848 0.831 60.1 1.741983 12.6 0.821 0.805 58.7 1.701984 12.7 0.825 0.810 58.3 1.681985 13.0 0.832 0.816 59.5 1.701986 12.9 0.813 0.798 58.5 1.681987 13.0 0.820 0.806 58.8 1.681988 13.0 0.821 0.808 59.1 1.681989 12.5 0.791 0.779 56.7 1.611990 13.0 0.816 0.803 58.8 1.671991 13.2 0.830 0.817 59.8 1.691992 12.9 0.824 0.812 59.3 1.671993 12.4 0.796 0.784 57.4 1.621994 12.1 0.779 0.768 56.0 1.581995 11.8 0.764 0.752 54.6 1.551996 11.6 0.755 0.744 54.1 1.561997 11.7 0.772 0.761 54.4 1.581998 11.3 0.754 0.744 52.7 1.551999 10.9 0.742 0.731 50.9 1.512000 10.5 0.723 0.713 49.2 1.482001 10.4 0.727 0.717 48.8 1.492002 10.1 0.717 0.707 47.9 1.472003 10.3 0.740 0.730 49.2 1.522004 10.6 0.766 0.756 50.7 1.582005 10.6 0.769 0.759 51.1 1.602006 10.8 0.800 0.790 52.3 1.642007 11.2 0.823 0.812 54.2 1.702008 11.5 0.864 0.853 56.4 1.772009 11.3 0.845 0.835 55.6 1.732010 11.2 0.843 0.832 55.6 1.722011 11.1 0.823 0.812 55.4 1.692012 10.9 0.815 0.806 55.2 1.672013 10.5 0.781 0.772 53.7 1.612014 10.6 0.791 0.782 54.7 1.622015 10.3 0.759 0.750 53.2 1.562016 10.1 0.737 0.729 52.6 1.52
Footnote
© Crown Copyright 2017
Table 3.04: Birth rate, gross and net reproduction rates and general and total fertility rates1, Scotland, 1971 to 2016
Gross reproduction rate
Net reproduction rate
General fertility rate
1) Refer to the vital events reference tables Notes and Definitions.
Page 32
Table 3.05: Fertility rates by age of mother, Scotland, 1971 to 2016
Year15-19 20-24 25-29 30-34 35-39 40-44
All (per 1,000 women)1971 85.8 47.5 162.9 163.8 84.5 36.4 9.6 1976 62.2 35.3 115.6 124.3 57.3 19.2 4.6 1981 63.1 30.5 112.3 131.3 66.2 20.8 3.9 1986 58.5 30.8 91.3 119.9 69.9 20.3 3.6
1991 59.8 33.3 82.3 116.5 78.3 26.8 4.0 1992 59.3 33.1 77.7 113.6 80.7 27.8 4.0 1993 57.4 31.2 72.5 110.0 79.8 28.0 4.3 1994 56.0 28.5 68.2 106.5 81.3 28.8 4.5 1995 54.6 28.2 66.6 101.3 80.6 30.4 4.9 1996 54.1 29.7 64.5 98.5 81.9 31.4 5.4 1997 54.4 31.0 65.5 97.4 83.9 34.0 5.4 1998 52.7 30.6 62.8 94.3 83.2 34.1 5.9 1999 50.9 30.3 61.0 90.4 82.0 34.3 6.1 2000 49.2 29.3 57.6 86.5 81.3 35.6 6.1 2001 48.8 28.4 57.8 85.1 82.2 36.9 6.5 2002 47.9 26.7 57.3 82.6 83.3 37.0 6.6 2003 49.2 26.3 58.6 85.3 86.5 40.1 7.3 2004 50.7 26.3 60.0 87.8 90.0 43.4 8.2 2005 51.1 26.2 59.1 86.7 92.3 45.4 8.4 2006 52.3 25.8 60.9 88.3 95.9 47.6 8.7 2007 54.2 26.5 63.3 90.6 98.1 50.9 9.2 2008 56.4 26.3 65.2 95.1 102.6 52.4 10.2 2009 55.6 24.3 63.8 93.8 100.7 52.6 10.3 2010 55.6 22.9 59.9 92.6 102.8 53.8 10.7 2011 55.4 21.1 57.9 90.2 102.8 55.4 11.2 2012 55.2 19.7 55.1 90.8 101.8 55.8 11.0 2013 53.7 18.1 52.6 85.5 98.1 56.1 11.6 2014 54.7 16.3 50.1 87.1 100.4 59.0 11.3 2015 53.2 14.3 46.8 83.6 98.1 58.1 11.7 2016 52.6 13.5 45.4 79.7 97.4 57.4 12.7
Footnote
All ages1 Age group1
1) Rates for age groups 15-19 and 40-44 include births at age under 15 and 45+ respectively. The all ages rate includes cases where the mother's age was not stated and is calculated using the number of women aged 15-44.
Page 33
Age of motherYear of experience Year of experience
1951 1964 1973 1974 1975 1976 1977 1978 1979 1980 1981 1982 1983 1984 1985 1986 1987 1988 1989 1990 1991 1992 1993
1 1 3 3 3 3 2 2 3 2 2 3 3 3 3 3 3 4 4 4 4 5 4 16 3 10 16 15 14 13 12 12 12 11 10 11 11 11 13 13 13 14 14 13 14 15 15 17 11 33 47 44 39 34 32 30 30 31 28 29 27 29 32 30 31 31 31 33 34 33 32 18 30 67 70 69 65 56 51 50 50 50 48 46 42 44 46 46 48 46 44 46 49 51 48 19 56 105 93 90 83 76 67 69 68 69 66 64 58 54 58 58 58 59 55 55 58 57 52 20 91 139 110 105 102 92 86 83 83 83 82 77 73 69 69 68 65 69 63 65 63 62 57 21 124 176 130 123 113 107 98 102 99 102 100 95 90 84 82 80 80 78 71 73 71 67 64 22 135 191 140 131 128 119 112 113 119 115 117 108 103 99 98 91 87 88 83 82 80 73 68 23 151 215 151 142 138 128 121 121 129 130 128 120 115 110 112 105 104 98 93 90 93 88 80 24 155 221 163 149 145 136 131 131 133 135 139 127 125 122 119 116 117 110 103 104 104 97 91 25 161 224 161 148 150 143 136 137 146 141 142 132 129 127 125 122 120 121 112 114 111 105 106 26 163 213 152 147 143 139 130 136 142 141 138 130 131 129 131 124 122 125 115 118 120 115 108 27 143 191 146 131 134 131 125 128 141 140 132 128 121 125 126 123 121 124 118 123 120 117 113 28 145 181 130 123 113 117 111 118 129 127 118 118 116 117 121 116 118 117 112 118 117 117 113 29 133 164 109 101 101 97 98 105 115 111 116 107 105 108 107 109 109 111 105 109 114 114 109 30 124 150 95 87 85 86 83 90 96 99 97 94 96 93 95 98 99 98 96 100 102 104 103 31 114 126 76 71 70 69 68 68 75 82 83 77 78 79 79 83 84 83 83 89 91 96 93 32 101 120 69 58 56 65 52 58 63 64 67 64 63 65 67 66 71 70 71 78 78 79 78 33 94 101 54 46 46 43 43 46 51 49 51 50 51 51 55 55 55 59 58 61 64 67 65 34 86 92 45 42 38 35 33 36 39 40 40 42 40 40 41 44 46 47 46 49 53 55 57 35 77 77 38 32 32 28 29 29 32 33 34 31 33 32 34 34 37 39 39 39 43 45 44 36 69 66 32 26 24 24 21 21 26 24 26 26 24 25 26 26 26 31 28 30 33 34 33 37 55 53 27 22 21 19 17 17 19 19 20 18 18 18 20 19 19 21 21 23 24 27 27 38 53 50 22 17 17 14 14 13 14 13 13 15 15 14 13 15 15 15 16 17 18 18 19 39 42 39 17 15 13 12 9 10 11 11 10 10 10 10 11 9 10 10 10 11 14 13 15 40 31 28 12 11 9 9 8 7 7 7 7 8 8 7 7 8 6 7 7 7 9 8 9 41 20 20 8 8 7 6 5 4 5 5 5 5 4 4 4 4 5 4 5 5 5 5 6 42 17 15 5 5 6 3 4 3 3 3 3 3 3 3 3 3 2 2 3 3 3 4 3 43 9 9 4 4 3 3 3 2 2 2 2 2 2 2 2 2 2 1 2 1 2 2 2
11 10 3 4 4 3 2 2 2 2 2 2 2 2 2 2 1 1 2 1 2 2 2
- 2.46 2.54 2.51 2.54 2.57 2.63 2.59 2.56 2.55 2.52 2.52 2.48 2.43 2.34 2.30 2.30 2.26 2.25 2.11 2.16 2.12
Total fertility rate 2.41 3.09 2.13 1.97 1.90 1.80 1.70 1.74 1.84 1.84 1.84 1.74 1.70 1.68 1.70 1.68 1.68 1.68 1.61 1.67 1.69 1.67 1.62
28.6 27.4 26.0 25.9 26.0 26.0 26.1 26.2 26.3 26.3 26.3 26.3 26.4 26.5 26.5 26.6 26.7 26.8 27.0 27.2 27.4 27.7 27.9
Footnotes
2) Rate for age 15 includes births at younger ages and for age 44 includes births at older ages.3) Diagonals (1973 onwards) display fertility experience of individual female cohorts through time.4) Completed family sizes for 1918 to 1923 birth cohorts include extrapolated estimates of fertility at younger ages (this is pre 1939 births).5) The average age is calculated by adding 0.5 years to the mother's age at her last birthday (For example, it is assumed that 30-year-old mothers were, on average, aged 30 years and 6 months when they gave birth).
© Crown Copyright 2017
Table 3.06 : Age-specific birth rates1, per 1,000 female population, Scotland, 1951 to 2016 Back to contents
152
442
Completed family size for female birth
cohort32.504
Average age of mother at childbirth5
1) Live births only. Excludes births where mother's age is not stated.
Page 34
Year of experienceAge of mother1994 1995 1996 1997 1998 1999 2000 2001 2002 2003 2004 2005 2006 2007 2008 2009 2010 2011 2012 2013 2014 2015 2016
4 5 5 6 4 5 4 4 3 3 3 3 3 3 3 3 3 3 2 2 2 2 1 13 14 15 16 16 14 12 13 11 11 11 10 11 11 11 11 10 9 7 7 6 5 4 1630 32 33 34 35 34 31 29 29 29 27 27 27 28 26 24 24 22 19 18 15 13 13 1743 43 47 46 45 47 45 44 41 41 41 40 39 38 40 34 31 28 30 25 23 20 18 1849 49 52 55 51 49 53 53 50 48 48 48 46 50 49 47 42 39 37 35 33 28 27 1955 54 55 56 55 54 52 54 51 54 53 52 54 55 54 54 51 45 44 41 38 35 34 2060 60 58 59 58 56 54 53 57 55 56 56 54 60 61 59 54 53 48 45 44 41 38 2165 66 62 64 61 58 57 56 54 57 60 57 60 62 66 62 59 58 56 51 50 48 45 2277 70 69 70 66 64 62 61 59 62 64 63 68 66 70 70 66 64 60 60 54 51 52 2381 80 77 77 74 73 65 68 67 65 67 66 69 73 76 74 70 70 69 66 64 58 56 2497 92 86 84 83 81 74 73 68 74 76 74 77 75 83 82 77 81 76 70 72 68 64 25
104 99 94 93 89 84 84 78 78 76 83 80 81 84 88 90 87 85 85 78 79 74 72 26110 105 105 97 94 89 86 88 83 85 88 89 87 93 95 95 92 88 92 87 89 84 79 27112 105 104 105 101 98 91 92 89 94 95 94 97 101 104 100 102 96 98 92 96 95 90 28109 105 103 106 103 98 95 93 93 96 97 97 103 102 107 102 106 101 104 101 101 98 95 29103 101 102 103 100 99 98 96 95 96 100 99 104 105 108 106 106 109 107 101 102 97 100 3095 92 93 93 93 94 91 91 94 96 98 102 105 106 111 109 110 107 108 105 108 108 103 3181 80 80 86 86 83 84 84 87 93 94 96 100 102 105 106 107 105 104 102 104 102 101 3267 70 73 75 73 73 72 76 77 80 86 89 92 96 98 95 101 101 99 95 96 94 97 3358 58 61 63 64 62 63 66 65 70 75 78 82 84 93 89 89 90 89 87 92 90 86 3445 48 49 53 53 53 54 57 57 61 66 69 72 75 77 76 77 81 85 84 81 81 80 3535 37 38 43 42 44 44 46 46 49 52 57 61 63 66 66 69 69 67 69 72 71 70 3627 31 30 31 33 31 34 35 35 41 44 44 45 51 54 52 54 55 55 54 59 57 55 3720 19 22 24 23 24 27 27 28 29 32 34 36 40 39 42 43 44 43 43 45 46 43 3815 15 16 17 17 18 19 19 20 22 23 25 26 29 30 31 32 33 34 33 35 34 35 399 11 11 12 12 12 12 13 14 15 16 18 17 19 21 21 23 22 23 24 25 23 25 406 6 7 6 7 8 9 8 8 9 11 11 12 12 14 13 14 15 15 15 17 16 17 414 4 4 4 4 4 5 5 5 6 6 6 7 7 8 9 8 9 9 9 9 10 10 422 2 3 2 2 3 3 3 3 3 3 4 4 4 5 5 5 5 5 6 5 6 6 432 2 2 2 3 3 2 3 3 2 3 3 3 4 4 5 5 5 5 6 6 6 6
2.08 2.03 2.02 1.99 1.95 1.95 1.93 1.93 1.90 1.90 1.87 1.87 1.87 1.86 1.82 1.80 1.80 1.78 1.78 1.77 1.74 1.74 1.72
1.58 1.55 1.56 1.58 1.55 1.51 1.48 1.49 1.47 1.52 1.58 1.60 1.64 1.70 1.77 1.73 1.72 1.69 1.67 1.61 1.62 1.56 1.52 Total fertility rate
28.2 28.4 28.5 28.7 28.8 28.9 29.0 29.2 29.2 29.3 29.4 29.5 29.5 29.4 29.4 29.4 29.6 29.7 29.7 29.9 30.1 30.2 30.3
152
442
Completed family size for female birth
cohort3
Average age of mother at childbirth5
Page 35
Age (at the mother's last birthday)19 24 29 34 39 44
1931 0.11 0.81 1.67 2.25 2.48 2.51 1932 0.10 0.83 1.73 2.29 2.51 2.54 1933 0.10 0.87 1.79 2.34 2.54 2.57 1934 0.10 0.92 1.87 2.41 2.60 2.63 1935 0.11 0.94 1.90 2.41 2.57 2.61 1936 0.11 0.97 1.92 2.39 2.54 2.56 1937 0.12 1.00 1.94 2.40 2.53 2.55 1938 0.13 1.02 1.96 2.40 2.51 2.52 1939 0.14 1.06 1.98 2.40 2.50 2.52 1940 0.15 1.09 1.99 2.37 2.47 2.48 1941 0.16 1.09 1.96 2.32 2.41 2.43 1942 0.16 1.06 1.91 2.23 2.33 2.34 1943 0.17 1.07 1.89 2.19 2.29 2.30 1944 0.19 1.09 1.88 2.18 2.28 2.30 1945 0.20 1.10 1.85 2.14 2.24 2.26 1946 0.21 1.11 1.83 2.13 2.24 2.25 1947 0.21 1.03 1.69 2.00 2.09 2.11 1948 0.23 1.06 1.72 2.04 2.14 2.16 1949 0.23 1.03 1.67 2.00 2.10 2.12 1950 0.23 0.97 1.62 1.95 2.06 2.08 1951 0.24 0.93 1.57 1.90 2.01 2.03 1952 0.23 0.88 1.54 1.88 2.00 2.02 1953 0.24 0.86 1.50 1.85 1.97 1.99 1954 0.23 0.82 1.46 1.80 1.92 1.95 1955 0.23 0.80 1.43 1.79 1.92 1.95 1956 0.22 0.79 1.40 1.76 1.90 1.93 1957 0.20 0.78 1.40 1.77 1.91 1.93 1958 0.18 0.73 1.34 1.72 1.87 1.90 1959 0.17 0.72 1.33 1.72 1.87 1.90 1960 0.17 0.69 1.29 1.68 1.84 1.87 1961 0.16 0.67 1.26 1.66 1.83 1.87 1962 0.16 0.65 1.25 1.66 1.83 1.87 1963 0.16 0.63 1.22 1.64 1.82 1.86 1964 0.15 0.60 1.18 1.59 1.77 1.82 1965 0.14 0.57 1.15 1.56 1.75 1.80 1966 0.14 0.58 1.13 1.55 1.75 1.80 1967 0.15 0.57 1.10 1.52 1.72 1.78 1968 0.15 0.56 1.09 1.50 1.73 1.78 1969 0.15 0.55 1.06 1.48 1.72 1.77 1970 0.15 0.52 1.00 1.43 1.68 1.74 1971 0.15 0.50 0.97 1.42 1.68 1.74 1972 0.15 0.49 0.94 1.39 1.66 1.72 1973 0.16 0.49 0.92 1.39 1.67 1974 0.15 0.48 0.91 1.40 1.68 1975 0.15 0.46 0.89 1.38 1.66 1976 0.14 0.45 0.88 1.37 1.66 1977 0.15 0.45 0.88 1.39 1.68 1978 0.15 0.45 0.89 1.41 1979 0.15 0.44 0.89 1.39 1980 0.15 0.44 0.89 1.40 1981 0.16 0.45 0.92 1.42 1982 0.15 0.45 0.91 1.41 1983 0.14 0.45 0.92 1984 0.14 0.45 0.90 1985 0.13 0.45 0.89 1986 0.13 0.45 0.90 1987 0.13 0.44 0.88 1988 0.13 0.43 1989 0.13 0.42 1990 0.13 0.41 1991 0.12 0.37 1992 0.11 0.35 1993 0.10 1994 0.10 1995 0.09 1996 0.08 1997 0.07
Footnote1) Refer to footnotes for Table 3.07(b).
© Crown Copyright 2017
Table 3.07(a) : Cumulative fertility1, by (assumed) birth cohort and selected age, Scotland, up to 2016
(assumed) birth cohort 1
Page 36
1951 1956 1961 1966 1971 1976 1981 1986 1991 1996 2001
15 0.002 0.003 0.003 0.002 0.003 0.004 0.005 0.004 0.003 0.003 0.00116 0.014 0.019 0.015 0.013 0.016 0.019 0.021 0.015 0.014 0.01017 0.053 0.065 0.045 0.040 0.047 0.051 0.055 0.044 0.040 0.02818 0.128 0.134 0.095 0.085 0.091 0.094 0.102 0.085 0.075 0.05119 0.238 0.217 0.164 0.143 0.147 0.143 0.155 0.133 0.117 0.07920 0.368 0.309 0.246 0.211 0.210 0.198 0.209 0.187 0.162 0.11321 0.505 0.407 0.341 0.291 0.277 0.257 0.266 0.247 0.21022 0.645 0.519 0.444 0.380 0.345 0.318 0.323 0.313 0.26123 0.787 0.649 0.554 0.472 0.422 0.382 0.387 0.383 0.31524 0.932 0.784 0.674 0.577 0.502 0.447 0.454 0.453 0.37325 1.075 0.926 0.796 0.688 0.588 0.520 0.530 0.534 0.43726 1.205 1.057 0.917 0.803 0.682 0.598 0.614 0.61827 1.333 1.177 1.041 0.916 0.776 0.683 0.709 0.70528 1.462 1.294 1.154 1.028 0.874 0.778 0.810 0.80129 1.573 1.401 1.263 1.133 0.969 0.875 0.915 0.89930 1.670 1.499 1.365 1.236 1.064 0.979 1.025 0.99931 1.746 1.583 1.461 1.328 1.158 1.085 1.13332 1.810 1.652 1.540 1.415 1.251 1.189 1.23433 1.861 1.710 1.607 1.487 1.338 1.284 1.33034 1.902 1.760 1.665 1.551 1.416 1.374 1.42035 1.937 1.803 1.713 1.608 1.489 1.455 1.50036 1.963 1.837 1.757 1.654 1.552 1.52237 1.984 1.863 1.790 1.695 1.606 1.57638 2.000 1.883 1.813 1.727 1.648 1.62139 2.011 1.898 1.832 1.752 1.680 1.65540 2.020 1.910 1.845 1.770 1.702 1.68141 2.026 1.916 1.853 1.782 1.71742 2.029 1.920 1.859 1.790 1.72643 2.031 1.923 1.862 1.794 1.73144 2.033 1.925 1.865 1.799 1.737
Footnotes1) In 2010, some of the figures in Table 3.07(b) were revised slightly from those published in the previous edition.
For consistency, the old figures in Table 3.07(b) were replaced by the newly calculated figures.
© Crown Copyright 2017
Table 3.07(b): Cumulative fertility1, for selected (assumed) birth cohorts, Scotland, up to 2016
Age at last birthday
(assumed) birth cohort2
In order to produce the new Table 3.07(c), figures had to be calculated for every cohort from 1935 onwards, and some of the results for the cohorts shown in Table 3.07(b) were found to differ slightly from what was published previously.
However, the figures which appear in Table 3.07(a) were not replaced, so there may be a few minor inconsistencies between that table and Tables 3.07(b) and 3.07(c).
2) The assumed birth cohorts are inferred from the mother's age (at her last birthday) when she gave birth and the calendar year in which the birth occurred - they are not based on the mother's actual year of birth. For example, all mothers aged 29 who gave birth in 2010 are counted as being in the assumed 1981 birth cohort, many of the mothers who were born in 1981 and gave birth in 1981 and gave birth in 2010 would have done so when they were 28 years old.
Page 37
Age1935 1936 1937 1938 1939 1940 1941 1942 1943 1944 1945 1946 1947 1948 1949 1950 1951 1952 1953 1954 1955
15 0.000 0.001 0.001 0.001 0.001 0.001 0.001 0.001 0.001 0.001 0.001 0.001 0.001 0.002 0.001 0.002 0.002 0.002 0.002 0.003 0.00316 0.003 0.003 0.003 0.004 0.004 0.005 0.005 0.005 0.006 0.007 0.008 0.009 0.009 0.011 0.011 0.013 0.014 0.015 0.015 0.016 0.01817 0.014 0.014 0.016 0.017 0.020 0.022 0.023 0.025 0.028 0.033 0.036 0.041 0.042 0.047 0.047 0.051 0.053 0.055 0.058 0.059 0.06518 0.046 0.047 0.049 0.056 0.063 0.067 0.070 0.074 0.079 0.089 0.097 0.108 0.106 0.116 0.123 0.126 0.128 0.129 0.139 0.133 0.13519 0.108 0.113 0.122 0.133 0.144 0.153 0.158 0.159 0.172 0.186 0.203 0.213 0.209 0.228 0.233 0.235 0.238 0.233 0.239 0.227 0.22520 0.206 0.220 0.236 0.251 0.266 0.279 0.281 0.290 0.302 0.325 0.345 0.357 0.345 0.373 0.373 0.366 0.368 0.350 0.349 0.332 0.32721 0.353 0.374 0.399 0.416 0.437 0.449 0.460 0.458 0.478 0.500 0.519 0.533 0.514 0.538 0.536 0.523 0.505 0.480 0.472 0.446 0.43322 0.532 0.553 0.581 0.602 0.624 0.651 0.653 0.649 0.664 0.684 0.708 0.726 0.681 0.711 0.702 0.671 0.645 0.611 0.600 0.565 0.54523 0.737 0.752 0.783 0.804 0.842 0.866 0.868 0.853 0.866 0.884 0.906 0.917 0.856 0.891 0.865 0.823 0.787 0.750 0.728 0.686 0.66624 0.941 0.965 0.997 1.022 1.059 1.087 1.085 1.059 1.072 1.088 1.098 1.107 1.033 1.060 1.028 0.971 0.932 0.885 0.858 0.817 0.79825 1.152 1.175 1.215 1.245 1.283 1.298 1.296 1.265 1.276 1.286 1.287 1.298 1.200 1.221 1.176 1.121 1.075 1.022 0.996 0.963 0.94026 1.358 1.384 1.424 1.457 1.488 1.493 1.491 1.459 1.458 1.468 1.466 1.461 1.352 1.369 1.319 1.260 1.205 1.157 1.138 1.105 1.07827 1.555 1.574 1.615 1.646 1.666 1.676 1.667 1.627 1.625 1.633 1.616 1.608 1.482 1.503 1.450 1.385 1.333 1.298 1.278 1.237 1.20628 1.737 1.755 1.796 1.818 1.837 1.843 1.829 1.779 1.775 1.766 1.746 1.730 1.595 1.619 1.562 1.503 1.462 1.425 1.405 1.355 1.32329 1.901 1.914 1.944 1.963 1.983 1.984 1.959 1.912 1.888 1.875 1.848 1.831 1.692 1.718 1.667 1.618 1.573 1.541 1.512 1.460 1.43130 2.041 2.047 2.073 2.091 2.108 2.103 2.075 2.016 1.984 1.962 1.933 1.916 1.774 1.808 1.762 1.717 1.670 1.635 1.608 1.553 1.52631 2.152 2.155 2.180 2.191 2.207 2.199 2.160 2.093 2.055 2.032 2.001 1.985 1.843 1.883 1.844 1.800 1.746 1.713 1.687 1.632 1.60932 2.253 2.251 2.271 2.276 2.291 2.271 2.229 2.151 2.111 2.086 2.054 2.043 1.906 1.947 1.911 1.864 1.810 1.778 1.754 1.699 1.68033 2.336 2.328 2.343 2.345 2.353 2.325 2.275 2.197 2.153 2.129 2.100 2.093 1.955 1.998 1.961 1.915 1.861 1.833 1.809 1.754 1.73934 2.406 2.390 2.401 2.396 2.398 2.367 2.313 2.232 2.186 2.164 2.139 2.133 1.995 2.040 2.001 1.955 1.902 1.877 1.855 1.800 1.78535 2.461 2.445 2.445 2.433 2.430 2.399 2.341 2.261 2.215 2.196 2.172 2.167 2.026 2.073 2.033 1.989 1.937 1.914 1.894 1.839 1.82436 2.504 2.481 2.477 2.459 2.454 2.423 2.362 2.282 2.241 2.220 2.198 2.192 2.050 2.097 2.060 2.015 1.963 1.944 1.922 1.869 1.85737 2.533 2.507 2.500 2.481 2.473 2.440 2.379 2.301 2.260 2.240 2.216 2.210 2.068 2.118 2.079 2.034 1.984 1.965 1.946 1.894 1.88438 2.555 2.525 2.517 2.495 2.487 2.453 2.394 2.314 2.274 2.255 2.231 2.224 2.081 2.133 2.094 2.049 2.000 1.983 1.964 1.912 1.90339 2.570 2.537 2.528 2.504 2.498 2.464 2.405 2.324 2.283 2.265 2.241 2.235 2.090 2.143 2.104 2.060 2.011 1.996 1.977 1.926 1.91840 2.579 2.546 2.536 2.511 2.505 2.471 2.412 2.332 2.291 2.272 2.248 2.242 2.097 2.149 2.111 2.067 2.020 2.004 1.986 1.936 1.92941 2.584 2.551 2.541 2.516 2.510 2.476 2.417 2.336 2.296 2.276 2.252 2.247 2.100 2.154 2.116 2.072 2.026 2.011 1.992 1.942 1.93642 2.588 2.554 2.544 2.520 2.513 2.479 2.420 2.339 2.299 2.279 2.254 2.249 2.103 2.156 2.119 2.076 2.029 2.014 1.996 1.945 1.94043 2.590 2.557 2.546 2.521 2.515 2.481 2.422 2.340 2.300 2.281 2.255 2.251 2.105 2.158 2.121 2.078 2.031 2.016 1.998 1.948 1.94344 2.592 2.558 2.548 2.523 2.517 2.483 2.424 2.342 2.302 2.282 2.257 2.252 2.106 2.160 2.123 2.079 2.033 2.018 2.000 1.950 1.945
Footnote1) Refer to footnotes for Table 3.07(b).
Table 3.07(c) : Cumulative fertility1, 1935-2001 (assumed) birth cohorts, Scotland, up to 2016
(assumed) birth cohort 1
Page 38
© Crown Copyright 2017
Page 39
1956 1957 1958 1959 1960 1961 1962 1963 1964 1965 1966 1967 1968 1969 1970 1971 1972 1973 1974 1975 1976 19770.003 0.003 0.003 0.004 0.003 0.003 0.002 0.002 0.003 0.002 0.002 0.003 0.003 0.003 0.003 0.003 0.003 0.004 0.004 0.004 0.004 0.0050.019 0.019 0.018 0.017 0.016 0.015 0.014 0.014 0.014 0.013 0.013 0.013 0.014 0.016 0.016 0.016 0.017 0.018 0.017 0.018 0.019 0.0200.065 0.063 0.057 0.051 0.048 0.045 0.045 0.045 0.041 0.042 0.040 0.042 0.046 0.046 0.047 0.047 0.048 0.051 0.052 0.051 0.051 0.0490.134 0.128 0.113 0.102 0.098 0.095 0.094 0.093 0.087 0.084 0.085 0.088 0.092 0.094 0.093 0.091 0.093 0.101 0.102 0.099 0.094 0.0920.217 0.204 0.180 0.171 0.166 0.164 0.160 0.157 0.145 0.139 0.143 0.146 0.150 0.153 0.148 0.147 0.152 0.157 0.154 0.148 0.143 0.1440.309 0.290 0.263 0.254 0.249 0.246 0.237 0.230 0.214 0.208 0.211 0.212 0.219 0.216 0.213 0.210 0.214 0.214 0.209 0.202 0.198 0.2010.407 0.391 0.362 0.356 0.348 0.341 0.327 0.314 0.296 0.287 0.291 0.290 0.289 0.289 0.284 0.277 0.278 0.274 0.268 0.260 0.257 0.2590.519 0.510 0.477 0.474 0.457 0.444 0.426 0.411 0.387 0.374 0.380 0.372 0.371 0.368 0.357 0.345 0.342 0.340 0.331 0.324 0.318 0.3170.649 0.641 0.605 0.594 0.572 0.554 0.538 0.516 0.491 0.472 0.472 0.463 0.464 0.457 0.437 0.422 0.413 0.409 0.401 0.390 0.382 0.3790.784 0.780 0.732 0.719 0.694 0.674 0.654 0.633 0.601 0.575 0.577 0.566 0.561 0.548 0.519 0.502 0.489 0.486 0.474 0.462 0.447 0.4470.926 0.912 0.861 0.845 0.819 0.796 0.774 0.754 0.713 0.689 0.688 0.671 0.667 0.645 0.611 0.588 0.573 0.570 0.555 0.536 0.520 0.5151.057 1.043 0.990 0.977 0.944 0.917 0.899 0.869 0.832 0.809 0.803 0.779 0.770 0.744 0.704 0.682 0.662 0.653 0.638 0.614 0.598 0.5911.177 1.168 1.116 1.100 1.065 1.041 1.016 0.992 0.951 0.926 0.916 0.889 0.875 0.849 0.802 0.776 0.751 0.740 0.726 0.697 0.683 0.6801.294 1.289 1.232 1.218 1.181 1.154 1.135 1.110 1.068 1.039 1.028 0.994 0.979 0.954 0.903 0.874 0.842 0.831 0.815 0.791 0.778 0.7741.401 1.398 1.341 1.329 1.287 1.263 1.249 1.224 1.178 1.148 1.133 1.097 1.085 1.057 1.001 0.969 0.935 0.924 0.911 0.888 0.875 0.8771.499 1.497 1.439 1.425 1.386 1.365 1.353 1.327 1.280 1.250 1.236 1.200 1.185 1.156 1.099 1.064 1.030 1.020 1.010 0.987 0.979 0.9811.583 1.581 1.522 1.514 1.477 1.461 1.446 1.422 1.373 1.343 1.328 1.293 1.280 1.247 1.191 1.158 1.126 1.118 1.113 1.092 1.085 1.0921.652 1.652 1.600 1.593 1.556 1.540 1.528 1.502 1.453 1.428 1.415 1.377 1.363 1.331 1.278 1.251 1.220 1.214 1.212 1.194 1.189 1.1981.710 1.713 1.664 1.660 1.622 1.607 1.598 1.575 1.528 1.502 1.487 1.448 1.439 1.408 1.358 1.338 1.308 1.306 1.308 1.291 1.284 1.2991.760 1.766 1.719 1.717 1.680 1.665 1.659 1.638 1.592 1.564 1.551 1.515 1.504 1.478 1.433 1.416 1.390 1.391 1.401 1.380 1.374 1.3891.803 1.811 1.763 1.762 1.727 1.713 1.712 1.692 1.645 1.618 1.608 1.571 1.565 1.544 1.501 1.489 1.465 1.468 1.478 1.457 1.455 1.4741.837 1.845 1.798 1.800 1.766 1.757 1.754 1.736 1.689 1.665 1.654 1.620 1.618 1.601 1.562 1.552 1.531 1.534 1.547 1.526 1.522 1.5431.863 1.872 1.829 1.830 1.797 1.790 1.786 1.770 1.724 1.700 1.695 1.664 1.662 1.646 1.613 1.606 1.583 1.589 1.602 1.581 1.576 1.6021.883 1.891 1.851 1.854 1.820 1.813 1.812 1.796 1.752 1.729 1.727 1.698 1.698 1.686 1.652 1.648 1.627 1.633 1.644 1.625 1.621 1.6481.898 1.907 1.868 1.871 1.838 1.832 1.831 1.816 1.774 1.752 1.752 1.724 1.727 1.716 1.684 1.680 1.660 1.666 1.677 1.659 1.655 1.6831.910 1.919 1.880 1.884 1.850 1.845 1.845 1.832 1.790 1.770 1.770 1.743 1.747 1.737 1.706 1.702 1.682 1.690 1.703 1.682 1.6811.916 1.926 1.888 1.892 1.858 1.853 1.855 1.843 1.801 1.782 1.782 1.758 1.760 1.751 1.721 1.717 1.697 1.707 1.719 1.7001.920 1.930 1.893 1.897 1.863 1.859 1.861 1.849 1.808 1.789 1.790 1.766 1.768 1.759 1.730 1.726 1.706 1.716 1.7291.923 1.933 1.896 1.901 1.866 1.862 1.865 1.853 1.812 1.793 1.794 1.771 1.774 1.764 1.736 1.731 1.712 1.7231.925 1.935 1.899 1.903 1.869 1.865 1.868 1.857 1.816 1.798 1.799 1.776 1.779 1.770 1.742 1.737 1.718
(assumed) birth cohort 1
Page 40
19780.0040.0180.0490.0960.1510.2060.2620.3190.3790.4460.5200.6030.6930.7900.8921.0001.1091.2171.3171.4071.4901.5621.6191.662
Page 41
1979 1980 1981 1982 1983 1984 1985 1986 1987 1988 1989 1990 1991 1992 1993 1994 1995 1996 1997 1998 1999 20000.004 0.005 0.005 0.006 0.004 0.005 0.004 0.004 0.003 0.003 0.003 0.003 0.003 0.003 0.003 0.003 0.003 0.003 0.002 0.002 0.002 0.0020.018 0.020 0.021 0.022 0.018 0.017 0.017 0.015 0.015 0.014 0.014 0.015 0.014 0.015 0.014 0.013 0.011 0.010 0.010 0.008 0.007 0.00650.051 0.055 0.055 0.056 0.050 0.045 0.046 0.044 0.042 0.041 0.041 0.043 0.040 0.038 0.038 0.035 0.030 0.028 0.025 0.021 0.0200.097 0.100 0.102 0.100 0.094 0.087 0.086 0.085 0.082 0.080 0.079 0.083 0.075 0.070 0.066 0.065 0.056 0.051 0.0447 0.03970.148 0.149 0.155 0.153 0.144 0.135 0.134 0.133 0.128 0.130 0.128 0.130 0.117 0.109 0.102 0.100 0.088 0.079 0.07210.202 0.201 0.209 0.204 0.198 0.188 0.186 0.187 0.184 0.184 0.182 0.180 0.162 0.153 0.143 0.138 0.123 0.1130.256 0.253 0.266 0.259 0.254 0.244 0.240 0.247 0.244 0.244 0.236 0.234 0.210 0.198 0.187 0.179 0.1610.312 0.308 0.323 0.319 0.311 0.304 0.302 0.313 0.306 0.302 0.293 0.290 0.261 0.248 0.235 0.2240.372 0.369 0.387 0.383 0.379 0.370 0.373 0.383 0.372 0.366 0.353 0.349 0.315 0.298 0.2870.437 0.436 0.454 0.452 0.452 0.446 0.446 0.453 0.443 0.434 0.419 0.413 0.373 0.3540.513 0.510 0.530 0.527 0.534 0.528 0.524 0.534 0.519 0.505 0.491 0.481 0.4370.593 0.592 0.614 0.615 0.624 0.614 0.609 0.618 0.597 0.584 0.565 0.5530.680 0.685 0.709 0.710 0.716 0.702 0.700 0.705 0.686 0.668 0.6440.781 0.789 0.810 0.811 0.812 0.800 0.792 0.801 0.781 0.7580.888 0.891 0.915 0.913 0.916 0.902 0.893 0.899 0.8760.993 0.998 1.025 1.020 1.017 1.003 0.990 0.9991.103 1.104 1.133 1.124 1.124 1.111 1.0921.208 1.209 1.234 1.228 1.227 1.2121.307 1.303 1.330 1.322 1.3241.394 1.396 1.420 1.4081.475 1.476 1.5001.546 1.5461.601
(assumed) birth cohort 1
Page 43
Area
Live birthsNumbers Percentage of live births
To unmarried parents
TotalJoint registration
Scotland 54,488 26,761 27,727 19,394 6,012 2,321 52.6 50.9 15.3Council areasAberdeen City 2,521 1,398 1,123 866 171 86 47.6 44.5 10.2Aberdeenshire 2,811 1,712 1,099 925 99 75 61.6 39.1 6.2Angus 1,025 480 545 421 71 53 53.5 53.2 12.1Argyll & Bute 699 321 378 296 58 24 55.9 54.1 11.7
5,300 3,243 2,057 1,580 290 187 43.4 38.8 9.0Clackmannanshire 505 187 318 211 77 30 56.4 63.0 21.2Dumfries & Galloway 1,318 535 783 599 112 72 57.3 59.4 14.0Dundee City 1,576 604 972 593 268 111 48.5 61.7 24.0East Ayrshire 1,275 494 781 548 160 73 58.9 61.3 18.3East Dunbartonshire 951 611 340 235 82 23 55.6 35.8 11.0East Lothian 1,041 535 506 371 101 34 56.5 48.6 13.0East Renfrewshire 861 620 241 160 67 14 54.3 28.0 9.4Falkirk 1,565 732 833 605 161 67 53.3 53.2 14.6Fife 3,739 1,674 2,065 1,469 416 180 55.3 55.2 15.9Glasgow City 6,833 3,262 3,571 2,107 1,095 369 47.4 52.3 21.4Highland 2,150 1,005 1,145 894 179 72 55.5 53.3 11.7Inverclyde 706 287 419 246 148 25 51.3 59.3 24.5Midlothian 1,088 517 571 400 120 51 66.8 52.5 15.7Moray 939 467 472 364 71 37 57.5 50.3 11.5
238 144 94 81 10 3 58.6 39.5 5.5North Ayrshire 1,244 448 796 503 218 75 53.3 64.0 23.6North Lanarkshire 3,511 1,458 2,053 1,328 563 162 54.2 58.5 20.6Orkney Islands 178 97 81 70 8 3 51.1 45.5 6.2Perth & Kinross 1,325 650 675 541 86 48 53.5 50.9 10.1Renfrewshire 1,773 837 936 610 257 69 54.7 52.8 18.4Scottish Borders 1,005 495 510 395 69 46 57.4 50.7 11.4Shetland Islands 266 155 111 96 12 3 66.9 41.7 5.6South Ayrshire 976 412 564 398 126 40 54.1 57.8 17.0South Lanarkshire 3,315 1,655 1,660 1,097 437 126 58.1 50.1 17.0Stirling 807 432 375 266 85 24 43.1 46.5 13.5West Dunbartonshire 958 354 604 361 190 53 57.8 63.0 25.4West Lothian 1,989 940 1,049 758 205 86 58.2 52.7 14.6
Ayrshire & Arran 3,495 1,354 2,141 1,449 504 188 55.5 61.3 19.8Borders 1,005 495 510 395 69 46 57.4 50.7 11.4Dumfries & Galloway 1,318 535 783 599 112 72 57.3 59.4 14.0Fife 3,739 1,674 2,065 1,469 416 180 55.3 55.2 15.9Forth Valley 2,877 1,351 1,526 1,082 323 121 50.5 53.0 15.4Grampian 6,271 3,577 2,694 2,155 341 198 54.6 43.0 8.6Greater Glasgow & Clyde 12,082 5,971 6,111 3,719 1,839 553 50.4 50.6 19.8Highland 2,849 1,326 1,523 1,190 237 96 55.6 53.5 11.7Lanarkshire 6,826 3,113 3,713 2,425 1,000 288 56.0 54.4 18.9Lothian 9,418 5,235 4,183 3,109 716 358 49.3 44.4 11.4Orkney 178 97 81 70 8 3 51.1 45.5 6.2Shetland 266 155 111 96 12 3 66.9 41.7 5.6Tayside 3,926 1,734 2,192 1,555 425 212 51.4 55.8 16.2Western Isles 238 144 94 81 10 3 58.6 39.5 5.5
Footnotes
2) The statistics for each health board's area are based on the board boundaries that apply with effect from 1 April 2014.
Table 3.08: Live births, numbers and fertility rates by marital status of parents, type of registration and administrative area, Scotland, 2016
General Fertility Rate: all live
births per 1,000 women aged 15-
44
All live births
To married parents
- to unmarried
parents
- registered solely or jointly but with different parental
addresses
Sole registrationSame
addressDifferent address
City of Edinburgh1
Na h-Eileanan Siar1
NHS Board areas 2
1) The alphabetical order of the council areas has changed due to adoption of the preferred forms of reference to the Edinburgh and Western Isles council areas. Previous versions of this table used the forms 'Edinburgh, City of' and 'Eilean Siar'.
Page 44
Table 3.9: Live births, by country of birth of mother and administrative area, Scotland, 2016
Area
Country of birth of motherCommonwealth
Total Africa
SCOTLAND 54,488 45,192 286 4,350 2,518 287 1,251 26 847 107 2,137 5Council areasAberdeen City 2,521 1,533 11 449 336 18 143 2 151 22 192 -Aberdeenshire 2,811 2,357 12 263 92 19 19 - 46 8 87 -Angus 1,025 886 5 98 16 5 4 2 5 - 20 -Argyll & Bute 699 612 1 47 17 4 - - 10 3 22 -
5,300 3,464 74 892 430 70 194 7 139 20 440 -Clackmannanshire 505 464 1 23 8 1 6 - 1 - 9 -Dumfries & Galloway 1,318 1,222 5 59 16 2 6 - 7 1 16 -Dundee City 1,576 1,269 9 140 86 6 56 - 20 4 72 -East Ayrshire 1,275 1,217 2 20 22 7 12 - 3 - 13 1East Dunbartonshire 951 885 5 19 21 4 8 - 9 - 21 -East Lothian 1,041 911 14 85 16 5 3 - 8 - 14 1East Renfrewshire 861 753 3 24 66 3 47 - 12 4 15 -Falkirk 1,565 1,392 9 80 61 9 32 2 17 1 23 -Fife 3,739 3,254 19 263 101 17 51 2 25 6 102 -Glasgow City 6,833 4,893 39 539 680 29 433 4 196 18 681 1Highland 2,150 1,828 6 205 71 16 16 3 30 6 40 -Inverclyde 706 671 - 15 3 1 - - 2 - 17 -Midlothian 1,088 960 15 52 32 10 9 - 10 3 29 -Moray 939 826 4 61 22 3 7 - 7 5 25 1
238 212 1 13 3 2 - - 1 - 9 -North Ayrshire 1,244 1,195 1 23 13 1 8 - 4 - 12 -North Lanarkshire 3,511 3,223 8 154 79 6 46 1 26 - 47 -Orkney Islands 178 165 - 9 4 2 1 - - 1 - -Perth & Kinross 1,325 1,102 3 170 32 6 14 1 11 - 18 -Renfrewshire 1,773 1,549 5 125 60 7 29 - 23 1 34 -Scottish Borders 1,005 876 4 79 18 4 5 - 8 1 27 1Shetland Islands 266 242 - 16 3 - 3 - - - 5 -South Ayrshire 976 923 3 21 12 2 6 1 3 - 17 -South Lanarkshire 3,315 3,051 11 114 84 10 43 - 31 - 55 -Stirling 807 700 3 61 26 7 9 - 9 1 17 -West Dunbartonshire 958 897 5 21 23 7 7 - 9 - 12 -West Lothian 1,989 1,660 8 210 65 4 34 1 24 2 46 -
Ayrshire & Arran 3,495 3,335 6 64 47 10 26 1 10 - 42 1Borders 1,005 876 4 79 18 4 5 - 8 1 27 1Dumfries & Galloway 1,318 1,222 5 59 16 2 6 - 7 1 16 -Fife 3,739 3,254 19 263 101 17 51 2 25 6 102 -Forth Valley 2,877 2,556 13 164 95 17 47 2 27 2 49 -Grampian 6,271 4,716 27 773 450 40 169 2 204 35 304 1Greater Glasgow & Clyde 12,082 9,648 57 743 853 51 524 4 251 23 780 1Highland 2,849 2,440 7 252 88 20 16 3 40 9 62 -Lanarkshire 6,826 6,274 19 268 163 16 89 1 57 - 102 -Lothian 9,418 6,995 111 1,239 543 89 240 8 181 25 529 1Orkney 178 165 - 9 4 2 1 - - 1 - -Shetland 266 242 - 16 3 - 3 - - - 5 -Tayside 3,926 3,257 17 408 134 17 74 3 36 4 110 -Western Isles 238 212 1 13 3 2 - - 1 - 9 -
Footnotes
2) The statistics for each Health Board's area are based on the Board boundaries that apply with effect from 1 April 2014.
All countries of birth
United Kingdom,
Isle of Man,
Channel Islands
Irish Republic including Ireland, part not stated
Other European
Union
Other Countries
Not stated
Australia, Canada,
New Zealand
India, BangladeshSri Lanka, Pakistan
West Indies, Belize, Guyana
Other Commonw
ealth
City of Edinburgh 1
Na h-Eileanan Siar 1
NHS Board areas 2
1) The alphabetical order of the council areas has changed due to adoption of the preferred forms of reference to the Edinburgh and Western Isles council areas. Previous versions of this table used the forms 'Edinburgh, City of' and 'Eilean Siar'.
Page 45
Table 3.10: Live births, country of birth of mother by country of birth of father, Scotland, 2016
Country of birth of mother
Scotland
Commonwealth
Total Africa
All countries 54,488 40,024 5,168 286 4,350 2,518 287 1,251 26 847 107 2,137 5Scotland 38,425 33,095 3,153 179 824 637 172 223 8 199 35 537 -
5,170 3,213 1,390 42 209 157 42 44 6 55 10 159 -
294 187 39 39 13 7 2 2 1 1 1 9 -
Other European Union 3,619 478 102 3 2,890 43 12 11 1 18 1 103 -Commonwealth, Total 2,799 763 205 11 151 1,574 47 952 9 517 49 94 1
247 147 27 4 15 40 37 1 - 2 - 14 -
1,442 289 90 3 71 953 2 948 - 3 - 35 1
33 17 4 - 4 5 - - 5 - - 3 -
Africa 981 284 77 4 58 525 8 2 4 511 - 33 -Other Commonwealth 96 26 7 - 3 51 - 1 - 1 49 9 -Other countries 1,850 362 102 7 141 47 8 16 - 13 10 1,191 -Not stated 2,331 1,926 177 5 122 53 4 3 1 44 1 44 4
© Crown Copyright 2017
Country of birth of father All countries
of birth
Other United
Kingdom, Isle of Man,
Channel Islands
Irish Republic including Ireland, part not stated
Other European
Union
Other countries
Not stated
Australia, Canada,
New Zealand
India, Bangladesh, Sri Lanka, Pakistan
West Indies, Belize, Guyana
Other Commonw
ealth
Other UK, Isle of Man, Channel IslandsIrish Republic, including Ireland, part not stated
Australia, Canada, New ZealandIndia, Bangladesh, Sri Lanka, PakistanWest Indies, Belize, Guyana
Page 46
Table 3.11: Live births, stillbirths¹ and maternities², by sex of child, marital status of parents and age of mother, Scotland, 2016
Live births StillbirthsAll live births To married parents To unmarried parents All stillbirths
Males Females Males Females Males Females Males Females
All ages 54,488 28,236 26,252 26,761 13,860 12,901 27,727 14,376 13,351 236 116 120under 20 1,974 1,007 967 46 23 23 1,928 984 944 10 5 5
10 - - - - - - - - - - - -11 - - - - - - - - - - - -12 - - - - - - - - - - - -13 2 1 1 - - - 2 1 1 - - -14 5 1 4 - - - 5 1 4 - - -15 33 15 18 - - - 33 15 18 - - -16 121 69 52 3 3 - 118 66 52 1 1 -17 364 178 186 2 - 2 362 178 184 1 1 -18 551 277 274 9 5 4 542 272 270 2 1 119 898 466 432 32 15 17 866 451 415 6 2 4
20-24 8,282 4,302 3,980 1,165 598 567 7,117 3,704 3,413 42 21 21 20 1,142 585 557 65 39 26 1,077 546 531 4 2 2 21 1,328 685 643 101 49 52 1,227 636 591 12 7 5 22 1,649 893 756 184 93 91 1,465 800 665 11 5 6 23 1,958 997 961 312 163 149 1,646 834 812 5 3 2 24 2,205 1,142 1,063 503 254 249 1,702 888 814 10 4 6
25-29 14,976 7,729 7,247 6,653 3,431 3,222 8,323 4,298 4,025 52 24 28 25 2,480 1,266 1,214 698 354 344 1,782 912 870 9 1 8 26 2,693 1,370 1,323 998 513 485 1,695 857 838 8 4 4 27 2,949 1,552 1,397 1,296 682 614 1,653 870 783 9 5 4 28 3,362 1,733 1,629 1,703 890 813 1,659 843 816 14 5 9 29 3,492 1,808 1,684 1,958 992 966 1,534 816 718 12 9 3
30-34 17,490 9,069 8,421 11,343 5,861 5,482 6,147 3,208 2,939 62 33 29 30 3,620 1,899 1,721 2,185 1,136 1,049 1,435 763 672 12 8 4 31 3,723 1,972 1,751 2,349 1,240 1,109 1,374 732 642 8 3 5 32 3,546 1,827 1,719 2,383 1,236 1,147 1,163 591 572 15 7 8 33 3,469 1,778 1,691 2,281 1,171 1,110 1,188 607 581 15 8 7 34 3,132 1,593 1,539 2,145 1,078 1,067 987 515 472 12 7 5
35-39 9,556 5,026 4,530 6,254 3,290 2,964 3,302 1,736 1,566 53 25 28 35 2,850 1,505 1,345 1,886 969 917 964 536 428 13 10 3 36 2,448 1,249 1,199 1,599 822 777 849 427 422 12 4 8 37 1,829 972 857 1,221 667 554 608 305 303 8 3 5 38 1,367 725 642 884 475 409 483 250 233 4 1 3 39 1,062 575 487 664 357 307 398 218 180 16 7 9
40-44 2,056 1,034 1,022 1,212 619 593 844 415 429 15 8 7 40 828 413 415 485 241 244 343 172 171 8 6 2 41 570 280 290 337 169 168 233 111 122 4 2 2 42 336 163 173 188 92 96 148 71 77 2 - 2 43 224 127 97 147 90 57 77 37 40 1 - 1 44 98 51 47 55 27 28 43 24 19 - - -
45-49 126 59 67 74 34 40 52 25 27 1 - 145 69 35 34 41 21 20 28 14 14 - - -46 24 9 15 15 3 12 9 6 3 1 - 147 19 11 8 10 8 2 9 3 6 - - -48 12 3 9 8 2 6 4 1 3 - - -49 2 1 1 - - - 2 1 1 - - -
50 & over 11 2 9 7 1 6 4 1 3 - - -NS 17 8 9 7 3 4 10 5 5 1 - 1
Footnotes1) Male stillbirths column includes sex not known.2) Maternities are defined to be the number of pregnancies ending in stillbirths or live births with multiple births counting once only.
© Crown Copyright 2017
Age of mother Both
sexesBoth sexes
Both sexes
Both sexes
Page 47
Table 3.11: Live births, stillbirths¹ and maternities², by sex of child, marital status of parents and age of mother, Scotland, 2016
Stillbirths MaternitiesTo married parents To unmarried parents
Males Females Males Females
88 44 44 148 72 76 53,898 26,388 27,510 All ages- - - 10 5 5 1,966 45 1,921 under 20- - - - - - - - - 10- - - - - - - - - 11- - - - - - - - - 12- - - - - - 2 - 2 13- - - - - - 5 - 5 14- - - - - - 33 - 33 15- - - 1 1 - 120 3 117 16- - - 1 1 - 360 2 358 17- - - 2 1 1 548 9 539 18- - - 6 2 4 898 31 867 19
6 3 3 36 18 18 8,258 1,164 7,094 20-24 - - - 4 2 2 1,134 65 1,069 20 - - - 12 7 5 1,336 101 1,235 21
1 - 1 10 5 5 1,646 184 1,462 22 1 - 1 4 3 1 1,944 309 1,635 23 4 3 1 6 1 5 2,198 505 1,693 24 24 15 9 28 9 19 14,836 6,584 8,252 25-29 4 - 4 5 1 4 2,458 696 1,762 25 3 1 2 5 3 2 2,669 988 1,681 26 2 2 - 7 3 4 2,927 1,282 1,645 27 5 3 2 9 2 7 3,318 1,673 1,645 28 10 9 1 2 - 2 3,464 1,945 1,519 29 25 16 9 37 17 20 17,266 11,181 6,085 30-34 5 3 2 7 5 2 3,569 2,145 1,424 30 2 1 1 6 2 4 3,683 2,326 1,357 31 5 4 1 10 3 7 3,509 2,353 1,156 32 7 5 2 8 3 5 3,428 2,255 1,173 33 6 3 3 6 4 2 3,077 2,102 975 34 25 7 18 28 18 10 9,399 6,139 3,260 35-39 4 3 1 9 7 2 2,795 1,835 960 35 5 - 5 7 4 3 2,403 1,575 828 36 3 - 3 5 3 2 1,805 1,202 603 37 3 - 3 1 1 - 1,336 867 469 38 10 4 6 6 3 3 1,060 660 400 39 6 3 3 9 5 4 2,022 1,188 834 40-44 3 2 1 5 4 1 819 477 342 40 1 1 - 3 1 2 558 328 230 41 1 - 1 1 - 1 333 188 145 42 1 - 1 - - - 218 143 75 43
- - - - - - 94 52 42 441 - 1 - - - 124 73 51 45-49- - - - - - 67 40 27 451 - 1 - - - 24 15 9 46- - - - - - 19 10 9 47- - - - - - 12 8 4 48- - - - - - 2 - 2 49- - - - - - 9 6 3 50 & over1 - 1 - - - 18 8 10 NS
Age of motherAll
maternitiesMarried parents
Unmarried parentsBoth
sexesBoth sexes
Page 48
Rate per 1,000 womenLive births Stillbirths
Both sexes Males Females Both sexes Males Females
15-44 52.1 52.6 27.3 25.4 0.2 0.1 0.115-19 13.5 13.5 6.9 6.6 0.1 0.0 0.020-24 45.3 45.4 23.6 21.8 0.2 0.1 0.125-29 78.9 79.7 41.1 38.6 0.3 0.1 0.130-34 96.1 97.4 50.5 46.9 0.3 0.2 0.235-39 56.5 57.4 30.2 27.2 0.3 0.2 0.240-44 12.5 12.7 6.3 6.4 0.1 0.0 0.0
Footnotes
2) Maternities are defined to be the number of pregnancies ending in stillbirths or live births with multiple births counting once only.
© Crown Copyright 2017
Table 3.12: Live birth, stillbirth and maternity rates per 1,000 women, by sex of child and age of mother, Scotland, 2016
Age of mother1 Maternities2
1) Rates for age groups 15-19 and 40-44 include births at age under 15 and over 44 respectively. The all ages rate includes cases where the mother's age was not stated and is calculated using the number of women aged 15-44.
Page 49
Table 3.13: Live births, by country of birth of mother, Scotland, 2006, 2011, 2014 to 2016
Country of birth of mother 2006 2011 2014 2015 2016
All countries Total 55,690 58,590 56,725 55,098 54,488 -610 100 100
UK, IoM, CI Total 50,468 50,247 47,547 46,100 45,192 -908 91 83Scotland 44,386 44,482 42,134 41,082 40,024 -1,058 80 73England 5,371 5,035 4,705 4,365 4,490 125 10 8Wales 209 163 165 162 171 9 0 0
Northern Ireland 492 545 513 477 489 12 1 1Isle of Man (IoM), Channel Islands (CI) 10 22 30 14 18 4 0 0
UK country not known - - - - - - 0 0
Other EU countries Total 1,583 3,690 4,398 4,420 4,636 216 3 9
Members pre-2004 Total 1,030 1,167 1,216 1,282 1,243 -39 2 2Austria 10 8 12 11 9 -2 0 0Belgium 14 18 20 21 18 -3 0 0Denmark 24 23 16 20 28 8 0 0Finland 17 22 17 16 15 -1 0 0France 89 111 111 92 102 10 0 0
Germany 396 400 368 378 306 -72 1 1Greece 16 27 35 54 52 -2 0 0
Ireland (Republic and part not known) 257 283 316 303 286 -17 0 1Italy 40 48 55 93 93 0 0 0
Luxembourg 1 5 4 5 4 -1 0 0Netherlands 47 58 45 64 57 -7 0 0
Portugal 29 32 49 71 66 -5 0 0Spain 51 90 125 133 166 33 0 0
Sweden 39 42 43 21 41 20 0 0
Joined in 2004 Total 553 2,393 2,952 2,823 2,962 139 1 5Cyprus 15 19 25 19 16 -3 0 0
Czech Republic 25 79 78 97 106 9 0 0Estonia 10 22 29 20 17 -3 0 0Hungary 13 63 110 91 107 16 0 0Latvia 35 175 203 178 206 28 0 0
Lithuania 42 139 178 191 206 15 0 0Malta 16 16 8 9 12 3 0 0
Poland 365 1,791 2,197 2,089 2,151 62 1 4Slovakia 31 86 120 126 137 11 0 0Slovenia 1 3 4 3 4 1 0 0
Joined in 2007 Total 32 130 227 308 429 121 0 1Bulgaria 10 39 52 74 86 12 0 0Romania 22 91 175 234 343 109 0 1
Joined in 2013 Total 7 2 3 7 2 -5 0 0Croatia 7 2 3 7 2 -5 0 0
Non-EU Total 3,637 4,651 4,780 4,577 4,655 78 7 9
Commonwealth Total 2,112 2,741 2,701 2,570 2,518 -52 4 5Australia, Canada, New Zealand 412 311 307 273 287 14 1 1
India, Pakistan, B-desh, Sri L. 979 1,334 1,352 1,292 1,251 -41 2 2West Indies, Belize, Guyana 27 20 25 19 26 7 0 0
Africa 573 960 911 865 847 -18 1 2Other Commonwealth 121 116 106 121 107 -14 0 0
Other countries Total 1,525 1,910 2,079 2,007 2,137 130 3 4
Not stated 2 2 - 1 5 4 0 0
© Crown Copyright 2017
Change 2015-2016
% of total births in
2006
% of total births in
2016
Page 50
Table 3.15: Live births, numbers by age of mother and age of father, and the average ages of mothers and fathers, Scotland, 2016
Father's Ageup to 17 18 19 20 21 22 23 24 25 26 27 28 29 30 31 32 33 34 35 36 37 38 39 40+ All
Mother's AgeNot Known 15 - - - - - - 1 - - - - 1 - - - - - - - - - - - - 17 26.0up to 17 134 116 75 59 45 34 22 11 5 3 2 3 3 6 1 3 1 2 - - - - - - - 525 19.818 94 33 67 86 74 65 26 27 24 14 10 6 6 7 3 2 - - 2 1 1 1 - - 2 551 21.419 136 13 36 94 122 106 92 64 48 58 34 24 25 13 11 4 2 3 2 4 2 1 - 1 3 898 23.020 134 6 15 73 119 135 150 117 83 70 61 38 24 33 16 9 17 17 8 6 1 4 1 1 4 1,142 24.021 116 4 7 33 65 155 189 175 127 116 67 50 51 39 33 24 23 14 10 7 7 4 - 2 10 1,328 24.922 125 3 6 17 57 92 154 215 209 173 132 117 92 59 43 29 34 12 13 12 8 10 4 1 32 1,649 26.123 132 - 4 13 27 51 142 186 266 236 195 151 123 107 67 61 41 28 28 20 17 13 8 3 39 1,958 27.024 135 2 - 12 17 28 47 141 256 265 258 228 163 135 129 78 67 54 42 27 19 20 16 14 52 2,205 28.1
25 123 - - 3 13 15 37 72 153 305 304 271 272 192 150 137 88 81 40 49 40 29 28 18 60 2,480 29.0
26 114 4 - 9 7 17 32 59 88 177 313 324 320 244 183 167 145 117 84 60 50 48 27 19 85 2,693 29.8
27 101 - 1 3 4 13 17 37 66 112 183 332 404 313 310 239 167 147 114 98 73 55 33 24 103 2,949 30.6
28 107 1 - 3 6 10 10 23 40 59 121 229 438 424 341 352 271 223 171 136 93 66 41 40 157 3,362 31.5
29 115 1 - 4 5 2 11 21 26 50 88 146 277 434 426 414 327 251 197 164 132 90 61 53 197 3,492 32.3
30 87 - - 2 7 4 13 13 35 38 68 104 157 298 474 467 415 304 262 221 157 112 75 63 244 3,620 33.0
31 105 - - 1 1 6 5 11 22 27 47 71 115 181 324 534 441 407 327 253 206 175 102 70 292 3,723 33.7
32 81 - - 1 3 5 2 4 19 16 29 56 89 115 153 296 472 465 366 324 226 172 178 103 371 3,546 34.8
33 98 - - - 4 2 5 9 9 27 22 34 54 84 127 184 314 456 389 377 272 249 172 139 442 3,469 35.5
34 74 - - 1 - 1 7 4 7 19 17 36 47 66 82 131 165 258 405 397 343 249 183 148 492 3,132 36.2
35 72 - 1 - 4 3 9 7 5 10 11 30 47 39 56 98 118 157 247 367 327 237 220 167 618 2,850 37.1
36 59 - - - - 1 6 2 3 6 11 12 21 40 40 71 72 104 140 237 302 279 237 183 622 2,448 38.0
37 47 - - - - 1 3 - 1 4 6 9 16 14 31 39 57 70 101 122 148 221 208 146 585 1,829 38.5
38 34 - - - - 1 1 1 2 5 3 5 12 14 18 22 23 34 41 60 98 120 146 141 586 1,367 39.7
39 29 - - - - - - - 2 4 2 6 4 11 9 17 22 22 36 52 55 59 92 124 516 1,062 40.1
40+ 83 - - - - - - 5 6 2 3 12 13 10 12 23 29 41 43 63 77 100 132 144 1,395 2,193 42.3
32.9All 2,350 183 212 414 580 747 980 1,205 1,502 1,796 1,987 2,294 2,774 2,878 3,039 3,401 3,311 3,267 3,068 3,057 2,654 2,314 1,964 1,604 6,907 54,488 32.9
27.1 18.0 18.8 20.3 21.1 21.7 22.8 23.5 24.5 25.2 26.0 27.1 27.9 28.6 29.4 30.3 30.9 31.6 32.3 33.0 33.6 34.0 34.8 35.2 36.0 30.3
© Crown Copyright 2017
Back to contents
Not Known
Average age of fathers
Average age of mothers
Page 51
AreaAge Group
20-24 25-29 30-34 35-39Scotland 13.5 45.4 79.7 97.4 57.4 12.7 52.6 1.53Council areasAberdeen City 11.6 32.0 57.1 93.2 55.5 14.9 47.6 1.32Aberdeenshire 10.0 54.8 116.5 119.9 60.8 11.5 61.6 1.87Angus 13.1 55.6 102.4 102.2 48.8 7.4 53.5 1.65Argyll + Bute 12.4 69.6 100.5 105.2 54.7 12.2 55.9 1.77City of Edinburgh 9.1 20.2 43.2 84.0 70.1 17.2 43.4 1.22Clackmannanshire 17.5 80.1 98.0 97.8 43.2 12.1 56.4 1.74Dumfries + Galloway 20.4 68.5 106.1 98.6 42.1 12.2 57.3 1.74Dundee City 19.8 41.7 67.0 86.0 50.1 9.6 48.5 1.37East Ayrshire 22.9 75.7 96.3 98.8 51.6 9.0 58.9 1.77East Dunbartonshire 7.6 23.2 80.6 153.5 79.2 14.3 55.6 1.79East Lothian 12.4 44.2 102.6 109.5 64.6 14.2 56.5 1.74East Renfrewshire 4.6 21.7 71.2 161.7 77.5 16.7 54.3 1.77Falkirk 16.1 63.8 93.7 94.4 46.4 8.6 53.3 1.61Fife 18.0 55.8 99.6 96.0 52.6 10.9 55.3 1.66Glasgow City 12.9 34.5 60.2 80.5 57.8 15.5 47.4 1.31Highland 13.6 63.6 97.2 91.4 57.1 14.1 55.5 1.69Inverclyde 13.7 51.2 83.6 100.9 52.0 8.5 51.3 1.55Midlothian 19.1 63.0 117.2 115.0 67.4 16.3 66.8 1.99Moray 16.0 65.5 115.1 89.6 51.0 12.1 57.5 1.75Na h-Eileanan Siar 13.7 57.2 111.3 103.9 63.0 15.7 58.6 1.82North Ayrshire 15.9 63.3 98.9 94.7 47.0 7.7 53.3 1.64North Lanarkshire 15.9 56.4 96.5 93.0 52.8 10.3 54.2 1.62Orkney Islands 10.1 63.7 97.5 80.8 44.3 10.3 51.1 1.53Perth + Kinross 8.0 52.4 93.3 101.7 55.2 13.3 53.5 1.62Renfrewshire 12.0 45.8 83.9 109.5 61.3 11.7 54.7 1.62Scottish Borders 13.5 56.2 113.6 106.1 63.1 13.7 57.4 1.83Shetland Islands 12.2 60.5 113.8 129.5 68.6 19.4 66.9 2.02South Ayrshire 15.0 58.0 94.6 106.1 47.2 12.6 54.1 1.67South Lanarkshire 13.7 51.7 99.0 119.3 53.1 11.9 58.1 1.74Stirling 5.1 33.5 56.3 96.3 70.1 14.8 43.1 1.38West Dunbartonshire 16.2 58.7 95.7 104.6 49.3 11.8 57.8 1.68West Lothian 12.6 65.0 106.0 101.7 55.1 10.2 58.2 1.75
NHS Board areasAyrshire & Arran 17.9 65.9 96.8 99.4 48.7 9.6 55.5 1.69Borders 13.5 56.2 113.6 106.1 63.1 13.7 57.4 1.83Dumfries & Galloway 20.4 68.5 106.1 98.6 42.1 12.2 57.3 1.74Fife 18.0 55.8 99.6 96.0 52.6 10.9 55.3 1.66Forth Valley 12.2 53.8 81.3 95.4 52.6 11.0 50.5 1.53Grampian 11.7 43.4 83.4 103.2 57.3 12.8 54.6 1.56Greater Glasgow & Clyde 11.8 36.9 67.8 95.6 60.6 14.1 50.4 1.43Highland 13.3 65.1 98.0 94.5 56.5 13.6 55.6 1.71Lanarkshire 14.9 54.2 97.7 105.3 52.9 11.0 56.0 1.68Lothian 11.4 31.7 61.7 91.8 66.4 15.1 49.3 1.39Orkney 10.1 63.7 97.5 80.8 44.3 10.3 51.1 1.53Shetland 12.2 60.5 113.8 129.5 68.6 19.4 66.9 2.02Tayside 14.0 47.5 82.0 95.3 51.5 10.3 51.4 1.50Western Isles 13.7 57.2 111.3 103.9 63.0 15.7 58.6 1.82
Footnotes1) Live births (registered in the calendar year) per 1,000 females (mid-year population estimate).2) Includes any births to mothers who were aged under 15.3) Includes any births to mothers who were aged 45 or over.4) Total live births (including any whose mother's age was not known) per 1,000 women aged 15-44 (inclusive).
Table 3.16: Fertility rates (per 1,000 women)1 by age group and administrative area Scotland, 2016
General Fertility Rate 4
Approximate Total fertility
Rate 5
(per woman)15-19 2 40-44 3
5) The total fertility rate is the average number of children (per woman) that would be born to a cohort of women if they experienced, throughout their childbearing years, the age-specific fertility rates of the calendar year in question. The TFRs give here are approximate, being calculated by adding up the fertility rates for the 5-year-age-groups, multiplying by five (to get a result which is roughly the same as that of adding together all the fertility rates for each individual year of age) and dividing by 1,000 to get a 'per woman' figure. TFRs calculated in this way may differ slightly from TFRs calculated using data for individual years of age - so the TFR that is given here for Scotland may differ from the TFRs shown in other tables.
Page 52
Year Live births Stillbirths Infant deaths
Both sexes1946-50 101,222 3,047 5,037 2,643 2,146 4,789 1951-55 91,366 2,390 3,979 1,893 1,116 3,009 1956-60 98,663 2,307 3,917 1,874 881 2,755 1961-65 102,642 2,000 3,512 1,745 823 2,568 1966-70 93,033 1,415 2,512 1,280 690 1,970 1971-75 75,541 939 1,759 956 465 1,421 1976-80 65,758 529 1,046 613 287 900
66,422 389 729 421 274 695 1986-90 65,544 350 598 309 241 550 1991-95 63,571 382 (314) 586 (565) 267 150 418
1996-2000 56,856 327 (248) 478 (399) 204 112 316 2001-05 52,914 297 (232) 425 (361) 179 96 275 2006-10 58,270 311 (235) 433 (357) 169 77 245 2011-15 56,891 249 (190) 348 (288) 137 67 205
1971 86,728 1,155 2,151 1,168 554 1,722 1972 78,550 1,053 1,888 974 503 1,477 1973 74,392 873 1,690 942 470 1,412 1974 70,093 850 1,617 897 429 1,326 1975 67,943 765 1,448 799 369 1,168 1976 64,895 629 1,199 666 293 959 1977 62,342 553 1,150 706 298 1,004 1978 64,295 524 999 564 266 830 1979 68,366 475 973 594 284 878 1980 68,892 463 909 535 296 831 1981 69,054 436 808 474 306 780 1982 66,196 386 766 472 281 753 1983 65,078 379 696 379 267 646 1984 65,106 379 718 416 256 672 1985 66,676 366 656 364 260 624 1986 65,812 385 673 343 238 581 1987 66,241 339 594 312 251 563 1988 66,212 357 594 300 243 543 1989 63,480 319 553 300 254 554 1990 65,973 349 574 289 221 510 1991 67,024 369 582 292 181 473 1992 65,789 356 (321) 597 (562) 304 145 449 1993 63,337 409 (306) 611 (508) 254 158 412 1994 61,656 381 (281) 558 (458) 246 136 382 1995 60,051 397 (294) 582 (479) 241 132 375 1996 59,296 381 (300) 552 (471) 233 132 365 1997 59,440 319 (245) 466 (392) 189 127 316 1998 57,319 351 (259) 504 (412) 206 114 320 1999 55,147 286 (220) 422 (356) 182 94 276 2000 53,076 298 (215) 448 (365) 212 93 305 2001 52,527 301 (242) 449 (390) 199 91 290 2002 51,270 278 (216) 391 (329) 163 107 270 2003 52,432 296 (237) 424 (365) 178 87 265 2004 53,957 317 (240) 439 (362) 166 100 266 2005 54,386 292 (226) 423 (357) 190 94 284 2006 55,690 296 (226) 415 (345) 172 76 248 2007 57,781 327 (240) 456 (369) 188 84 272 2008 60,041 325 (261) 447 (383) 168 85 253 2009 59,046 317 (237) 437 (357) 165 70 235 2010 58,791 291 (211) 409 (329) 150 68 218 2011 58,590 299 (222) 409 (332) 159 79 238 2012 58,027 274 (215) 379 (320) 148 69 217 2013 56,014 234 (178) 327 (271) 131 55 186 2014 56,725 228 (175) 334 (281) 137 70 207 2015 55,098 211 (158) 291 (238) 112 63 175 2016 54,488 236 (167) 326 (257) 121 60 181
Table 4.01: Live births, stillbirths1, perinatal, neonatal, postneonatal and infant deaths, Scotland, 1946 to 2016
Perinatal deaths
Neonatal deaths
Postneonatal deaths
Page 53
Year Live births Stillbirths Infant deaths
1946-50 52,146 1,606 2,767 1,527 1,248 2,775 1951-55 46,952 1,244 2,173 1,104 626 1,730 1956-60 50,677 1,162 2,119 1,109 489 1,599 1961-65 52,862 1,003 1,906 1,035 459 1,494 1966-70 47,996 717 1,357 742 399 1,141 1971-75 38,838 473 956 558 258 816 1976-80 33,860 268 577 363 157 521 1981-85 34,023 217 407 230 166 396 1986-90 33,661 133 328 177 147 323 1991-95 32,491 210 (174) 332 (295) 156 86 243
1996-2000 29,195 181 (136) 268 (223) 116 65 182 2001-05 27,152 156 (121) 229 (194) 102 55 157 2006-10 29,755 164 (124) 235 (195) 95 45 140 2011-15 29,212 122 (95) 177 (149) 76 40 116
1971 44,467 613 1,205 689 299 988 1972 40,280 528 1,013 561 272 833 1973 38,601 441 939 570 271 841 1974 35,824 424 864 509 239 748 1975 35,017 358 757 461 208 669 1976 33,501 324 670 396 172 568 1977 31,993 246 603 417 168 585 1978 33,059 274 559 339 140 479 1979 35,351 257 544 343 147 490 1980 35,395 237 507 322 159 481 1981 35,283 231 432 249 186 435 1982 33,911 219 447 275 161 436 1983 33,656 215 393 206 174 380 1984 33,144 224 419 234 155 389 1985 34,120 197 345 186 156 342 1986 33,874 208 372 190 144 334 1987 33,970 156 303 181 150 331 1988 34,060 186 331 181 143 324 1989 32,504 185 326 172 159 331 1990 33,898 183 309 159 138 297 1991 34,419 203 340 188 111 299 1992 33,610 198 (178) 352 (332) 184 81 265 1993 32,374 233 (174) 353 (294) 146 94 240 1994 31,399 203 (148) 302 (247) 137 75 212 1995 30,652 215 (165) 311 (261) 127 68 197 1996 30,523 215 (170) 309 (264) 131 75 206 1997 30,516 164 (124) 248 (208) 104 82 186 1998 29,496 194 (141) 284 (231) 117 66 183 1999 28,246 157 (121) 240 (204) 108 53 161 2000 27,196 173 (123) 260 (210) 122 51 173 2001 26,786 163 (131) 248 (216) 108 47 155 2002 26,218 150 (114) 209 (173) 97 70 167 2003 26,906 154 (115) 226 (187) 98 48 146 2004 27,769 172 (135) 247 (210) 101 59 160 2005 28,083 139 (110) 214 (185) 107 52 159 2006 28,473 151 (114) 221 (184) 97 48 145 2007 29,694 175 (133) 251 (209) 104 50 154 2008 30,570 177 (142) 250 (215) 92 48 140 2009 30,165 158 (118) 229 (189) 100 42 142 2010 29,872 157 (114) 222 (179) 84 35 119 2011 30,111 153 (115) 216 (178) 91 48 139 2012 29,713 136 (104) 198 (166) 88 45 133 2013 28,828 106 (84) 152 (130) 65 33 98 2014 29,056 112 (91) 168 (147) 72 38 110 2015 28,354 104 (81) 149 (126) 63 36 99 2016 28,236 116 (77) 167 (128) 66 28 94
Perinatal deaths
Neonatal deaths
Postneonatal deaths
Males 2
Page 54
Year Live births Stillbirths Infant deaths
Females1946-50 49,076 1,441 2,270 1,117 898 2,015 1951-55 44,414 1,146 1,807 789 490 1,279 1956-60 47,986 1,145 1,798 765 392 1,157 1961-65 49,780 997 1,606 710 364 1,074 1966-70 45,037 698 1,156 538 291 829 1971-75 36,703 466 803 398 207 605 1976-80 31,898 261 469 250 130 380 1981-85 32,399 172 322 191 108 299 1986-90 31,882 166 269 132 95 227 1991-95 31,081 172 (141) 254 (223) 111 65 176
1996-2000 27,660 146 (112) 210 (176) 88 47 135 2001-05 25,762 141 (111) 196 (166) 77 41 118 2006-10 28,515 148 (111) 198 (161) 73 32 105 2011-15 27,678 127 (95) 171 (139) 62 27 89
1971 42,261 542 946 479 255 734 1972 38,270 525 875 413 231 644 1973 35,791 432 751 372 199 571 1974 34,269 426 753 388 190 578 1975 32,926 407 691 338 161 499 1976 31,394 305 529 270 121 391 1977 30,349 307 547 289 130 419 1978 31,236 250 440 225 126 351 1979 33,015 218 429 251 137 388 1980 33,497 226 402 213 137 350 1981 33,771 205 376 225 120 345 1982 32,285 167 319 197 120 317 1983 31,422 164 303 173 93 266 1984 31,962 155 299 182 101 283 1985 32,556 169 311 178 104 282 1986 31,938 177 301 153 94 247 1987 32,271 183 291 131 101 232 1988 32,152 171 263 119 100 219 1989 30,976 134 227 128 95 223 1990 32,075 166 265 130 83 213 1991 32,605 166 242 104 70 174 1992 32,179 158 (143) 245 (230) 120 64 184 1993 30,963 176 (132) 258 (214) 108 64 172 1994 30,257 178 (133) 256 (211) 109 61 170 1995 29,399 182 (129) 271 (218) 114 64 178 1996 28,773 165 (129) 242 (206) 102 57 159 1997 28,924 155 (121) 218 (184) 85 45 130 1998 27,823 157 (118) 220 (181) 89 48 137 1999 26,901 129 (99) 182 (152) 74 41 115 2000 25,880 125 (92) 188 (155) 90 42 132 2001 25,741 138 (111) 201 (174) 91 44 135 2002 25,052 128 (102) 182 (156) 66 37 103 2003 25,526 142 (122) 198 (178) 80 39 119 2004 26,188 145 (105) 192 (152) 65 41 106 2005 26,303 153 (116) 209 (172) 83 42 125 2006 27,217 145 (112) 194 (161) 75 28 103 2007 28,087 152 (107) 205 (160) 84 34 118 2008 29,471 148 (119) 197 (168) 76 37 113 2009 28,881 159 (119) 208 (168) 65 28 93 2010 28,919 134 (97) 187 (150) 66 33 99 2011 28,479 146 (107) 193 (154) 68 31 99 2012 28,314 138 (111) 181 (154) 60 24 84 2013 27,186 128 (94) 175 (141) 66 22 88 2014 27,669 116 (84) 166 (134) 65 32 97 2015 26,744 107 (77) 142 (112) 49 27 76 2016 26,252 120 (90) 159 (129) 55 32 87
Footnotes
2) Includes any cases for which the sex was not known.
Perinatal deaths
Neonatal deaths
Postneonatal deaths
1) The Still-Birth (Definition) Act 1992 re-defined stillbirths, from 1 October 1992, to include losses between 24 and 27 weeks gestation. This table includes all stillbirths registered during the year. The figures in brackets show those stillbirths with a gestation period of 28 weeks and over.
Page 55
© Crown Copyright 2017
Page 56
Scotland, 1946 to 2016
YearRates per 1,000 births (live and still)
Stillbirths Perinatal deaths
Both sexes1946-50 29.2 48.3 54.6 26.1 47.31951-55 25.5 42.4 45.7 20.7 32.91956-60 22.8 38.8 41.4 19.0 27.91961-65 19.1 33.6 35.8 17.0 25.01966-70 15.0 26.6 28.5 13.8 21.21971-75 12.3 23.0 24.8 12.7 18.8
8.0 15.8 17.2 9.3 13.71981-85 5.8 10.9 12.1 6.3 10.51986-90 5.3 9.1 10.0 4.7 8.41991-95 6.0 (4.9) 9.2 (8.1) 10.2 (9.1) 4.2 6.6
1996-2000 5.7 (4.3) 8.4 (7.0) 9.3 (7.9) 3.6 5.62001-05 5.6 (4.4) 8.0 (6.8) 9.0 (7.7) 3.4 5.22006-10 5.3 (4.0) 7.4 (6.1) 8.2 (6.9) 2.9 4.22011-15 4.4 (3.3) 6.1 (5.0) 6.7 (5.7) 2.4 3.6
1971 13.1 24.5 26.8 13.5 19.91972 13.2 23.7 25.5 12.4 18.81973 11.6 22.5 24.1 12.7 19.01974 12.0 22.8 24.6 12.8 18.91975 11.1 21.1 22.8 11.8 17.21976 9.6 18.3 19.8 10.3 14.81977 8.8 18.3 20.0 11.3 16.11978 8.1 15.4 16.8 8.8 12.91979 6.9 14.1 15.5 8.7 12.81980 6.7 13.1 14.4 7.8 12.11981 6.3 11.6 13.1 6.9 11.31982 5.8 11.5 12.9 7.1 11.41983 5.8 10.6 11.6 5.8 9.91984 5.8 11.0 12.1 6.4 10.31985 5.5 9.8 10.9 5.5 9.41986 5.8 10.2 11.0 5.2 8.81987 5.1 8.9 9.8 4.7 8.51988 5.4 8.9 9.9 4.5 8.21989 5.0 8.7 9.7 4.7 8.71990 5.3 8.7 9.6 4.4 7.71991 5.5 8.6 9.8 4.4 7.11992 5.4 (4.9) 9.0 (8.5) 10.0 (9.4) 4.6 6.81993 6.4 (4.8) 9.6 (8.0) 10.4 (8.8) 4.0 6.51994 6.1 (4.5) 9.0 (7.4) 10.1 (8.5) 4.0 6.21995 6.6 (4.9) 9.6 (7.9) 10.6 (8.9) 4.0 6.21996 6.4 (5.0) 9.2 (7.9) 10.3 (8.9) 3.9 6.21997 5.3 (4.1) 7.8 (6.6) 8.5 (7.3) 3.2 5.31998 6.1 (4.5) 8.7 (7.2) 9.7 (8.1) 3.6 5.61999 5.2 (4.0) 7.6 (6.4) 8.4 (7.3) 3.3 5.02000 5.6 (4.0) 8.4 (6.8) 9.6 (8.0) 4.0 5.72001 5.7 (4.6) 8.5 (7.4) 9.5 (8.4) 3.8 5.52002 5.4 (4.2) 7.6 (6.4) 8.6 (7.4) 3.2 5.32003 5.6 (4.5) 8.0 (6.9) 9.0 (7.9) 3.4 5.12004 5.8 (4.4) 8.1 (6.7) 8.9 (7.5) 3.1 4.92005 5.3 (4.1) 7.7 (6.5) 8.8 (7.6) 3.5 5.22006 5.3 (4.0) 7.4 (6.2) 8.4 (7.1) 3.1 4.5
Table 4.02: Stillbirth,1 perinatal, neonatal, postneonatal and infant death rates
Rates per 1,000 live birthsStillbirths
and neonatal deaths
Neonatal deaths
Infant deaths
Page 57
2007 5.6 (4.1) 7.8 (6.4) 8.9 (7.4) 3.3 4.72008 5.4 (4.3) 7.4 (6.4) 8.2 (7.1) 2.8 4.22009 5.3 (4.0) 7.4 (6.0) 8.1 (6.8) 2.8 4.02010 4.9 (3.6) 6.9 (5.6) 7.5 (6.1) 2.6 3.72011 5.1 (3.8) 6.9 (5.6) 7.8 (6.5) 2.7 4.12012 4.7 (3.7) 6.5 (5.5) 7.2 (6.2) 2.6 3.72013 4.2 (3.2) 5.8 (4.8) 6.5 (5.5) 2.3 3.32014 4.0 (3.1) 5.9 (4.9) 6.4 (5.5) 2.4 3.62015 3.8 (2.9) 5.3 (4.3) 5.8 (4.9) 2.0 3.22016 4.3 (3.1) 6.0 (4.7) 6.5 (5.3) 2.2 3.3
Year
Rates per 1,000 births (live and still)
Stillbirths Perinatal deaths
1946-50 29.9 51.5 58.3 29.3 53.21951-55 25.8 45.1 48.7 23.5 36.81956-60 22.4 40.9 43.8 21.9 31.51961-65 18.6 35.4 37.8 19.6 28.31966-70 14.7 27.8 30 15.5 23.81971-75 12.0 24.3 26.2 14.4 21.01976-80 7.9 16.9 18.5 10.7 15.41981-85 6.3 11.9 13.1 6.8 11.71986-90 5.4 9.7 10.6 5.3 9.51991-95 6.4 (5.3) 10.1 (9.0) 1.2 (10.1) 4.8 7.5
1996-2000 6.1 (4.6) 9.1 (7.6) 10.1 (8.6) 4.0 6.22001-05 5.7 (4.4) 8.4 (7.1) 9.4 (8.2) 3.8 5.82006-10 5.5 (4.2) 7.8 (6.5) 8.6 (7.3) 3.2 4.72011-15 4.2 (3.2) 6.0 (5.1) 6.7 (5.8) 2.6 4.0
1971 13.6 26.7 28.9 15.5 22.21972 12.9 24.8 26.7 13.9 20.71973 11.3 24.1 25.9 14.8 21.81974 11.7 23.8 25.7 14.2 20.91975 10.1 21.4 23.2 13.2 19.11976 9.6 19.8 21.3 11.8 17.01977 7.6 18.7 20.6 13.0 18.31978 8.2 16.8 18.4 10.3 14.51979 7.2 15.3 16.9 9.7 13.91980 6.7 14.2 15.7 9.1 13.61981 6.5 12.2 13.5 7.1 12.31982 6.4 13.1 14.5 8.1 12.91983 6.3 11.6 12.4 6.1 11.31984 6.7 12.6 13.7 7.1 11.71985 5.7 10.1 11.2 5.5 10.01986 6.1 10.9 11.7 5.6 9.91987 4.6 8.9 9.9 5.3 9.71988 5.4 9.7 10.7 5.3 9.51989 5.7 10.1 10.9 5.3 10.21990 5.4 9.1 10.0 4.7 8.81991 5.9 9.8 11.3 5.5 8.71992 5.9 (5.3) 10.4 (9.8) 1.3 (10.7) 5.5 7.91993 7.1 (5.3) 10.8 (9.1) 11.6 (9.9) 4.5 7.41994 6.4 (4.7) 9.6 (7.8) 10.8 (9.0) 4.4 6.81995 7.0 (5.3) 10.1 (8.5) 11.1 (9.5) 4.1 6.41996 7.0 (5.5) 10.1 (8.6) 11.3 (9.8) 4.3 6.7
Rates per 1,000 live births
Stillbirths and
neonatal deaths
Neonatal deaths
Infant deaths
Males 2
Page 58
1997 5.3 (4.0) 8.1 (6.8) 8.7 (7.4) 3.4 6.11998 6.5 (4.8) 9.6 (7.8) 10.5 (8.7) 4.0 6.21999 5.5 (4.3) 8.4 (7.2) 9.3 (8.1) 3.8 5.72000 6.3 (4.5) 9.5 (7.7) 10.8 (9.0) 4.5 6.42001 6.0 (4.9) 9.2 (8.0) 10.1 (8.9) 4.0 5.82002 5.7 (4.3) 7.9 (6.6) 9.4 (8.0) 3.7 6.42003 5.7 (4.3) 8.4 (6.9) 9.3 (7.9) 3.6 5.42004 6.2 (4.8) 8.8 (7.5) 9.8 (8.5) 3.6 5.82005 4.9 (3.9) 7.6 (6.6) 8.7 (7.7) 3.8 5.72006 5.3 (4.0) 7.7 (6.4) 8.7 (7.4) 3.4 5.12007 5.9 (4.5) 8.4 (7.0) 9.3 (7.9) 3.5 5.22008 5.8 (4.6) 8.1 (7.0) 8.7 (7.6) 3.0 4.62009 5.2 (3.9) 7.6 (6.2) 8.5 (7.2) 3.3 4.72010 5.2 (3.8) 7.4 (6.0) 8.0 (6.6) 2.8 4.02011 5.1 (3.8) 7.1 (5.9) 8.1 (6.8) 3.0 4.62012 4.6 (3.5) 6.6 (5.6) 7.5 (6.4) 3.0 4.52013 3.7 (2.9) 5.3 (4.5) 5.9 (5.2) 2.3 3.42014 3.8 (3.1) 5.8 (5.0) 6.3 (5.6) 2.5 3.82015 3.7 (2.8) 5.2 (4.4) 5.9 (5.1) 2.2 3.52016 4.1 (2.7) 5.9 (4.5) 6.4 (5.1) 2.3 3.3
Year
Rates per 1,000 births (live and still)
Stillbirths Perinatal deaths
Females 1946-50 28.5 44.9 50.6 22.8 41.11951-55 25.1 39.7 42.5 17.8 28.81956-60 23.3 36.6 38.9 15.9 24.11961-65 19.6 31.6 33.6 14.3 21.61966-70 15.3 25.3 27.0 11.9 18.41971-75 12.5 21.6 23.2 10.8 16.51976-80 8.1 14.6 15.9 7.8 11.91981-85 5.3 9.9 11.1 5.9 9.21986-90 5.2 8.4 9.3 4.1 7.11991-95 5.5 (4.5) 8.2 (7.1) 9.1 (8.0) 3.6 5.6
1996-2000 5.2 (4.0) 7.5 (6.3) 8.4 (7.2) 3.2 4.92001-05 5.4 (4.3) 7.6 (6.4) 8.4 (7.3) 3.0 4.62006-10 5.2 (3.9) 6.9 (5.7) 7.7 (6.4) 2.6 3.72011-15 4.6 (3.4) 6.2 (5.0) 6.8 (5.6) 2.2 3.2
1971 12.7 22.1 23.9 11.3 17.41972 13.5 22.6 24.2 10.8 16.81973 11.9 20.7 22.2 10.4 16.01974 12.3 21.7 23.5 11.3 16.91975 12.2 20.7 22.4 10.3 15.21976 9.6 16.7 18.1 8.6 12.51977 10.0 17.8 19.4 9.5 13.81978 7.9 14.0 15.1 7.2 11.21979 6.6 12.9 14.1 7.6 11.81980 6.7 11.9 13 6.4 10.41981 6.0 11.1 12.7 6.7 10.21982 5.1 9.8 11.2 6.1 9.81983 5.2 9.6 10.7 5.5 8.51984 4.8 9.3 10.5 5.7 8.91985 5.2 9.5 10.6 5.5 8.7
Rates per 1,000 live births
Stillbirths and
neonatal deaths
Neonatal deaths
Infant deaths
Page 59
1986 5.5 9.4 10.3 4.8 7.71987 5.6 9.0 9.7 4.1 7.21988 5.3 8.1 9.0 3.7 6.81989 4.3 7.3 8.4 4.1 7.21990 5.1 8.2 9.2 4.1 6.61991 5.1 7.4 8.2 3.2 5.31992 4.9 (4.4) 7.6 (7.1) 8.6 (8.1) 3.7 5.71993 5.7 (4.2) 8.3 (6.9) 9.1 (7.8) 3.5 5.61994 5.8 (4.4) 8.4 (6.9) 9.4 (8.0) 3.6 5.61995 6.2 (4.4) 9.2 (7.4) 10.0 (8.2) 3.9 6.11996 5.7 (4.5) 8.4 (7.1) 9.2 (8.0) 3.5 5.51997 5.3 (4.2) 7.5 (6.3) 8.3 (7.1) 2.9 4.51998 5.6 (4.2) 7.9 (6.5) 8.8 (7.4) 3.2 4.91999 4.8 (3.7) 6.7 (5.6) 7.5 (6.4) 2.8 4.32000 4.8 (3.5) 7.2 (6.0) 8.3 (7.0) 3.5 5.12001 5.3 (4.3) 7.8 (6.7) 8.8 (7.8) 3.5 5.22002 5.1 (4.1) 7.2 (6.2) 7.7 (6.7) 2.6 4.12003 5.5 (4.8) 7.7 (6.9) 8.6 (7.9) 3.1 4.72004 5.5 (4.0) 7.3 (5.8) 8.0 (6.5) 2.5 4.02005 5.8 (4.4) 7.9 (6.5) 8.9 (7.5) 3.2 4.82006 5.3 (4.1) 7.1 (5.9) 8.0 (6.8) 2.8 3.82007 5.4 (3.8) 7.3 (5.7) 8.4 (6.8) 3.0 4.22008 5.0 (4.0) 6.7 (5.7) 7.6 (6.6) 2.6 3.82009 5.5 (4.1) 7.2 (5.8) 7.7 (6.3) 2.3 3.22010 4.6 (3.3) 6.4 (5.2) 6.9 (5.6) 2.3 3.42011 5.1 (3.7) 6.7 (5.4) 7.5 (6.1) 2.4 3.52012 4.9 (3.9) 6.4 (5.4) 7.0 (6.0) 2.1 3.02013 4.7 (3.4) 6.4 (5.2) 7.1 (5.9) 2.4 3.22014 4.2 (3.0) 6.0 (4.8) 6.5 (5.4) 2.3 3.52015 4.0 (2.9) 5.3 (4.2) 5.8 (4.7) 1.8 2.82016 4.6 (3.4) 6.0 (4.9) 6.6 (5.5) 2.1 3.3
Footnotes
2) Includes any cases for which the sex was not known
© Crown Copyright 2017
1) The Still-Birth (Definition) Act 1992 re-defined stillbirths, from 1 October 1992, to include losses between 24 and 27 weeks gestation. This table is based on all stillbirths registered during the year. The rates in brackets are based on stillbirths with a gestation period of 28 weeks and over.
Page 61
Table 4.03: Infant death rates, by age, Scotland, 1946 to 2016
Year
Rates per 1,000 live births7 to 27 days
1946-50 47.3 19.7 6.5 7.9 7.4 5.9 1951-55 32.9 17.4 3.3 4.9 4.4 2.9 1956-60 27.9 16.3 2.7 3.7 3.1 2.2 1961-65 25.0 14.7 2.3 3.2 2.9 1.9 1966-70 21.2 11.8 2.0 3.0 2.7 1.7 1971-75 18.8 10.9 1.8 2.4 2.2 1.6
13.7 7.9 1.5 1.7 1.6 1.1 1981-85 10.5 5.1 1.2 1.7 1.5 1.0 1986-90 8.4 3.8 0.9 1.5 1.4 0.8 1991-95 6.6 3.2 1.0 1.0 0.7 0.6
1996-2000 5.6 2.7 0.9 1.0 0.6 0.4 2001-05 5.2 2.4 1.0 0.9 0.5 0.3 2006-10 4.2 2.1 0.8 0.7 0.3 0.3 2011-15 3.6 1.8 0.7 0.6 0.3 0.2
1995 6.2 3.1 0.9 0.9 0.6 0.6 1996 6.2 2.9 1.0 1.2 0.5 0.5 1997 5.3 2.5 0.7 1.1 0.6 0.5 1998 5.6 2.7 0.9 0.9 0.8 0.3 1999 5.0 2.5 0.8 0.8 0.5 0.5 2000 5.7 2.8 1.2 1.0 0.5 0.3 2001 5.5 2.8 1.0 0.9 0.5 0.3 2002 5.3 2.2 1.0 1.0 0.6 0.4 2003 5.1 2.4 1.0 0.9 0.6 0.2 2004 4.9 2.3 0.8 0.9 0.5 0.4 2005 5.2 2.4 1.1 1.0 0.4 0.3 2006 4.5 2.1 1.0 0.8 0.2 0.4 2007 4.7 2.2 1.0 0.8 0.3 0.3 2008 4.2 2.0 0.8 0.8 0.3 0.3 2009 4.0 2.0 0.8 0.6 0.2 0.3 2010 3.7 2.0 0.5 0.6 0.4 0.2 2011 4.1 1.9 0.8 0.7 0.4 0.2 2012 3.7 1.8 0.7 0.7 0.3 0.2 2013 3.3 1.7 0.7 0.4 0.3 0.2 2014 3.6 1.9 0.5 0.6 0.3 0.3 2015 3.2 1.5 0.6 0.7 0.2 0.3 2016 3.3 1.7 0.6 0.7 0.3 0.1
© Crown Copyright 2017
Under 1 year
Under 7 days
28 days and under 3 months
3 months and under 6
months
6 months and under 12 months
Page 63
Table 4.04: Stillbirths, by sex and cause, Scotland, 2006 to 2016
Cause of death 2006 2007 2008 2009 2010 2011 2012 2013 2014 2015 2016
All causes P 296 327 325 317 291 299 274 234 228 211 236M 149 169 174 155 154 151 135 106 111 101 116F 145 152 148 159 134 146 138 128 116 107 120
Other - Outwith Chapters P and Q M - - - - 1 - 1 1 2 - -F 1 1 1 - 1 2 1 - - 3 1
NK - - - - - - - - - 1 -P00-P96 M 136 159 161 135 142 133 120 91 102 89 100
F 135 142 129 139 119 136 122 120 100 84 98NK 2 4 3 3 3 2 . - 1 2 -
P00, P04 M 5 3 9 4 2 5 7 1 2 5 4F 5 6 3 6 4 7 8 11 3 7 7
P01 M 2 2 4 3 5 5 2 3 2 - 1F 2 3 6 4 - 1 2 3 2 - -
NK 1 - - - 1 - - - - - -P02 M 24 34 29 29 34 31 32 26 39 17 35
F 21 32 23 22 21 33 29 24 22 24 17NK - - - - 1 - - - - - -
P03 M - - 1 1 - 1 - 1 - - -F 2 - - 2 1 1 - - 1 1 1
P05-08 M 8 5 9 7 4 3 5 2 3 4 -F 1 3 5 7 3 4 1 7 9 2 7
NK - - 1 - - - - - 1 1 5P10-15 Birth trauma M - - - - - - - - - - -
F - - - - - - - - - - -P20-29 M 5 2 2 2 3 4 3 2 3 2 1
F 4 2 5 3 3 7 1 1 1 1 1P35-39 M 2 3 1 2 1 2 1 1 - 2 -
F - 1 4 1 2 1 2 - 2 2 -P50-61 M 2 1 - 1 3 1 3 - 2 5 1
F 9 - - 2 3 1 1 2 1 2 1P70-74 M 1 2 - 2 - 2 5 - - 3 3
F 1 - 1 2 1 1 2 - 1 - -P75-96 M 87 107 106 84 90 79 62 55 51 51 48
Back to contents ICD10
list
XVI. Certain conditions originating in the perinatal period
Maternal conditions unrelated to pregnancyFetus and newborn affected by maternal complications of pregnancy
Fetus and newborn affected by complications of placenta, cord and membranesFetus and newborn affected by other complications of labour and deliveryDisorders related to length of gestation and fetal growth
Respiratory and cardiovascular disorders specific to the perinatal periodInfections specific to the perinatal periodHaemorrhaghic and haematological diseases of fetus and newbornTransistory endocrine and metabolic disorders specific to fetus and newbornOther conditions and disorders originating in the perinatal period
Page 64
P75-96F 90 95 82 90 81 80 76 72 58 45 66
NK 1 4 2 3 1 2 - - - 1 -Q00-Q99 M 13 10 13 20 11 18 14 14 7 12 16
F 9 9 18 20 14 8 15 8 16 20 21NK - 2 - - - - 1 - - - -
Q00-07 M 5 1 3 3 3 3 5 1 1 2 4F 4 2 5 9 2 4 4 2 4 7 7
Q20-28 M 4 1 2 1 1 2 1 - 2 4 2F - - 1 1 1 1 2 2 1 1 4
Q30-34 M - 1 - - - - - 1 - - -F - - - - - - - 1 - - -
Q35-45 M 1 - - - - 1 - - - - -F 1 - 1 - - - - 1 - 1 1
Q50-64 M - 3 - 2 1 - 1 1 - 1 2F - - - - 1 - 1 - 1 - -
Q65-79 M 1 1 2 3 - 4 - 2 - 2 1F - 2 1 1 - 1 - - 2 - 1
Q00-89 M - - 4 6 2 2 3 1 2 1 4F - 2 4 7 3 1 5 2 1 6 2
NK - 2 - - - - 1 - - - -Q90-99 M 2 3 2 4 4 6 4 8 2 2 3
F 4 3 6 2 7 1 3 - 7 5 6
© Crown Copyright 2017
Other conditions and disorders originating in the perinatal period
XVII. Congenital malformations, deformations and chromosomal abnormalitiesCongenital malformations of the nervous systemCongenital malformations of the circulatory system and heartCongenital malformations of the respiratory systemCongenital malformations of the digestive systemCongenital malformations of the genitourinary systemCongenital malformations and deformations of the musculoskeletal systemRemainder of other congenital malformations
Chromosomal abnormalities, not elsewhere classified
Page 65
Table 4.05: Infant deaths, by sex and cause, Scotland, 2006 to 2016
ICD10 list Cause of death 2006 2007 2008 2009 2010 2011 2012 2013 2014 2015 2016
All causes P 248 272 253 235 218 238 217 186 207 175 181M 145 152 140 140 119 139 133 98 109 95 92F 103 118 113 93 99 99 84 88 97 76 87
NK - 2 . 2 - - - - 1 4 2A00-B99 I. Certain infectious and parasitic diseases M 4 1 3 2 - 2 1 1 1 3 -
F 1 3 . 4 2 1 1 2 1 - 1C00-D48 II. Neoplasms M 1 2 . 2 2 2 1 3 1 - -
F 6 - . 1 - 1 . 1 1 - 1E00-E90 M - 1 4 2 4 4 3 - - - -
F 2 - 2 1 - - - 2 3 - 1G00-H99 M - 4 5 1 1 2 4 2 3 5 1
F 1 2 5 2 2 2 1 1 4 2 -I00-I99 IX. Diseases of the circulatory system M - 1 . 1 1 - 1 - 1 - 1
F 1 1 . - - 1 1 1 - - 1J00-J99 X. Diseases of the respiratory system M 2 2 2 1 - - 1 2 1 3 -
F 2 - 2 3 - - 1 - - - 1All other causes in Chapters III, V, XI - XV M - 1 3 2 - - 2 1 3 1 -
F - - 1 - - 1 - 1 - 1 -P00-P96 M 88 92 75 73 62 84 67 55 59 52 45
F 51 65 59 48 56 48 43 46 44 44 47NK - - - 2 - - - - 1 2 2
P00, P04 Maternal conditions unrelated to pregnancy M - - - - 2 - - 3 - 1 -F 1 2 - 1 1 - - 1 1 2 -
P01 M 4 2 2 3 3 7 9 3 5 3 5F 1 4 2 5 1 3 5 3 2 2 4
NK - - - - - - - - - - 1P02 M 5 4 4 4 5 3 7 2 6 3 1
F 5 3 5 7 4 3 2 3 6 4 3P03 M - - - 1 1 - - - 1 - -
F 1 2 1 1 - - - 2 1 - 2P05-08 M 16 21 14 15 13 18 12 10 11 13 11
F 10 13 18 7 10 9 9 7 10 8 5
IV. Endocrine, nutritional and metabolic diseasesVI - VIII. Diseases of the nervous system and the sense organs
D50-D89, F00-F99 and
K00-O99 XVI. Certain conditions originating in the perinatal period
Fetus and newborn affected by maternal complications of pregnancy
Fetus and newborn affected by compllications of placenta, cord and membranesFetus and newborn affected by other complications of labour and deliveryDisorders related to length of gestation and fetal growth
Page 66
P05-08
NK - - - 2 - - - - - 2 1P10-15 Birth trauma M - - - - - - - 1 - - -F - - 1 1 - - 1 - - - -P20-29 M 20 22 19 14 16 22 18 16 15 8 13
F 12 13 8 7 16 8 4 12 9 14 9P35-39 Infections specific to the perinatal period M 19 14 4 8 7 10 10 4 7 10 2F 7 15 8 7 6 7 5 4 3 4 11P50-61 M 8 8 10 9 3 8 4 3 4 3 3
F - 2 4 2 1 4 5 5 1 - 3P70-74 M - - - - - - - - - - -
F - - - - - - - - - - -P75-96 M 16 21 22 19 12 16 7 13 10 11 10
F 14 11 12 10 17 14 12 9 11 10 10Q00-Q99 M 32 31 39 35 29 23 34 23 32 17 33
F 26 29 28 26 27 32 24 27 32 14 23NK - 2 - - - - - - - 2 -
Q00-07 Congenital malformations of the nervous system M 3 3 3 6 2 2 4 2 3 1 4F 5 7 4 4 3 2 4 4 9 2 2NK - 1 - - - - - - - 1 -
Q20-28 M 10 8 13 11 11 8 12 8 9 6 5F 4 12 10 12 5 11 13 5 7 3 10NK - 1 - - - - - - - - -
Q30-34 M 3 5 5 2 - - 1 2 2 1 3F 1 - 1 2 2 4 1 1 - - -
Q35-45 Congenital malformations of the digestive system M - 1 - - 1 2 2 1 2 1 -F 2 - 1 - 2 1 - 2 1 1 -
Q50-64 M 4 2 5 3 3 1 5 4 4 2 5F 5 - 3 1 3 - - 2 1 2 1
Q65-79 M 5 5 7 6 6 3 2 3 7 6 8F 4 3 2 1 3 6 1 2 2 1 2
Q00-89 Remainder of other congenital malformations M 3 6 4 3 1 3 3 2 3 - 5F 2 1 1 4 1 2 2 3 5 2 1
NK - - - - - - - - - 1 -Q90-99 M 4 1 2 4 5 4 5 1 2 - 3
F 3 6 6 2 8 6 3 8 7 3 7R00-R99 M 17 16 9 18 14 19 17 10 7 11 11
F 12 15 13 6 12 12 12 7 7 10 7R95 Sudden infant death syndrome M 17 16 9 17 14 17 17 10 7 10 11
F 10 15 13 6 12 12 12 7 7 9 7V01-Y98 M 1 1 - 3 6 3 2 1 1 3 1
F 1 3 3 2 - 1 1 - 5 5 5
Disorders related to length of gestation and fetal growth
Respiratory and cardiovascular disorders specific to the perinatal period
Haemorrhaghic and haematological diseases of fetus and newbornTransistory endocrine and metabolic disorders specific to fetus and newbornOther conditions and disorders originating in the perinatal periodXVII. Congenital malformations, deformations and chromosomal abnormalities
Congenital malformations of the circulatory system and heart
Congenital malformations of the respiratory system
Congenital malformations and deformations of the genitourinary systemCongenital malformations of the musculoskeletal system
Chromosomal abnormalities, not elsewhere classifiedXVIII. Symptoms, signs and abnormal clinical and laboratory findings, not elsewhere classified - of which
XX. External causes of morbidity and mortality
Page 67
© Crown Copyright 2017
Page 69
Cause of death 2006 2007 2008 2009 2010 2011 2012 2013 2014 2015 2016
All causes P 5.3 5.6 5.4 5.3 4.9 5.1 4.7 4.2 4.0 3.8 4.3M 5.3 5.9 5.8 5.2 5.2 5.1 4.6 3.7 3.8 3.7 4.1F 5.3 5.4 5.0 5.5 4.6 5.1 4.9 4.7 4.2 4.0 4.6
P00-P96 M 4.8 5.5 5.3 4.6 4.8 4.5 4.0 3.1 3.5 3.2 3.5F 4.9 5.0 4.4 4.8 4.1 4.8 4.3 4.4 3.6 3.1 3.7
P02 M 0.8 1.1 0.9 1.0 1.2 1.0 1.1 0.9 1.3 0.6 1.3F 0.8 1.1 0.8 0.8 0.7 1.2 1.0 0.9 0.8 0.9 0.7
P05-08 M 0.3 0.2 0.3 0.2 0.1 0.1 0.2 0.1 0.1 0.2 0.2F - 0.1 0.2 0.2 0.1 0.1 - 0.3 0.3 0.1 0.2
P20-29 M 0.2 0.1 0.1 0.1 0.1 0.1 0.1 0.1 0.1 0.1 -F 0.1 0.1 0.2 0.1 0.1 0.2 - - - - -
Q00-Q99 M 0.5 0.4 0.4 0.7 0.4 0.6 0.5 0.5 0.2 0.4 0.6F 0.3 0.3 0.6 0.7 0.5 0.3 0.5 0.3 0.6 0.7 0.8
Footnotes1) Per 1,000 births (live and still).2) 'Males' includes any cases for which the sex was unknown.
© Crown Copyright 2017
Table 4.06: Stillbirth rates 1, by sex 2 and cause, Scotland, 2006 to 2016Back to contents
ICD10 list
XVI. Certain conditions originating in the perinatal period of which
Fetus and newborn affected by complications of placenta, cord and membranes
Disorders related to length of gestation and fetal growthRespiratory and cardiovascular disorders specific to the perinatal period
XVII. Congenital malformations, deformations and chromosomal abnormalities
Page 71
ICD10 list Cause of death 2006 2007 2008 2009 2010 2011 2012 2013 2014 2015 2016
All causesP 4.5 4.7 4.2 4.0 3.7 4.1 3.7 3.3 3.6 3.2 3.3M 5.1 5.2 4.6 4.7 4.0 4.6 4.5 3.4 3.8 3.5 3.3F 3.8 4.2 3.8 3.2 3.4 3.5 3.0 3.2 3.5 2.8 3.3
A00-O99 All causes in Chapters I - XV M 0.2 0.4 0.6 0.4 0.3 0.4 0.4 0.3 0.3 0.4 0.1F 0.5 0.2 0.3 0.4 0.1 0.2 0.1 0.3 0.3 0.1 0.2
P00-P96 M 3.1 3.1 2.5 2.5 2.1 2.8 2.3 1.9 2.1 1.9 1.7F 1.9 2.3 2.0 1.7 1.9 1.7 1.5 1.7 1.5 1.6 1.8
P05-08 M 0.6 0.7 0.5 0.6 0.4 0.6 0.4 0.3 0.4 0.5 0.4F 0.4 0.5 0.6 0.2 0.3 0.3 0.3 0.3 0.4 0.3 0.2
P20-29 M 0.7 0.7 0.6 0.5 0.5 0.7 0.6 0.6 0.6 0.3 0.5F 0.4 0.5 0.3 0.2 0.6 0.3 0.1 0.4 0.3 0.5 0.3
Q00-Q99 M 1.1 1.1 1.3 1.2 1.0 0.8 1.1 0.8 1.0 0.7 1.2F 1.0 1.0 1.0 0.9 0.9 1.1 0.8 1.0 1.2 0.5 0.9
R00-R99 M 0.6 0.5 0.3 0.6 0.5 0.6 0.6 0.3 0.3 0.4 0.4F 0.4 0.5 0.4 0.2 0.4 0.4 0.4 0.3 0.5 0.4 0.3
R95 Sudden infant death syndrome M 0.6 0.5 0.3 0.6 0.5 0.6 0.6 0.3 0.2 0.4 0.4F 0.4 0.5 0.4 0.2 0.4 0.4 0.4 0.3 0.3 0.3 0.3
V01-Y98 M - - - 0.1 0.2 0.1 0.1 - - 0.1 -F - 0.1 0.1 0.1 - - - - 0.1 0.2 0.2
Footnotes1) Per 1,000 live births.2) 'Males' includes any cases for which the sex was unknown.
© Crown Copyright 2017
Table 4.07: Infant death rates 1, by sex 2 and cause, Scotland, 2006 to 2016
XVI. Certain conditions originating in the perinatal period - of whichDisorders related to length of gestation and fetal growthRespiratory and cardiovascular disorders specific to the perinatal periodXVII. Congenital malformations deformations and chromosomal abnormalitiesXVIII. Symptoms, signs and abnormal clinical and laboratory findings, not elsewhere classified - of which
XX. External causes of morbidity and mortality
Page 74
Table 5.01(a): Death rates, by sex and age, Scotland, 1946-50 to 2011-2015
Year Age group
0 1-4 5-9 10-14 15-24 25-34 35-44 45-54 55-64 65-74 75-84 85-89 90+85+
Persons - rates per 1,000 1946-50 50.5 2.5 1.0 0.8 2.1 2.7 3.8 8.5 19.8 46.8 113.5 254.2 1951-55 34.5 1.4 0.6 0.5 1.0 1.6 3.0 7.8 19.3 46.9 115.2 252.8 1956-60 29.4 1.1 0.5 0.4 0.7 1.2 2.7 7.2 18.8 45.9 110.5 249.4 1961-65 25.9 1.0 0.4 0.4 0.7 1.1 2.7 7.3 19.0 44.9 106.5 233.5 1966-70 21.7 0.9 0.4 0.4 0.7 1.0 2.5 7.0 18.0 42.6 98.2 225.6 1971-75 18.7 0.8 0.4 0.3 0.7 1.0 2.4 7.1 17.8 41.5 93.9 211.5 1976-80 13.9 0.6 0.3 0.3 0.7 1.0 2.3 6.9 17.2 40.0 89.8 203.0 1981-85 10.6 0.5 0.3 0.3 0.6 0.9 1.9 6.0 16.3 38.9 85.5 193.4 1986-90 8.4 0.4 0.2 0.2 0.6 0.9 1.8 5.2 15.1 36.4 81.8 183.4 1991-95 6.5 0.3 0.2 0.2 0.7 0.9 1.7 4.6 13.1 34.0 78.4 148.5 247.6
1996-2000 5.5 0.2 0.2 0.2 0.7 1.0 1.7 4.4 11.7 30.6 71.9 144.0 245.7 2001-05 5.2 0.3 0.1 0.2 0.6 1.0 1.7 4.1 10.3 26.1 65.8 135.3 263.1 2006-10 4.2 0.2 0.1 0.1 0.6 1.0 1.8 3.7 9.0 22.5 59.0 122.8 249.3 2011-15 3.5 0.2 0.1 0.1 0.4 0.8 1.7 3.4 7.9 19.8 53.7 123.1 228.2
Males - rates per 1,000 1946-50 57.2 2.7 1.2 0.9 2.0 2.5 4.3 10.6 25.0 54.5 127.7 227.5 1951-55 38.7 1.6 0.7 0.5 1.2 1.8 3.4 9.6 25.6 57.0 130.4 278.1 1956-60 33.3 1.2 0.5 0.5 1.0 1.5 3.1 9.2 25.3 58.9 127.7 268.6 1961-65 29.4 1.1 0.6 0.5 1.0 1.3 3.2 9.3 25.9 59.8 128.7 266.8 1966-70 24.4 1.0 0.5 0.5 1.0 1.3 3.0 8.8 24.4 57.7 122.3 256.3 1971-75 21.0 0.9 0.5 0.4 1.0 1.2 3.0 8.9 23.8 57.3 122.7 246.4 1976-80 15.7 0.7 0.4 0.3 1.0 1.3 2.8 8.6 22.7 54.2 119.0 243.5 1981-85 11.8 0.5 0.3 0.3 0.9 1.1 2.4 7.6 21.2 51.8 113.3 229.7 1986-90 9.7 0.5 0.2 0.3 1.0 1.2 2.3 6.6 19.3 47.8 107.0 223.0 1991-95 7.4 0.4 0.2 0.2 1.0 1.3 2.1 5.8 16.8 44.0 100.7 189.9 283.9
1996-2000 6.2 0.3 0.2 0.2 1.1 1.4 2.2 5.4 15.0 39.1 90.6 179.1 265.3 2001-05 5.8 0.3 0.1 0.2 0.9 1.5 2.3 5.0 13.0 32.8 80.3 164.2 291.9 2006-10 4.7 0.2 0.1 0.1 0.8 1.5 2.3 4.6 11.0 27.4 70.2 144.6 272.3 2011-15 3.8 0.2 0.1 0.1 0.6 1.1 2.3 4.1 9.7 24.1 63.4 143.3 242.4
Females - rates per 1,000 1946-50 43.5 2.2 0.9 0.8 2.2 2.8 3.3 6.6 15.6 40.6 103.7 243.4 1951-55 30.0 1.3 0.5 0.4 0.9 1.5 2.7 6.0 14.4 39.5 104.6 240.6 1956-60 25.3 0.9 0.4 0.3 0.5 1.0 2.3 5.4 13.5 37.0 99.3 239.8 1961-65 22.3 0.9 0.3 0.3 0.4 0.9 2.2 5.4 13.1 35.1 93.8 217.4 1966-70 18.8 0.8 0.3 0.3 0.4 0.7 2.0 5.4 12.4 32.4 85.8 212.4 1971-75 16.4 0.7 0.3 0.2 0.4 0.7 1.9 5.3 12.6 30.3 80.1 198.5 1976-80 12.1 0.5 0.2 0.2 0.4 0.7 1.9 5.2 12.5 29.6 75.8 190.1 1981-85 9.3 0.4 0.2 0.2 0.3 0.6 1.5 4.5 12.0 29.5 71.4 183.0 1986-90 7.1 0.3 0.1 0.2 0.3 0.5 1.3 3.9 11.3 27.9 68.4 172.0 1991-95 5.6 0.3 0.1 0.2 0.3 0.6 1.3 3.5 9.9 26.3 66.2 134.4 239.5
1996-2000 4.8 0.2 0.1 0.1 0.4 0.5 1.3 3.4 8.7 23.8 60.9 130.7 240.8 2001-05 4.6 0.2 0.1 0.1 0.4 0.5 1.2 3.1 7.8 20.6 56.7 123.4 255.2 2006-10 3.7 0.2 0.1 0.1 0.3 0.5 1.2 2.9 7.0 18.2 51.5 112.6 242.1 2011-15 3.3 0.2 0.0 0.1 0.3 0.5 1.2 2.7 6.4 16.3 47.1 112.3 222.9
© Crown Copyright 2017
Page 75
Year Age group0 1-4 5-9 10-14 15-24 25-34 35-44 45-54 55-64
Persons - rates per 1,000 2001 5.6 0.2 0.1 0.2 0.7 1.0 1.8 4.3 11.1 2002 5.3 0.3 0.1 0.1 0.7 1.1 1.8 4.3 10.7 2003 5.1 0.3 0.1 0.2 0.7 1.0 1.7 3.9 10.6 2004 5.0 0.2 0.1 0.1 0.6 1.0 1.7 4.0 9.8 2005 5.2 0.3 0.1 0.2 0.6 0.9 1.7 3.9 9.4 2006 4.5 0.2 0.1 0.1 0.6 1.0 1.8 3.9 9.4 2007 4.8 0.2 0.1 0.1 0.6 1.0 1.8 3.8 9.3 2008 4.2 0.2 0.1 0.1 0.6 1.0 1.8 3.7 9.0 2009 3.9 0.2 0.1 0.1 0.5 1.0 1.8 3.6 8.6 2010 3.7 0.2 0.1 0.1 0.5 0.9 1.7 3.5 8.6 2011 3.9 0.2 0.1 0.1 0.5 0.9 1.8 3.4 8.1 2012 3.7 0.2 0.1 0.1 0.4 0.9 1.7 3.3 8.0 2013 3.3 0.2 0.0 0.1 0.4 0.8 1.7 3.3 7.8 2014 3.7 0.1 0.1 0.1 0.4 0.7 1.7 3.3 7.6 2015 3.1 0.2 0.1 0.1 0.3 0.8 1.7 3.5 7.7 2016 3.3 0.2 0.1 0.1 0.4 0.9 1.9 3.6 7.8
Males - rates per 1,000 2001 5.9 0.2 0.2 0.2 1.0 1.5 2.4 5.3 14.1 2002 6.4 0.3 0.1 0.2 1.0 1.7 2.4 5.3 13.7 2003 5.5 0.3 0.1 0.2 0.9 1.5 2.3 4.8 13.2 2004 5.8 0.3 0.1 0.1 0.9 1.4 2.3 4.9 12.4 2005 5.7 0.3 0.1 0.2 0.8 1.2 2.3 4.8 11.6 2006 5.1 0.2 0.1 0.1 1.0 1.5 2.4 4.8 11.6 2007 5.3 0.2 0.1 0.2 1.0 1.5 2.4 4.7 11.5 2008 4.6 0.2 0.1 0.1 0.8 1.6 2.3 4.7 11.1 2009 4.6 0.2 0.1 0.1 0.7 1.4 2.4 4.4 10.4 2010 4.0 0.2 0.1 0.1 0.7 1.3 2.2 4.3 10.5 2011 4.5 0.2 0.1 0.1 0.7 1.3 2.4 3.9 9.8 2012 4.4 0.2 0.1 0.1 0.5 1.3 2.2 4.0 9.7 2013 3.4 0.2 0.1 0.1 0.5 1.1 2.3 4.1 9.5 2014 3.8 0.1 0.1 0.1 0.5 0.9 2.3 4.0 9.2 2015 3.4 0.2 0.1 0.1 0.5 1.1 2.2 4.2 9.4 2016 3.3 0.2 0.1 0.1 0.5 1.2 2.5 4.5 9.4
Females - rates per 1,000 2001 5.3 0.2 0.1 0.1 0.4 0.5 1.2 3.2 8.3 2002 4.1 0.3 0.1 0.1 0.4 0.5 1.2 3.3 7.9 2003 4.7 0.2 0.1 0.1 0.4 0.5 1.2 3.1 8.1 2004 4.1 0.2 0.1 0.1 0.4 0.5 1.2 3.0 7.4 2005 4.7 0.3 0.1 0.1 0.3 0.5 1.2 3.0 7.4 2006 3.8 0.3 0.1 0.1 0.3 0.5 1.2 3.0 7.3 2007 4.3 0.2 0.1 0.1 0.3 0.5 1.2 3.0 7.1 2008 3.9 0.2 0.1 0.1 0.4 0.5 1.2 2.8 7.1 2009 3.2 0.2 0.1 0.1 0.3 0.6 1.3 2.8 6.8 2010 3.4 0.2 0.0 0.1 0.3 0.6 1.2 2.7 6.8 2011 3.4 0.2 0.1 0.1 0.3 0.6 1.2 2.9 6.5 2012 3.0 0.1 0.1 0.1 0.2 0.5 1.2 2.6 6.4 2013 3.2 0.2 0.0 0.1 0.2 0.5 1.1 2.6 6.3 2014 3.6 0.1 0.0 0.1 0.3 0.5 1.2 2.6 6.2 2015 2.8 0.1 0.0 0.1 0.2 0.5 1.3 2.8 6.0
Table 5.01(b): Death rates, by sex and age, Scotland, 2001 to 20161
Page 76
2016 3.2 0.2 0.1 0.1 0.3 0.5 1.4 2.7 6.2
Footnote1) A number of amendments have been made to the rates which were wrong in figures published for 2013 and 2014.
© Crown Copyright 2017
Page 77
Age group65-74 75-84 85-89 90+
Persons - rates per 1,000 27.3 66.7 135.9 238.6 27.1 66.1 140.1 271.2 26.5 67.2 142.1 283.4 25.1 64.9 132.5 264.3 24.5 64.0 126.0 260.4 23.4 61.6 122.0 251.3 23.5 60.8 125.1 260.6 22.8 60.1 125.2 257.0 21.5 56.4 123.3 243.8 21.1 56.2 118.6 235.3 20.7 54.1 121.9 220.1 20.0 54.8 124.9 230.5 19.6 53.6 122.3 228.1 18.7 52.4 120.8 215.9 19.8 53.7 125.5 245.7 19.0 52.0 119.7 225.7
Males - rates per 1,000 34.7 81.7 167.6 253.3 34.3 81.3 168.9 306.2 33.2 82.8 171.2 329.9 31.5 78.4 160.2 294.2 30.4 77.5 153.8 280.9 28.5 73.5 146.9 273.9 28.8 73.7 148.4 288.3 28.1 70.0 145.2 281.0 26.4 66.8 146.4 259.5 25.4 66.9 137.1 261.6 25.3 64.1 144.2 235.3 23.8 62.8 145.5 238.5 23.3 62.8 140.9 243.9 22.8 60.8 140.4 233.7 23.9 62.5 145.5 258.2 22.9 60.5 135.3 244.1
Females - rates per 1,000 21.3 57.5 123.6 234.5 21.2 56.8 128.4 262.1 21.0 57.4 130.3 270.7 19.8 56.4 120.9 256.0 19.5 55.2 114.0 254.4 19.1 53.7 110.9 244.6 19.1 52.2 114.5 252.3 18.2 53.3 115.8 249.6 17.3 49.3 112.2 238.8 17.4 48.7 109.3 226.7 16.6 47.0 110.4 214.8 16.6 49.1 114.2 227.6 16.2 46.9 112.3 222.1 15.1 46.1 110.0 209.1 16.0 47.0 114.5 240.6
Back to contents
Page 78
15.4 45.6 110.8 218.1
1) A number of amendments have been made to the rates which were wrong in figures published for 2013 and 2014.
Page 79
Table 5.02: Deaths, by sex, age, and administrative area, Scotland, 2016
Area All ages Age0 1-4 5- 10- 15- 20-
SCOTLANDPersons 56,728 181 42 29 26 98 165
Males 27,760 94 23 19 13 67 108Females 28,968 87 19 10 13 31 57
Aberdeen City P 2,129 8 1 3 1 4 5M 1,024 4 1 3 1 4 4F 1,105 4 - - - - 1
Aberdeenshire P 2,360 7 1 2 3 5 4M 1,170 4 - 1 2 4 4F 1,190 3 1 1 1 1 -
Angus P 1,433 5 - - - 1 3M 693 1 - - - 1 1F 740 4 - - - - 2
Argyll & Bute P 1,110 1 2 - 1 2 1M 560 - 1 - 1 2 1F 550 1 1 - - - -P 4,361 20 5 1 4 6 13
M 2,092 13 3 1 2 5 9F 2,269 7 2 - 2 1 4
Clackmannanshire P 546 1 - - - 1 2 M 263 1 - - - 1 2
F 283 - - - - - -Dumfries & Galloway P 1,858 6 1 2 - 5 5
M 971 4 1 2 - 2 3F 887 2 - - - 3 2
Dundee City P 1,691 12 3 - 1 - 4M 822 7 1 - - - 4F 869 5 2 - 1 - -
East Ayrshire P 1,453 2 1 - - 1 4M 709 1 1 - - 1 2F 744 1 - - - - 2
East Dunbartonshire P 1,114 2 3 - - 1 5M 514 1 2 - - 1 2F 600 1 1 - - - 3
East Lothian P 1,001 4 - - - 1 5M 476 4 - - - 1 2F 525 - - - - - 3
East Renfrewshire P 883 1 1 - - - 3M 397 - - - - - -F 486 1 1 - - - 3
Falkirk P 1,734 8 1 2 - 3 7M 844 4 1 1 - 3 6F 890 4 - 1 - - 1
Fife P 4,091 24 2 3 1 3 7M 1,967 15 2 3 - 2 3F 2,124 9 - - 1 1 4
Glasgow City P 6,321 29 5 4 3 11 15M 3,142 12 3 2 2 9 11F 3,179 17 2 2 1 2 4
Highland P 2,397 3 - - 3 7 11M 1,260 1 - - - 5 6F 1,137 2 - - 3 2 5
City of Edinburgh1
Page 80
Area All ages Age0 1-4 5- 10- 15- 20-
Inverclyde P 1,006 1 - - - - 3M 491 1 - - - - 3F 515 - - - - - -
Midlothian P 848 2 - - - 4 2M 425 1 - - - 1 1F 423 1 - - - 3 1
Moray P 979 1 - - 2 3 5M 494 1 - - 1 2 5F 485 - - - 1 1 -P 359 - - - - - 1
M 183 - - - - - 1F 176 - - - - - -
North Ayrshire P 1,593 8 2 - - 2 6M 800 2 2 - - 1 3F 793 6 - - - 1 3
North Lanarkshire P 3,568 4 2 3 3 10 10M 1,791 4 1 1 2 8 7F 1,777 - 1 2 1 2 3
Orkney Islands P 223 - - - 1 - -M 100 - - - 1 - -F 123 - - - - - -
Perth & Kinross P 1,617 8 2 - - 6 6M 750 4 1 - - 3 2F 867 4 1 - - 3 4
Renfrewshire P 2,070 2 2 3 1 2 5M 1,015 - - 2 - 1 3F 1,055 2 2 1 1 1 2
Scottish Borders P 1,277 2 - - - 3 2M 635 1 - - - 2 2F 642 1 - - - 1 -
Shetland Islands P 232 - - - - - 2M 122 - - - - - 2F 110 - - - - - -
South Ayrshire P 1,445 3 2 1 1 - 8M 683 1 1 - 1 - 4F 762 2 1 1 - - 4
South Lanarkshire P 3,529 9 4 2 - 4 10M 1,697 3 2 - - 3 9F 1,832 6 2 2 - 1 1
Stirling P 899 - - - - 4 3M 436 - - - - 2 2F 463 - - - - 2 1
West Dunbartonshire P 1,050 1 1 - 1 4 2M 493 1 - - - 2 1F 557 - 1 - 1 2 1
West Lothian P 1,551 7 1 3 - 5 6M 741 3 - 3 - 1 3F 810 4 1 - - 4 3
Table 5.02: (continued)
Area All ages Age0 1-4 5- 10- 15- 20-
Na h-Eileanan Siar1
Page 81
Ayrshire & Arran P 4,491 13 5 1 1 3 18M 2,192 4 4 - 1 2 9F 2,299 9 1 1 - 1 9
Borders P 1,277 2 - - - 3 2M 635 1 - - - 2 2F 642 1 - - - 1 -
Dumfries & Galloway P 1,858 6 1 2 - 5 5M 971 4 1 2 - 2 3F 887 2 - - - 3 2
Fife P 4,091 24 2 3 1 3 7M 1,967 15 2 3 - 2 3F 2,124 9 - - 1 1 4
Forth Valley P 3,179 9 1 2 - 8 12M 1,543 5 1 1 - 6 10F 1,636 4 - 1 - 2 2
Grampian P 5,468 16 2 5 6 12 14M 2,688 9 1 4 4 10 13F 2,780 7 1 1 2 2 1P 12,444 36 12 7 5 18 33M 6,052 15 5 4 2 13 20F 6,392 21 7 3 3 5 13
Highland P 3,507 4 2 - 4 9 12M 1,820 1 1 - 1 7 7F 1,687 3 1 - 3 2 5
Lanarkshire P 7,097 13 6 5 3 14 20M 3,488 7 3 1 2 11 16F 3,609 6 3 4 1 3 4
Lothian P 7,761 33 6 4 4 16 26M 3,734 21 3 4 2 8 15F 4,027 12 3 - 2 8 11
Orkney P 223 - - - 1 - -M 100 - - - 1 - -F 123 - - - - - -
Shetland P 232 - - - - - 2M 122 - - - - - 2F 110 - - - - - -
Tayside P 4,741 25 5 - 1 7 13M 2,265 12 2 - - 4 7F 2,476 13 3 - 1 3 6
Western Isles P 359 - - - - - 1M 183 - - - - - 1F 176 - - - - - -
Footnote1) The alphabetical order of the council areas has changed due to adoption of the preferred forms of reference to the Edinburgh and Western Isles council areas. Previous versions of this table used the forms 'Edinburgh, City of' and 'Eilean Siar'.
© Crown Copyright 2017
Greater Glasgow & Clyde
Page 82
Age25- 30- 35- 40- 45- 50- 55- 60- 65- 70-
276 363 470 822 1,173 1,699 2,302 3,082 4,767 5,818206 238 292 530 721 1,031 1,367 1,807 2,844 3,245
70 125 178 292 452 668 935 1,275 1,923 2,5736 11 29 43 60 57 106 123 191 1646 6 18 23 38 35 63 78 118 99- 5 11 20 22 22 43 45 73 654 10 15 28 43 65 85 113 175 2374 7 8 15 23 43 52 72 114 133- 3 7 13 20 22 33 41 61 1043 4 10 14 14 43 50 81 114 1333 3 6 6 7 27 22 49 71 81- 1 4 8 7 16 28 32 43 524 5 5 12 18 26 46 66 92 1124 4 4 9 14 20 25 37 59 71- 1 1 3 4 6 21 29 33 41
26 37 37 70 101 123 166 211 315 37918 25 26 40 59 81 104 127 178 220
8 12 11 30 42 42 62 84 137 1595 7 5 6 13 13 18 43 45 653 6 3 4 9 6 7 30 23 402 1 2 2 4 7 11 13 22 257 8 15 14 28 33 67 78 153 1943 7 9 11 14 22 51 48 97 1094 1 6 3 14 11 16 30 56 85
18 14 21 35 35 60 78 101 154 15212 9 11 28 23 36 43 65 78 83
6 5 10 7 12 24 35 36 76 698 7 12 25 28 53 42 69 130 1835 6 7 13 19 34 23 31 78 1003 1 5 12 9 19 19 38 52 833 4 6 13 14 23 43 55 68 1162 2 4 9 8 11 29 29 28 621 2 2 4 6 12 14 26 40 547 6 10 10 19 33 32 47 83 1055 4 6 8 10 17 19 26 44 552 2 4 2 9 16 13 21 39 502 3 2 9 12 17 32 28 57 812 2 - 6 5 9 12 21 33 45- 1 2 3 7 8 20 7 24 368 13 14 36 37 56 62 101 116 2017 7 10 23 22 28 32 62 68 1101 6 4 13 15 28 30 39 48 91
20 23 35 55 68 124 145 210 361 43013 16 17 36 32 75 84 125 209 233
7 7 18 19 36 49 61 85 152 19739 53 65 131 206 264 307 408 602 61729 35 44 95 147 161 187 240 372 34310 18 21 36 59 103 120 168 230 274
7 12 20 31 37 59 114 133 197 2507 6 17 22 25 35 76 78 127 153- 6 3 9 12 24 38 55 70 97
Back to contents
Page 83
Age25- 30- 35- 40- 45- 50- 55- 60- 65- 70-
2 5 9 22 27 33 35 52 95 981 3 2 17 18 19 24 29 64 571 2 7 5 9 14 11 23 31 414 3 5 5 10 18 37 53 84 1003 3 2 2 5 12 23 31 55 571 - 3 3 5 6 14 22 29 434 4 3 8 11 20 34 43 90 1044 2 3 7 9 10 19 19 53 62- 2 - 1 2 10 15 24 37 421 1 2 4 5 6 10 22 37 441 - 1 2 3 2 6 14 21 27- 1 1 2 2 4 4 8 16 175 13 15 27 34 48 73 98 141 1874 9 12 16 21 30 39 53 83 1081 4 3 11 13 18 34 45 58 79
20 28 37 66 104 129 173 211 347 39816 18 23 40 67 81 101 118 202 222
4 10 14 26 37 48 72 93 145 176- 2 - 1 1 8 9 13 15 16- 2 - - - 4 5 9 8 5- - - 1 1 4 4 4 7 115 6 9 16 29 31 53 62 126 1614 5 6 10 15 16 34 32 70 831 1 3 6 14 15 19 30 56 78
18 11 10 30 38 57 87 117 173 22812 3 8 19 19 34 55 72 107 116
6 8 2 11 19 23 32 45 66 1123 8 3 5 17 33 52 60 98 1323 6 3 4 7 19 31 38 53 73- 2 - 1 10 14 21 22 45 59- 1 1 2 - 9 9 6 12 21- 1 - 1 - 6 4 4 11 12- - 1 1 - 3 5 2 1 98 12 11 24 28 44 47 63 110 1605 9 6 14 18 25 26 35 66 833 3 5 10 10 19 21 28 44 77
18 31 38 47 75 101 156 213 266 37513 19 18 34 48 70 93 124 155 197
5 12 20 13 27 31 63 89 111 1785 2 5 2 15 21 30 44 81 834 1 5 - 9 12 20 22 54 491 1 - 2 6 9 10 22 27 349 9 11 15 18 35 48 64 86 1138 6 8 6 12 21 28 37 55 601 3 3 9 6 14 20 27 31 537 10 10 16 28 57 56 94 153 1795 6 5 10 15 30 30 52 90 972 4 5 6 13 27 26 42 63 82
Age25- 30- 35- 40- 45- 50- 55- 60- 65- 70-
Page 84
21 32 38 76 90 145 162 230 381 53014 24 25 43 58 89 88 119 227 291
7 8 13 33 32 56 74 111 154 2393 8 3 5 17 33 52 60 98 1323 6 3 4 7 19 31 38 53 73- 2 - 1 10 14 21 22 45 597 8 15 14 28 33 67 78 153 1943 7 9 11 14 22 51 48 97 1094 1 6 3 14 11 16 30 56 85
20 23 35 55 68 124 145 210 361 43013 16 17 36 32 75 84 125 209 233
7 7 18 19 36 49 61 85 152 19718 22 24 44 65 90 110 188 242 34914 14 18 27 40 46 59 114 145 199
4 8 6 17 25 44 51 74 97 15014 25 47 79 114 142 225 279 456 50514 15 29 45 70 88 134 169 285 294
- 10 18 34 44 54 91 110 171 21173 85 103 220 315 429 552 724 1,081 1,25354 51 66 152 209 255 335 428 659 68319 34 37 68 106 174 217 296 422 57011 17 25 43 55 85 160 199 289 36211 10 21 31 39 55 101 115 186 224
- 7 4 12 16 30 59 84 103 13838 59 75 113 179 230 329 424 613 77329 37 41 74 115 151 194 242 357 419
9 22 34 39 64 79 135 182 256 35444 56 62 101 158 231 291 405 635 76331 38 39 60 89 140 176 236 367 42913 18 23 41 69 91 115 169 268 334
- 2 - 1 1 8 9 13 15 16- 2 - - - 4 5 9 8 5- - - 1 1 4 4 4 7 11- 1 1 2 - 9 9 6 12 21- 1 - 1 - 6 4 4 11 12- - 1 1 - 3 5 2 1 9
26 24 40 65 78 134 181 244 394 44619 17 23 44 45 79 99 146 219 247
7 7 17 21 33 55 82 98 175 1991 1 2 4 5 6 10 22 37 441 - 1 2 3 2 6 14 21 27- 1 1 2 2 4 4 8 16 17
1) The alphabetical order of the council areas has changed due to adoption of the preferred forms of reference to the Edinburgh and Western Isles council areas. Previous versions of this table used the forms 'Edinburgh, City of' and 'Eilean Siar'.
Page 85
Age75- 80- 85- 90+
7,462 9,350 9,333 9,2703,843 4,551 3,828 2,9333,619 4,799 5,505 6,337
240 346 386 345122 155 156 90118 191 230 255283 380 403 497156 192 157 179127 188 246 318198 238 256 266107 113 105 90
91 125 151 176133 173 189 222
63 95 87 6370 78 102 159
508 654 776 909264 323 322 272244 331 454 637
80 89 69 8435 38 28 2745 51 41 57
239 338 334 331134 170 157 127105 168 177 204203 260 277 263
98 116 116 92105 144 161 171188 272 229 199102 129 89 68
86 143 140 131124 189 214 231
72 96 72 8452 93 142 147
123 162 179 17572 81 70 5251 81 109 123
120 151 179 18566 70 70 5654 81 109 129
261 276 278 254141 136 112 71120 140 166 183542 673 660 705265 347 269 221277 326 391 484835 1,033 865 829408 488 333 221427 545 532 608284 408 380 441161 211 171 159123 197 209 282
Page 86
Age75- 80- 85- 90+
129 152 169 17463 67 72 5166 85 97 123
109 155 143 11456 73 62 3853 82 81 76
134 168 185 16069 92 77 5965 76 108 10145 49 61 7125 25 32 2320 24 29 48
221 255 239 219121 121 106 69100 134 133 150522 595 505 401249 308 202 121273 287 303 280
34 32 41 5021 11 16 1813 21 25 32
197 271 294 335118 126 122 99
79 145 172 236291 351 349 295146 170 140 108145 181 209 187163 225 224 247
92 107 107 8771 118 117 16037 45 40 4720 19 22 2017 26 18 27
187 225 252 25990 109 95 9597 116 157 164
508 574 619 479263 273 243 130245 301 376 349136 158 150 160
70 79 62 4566 79 88 115
149 175 165 14464 83 56 4585 92 109 99
239 278 223 179110 128 100 53129 150 123 126
Age75- 80- 85- 90+
Page 87
596 752 720 677313 359 290 232283 393 430 445163 225 224 247
92 107 107 8771 118 117 160
239 338 334 331134 170 157 127105 168 177 204542 673 660 705265 347 269 221277 326 391 484477 523 497 498246 253 202 143231 270 295 355657 894 974 1,002347 439 390 328310 455 584 674
1,648 2,051 1,941 1,858819 974 743 565829 1,077 1,198 1,293417 581 569 663224 306 258 222193 275 311 441
1,030 1,169 1,124 880512 581 445 251518 588 679 629979 1,249 1,321 1,377502 605 554 415477 644 767 962
34 32 41 5021 11 16 1813 21 25 3237 45 40 4720 19 22 2017 26 18 27
598 769 827 864323 355 343 281275 414 484 583
45 49 61 7125 25 32 2320 24 29 48
1) The alphabetical order of the council areas has changed due to adoption of the preferred forms of reference to the Edinburgh and Western Isles council areas. Previous versions of this table used the forms 'Edinburgh, City of' and 'Eilean Siar'.
Page 88
Table 5.03: Deaths, by country of birth of deceased, Scotland, 1971 to 2016
Year
Country of birth of deceasedCommonwealth
Total
1971 61,614 59,240 761 .. 237 92 6 106 13 1972 65,017 62,560 832 .. 253 105 13 92 12 1973 64,545 62,289 811 .. 285 102 17 110 23 1974 64,740 62,537 810 145 283 110 11 121 14 1975 63,125 61,143 756 116 283 121 15 102 7 1976 65,253 63,168 821 139 329 137 11 124 17 1977 62,294 60,371 700 179 301 116 9 126 16 1978 65,123 63,148 746 147 326 135 12 129 8 1979 65,747 63,761 756 144 338 129 16 138 14 1980 63,299 61,460 722 166 291 123 13 106 7 1981 63,828 62,007 703 163 348 157 13 130 8 1982 65,022 63,189 683 165 347 144 15 123 12 1983 63,454 61,629 702 160 316 124 14 126 14 1984 62,345 60,586 639 156 355 154 16 135 10 1985 63,967 62,147 656 142 365 152 13 148 8 1986 63,467 61,608 674 162 391 142 8 165 13 1987 62,014 60,204 619 168 414 172 14 150 12 1988 61,957 60,024 592 179 393 165 11 151 7 1989 65,017 63,051 628 172 335 126 12 133 7 1990 61,527 59,721 608 156 385 132 12 172 16 1991 61,041 59,195 593 183 413 165 15 160 13 1992 60,937 59,079 610 216 433 169 9 181 14 1993 64,049 62,148 586 231 430 162 16 174 11 1994 59,328 57,617 524 210 408 160 10 171 14 1995 60,500 58,722 543 240 415 154 7 166 11 1996 60,654 58,911 531 227 510 156 13 196 15 1997 59,494 57,701 551 256 477 190 13 173 12 1998 59,164 57,434 532 237 471 150 11 210 12 1999 60,281 58,539 528 270 465 152 9 201 12 2000 57,799 56,124 499 251 467 158 19 181 16 2001 57,382 55,614 476 271 500 161 13 211 10 2002 58,103 56,305 513 265 531 185 19 212 6 2003 58,472 56,752 486 263 507 181 16 192 14 2004 56,187 54,437 460 463 531 172 .. 238 18 2005 55,747 53,977 518 461 506 163 .. 206 14 2006 55,093 53,287 492 480 540 182 .. 218 13 2007 55,986 54,102 480 512 553 173 .. 240 14 2008 55,700 53,763 446 557 582 167 .. 251 17 2009 53,856 52,025 442 519 534 151 .. 239 17 2010 53,967 52,179 414 503 558 169 .. 239 16 2011 53,661 51,823 435 471 583 168 .. 252 22 2012 54,937 53,024 433 526 620 180 .. 274 19 2013 54,700 52,788 430 578 597 147 .. 275 23 2014 54,239 52,377 405 531 572 176 .. 238 17 2015 57,579 55,524 465 576 620 165 .. 258 16 2016 56,728 54,634 456 583 645 156 .. 297 27
All countries of birth
United Kingdom,
Isle of Man,
Channel Islands
Irish Republic including Ireland, part not stated
Other European
Union1
Australia, Canada,
New Zealand
Malta, Gibraltar, Cyprus2
India, Bangla- desh, Sri Lanka,
Pakistan
West Indies, Belize, Guyana
Page 89
Footnotes1) Included with 'other countries' for 1971 to 1973. From 1974 includes those countries which constituted the European Union in the year in question.2) Malta and Cyprus joined the European Union in 2004, Gibraltar is included in 'Other Commonwealth'.
© Crown Copyright 2017
Page 90
Table 5.03: Deaths, by country of birth of deceased, Scotland, 1971 to 2016
Country of birth of deceasedCommonwealth
Not statedAfrica
5 15 581 795 14 17 669 703
6 27 615 545 8 19 476 489
15 23 469 358 13 27 540 256 14 20 546 197 11 31 503 253 13 28 538 210 17 25 504 156 11 29 489 118 14 39 519 119 18 20 518 129 14 26 478 131 11 33 530 127 20 43 489 143 24 42 505 104 18 41 533 236 17 40 529 302 13 40 534 123 22 38 531 126 19 41 488 111 27 40 542 112 16 37 497 72 28 49 507 73 74 56 427 48 68 21 472 37 67 21 456 34 63 28 444 35 75 18 422 36 75 30 473 48 92 17 459 30 88 16 429 35 80 23 275 21 94 29 262 23
101 26 274 20 99 27 304 35
108 39 320 32 96 31 317 19
102 32 289 24 110 31 319 30 109 38 318 16 118 34 294 13 101 40 316 38 137 44 347 47 134 31 328 82
Back to contents
Other countries
Other Common-
wealth
Page 91
1) Included with 'other countries' for 1971 to 1973. From 1974 includes those countries which constituted the European Union in the year in question.
Page 92
Table 5.04: Deaths, by sex, age, and ethnic group, Scotland, 2016
Sex All ages AgeEthnic group of the deceased (if provided) 0 1-4
PERSONS 56,728 181 42
The person who registered the death was ...Not willing to provide this information 2,336 55 9Unable to provide because didn't know ethnicity 252 9 -Willing and able to provide the deceased's ethnicity 54,140 117 33All 56,728 181 42
White Scottish 47,371 104 33Other British 5,412 2 -Irish 425 - -Gypsy / Traveller 10 - -Polish 133 1 -Other White ethnic group 453 1 -All 53,804 108 33
Mixed or Multiple ethnic groupsMixed or Multiple ethnic groups 21 - -All 21 - -
Asian Pakistani, Pakistani Scottish or Pakistani British 127 5 -Indian, Indian Scottish or Indian British 82 2 -
6 - -
Chinese, Chinese Scottish or Chinese British 30 - -Other Asian 19 1 -All 264 8 -
African African, African Scottish or African British 19 - -Other African 5 - -All 24 - -
Caribbean or Black Caribbean, Caribbean Scottish or Caribbean British 10 - -Black, Black Scottish or Black British 3 1 -Other Caribbean or Black 4 - -All 17 1 -
Other Ethnic GroupArab, Arab Scottish or Arab British 4 - -Other Ethnic Group 6 - -All 10 - -
Sex All ages AgeEthnic group of the deceased (if provided) 0 1-4
MALES 27,760 94 23
Deceased's ethnic group was not provided 1,270 31 3
White Scottish 23,120 55 20
Bangladeshi, Bangladeshi Scottish or Bangladeshi British
Page 93
Other British 2,670 1 -Irish 201 - -Gypsy / Traveller 6 - -Polish 97 1 -Other White ethnic group 209 1 -All 26,303 58 20
Mixed or Multiple ethnic groupsMixed or Multiple ethnic groups 12 - -All 12 - -
Asian Pakistani, Pakistani Scottish or Pakistani British 70 2 -Indian, Indian Scottish or Indian British 53 2 -
3 - -
Chinese, Chinese Scottish or Chinese British 12 - -Other Asian 10 - -All 148 4 -
African African, African Scottish or African British 11 - -Other African 2 - -All 13 - -
Caribbean or Black Caribbean, Caribbean Scottish or Caribbean British 5 - -Black, Black Scottish or Black British 1 1 -Other Caribbean or Black 3 - -All 9 1 -
Other Ethnic GroupArab, Arab Scottish or Arab British 1 - -Other Ethnic Group 4 - -All 5 - -
Table 5.04: (continued)Sex All ages Age
Ethnic group of the deceased (if provided) 0 1-4
FEMALES 28,968 87 19
Deceased's ethnic group was not provided 1,318 33 6
White Scottish 24,251 49 13Other British 2,742 1 -Irish 224 - -Gypsy / Traveller 4 - -Polish 36 - -Other White ethnic group 244 - -All 27,501 50 13
Mixed or Multiple ethnic groupsMixed or Multiple ethnic groups 9 - -All 9 - -
Asian Pakistani, Pakistani Scottish or Pakistani British 57 3 -Indian, Indian Scottish or Indian British 29 - -
3 - -
Chinese, Chinese Scottish or Chinese British 18 - -
Bangladeshi, Bangladeshi Scottish or Bangladeshi British
Bangladeshi, Bangladeshi Scottish or Bangladeshi British
Page 94
Other Asian 9 1 -All 116 4 -
African African, African Scottish or African British 8 - -Other African 3 - -All 11 - -
Caribbean or Black Caribbean, Caribbean Scottish or Caribbean British 5 - -Black, Black Scottish or Black British 2 - -Other Caribbean or Black 1 - -All 8 - -
Other Ethnic GroupArab, Arab Scottish or Arab British 3 - -Other Ethnic Group 2 - -All 5 - -
© Crown Copyright 2017
Page 95
Age5- 10- 15- 20- 25- 30- 35- 40- 45- 50-
29 26 98 165 276 363 470 822 1,173 1,699
9 6 11 21 21 26 34 56 69 83- - 1 1 1 3 10 1 3 7
20 20 86 143 254 334 426 765 1,101 1,60929 26 98 165 276 363 470 822 1,173 1,699
16 17 73 114 230 278 363 673 983 1,4071 1 6 20 12 22 33 48 85 149- - - - 2 3 3 4 2 5- - 1 - - 2 1 - - -1 - - - 4 13 7 8 10 15- 1 3 6 5 11 8 13 7 16
18 19 83 140 253 329 415 746 1,087 1,592
- - - - - - - - 1 2- - - - - - - - 1 2
1 - 2 1 1 3 2 5 4 8- - - - - - 2 7 4 4- - - 1 - - 1 - - 1
- - 1 - - - 1 1 1 -- 1 - - - - 1 - 1 11 1 3 2 1 3 7 13 10 14
1 - - - - 1 1 3 2 -- - - - - - - - - 11 - - - - 1 1 3 2 1
- - - - - - - - 1 -- - - - - - 1 1 - -- - - - - - - 2 - -- - - - - - 1 3 1 -
- - - 1 - 1 - - - -- - - - - - 2 - - -- - - 1 - 1 2 - - -
Age5- 10- 15- 20- 25- 30- 35- 40- 45- 50-
19 13 67 108 206 238 292 530 721 1,031
7 3 7 14 16 17 25 34 45 49
10 10 51 74 172 180 226 437 609 856
Back to contents
Page 96
- - 3 16 8 16 21 30 49 90- - - - 2 3 2 1 2 3- - 1 - - 1 1 - - -1 - - - 4 12 6 5 8 12- - 2 3 3 6 5 10 3 8
11 10 57 93 189 218 261 483 671 969
- - - - - - - - 1 2- - - - - - - - 1 2
- - 2 - 1 1 1 3 2 6- - - - - - 2 6 2 4- - - 1 - - 1 - - -
- - 1 - - - - - - -- - - - - - 1 - - 1- - 3 1 1 1 5 9 4 11
1 - - - - 1 - 2 - -- - - - - - - - - -1 - - - - 1 - 2 - -
- - - - - - - - - -- - - - - - - - - -- - - - - - - 2 - -- - - - - - - 2 - -
- - - - - 1 - - - -- - - - - - 1 - - -- - - - - 1 1 - - -
Age5- 10- 15- 20- 25- 30- 35- 40- 45- 50-
10 13 31 57 70 125 178 292 452 668
2 3 5 8 6 12 19 23 27 41
6 7 22 40 58 98 137 236 374 5511 1 3 4 4 6 12 18 36 59- - - - - - 1 3 - 2- - - - - 1 - - - -- - - - - 1 1 3 2 3- 1 1 3 2 5 3 3 4 87 9 26 47 64 111 154 263 416 623
- - - - - - - - - -- - - - - - - - - -
1 - - 1 - 2 1 2 2 2- - - - - - - 1 2 -- - - - - - - - - 1
- - - - - - 1 1 1 -
Page 97
- 1 - - - - - - 1 -1 1 - 1 - 2 2 4 6 3
- - - - - - 1 1 2 -- - - - - - - - - 1- - - - - - 1 1 2 1
- - - - - - - - 1 -- - - - - - 1 1 - -- - - - - - - - - -- - - - - - 1 1 1 -
- - - 1 - - - - - -- - - - - - 1 - - -- - - 1 - - 1 - - -
Page 98
Age55- 60- 65- 70- 75- 80- 85- 90+
2,302 3,082 4,767 5,818 7,462 9,350 9,333 9,270
113 130 185 210 255 343 312 38812 20 22 27 28 37 37 33
2,177 2,932 4,560 5,581 7,179 8,970 8,984 8,8492,302 3,082 4,767 5,818 7,462 9,350 9,333 9,270
1,947 2,593 4,018 4,916 6,361 7,969 7,897 7,379186 259 446 568 665 821 870 1,218
7 14 27 35 57 91 90 851 2 1 1 - 1 - -3 12 7 3 2 - 8 39
15 20 30 36 43 46 87 1052,159 2,900 4,529 5,559 7,128 8,928 8,952 8,826
- - 3 1 1 5 3 5- - 3 1 1 5 3 5
9 14 16 7 20 19 6 43 5 4 8 13 12 12 6- 1 - - 2 - - -
2 4 2 1 4 3 4 62 4 2 1 2 1 1 1
16 28 24 17 41 35 23 17
1 2 2 1 4 - 1 -- - 1 2 1 - - -1 2 3 3 5 - 1 -
- 1 - 1 3 2 1 1- - - - - - - -1 - - - 1 - - -1 1 - 1 4 2 1 1
- 1 - - - - 1 -- - 1 - - - 3 -- 1 1 - - - 4 -
Age55- 60- 65- 70- 75- 80- 85- 90+
1,367 1,807 2,844 3,245 3,843 4,551 3,828 2,933
80 89 120 140 151 186 132 121
1,142 1,516 2,407 2,729 3,240 3,848 3,242 2,296
Page 99
121 151 260 317 367 435 361 4245 9 15 18 34 44 40 23- - 1 1 - 1 - -2 7 4 1 - - 4 309 16 16 22 25 15 34 31
1,279 1,699 2,703 3,088 3,666 4,343 3,681 2,804
- - 3 1 - 3 1 1- - 3 1 - 3 1 1
5 8 11 6 8 7 3 41 3 3 4 9 9 6 2- 1 - - - - - -
- 3 1 1 2 1 2 12 2 1 1 2 - - -8 17 16 12 21 17 11 7
- 2 1 1 3 - - -- - - 2 - - - -- 2 1 3 3 - - -
- - - 1 1 2 1 -- - - - - - - -- - - - 1 - - -- - - 1 2 2 1 -
- - - - - - - -- - 1 - - - 2 -- - 1 - - - 2 -
Age55- 60- 65- 70- 75- 80- 85- 90+
935 1,275 1,923 2,573 3,619 4,799 5,505 6,337
45 61 87 97 132 194 217 300
805 1,077 1,611 2,187 3,121 4,121 4,655 5,08365 108 186 251 298 386 509 794
2 5 12 17 23 47 50 621 2 - - - - - -1 5 3 2 2 - 4 96 4 14 14 18 31 53 74
880 1,201 1,826 2,471 3,462 4,585 5,271 6,022
- - - - 1 2 2 4- - - - 1 2 2 4
4 6 5 1 12 12 3 -2 2 1 4 4 3 6 4- - - - 2 - - -
2 1 1 - 2 2 2 5
Page 100
- 2 1 - - 1 1 18 11 8 5 20 18 12 10
1 - 1 - 1 - 1 -- - 1 - 1 - - -1 - 2 - 2 - 1 -
- 1 - - 2 - - 1- - - - - - - -1 - - - - - - -1 1 - - 2 - - 1
- 1 - - - - 1 -- - - - - - 1 -- 1 - - - - 2 -
Page 101
Table 6.01: Deaths, by sex and cause, Scotland, 2006 to 2016
Cause of death 2006 2007 2008 2009 2010 2011 2012 2013 2014 2015 2016
All causes All 55,093 55,986 55,700 53,856 53,967 53,661 54,937 54,700 54,239 57,579 56,728M 26,251 26,895 26,504 25,828 25,963 25,913 26,015 26,325 26,289 27,905 27,760F 28,842 29,091 29,196 28,028 28,004 27,748 28,922 28,375 27,950 29,674 28,968
A00-B99 M 358 366 380 383 316 372 302 346 333 340 343F 433 583 556 455 435 440 394 408 383 415 410
Tuberculosis M 23 22 19 32 17 25 16 14 17 11 17F 20 19 27 17 16 14 18 17 11 10 9
A39 Meningococcal infection M 4 4 1 1 1 2 2 4 1 3 2F 2 4 3 4 2 2 1 3 1 2 2
B15-19 Viral hepatitis M 13 15 16 17 18 19 18 19 19 40 18F 7 7 8 8 6 8 7 9 3 13 11
B20-24 M 13 14 14 14 14 11 15 10 10 10 19F 6 7 4 3 7 5 3 4 4 2 5
C00-D48 II. Neoplasms M 7,847 7,926 7,841 7,862 7,941 8,125 8,134 8,263 8,311 8,523 8,467F 7,513 7,644 7,684 7,622 7,677 7,606 8,029 7,898 7,856 7,856 7,778
C00-97 Malignant neoplasms M 7,728 7,783 7,729 7,731 7,807 8,005 7,978 8,110 8,146 8,378 8,303F 7,356 7,491 7,540 7,456 7,516 7,452 7,886 7,748 7,694 7,715 7,598
C00-14 M 166 178 177 190 192 212 209 219 206 204 239F 81 99 82 91 88 98 106 105 102 107 119
C15 Malignant neoplasm of oesophagus M 490 485 520 507 533 541 533 538 535 552 553F 275 301 311 239 278 283 280 290 315 264 267
C16 Malignant neoplasm of stomach M 338 304 300 323 334 279 306 265 285 262 272F 214 202 211 212 171 193 188 226 192 180 136
C18 Malignant neoplasm of colon M 464 443 500 416 412 454 464 471 432 462 464F 458 456 440 430 445 439 453 452 468 466 492
C19-21 Malignant neoplasm of rectum and anus M 375 379 339 420 381 378 380 412 370 398 408F 271 285 306 312 290 284 351 268 305 275 297
C22 M 217 256 213 227 230 263 249 343 338 350 373F 128 122 130 120 132 157 182 190 197 221 211
C25 Malignant neoplasm of pancreas M 269 338 319 309 346 358 369 354 364 365 353F 298 375 323 382 323 344 373 388 349 384 366
C32 Malignant neoplasm of larynx M 72 59 95 85 70 72 72 82 86 100 91F 25 13 19 17 24 31 21 28 22 27 20
C33-34 M 2,162 2,239 2,114 2,196 2,107 2,200 2,094 2,127 2,119 2,075 2,081F 1,900 1,876 1,966 1,951 1,948 1,978 2,095 1,993 1,998 1,972 1,954
C43 Malignant melanoma of skin M 90 94 93 101 114 105 115 88 100 99 102F 68 70 78 84 81 71 75 92 76 75 60
C50 Malignant neoplasm of breast M 4 5 7 8 10 5 8 7 10 3 9F 1,108 1,062 1,043 1,002 1,022 1,036 1,063 1,013 966 989 1,020
C53 Malignant neoplasm of cervix uteri F 92 105 102 107 99 108 112 91 88 116 106C54-55 F 141 126 163 153 203 154 194 202 212 230 230
C56 Malignant neoplasm of ovary F 400 381 411 400 387 363 383 396 375 362 349C61 Malignant neoplasm of prostate M 779 793 792 790 849 900 881 876 906 986 894C64 M 205 220 220 210 172 208 206 186 253 210 252
F 136 143 151 138 135 133 139 134 155 147 155C67 Malignant neoplasm of bladder M 281 299 276 258 269 294 303 318 300 329 336
F 144 178 181 171 171 178 179 213 180 193 184C81-96 M 566 554 539 553 570 558 562 597 547 648 603
F 487 490 463 433 505 497 522 465 484 501 483D50-89 M 48 51 39 55 25 34 42 54 41 55 55
F 65 60 46 58 62 53 81 59 45 67 59
E00-90 M 475 493 498 427 525 479 518 452 461 532 569F 543 487 493 446 479 500 459 486 556 534 580
E10-14 Diabetes mellitus M 373 370 372 314 408 382 407 344 376 408 456F 378 356 361 318 346 380 347 364 424 409 423
F00-99 M 1,087 1,228 1,335 1,303 1,377 1,178 1,277 1,301 1,412 1,627 1,522F 1,730 1,889 2,027 2,024 2,082 2,161 2,470 2,611 2,540 2,800 2,546
F01, F03 Dementia M 572 706 748 761 859 944 1,073 1,096 1,152 1,304 1,214F 1,529 1,740 1,842 1,824 1,886 2,050 2,381 2,527 2,424 2,656 2,394
F10 M 272 236 255 219 227 197 159 149 198 238 240F 106 85 87 93 103 82 55 51 82 77 81M 234 276 321 315 283 18 31 35 40 49 41F 59 34 74 95 68 7 9 7 14 20 14
G00-H95 M 561 685 720 751 718 905 933 999 1,109 1,338 1,378F 772 870 899 906 1,041 1,153 1,425 1,441 1,489 1,890 2,048
G00-03 Meningitis M 10 7 12 5 4 5 3 8 9 8 8F 5 9 8 4 7 5 1 4 4 5 6
G30 Alzheimer's Disease M 132 158 180 186 178 292 312 338 423 532 604F 320 391 444 448 487 625 843 858 916 1,244 1,359
ICD10 Summary
list
I. Certain infectious and parasitic diseases 1
A15-19, B90
Human immunodeficiency virus (HIV) disease
Malignant neoplasms of lip, oral cavity and pharynx
Malignant neoplasm of liver and intrahepatic bile ducts
Malignant neoplasm of trachea bronchus and lung
Malignant neoplasm of other parts of the uterus
Malignant neoplasm of kidney, except renal pelvis
Malignant neoplasm of lymphoid, haematopoietic and related tissueIII. Diseases of the blood and blood-forming organs and certain disorders involving the immune mechanismIV. Endocrine, nutritional and metabolic diseases
V. Mental and behavioural disorders1
Mental and behavioural disorders due to use of alcohol
F11-16, F18-19
Mental and behavioural disorders due to use of drugs VI-VIII. Diseases of the nervous system and the sense organs 1
Page 103
Cause of death 2006 2007 2008 2009 2010 2011 2012 2013 2014 2015 2016
I00-99 IX. Diseases of the circulatory system M 8,798 8,999 8,497 8,016 8,068 7,695 7,610 7,668 7,464 7,853 7,645F 9,973 9,580 9,352 8,753 8,449 8,218 8,279 7,900 7,552 7,915 7,486
I20-25 Ischaemic heart diseases M 5,099 5,260 4,852 4,600 4,599 4,320 4,258 4,155 3,989 4,168 3,917F 4,433 4,083 3,989 3,674 3,539 3,316 3,283 3,084 2,883 2,974 2,780
Other heart diseases M 595 612 590 559 551 553 645 705 759 775 810F 796 835 828 776 793 746 884 874 875 1,017 938
I60-69 Cerebrovascular diseases M 2,060 2,039 2,051 1,841 1,889 1,765 1,686 1,774 1,605 1,728 1,712F 3,406 3,294 3,316 3,065 2,875 2,829 2,789 2,672 2,518 2,575 2,430
J00-99 X. Diseases of the respiratory system M 3,161 3,284 3,276 3,272 3,080 3,138 3,233 3,256 3,143 3,522 3,373F 4,022 4,078 4,167 3,853 3,816 3,653 3,935 3,769 3,563 4,147 3,923
J09-11 Influenza M 2 3 5 30 4 7 4 20 15 42 42F - 2 5 32 8 5 15 39 8 52 37
J12-18 Pneumonia M 967 970 937 969 981 810 888 855 787 863 789F 1,546 1,474 1,516 1,379 1,343 1,138 1,202 1,141 932 1,070 1,011
J40-47 Chronic lower respiratory diseases M 1,384 1,458 1,400 1,408 1,230 1,394 1,458 1,487 1,427 1,575 1,508F 1,617 1,646 1,637 1,578 1,577 1,668 1,793 1,697 1,689 1,937 1,930
J45-46 Asthma M 28 34 33 32 29 39 20 34 20 35 41F 54 78 70 61 62 55 69 71 52 87 92
K00-93 XI. Diseases of the digestive system M 1,560 1,506 1,531 1,421 1,550 1,388 1,395 1,372 1,459 1,399 1,496F 1,648 1,570 1,588 1,585 1,558 1,548 1,429 1,496 1,493 1,527 1,545
K25-28 M 136 102 107 118 107 106 85 76 87 80 74F 127 107 114 109 115 89 78 72 73 64 55
Chronic liver disease M 745 703 692 590 657 566 516 526 536 485 574F 417 377 367 362 321 343 274 298 285 312 320
L00-99 M 43 43 55 50 55 50 51 64 58 67 66F 87 88 104 107 101 88 87 98 105 102 105
M00-99 M 106 114 106 100 104 111 110 114 96 137 147F 248 281 245 244 245 238 231 249 231 243 258
Rheumatoid arthritis and osteoarthrosis M 30 37 38 26 26 33 35 37 39 43 49F 103 133 89 99 98 86 97 88 93 87 102
N00-99 M 456 456 511 514 541 441 427 476 477 525 439F 656 693 768 755 796 641 711 605 692 686 652
N00-29 Diseases of the kidney and ureter M 259 248 268 250 272 258 245 280 258 297 241F 319 350 385 381 394 361 384 337 385 409 352
O00-99 F 7 8 5 6 3 5 7 3 5 5 5
P00-96 M 88 92 75 75 63 84 67 55 61 54 48F 51 65 59 48 57 50 43 47 44 44 49
Q00-99 M 78 83 78 79 82 70 75 74 75 92 100F 73 67 66 74 69 81 86 74 75 68 80
Q00-07 M 11 13 8 10 7 11 9 11 8 10 11F 14 9 10 11 8 7 12 9 19 10 11
Q20-28 M 23 22 26 22 28 22 24 22 21 14 18F 23 25 20 27 15 22 23 16 15 14 19
R00-99 M 124 126 150 152 159 145 170 155 201 197 197F 245 268 288 262 280 336 353 321 348 317 288
R95 Sudden infant death syndrome M 17 16 9 17 14 17 17 10 7 10 11F 10 15 13 6 12 12 12 7 7 9 7
R96-99 Other ill-defined and unknown causes M 68 81 92 83 89 77 89 70 116 124 129F 39 39 46 40 40 58 47 45 64 78 53
V01-Y98 M 1,461 1,443 1,412 1,368 1,359 1,698 1,671 1,676 1,588 1,644 1,915F 776 860 849 830 854 977 903 910 973 1,058 1,156
Accidents M 722 708 696 744 696 970 985 989 1,031 1,085 1,320F 542 581 565 588 599 687 644 675 719 807 896
V01-99 Transport accidents M 259 233 214 217 167 160 169 151 162 147 147F 71 79 76 60 66 52 48 56 60 44 59
W00-19 Falls M 260 257 252 283 286 297 310 320 306 322 388F 382 401 382 402 417 426 395 398 433 465 490
X40-49 Poisonings M 59 59 76 68 85 341 375 374 428 472 607F 11 4 6 30 39 120 133 136 142 191 243
Intentional self-harm M 427 386 441 429 425 393 426 479 398 408 439F 115 131 128 139 144 134 143 122 151 148 164
Assault M 100 73 57 53 60 59 52 49 36 33 41F 15 15 31 19 23 13 11 9 16 11 13
Event of undetermined intent M 165 234 189 120 156 246 182 132 99 68 78F 58 87 85 58 56 116 79 62 48 48 47
Footnote1) Chapter affected significantly by change in coding rules between 2010 and 2011 - refer to the notes on the page which list all the Section 6 tables.
© Crown Copyright 2017
ICD10 Summary
list
I30-33, I39-52
Ulcer of the stomach, duodenum and jejunum
K70,K73-74
XII. Diseases of the skin and subcutaneous tissueXIII. Diseases of the musculoskeletal system and connective tissue
M05-06,M15-19
XIV. Diseases of the genitourinary system
XV. Pregnancy, childbirth and the puerperiumXVI. Certain conditions originating in the perinatal periodXVII. Congenital malformations, deformations and chromosomal abnormalitiesCongenital malformations of the nervous systemCongenital malformations of the circulatory systemXVIII. Symptoms, signs and abnormal clinical and laboratory findings, not elsewhere classified
XX. External causes of morbidity and mortality 1
V01-X59,Y85, Y86
X60-84,Y87.0
X85-Y09,Y87.1
Y10-Y34,Y87.2
Page 104
Table 6.02: Deaths, numbers and rates, by sex, age and cause, Scotland, 2016
Cause of deathNumbers
All agesWeeks
1-4 5-9 10-14 15-24 25-34 35-44 45-54 55-64 65-74 75-84 85-89 90+<4 4-
All causes All 56,728 121 60 42 29 26 263 639 1,292 2,872 5,384 10,585 16,812 9,333 9,270M 27,760 66 28 23 19 13 175 444 822 1,752 3,174 6,089 8,394 3,828 2,933F 28,968 55 32 19 10 13 88 195 470 1,120 2,210 4,496 8,418 5,505 6,337
A00-B99 M 343 - - 7 1 - 3 3 10 31 34 68 105 46 35F 410 - 1 4 3 1 1 3 8 23 29 59 119 86 73
Tuberculosis M 17 - - - 1 - - - - 1 2 4 5 2 2F 9 - - - - - - - - - 1 - 6 1 1
A39 Meningococcal infection M 2 - - 1 - - - - - - - 1 - - -F 2 - - - 1 - - - - - - - 1 - -
B15-19 Viral hepatitis M 18 - - - - - - - 2 9 3 4 - - -F 11 - - - - - - - 4 4 2 1 - - -
B20-24 M 19 - - - - - - 2 3 7 4 1 2 - -F 5 - - - - - - - 2 1 2 - - - -
C00-D48 II. Neoplasms M 8,467 - - 3 6 1 14 34 92 442 1,188 2,496 2,761 929 501F 7,778 1 - 1 1 4 11 37 147 445 997 1,934 2,477 1,019 704
C00-97 Malignant neoplasms M 8,303 - - 2 6 1 13 34 91 436 1,174 2,464 2,705 898 479F 7,598 - - 1 1 4 11 36 144 441 990 1,908 2,423 989 650
C00-14 M 239 - - - - - 1 - 2 28 65 88 43 10 2F 119 - - - - 1 - - - 7 12 38 37 13 11
C15 Malignant neoplasm of oesophagus M 553 - - - - - - 1 6 41 95 204 148 38 20F 267 - - - - - - - 2 12 44 56 101 31 21
C16 Malignant neoplasm of stomach M 272 - - - - - 2 3 3 17 44 65 101 26 11F 136 - - - - - - - 3 9 19 18 47 29 11
C18 Malignant neoplasm of colon M 464 - - - - - 1 1 4 27 58 115 172 56 30F 492 - - - - - 1 4 8 26 45 109 148 83 68
C19-21 Malignant neoplasm of rectum and anus M 408 - - - - - - 1 6 21 59 117 147 35 22F 297 - - - - - - 1 7 19 40 62 89 52 27
C22 M 373 - - - - - - - 3 22 68 122 107 34 17F 211 - - - - - - 1 1 13 27 52 78 31 8
C25 Malignant neoplasm of pancreas M 353 - - - - - - - 2 23 59 132 95 29 13F 366 - - - - - 1 - 5 12 46 120 123 37 22
C32 Malignant neoplasm of larynx M 91 - - - - - - - - 6 11 39 26 6 3F 20 - - - - - - - 2 1 6 3 6 2 -
C33-34 M 2,081 - - - - - - 1 17 102 318 692 680 186 85F 1,954 - - - - - - 1 12 71 270 606 678 213 103
C43 Malignant melanoma of skin M 102 - - - - - - 2 5 11 15 28 25 8 8F 60 - - - - - - - 3 6 8 13 14 7 9
C50 Malignant neoplasm of breast M 9 - - - - - - - 1 2 1 1 2 1 1F 1,020 - - - - - - 8 55 124 142 195 243 127 126
C53 Malignant neoplasm of cervix uteri F 106 - - - - - 1 5 17 17 19 16 16 11 4C54-55 F 230 - - - - - - - 2 8 30 70 78 25 17
C56 Malignant neoplasm of ovary F 349 - - - - - - 3 6 32 61 98 98 31 20C61 Malignant neoplasm of prostate M 894 - - - - - - - - 4 67 198 352 168 105C64 M 252 - - - - - - - 6 11 49 63 88 22 13
F 155 - - - - - - - - 9 20 46 53 20 7C67 Malignant neoplasm of bladder M 336 - - - - - - - 2 8 25 88 123 52 38
F 184 - - - - - - - 1 6 15 24 77 37 24C81-96 M 603 - - 1 1 - 3 4 6 19 61 172 221 73 42
F 483 - - - - - 4 3 5 11 54 113 162 77 54D50-89 M 55 - - - - - - 2 - 6 10 9 18 4 6
F 59 - - - - 1 - - 1 2 4 10 16 9 16
E00-90 M 569 - - 1 - 1 5 13 29 52 77 131 157 67 36F 580 1 - 2 - - 2 10 14 38 67 95 189 79 83
E10-E14 Diabetes mellitus M 456 - - - - - 1 9 22 41 57 103 129 64 30F 423 - - - - - - 4 10 20 43 63 159 63 61
F00-99 V. Mental and behavioural disorders M 1,522 - - - - - 1 12 43 68 74 148 454 392 330F 2,546 - - - - - - 6 14 28 37 103 565 689 1,104
F01,F03 Dementia M 1,214 - - - - - - - - 2 8 81 416 382 325F 2,394 - - - - - - - - 1 7 79 550 672 1,085
F10 M 240 - - - - - - 6 19 57 62 60 32 4 -F 81 - - - - - - - 6 22 28 18 5 2 -M 41 - - - - - 1 6 24 9 1 - - - -F 14 - - - - - - 4 5 4 1 - - - -
G00-H95 M 1,378 1 - 2 3 2 20 7 29 48 94 242 487 258 185F 2,048 - - 2 1 1 3 2 20 49 121 217 586 506 540
G00-03 Meningitis M 8 - - - 1 - - - 1 1 1 1 3 - -F 6 - - - - - - - 1 1 - 2 2 - -
G30 Alzheimer's Disease M 604 - - - - - - - - - 5 69 223 157 150F 1,359 - - - - - - - - 1 18 82 384 405 469
ICD10 Summary
list
I. Certain infectious and parasitic diseases
A15-19, B90
Human immunodeficiency virus (HIV) disease
Malignant neoplasms of lip, oral cavity and pharynx
Malignant neoplasm of liver and intrahepatic bile ducts
Malignant neoplasm of trachea bronchus and lung
Malignant neoplasm of other parts of the uterus
Malignant neoplasm of kidney, except renal pelvis
Malignant neoplasm of lymphoid, haematopoietic and related tissueIII. Diseases of the blood and blood-forming organs and certain disorders involving the immune mechanism
IV. Endocrine, nutritional and metabolic diseases
Mental and behavioural disorders due to use of alcohol
F11-16, F18-19
Mental and behavioural disorders due to use of drugsVI-VIII. Diseases of the nervous system and the sense organs
Page 105
Cause of deathNumbers
All agesWeeks
1-4 5-9 10-14 15-24 25-34 35-44 45-54 55-64 65-74 75-84 85-89 90+<4 4-
I00-99 IX. Diseases of the circulatory system M 7,645 - 1 - 1 1 4 29 111 423 870 1,640 2,467 1,167 931F 7,486 1 - - 1 - 4 19 63 153 374 949 2,277 1,691 1,954
I20-25 Ischaemic heart diseases M 3,917 - - - - - - 11 55 272 552 948 1,228 480 371F 2,780 - - - - - - 3 16 54 175 466 834 623 609
Other heart diseases M 810 - 1 - - - 3 9 17 41 77 146 245 140 131F 938 1 - - - - 1 3 11 27 38 69 246 214 328
I60-69 Cerebrovascular diseases M 1,712 - - - 1 - - 5 14 55 129 280 601 344 283F 2,430 - - - - - 2 4 19 41 93 250 739 581 701
J00-99 X. Diseases of the respiratory system M 3,373 - - 2 1 1 4 9 19 100 252 696 1,176 581 532F 3,923 - 1 1 1 - 2 3 15 72 249 647 1,216 773 943
J09-11 Influenza M 42 - - - - - - - 3 5 9 8 16 - 1F 37 - - - - - - 1 2 4 8 4 5 9 4
J12-18 Pneumonia M 789 - - 2 - - - 3 6 39 44 109 221 158 207F 1,011 - 1 1 1 - - 1 7 18 35 67 214 231 435
J40-47 Chronic lower respiratory diseases M 1,508 - - - - 1 3 3 8 36 135 388 589 222 123F 1,930 - - - - - 2 1 4 41 163 459 739 329 192
J45-46 Asthma M 41 - - - - 1 3 2 3 3 4 9 6 4 6F 92 - - - - - 2 - 3 8 3 13 23 14 26
K00-93 XI. Diseases of the digestive system M 1,496 - - - 1 2 1 18 65 195 293 332 345 133 111F 1,545 - - - - 2 1 12 38 122 169 260 445 255 241
K25-28 M 74 - - - - - - 1 - 5 17 17 21 7 6F 55 - - - - - - - - 4 4 17 7 10 13
Chronic liver disease M 574 - - - - - - 12 46 133 186 138 53 6 -F 320 - - - - - - 9 30 76 89 63 44 8 1
L00-99 M 66 - - - - - - - 1 2 6 18 17 14 8F 105 - - - - - - 1 1 5 11 11 29 26 21
M00-99 M 147 - - - - - - - 1 11 17 37 47 14 20F 258 - - - - - - 1 2 8 19 35 91 45 57
Rheumatoid arthritis and osteoarthrosis M 49 - - - - - - - - 3 3 16 17 4 6F 102 - - - - - - 1 - 3 7 16 47 12 16
N00-99 M 439 - - - - - - 2 1 13 21 73 130 101 98F 652 - - - - - 1 4 3 5 18 66 200 137 218
N00-29 Diseases of the kidney and ureter M 241 - - - - - - 1 1 10 12 46 63 54 54F 352 - - - - - 1 3 2 3 8 40 97 79 119
O00-99 F 5 - - - - - 1 4 - - - - - - -
P00-96 M 48 43 4 - - - - - - - 1 - - - -F 49 34 13 2 - - - - - - - - - - -
Q00-99 M 100 21 12 3 2 1 6 8 9 10 11 13 3 1 -F 80 14 9 3 - - 5 - 2 13 17 9 7 - 1
Q00-07 M 11 3 1 1 - - 2 1 - 2 1 - - - -F 11 2 - - - - 1 - 1 3 1 2 1 - -
Q20-28 M 18 1 4 2 - - 3 2 2 3 1 - - - -F 19 6 4 1 - - 2 - - 3 2 1 - - -
R00-99 M 197 1 10 4 - - 7 6 25 23 33 20 14 14 40F 288 3 4 1 1 1 1 3 4 11 12 13 24 33 177
R95 Sudden infant death syndrome M 11 1 10 - - - - - - - - - - - -F 7 3 4 - - - - - - - - - - - -
R96-99 Other ill-defined and unknown causes M 129 - - 4 - - 7 5 25 23 33 19 9 4 -F 53 - - 1 1 1 1 3 4 10 11 12 8 - 1
V01-Y98 M 1,915 - 1 1 4 4 110 301 387 328 193 166 213 107 100F 1,156 1 4 3 2 3 56 90 138 146 86 88 177 157 205
Accidents M 1,320 - 1 1 4 3 56 194 265 190 114 120 185 94 93F 896 - 2 3 2 2 31 58 93 93 47 63 157 145 200
V01-99 Transport accidents M 147 - - 1 3 2 28 34 14 17 21 10 13 2 2F 59 - - 2 2 2 11 8 4 10 5 3 6 3 3
W00-19 Falls M 388 - - - - 1 4 4 9 10 16 47 127 81 89F 490 - - - - - 1 2 - 2 11 35 128 130 181
X40-49 Poisonings M 607 - - - - - 18 145 222 135 40 24 19 4 -F 243 - - - - - 17 45 83 72 18 5 1 2 -
Intentional self-harm M 439 - - - - 1 42 87 92 109 64 27 14 1 2F 164 - - - - 1 23 23 28 39 27 15 6 2 -
Assault M 41 - - - - - 6 7 12 9 2 3 2 - -F 13 - 1 - - - 1 1 7 1 1 - 1 - -
Event of undetermined intent M 78 - - - - - 6 13 18 20 8 10 2 - 1F 47 - 1 - - - 1 7 10 10 9 6 1 2 -
ICD10 Summary
list
I30-33,I39-52
Ulcer of the stomach, duodenum and jejunum
K70, K73-74
XII. Diseases of the skin and subcutaneous tissueXIII. Diseases of the musculoskeletal system and connective tissue
M05-06,M15-19
XIV. Diseases of the genitourinary system
XV. Pregnancy, childbirth and the puerperiumXVI. Certain conditions originating in the perinatal periodXVII. Congenital malformations, deformations and chromosomal abnormalitiesCongenital malformations of the nervous systemCongenital malformations of the circulatory systemXVIII. Symptoms, signs and abnormal clinical and laboratory findings, not elsewhere classified
XX. External causes of morbidity and mortality
V01-X59,Y85, Y86
X60-84,Y87.0
X85-Y09,Y87.1
Y10-Y34,Y87.2
Page 106
Table 6.02 (continued)
Cause of deathDeath rates per 100,000 population
All ages 0 1-4 5-9 10-14 15-24 25-34 35-44 45-54 55-64 65-74 75-84 85-89 90+
All causes All 1,050 326 18 10 9 40 88 194 359 778 1,902 5,201 11,969 22,573M 1,057 328 19 12 9 52 124 252 453 941 2,295 6,051 13,533 24,407F 1,043 324 17 7 10 27 53 139 272 622 1,544 4,561 11,078 21,814
A00-B99 M 13 - 6 1 - 1 1 3 8 10 26 76 163 291F 15 4 4 2 1 - 1 2 6 8 20 64 173 251
Tuberculosis M 1 - - 1 - - - - - 1 2 4 7 17F - - - - - - - - - - - 3 2 3
A39 Meningococcal infection M - - 1 - - - - - - - - - - -F - - - 1 - - - - - - - 1 - -
B15-19 Viral hepatitis M 1 - - - - - - 1 2 1 2 - - -F - - - - - - - 1 1 1 - - - -
B20-24 M 1 - - - - - 1 1 2 1 - 1 - -F - - - - - - - 1 - 1 - - - -
C00-D48 II. Neoplasms M 322 - 3 4 1 4 9 28 114 352 941 1,990 3,284 4,169F 280 4 1 1 3 3 10 43 108 281 664 1,342 2,051 2,423
C00-97 Malignant neoplasms M 316 - 2 4 1 4 9 28 113 348 929 1,950 3,175 3,986F 274 - 1 1 3 3 10 42 107 279 655 1,313 1,990 2,238
C00-14 M 9 - - - - - - 1 7 19 33 31 35 17F 4 - - - 1 - - - 2 3 13 20 26 38
C15 Malignant neoplasm of oesophagus M 21 - - - - - - 2 11 28 77 107 134 166F 10 - - - - - - 1 3 12 19 55 62 72
C16 Malignant neoplasm of stomach M 10 - - - - 1 1 1 4 13 24 73 92 92F 5 - - - - - - 1 2 5 6 25 58 38
C18 Malignant neoplasm of colon M 18 - - - - - - 1 7 17 43 124 198 250F 18 - - - - - 1 2 6 13 37 80 167 234
C19-21 Malignant neoplasm of rectum and anus M 16 - - - - - - 2 5 17 44 106 124 183F 11 - - - - - - 2 5 11 21 48 105 93
C22 M 14 - - - - - - 1 6 20 46 77 120 141F 8 - - - - - - - 3 8 18 42 62 28
C25 Malignant neoplasm of pancreas M 13 - - - - - - 1 6 17 50 68 103 108F 13 - - - - - - 1 3 13 41 67 74 76
C32 Malignant neoplasm of larynx M 3 - - - - - - - 2 3 15 19 21 25F 1 - - - - - - 1 - 2 1 3 4 -
C33-34 M 79 - - - - - - 5 26 94 261 490 658 707F 70 - - - - - - 4 17 76 208 367 429 355
C43 Malignant melanoma of skin M 4 - - - - - 1 2 3 4 11 18 28 67F 2 - - - - - - 1 1 2 4 8 14 31
C50 Malignant neoplasm of breast M - - - - - - - - 1 - - 1 4 8F 37 - - - - - 2 16 30 40 67 132 256 434
C53 Malignant neoplasm of cervix uteri F 4 - - - - - 1 5 4 5 5 9 22 14C54-55 F 8 - - - - - - 1 2 8 24 42 50 59
C56 Malignant neoplasm of ovary F 13 - - - - - 1 2 8 17 34 53 62 69C61 Malignant neoplasm of prostate M 34 - - - - - - - 1 20 75 254 594 874C64 M 10 - - - - - - 2 3 15 24 63 78 108
F 6 - - - - - - - 2 6 16 29 40 24C67 Malignant neoplasm of bladder M 13 - - - - - - 1 2 7 33 89 184 316
F 7 - - - - - - - 1 4 8 42 74 83C81-96 M 23 - 1 1 - 1 1 2 5 18 65 159 258 350
F 17 - - - - 1 1 1 3 15 39 88 155 186D50-89 M 2 - - - - - 1 - 2 3 3 13 14 50
F 2 - - - 1 - - - - 1 3 9 18 55
E00-90 M 22 - 1 - 1 1 4 9 13 23 49 113 237 300F 21 4 2 - - 1 3 4 9 19 33 102 159 286
E10-E14 Diabetes mellitus M 17 - - - - - 3 7 11 17 39 93 226 250F 15 - - - - - 1 3 5 12 22 86 127 210
F00-99 V. Mental and behavioural disorders M 58 - - - - - 3 13 18 22 56 327 1,386 2,746F 92 - - - - - 2 4 7 10 35 306 1,387 3,800
F01,F03 Dementia M 46 - - - - - - - 1 2 31 300 1,350 2,705F 86 - - - - - - - - 2 27 298 1,352 3,735
F10 M 9 - - - - - 2 6 15 18 23 23 14 -F 3 - - - - - - 2 5 8 6 3 4 -M 2 - - - - - 2 7 2 - - - - -F 1 - - - - - 1 1 1 - - - - -
G00-H95 M 52 3 2 2 1 6 2 9 12 28 91 351 912 1,539F 74 - 2 1 1 1 1 6 12 34 75 318 1,018 1,859
G00-03 Meningitis M - - - 1 - - - - - - - 2 - -F - - - - - - - - - - 1 1 - -
G30 Alzheimer's Disease M 23 - - - - - - - - 1 26 161 555 1,248F 49 - - - - - - - - 5 28 208 815 1,614
ICD10 Summary
list
I. Certain infectious and parasitic diseases
A15-19, B90
Human immunodeficiency virus (HIV) disease
Malignant neoplasms of lip, oral cavity and pharynx
Malignant neoplasm of liver and intrahepatic bile ducts
Malignant neoplasm of trachea bronchus and lung
Malignant neoplasm of other parts of the uterus
Malignant neoplasm of kidney, except renal pelvis
Malignant neoplasm of lymphoid, haematopoietic and related tissueIII. Diseases of the blood and blood-forming organs and certain disorders involving the immune mechanism
IV. Endocrine, nutritional and metabolic diseases
Mental and behavioural disorders due to use of alcohol
F11-16, F18-19
Mental and behavioural disorders due to use of drugsVI-VIII. Diseases of the nervous system and the sense organs
Page 107
Cause of deathDeath rates per 100,000 population
All ages - 1-4 5-9 10-14 15-24 25-34 35-44 45-54 55-64 65-74 75-84 85-89 90+
I00-99 IX. Diseases of the circulatory system M 291 3 - 1 1 1 8 34 109 258 618 1,778 4,126 7,747F 270 4 - 1 - 1 5 19 37 105 326 1,234 3,403 6,726
I20-25 Ischaemic heart diseases M 149 - - - - - 3 17 70 164 357 885 1,697 3,087F 100 - - - - - 1 5 13 49 160 452 1,254 2,096
Other heart diseases M 31 3 - - - 1 3 5 11 23 55 177 495 1,090F 34 4 - - - - 1 3 7 11 24 133 431 1,129
I60-69 Cerebrovascular diseases M 65 - - 1 - - 1 4 14 38 106 433 1,216 2,355F 87 - - - - 1 1 6 10 26 86 400 1,169 2,413
J00-99 X. Diseases of the respiratory system M 128 - 2 1 1 1 3 6 26 75 262 848 2,054 4,427F 141 4 1 1 - 1 1 4 17 70 222 659 1,556 3,246
J09-11 Influenza M 2 - - - - - - 1 1 3 3 12 - 8F 1 - - - - - - 1 1 2 1 3 18 14
J12-18 Pneumonia M 30 - 2 - - - 1 2 10 13 41 159 559 1,723F 36 4 1 1 - - - 2 4 10 23 116 465 1,497
J40-47 Chronic lower respiratory diseases M 57 - - - 1 1 1 2 9 40 146 425 785 1,024F 69 - - - - 1 - 1 10 46 158 400 662 661
J45-46 Asthma M 2 - - - 1 1 1 1 1 1 3 4 14 50F 3 - - - - 1 - 1 2 1 4 12 28 90
K00-93 XI. Diseases of the digestive system M 57 - - 1 1 - 5 20 50 87 125 249 470 924F 56 - - - 1 - 3 11 30 48 89 241 513 830
K25-28 M 3 - - - - - - - 1 5 6 15 25 50F 2 - - - - - - - 1 1 6 4 20 45
Chronic liver disease M 22 - - - - - 3 14 34 55 52 38 21 -F 12 - - - - - 2 9 18 25 22 24 16 3
L00-99 M 3 - - - - - - - 1 2 7 12 49 67F 4 - - - - - - - 1 3 4 16 52 72
M00-99 M 6 - - - - - - - 3 5 14 34 49 166F 9 - - - - - - 1 2 5 12 49 91 196
Rheumatoid arthritis and osteoarthrosis M 2 - - - - - - - 1 1 6 12 14 50F 4 - - - - - - - 1 2 5 25 24 55
N00-99 M 17 - - - - - 1 - 3 6 28 94 357 816F 23 - - - - - 1 1 1 5 23 108 276 750
N00-29 Diseases of the kidney and ureter M 9 - - - - - - - 3 4 17 45 191 449F 13 - - - - - 1 1 1 2 14 53 159 410
O00-99 F - - - - - - 1 - - - - - - -
P00-96 M 2 164 - - - - - - - - - - - -F 2 175 2 - - - - - - - - - - -
Q00-99 M 4 115 3 1 1 2 2 3 3 3 5 2 4 -F 3 86 3 - - 2 - 1 3 5 3 4 - 3
Q00-07 M - 14 1 - - 1 - - 1 - - - - -F - 7 - - - - - - 1 - 1 1 - -
Q20-28 M 1 17 2 - - 1 1 1 1 - - - - -F 1 37 1 - - 1 - - 1 1 - - - -
R00-99 M 7 38 3 - - 2 2 8 6 10 8 10 49 333F 10 26 1 1 1 - 1 1 3 3 4 13 66 609
R95 Sudden infant death syndrome M - 38 - - - - - - - - - - - -F - 26 - - - - - - - - - - - -
R96-99 Other ill-defined and unknown causes M 5 - 3 - - 2 1 8 6 10 7 6 14 -F 2 - 1 1 1 - 1 1 2 3 4 4 - 3
V01-Y98 M 73 3 1 3 3 33 84 119 85 57 63 154 378 832F 42 19 3 1 2 17 24 41 35 24 30 96 316 706
Accidents M 50 3 1 3 2 17 54 81 49 34 45 133 332 774F 32 7 3 1 1 9 16 27 23 13 22 85 292 688
V01-99 Transport accidents M 6 - 1 2 1 8 9 4 4 6 4 9 7 17F 2 - 2 1 1 3 2 1 2 1 1 3 6 10
W00-19 Falls M 15 - - - 1 1 1 3 3 5 18 92 286 741F 18 - - - - - 1 - - 3 12 69 262 623
X40-49 Poisonings M 23 - - - - 5 40 68 35 12 9 14 14 -F 9 - - - - 5 12 24 17 5 2 1 4 -
Intentional self-harm M 17 - - - 1 13 24 28 28 19 10 10 4 17F 6 - - - 1 7 6 8 9 8 5 3 4 -
Assault M 2 - - - - 2 2 4 2 1 1 1 - -F - 4 - - - - - 2 - - - 1 - -
Event of undetermined intent M 3 - - - - 2 4 6 5 2 4 1 - 8F 2 4 - - - - 2 3 2 3 2 1 4 -
© Crown Copyright 2017
ICD10 Summary
list
I30-33,I39-52
Ulcer of the stomach, duodenum and jejunum
K70, K73-74
XII. Diseases of the skin and subcutaneous tissueXIII. Diseases of the musculoskeletal system and connective tissue
M05-06,M15-19
XIV. Diseases of the genitourinary system
XV. Pregnancy, childbirth and the puerperiumXVI. Certain conditions originating in the perinatal periodXVII. Congenital malformations, deformations and chromosomal abnormalitiesCongenital malformations of the nervous systemCongenital malformations of the circulatory systemXVIII. Symptoms, signs and abnormal clinical and laboratory findings, not elsewhere classified
XX. External causes of morbidity and mortality
V01-X59,Y85, Y86
X60-84,Y87.0
X85-Y09,Y87.1
Y10-Y34,Y87.2
Page 108
Table 6.03: Deaths, by sex, cause and administartive area, Scotland, 2016
Cause of death Scotland Angus
All causes All 56,728 2,129 2,360 1,433 1,110 4,361M 27,760 1,024 1,170 693 560 2,092F 28,968 1,105 1,190 740 550 2,269
A00-B99 M 343 11 11 9 8 28F 410 17 12 6 6 33
Tuberculosis M 17 - - 1 - -F 9 - - 1 - -
A39 Meningococcal infection M 2 - - 1 - -F 2 - - - - -
B15-19 Viral hepatitis M 18 1 - - - 2F 11 2 - - - 1
B20-24 M 19 1 - 2 1 4F 5 1 - - - -
C00-D48 II. Neoplasms M 8,467 317 356 243 185 619F 7,778 281 308 192 143 597
C00-97 Malignant neoplasms M 8,303 315 348 238 179 607F 7,598 275 300 189 136 580
C00-14 M 239 4 6 1 7 20F 119 3 2 2 2 12
C15 Malignant neoplasm of oesophagus M 553 21 25 16 19 46F 267 13 13 4 6 20
C16 Malignant neoplasm of stomach M 272 9 13 10 5 18F 136 3 3 3 1 8
C18 Malignant neoplasm of colon M 464 16 24 15 8 29F 492 18 22 14 9 51
C19-21 Malignant neoplasm of rectum and anus M 408 12 18 8 4 37F 297 11 15 15 5 22
C22 M 373 15 11 14 8 27F 211 6 9 9 2 15
C25 Malignant neoplasm of pancreas M 353 16 14 13 16 28F 366 9 14 13 10 18
C32 Malignant neoplasm of larynx M 91 4 2 2 2 8F 20 2 - - - 4
C33-34 M 2,081 94 69 43 41 151F 1,954 79 55 37 24 132
C43 Malignant melanoma of skin M 102 1 3 5 3 5F 60 4 3 - - 3
C50 Malignant neoplasm of breast M 9 - - - - 2F 1,020 30 46 25 21 80
C53 Malignant neoplasm of cervix uteri F 106 4 4 2 4 10C54-55 F 230 6 8 13 7 20
C56 Malignant neoplasm of ovary F 349 9 19 7 8 30C61 Malignant neoplasm of prostate M 894 36 44 38 19 62C64 M 252 6 17 12 5 14
F 155 4 5 4 - 14C67 Malignant neoplasm of bladder M 336 13 14 11 8 20
F 184 5 7 3 1 13C81-96 M 603 20 31 18 8 45
F 483 17 12 12 5 34D50-89 M 55 1 3 2 3 3
F 59 2 6 2 1 5
E00-90 M 569 27 24 15 13 43F 580 30 19 8 7 54
E10-E14 Diabetes mellitus M 456 21 21 11 10 33F 423 23 15 7 6 43
F00-99 V. Mental and behavioural disorders M 1,522 54 60 27 30 136F 2,546 115 119 59 52 241
F01,F03 Dementia M 1,214 41 49 22 25 103F 2,394 108 114 54 50 220
F10 M 240 10 9 5 3 21F 81 3 2 5 - 9M 41 2 1 - 2 8F 14 2 - - - 2
G00-H95 M 1,378 49 54 48 18 128F 2,048 73 70 61 39 166
G00-03 Meningitis M 8 - - - - 1F 6 - 1 - - 1
G30 Alzheimer's Disease M 604 22 24 28 6 58F 1,359 47 44 42 21 115
ICD10 Summary
list
Aberdeen City
Aberdeen-shire
Argyll & Bute
City of Edinburgh1
I. Certain infectious and parasitic diseases
A15-19, B90
Human immunodeficiency virus (HIV) disease
Malignant neoplasms of lip, oral cavity and pharynx
Malignant neoplasm of liver and intrahepatic bile ducts
Malignant neoplasm of trachea bronchus and lung
Malignant neoplasm of other parts of the uterus
Malignant neoplasm of kidney, except renal pelvis
Malignant neoplasm of lymphoid, haematopoietic and related tissueIII. Diseases of the blood and blood-forming organs and certain disorders involving the immune mechanism
IV. Endocrine, nutritional and metabolic diseases
Mental and behavioural disorders due to use of alcohol
F11-16, F18-19
Mental and behavioural disorders due to use of drugsVI-VIII. Diseases of the nervous system and the sense organs
Page 109
Cause of death Scotland Angus
I00-99 IX. Diseases of the circulatory system M 7,645 273 372 169 171 556F 7,486 295 376 206 153 582
I20-25 Ischaemic heart diseases M 3,917 126 168 88 81 292F 2,780 103 123 78 60 208
Other heart diseases M 810 43 58 19 17 61F 938 64 68 24 14 71
I60-69 Cerebrovascular diseases M 1,712 64 96 40 38 125F 2,430 79 129 67 47 201
J00-99 X. Diseases of the respiratory system M 3,373 114 131 90 57 241F 3,923 143 126 91 72 268
J09-11 Influenza M 42 1 1 3 1 3F 37 1 3 1 - 5
J12-18 Pneumonia M 789 35 27 15 17 57F 1,011 43 39 22 30 68
J40-47 Chronic lower respiratory diseases M 1,508 57 58 44 19 109F 1,930 71 53 43 23 115
J45-46 Asthma M 41 3 2 2 1 7F 92 4 7 3 - 9
K00-93 XI. Diseases of the digestive system M 1,496 57 51 33 23 93F 1,545 64 56 35 30 116
K25-28 M 74 3 6 1 1 8F 55 - 2 2 1 8
Chronic liver disease M 574 23 11 8 7 32F 320 16 7 5 4 25
L00-99 M 66 2 1 2 1 5F 105 4 1 5 3 9
M00-99 M 147 7 4 6 3 13F 258 8 14 7 4 23
Rheumatoid arthritis and osteoarthrosis M 49 5 - 3 2 2F 102 3 4 4 2 10
N00-99 M 439 13 22 7 9 28F 652 19 30 16 10 39
N00-29 Diseases of the kidney and ureter M 241 12 13 5 7 15F 352 11 17 9 8 25
O00-99 F 5 - - - - 1
P00-96 M 48 2 3 1 - 8F 49 3 1 2 1 6
Q00-99 M 100 6 1 1 2 9F 80 2 2 3 2 3
Q00-07 M 11 2 - - - 1F 11 - - 1 1 1
Q20-28 M 18 - 1 - - 1F 19 2 - - - -
R00-99 M 197 6 7 2 6 22F 288 6 7 10 6 33
R95 Sudden infant death syndrome M 11 - - - - 1F 7 - - - - -
R96-99 Other ill-defined and unknown causes M 129 5 4 2 4 11F 53 - 2 - - 4
V01-Y98 M 1,915 85 70 38 31 160F 1,156 43 43 37 21 93
Accidents M 1,320 57 45 28 25 101F 896 32 36 29 18 63
V01-99 Transport accidents M 147 7 14 1 5 10F 59 - 3 3 2 3
W00-19 Falls M 388 19 15 12 8 28F 490 9 24 21 11 36
X40-49 Poisonings M 607 27 10 9 9 52F 243 16 6 2 2 15
Intentional self-harm M 439 19 23 9 6 36F 164 4 5 6 1 22
Assault M 41 2 1 - - 1F 13 2 - 1 - -
Event of undetermined intent M 78 5 - 1 - 15F 47 3 1 1 - 4
ICD10 Summary
list
Aberdeen City
Aberdeen-shire
Argyll & Bute
City of Edinburgh1
I30-33,I39-52
Ulcer of the stomach, duodenum and jejunum
K70, K73-74
XII. Diseases of the skin and subcutaneous tissueXIII. Diseases of the musculoskeletal system and connective tissue
M05-06,M15-19
XIV. Diseases of the genitourinary system
XV. Pregnancy, childbirth and the puerperiumXVI. Certain conditions originating in the perinatal periodXVII. Congenital malformations, deformations and chromosomal abnormalities
Congenital malformations of the nervous systemCongenital malformations of the circulatory systemXVIII. Symptoms, signs and abnormal clinical and laboratory findings, not elsewhere classified
XX. External causes of morbidity and mortality
V01-X59,Y85, Y86
X60-84,Y87.0
X85-Y09,Y87.1
Y10-Y34,Y87.2
Page 110
Table 6.03 (continued)
Cause of death Falkirk Fife
All causes All 546 1,858 1,691 1,453 1,114 1,001 883 1,734 4,091M 263 971 822 709 514 476 397 844 1,967F 283 887 869 744 600 525 486 890 2,124
A00-B99 M 1 13 11 7 10 7 5 14 21F 3 5 18 8 15 4 4 18 25
Tuberculosis M - - - 1 - 1 - 1 1F - - - 2 - - - - -
A39 Meningococcal infection M - - - - - - - - -F - - - - - - - - -
B15-19 Viral hepatitis M - - - - - - - 1 -F - 1 - - - - - - 1
B20-24 M - 1 - - - - - 2 1F - - - - - - - - 1
C00-D48 II. Neoplasms M 76 292 240 213 161 154 119 271 635F 74 234 222 199 162 157 137 216 584
C00-97 Malignant neoplasms M 73 285 235 211 155 149 117 269 621F 71 227 217 190 158 156 134 210 569
C00-14 M 2 7 8 3 3 4 - 6 10F - 1 2 2 4 3 2 3 8
C15 Malignant neoplasm of oesophagus M 6 20 17 12 12 7 8 15 41F 5 6 8 6 5 6 8 8 21
C16 Malignant neoplasm of stomach M 4 9 7 11 4 6 4 1 22F 2 4 3 5 5 2 3 6 5
C18 Malignant neoplasm of colon M 3 18 11 14 11 12 6 18 34F 5 16 8 16 11 5 9 10 39
C19-21 Malignant neoplasm of rectum and anus M 4 11 14 10 7 11 8 10 20F 4 3 7 7 6 9 5 10 20
C22 M 3 9 14 10 10 5 4 11 16F 1 4 8 3 4 4 - 8 25
C25 Malignant neoplasm of pancreas M 3 11 7 8 4 5 8 17 23F 4 19 12 13 12 10 6 5 19
C32 Malignant neoplasm of larynx M - 2 7 2 1 2 3 5 2F - - 1 1 - 1 - 3 2
C33-34 M 18 84 62 61 31 28 24 77 162F 14 48 57 64 34 36 30 58 147
C43 Malignant melanoma of skin M - 2 4 5 1 1 1 5 5F 2 2 1 - 3 2 2 2 3
C50 Malignant neoplasm of breast M - - - 1 - - - 1 -F 10 30 34 17 22 19 25 27 71
C53 Malignant neoplasm of cervix uteri F 1 6 8 2 1 2 1 4 5C54-55 F 2
11 6 7 4 5 3 9 17C56 Malignant neoplasm of ovary F 5 7 3 5 9 8 6 4 31C61 Malignant neoplasm of prostate M 10 40 20 24 16 14 13 26 88C64 M 2 7 7 5 3 4 4 7 16
F 1 2 6 4 2 6 1 4 14C67 Malignant neoplasm of bladder M 3 10 12 12 9 7 9 16 31
F 2 8 5 7 4 4 1 8 24C81-96 M 4 17 11 9 16 15 5 16 60
F 1 19 18 8 13 10 12 15 39D50-89 M 1 2 2 - - 1 - - 4
F - 2 1 - 2 1 1 1 5
E00-90 M 5 22 23 12 10 8 7 14 43F 6 24 20 10 10 18 8 22 29
E10-E14 Diabetes mellitus M 5 16 21 9 7 7 7 11 31F 3 11 13 6 6 15 6 16 21
F00-99 V. Mental and behavioural disorders M 13 55 44 21 27 24 30 36 121F 19 67 63 46 60 33 46 83 231
F01,F03 Dementia M 11 50 31 19 26 21 29 30 100F 17 65 61 42 55 29 42 81 220
F10 M 2 4 12 2 1 2 - 4 13F 1 - 1 2 2 3 3 1 8M - 1 1 - - 1 - 2 4F - 1 1 - - - - - -
G00-H95 M 15 45 41 33 35 32 21 44 86F 25 84 76 48 56 45 42 51 124
G00-03 Meningitis M - - - - - - - - 1F - - - - - - - 1 1
G30 Alzheimer's Disease M 6 21 18 18 14 18 9 14 44F 20 52 52 36 32 37 27 39 86
ICD10 Summary
list
Clackman-nanshire
Dumfries & Galloway
Dundee City
East Ayrshire
East Dunbarton-
shire
East Lothian
East Renfrew-
shire
I. Certain infectious and parasitic diseases
A15-19, B90
Human immunodeficiency virus (HIV) disease
Malignant neoplasms of lip, oral cavity and pharynx
Malignant neoplasm of liver and intrahepatic bile ducts
Malignant neoplasm of trachea bronchus and lung
Malignant neoplasm of other parts of the uterus
Malignant neoplasm of kidney, except renal pelvis
Malignant neoplasm of lymphoid, haematopoietic and related tissueIII. Diseases of the blood and blood-forming organs and certain disorders involving the immune mechanism
IV. Endocrine, nutritional and metabolic diseases
Mental and behavioural disorders due to use of alcohol
F11-16, F18-19
Mental and behavioural disorders due to use of drugsVI-VIII. Diseases of the nervous system and the sense organs
Page 111
Cause of death Falkirk Fife
I00-99 IX. Diseases of the circulatory system M 76 292 226 221 132 127 112 210 544F 74 239 211 194 143 140 126 225 577
I20-25 Ischaemic heart diseases M 37 160 123 115 66 62 63 108 291F 32 103 81 77 51 56 51 92 207
Other heart diseases M 8 24 14 23 16 16 17 29 48F 12 29 28 27 15 20 12 29 69
I60-69 Cerebrovascular diseases M 16 56 54 55 23 30 12 46 102F 25 61 64 49 57 35 45 63 163
J00-99 X. Diseases of the respiratory system M 29 109 88 91 67 58 46 118 218F 48 108 120 120 75 61 57 116 266
J09-11 Influenza M - 2 - - 3 - 1 2 5F - 2 4 - - 1 - 1 4
J12-18 Pneumonia M 7 23 16 16 14 10 10 29 48F 8 26 24 31 26 17 12 37 60
J40-47 Chronic lower respiratory diseases M 11 55 42 47 29 27 17 56 95F 30 56 65 64 31 31 23 59 148
J45-46 Asthma M - 1 2 - 1 1 - - 3F 2 3 - 4 3 1 1 3 8
K00-93 XI. Diseases of the digestive system M 10 46 42 44 29 18 23 39 106F 15 45 54 51 30 24 16 67 101
K25-28 M 1 1 1 3 1 - - 2 3F - 5 2 2 2 2 1 - 5
Chronic liver disease M 3 14 14 16 7 6 8 15 33F 6 8 6 11 1 2 3 12 19
L00-99 M 1 2 2 - - 2 4 3 3F - 3 2 2 - 2 2 4 9
M00-99 M - 1 5 3 4 2 - 5 12F 2 6 9 6 7 3 4 4 19
Rheumatoid arthritis and osteoarthrosis M - - 1 - 1 2 - 2 5F 2 5 3 1 3 1 - 1 8
N00-99 M 6 25 9 7 7 5 6 13 35F 7 27 21 26 13 6 12 24 54
N00-29 Diseases of the kidney and ureter M 2 15 4 2 4 4 5 5 18F 3 16 13 9 6 4 5 6 34
O00-99 F - - - 1 1 - - - -
P00-96 M - 2 4 1 - 2 - 3 7F - - 3 1 - - 1 4 3
Q00-99 M 4 8 3 - 2 4 - 4 12F - 1 3 1 1 2 2 2 7
Q00-07 M 1 - - - - 1 - - 3F - - 1 - - - - - -
Q20-28 M 1 - - - 1 - - - 3F - 1 1 1 - 1 1 - 3
R00-99 M 1 5 7 1 - 6 3 1 12F 2 11 7 2 7 7 9 11 16
R95 Sudden infant death syndrome M 1 - - - - 1 - - 2F - 1 1 - - - - - 1
R96-99 Other ill-defined and unknown causes M - 2 4 1 - 2 1 1 6F 1 - - - 3 - 1 1 3
V01-Y98 M 25 52 75 55 30 26 21 69 108F 8 31 39 29 18 22 19 42 74
Accidents M 17 38 47 43 25 20 18 46 73F 5 22 24 24 17 19 12 27 57
V01-99 Transport accidents M - 8 3 5 3 2 - 5 6F - 1 3 2 - 3 - 2 4
W00-19 Falls M 3 14 11 11 15 5 9 13 24F 3 15 6 9 14 13 9 16 30
X40-49 Poisonings M 12 12 28 22 6 7 5 22 32F 2 4 11 9 3 2 1 3 16
Intentional self-harm M 7 11 21 8 4 6 3 19 24F 2 7 11 2 1 2 4 10 8
Assault M - - 3 2 - - - - 4F - - 2 1 - - 1 - 2
Event of undetermined intent M 1 1 3 1 - - - 4 6F 1 1 2 1 - 1 1 4 5
ICD10 Summary
list
Clackmannanshire
Dumfries & Galloway
Dundee City
East Ayrshire
East Dunbarton-
shire
East Lothian
East Renfrew-
shire
I30-33,I39-52
Ulcer of the stomach, duodenum and jejunum
K70, K73-74
XII. Diseases of the skin and subcutaneous tissueXIII. Diseases of the musculoskeletal system and connective tissue
M05-06,M15-19
XIV. Diseases of the genitourinary system
XV. Pregnancy, childbirth and the puerperiumXVI. Certain conditions originating in the perinatal periodXVII. Congenital malformations, deformations and chromosomal abnormalities Congenital malformations of the nervous systemCongenital malformations of the circulatory systemXVIII. Symptoms, signs and abnormal clinical and laboratory findings, not elsewhere classified
XX. External causes of morbidity and mortality
V01-X59,Y85, Y86
X60-84,Y87.0
X85-Y09, Y87.1
Y10-Y34,Y87.2
Page 112
Table 6.03 (continued)
Cause of death Highland Inverclyde Midlothian Moray
All causes All 6,321 2,397 1,006 848 979 359 1,593 3,568 223M 3,142 1,260 491 425 494 183 800 1,791 100F 3,179 1,137 515 423 485 176 793 1,777 123
A00-B99 M 37 13 8 5 4 2 7 23 2F 54 9 8 5 8 3 12 38 1
Tuberculosis M 1 - 1 1 - - - 4 -F 3 - - - - - - - -
A39 Meningococcal infection M 1 - - - - - - - -F - - - 1 - - - - -
B15-19 Viral hepatitis M 7 1 1 - - 1 - - -F 4 - 1 - - - - 1 -
B20-24 M 3 1 - - - - - 2 -F - - - - - - - 1 -
C00-D48 II. Neoplasms M 894 390 142 138 161 64 237 517 23F 863 310 114 110 120 56 236 471 22
C00-97 Malignant neoplasms M 887 383 139 136 155 62 234 507 23F 845 304 110 107 119 56 231 461 22
C00-14 M 45 7 3 8 4 1 9 14 -F 18 5 1 - 2 5 3 9 1
C15 Malignant neoplasm of oesophagus M 48 34 11 5 11 2 13 35 1F 24 10 5 4 7 1 5 15 2
C16 Malignant neoplasm of stomach M 40 10 3 2 3 1 12 23 1F 18 4 2 2 2 2 6 7 -
C18 Malignant neoplasm of colon M 45 20 3 10 7 2 14 27 -F 52 19 4 5 13 3 17 26 -
C19-21 Malignant neoplasm of rectum and anus M 32 23 3 8 9 3 9 35 1F 25 11 6 7 3 6 11 11 -
C22 M 53 18 3 4 2 3 10 23 -F 26 13 3 4 1 - 5 11 -
C25 Malignant neoplasm of pancreas M 18 14 7 9 2 4 8 22 1F 41 18 2 4 8 5 8 24 -
C32 Malignant neoplasm of larynx M 12 3 5 1 1 - 4 5 -F 2 - 1 - - - - - -
C33-34 M 252 87 37 31 42 15 60 136 3F 277 57 33 25 25 9 64 135 6
C43 Malignant melanoma of skin M 8 9 3 1 - 1 7 2 1F 3 3 - - 2 - 3 3 1
C50 Malignant neoplasm of breast M 2 - - - - - 1 - -F 86 60 18 17 19 7 32 39 2
C53 Malignant neoplasm of cervix uteri F 11 4 - 1 3 - 2 11 -C54-55 F
18 7 2 3 6 - 6 15 3C56 Malignant neoplasm of ovary F 39 13 7 5 8 6 10 17 2C61 Malignant neoplasm of prostate M 65 48 14 14 18 10 17 51 2C64 M 32 12 2 4 5 3 4 22 1
F 18 3 2 1 3 - 5 11 1C67 Malignant neoplasm of bladder M 31 12 6 5 10 3 14 16 -
F 23 3 1 2 2 - 7 11 1C81-96 M 50 28 15 8 14 3 22 38 5
F 54 27 7 9 4 1 13 37 -D50-89 M 5 3 2 1 4 1 - 2 -
F 7 - 1 1 - - 1 4 1
E00-90 M 77 28 8 6 6 3 14 30 2F 59 18 8 13 13 3 14 42 2
E10-E14 Diabetes mellitus M 64 19 8 5 5 3 13 20 2F 48 9 6 12 11 3 11 24 2
F00-99 V. Mental and behavioural disorders M 184 78 31 17 26 9 30 103 8F 251 115 55 26 38 10 58 139 12
F01,F03 Dementia M 122 63 21 13 21 7 29 72 2F 229 108 53 24 35 10 55 129 11
F10 M 46 15 8 4 5 2 - 23 6F 11 3 2 - 3 - 1 7 1M 9 - 2 - - - 1 1 -F 2 1 - - - - 1 - -
G00-H95 M 124 62 23 37 24 6 41 87 3F 235 73 41 32 25 6 41 106 13
G00-03 Meningitis M 2 1 - - - - - 2 -F 1 - - - - - - - -
G30 Alzheimer's Disease M 57 24 12 13 10 2 16 48 1F 158 39 31 21 13 1 22 66 6
ICD10 Summary
list
Glasgow City
Na h-Eileanan
Siar1
North Ayrshire
North Lanark-shire
Orkney Islands
I. Certain infectious and parasitic diseases
A15-19, B90
Human immunodeficiency virus (HIV) disease
Malignant neoplasms of lip, oral cavity and pharynx
Malignant neoplasm of liver and intrahepatic bile ducts
Malignant neoplasm of trachea bronchus and lung
Malignant neoplasm of other parts of the uterus
Malignant neoplasm of kidney, except renal pelvis
Malignant neoplasm of lymphoid, haematopoietic and related tissueIII. Diseases of the blood and blood-forming organs and certain disorders involving the immune mechanism
IV. Endocrine, nutritional and metabolic diseases
Mental and behavioural disorders due to use of alcohol
F11-16, F18-19
Mental and behavioural disorders due to use of drugsVI-VIII. Diseases of the nervous system and the sense organs
Page 113
Cause of death Highland Inverclyde Midlothian Moray
I00-99 IX. Diseases of the circulatory system M 822 341 124 111 138 59 241 492 36F 760 322 111 117 145 51 178 443 31
I20-25 Ischaemic heart diseases M 436 180 58 68 72 29 140 240 19F 301 98 40 38 52 17 81 166 12
Other heart diseases M 86 34 12 6 14 6 18 55 5F 77 45 13 20 13 6 17 51 6
I60-69 Cerebrovascular diseases M 184 69 35 27 38 15 50 109 7F 258 120 41 36 59 19 51 144 9
J00-99 X. Diseases of the respiratory system M 401 141 69 61 54 20 102 227 14F 474 119 100 60 75 24 127 277 21
J09-11 Influenza M 3 3 2 - - - 1 3 -F 3 2 - 1 - - 1 1 -
J12-18 Pneumonia M 85 32 17 15 11 4 26 56 4F 95 30 28 13 27 8 37 63 7
J40-47 Chronic lower respiratory diseases M 186 61 27 32 23 9 49 100 8F 262 55 49 32 25 7 63 143 8
J45-46 Asthma M 3 4 1 1 - - 2 3 -F 5 2 4 - - - 2 10 -
K00-93 XI. Diseases of the digestive system M 202 71 31 14 29 9 44 132 2F 188 63 34 24 16 10 48 106 4
K25-28 M 6 2 3 1 1 1 2 4 1F 3 2 1 2 - - 1 2 -
Chronic liver disease M 100 37 12 3 14 3 17 59 1F 44 11 6 8 2 2 17 28 1
L00-99 M 6 - 3 - - - 2 9 1F 13 4 1 3 3 - - 12 -
M00-99 M 22 9 1 - 6 1 - 6 -F 28 13 5 2 6 - 9 12 4
Rheumatoid arthritis and osteoarthrosis M 5 4 - - 3 - - 1 -F 12 4 3 1 3 - 5 3 1
N00-99 M 32 21 11 4 8 2 17 26 1F 57 25 11 11 11 6 24 33 3
N00-29 Diseases of the kidney and ureter M 20 9 4 2 4 2 8 15 -F 32 15 9 9 6 2 13 16 2
O00-99 F - - - - - - - 1 -
P00-96 M 4 - 1 - 1 - 1 2 -F 8 - - 1 - - 3 1 -
Q00-99 M 6 2 4 3 - - 3 6 1F 12 4 - 1 - - 2 5 -
Q00-07 M - - - - - - - - -F 1 2 - 1 - - - - -
Q20-28 M 1 - - 1 - - 2 3 -F 4 1 - - - - 1 - -
R00-99 M 45 5 4 1 1 1 3 14 -F 24 18 5 2 8 2 6 12 4
R95 Sudden infant death syndrome M 3 - - - - - - - -F 2 - - - - - 1 - -
R96-99 Other ill-defined and unknown causes M 36 4 2 1 1 1 - 10 -F 10 1 1 - 2 - 2 2 -
V01-Y98 M 281 96 29 27 32 6 58 115 7F 146 44 21 15 17 5 34 75 5
Accidents M 198 71 20 15 17 4 40 77 5F 116 27 18 10 13 3 25 62 4
V01-99 Transport accidents M 14 15 - 2 5 1 4 6 1F 3 6 - 1 2 - 2 3 -
W00-19 Falls M 46 22 6 6 5 2 5 18 2F 50 12 8 6 9 3 12 36 4
X40-49 Poisonings M 116 17 11 5 5 - 27 44 -F 51 - 10 3 1 - 8 15 -
Intentional self-harm M 55 19 5 9 11 - 15 28 1F 23 7 2 4 3 2 6 9 1
Assault M 14 1 1 - - - 2 5 -F 1 1 - - - - - - -
Event of undetermined intent M 9 3 1 2 4 1 - 3 1F 4 7 - - 1 - - 2 -
ICD10 Summary
list
Glasgow City
Na h-Eileanan
Siar1
North Ayrshire
North Lanark-shire
Orkney Islands
I30-33,I39-52
Ulcer of the stomach, duodenum and jejunum
K70, K73-74
XII. Diseases of the skin and subcutaneous tissueXIII. Diseases of the musculoskeletal system and connective tissue
M05-06,M15-19
XIV. Diseases of the genitourinary system
XV. Pregnancy, childbirth and the puerperiumXVI. Certain conditions originating in the perinatal periodXVII. Congenital malformations, deformations and chromosomal abnormalities
Congenital malformations of the nervous systemCongenital malformations of the circulatory systemXVIII. Symptoms, signs and abnormal clinical and laboratory findings, not elsewhere classified
XX. External causes of morbidity and mortality
V01-X59,Y85, Y86
X60-84, Y87.0
X85-Y09,Y87.1
Y10-Y34,Y87.2
Page 114
Table 6.03 (continued)
Cause of death Stirling West Lothian
All causes All 1,617 2,070 1,277 232 1,445 3,529 899 1,050 1,551M 750 1,015 635 122 683 1,697 436 493 741F 867 1,055 642 110 762 1,832 463 557 810
A00-B99 M 7 10 9 2 8 29 9 4 8F 9 23 9 1 10 19 7 11 9
Tuberculosis M - 1 2 - - 1 - - 1F 1 - - - - 1 - 1 -
A39 Meningococcal infection M - - - - - - - - -F - - - - - 1 - - -
B15-19 Viral hepatitis M - - 1 - 1 2 - - -F - - - - - - - - -
B20-24 M - - - - 1 - - - -F - - - - - 1 - - 1
C00-D48 II. Neoplasms M 252 294 205 37 200 500 142 156 234F 232 292 173 38 199 502 113 166 255
C00-97 Malignant neoplasms M 242 287 202 36 195 489 141 152 231F 225 287 169 37 196 491 110 164 252
C00-14 M 2 13 6 - 4 21 3 12 6F 4 4 - - 2 8 1 4 6
C15 Malignant neoplasm of oesophagus M 18 13 13 2 12 27 8 14 21F 7 5 9 - 7 18 6 5 8
C16 Malignant neoplasm of stomach M 8 8 7 - 4 11 5 4 7F 1 5 2 2 5 8 2 9 6
C18 Malignant neoplasm of colon M 19 17 14 2 11 26 6 9 13F 16 21 12 - 9 27 8 9 18
C19-21 Malignant neoplasm of rectum and anus M 14 19 18 3 11 26 6 5 9F 13 13 11 2 13 13 5 4 4
C22 M 18 15 6 1 11 27 9 8 5F 10 11 - - 3 10 4 1 11
C25 Malignant neoplasm of pancreas M 15 14 8 1 6 28 5 4 14F 10 15 11 2 11 24 6 3 10
C32 Malignant neoplasm of larynx M 1 1 2 - 2 7 1 3 1F - - - - - 1 - 1 1
C33-34 M 58 78 46 9 43 115 36 29 59F 54 70 34 9 55 128 38 49 71
C43 Malignant melanoma of skin M 1 4 3 - 3 8 3 4 3F 1 3 2 - - 8 - 1 3
C50 Malignant neoplasm of breast M - - - - - 1 1 - -F 29 45 21 5 30 79 15 26 33
C53 Malignant neoplasm of cervix uteri F 2 5 - - 2 5 - 3 3C54-55 F
7 9 9 2 4 12 - 6 3C56 Malignant neoplasm of ovary F 12 14 8 3 11 18 3 10 12C61 Malignant neoplasm of prostate M 31 40 19 7 17 52 11 14 14C64 M 4 7 5 2 6 16 6 4 8
F 6 9 6 - 1 12 3 4 3C67 Malignant neoplasm of bladder M 5 7 5 1 12 12 5 7 10
F 5 4 5 1 2 13 3 2 7C81-96 M 14 14 20 4 21 22 12 10 28
F 19 16 13 - 8 28 6 4 22D50-89 M 3 2 2 1 2 3 - - 2
F 4 2 1 - - 3 3 1 1
E00-90 M 24 18 8 1 8 37 8 7 18F 16 12 11 1 13 42 11 11 26
E10-E14 Diabetes mellitus M 21 16 7 - 8 29 7 5 14F 15 9 7 1 11 31 7 7 18
F00-99 V. Mental and behavioural disorders M 47 65 28 6 30 91 23 32 36F 82 94 56 9 71 162 26 44 64
F01,F03 Dementia M 42 56 24 4 30 70 23 27 31F 80 91 55 9 68 153 26 42 58
F10 M 3 6 4 2 - 18 - 5 5F 1 1 1 - - 4 - 2 4M 2 3 - - - 1 - - -F 1 1 - - 2 - - - -
G00-H95 M 33 58 35 11 33 71 26 18 37F 62 77 36 13 54 125 42 35 72
G00-03 Meningitis M - 1 - - - - - - -F 1 - - - - - - - -
G30 Alzheimer's Disease M 9 30 11 4 18 23 9 7 10F 44 53 25 9 38 87 33 21 42
ICD10 Summary
list
Perth & Kinross
Renfrew-shire
Scottish Borders
Shetland Islands
South Ayrshire
South Lanark-
shire
West Dunbarton-
shire
I. Certain infectious and parasitic diseases
A15-19, B90
Human immunodeficiency virus (HIV) disease
Malignant neoplasms of lip, oral cavity and pharynx
Malignant neoplasm of liver and intrahepatic bile ducts
Malignant neoplasm of trachea bronchus and lung
Malignant neoplasm of other parts of the uterus
Malignant neoplasm of kidney, except renal pelvis
Malignant neoplasm of lymphoid, haematopoietic and related tissueIII. Diseases of the blood and blood-forming organs and certain disorders involving the immune mechanism
IV. Endocrine, nutritional and metabolic diseases
Mental and behavioural disorders due to use of alcohol
F11-16, F18-19
Mental and behavioural disorders due to use of drugsVI-VIII. Diseases of the nervous system and the sense organs
Page 115
Cause of death Stirling West Lothian
I00-99 IX. Diseases of the circulatory system M 209 271 172 41 208 471 103 111 214F 246 261 171 21 205 445 115 136 187
I20-25 Ischaemic heart diseases M 106 141 83 23 99 222 55 60 106F 76 98 60 8 76 167 46 54 68
Other heart diseases M 17 21 11 2 24 55 11 14 26F 29 29 26 3 18 50 13 26 14
I60-69 Cerebrovascular diseases M 53 61 42 11 59 101 19 27 48F 88 88 55 7 73 157 41 35 64
J00-99 X. Diseases of the respiratory system M 79 135 79 10 101 217 52 70 84F 90 145 90 15 106 278 73 69 109
J09-11 Influenza M - - 1 - - 3 - 1 3F 1 - 2 - 2 1 - 1 -
J12-18 Pneumonia M 23 35 24 3 21 61 16 14 18F 31 30 23 7 27 80 18 19 25
J40-47 Chronic lower respiratory diseases M 30 51 39 5 36 82 20 35 49F 40 72 40 4 47 137 37 30 67
J45-46 Asthma M 1 - - 1 - 1 - 1 -F 1 2 1 2 6 3 1 1 4
K00-93 XI. Diseases of the digestive system M 36 54 32 8 27 95 24 30 42F 35 61 27 4 37 88 28 34 34
K25-28 M 1 5 5 - 3 5 - 1 2F - 1 3 - 1 5 1 - 1
Chronic liver disease M 12 20 11 2 8 43 10 11 14F 9 17 2 - 8 21 6 8 5
L00-99 M 2 4 3 - 2 3 2 - 1F 2 5 2 - 2 8 2 1 1
M00-99 M 6 4 3 1 - 8 2 4 9F 10 5 8 1 5 14 5 11 4
Rheumatoid arthritis and osteoarthrosis M - 1 1 - - 2 1 3 5F 2 4 3 - 1 6 2 5 -
N00-99 M 7 26 13 2 13 33 5 16 10F 20 21 20 1 24 42 14 10 15
N00-29 Diseases of the kidney and ureter M 5 13 5 2 4 17 2 11 7F 11 6 11 - 9 22 6 7 10
O00-99 F - 1 - - - - - - -
P00-96 M 2 - - - - 1 - 1 2F 3 - 1 - 2 4 - - 1
Q00-99 M 3 - - - 3 3 1 5 4F 4 3 2 - 5 4 2 2 3
Q00-07 M - - - - 1 - - 1 1F - 1 - - 1 - - 1 -
Q20-28 M - - - - 1 1 1 1 -F - 1 - - - 1 - - 1
R00-99 M 9 11 5 - 2 9 4 1 3F 9 12 9 2 8 20 5 2 6
R95 Sudden infant death syndrome M 1 - 1 - - 1 - - -F - - - - - - - - 1
R96-99 Other ill-defined and unknown causes M 5 9 4 - 1 6 3 1 2F 1 6 - - 2 9 - 1 1
V01-Y98 M 31 63 41 2 46 126 35 38 37F 43 41 26 4 21 76 17 24 23
Accidents M 16 49 31 2 32 86 26 26 22F 33 34 21 4 20 66 15 22 18
V01-99 Transport accidents M 2 2 6 - 5 9 3 2 1F 3 2 5 - 1 3 - 1 1
W00-19 Falls M 8 12 8 1 9 22 12 11 6F 22 18 14 4 10 37 10 12 7
X40-49 Poisonings M 4 28 10 1 15 45 7 11 8F 4 12 - - 8 21 2 8 8
Intentional self-harm M 13 10 7 - 12 31 8 10 9F 5 4 3 - 1 5 1 - 3
Assault M - 1 1 - 1 2 - - -F 1 - - - - - - 1 -
Event of undetermined intent M 1 1 1 - 1 6 1 2 4F 1 1 1 - - 2 1 - 2
ICD10 Summary
list
Perth & Kinross
Renfrew-shire
Scottish Borders
Shetland Islands
South Ayrshire
South Lanark-
shire
West Dunbarton-
shire
I30-33,I39-52
Ulcer of the stomach, duodenum and jejunum
K70, K73-74
XII. Diseases of the skin and subcutaneous tissueXIII. Diseases of the musculoskeletal system and connective tissue
M05-06, M15-19
XIV. Diseases of the genitourinary system
XV. Pregnancy, childbirth and the puerperiumXVI. Certain conditions originating in the perinatal periodXVII. Congenital malformations, deformations and chromosomal abnormalities
Congenital malformations of the nervous systemCongenital malformations of the circulatory systemXVIII. Symptoms, signs and abnormal clinical and laboratory findings, not elsewhere classified
XX. External causes of morbidity and mortality
V01-X59,Y85, Y86
X60-84,Y87.0
X85-Y09,Y87.1
Y10-Y34,Y87.2
Page 116
Table 6.03 (continued)
Cause of death Fife HBA Highland HBA
All causes All 4,491 1,277 1,858 4,091 3,179 5,468 12,444 3,507 7,097M 2,192 635 971 1,967 1,543 2,688 6,052 1,820 3,488F 2,299 642 887 2,124 1,636 2,780 6,392 1,687 3,609
A00-B99 M 22 9 13 21 24 26 74 21 52F 30 9 5 25 28 37 115 15 57
Tuberculosis M 1 2 - 1 1 - 3 - 5F 2 - - - - - 4 - 1
A39 Meningococcal infection M - - - - - - 1 - -F - - - - - - - - 1
B15-19 Viral hepatitis M 1 1 - - 1 1 8 1 2F - - 1 1 - 2 5 - 1
B20-24 M 1 - 1 1 2 1 3 2 2F - - - 1 - 1 - - 2
C00-D48 II. Neoplasms M 650 205 292 635 489 834 1,766 575 1,017F 634 173 234 584 403 709 1,734 453 973
C00-97 Malignant neoplasms M 640 202 285 621 483 818 1,737 562 996F 617 169 227 569 391 694 1,698 440 952
C00-14 M 16 6 7 10 11 14 76 14 35F 7 - 1 8 4 7 33 7 17
C15 Malignant neoplasm of oesophagus M 37 13 20 41 29 57 106 53 62F 18 9 6 21 19 33 52 16 33
C16 Malignant neoplasm of stomach M 27 7 9 22 10 25 63 15 34F 16 2 4 5 10 8 42 5 15
C18 Malignant neoplasm of colon M 39 14 18 34 27 47 91 28 53F 42 12 16 39 23 53 106 28 53
C19-21 Malignant neoplasm of rectum and anus M 30 18 11 20 20 39 74 27 61F 31 11 3 20 19 29 59 16 24
C22 M 31 6 9 16 23 28 93 26 50F 11 - 4 25 13 16 45 15 21
C25 Malignant neoplasm of pancreas M 22 8 11 23 25 32 55 30 50F 32 11 19 19 15 31 79 28 48
C32 Malignant neoplasm of larynx M 8 2 2 2 6 7 25 5 12F 1 - - 2 3 2 4 - 1
C33-34 M 164 46 84 162 131 205 451 128 251F 183 34 48 147 110 159 493 81 263
C43 Malignant melanoma of skin M 15 3 2 5 8 4 21 12 10F 3 2 2 3 4 9 12 3 11
C50 Malignant neoplasm of breast M 2 - - - 2 - 2 - 1F 79 21 30 71 52 95 222 81 118
C53 Malignant neoplasm of cervix uteri F 6 - 6 5 5 11 21 8 16C54-55 F
17 9 11 17 11 20 42 14 27C56 Malignant neoplasm of ovary F 26 8 7 31 12 36 85 21 35C61 Malignant neoplasm of prostate M 58 19 40 88 47 98 162 67 103C64 M 15 5 7 16 15 28 52 17 38
F 10 6 2 14 8 12 36 3 23C67 Malignant neoplasm of bladder M 38 5 10 31 24 37 69 20 28
F 16 5 8 24 13 14 35 4 24C81-96 M 52 20 17 60 32 65 110 36 60
F 29 13 19 39 22 33 106 32 65D50-89 M 2 2 2 4 1 8 9 6 5
F 1 1 2 5 4 8 14 1 7
E00-90 M 34 8 22 43 27 57 127 41 67F 37 11 24 29 39 62 108 25 84
E10-E14 Diabetes mellitus M 30 7 16 31 23 47 107 29 49F 28 7 11 21 26 49 82 15 55
F00-99 V. Mental and behavioural disorders M 81 28 55 121 72 140 369 108 194F 175 56 67 231 128 272 550 167 301
F01,F03 Dementia M 78 24 50 100 64 111 281 88 142F 165 55 65 220 124 257 512 158 282
F10 M 2 4 4 13 6 24 66 18 41F 3 1 - 8 2 8 21 3 11M 1 - 1 4 2 3 14 2 2F 3 - 1 - - 2 3 1 -
G00-H95 M 107 35 45 86 85 127 279 80 158F 143 36 84 124 118 168 486 112 231
G00-03 Meningitis M - - - 1 - - 3 1 2F - - - 1 1 1 1 - -
G30 Alzheimer's Disease M 52 11 21 44 29 56 129 30 71F 96 25 52 86 92 104 322 60 153
ICD10 Summary
list
Ayrshire & Arran HBA
Borders HBA
Dumfries & Galloway
HBA
Forth Valley HBA
Grampian HBA
Greater Glasgow & Clyde HBA
Lanarkshire HBA
I. Certain infectious and parasitic diseases
A15-19, B90
Human immunodeficiency virus (HIV) disease
Malignant neoplasms of lip, oral cavity and pharynx
Malignant neoplasm of liver and intrahepatic bile ducts
Malignant neoplasm of trachea bronchus and lung
Malignant neoplasm of other parts of the uterus
Malignant neoplasm of kidney, except renal pelvis
Malignant neoplasm of lymphoid, haematopoietic and related tissueIII. Diseases of the blood and blood-forming organs and certain disorders involving the immune mechanism
IV. Endocrine, nutritional and metabolic diseases
Mental and behavioural disorders due to use of alcohol
F11-16, F18-19
Mental and behavioural disorders due to use of drugsVI-VIII. Diseases of the nervous system and the sense organs
Page 117
Cause of death Fife HBA Highland HBA
I00-99 IX. Diseases of the circulatory system M 670 172 292 544 389 783 1,572 512 963F 577 171 239 577 414 816 1,537 475 888
I20-25 Ischaemic heart diseases M 354 83 160 291 200 366 824 261 462F 234 60 103 207 170 278 595 158 333
Other heart diseases M 65 11 24 48 48 115 166 51 110F 62 26 29 69 54 145 172 59 101
I60-69 Cerebrovascular diseases M 164 42 56 102 81 198 342 107 210F 173 55 61 163 129 267 524 167 301
J00-99 X. Diseases of the respiratory system M 294 79 109 218 199 299 788 198 444F 353 90 108 266 237 344 920 191 555
J09-11 Influenza M 1 1 2 5 2 2 10 4 6F 3 2 2 4 1 4 4 2 2
J12-18 Pneumonia M 63 24 23 48 52 73 175 49 117F 95 23 26 60 63 109 210 60 143
J40-47 Chronic lower respiratory diseases M 132 39 55 95 87 138 345 80 182F 174 40 56 148 126 149 467 78 280
J45-46 Asthma M 2 - 1 3 - 5 6 5 4F 12 1 3 8 6 11 16 2 13
K00-93 XI. Diseases of the digestive system M 115 32 46 106 73 137 369 94 227F 136 27 45 101 110 136 363 93 194
K25-28 M 8 5 1 3 3 10 16 3 9F 4 3 5 5 1 2 8 3 7
Chronic liver disease M 41 11 14 33 28 48 158 44 102F 36 2 8 19 24 25 79 15 49
L00-99 M 4 3 2 3 6 3 17 1 12F 4 2 3 9 6 8 22 7 20
M00-99 M 3 3 1 12 7 17 35 12 14F 20 8 6 19 11 28 60 17 26
Rheumatoid arthritis and osteoarthrosis M - 1 - 5 3 8 10 6 3F 7 3 5 8 5 10 27 6 9
N00-99 M 37 13 25 35 24 43 98 30 59F 74 20 27 54 45 60 124 35 75
N00-29 Diseases of the kidney and ureter M 14 5 15 18 9 29 57 16 32F 31 11 16 34 15 34 65 23 38
O00-99 F 1 - - - - - 2 - 1
P00-96 M 2 - 2 7 3 6 6 - 3F 6 1 - 3 4 4 9 1 5
Q00-99 M 6 - 8 12 9 7 17 4 9F 8 2 1 7 4 4 20 6 9
Q00-07 M 1 - - 3 1 2 1 - -F 1 - - - - - 3 3 -
Q20-28 M 3 - - 3 2 1 3 - 4F 2 - 1 3 - 2 6 1 1
R00-99 M 6 5 5 12 6 14 64 11 23F 16 9 11 16 18 21 59 24 32
R95 Sudden infant death syndrome M - 1 - 2 1 - 3 - 1F 1 - 1 1 - - 2 - -
R96-99 Other ill-defined and unknown causes M 2 4 2 6 4 10 49 8 16F 4 - - 3 2 4 22 1 11
V01-Y98 M 159 41 52 108 129 187 462 127 241F 84 26 31 74 67 103 269 65 151
Accidents M 115 31 38 73 89 119 336 96 163F 69 21 22 57 47 81 219 45 128
V01-99 Transport accidents M 14 6 8 6 8 26 21 20 15F 5 5 1 4 2 5 6 8 6
W00-19 Falls M 25 8 14 24 28 39 99 30 40F 31 14 15 30 29 42 111 23 73
X40-49 Poisonings M 64 10 12 32 41 42 177 26 89F 25 - 4 16 7 23 85 2 36
Intentional self-harm M 35 7 11 24 34 53 87 25 59F 9 3 7 8 13 12 34 8 14
Assault M 5 1 - 4 - 3 16 1 7F 1 - - 2 - 2 3 1 -
Event of undetermined intent M 2 1 1 6 6 9 13 3 9F 1 1 1 5 6 5 6 7 4
ICD10 Summary
list
Ayrshire & Arran HBA
Borders HBA
Dumfries & Galloway
HBA
Forth Valley HBA
Grampian HBA
Greater Glasgow & Clyde HBA
Lanarkshire HBA
I30-33,I39-52
Ulcer of the stomach, duodenum and jejunum
K70, K73-74
XII. Diseases of the skin and subcutaneous tissueXIII. Diseases of the musculoskeletal system and connective tissue
M05-06,M15-19
XIV. Diseases of the genitourinary system
XV. Pregnancy, childbirth and the puerperiumXVI. Certain conditions originating in the perinatal periodXVII. Congenital malformations, deformations and chromosomal abnormalities
Congenital malformations of the nervous systemCongenital malformations of the circulatory systemXVIII. Symptoms, signs and abnormal clinical and laboratory findings, not elsewhere classified
XX. External causes of morbidity and mortality
V01-X59,Y85, Y86
X60-84,Y87.0
X85-Y09,Y87.1
Y10-Y34,Y87.2
Page 118
Table 6.03 (continued)
Cause of death
All causes All 7,761 223 232 4,741 359M 3,734 100 122 2,265 183F 4,027 123 110 2,476 176
A00-B99 M 48 2 2 27 2F 51 1 1 33 3
Tuberculosis M 3 - - 1 -F - - - 2 -
A39 Meningococcal infection M - - - 1 -F 1 - - - -
B15-19 Viral hepatitis M 2 - - - 1F 1 - - - -
B20-24 M 4 - - 2 -F 1 - - - -
C00-D48 II. Neoplasms M 1,145 23 37 735 64F 1,119 22 38 646 56
C00-97 Malignant neoplasms M 1,123 23 36 715 62F 1,095 22 37 631 56
C00-14 M 38 - - 11 1F 21 1 - 8 5
C15 Malignant neoplasm of oesophagus M 79 1 2 51 2F 38 2 - 19 1
C16 Malignant neoplasm of stomach M 33 1 - 25 1F 18 - 2 7 2
C18 Malignant neoplasm of colon M 64 - 2 45 2F 79 - - 38 3
C19-21 Malignant neoplasm of rectum and anus M 65 1 3 36 3F 42 - 2 35 6
C22 M 41 - 1 46 3F 34 - - 27 -
C25 Malignant neoplasm of pancreas M 56 1 1 35 4F 42 - 2 35 5
C32 Malignant neoplasm of larynx M 12 - - 10 -F 6 - - 1 -
C33-34 M 269 3 9 163 15F 264 6 9 148 9
C43 Malignant melanoma of skin M 10 1 - 10 1F 8 1 - 2 -
C50 Malignant neoplasm of breast M 2 - - - -F 149 2 5 88 7
C53 Malignant neoplasm of cervix uteri F 16 - - 12 -C54-55 F
31 3 2 26 -C56 Malignant neoplasm of ovary F 55 2 3 22 6C61 Malignant neoplasm of prostate M 104 2 7 89 10C64 M 30 1 2 23 3
F 24 1 - 16 -C67 Malignant neoplasm of bladder M 42 - 1 28 3
F 26 1 1 13 -C81-96 M 96 5 4 43 3
F 75 - - 49 1D50-89 M 7 - 1 7 1
F 8 1 - 7 -
E00-90 M 75 2 1 62 3F 111 2 1 44 3
E10-E14 Diabetes mellitus M 59 2 - 53 3F 88 2 1 35 3
F00-99 V. Mental and behavioural disorders M 213 8 6 118 9F 364 12 9 204 10
F01,F03 Dementia M 168 2 4 95 7F 331 11 9 195 10
F10 M 32 6 2 20 2F 16 1 - 7 -M 9 - - 3 -F 2 - - 2 -
G00-H95 M 234 3 11 122 6F 315 13 13 199 6
G00-03 Meningitis M 1 - - - -F 1 - - 1 -
G30 Alzheimer's Disease M 99 1 4 55 2F 215 6 9 138 1
ICD10 Summary
list
Lothian HBA
Orkney HBA
Shetland HBA
Tayside HBA
Western Isles HBA
I. Certain infectious and parasitic diseases
A15-19, B90
Human immunodeficiency virus (HIV) disease
Malignant neoplasms of lip, oral cavity and pharynx
Malignant neoplasm of liver and intrahepatic bile ducts
Malignant neoplasm of trachea bronchus and lung
Malignant neoplasm of other parts of the uterus
Malignant neoplasm of kidney, except renal pelvis
Malignant neoplasm of lymphoid, haematopoietic and related tissueIII. Diseases of the blood and blood-forming organs and certain disorders involving the immune mechanism
IV. Endocrine, nutritional and metabolic diseases
Mental and behavioural disorders due to use of alcohol
F11-16, F18-19
Mental and behavioural disorders due to use of drugsVI-VIII. Diseases of the nervous system and the sense organs
Page 119
Cause of death
I00-99 IX. Diseases of the circulatory system M 1,008 36 41 604 59F 1,026 31 21 663 51
I20-25 Ischaemic heart diseases M 528 19 23 317 29F 370 12 8 235 17
Other heart diseases M 109 5 2 50 6F 125 6 3 81 6
I60-69 Cerebrovascular diseases M 230 7 11 147 15F 336 9 7 219 19
J00-99 X. Diseases of the respiratory system M 444 14 10 257 20F 498 21 15 301 24
J09-11 Influenza M 6 - - 3 -F 7 - - 6 -
J12-18 Pneumonia M 100 4 3 54 4F 123 7 7 77 8
J40-47 Chronic lower respiratory diseases M 217 8 5 116 9F 245 8 4 148 7
J45-46 Asthma M 9 - 1 5 -F 14 - 2 4 -
K00-93 XI. Diseases of the digestive system M 167 2 8 111 9F 198 4 4 124 10
K25-28 M 11 1 - 3 1F 13 - - 4 -
Chronic liver disease M 55 1 2 34 3F 40 1 - 20 2
L00-99 M 8 1 - 6 -F 15 - - 9 -
M00-99 M 24 - 1 17 1F 32 4 1 26 -
Rheumatoid arthritis and osteoarthrosis M 9 - - 4 -F 12 1 - 9 -
N00-99 M 47 1 2 23 2F 71 3 1 57 6
N00-29 Diseases of the kidney and ureter M 28 - 2 14 2F 48 2 - 33 2
O00-99 F 1 - - - -
P00-96 M 12 - - 7 -F 8 - - 8 -
Q00-99 M 20 1 - 7 -F 9 - - 10 -
Q00-07 M 3 - - - -F 2 - - 2 -
Q20-28 M 2 - - - -F 2 - - 1 -
R00-99 M 32 - - 18 1F 48 4 2 26 2
R95 Sudden infant death syndrome M 2 - - 1 -F 1 - - 1 -
R96-99 Other ill-defined and unknown causes M 16 - - 11 1F 5 - - 1 -
V01-Y98 M 250 7 2 144 6F 153 5 4 119 5
Accidents M 158 5 2 91 4F 110 4 4 86 3
V01-99 Transport accidents M 15 1 - 6 1F 8 - - 9 -
W00-19 Falls M 45 2 1 31 2F 62 4 4 49 3
X40-49 Poisonings M 72 - 1 41 -F 28 - - 17 -
Intentional self-harm M 60 1 - 43 -F 31 1 - 22 2
Assault M 1 - - 3 -F - - - 4 -
Event of undetermined intent M 21 1 - 5 1F 7 - - 4 -
Footnote
© Crown Copyright 2017
ICD10 Summary
list
Lothian HBA
Orkney HBA
Shetland HBA
Tayside HBA
Western Isles HBA
I30-33,I39-52
Ulcer of the stomach, duodenum and jejunum
K70, K73-74
XII. Diseases of the skin and subcutaneous tissueXIII. Diseases of the musculoskeletal system and connective tissue
M05-06,M15-19
XIV. Diseases of the genitourinary system
XV. Pregnancy, childbirth and the puerperiumXVI. Certain conditions originating in the perinatal periodXVII. Congenital malformations, deformations and chromosomal abnormalities
Congenital malformations of the nervous systemCongenital malformations of the circulatory systemXVIII. Symptoms, signs and abnormal clinical and laboratory findings, not elsewhere classified
XX. External causes of morbidity and mortality
V01-X59,Y85, Y86
X60-84,Y87.0
X85-Y09,Y87.1
Y10-Y34,Y87.2
1) The alphabetical order of the council areas has changed due to adoption of the preferred forms of reference to the Edinburgh and Western Isles council areas. Previous versions of this table used the forms 'Edinburgh, City of' and 'Eilean Siar'.
Page 120
ICD Codes Cause of death All ages Age group0 1-4 5-9 10-14 15-19 20-24 25-29 30-34 35-39 40-44 45-49 50-54 55-59 60-64 65-69 70-74 75-79 80-84
All causes P 56,728 181 42 29 26 98 165 276 363 470 822 1,173 1,699 2,302 3,082 4,767 5,818 7,462 9,350M 27,760 94 23 19 13 67 108 206 238 292 530 721 1,031 1,367 1,807 2,844 3,245 3,843 4,551F 28,968 87 19 10 13 31 57 70 125 178 292 452 668 935 1,275 1,923 2,573 3,619 4,799
A00-B99 I. CERTAIN INFECTIOUS AND PARASITIC DISEASES M 343 - 7 1 - - 3 2 1 7 3 13 18 14 20 32 36 43 62F 410 1 4 3 1 - 1 - 3 3 5 9 14 14 15 26 33 49 70
A00-09 Intestinal infectious diseases M 49 - 1 - - - - - - - - 1 2 1 2 4 3 9 10F 95 - - - 1 - - - - - - - 1 2 - 7 12 8 15
A04 Other bacterial intestinal infections M 18 - - - - - - - - - - 1 1 - 1 3 - 5 5F 36 - - - - - - - - - - - - 1 - 4 4 3 7
A08 Viral and other specified intestinal infections M 8 - 1 - - - - - - - - - 1 - - - 1 1 1F 13 - - - - - - - - - - - 1 - - 1 1 1 -
A09 Other gastroenteritis and colitis of infectious and unspecified origin M 23 - - - - - - - - - - - - 1 1 1 2 3 4F 46 - - - 1 - - - - - - - - 1 - 2 7 4 8
A15-19 Tuberculosis M 13 - - 1 - - - - - - - 1 - - 2 3 1 2 -F 4 - - - - - - - - - - - - 1 - - - - 2
A16 M 9 - - 1 - - - - - - - 1 - - 1 2 1 - -F 4 - - - - - - - - - - - - 1 - - - - 2
A17 Tuberculosis of nervous system M 1 - - - - - - - - - - - - - - - - 1 -F - - - - - - - - - - - - - - - - - - -
A18 Tuberculosis of other organs M 1 - - - - - - - - - - - - - - 1 - - -F - - - - - - - - - - - - - - - - - - -
A19 Miliary tuberculosis M 2 - - - - - - - - - - - - - 1 - - 1 -F - - - - - - - - - - - - - - - - - - -
A20-28 Certain zoonotic bacterial diseases M 1 - - - - - - - - 1 - - - - - - - - -F - - - - - - - - - - - - - - - - - - -
A28 Other zoonotic bacterial diseases, not elsewhere classified M 1 - - - - - - - - 1 - - - - - - - - -F - - - - - - - - - - - - - - - - - - -
A30-49 Other bacterial diseases M 201 - 5 - - - 3 1 - 1 - 5 5 4 13 17 24 26 42F 261 - 4 3 - - 1 - 3 - 2 5 11 6 14 18 20 35 45
A31 Infection due to other mycobacteria M 1 - - - - - - - - - - - - - - - - - 1F 1 - - - - - - - - - - - - 1 - - - - -
A32 Listeriosis M - - - - - - - - - - - - - - - - - - -F 1 - - - - - - - - - - - - - - - - 1 -
A39 Meningococcal infection M 2 - 1 - - - - - - - - - - - - 1 - - -F 2 - - 1 - - - - - - - - - - - - - - 1
A40 Streptococcal sepsis M 14 - 3 - - - - - - - - - 1 - 2 3 2 1 1F 11 - 2 2 - - - - - - - 1 1 - - - - 1 2
A41 Other sepsis M 146 - - - - - 2 1 - 1 - 3 4 4 7 10 20 18 32F 211 - 1 - - - 1 - 2 - - 3 10 5 13 18 20 28 34
A48 Other bacterial diseases, not elsewhere classified M 4 - - - - - - - - - - - - - 1 1 - 2 -F 1 - - - - - - - - - - - - - - - - 1 -
A49 Bacterial infection of unspecified site M 34 - 1 - - - 1 - - - - 2 - - 3 2 2 5 8F 34 - 1 - - - - - 1 - 2 1 - - 1 - - 4 8
A80-89 Viral infections of the central nervous system M 10 - - - - - - - - 2 - - - 2 - 1 2 2 1F 2 - - - - - - - - - - - - - - - - 2 -
A81 Atypical virus infections of central nervous system M 8 - - - - - - - - 1 - - - 2 - 1 2 1 1F 2 - - - - - - - - - - - - - - - - 2 -
A86 Unspecified viral encephalitis M 2 - - - - - - - - 1 - - - - - - - 1 -F - - - - - - - - - - - - - - - - - - -
B00-09 M 6 - - - - - - - - 1 - - 1 - - - 1 1 1F 11 - - - - - - - - - - - - - - - - - 3
B00 Herpesviral [herpes simplex] infections M 3 - - - - - - - - - - - - - - - 1 1 -F 3 - - - - - - - - - - - - - - - - - 2
B01 Varicella [chickenpox] M 2 - - - - - - - - - - - 1 - - - - - 1F - - - - - - - - - - - - - - - - - - -
B02 Zoster [herpes zoster] M 1 - - - - - - - - 1 - - - - - - - - -F 8 - - - - - - - - - - - - - - - - - 1
B15-19 Viral hepatitis M 18 - - - - - - - - 2 - 4 5 2 1 3 1 - -F 11 - - - - - - - - 2 2 2 2 2 - - 1 - -
B16 Acute hepatitis B M 1 - - - - - - - - - - - - - - - 1 - -F - - - - - - - - - - - - - - - - - - -
B17 Other acute viral hepatitis M 1 - - - - - - - - - - - - - - 1 - - -F 1 - - - - - - - - - - - - 1 - - - - -
B18 Chronic viral hepatitis M 16 - - - - - - - - 2 - 4 5 2 1 2 - - -F 10 - - - - - - - - 2 2 2 2 1 - - 1 - -
B20-24 Human immunodeficiency virus [HIV] disease M 19 - - - - - - 1 1 - 3 2 5 2 2 1 - 1 1F 5 - - - - - - - - 1 1 1 - 2 - - - - -
B20 M 7 - - - - - - - - - 2 - 2 2 1 - - - -F 2 - - - - - - - - 1 - - - 1 - - - - -
B21 M 1 - - - - - - - - - - - 1 - - - - - -F 1 - - - - - - - - - 1 - - - - - - - -
B22 M 4 - - - - - - - 1 - - - 2 - 1 - - - -F - - - - - - - - - - - - - - - - - - -
B23 M 4 - - - - - - - - - - 1 - - - 1 - 1 1F - - - - - - - - - - - - - - - - - - -
B24 Unspecified human immunodeficiency virus [HIV] disease M 3 - - - - - - 1 - - 1 1 - - - - - - -F 2 - - - - - - - - - - 1 - 1 - - - - -
B25-34 Other viral diseases M 5 - 1 - - - - - - - - - - 2 - 1 - - -F 8 1 - - - - - - - - - - - - 1 1 - 1 2
B25 Cytomegaloviral disease M 1 - - - - - - - - - - - - - - - - - -F 1 - - - - - - - - - - - - - 1 - - - -
B26 Mumps M - - - - - - - - - - - - - - - - - - -F 1 - - - - - - - - - - - - - - - - - -
B27 Infectious mononucleosis M - - - - - - - - - - - - - - - - - - -F 1 - - - - - - - - - - - - - - - - - 1
B33 Other viral diseases, not elsewhere classified M 1 - - - - - - - - - - - - 1 - - - - -F - - - - - - - - - - - - - - - - - - -
B34 Viral infection of unspecified site M 3 - 1 - - - - - - - - - - 1 - 1 - - -F 5 1 - - - - - - - - - - - - - 1 - 1 1
B35-49 Mycoses M 10 - - - - - - - - - - - - 1 - 2 2 2 1F 2 - - - - - - - - - - 1 - - - - - - -
B37 Candidiasis M 2 - - - - - - - - - - - - - - - 1 - -F 2 - - - - - - - - - - 1 - - - - - - -
B44 Aspergillosis M 7 - - - - - - - - - - - - 1 - 2 1 2 1F - - - - - - - - - - - - - - - - - - -
B45 Cryptococcosis M 1 - - - - - - - - - - - - - - - - - -F - - - - - - - - - - - - - - - - - - -
B50-64 Protozoal diseases M - - - - - - - - - - - - - - - - - - -F 1 - - - - - - - - - - - - 1 - - - - -
B59 Pneumocystosis M - - - - - - - - - - - - - - - - - - -F 1 - - - - - - - - - - - - 1 - - - - -
B90-94 Sequelae of infectious and parasitic diseases M 10 - - - - - - - - - - - - - - - 2 - 5F 7 - - - - - - - - - - - - - - - - 2 3
B90 Sequelae of tuberculosis M 4 - - - - - - - - - - - - - - - - - 3F 5 - - - - - - - - - - - - - - - - 1 3
B91 Sequelae of poliomyelitis M 3 - - - - - - - - - - - - - - - 1 - -F 1 - - - - - - - - - - - - - - - - 1 -
B94 M 3 - - - - - - - - - - - - - - - 1 - 2
Table 6.04: Deaths, by sex, age and cause1, Scotland, 2016
Respiratory tuberculosis, not confirmed bacteriologically or histologically
Viral infections characterised by skin and mucous membrane lesions
Human immunodeficiency virus [HIV] disease resulting in infectious and parasitic diseasesHuman immunodeficiency virus [HIV] disease resulting in malignant neoplasmsHuman immunodeficiency virus [HIV] disease resulting in other specified diseasesHuman immunodeficiency virus [HIV] disease resulting in other conditions
Sequelae of other and unspecified infectious and parasitic diseases
Page 121
ICD Codes Cause of death All ages Age group0 1-4 5-9 10-14 15-19 20-24 25-29 30-34 35-39 40-44 45-49 50-54 55-59 60-64 65-69 70-74 75-79 80-84
F 1 - - - - - - - - - - - - - - - - - -B99-B99 Other infectious diseases M 1 - - - - - - - - - - - - - - - - - 1
F 3 - - - - - - - - - - - - - - - - 1 -B99 Other and unspecified infectious diseases M 1 - - - - - - - - - - - - - - - - - 1
F 3 - - - - - - - - - - - - - - - - 1 -C00-D48 II. NEOPLASMS M 8,467 - 3 6 1 5 9 13 21 22 70 171 271 454 734 1,204 1,292 1,374 1,387
F 7,778 1 1 1 4 4 7 13 24 49 98 154 291 440 557 869 1,065 1,246 1,231C00-97 Malignant neoplasms M 8,303 - 2 6 1 5 8 13 21 21 70 168 268 448 726 1,192 1,272 1,351 1,354
F 7,598 - 1 1 4 4 7 13 23 49 95 153 288 435 555 863 1,045 1,225 1,198C00-14 Lip, oral cavity and pharynx M 239 - - - - - 1 - - - 2 12 16 21 44 54 34 19 24
F 119 - - - 1 - - - - - - 2 5 3 9 16 22 20 17C00 Malignant neoplasm of lip M 3 - - - - - - - - - - - - 1 2 - - - -
F - - - - - - - - - - - - - - - - - - -C01 Malignant neoplasm of base of tongue M 14 - - - - - - - - - - 2 - 3 2 2 2 1 1
F 7 - - - - - - - - - - - 1 2 1 - 1 2 -C02 Malignant neoplasm of other and unspecified parts of tongue M 45 - - - - - 1 - - - 1 1 2 2 7 11 5 5 5
F 27 - - - 1 - - - - - - - 1 - 1 3 8 3 5C03 Malignant neoplasm of gum M 2 - - - - - - - - - - - - - 1 1 - - -
F 1 - - - - - - - - - - - - - - - - - -C04 Malignant neoplasm of floor of mouth M 5 - - - - - - - - - - - - 2 - 1 - 1 1
F 9 - - - - - - - - - - - - - 2 - - 3 2C05 Malignant neoplasm of palate M 6 - - - - - - - - - - - - - 2 2 1 1 -
F 4 - - - - - - - - - - - - - - 1 1 2 -C06 Malignant neoplasm of other and unspecified parts of mouth M 22 - - - - - - - - - - 1 1 1 8 4 2 4 -
F 20 - - - - - - - - - - - 1 - 1 1 2 1 3C07 Malignant neoplasm of parotid gland M 12 - - - - - - - - - - - 2 1 - 1 1 1 4
F 8 - - - - - - - - - - - - 1 - 1 3 - -C08 Malignant neoplasm of other and unspecified major salivary glands M 3 - - - - - - - - - - - - 1 - - 2 - -
F 1 - - - - - - - - - - - - - - 1 - - -C09 Malignant neoplasm of tonsil M 20 - - - - - - - - - - 3 - 4 4 4 3 1 1
F 11 - - - - - - - - - - - 1 - 1 2 4 - 3C10 Malignant neoplasm of oropharynx M 34 - - - - - - - - - 1 3 2 2 5 12 5 1 2
F 12 - - - - - - - - - - - - - 2 3 2 5 -C11 Malignant neoplasm of nasopharynx M 7 - - - - - - - - - - - 1 - 2 1 - - 3
F 4 - - - - - - - - - - 1 - - - 1 - 1 -C12 Malignant neoplasm of pyriform sinus M 16 - - - - - - - - - - - 1 2 5 2 3 1 2
F 1 - - - - - - - - - - - - - - - - - 1C13 Malignant neoplasm of hypopharynx M 24 - - - - - - - - - - 2 2 - 2 8 5 2 2
F 6 - - - - - - - - - - - - - 1 2 - 1 1C14 M 26 - - - - - - - - - - - 5 2 4 5 5 1 3
F 8 - - - - - - - - - - 1 1 - - 1 1 2 2C15-26 Digestive organs M 2,628 - - - - 1 2 2 5 3 23 59 103 172 238 393 418 433 407
F 1,980 - - - - 1 1 1 5 7 20 41 58 104 142 191 277 287 363C15 Malignant neoplasm of oesophagus M 553 - - - - - - - 1 - 6 16 25 34 61 97 107 80 68
F 267 - - - - - - - - 1 1 4 8 16 28 22 34 40 61C16 Malignant neoplasm of stomach M 272 - - - - - 2 - 3 - 3 4 13 22 22 26 39 54 47
F 136 - - - - - - - - 2 1 6 3 14 5 8 10 22 25C17 Malignant neoplasm of small intestine M 39 - - - - - - - - - 1 2 2 2 2 9 6 2 9
F 33 - - - - - - - - - - 1 2 - 2 2 7 7 4C18 Malignant neoplasm of colon M 464 - - - - 1 - 1 - - 4 13 14 25 33 62 53 85 87
F 492 - - - - - 1 - 4 2 6 12 14 17 28 38 71 58 90C19 Malignant neoplasm of rectosigmoid junction M 160 - - - - - - - - - 2 1 6 9 17 27 23 30 28
F 129 - - - - - - - - 1 2 7 7 9 9 12 14 14 23C20 Malignant neoplasm of rectum M 233 - - - - - - 1 - 2 1 3 10 17 12 24 38 47 40
F 139 - - - - - - - 1 1 1 - 1 7 10 10 20 17 28C21 Malignant neoplasm of anus and anal canal M 15 - - - - - - - - - 1 - 1 2 2 2 3 - 2
F 29 - - - - - - - - - 2 3 1 3 2 4 2 1 6C22 Malignant neoplasm of liver and intrahepatic bile ducts M 373 - - - - - - - - 1 2 7 15 32 36 64 58 62 45
F 211 - - - - - - 1 - - 1 1 12 10 17 22 30 46 32C23 Malignant neoplasm of gallbladder M 19 - - - - - - - - - - 1 1 1 3 1 3 4 2
F 44 - - - - - - - - - 1 - 1 4 2 6 7 12 2C24 Malignant neoplasm of other and unspecified parts of biliary tract M 31 - - - - - - - - - - 1 - 2 3 6 - 7 6
F 21 - - - - - - - - - - 1 1 - 3 2 5 5 3C25 Malignant neoplasm of pancreas M 353 - - - - - - - - - 2 8 15 22 37 61 71 41 54
F 366 - - - - 1 - - - - 5 4 8 16 30 57 63 52 71C26 Malignant neoplasm of other and ill-defined digestive organs M 116 - - - - - - - 1 - 1 3 1 4 10 14 17 21 19
F 113 - - - - - - - - - - 2 - 8 6 8 14 13 18C30-39 Respiratory and intrathoracic organs M 2,204 - - - - - - - 1 3 14 40 68 115 221 355 388 376 337
F 1,992 - - - - - - - 1 4 10 20 55 113 168 290 322 381 307C30 Malignant neoplasm of nasal cavity and middle ear M 2 - - - - - - - - - - - - 1 - - 1 - -
F 2 - - - - - - - - - - - - - - - - 1 -C31 Malignant neoplasm of accessory sinuses M 10 - - - - - - - - - - - - 1 - 4 2 3 -
F 6 - - - - - - - - - - - 1 1 1 1 - - 1C32 Malignant neoplasm of larynx M 91 - - - - - - - - - - 3 3 6 5 18 21 11 15
F 20 - - - - - - - - 1 1 1 - 1 5 2 1 5 1C33 Malignant neoplasm of trachea M 2 - - - - - - - 1 - - - - - - - - 1 -
F 1 - - - - - - - - - - - - - 1 - - - -C34 Malignant neoplasm of bronchus and lung M 2,079 - - - - - - - - 3 14 37 65 106 212 331 361 357 322
F 1,953 - - - - - - - 1 3 9 17 54 111 158 286 320 373 305C37 Malignant neoplasm of thymus M 5 - - - - - - - - - - - - - 2 - 2 - -
F 4 - - - - - - - - - - 1 - - 2 - - - -C38 Malignant neoplasm of heart, mediastinum and pleura M 13 - - - - - - - - - - - - 1 2 1 1 4 -
F 6 - - - - - - - - - - 1 - - 1 1 1 2 -C39 M 2 - - - - - - - - - - - - - - 1 - - -
F - - - - - - - - - - - - - - - - - - -C40-41 Bone and articular cartilage M 26 - - - - 3 2 3 - - - 1 3 1 - 1 3 3 4
F 11 - - - 1 2 - - - - 1 - 1 1 - 1 2 - -C40 Malignant neoplasm of bone and articular cartilage of limbs M 2 - - - - 1 - 1 - - - - - - - - - - -
F 3 - - - - - - - - - - - - 1 - - 2 - -C41 M 24 - - - - 2 2 2 - - - 1 3 1 - 1 3 3 4
F 8 - - - 1 2 - - - - 1 - 1 - - 1 - - -C43-44 Skin M 161 - - 1 - - - 1 1 - 5 5 7 10 13 17 21 20 25
F 88 - - - - - - - - 1 2 2 5 4 6 10 9 10 12C43 Malignant melanoma of skin M 102 - - - - - - 1 1 - 5 5 6 9 6 13 15 14 11
F 60 - - - - - - - - 1 2 2 4 4 4 8 5 7 7C44 Other malignant neoplasms of skin M 59 - - 1 - - - - - - - - 1 1 7 4 6 6 14
F 28 - - - - - - - - - - - 1 - 2 2 4 3 5C45-49 Mesothelial and soft tissue M 171 - - - - - - 3 1 1 - 2 5 9 5 33 35 25 24
F 92 - - - - 1 1 - - 1 1 1 - 6 1 12 19 11 20C45 Mesothelioma M 120 - - - - - - - - 1 - - - 3 4 24 29 20 16
F 24 - - - - - - - - - - - - 2 - 2 6 4 7C47 M - - - - - - - - - - - - - - - - - - -
F 1 - - - - - - - - - - - - - - - - - -C48 Malignant neoplasm of retroperitoneum and peritoneum M 11 - - - - - - - 1 - - - - 2 1 2 1 2 -
F 35 - - - - - - - - - - 1 - 1 - 7 9 2 8C49 Malignant neoplasm of other connective and soft tissue M 40 - - - - - - 3 - - - 2 5 4 - 7 5 3 8
F 32 - - - - 1 1 - - 1 1 - - 3 1 3 4 5 5C50-50 Malignant neoplasm of breast M 9 - - - - - - - - - 1 2 - 1 - 1 - 2 -
F 1,020 - - - - - - 4 4 20 35 49 75 75 67 99 96 138 105C50 Malignant neoplasm of breast M 9 - - - - - - - - - 1 2 - 1 - 1 - 2 -
Sequelae of other and unspecified infectious and parasitic diseases
Malignant neoplasm of other and ill-defined sites in the lip, oral cavity and pharynx
Malignant neoplasm of other and ill-defined sites in the respiratory system and intrathoracic organs
Malignant neoplasm of bone and articular cartilage of other and unspecified sites
Malignant neoplasm of peripheral nerves and autonomic nervous system
Page 122
ICD Codes Cause of death All ages Age group0 1-4 5-9 10-14 15-19 20-24 25-29 30-34 35-39 40-44 45-49 50-54 55-59 60-64 65-69 70-74 75-79 80-84
C50 Malignant neoplasm of breastF 1,020 - - - - - - 4 4 20 35 49 75 75 67 99 96 138 105
C51-58 Female genital organs F 754 - - - - - 1 4 5 9 16 11 49 60 58 99 107 119 93C51 Malignant neoplasm of vulva F 35 - - - - - - - - - - - - 3 2 6 6 3 5C52 Malignant neoplasm of vagina F 13 - - - - - - - - - - 1 1 - - 1 4 1 3C53 Malignant neoplasm of cervix uteri F 106 - - - - - 1 3 2 8 9 9 8 11 8 9 7 13 3C54 Malignant neoplasm of corpus uteri F 183 - - - - - - - - - 2 - 4 12 14 23 30 36 30C55 Malignant neoplasm of uterus, part unspecified F 47 - - - - - - - - - - - 4 1 3 11 6 6 6C56 Malignant neoplasm of ovary F 349 - - - - - - 1 2 1 5 1 31 31 30 47 51 57 41C57 F 19 - - - - - - - - - - - - 2 1 2 3 3 5
C58 Malignant neoplasm of placenta F 2 - - - - - - - 1 - - - 1 - - - - - -C60-63 Male genital organs M 915 - - - - - - 1 2 3 - 4 2 25 46 89 113 156 199
C60 Malignant neoplasm of penis M 14 - - - - - - - - 2 - - - 1 2 4 - 2 1C61 Malignant neoplasm of prostate M 894 - - - - - - - - - - 3 1 24 43 85 113 154 198C62 Malignant neoplasm of testis M 7 - - - - - - 1 2 1 - 1 1 - 1 - - - -
C64-68 Urinary tract M 650 - - - - - - - - 1 7 6 16 31 49 76 88 125 111F 376 - - - - - - - - - 1 7 11 19 21 34 40 69 77
C64 Malignant neoplasm of kidney, except renal pelvis M 252 - - - - - - - - 1 5 3 8 24 25 33 30 49 39F 155 - - - - - - - - - - 4 5 9 11 21 25 22 31
C65 Malignant neoplasm of renal pelvis M 3 - - - - - - - - - - - 1 - - 1 - - 1F - - - - - - - - - - - - - - - - - - -
C66 Malignant neoplasm of ureter M 29 - - - - - - - - - - - 1 1 1 2 4 5 7F 15 - - - - - - - - - - - 1 1 - - 3 2 5
C67 Malignant neoplasm of bladder M 336 - - - - - - - - - 2 2 6 5 20 36 52 64 59F 184 - - - - - - - - - 1 3 3 7 8 13 11 38 39
C68 Malignant neoplasm of other and unspecified urinary organs M 30 - - - - - - - - - - 1 - 1 3 4 2 7 5F 22 - - - - - - - - - - - 2 2 2 - 1 7 2
C69-72 Eye, brain and other parts of the central nervous system M 241 - - 4 1 - 1 1 6 6 12 19 18 25 34 38 24 21 20F 160 - - 1 2 - - 3 4 3 5 6 10 12 20 31 20 19 17
C69 Malignant neoplasm of eye and adnexa M 8 - - - - - - - - - 1 - - 2 1 1 - 2 -F 4 - - - - - - - - - - - - 1 1 1 - 1 -
C70 Malignant neoplasm of meninges M 2 - - - - - - - - - - - 1 - - - - - 1F 5 - - - 1 - - - - - - - - - - 3 - - -
C71 Malignant neoplasm of brain M 229 - - 4 1 - 1 1 5 6 11 18 17 23 33 37 24 19 19F 150 - - 1 1 - - 3 4 3 5 6 10 11 19 27 20 17 17
C72 M 2 - - - - - - - 1 - - 1 - - - - - - -F 1 - - - - - - - - - - - - - - - - 1 -
C73-75 Thyroid and other endocrine glands M 22 - 1 - - - - 1 - - - 2 1 - 1 3 6 1 2F 29 - - - - - - - 1 - - 1 - 1 3 1 4 5 8
C73 Malignant neoplasm of thyroid gland M 18 - - - - - - - - - - 2 1 - 1 3 5 - 2F 22 - - - - - - - - - - - - 1 2 1 3 3 7
C74 Malignant neoplasm of adrenal gland M 2 - 1 - - - - 1 - - - - - - - - - - -F 4 - - - - - - - 1 - - 1 - - - - 1 1 -
C75 M 2 - - - - - - - - - - - - - - - 1 1 -F 3 - - - - - - - - - - - - - 1 - - 1 1
C76-80 M 381 - - - - - - - 2 2 2 7 17 16 30 47 41 51 81F 447 - 1 - - - - - - 1 1 8 10 13 25 35 43 87 84
C76 Malignant neoplasm of other and ill-defined sites M 19 - - - - - - - - - - - 3 1 2 - 2 2 2F 41 - - - - - - - - - - - - 1 1 1 2 3 8
C78 Secondary malignant neoplasm of respiratory and digestive organs M 1 - - - - - - - - - - - - - 1 - - - -F 6 - - - - - - - - - - - - - - - - 2 1
C79 Secondary malignant neoplasm of other and unspecified sites M 1 - - - - - - - - - - - 1 - - - - - -F 1 - - - - - - - - - - - - - - 1 - - -
C80 Malignant neoplasm, without specification of site M 360 - - - - - - - 2 2 2 7 13 15 27 47 39 49 79F 399 - 1 - - - - - - 1 1 8 10 12 24 33 41 82 75
C81-96 M 603 - 1 1 - 1 2 1 3 2 4 8 11 21 40 77 95 110 111F 483 - - - - - 4 1 2 3 2 5 6 21 33 39 74 72 90
C81 Hodgkin lymphoma M 12 - - - - - - - - - 1 - 1 1 - - 4 2 2F 10 - - - - - - - 1 - - 1 1 - 2 - 1 1 2
C82 Follicular lymphoma M 19 - - - - - - - - - - 1 1 - 3 2 1 4 2F 22 - - - - - - - - - - - - 2 - - 10 5 3
C83 Non-follicular lymphoma M 86 - - - - - 1 - - - 1 2 1 2 8 11 12 17 13F 54 - - - - - - - - - - - 1 3 3 10 9 11 4
C84 Mature T/NK-cell lymphomas M 22 - - - - - 1 - 1 - 1 - 1 3 3 2 3 4 3F 15 - - - - - - - - - - - - - 1 2 2 7 1
C85 Other and unspecified types of non-Hodgkin's lymphoma M 101 - - - - - - - - - - - 1 5 3 10 9 20 23F 97 - - - - - 2 1 1 - - 2 1 3 7 7 9 12 22
C88 Malignant immunoproliferative diseases M 7 - - - - - - - - - - - - - - - 1 1 1F 4 - - - - - - - - - - - - - - 1 1 - 1
C90 Multiple myeloma and malignant plasma cell neoplasms M 122 - - - - - - - - - 1 3 2 5 11 21 15 15 25F 109 - - - - - - - - - 1 - 1 5 8 8 18 14 22
C91 Lymphoid leukaemia M 65 - 1 1 - 1 - 1 2 - - 2 - 3 2 8 12 10 13F 36 - - - - - - - - 1 - 2 - 1 1 5 6 1 7
C92 Myeloid leukaemia M 154 - - - - - - - - 1 - - 4 2 9 22 34 36 25F 120 - - - - - 1 - - 2 1 - 2 7 10 6 16 20 24
C93 Monocytic leukaemia M 5 - - - - - - - - - - - - - 1 - 2 - 2F 6 - - - - - - - - - - - - - 1 - 1 1 1
C95 Leukaemia of unspecified cell type M 9 - - - - - - - - 1 - - - - - 1 2 1 2F 9 - - - - - 1 - - - - - - - - - - - 3
C96 M 1 - - - - - - - - - - - - - - - - - -F 1 - - - - - - - - - - - - - - - 1 - -
C97-C97 Malignant neoplasms of independent (primary) multiple sites M 53 - - - - - - - - - - 1 1 1 5 8 6 9 9F 47 - - - - - - - 1 - 1 - 3 3 2 5 10 7 5
C97 Malignant neoplasms of independent (primary) multiple sites M 53 - - - - - - - - - - 1 1 1 5 8 6 9 9F 47 - - - - - - - 1 - 1 - 3 3 2 5 10 7 5
D00-09 In situ neoplasms M 1 - - - - - - - - - - - - - - - - - -F - - - - - - - - - - - - - - - - - - -
D00 Carcinoma in situ of oral cavity, oesophagus and stomach M 1 - - - - - - - - - - - - - - - - - -F - - - - - - - - - - - - - - - - - - -
D10-36 Benign neoplasms M 26 - - - - - - - - - - 2 1 - 2 2 4 5 3F 31 - - - - - - - - - - 1 1 1 1 2 3 7 7
D13 Benign neoplasm of other and ill-defined parts of digestive system M 2 - - - - - - - - - - - - - - - - 1 -F - - - - - - - - - - - - - - - - - - -
D15 Benign neoplasm of other and unspecified intrathoracic organs M 4 - - - - - - - - - - - - - - - 1 1 -F 2 - - - - - - - - - - 1 1 - - - - - -
D17 Benign lipomatous neoplasm M 2 - - - - - - - - - - - - - - - 1 1 -F - - - - - - - - - - - - - - - - - - -
D18 Haemangioma and lymphangioma, any site M 1 - - - - - - - - - - 1 - - - - - - -F 1 - - - - - - - - - - - - - - - - - -
D27 Benign neoplasm of ovary F 1 - - - - - - - - - - - - - - 1 - - -D30 Benign neoplasm of urinary organs M 1 - - - - - - - - - - - - - - - - - 1
F - - - - - - - - - - - - - - - - - - -D32 Benign neoplasm of meninges M 13 - - - - - - - - - - - 1 - 1 2 2 1 2
F 23 - - - - - - - - - - - - 1 1 1 3 4 7D33 M - - - - - - - - - - - - - - - - - - -
F 1 - - - - - - - - - - - - - - - - - -D35 Benign neoplasm of other and unspecified endocrine glands M 1 - - - - - - - - - - 1 - - - - - - -
F 3 - - - - - - - - - - - - - - - - 3 -D36 Benign neoplasm of other and unspecified sites M 2 - - - - - - - - - - - - - 1 - - 1 -
F - - - - - - - - - - - - - - - - - - -D37-48 Neoplasms of uncertain or unknown behaviour M 137 - 1 - - - 1 - - 1 - 1 2 6 6 10 16 18 30
Malignant neoplasm of other and unspecified female genital organs
Malignant neoplasm of spinal cord, cranial nerves and other parts of central nervous system
Malignant neoplasm of other endocrine glands and related structuresMalignant neoplasms of ill-defined, secondary and unspecified sites
Malignant neoplasms, stated or presumed to be primary, of lymphoid, haematopoietic and related tissue
Other and unspecified malignant neoplasms of lymphoid, haematopoietic and related tissue
Benign neoplasm of brain and other parts of central nervous system
Page 123
ICD Codes Cause of death All ages Age group0 1-4 5-9 10-14 15-19 20-24 25-29 30-34 35-39 40-44 45-49 50-54 55-59 60-64 65-69 70-74 75-79 80-84
D37-48 Neoplasms of uncertain or unknown behaviourF 149 1 - - - - - - 1 - 3 - 2 4 1 4 17 14 26
D37 M 10 - - - - - - - - - - - - 1 2 2 - - 1F 7 - - - - - - - - - - - - - - - 1 - 1
D38 M 8 - - - - - - - - - - - - - - 1 - 1 1F 3 - - - - - - - - - - - - - - - - 1 1
D39 F 2 - - - - - - - - - - - - - - - - 1 -
D41 Neoplasm of uncertain or unknown behaviour of urinary organs M 3 - - - - - - - - - - - - - - - 1 - 1F 7 1 - - - - - - - - - - - - - - - - -
D42 Neoplasm of uncertain or unknown behaviour of meninges M - - - - - - - - - - - - - - - - - - -F 3 - - - - - - - - - - - - - - - - - -
D43 M 10 - - - - - 1 - - - - 1 1 - - 2 2 2 1F 18 - - - - - - - 1 - - - 2 2 - 1 2 2 6
D44 Neoplasm of uncertain or unknown behaviour of endocrine glands M 1 - - - - - - - - 1 - - - - - - - - -F 4 - - - - - - - - - 1 - - - - - - 2 -
D45 Polycythaemia vera M 6 - - - - - - - - - - - - - - - 3 - 1F 3 - - - - - - - - - - - - - - - - - -
D46 Myelodysplastic syndromes M 69 - - - - - - - - - - - - 3 2 1 5 9 23F 63 - - - - - - - - - 2 - - - 1 - 9 4 13
D47 M 26 - - - - - - - - - - - 1 2 2 4 4 4 2F 33 - - - - - - - - - - - - 2 - 3 4 3 4
D48 M 4 - 1 - - - - - - - - - - - - - 1 2 -F 6 - - - - - - - - - - - - - - - 1 1 1
D50-D89 M 55 - - - - - - 1 1 - - - 6 4 6 6 3 8 10F 59 - - - 1 - - - - - 1 1 1 3 1 5 5 5 11
D50-53 Nutritional anaemias M 4 - - - - - - - - - - - - - 1 - - - 1F 9 - - - - - - - - - - - - - - - 1 1 2
D50 Iron deficiency anaemia M 4 - - - - - - - - - - - - - 1 - - - 1F 7 - - - - - - - - - - - - - - - 1 - 1
D51 M - - - - - - - - - - - - - - - - - - -F 2 - - - - - - - - - - - - - - - - 1 1
D55-59 Haemolytic anaemias M 7 - - - - - - - - - - - 1 - 2 1 - - 1F 4 - - - - - - - - - - - - - - - 1 1 1
D58 Other hereditary haemolytic anaemias M 1 - - - - - - - - - - - - - - 1 - - -F - - - - - - - - - - - - - - - - - - -
D59 Acquired haemolytic anaemia M 6 - - - - - - - - - - - 1 - 2 - - - 1F 4 - - - - - - - - - - - - - - - 1 1 1
D60-64 Aplastic and other anaemias M 9 - - - - - - - - - - - 1 - - 2 - 1 2F 18 - - - - - - - - - - - - - - 2 2 1 3
D60 Acquired pure red cell aplasia [erythroblastopenia] M 2 - - - - - - - - - - - - - - 1 - 1 -F - - - - - - - - - - - - - - - - - - -
D61 Other aplastic anaemias M 4 - - - - - - - - - - - 1 - - 1 - - 1F 3 - - - - - - - - - - - - - - 1 1 1 -
D64 Other anaemias M 3 - - - - - - - - - - - - - - - - - 1F 15 - - - - - - - - - - - - - - 1 1 - 3
D65-69 M 10 - - - - - - - - - - - 1 1 1 - 2 3 1F 10 - - - - - - - - - 1 1 - - - - - 1 2
D65 Disseminated intravascular coagulation [defibrination syndrome] M 2 - - - - - - - - - - - - - - - 1 1 -F 3 - - - - - - - - - - - - - - - - - -
D67 Hereditary factor IX deficiency M 1 - - - - - - - - - - - - - 1 - - - -F - - - - - - - - - - - - - - - - - - -
D68 Other coagulation defects M 4 - - - - - - - - - - - - 1 - - - 1 1F 5 - - - - - - - - - 1 1 - - - - - 1 2
D69 Purpura and other haemorrhagic conditions M 3 - - - - - - - - - - - 1 - - - 1 1 -F 2 - - - - - - - - - - - - - - - - - -
D70-77 Other diseases of blood and blood-forming organs M 5 - - - - - - - - - - - 1 - 2 - - - 1F 8 - - - 1 - - - - - - - 1 1 - 1 - - -
D70 Agranulocytosis M 4 - - - - - - - - - - - 1 - 1 - - - 1F 5 - - - - - - - - - - - - - - 1 - - -
D73 Diseases of spleen M 1 - - - - - - - - - - - - - 1 - - - -F 2 - - - - - - - - - - - 1 1 - - - - -
D76 M - - - - - - - - - - - - - - - - - - -F 1 - - - 1 - - - - - - - - - - - - - -
D80-89 Certain disorders involving the immune mechanism M 20 - - - - - - 1 1 - - - 2 3 - 3 1 4 4F 10 - - - - - - - - - - - - 2 1 2 1 1 3
D80 Immunodeficiency with predominantly antibody defects M 2 - - - - - - - 1 - - - - - - - - - 1F - - - - - - - - - - - - - - - - - - -
D82 Immunodeficiency associated with other major defects M 1 - - - - - - 1 - - - - - - - - - - -F - - - - - - - - - - - - - - - - - - -
D83 Common variable immunodeficiency M 1 - - - - - - - - - - - 1 - - - - - -F - - - - - - - - - - - - - - - - - - -
D84 Other immunodeficiencies M - - - - - - - - - - - - - - - - - - -F 1 - - - - - - - - - - - - 1 - - - - -
D86 Sarcoidosis M 10 - - - - - - - - - - - - 2 - 2 - 4 1F 6 - - - - - - - - - - - - - 1 2 - 1 2
D89 M 6 - - - - - - - - - - - 1 1 - 1 1 - 2F 3 - - - - - - - - - - - - 1 - - 1 - 1
E00-E99 IV. ENDOCRINE, NUTRITIONAL AND METABOLIC DISEASES M 569 - 1 - 1 1 4 5 8 9 20 23 29 38 39 57 74 72 85F 580 1 2 - - 1 1 5 5 6 8 19 19 26 41 39 56 79 110
E00-07 Disorders of thyroid gland M 2 - - - - - - - - - - - - - - - - - 2F 6 - - - - - - - - - 1 - - 1 - - - 1 -
E03 Other hypothyroidism M - - - - - - - - - - - - - - - - - - -F 3 - - - - - - - - - - - - - - - - 1 -
E05 Thyrotoxicosis [hyperthyroidism] M 2 - - - - - - - - - - - - - - - - - 2F 2 - - - - - - - - - 1 - - - - - - - -
E06 Thyroiditis M - - - - - - - - - - - - - - - - - - -F 1 - - - - - - - - - - - - 1 - - - - -
E10-14 Diabetes mellitus M 456 - - - - - 1 4 5 7 15 19 22 32 25 39 64 59 70F 423 - - - - - - 3 1 4 6 10 10 20 23 24 39 62 97
E10 Insulin-dependent diabetes mellitus M 68 - - - - - 1 4 2 4 7 9 10 11 4 4 4 1 5F 47 - - - - - - 2 1 2 3 4 7 6 3 3 3 4 5
E11 Non-insulin-dependent diabetes mellitus M 291 - - - - - - - - - 1 2 7 12 17 29 47 44 58F 301 - - - - - - - - 1 - 3 - 11 13 17 29 49 77
E14 Unspecified diabetes mellitus M 97 - - - - - - - 3 3 7 8 5 9 4 6 13 14 7F 75 - - - - - - 1 - 1 3 3 3 3 7 4 7 9 15
E15-16 M 2 - - - - - - - - - 1 - - - - - - - 1F 1 - - - - - - - - - - - - - - - - - -
E15 Nondiabetic hypoglycaemic coma M 1 - - - - - - - - - - - - - - - - - 1F - - - - - - - - - - - - - - - - - - -
E16 Other disorders of pancreatic internal secretion M 1 - - - - - - - - - 1 - - - - - - - -F 1 - - - - - - - - - - - - - - - - - -
E20-35 Disorders of other endocrine glands M 3 - - - - - - - 1 - - - - - - 1 - 1 -F 10 - - - - - - - - - - - - 1 - - - 1 2
E21 Hyperparathyroidism and other disorders of parathyroid gland M 1 - - - - - - - - - - - - - - 1 - - -F 1 - - - - - - - - - - - - - - - - - 1
E22 Hyperfunction of pituitary gland M - - - - - - - - - - - - - - - - - - -F 4 - - - - - - - - - - - - - - - - - 1
E24 Cushing syndrome M - - - - - - - - - - - - - - - - - - -F 1 - - - - - - - - - - - - - - - - 1 -
E26 Hyperaldosteronism M - - - - - - - - - - - - - - - - - - -
Neoplasm of uncertain or unknown behaviour of oral cavity and digestive organsNeoplasm of uncertain or unknown behaviour of middle ear and respiratory and intrathoracic organsNeoplasm of uncertain or unknown behaviour of female genital organs
Neoplasm of uncertain or unknown behaviour of brain and central nervous system
Other neoplasms of uncertain or unknown behaviour of lymphoid, haematopoietic and related tissueNeoplasm of uncertain or unknown behaviour of other and unspecified sitesDiseases of the blood and blood-forming organs and certain disorders involving the immune mechanism
Vitamin B12 deficiency anaemia
Coagulation defects, purpura and other haemorrhagic conditions
Other specified diseases with participation of lymphoreticular and reticulohistiocytic tissue
Other disorders involving the immune mechanism, not elsewhere classified
Other disorders of glucose regulation and pancreatic internal secretion
Page 124
ICD Codes Cause of death All ages Age group0 1-4 5-9 10-14 15-19 20-24 25-29 30-34 35-39 40-44 45-49 50-54 55-59 60-64 65-69 70-74 75-79 80-84
HyperaldosteronismF 1 - - - - - - - - - - - - - - - - - -
E27 Other disorders of adrenal gland M - - - - - - - - - - - - - - - - - - -F 3 - - - - - - - - - - - - 1 - - - - -
E31 Polyglandular dysfunction M 1 - - - - - - - 1 - - - - - - - - - -F - - - - - - - - - - - - - - - - - - -
E34 Other endocrine disorders M 1 - - - - - - - - - - - - - - - - 1 -F - - - - - - - - - - - - - - - - - - -
E40-46 Malnutrition M 5 - - - - - - - - - - - - - 1 1 - 1 2F 4 - - - - - - - - - - - 1 - - - 1 - 1
E41 Nutritional marasmus M - - - - - - - - - - - - - - - - - - -F 1 - - - - - - - - - - - - - - - - - -
E46 Unspecified protein-energy malnutrition M 5 - - - - - - - - - - - - - 1 1 - 1 2F 3 - - - - - - - - - - - 1 - - - 1 - 1
E50-64 Other nutritional deficiencies M 1 - - - - - - - - - - - - - - - - 1 -F 1 - - - - - - - - - - - - - - - - - -
E51 Thiamine deficiency M 1 - - - - - - - - - - - - - - - - 1 -F - - - - - - - - - - - - - - - - - - -
E61 Deficiency of other nutrient elements M - - - - - - - - - - - - - - - - - - -F 1 - - - - - - - - - - - - - - - - - -
E65-68 Obesity and other hyperalimentation M 33 - - - - - - - - 1 1 2 4 5 7 6 3 4 -F 43 - - - - - - - - 1 - 5 6 1 10 8 5 4 1
E66 Obesity M 33 - - - - - - - - 1 1 2 4 5 7 6 3 4 -F 43 - - - - - - - - 1 - 5 6 1 10 8 5 4 1
E70-90 Metabolic disorders M 67 - 1 - 1 1 3 1 2 1 3 2 3 1 6 10 7 6 10F 92 1 2 - - 1 1 2 4 1 1 4 2 3 8 7 11 11 9
E71 M 1 - - - - - - - - 1 - - - - - - - - -F - - - - - - - - - - - - - - - - - - -
E72 Other disorders of amino-acid metabolism M 1 - - - - - - - - - - 1 - - - - - - -F - - - - - - - - - - - - - - - - - - -
E75 M 1 - - - - - 1 - - - - - - - - - - - -F 5 - 2 - - - 1 - - - - 1 - - - - - 1 -
E76 Disorders of glycosaminoglycan metabolism M 2 - - - 1 1 - - - - - - - - - - - - -F - - - - - - - - - - - - - - - - - - -
E78 Disorders of lipoprotein metabolism and other lipidaemias M 19 - - - - - - - - - 1 - 2 - 3 6 2 1 3F 18 - - - - - - - - - - - - - 2 - 1 5 4
E83 Disorders of mineral metabolism M 1 - - - - - - - - - - - - - - 1 - - -F 3 - - - - - - - - - - - 1 - 1 1 - - -
E84 Cystic fibrosis M 3 - - - - - 1 1 1 - - - - - - - - - -F 12 - - - - 1 - 2 4 1 1 1 - - 1 - 1 - -
E85 Amyloidosis M 14 - - - - - - - - - - - - - 2 2 4 1 3F 14 - - - - - - - - - - 1 - 1 2 1 3 2 2
E86 Volume depletion M 10 - - - - - - - - - - - - 1 - - - 3 2F 17 - - - - - - - - - - - - 1 - 1 1 3 1
E87 Other disorders of fluid, electrolyte and acid-base balance M 13 - - - - - 1 - - - 2 1 1 - 1 1 1 1 2F 15 - - - - - - - - - - - 1 1 1 2 3 - 2
E88 Other metabolic disorders M 2 - 1 - - - - - 1 - - - - - - - - - -F 8 1 - - - - - - - - - 1 - - 1 2 2 - -
F00-F99 V. MENTAL AND BEHAVIOURAL DISORDERS M 1,522 - - - - - 1 5 7 10 33 30 38 34 40 69 79 160 294F 2,546 - - - - - - 3 3 8 6 10 18 19 18 37 66 182 383
F00-09 Organic, including symptomatic, mental disorders M 1,229 - - - - - - - - - - - 2 1 7 25 58 139 282F 2,414 - - - - - - - - - - - 1 3 4 22 57 176 377
F01 Vascular dementia M 674 - - - - - - - - - - - 1 1 2 9 38 78 157F 1,033 - - - - - - - - - - - - 1 2 9 24 77 182
F03 Unspecified dementia M 540 - - - - - - - - - - - 1 - 5 14 20 59 122F 1,361 - - - - - - - - - - - 1 2 2 13 33 99 192
F05 M 15 - - - - - - - - - - - - - - 2 - 2 3F 19 - - - - - - - - - - - - - - - - - 3
F06 M - - - - - - - - - - - - - - - - - - -F 1 - - - - - - - - - - - - - - - - - -
F10-F19 M 281 - - - - - 1 5 7 10 33 30 36 31 32 42 18 21 11F 95 - - - - - - 2 2 5 6 10 16 16 13 12 6 2 3
F10 Mental and behavioural disorders due to use of alcohol M 240 - - - - - - 1 5 4 15 26 31 30 32 42 18 21 11F 81 - - - - - - - - 1 5 8 14 15 13 12 6 2 3
F11 Mental and behavioural disorders due to use of opioids M 4 - - - - - - - - - 2 1 1 - - - - - -F - - - - - - - - - - - - - - - - - - -
F12 Mental and behavioural disorders due to use of cannabinoids M 1 - - - - - - - - 1 - - - - - - - - -F - - - - - - - - - - - - - - - - - - -
F13 M 1 - - - - - - - - - 1 - - - - - - - -F - - - - - - - - - - - - - - - - - - -
F14 Mental and behavioural disorders due to use of cocaine M 1 - - - - - - 1 - - - - - - - - - - -F - - - - - - - - - - - - - - - - - - -
F18 Mental and behavioural disorders due to use of volatile solvents M 1 - - - - - - - - - 1 - - - - - - - -F - - - - - - - - - - - - - - - - - - -
F19 M 33 - - - - - 1 3 2 5 14 3 4 1 - - - - -F 14 - - - - - - 2 2 4 1 2 2 1 - - - - -
F20-29 Schizophrenia, schizotypal and delusional disorders M 4 - - - - - - - - - - - - 1 - 1 2 - -F 8 - - - - - - - - - - - - - - 1 2 - -
F20 Schizophrenia M 3 - - - - - - - - - - - - 1 - 1 1 - -F 4 - - - - - - - - - - - - - - 1 - - -
F22 Persistent delusional disorders M - - - - - - - - - - - - - - - - - - -F 2 - - - - - - - - - - - - - - - 1 - -
F29 Unspecified nonorganic psychosis M 1 - - - - - - - - - - - - - - - 1 - -F 2 - - - - - - - - - - - - - - - 1 - -
F30-39 Mood (affective) disorders M 6 - - - - - - - - - - - - - - 1 1 - 1F 18 - - - - - - - - - - - - - - - 1 3 3
F31 Bipolar affective disorder M 1 - - - - - - - - - - - - - - - - - 1F 3 - - - - - - - - - - - - - - - - 1 -
F32 Depressive episode M 4 - - - - - - - - - - - - - - 1 1 - -F 14 - - - - - - - - - - - - - - - 1 2 3
F33 Recurrent depressive disorder M 1 - - - - - - - - - - - - - - - - - -F 1 - - - - - - - - - - - - - - - - - -
F50-59 M - - - - - - - - - - - - - - - - - - -F 5 - - - - - - 1 1 2 - - - - 1 - - - -
F50 Eating disorders M - - - - - - - - - - - - - - - - - - -F 5 - - - - - - 1 1 2 - - - - 1 - - - -
F60-69 Disorders of adult personality and behaviour M - - - - - - - - - - - - - - - - - - -F 1 - - - - - - - - - - - 1 - - - - - -
F60 Specific personality disorders M - - - - - - - - - - - - - - - - - - -F 1 - - - - - - - - - - - 1 - - - - - -
F80-89 Disorders of psychological development M 2 - - - - - - - - - - - - 1 1 - - - -F 5 - - - - - - - - 1 - - - - - 2 - 1 -
F81 Specific developmental disorders of scholastic skills M 2 - - - - - - - - - - - - 1 1 - - - -F 4 - - - - - - - - - - - - - - 2 - 1 -
F84 Pervasive developmental disorders M - - - - - - - - - - - - - - - - - - -F 1 - - - - - - - - 1 - - - - - - - - -
G00-G99 VI. DISEASES OF THE NERVOUS SYSTEM M 1,374 1 2 3 2 14 6 3 4 9 19 23 25 48 46 100 142 192 292F 2,044 - 2 1 1 2 1 1 1 8 12 25 24 44 76 86 131 233 352
G00-09 Inflammatory diseases of the central nervous system M 16 - - 1 - - - - - - 3 1 - 1 3 2 1 1 3F 18 - - - - - - - - 1 1 1 - - 1 4 - 6 1
G00 Bacterial meningitis, not elsewhere classified M 5 - - 1 - - - - - - 1 - - - 1 1 - - 1F 5 - - - - - - - - - 1 1 - - - 1 - 1 1
Disorders of branched-chain amino-acid metabolism and fatty-acid metabolism
Disorders of sphingolipid metabolism and other lipid storage disorders
Delirium, not induced by alcohol and other psychoactive substancesOther mental disorders due to brain damage and dysfunction and to physical diseaseMental and behavioural disorders due to psychoactive substance use
Mental and behavioural disorders due to use of sedatives or hypnotics
Mental and behavioural disorders due to multiple drug use and use of other psychoactive substances
Behavioural syndromes associated with physiological disturbances and physical factors
Page 125
ICD Codes Cause of death All ages Age group0 1-4 5-9 10-14 15-19 20-24 25-29 30-34 35-39 40-44 45-49 50-54 55-59 60-64 65-69 70-74 75-79 80-84
G03 Meningitis due to other and unspecified causes M 3 - - - - - - - - - - 1 - - - - - - 2F 1 - - - - - - - - - - - - - - 1 - - -
G04 Encephalitis, myelitis and encephalomyelitis M 6 - - - - - - - - - - - - 1 2 1 1 1 -F 10 - - - - - - - - 1 - - - - 1 2 - 4 -
G06 Intracranial and intraspinal abscess and granuloma M 1 - - - - - - - - - 1 - - - - - - - -F 2 - - - - - - - - - - - - - - - - 1 -
G09 Sequelae of inflammatory diseases of central nervous system M 1 - - - - - - - - - 1 - - - - - - - -F - - - - - - - - - - - - - - - - - - -
G10-14 M 135 - - - - - - 1 - 2 3 5 10 15 12 30 21 17 15F 118 - - - - - - - - 1 2 4 3 7 14 22 14 19 19
G10 Huntington's disease M 13 - - - - - - - - - 1 1 - 4 1 2 3 - 1F 13 - - - - - - - - - - - 1 2 3 3 - 1 2
G11 Hereditary ataxia M 7 - - - - - - - - - 1 2 2 - - 1 - 1 -F 4 - - - - - - - - 1 - 1 - - - - - - 1
G12 Spinal muscular atrophy and related syndromes M 115 - - - - - - 1 - 2 1 2 8 11 11 27 18 16 14F 101 - - - - - - - - - 2 3 2 5 11 19 14 18 16
G20-26 Extrapyramidal and movement disorders M 273 - - - - - - - - - - - - 4 6 14 29 41 99F 180 - - - - - - - - - - - 1 1 3 2 16 34 38
G20 Parkinson's disease M 257 - - - - - - - - - - - - 3 6 13 27 39 95F 173 - - - - - - - - - - - 1 1 3 1 16 33 35
G21 Secondary parkinsonism M 14 - - - - - - - - - - - - - - - 2 2 4F 5 - - - - - - - - - - - - - - - - 1 3
G23 Other degenerative diseases of basal ganglia M 2 - - - - - - - - - - - - 1 - 1 - - -F 1 - - - - - - - - - - - - - - 1 - - -
G24 Dystonia M - - - - - - - - - - - - - - - - - - -F 1 - - - - - - - - - - - - - - - - - -
G30-32 Other degenerative diseases of the nervous system M 702 - - - - - - - - - - - - 4 6 34 58 100 163F 1,450 - - - - - - - - - - - 1 8 15 36 70 143 269
G30 Alzheimer's disease M 604 - - - - - - - - - - - - 2 3 22 47 79 144F 1,359 - - - - - - - - - - - 1 6 12 24 58 131 253
G31 M 98 - - - - - - - - - - - - 2 3 12 11 21 19F 91 - - - - - - - - - - - - 2 3 12 12 12 16
G35-37 Demyelinating diseases of the central nervous system M 60 - - - - - - - - - 2 8 6 10 5 4 14 8 3F 112 - - - - - - - 1 - 3 8 13 11 24 8 17 15 8
G35 Multiple sclerosis M 59 - - - - - - - - - 2 7 6 10 5 4 14 8 3F 112 - - - - - - - 1 - 3 8 13 11 24 8 17 15 8
G37 Other demyelinating diseases of central nervous system M 1 - - - - - - - - - - 1 - - - - - - -F - - - - - - - - - - - - - - - - - - -
G40-47 Episodic and paroxysmal disorders M 74 - - - - 7 2 1 3 3 8 3 6 5 8 7 5 7 3F 76 - 2 1 - - - - - 4 2 6 3 7 9 7 7 4 5
G40 Epilepsy M 59 - - - - 7 2 1 2 3 8 3 4 4 7 4 4 5 2F 61 - 2 1 - - - - - 4 2 5 3 7 9 6 5 3 3
G41 Status epilepticus M 2 - - - - - - - - - - - 1 - - - - - 1F 4 - - - - - - - - - - 1 - - - - 1 - 1
G45 Transient cerebral ischaemic attacks and related syndromes M 4 - - - - - - - - - - - - 1 - - - - -F 8 - - - - - - - - - - - - - - - 1 - 1
G47 Sleep disorders M 9 - - - - - - - 1 - - - 1 - 1 3 1 2 -F 3 - - - - - - - - - - - - - - 1 - 1 -
G50-59 Nerve, nerve root and plexus disorders M 1 - - - - - - - - - - - - - - - - - -F - - - - - - - - - - - - - - - - - - -
G51 Facial nerve disorders M 1 - - - - - - - - - - - - - - - - - -F - - - - - - - - - - - - - - - - - - -
G60-64 M 14 - - - - - - - - - - - - 1 - 1 2 5 1F 8 - - - - - - - - - - 1 1 - - 2 1 2 -
G60 Hereditary and idiopathic neuropathy M 2 - - - - - - - - - - - - - - - - 1 1F - - - - - - - - - - - - - - - - - - -
G61 Inflammatory polyneuropathy M 5 - - - - - - - - - - - - 1 - - - 2 -F 5 - - - - - - - - - - 1 1 - - - 1 2 -
G62 Other polyneuropathies M 7 - - - - - - - - - - - - - - 1 2 2 -F 3 - - - - - - - - - - - - - - 2 - - -
G70-73 Diseases of myoneural junction and muscle M 32 1 1 2 - 2 4 1 - 2 - 3 1 1 4 - 3 2 1F 27 - - - 1 - - - - - 2 4 1 4 3 2 1 2 3
G70 Myasthenia gravis and other myoneural disorders M 6 - - - - - - - - - - - - - 1 - 2 - -F 6 - - - - - - - - - - - - - - - - 2 -
G71 Primary disorders of muscles M 24 1 1 2 - 1 4 1 - 2 - 3 1 1 3 - 1 1 1F 19 - - - 1 - - - - - 2 4 1 3 3 2 1 - 2
G72 Other myopathies M 2 - - - - 1 - - - - - - - - - - - 1 -F 2 - - - - - - - - - - - - 1 - - - - 1
G80-83 Cerebral palsy and other paralytic syndromes M 28 - - - 2 5 - - 1 1 2 2 2 3 2 1 3 2 1F 22 - - - - 2 - 1 - 1 1 - - 4 1 - 1 4 1
G80 Cerebral palsy M 23 - - - 2 5 - - 1 1 2 2 1 3 1 1 2 1 -F 12 - - - - 1 - 1 - 1 - - - 3 1 - 1 3 1
G81 Hemiplegia M - - - - - - - - - - - - - - - - - - -F 1 - - - - - - - - - - - - - - - - - -
G82 Paraplegia and tetraplegia M 5 - - - - - - - - - - - 1 - 1 - 1 1 1F 6 - - - - 1 - - - - - - - - - - - 1 -
G83 Other paralytic syndromes M - - - - - - - - - - - - - - - - - - -F 3 - - - - - - - - - 1 - - 1 - - - - -
G90-99 Other disorders of the nervous system M 39 - 1 - - - - - - 1 1 1 - 4 - 7 6 9 3F 33 - - - - - 1 - - 1 1 1 1 2 6 3 4 4 8
G90 Disorders of autonomic nervous system M 10 - - - - - - - - - - - - 1 - 3 2 1 1F 11 - - - - - - - - - - - - - 2 1 2 2 4
G91 Hydrocephalus M - - - - - - - - - - - - - - - - - - -F 2 - - - - - - - - - - - - - - 1 - - -
G93 Other disorders of brain M 14 - - - - - - - - 1 1 1 - 1 - 4 1 4 -F 13 - - - - - 1 - - - 1 1 1 2 3 1 1 1 1
G95 Other diseases of spinal cord M 12 - - - - - - - - - - - - 2 - - 2 3 2F 4 - - - - - - - - - - - - - 1 - - - 3
G98 Other disorders of nervous system, not elsewhere classified M 3 - 1 - - - - - - - - - - - - - 1 1 -F 3 - - - - - - - - 1 - - - - - - 1 1 -
H00-H59 VII. DISEASES OF THE EYE AND ADNEXA M 1 - - - - - - - - - - - - - - - - - 1F 1 - - - - - - - - - - - - - - - - - -
H00-06 Disorders of eyelid, lacrimal system and orbit M 1 - - - - - - - - - - - - - - - - - 1F - - - - - - - - - - - - - - - - - - -
H05 Disorders of orbit M 1 - - - - - - - - - - - - - - - - - 1F - - - - - - - - - - - - - - - - - - -
H30-36 Disorders of choroid and retina M - - - - - - - - - - - - - - - - - - -F 1 - - - - - - - - - - - - - - - - - -
H35 Other retinal disorders M - - - - - - - - - - - - - - - - - - -F 1 - - - - - - - - - - - - - - - - - -
H60-H95 VIII. DISEASES OF THE EAR AND MASTOID PROCESS M 3 - - - - - - - - 1 - - - - - - - 1 1F 3 - - - - - - - - - - - - 1 - - - - 1
H60-62 Diseases of external ear M 1 - - - - - - - - - - - - - - - - - 1F - - - - - - - - - - - - - - - - - - -
H60 Otitis externa M 1 - - - - - - - - - - - - - - - - - 1F - - - - - - - - - - - - - - - - - - -
H65-75 Diseases of middle ear and mastoid M 2 - - - - - - - - 1 - - - - - - - 1 -F 3 - - - - - - - - - - - - 1 - - - - 1
H70 Mastoiditis and related conditions M 2 - - - - - - - - 1 - - - - - - - 1 -F 2 - - - - - - - - - - - - 1 - - - - 1
H71 Cholesteatoma of middle ear M - - - - - - - - - - - - - - - - - - -
Systemic atrophies primarily affecting the central nervous system
Other degenerative diseases of nervous system, not elsewhere classified
Polyneuropathies and other disorders of the peripheral nervous system
Page 126
ICD Codes Cause of death All ages Age group0 1-4 5-9 10-14 15-19 20-24 25-29 30-34 35-39 40-44 45-49 50-54 55-59 60-64 65-69 70-74 75-79 80-84
Cholesteatoma of middle earF 1 - - - - - - - - - - - - - - - - - -
I00-I99 IX. DISEASES OF THE CIRCULATORY SYSTEM M 7,645 1 - 1 1 1 3 14 15 32 79 153 270 401 469 742 898 1,121 1,346F 7,486 1 - 1 - 1 3 4 15 23 40 59 94 148 226 382 567 901 1,376
I00-02 Acute rheumatic fever M 1 - - - - - - - - - - - - - - - - - 1F - - - - - - - - - - - - - - - - - - -
I01 Rheumatic fever with heart involvement M 1 - - - - - - - - - - - - - - - - - 1F - - - - - - - - - - - - - - - - - - -
I05-09 Chronic rheumatic heart diseases M 34 - - - - - - - - - - - - 2 - 2 2 10 8F 89 - - 1 - - - - - - 2 - 2 1 3 4 4 14 20
I05 Rheumatic mitral valve diseases M 11 - - - - - - - - - - - - - - 2 1 2 3F 45 - - 1 - - - - - - 2 - 2 - 2 2 1 6 10
I06 Rheumatic aortic valve diseases M 1 - - - - - - - - - - - - - - - - - -F - - - - - - - - - - - - - - - - - - -
I07 Rheumatic tricuspid valve diseases M 1 - - - - - - - - - - - - - - - - - 1F 7 - - - - - - - - - - - - - - - - 2 -
I08 Multiple valve diseases M 18 - - - - - - - - - - - - 2 - - 1 5 4F 26 - - - - - - - - - - - - 1 1 1 3 5 4
I09 Other rheumatic heart diseases M 3 - - - - - - - - - - - - - - - - 3 -F 11 - - - - - - - - - - - - - - 1 - 1 6
I10-15 Hypertensive diseases M 264 - - - - - - - - 1 3 2 8 11 22 37 39 38 39F 323 - - - - - - - - - 2 1 4 6 10 13 25 37 59
I10 Essential (primary) hypertension M 67 - - - - - - - - 1 - - 1 2 3 6 8 14 14F 126 - - - - - - - - - - - - - 1 4 10 12 15
I11 Hypertensive heart disease M 160 - - - - - - - - - 3 2 6 9 18 27 25 19 19F 157 - - - - - - - - - 1 1 4 5 9 8 10 19 32
I12 Hypertensive renal disease M 30 - - - - - - - - - - - 1 - 1 2 6 4 6F 31 - - - - - - - - - 1 - - 1 - 1 2 6 9
I13 Hypertensive heart and renal disease M 7 - - - - - - - - - - - - - - 2 - 1 -F 9 - - - - - - - - - - - - - - - 3 - 3
I20-25 Ischaemic heart diseases M 3,917 - - - - - - 5 6 14 41 95 177 263 289 446 502 584 644F 2,780 - - - - - - 1 2 9 7 17 37 66 109 197 269 359 475
I20 Angina pectoris M 4 - - - - - - - - - - - - - - - 1 1 2F 8 - - - - - - - - - - 1 - - - 1 - - -
I21 Acute myocardial infarction M 2,088 - - - - - - 1 2 6 13 44 82 114 150 224 289 328 363F 1,541 - - - - - - 1 2 6 5 8 12 34 51 106 167 211 287
I24 Other acute ischaemic heart diseases M 63 - - - - - - - - - - 1 5 6 5 5 7 6 9F 50 - - - - - - - - - - - 3 2 5 - 2 8 7
I25 Chronic ischaemic heart disease M 1,762 - - - - - - 4 4 8 28 50 90 143 134 217 205 249 270F 1,181 - - - - - - - - 3 2 8 22 30 53 90 100 140 181
I26-28 M 107 - - - - - - 1 1 2 4 2 4 7 9 11 14 15 15F 145 - - - - - - 1 1 1 4 6 2 3 9 7 17 18 34
I26 Pulmonary embolism M 77 - - - - - - 1 1 2 4 1 4 5 7 8 10 9 12F 104 - - - - - - 1 1 1 3 5 1 2 8 4 12 12 26
I27 Other pulmonary heart diseases M 27 - - - - - - - - - - - - 1 2 3 3 6 3F 41 - - - - - - - - - 1 1 1 1 1 3 5 6 8
I28 Other diseases of pulmonary vessels M 3 - - - - - - - - - - 1 - 1 - - 1 - -F - - - - - - - - - - - - - - - - - - -
I30-52 Other forms of heart disease M 1,069 1 - - 1 - 3 5 4 8 11 17 33 42 47 87 103 142 188F 1,251 1 - - - - 1 - 3 5 7 12 19 21 22 40 59 132 214
I30 Acute pericarditis M 2 - - - - - - - - - - - - - - 1 - 1 -F 2 - - - - - - - - - 1 - - - - - 1 - -
I31 Other diseases of pericardium M 7 - - - - - - - - - - - 1 - - 1 1 2 -F 1 - - - - - - - - - - - - 1 - - - - -
I33 Acute and subacute endocarditis M 20 - - - - - - 1 - - - 2 2 4 1 4 - - 1F 16 - - - - - 1 - - - - 1 1 1 1 3 3 1 2
I34 Nonrheumatic mitral valve disorders M 30 - - - - - - - - - - - - - 3 1 3 4 6F 38 - - - - - - - - - 1 - 1 - - 2 3 5 9
I35 Nonrheumatic aortic valve disorders M 198 - - - 1 - - - - - 2 2 1 3 2 13 19 28 38F 231 - - - - - - - - - - - 1 1 3 8 14 26 44
I38 Endocarditis, valve unspecified M 31 - - - - - - - - - - 1 5 3 1 3 5 4 5F 44 - - - - - - - - - - - 2 - 1 1 2 6 10
I40 Acute myocarditis M 3 - - - - - - 1 - - - 1 1 - - - - - -F 1 - - - - - - - - - 1 - - - - - - - -
I42 Cardiomyopathy M 84 1 - - - - 1 1 1 2 4 2 6 2 12 16 14 10 7F 38 1 - - - - - - 2 1 - 1 - 5 4 4 4 6 6
I44 Atrioventricular and left bundle-branch block M 8 - - - - - - - - - - - - - - - - 1 1F 10 - - - - - - - - - - - - - - - 1 1 1
I45 Other conduction disorders M 4 - - - - - - - - - - - - - - - - 1 -F 5 - - - - - - - - 1 - 1 - - - - - - 1
I46 Cardiac arrest M 20 - - - - - - - - 3 - 1 1 1 2 2 4 2 2F 14 - - - - - - - - - 1 1 - 1 3 1 - - 5
I47 Paroxysmal tachycardia M 2 - - - - - - - - - - - - - - - - - -F 6 - - - - - - - - - - - - - 1 - 1 2 -
I48 Atrial fibrillation and flutter M 295 - - - - - - - - - - - - 7 4 13 32 48 64F 461 - - - - - - - - - - - 2 1 2 4 13 47 84
I49 Other cardiac arrhythmias M 21 - - - - - - - - 1 - - - 2 1 2 4 5 3F 13 - - - - - - - 1 - - 1 - 3 1 - 1 2 -
I50 Heart failure M 127 - - - - - - - - - - - 3 3 3 8 5 12 21F 197 - - - - - - - - - 1 1 3 2 3 2 7 16 28
I51 Complications and ill-defined descriptions of heart disease M 217 - - - - - 2 2 3 2 5 8 13 17 18 23 16 24 40F 174 - - - - - - - - 3 2 6 9 6 3 15 9 20 24
I60-69 Cerebrovascular diseases M 1,712 - - 1 - - - 3 2 4 10 25 30 56 73 107 173 245 356F 2,430 - - - - 1 1 1 3 4 15 18 23 37 56 96 154 271 468
I60 Subarachnoid haemorrhage M 53 - - - - - - 1 1 - 6 7 3 4 6 2 6 7 3F 103 - - - - - - - 1 - 4 10 10 8 9 11 15 11 13
I61 Intracerebral haemorrhage M 241 - - 1 - - - 2 1 2 3 5 10 13 15 23 37 38 44F 294 - - - - - - 1 1 2 6 4 7 10 14 22 26 50 63
I62 Other nontraumatic intracranial haemorrhage M 121 - - - - - - - - - - 3 1 6 8 9 13 13 23F 121 - - - - - - - - 2 3 1 2 1 5 8 11 11 29
I63 Cerebral infarction M 260 - - - - - - - - 1 1 6 8 13 14 21 33 38 45F 351 - - - - - 1 - 1 - 1 2 - 7 8 18 22 53 62
I64 Stroke, not specified as haemorrhage or infarction M 373 - - - - - - - - - - 2 3 11 11 23 33 43 92F 662 - - - - - - - - - - - - 3 5 15 29 68 136
I67 Other cerebrovascular diseases M 96 - - - - - - - - - - 1 2 2 3 6 6 16 19F 141 - - - - - - - - - 1 - 1 1 4 - 9 10 29
I69 Sequelae of cerebrovascular disease M 568 - - - - - - - - 1 - 1 3 7 16 23 45 90 130F 758 - - - - 1 - - - - - 1 3 7 11 22 42 68 136
I70-79 Diseases of arteries, arterioles and capillaries M 446 - - - - 1 - - - 1 3 5 7 10 18 41 57 79 88F 388 - - - - - - - 2 2 1 2 3 9 7 13 32 61 96
I70 Atherosclerosis M 28 - - - - - - - - - - - - 1 2 5 - 3 7F 19 - - - - - - - - - - - - - - - 1 3 9
I71 Aortic aneurysm and dissection M 269 - - - - - - - - 1 2 5 5 6 9 21 39 53 52F 158 - - - - - - - 1 1 1 - 1 4 3 8 18 31 41
I72 Other aneurysm and dissection M 12 - - - - - - - - - 1 - - - 1 1 3 3 2F 3 - - - - - - - 1 1 - - - - 1 - - - -
I73 Other peripheral vascular diseases M 111 - - - - - - - - - - - 1 2 4 10 8 16 23F 183 - - - - - - - - - - 2 1 3 2 4 11 18 39
I74 Arterial embolism and thrombosis M 7 - - - - - - - - - - - - - - - 3 3 1F 12 - - - - - - - - - - - 1 1 - 1 1 3 5
I77 Other disorders of arteries and arterioles M 19 - - - - 1 - - - - - - 1 1 2 4 4 1 3F 13 - - - - - - - - - - - - 1 1 - 1 6 2
Pulmonary heart disease and diseases of pulmonary circulation
Page 127
ICD Codes Cause of death All ages Age group0 1-4 5-9 10-14 15-19 20-24 25-29 30-34 35-39 40-44 45-49 50-54 55-59 60-64 65-69 70-74 75-79 80-84
I80-89 M 93 - - - - - - - 2 2 7 7 11 10 11 10 8 8 6F 77 - - - - - 1 1 4 2 2 3 4 5 10 12 7 9 8
I80 Phlebitis and thrombophlebitis M 76 - - - - - - - 2 2 6 7 11 10 10 10 6 4 2F 60 - - - - - 1 1 3 2 2 3 4 5 10 11 7 4 4
I81 Portal vein thrombosis M 3 - - - - - - - - - - - - - - - 1 2 -F 2 - - - - - - - - - - - - - - - - 1 1
I82 Other venous embolism and thrombosis M 4 - - - - - - - - - 1 - - - - - 1 - 2F 1 - - - - - - - 1 - - - - - - - - - -
I83 Varicose veins of lower extremities M 6 - - - - - - - - - - - - - - - - 2 1F 11 - - - - - - - - - - - - - - 1 - 2 3
I85 Oesophageal varices M - - - - - - - - - - - - - - - - - - -F 1 - - - - - - - - - - - - - - - - 1 -
I87 Other disorders of veins M - - - - - - - - - - - - - - - - - - -F 1 - - - - - - - - - - - - - - - - - -
I89 Other noninfective disorders of lymphatic vessels and lymph nodes M 4 - - - - - - - - - - - - - 1 - - - 1F 1 - - - - - - - - - - - - - - - - 1 -
I95-99 Other and unspecified disorders of the circulatory system M 2 - - - - - - - - - - - - - - 1 - - 1F 3 - - - - - - - - - - - - - - - - - 2
I95 Hypotension M 2 - - - - - - - - - - - - - - 1 - - 1F 1 - - - - - - - - - - - - - - - - - -
I99 Other and unspecified disorders of circulatory system M - - - - - - - - - - - - - - - - - - -F 2 - - - - - - - - - - - - - - - - - 2
J00-J99 X. DISEASES OF THE RESPIRATORY SYSTEM M 3,373 - 2 1 1 3 1 6 3 3 16 33 67 93 159 302 394 528 648F 3,923 1 1 1 - 1 1 - 3 6 9 27 45 86 163 257 390 547 669
J00-06 Acute upper respiratory infections M 4 - - 1 - - - - - - - - - 1 1 - - - 1F 1 - - - - - - - - - - - - - - - - - -
J04 Acute laryngitis and tracheitis M 2 - - 1 - - - - - - - - - - - - - - 1F - - - - - - - - - - - - - - - - - - -
J06 Acute upper respiratory infections of multiple and unspecified sites m 2 - - - - - - - - - - - - 1 1 - - - -F 1 - - - - - - - - - - - - - - - - - -
J09-18 Influenza and pneumonia M 831 - 2 - - - - 2 1 1 8 12 32 23 30 46 71 91 146F 1,048 1 1 1 - - - - 2 4 5 9 13 19 24 33 38 81 138
J09 Influenza due to certain identified influenza virus M 3 - - - - - - - - - - - - 1 1 - - 1 -F 5 - - - - - - - - - - 2 - 1 - - 1 1 -
J10 Influenza due to other identified influenza virus M 35 - - - - - - - - - 3 - 5 3 3 3 4 5 9F 24 - - - - - - - 1 1 1 1 - 4 1 1 1 1 2
J11 Influenza, virus not identified M 4 - - - - - - - - - - - - - 1 1 - 1 -F 8 - - - - - - - - - - 1 - - 2 - 1 1 -
J12 Viral pneumonia, not elsewhere classified M 2 - 1 - - - - - - - - - 1 - - - - - -F 7 1 - - - - - - - - - - - - - - 1 1 1
J13 Pneumonia due to Streptococcus pneumoniae M 9 - - - - - - - - - - - - 1 1 1 2 - -F 9 - 1 - - - - - - - 1 - 2 1 - 1 - 1 1
J14 Pneumonia due to Haemophilus influenzae M 2 - - - - - - - - - - - - - - - - - 1F 1 - - - - - - - - - - - - - - - 1 - -
J15 Bacterial pneumonia, not elsewhere classified M 11 - 1 - - - - - - - - - 1 1 1 2 2 - 1F 4 - - - - - - - - - - - - - 1 1 - - 2
J18 Pneumonia, organism unspecified M 765 - - - - - - 2 1 1 5 12 25 17 23 39 63 84 135F 990 - - 1 - - - - 1 3 3 5 11 13 20 30 33 76 132
J20-22 Other acute lower respiratory infections M 105 - - - - - - - - - - - 1 - 3 4 5 13 19F 168 - - - - - - - - - - - - 1 - 5 7 12 19
J20 Acute bronchitis M 2 - - - - - - - - - - - - - 1 - - - -F 1 - - - - - - - - - - - - 1 - - - - -
J21 Acute bronchiolitis M - - - - - - - - - - - - - - - - - - -F 1 - - - - - - - - - - - - - - - - 1 -
J22 Unspecified acute lower respiratory infection M 103 - - - - - - - - - - - 1 - 2 4 5 13 19F 166 - - - - - - - - - - - - - - 5 7 11 19
J30-39 Other diseases of upper respiratory tract M 14 - - - - - - 1 - - - - 1 1 1 1 - 1 3F 10 - - - - - - - - - - - 1 - - 1 1 1 1
J32 Chronic sinusitis M 1 - - - - - - 1 - - - - - - - - - - -F - - - - - - - - - - - - - - - - - - -
J38 Diseases of vocal cords and larynx, not elsewhere classified M 4 - - - - - - - - - - - 1 - 1 - - - -F 2 - - - - - - - - - - - - - - - 1 - -
J39 Other diseases of upper respiratory tract M 9 - - - - - - - - - - - - 1 - 1 - 1 3F 8 - - - - - - - - - - - 1 - - 1 - 1 1
J40-47 Chronic lower respiratory diseases M 1,508 - - - 1 2 1 1 2 2 6 14 22 44 91 165 223 282 307F 1,930 - - - - 1 1 - 1 2 2 16 25 51 112 180 279 353 386
J42 Unspecified chronic bronchitis M 2 - - - - - - - 1 - - - - - - - - 1 -F 2 - - - - - - - - - - - - - - - - - 1
J43 Emphysema M 55 - - - - - - - - 1 1 - 3 4 3 5 8 10 9F 36 - - - - - - - - - - - - 2 2 3 4 5 9
J44 Other chronic obstructive pulmonary disease M 1,354 - - - - - - - - - 3 13 16 38 83 153 204 255 280F 1,696 - - - - - - - - - 1 14 18 47 109 169 255 318 333
J45 Asthma M 37 - - - 1 2 1 - 1 1 2 1 1 1 3 4 3 2 4F 84 - - - - 1 1 - - 2 - - 5 2 1 4 8 4 16
J46 Status asthmaticus M 4 - - - - - - 1 - - - - 1 - - 1 1 - -F 8 - - - - - - - - - 1 2 1 - - 1 - 1 2
J47 Bronchiectasis M 56 - - - - - - - - - - - 1 1 2 2 7 14 14F 104 - - - - - - - 1 - - - 1 - - 3 12 25 25
J60-70 Lung diseases due to external agents M 357 - - - - - - - - - - 2 2 11 12 35 30 53 68F 260 - - - - - - - - - - - 1 2 9 7 16 31 37
J60 Coalworker's pneumoconiosis M 1 - - - - - - - - - - - - - - - - 1 -F - - - - - - - - - - - - - - - - - - -
J61 Pneumoconiosis due to asbestos and other mineral fibres M 24 - - - - - - - - - - - - - - 3 1 5 7F - - - - - - - - - - - - - - - - - - -
J67 Hypersensitivity pneumonitis due to organic dust M 6 - - - - - - - - - - - - 1 - 1 2 2 -F 2 - - - - - - - - - - - - - - 1 - - 1
J69 Pneumonitis due to solids and liquids M 325 - - - - - - - - - - 2 2 10 12 31 26 45 61F 258 - - - - - - - - - - - 1 2 9 6 16 31 36
J70 Respiratory conditions due to other external agents M 1 - - - - - - - - - - - - - - - 1 - -F - - - - - - - - - - - - - - - - - - -
J80-84 M 327 - - - - - - - - - 1 5 6 6 16 37 47 58 73F 238 - - - - - - - - - 1 2 5 8 10 18 36 52 52
J80 Adult respiratory distress syndrome M 2 - - - - - - - - - - - - - 1 - 1 - -F 1 - - - - - - - - - - - - - - - - 1 -
J81 Pulmonary oedema M 4 - - - - - - - - - - - - - - - - 1 1F 3 - - - - - - - - - - - - - - - - - 1
J82 Pulmonary eosinophilia, not elsewhere classified M 1 - - - - - - - - - - - - - - 1 - - -F - - - - - - - - - - - - - - - - - - -
J84 Other interstitial pulmonary diseases M 320 - - - - - - - - - 1 5 6 6 15 36 46 57 72F 234 - - - - - - - - - 1 2 5 8 10 18 36 51 51
J85-86 Suppurative and necrotic conditions of lower respiratory tract M 13 - - - - - - - - - - - - 3 2 1 - 4 1F 5 - - - - - - - - - - - - - - 2 1 - 1
J85 Abscess of lung and mediastinum M 2 - - - - - - - - - - - - 1 - 1 - - -F 1 - - - - - - - - - - - - - - - - - 1
J86 Pyothorax M 11 - - - - - - - - - - - - 2 2 - - 4 1F 4 - - - - - - - - - - - - - - 2 1 - -
J90-94 Other diseases of pleura M 15 - - - - - - - - - - - - - - 1 1 1 2F 7 - - - - - - - - - - - - - - - 1 - 1
J90 Pleural effusion, not elsewhere classified M 5 - - - - - - - - - - - - - - - 1 1 1F 4 - - - - - - - - - - - - - - - 1 - -
Diseases of veins, lymphatic vessels and lymph nodes, not elsewhere classified
Other respiratory diseases principally affecting the interstitium
Page 128
ICD Codes Cause of death All ages Age group0 1-4 5-9 10-14 15-19 20-24 25-29 30-34 35-39 40-44 45-49 50-54 55-59 60-64 65-69 70-74 75-79 80-84
J92 Pleural plaque M 3 - - - - - - - - - - - - - - - - - 1F - - - - - - - - - - - - - - - - - - -
J93 Pneumothorax M 5 - - - - - - - - - - - - - - - - - -F 1 - - - - - - - - - - - - - - - - - 1
J94 Other pleural conditions M 2 - - - - - - - - - - - - - - 1 - - -F 2 - - - - - - - - - - - - - - - - - -
J95-99 Other diseases of the respiratory system M 199 - - - - 1 - 2 - - 1 - 3 4 3 12 17 25 28F 256 - - - - - - - - - 1 - - 5 8 11 11 17 34
J96 Respiratory failure, not elsewhere classified M 2 - - - - - - - - - - - - - - - - 1 -F 3 - - - - - - - - - - - - 1 - 1 1 - -
J98 Other respiratory disorders M 197 - - - - 1 - 2 - - 1 - 3 4 3 12 17 24 28F 253 - - - - - - - - - 1 - - 4 8 10 10 17 34
K00-K93 XI. DISEASES OF THE DIGESTIVE SYSTEM M 1,496 - - 1 2 - 1 9 9 19 46 74 121 144 149 171 161 157 188F 1,545 - - - 2 - 1 4 8 11 27 46 76 71 98 129 131 182 263
K00-14 Diseases of oral cavity, salivary glands and jaws M 3 - - - - - - - - - - - - - - 2 - - -F 2 - - - - - - - - - - - - - - - 1 - -
K04 Diseases of pulp and periapical tissues M - - - - - - - - - - - - - - - - - - -F 1 - - - - - - - - - - - - - - - - - -
K11 Diseases of salivary glands M - - - - - - - - - - - - - - - - - - -F 1 - - - - - - - - - - - - - - - 1 - -
K12 Stomatitis and related lesions M 2 - - - - - - - - - - - - - - 2 - - -F - - - - - - - - - - - - - - - - - - -
K13 Other diseases of lip and oral mucosa M 1 - - - - - - - - - - - - - - - - - -F - - - - - - - - - - - - - - - - - - -
K20-31 Diseases of oesophagus, stomach and duodenum M 186 - - - 1 - - 1 1 2 - 6 5 12 19 26 16 30 31F 152 - - - - - - - - 1 - 3 3 3 6 14 10 16 19
K20 Oesophagitis M 10 - - - - - - - - - - - 1 - - 3 - 1 1F 7 - - - - - - - - - - - - - - - - 2 1
K21 Gastro-oesophageal reflux disease M 3 - - - - - - - - - - - - - - - - 1 2F 2 - - - - - - - - - - - - - - - - - -
K22 Other diseases of oesophagus M 37 - - - - - - - - - - 1 - 3 5 6 4 5 8F 21 - - - - - - - - 1 - - 1 - - 2 - 1 -
K25 Gastric ulcer M 14 - - - - - - - 1 - - - - - 3 3 2 1 3F 20 - - - - - - - - - - - - 1 2 5 3 1 -
K26 Duodenal ulcer M 47 - - - - - - - - - - 1 4 6 7 7 5 6 5F 26 - - - - - - - - - - 3 1 - 1 4 1 2 3
K27 Peptic ulcer, site unspecified M 12 - - - - - - - - - - - - 1 - - - 3 2F 9 - - - - - - - - - - - - - - 2 2 1 -
K28 Gastrojejunal ulcer M 1 - - - - - - - - - - - - - - - - - 1F - - - - - - - - - - - - - - - - - - -
K29 Gastritis and duodenitis M 17 - - - - - - 1 - 1 - 3 - 2 2 - 2 3 1F 13 - - - - - - - - - - - 1 1 1 - 1 2 3
K31 Other diseases of stomach and duodenum M 45 - - - 1 - - - - 1 - 1 - - 2 7 3 10 8F 54 - - - - - - - - - - - - 1 2 1 3 7 12
K35-38 Diseases of appendix M 5 - - - - - - - - - - - 1 - - 1 - 1 1F 4 - - - - - - - - - - - - - 1 - - 1 1
K35 Acute appendicitis M 3 - - - - - - - - - - - 1 - - 1 - - -F 3 - - - - - - - - - - - - - 1 - - 1 -
K37 Unspecified appendicitis M 2 - - - - - - - - - - - - - - - - 1 1F 1 - - - - - - - - - - - - - - - - - 1
K40-46 Hernia M 41 - - - 1 - - - - - - 1 2 2 4 2 3 4 6F 57 - - - - - - - - - - 1 1 1 4 2 4 12 14
K40 Inguinal hernia M 13 - - - - - - - - - - 1 - - - 1 1 - 1F 6 - - - - - - - - - - - - - - - 1 2 2
K41 Femoral hernia M - - - - - - - - - - - - - - - - - - -F 9 - - - - - - - - - - - - - - - 1 2 3
K42 Umbilical hernia M 5 - - - - - - - - - - - 1 1 2 1 - - -F 5 - - - - - - - - - - - - - 1 - - 1 2
K43 Ventral hernia M 10 - - - - - - - - - - - - 1 1 - - 4 1F 12 - - - - - - - - - - - - - 2 1 1 4 2
K44 Diaphragmatic hernia M 6 - - - - - - - - - - - 1 - - - - - 3F 12 - - - - - - - - - - - - 1 1 - - 1 3
K45 Other abdominal hernia M 1 - - - - - - - - - - - - - 1 - - - -F 2 - - - - - - - - - - - - - - 1 - - 1
K46 Unspecified abdominal hernia M 6 - - - 1 - - - - - - - - - - - 2 - 1F 11 - - - - - - - - - - 1 1 - - - 1 2 1
K50-52 Noninfective enteritis and colitis M 11 - - - - - - 1 - - - - 1 1 2 1 - 1 3F 42 - - - 1 - 1 - - - 1 - - 2 1 2 4 6 13
K50 Crohn's disease [regional enteritis] M 8 - - - - - - 1 - - - - 1 1 2 - - 1 1F 20 - - - - - - - - - 1 - - 2 - 1 1 3 6
K51 Ulcerative colitis M 1 - - - - - - - - - - - - - - 1 - - -F 13 - - - - - 1 - - - - - - - - 1 3 1 5
K52 Other noninfective gastroenteritis and colitis M 2 - - - - - - - - - - - - - - - - - 2F 9 - - - 1 - - - - - - - - - 1 - - 2 2
K55-63 Other diseases of intestines M 263 - - 1 - - 1 2 1 - - 1 7 8 9 22 39 44 49F 505 - - - 1 - - - - - 1 4 7 9 21 34 53 55 123
K55 Vascular disorders of intestine M 94 - - 1 - - - - - - - 1 4 2 3 6 22 23 15F 188 - - - 1 - - - - - 1 2 5 5 10 15 24 19 48
K56 Paralytic ileus and intestinal obstruction without hernia M 79 - - - - - 1 1 - - - - 2 3 1 6 7 10 21F 99 - - - - - - - - - - - - - 2 5 9 11 25
K57 Diverticular disease of intestine M 32 - - - - - - - - - - - - 2 1 2 4 4 7F 143 - - - - - - - - - - 1 - 1 5 10 8 19 38
K59 Other functional intestinal disorders M 10 - - - - - - - - - - - - 1 - 1 - 3 1F 6 - - - - - - - - - - - - 1 - - 1 - 1
K61 Abscess of anal and rectal regions M 2 - - - - - - - - - - - - - - 1 - - -F 1 - - - - - - - - - - - - - 1 - - - -
K62 Other diseases of anus and rectum M 5 - - - - - - - - - - - - - - - - 1 -F 7 - - - - - - - - - - - - - - - 1 1 -
K63 Other diseases of intestine M 41 - - - - - - 1 1 - - - 1 - 4 6 6 3 5F 61 - - - - - - - - - - 1 2 2 3 4 10 5 11
K65-67 Diseases of peritoneum M 12 - - - - - - - - 1 - 2 - - - 3 1 1 1F 12 - - - - - - - - - - 1 - 1 - 1 1 4 -
K65 Peritonitis M 9 - - - - - - - - 1 - 1 - - - 2 1 1 1F 10 - - - - - - - - - - - - 1 - 1 1 4 -
K66 Other disorders of peritoneum M 3 - - - - - - - - - - 1 - - - 1 - - -F 2 - - - - - - - - - - 1 - - - - - - -
K70-77 Diseases of liver M 674 - - - - - - 5 7 13 39 54 90 113 102 88 72 45 30F 414 - - - - - - 3 8 9 23 33 58 50 50 55 38 44 29
K70 Alcoholic liver disease M 490 - - - - - - 5 7 10 33 47 73 90 79 68 45 22 9F 239 - - - - - - 1 6 9 19 25 43 39 39 30 10 13 5
K71 Toxic liver disease M - - - - - - - - - - - - - - - - - - -F 1 - - - - - - - - - - - - - - - - 1 -
K72 Hepatic failure, not elsewhere classified M 24 - - - - - - - - - - - 2 1 8 1 1 4 2F 12 - - - - - - - 1 - 1 - 2 1 2 1 2 - 1
K73 Chronic hepatitis, not elsewhere classified M - - - - - - - - - - - - - - - - - - -F 2 - - - - - - - - - - - - - - - 1 1 -
K74 Fibrosis and cirrhosis of liver M 84 - - - - - - - - 1 2 5 8 9 8 8 17 10 12F 79 - - - - - - 1 1 - 2 1 7 8 3 13 9 14 11
K75 Other inflammatory liver diseases M 15 - - - - - - - - 1 - - 2 3 1 2 2 3 -F 31 - - - - - - 1 - - - 4 - - 2 1 7 7 6
K76 Other diseases of liver M 61 - - - - - - - - 1 4 2 5 10 6 9 7 6 7
Page 129
ICD Codes Cause of death All ages Age group0 1-4 5-9 10-14 15-19 20-24 25-29 30-34 35-39 40-44 45-49 50-54 55-59 60-64 65-69 70-74 75-79 80-84
K76 Other diseases of liverF 50 - - - - - - - - - 1 3 6 2 4 10 9 8 6
K80-87 Disorders of gallbladder, biliary tract and pancreas M 193 - - - - - - - - 3 6 8 13 8 10 18 21 23 38F 249 - - - - - - - - 1 2 4 5 4 13 20 17 30 48
K80 Cholelithiasis M 31 - - - - - - - - - - 1 - - 1 4 2 6 4F 57 - - - - - - - - - - - - - 4 3 4 10 6
K81 Cholecystitis M 27 - - - - - - - - - 1 - 1 - 1 2 2 4 7F 34 - - - - - - - - - - - 1 - 3 - - 3 10
K82 Other diseases of gallbladder M 7 - - - - - - - - - - - - 1 - 2 - 1 3F 7 - - - - - - - - - - 1 - - - 1 - - 4
K83 Other diseases of biliary tract M 47 - - - - - - - - - - - 3 - 3 2 6 6 15F 85 - - - - - - - - - - - 1 2 1 6 4 10 14
K85 Acute pancreatitis M 60 - - - - - - - - 2 4 5 5 6 5 4 8 5 7F 56 - - - - - - - - 1 1 3 3 1 3 8 8 6 13
K86 Other diseases of pancreas M 21 - - - - - - - - 1 1 2 4 1 - 4 3 1 2F 10 - - - - - - - - - 1 - - 1 2 2 1 1 1
K90-93 Other diseases of the digestive system M 108 - - - - - - - - - 1 2 2 - 3 8 9 8 29F 108 - - - - - - 1 - - - - 2 1 2 1 3 14 16
K90 Intestinal malabsorption M 2 - - - - - - - - - - - - - - - - 2 -F 4 - - - - - - - - - - - - - 1 - - 3 -
K92 Other diseases of digestive system M 106 - - - - - - - - - 1 2 2 - 3 8 9 6 29F 104 - - - - - - 1 - - - - 2 1 1 1 3 11 16
L00-L99 XII. DISEASES OF THE SKIN AND SUBCUTANEOUS TISSUE M 66 - - - - - - - - - 1 1 1 5 1 10 8 6 11F 105 - - - - - - - 1 - 1 2 3 4 7 5 6 15 14
L00-08 Infections of the skin and subcutaneous tissue M 37 - - - - - - - - - 1 1 1 2 1 6 6 4 7F 67 - - - - - - - - - - 1 1 3 5 3 5 10 9
L02 Cutaneous abscess, furuncle and carbuncle M 4 - - - - - - - - - - 1 1 - - 1 - - -F 3 - - - - - - - - - - - - - - - - 1 1
L03 Cellulitis M 28 - - - - - - - - - 1 - - 2 - 5 4 4 7F 58 - - - - - - - - - - 1 1 1 4 3 5 8 8
L04 Acute lymphadenitis M 1 - - - - - - - - - - - - - - - - - -F - - - - - - - - - - - - - - - - - - -
L08 Other local infections of skin and subcutaneous tissue M 4 - - - - - - - - - - - - - 1 - 2 - -F 6 - - - - - - - - - - - - 2 1 - - 1 -
L10-14 Bullous disorders M 1 - - - - - - - - - - - - - - - - - -F 2 - - - - - - - - - - - - - - - - 1 -
L12 Pemphigoid M 1 - - - - - - - - - - - - - - - - - -F 2 - - - - - - - - - - - - - - - - 1 -
L20-30 Dermatitis and eczema M 2 - - - - - - - - - - - - - - - - - 1F 1 - - - - - - - - - - - - - - - - - -
L27 Dermatitis due to substances taken internally M 1 - - - - - - - - - - - - - - - - - -F - - - - - - - - - - - - - - - - - - -
L30 Other dermatitis M 1 - - - - - - - - - - - - - - - - - 1F 1 - - - - - - - - - - - - - - - - - -
L40-45 Papulosquamous disorders M 5 - - - - - - - - - - - - 2 - 1 1 - 1F 2 - - - - - - - - - - - 1 - - 1 - - -
L40 Psoriasis M 5 - - - - - - - - - - - - 2 - 1 1 - 1F 2 - - - - - - - - - - - 1 - - 1 - - -
L50-54 Urticaria and erythema M 1 - - - - - - - - - - - - - - - 1 - -F 4 - - - - - - - - - - 1 - - 1 - 1 - 1
L51 Erythema multiforme M 1 - - - - - - - - - - - - - - - 1 - -F 1 - - - - - - - - - - - - - - - - - 1
L53 Other erythematous conditions M - - - - - - - - - - - - - - - - - - -F 3 - - - - - - - - - - 1 - - 1 - 1 - -
L80-99 Other disorders of the skin and subcutaneous tissue M 20 - - - - - - - - - - - - 1 - 3 - 2 2F 29 - - - - - - - 1 - 1 - 1 1 1 1 - 4 4
L88 Pyoderma gangrenosum M 1 - - - - - - - - - - - - - - - - - 1F 1 - - - - - - - - - - - - - - - - - 1
L89 Decubitus ulcer and pressure area M 4 - - - - - - - - - - - - 1 - - - 1 -F 7 - - - - - - - - - - - 1 1 1 - - 1 -
L92 Granulomatous disorders of skin and subcutaneous tissue M 1 - - - - - - - - - - - - - - 1 - - -F 1 - - - - - - - 1 - - - - - - - - - -
L93 Lupus erythematosus M - - - - - - - - - - - - - - - - - - -F 1 - - - - - - - - - - - - - - - - - -
L97 Ulcer of lower limb, not elsewhere classified M 13 - - - - - - - - - - - - - - 2 - 1 1F 17 - - - - - - - - - 1 - - - - - - 3 3
L98 M 1 - - - - - - - - - - - - - - - - - -F 2 - - - - - - - - - - - - - - 1 - - -
M00-M99 M 147 - - - - - - - - - 1 4 7 4 13 20 17 26 21F 258 - - - - - - - 1 - 2 1 7 11 8 15 20 34 57
M00-25 Arthropathies M 66 - - - - - - - - - - 1 2 - 5 8 11 16 12F 117 - - - - - - - 1 - - - 3 5 5 7 11 15 36
M00-03 Infectious arthropathies M 8 - - - - - - - - - - - - - 1 2 - 4 -F 9 - - - - - - - - - - - - - 1 - 1 - 3
M00 Pyogenic arthritis M 8 - - - - - - - - - - - - - 1 2 - 4 -F 9 - - - - - - - - - - - - - 1 - 1 - 3
M05-14 Inflammatory polyarthropathies M 46 - - - - - - - - - - 1 2 - 2 6 10 9 9F 95 - - - - - - - 1 - - - 2 5 4 7 10 14 30
M05 Seropositive rheumatoid arthritis M 14 - - - - - - - - - - - 1 - 2 2 4 2 3F 22 - - - - - - - - - - - 2 1 1 1 2 4 10
M06 Other rheumatoid arthritis M 27 - - - - - - - - - - 1 1 - - 3 6 5 4F 69 - - - - - - - 1 - - - - 3 2 5 8 10 20
M08 Juvenile arthritis M 1 - - - - - - - - - - - - - - 1 - - -F 1 - - - - - - - - - - - - 1 - - - - -
M10 Gout M 2 - - - - - - - - - - - - - - - - 1 1F 1 - - - - - - - - - - - - - - 1 - - -
M11 Other crystal arthropathies M 1 - - - - - - - - - - - - - - - - - 1F - - - - - - - - - - - - - - - - - - -
M13 Other arthritis M 1 - - - - - - - - - - - - - - - - 1 -F 2 - - - - - - - - - - - - - 1 - - - -
M15-19 Arthrosis M 8 - - - - - - - - - - - - - 1 - 1 1 2F 11 - - - - - - - - - - - 1 - - - - 1 2
M15 Polyarthrosis M 1 - - - - - - - - - - - - - - - - - 1F - - - - - - - - - - - - - - - - - - -
M16 Coxarthrosis [arthrosis of hip] M 1 - - - - - - - - - - - - - - - - - 1F 1 - - - - - - - - - - - 1 - - - - - -
M17 Gonarthrosis [arthrosis of knee] M 2 - - - - - - - - - - - - - - - 1 1 -F 2 - - - - - - - - - - - - - - - - - -
M19 Other arthrosis M 4 - - - - - - - - - - - - - 1 - - - -F 8 - - - - - - - - - - - - - - - - 1 2
M20-25 Other joint disorders M 4 - - - - - - - - - - - - - 1 - - 2 1F 2 - - - - - - - - - - - - - - - - - 1
M24 Other specific joint derangements M - - - - - - - - - - - - - - - - - - -F 2 - - - - - - - - - - - - - - - - - 1
M25 Other joint disorders, not elsewhere classified M 4 - - - - - - - - - - - - - 1 - - 2 1F - - - - - - - - - - - - - - - - - - -
M30-36 Systemic connective tissue disorders M 17 - - - - - - - - - - 1 3 1 1 3 1 4 1F 40 - - - - - - - - - 1 1 4 4 1 3 5 8 5
M30 Polyarteritis nodosa and related conditions M 2 - - - - - - - - - - - - - - - - 2 -F 1 - - - - - - - - - - - - - - - - 1 -
M31 Other necrotizing vasculopathies M 9 - - - - - - - - - - 1 2 - - 2 - 2 -F 7 - - - - - - - - - - - - 1 - 1 1 1 -
Other disorders of skin and subcutaneous tissue, not elsewhere classifiedXIII. DISEASES OF THE MUSCULOSKELETAL SYSTEM AND CONNECTIVE TISSUE
Page 130
ICD Codes Cause of death All ages Age group0 1-4 5-9 10-14 15-19 20-24 25-29 30-34 35-39 40-44 45-49 50-54 55-59 60-64 65-69 70-74 75-79 80-84
M32 Systemic lupus erythematosus M - - - - - - - - - - - - - - - - - - -F 6 - - - - - - - - - - - - - - 1 1 1 1
M33 Dermatopolymyositis M - - - - - - - - - - - - - - - - - - -F 1 - - - - - - - - - - - - - - - - 1 -
M34 Systemic sclerosis M 5 - - - - - - - - - - - 1 1 1 1 1 - -F 18 - - - - - - - - - 1 1 1 2 1 - 3 3 3
M35 Other systemic involvement of connective tissue M 1 - - - - - - - - - - - - - - - - - 1F 7 - - - - - - - - - - - 3 1 - 1 - 1 1
M40-54 Dorsopathies M 16 - - - - - - - - - - 2 - - 4 2 3 2 1F 23 - - - - - - - - - - - - - - 3 1 4 6
M40-43 Deforming dorsopathies M 5 - - - - - - - - - - 1 - - - 1 1 2 -F 16 - - - - - - - - - - - - - - 2 1 2 4
M40 Kyphosis and lordosis M 2 - - - - - - - - - - - - - - - 1 1 -F 3 - - - - - - - - - - - - - - - - - 1
M41 Scoliosis M 3 - - - - - - - - - - 1 - - - 1 - 1 -F 13 - - - - - - - - - - - - - - 2 1 2 3
M45-49 Spondylopathies M 11 - - - - - - - - - - 1 - - 4 1 2 - 1F 5 - - - - - - - - - - - - - - 1 - 2 1
M45 Ankylosing spondylitis M 4 - - - - - - - - - - - - - 2 1 - - 1F 1 - - - - - - - - - - - - - - - - - 1
M46 Other inflammatory spondylopathies M 6 - - - - - - - - - - 1 - - 1 - 2 - -F 2 - - - - - - - - - - - - - - - - 2 -
M47 Spondylosis M 1 - - - - - - - - - - - - - 1 - - - -F 1 - - - - - - - - - - - - - - - - - -
M48 Other spondylopathies M - - - - - - - - - - - - - - - - - - -F 1 - - - - - - - - - - - - - - 1 - - -
M50-54 Other dorsopathies M - - - - - - - - - - - - - - - - - - -F 2 - - - - - - - - - - - - - - - - - 1
M51 Other intervertebral disc disorders M - - - - - - - - - - - - - - - - - - -F 1 - - - - - - - - - - - - - - - - - 1
M54 Dorsalgia M - - - - - - - - - - - - - - - - - - -F 1 - - - - - - - - - - - - - - - - - -
M60-79 Soft tissue disorders M 26 - - - - - - - - - 1 - 2 2 2 6 1 2 4F 13 - - - - - - - - - 1 - - 1 - 1 2 2 1
M60-63 Disorders of muscles M 12 - - - - - - - - - - - 1 2 1 1 - 1 2F 10 - - - - - - - - - - - - - - 1 2 2 1
M60 Myositis M 5 - - - - - - - - - - - 1 1 - 1 - - 1F 5 - - - - - - - - - - - - - - 1 1 2 -
M62 Other disorders of muscle M 7 - - - - - - - - - - - - 1 1 - - 1 1F 5 - - - - - - - - - - - - - - - 1 - 1
M65-68 Disorders of synovium and tendon M 1 - - - - - - - - - - - - - - - - - -F - - - - - - - - - - - - - - - - - - -
M66 Spontaneous rupture of synovium and tendon M 1 - - - - - - - - - - - - - - - - - -F - - - - - - - - - - - - - - - - - - -
M70-79 Other soft tissue disorders M 13 - - - - - - - - - 1 - 1 - 1 5 1 1 2F 3 - - - - - - - - - 1 - - 1 - - - - -
M70 Soft tissue disorders related to use, overuse and pressure M 1 - - - - - - - - - - - - - - 1 - - -F 1 - - - - - - - - - - - - - - - - - -
M72 Fibroblastic disorders M 11 - - - - - - - - - 1 - 1 - 1 4 - 1 2F 2 - - - - - - - - - 1 - - 1 - - - - -
M77 Other enthesopathies M 1 - - - - - - - - - - - - - - - 1 - -F - - - - - - - - - - - - - - - - - - -
M80-94 Osteopathies and chondropathies M 22 - - - - - - - - - - - - 1 1 1 1 2 3F 65 - - - - - - - - - - - - 1 2 1 1 5 9
M80-85 Disorders of bone density and structure M 14 - - - - - - - - - - - - - 1 - - 1 1F 56 - - - - - - - - - - - - 1 1 1 1 3 8
M80 Osteoporosis with pathological fracture M 7 - - - - - - - - - - - - - - - - 1 -F 20 - - - - - - - - - - - - - - 1 - 1 4
M81 Osteoporosis without pathological fracture M 6 - - - - - - - - - - - - - 1 - - - 1F 33 - - - - - - - - - - - - 1 - - 1 2 3
M84 Disorders of continuity of bone M 1 - - - - - - - - - - - - - - - - - -F 2 - - - - - - - - - - - - - 1 - - - -
M85 Other disorders of bone density and structure M - - - - - - - - - - - - - - - - - - -F 1 - - - - - - - - - - - - - - - - - 1
M86-90 Other osteopathies M 8 - - - - - - - - - - - - 1 - 1 1 1 2F 9 - - - - - - - - - - - - - 1 - - 2 1
M86 Osteomyelitis M 7 - - - - - - - - - - - - 1 - 1 1 1 2F 8 - - - - - - - - - - - - - 1 - - 2 1
M88 Paget's disease of bone [osteitis deformans] M 1 - - - - - - - - - - - - - - - - - -F - - - - - - - - - - - - - - - - - - -
M89 Other disorders of bone M - - - - - - - - - - - - - - - - - - -F 1 - - - - - - - - - - - - - - - - - -
N00-N99 XIV. DISEASES OF THE GENITOURINARY SYSTEM M 439 - - - - - - 1 1 1 - 1 12 5 16 22 51 52 78F 652 - - - - 1 - 2 2 1 2 3 2 3 15 19 47 64 136
N00-08 Glomerular diseases M 91 - - - - - - - - - - 1 3 1 1 1 9 7 20F 169 - - - - - - - - - - - - 1 2 1 11 13 29
N00 Acute nephritic syndrome M 1 - - - - - - - - - - - - - - - 1 - -F - - - - - - - - - - - - - - - - - - -
N02 Recurrent and persistent haematuria M 6 - - - - - - - - - - 1 - 1 - - 3 1 -F 2 - - - - - - - - - - - - - - - 1 - -
N03 Chronic nephritic syndrome M 71 - - - - - - - - - - - 1 - 1 1 3 4 15F 162 - - - - - - - - - - - - 1 1 1 9 12 28
N04 Nephrotic syndrome M 7 - - - - - - - - - - - 2 - - - - 1 2F 2 - - - - - - - - - - - - - - - - - 1
N05 Unspecified nephritic syndrome M 6 - - - - - - - - - - - - - - - 2 1 3F 3 - - - - - - - - - - - - - 1 - 1 1 -
N10-16 Renal tubulo-interstitial diseases M 26 - - - - - - - - - - - 3 - 1 3 7 2 2F 19 - - - - - - - 1 1 1 2 - - 1 2 1 4 2
N10 Acute tubulo-interstitial nephritis M 5 - - - - - - - - - - - 2 - - 1 1 - -F 5 - - - - - - - 1 - - 1 - - 1 - 1 - -
N11 Chronic tubulo-interstitial nephritis M 1 - - - - - - - - - - - - - - - - - 1F 5 - - - - - - - - - - - - - - - - 4 -
N12 Tubulo-interstitial nephritis, not specified as acute or chronic M 5 - - - - - - - - - - - - - 1 1 1 1 -F 2 - - - - - - - - - 1 1 - - - - - - -
N13 Obstructive and reflux uropathy M 13 - - - - - - - - - - - - - - 1 5 - 1F 6 - - - - - - - - 1 - - - - - 1 - - 2
N14 M - - - - - - - - - - - - - - - - - - -F 1 - - - - - - - - - - - - - - 1 - - -
N15 Other renal tubulo-interstitial diseases M 2 - - - - - - - - - - - 1 - - - - 1 -F - - - - - - - - - - - - - - - - - - -
N17-19 Renal failure M 111 - - - - - - 1 - 1 - - 2 3 6 6 12 10 20F 153 - - - - 1 - 1 1 - - - 1 2 1 5 17 13 31
N17 Acute renal failure M 40 - - - - - - - - - - - - 1 2 3 4 3 8F 69 - - - - - - - - - - - - - - - 11 6 16
N18 Chronic kidney disease M 57 - - - - - - 1 - - - - 2 2 3 3 6 7 10F 64 - - - - 1 - 1 - - - - 1 1 1 3 4 7 13
N19 Unspecified kidney failure M 14 - - - - - - - - 1 - - - - 1 - 2 - 2F 20 - - - - - - - 1 - - - - 1 - 2 2 - 2
N20-23 Urolithiasis M 6 - - - - - - - - - - - 1 - - 1 3 - -F 5 - - - - - - - - - - - - - 1 - 1 - 2
N20 Calculus of kidney and ureter M 5 - - - - - - - - - - - 1 - - 1 3 - -
Drug- and heavy-metal-induced tubulo-interstitial and tubular conditions
Page 131
ICD Codes Cause of death All ages Age group0 1-4 5-9 10-14 15-19 20-24 25-29 30-34 35-39 40-44 45-49 50-54 55-59 60-64 65-69 70-74 75-79 80-84
N20 Calculus of kidney and ureterF 5 - - - - - - - - - - - - - 1 - 1 - 2
N21 Calculus of lower urinary tract M 1 - - - - - - - - - - - - - - - - - -F - - - - - - - - - - - - - - - - - - -
N25-29 Other disorders of kidney and ureter M 7 - - - - - - - - - - - - - - - 4 2 -F 6 - - - - - - - - - - - - - - 2 - - 3
N25 Disorders resulting from impaired renal tubular function M 2 - - - - - - - - - - - - - - - 1 1 -F - - - - - - - - - - - - - - - - - - -
N26 Unspecified contracted kidney M 2 - - - - - - - - - - - - - - - - 1 -F - - - - - - - - - - - - - - - - - - -
N28 Other disorders of kidney and ureter, not elsewhere classified M 3 - - - - - - - - - - - - - - - 3 - -F 6 - - - - - - - - - - - - - - 2 - - 3
N30-39 Other diseases of urinary system M 177 - - - - - - - 1 - - - 2 - 7 11 14 30 30F 286 - - - - - - 1 - - - 1 1 - 8 9 16 31 66
N30 Cystitis M 3 - - - - - - - - - - - - - - 1 - 1 1F 3 - - - - - - - - - - - - - - - - - -
N32 Other disorders of bladder M 8 - - - - - - - - - - - - - 1 - - 1 2F 6 - - - - - - - - - - - 1 - - - 1 3 -
N39 Other disorders of urinary system M 166 - - - - - - - 1 - - - 2 - 6 10 14 28 27F 277 - - - - - - 1 - - - 1 - - 8 9 15 28 66
N40-51 Diseases of male genital organs M 21 - - - - - - - - - - - 1 1 1 - 2 1 6N40 Hyperplasia of prostate M 15 - - - - - - - - - - - - - - - 1 1 5N41 Inflammatory diseases of prostate M 1 - - - - - - - - - - - - - 1 - - - -N49 M 5 - - - - - - - - - - - 1 1 - - 1 - 1
N70-77 Inflammatory diseases of female pelvic organs F 3 - - - - - - - - - 1 - - - 1 - - - 1N71 Inflammatory disease of uterus, except cervix F 1 - - - - - - - - - - - - - - - - - 1N73 Other female pelvic inflammatory diseases F 2 - - - - - - - - - 1 - - - 1 - - - -
N80-98 Noninflammatory disorders of female genital tract F 11 - - - - - - - - - - - - - 1 - 1 3 2N81 Female genital prolapse F 1 - - - - - - - - - - - - - - - - - 1N82 Fistulae involving female genital tract F 5 - - - - - - - - - - - - - - - 1 1 1N83 F 2 - - - - - - - - - - - - - - - - 1 -
N85 Other noninflammatory disorders of uterus, except cervix F 1 - - - - - - - - - - - - - - - - 1 -N94 F 2 - - - - - - - - - - - - - 1 - - - -
O00-O99 XV. PREGNANCY, CHILDBIRTH AND THE PUERPERIUM F 5 - - - - - 1 1 3 - - - - - - - - - -O10-16 F 1 - - - - - - - 1 - - - - - - - - - -
O16 Unspecified maternal hypertension F 1 - - - - - - - 1 - - - - - - - - - -O20-O29
Other maternal disorders predominantly related to pregnancyF 1 - - - - - 1 - - - - - - - - - - - -
O22 Venous complications in pregnancy F 1 - - - - - 1 - - - - - - - - - - - -O94-99 Other obstetric conditions, not elsewhere classified F 3 - - - - - - 1 2 - - - - - - - - - -
O98 F 1 - - - - - - - 1 - - - - - - - - - -
O99 F 2 - - - - - - 1 1 - - - - - - - - - -
P00-P96 M 48 47 - - - - - - - - - - - 1 - - - - -F 49 47 2 - - - - - - - - - - - - - - - -
P00-04 M 7 7 - - - - - - - - - - - - - - - - -F 9 9 - - - - - - - - - - - - - - - - -
P01 M 6 6 - - - - - - - - - - - - - - - - -F 4 4 - - - - - - - - - - - - - - - - -
P02 M 1 1 - - - - - - - - - - - - - - - - -F 3 3 - - - - - - - - - - - - - - - - -
P03 M - - - - - - - - - - - - - - - - - - -F 2 2 - - - - - - - - - - - - - - - - -
P05-08 Disorders related to length of gestation and fetal growth M 12 12 - - - - - - - - - - - - - - - - -F 5 5 - - - - - - - - - - - - - - - - -
P05 Slow fetal growth and fetal malnutrition M 1 1 - - - - - - - - - - - - - - - - -F 1 1 - - - - - - - - - - - - - - - - -
P07 M 11 11 - - - - - - - - - - - - - - - - -F 4 4 - - - - - - - - - - - - - - - - -
P20-29 M 14 13 - - - - - - - - - - - 1 - - - - -F 11 9 2 - - - - - - - - - - - - - - - -
P20 Intrauterine hypoxia M 2 2 - - - - - - - - - - - - - - - - -F - - - - - - - - - - - - - - - - - - -
P21 Birth asphyxia M 4 3 - - - - - - - - - - - 1 - - - - -F 1 1 - - - - - - - - - - - - - - - - -
P22 Respiratory distress of newborn M 2 2 - - - - - - - - - - - - - - - - -F 2 2 - - - - - - - - - - - - - - - - -
P27 Chronic respiratory disease originating in the perinatal period M 2 2 - - - - - - - - - - - - - - - - -F 4 2 2 - - - - - - - - - - - - - - - -
P28 Other respiratory conditions originating in the perinatal period M 3 3 - - - - - - - - - - - - - - - - -F 3 3 - - - - - - - - - - - - - - - - -
P29 Cardiovascular disorders originating in the perinatal period M 1 1 - - - - - - - - - - - - - - - - -F 1 1 - - - - - - - - - - - - - - - - -
P35-39 Infections specific to the perinatal period M 2 2 - - - - - - - - - - - - - - - - -F 11 11 - - - - - - - - - - - - - - - - -
P35 Congenital viral diseases M - - - - - - - - - - - - - - - - - - -F 1 1 - - - - - - - - - - - - - - - - -
P36 Bacterial sepsis of newborn M 2 2 - - - - - - - - - - - - - - - - -F 8 8 - - - - - - - - - - - - - - - - -
P37 Other congenital infectious and parasitic diseases M - - - - - - - - - - - - - - - - - - -F 1 1 - - - - - - - - - - - - - - - - -
P39 Other infections specific to the perinatal period M - - - - - - - - - - - - - - - - - - -F 1 1 - - - - - - - - - - - - - - - - -
P50-61 M 3 3 - - - - - - - - - - - - - - - - -F 3 3 - - - - - - - - - - - - - - - - -
P52 Intracranial nontraumatic haemorrhage of fetus and newborn M 3 3 - - - - - - - - - - - - - - - - -F 2 2 - - - - - - - - - - - - - - - - -
P56 Hydrops fetalis due to haemolytic disease M - - - - - - - - - - - - - - - - - - -F 1 1 - - - - - - - - - - - - - - - - -
P75-78 Digestive system disorders of fetus and newborn M 6 6 - - - - - - - - - - - - - - - - -F 5 5 - - - - - - - - - - - - - - - - -
P77 Necrotizing enterocolitis of fetus and newborn M 5 5 - - - - - - - - - - - - - - - - -F 4 4 - - - - - - - - - - - - - - - - -
P78 Other perinatal digestive system disorders M 1 1 - - - - - - - - - - - - - - - - -F 1 1 - - - - - - - - - - - - - - - - -
P80-83 M - - - - - - - - - - - - - - - - - - -F 2 2 - - - - - - - - - - - - - - - - -
P83 Other conditions of integument specific to fetus and newborn M - - - - - - - - - - - - - - - - - - -F 2 2 - - - - - - - - - - - - - - - - -
P90-96 Other disorders originating in the perinatal period M 4 4 - - - - - - - - - - - - - - - - -F 3 3 - - - - - - - - - - - - - - - - -
P91 Other disturbances of cerebral status of newborn M 4 4 - - - - - - - - - - - - - - - - -F 2 2 - - - - - - - - - - - - - - - - -
P96 Other conditions originating in the perinatal period M - - - - - - - - - - - - - - - - - - -F 1 1 - - - - - - - - - - - - - - - - -
Inflammatory disorders of male genital organs, not elsewhere classified
Noninflammatory disorders of ovary, fallopian tube and broad ligament
Pain and other conditions associated with female genital organs and menstrual cycle
Oedema, proteinuria and hypertensive disorders in pregnancy, childbirth and the puerperium
Maternal infectious and parasitic diseases classifiable elsewhere but complicating pregnancy, childbirth and the puerperium
Other maternal diseases classifiable elsewhere but complicating pregnancy, childbirth and the puerperium
XVI. CERTAIN CONDITIONS ORIGINATING IN THE PERINATAL PERIODFetus and newborn affected by maternal factors and by complications of pregnancy, labour and deliveryFetus and newborn affected by maternal complications of pregnancyFetus and newborn affected by complications of placenta, cord and membranesFetus and newborn affected by other complications of labour and delivery
Disorders related to short gestation and low birth weight, not elsewhere classifiedRespiratory and cardiovascular disorders specific to the perinatal period
Haemorrhagic and haematological disorders of fetus and newborn
Conditions involving the integument and temperature regulation of fetus and newborn
Page 132
ICD Codes Cause of death All ages Age group0 1-4 5-9 10-14 15-19 20-24 25-29 30-34 35-39 40-44 45-49 50-54 55-59 60-64 65-69 70-74 75-79 80-84
Q00-Q99 M 100 33 3 2 1 4 2 4 4 4 5 5 5 7 4 10 3 2 1F 80 23 3 - - 1 4 - - 1 1 4 9 12 5 5 4 5 2
Q00-07 Congenital malformations of the nervous system M 11 4 1 - - 2 - - 1 - - 1 1 - 1 - - - -F 11 2 - - - - 1 - - 1 - 2 1 1 - 2 - 1 -
Q00 Anencephaly and similar malformations M - - - - - - - - - - - - - - - - - - -F 1 1 - - - - - - - - - - - - - - - - -
Q02 Microcephaly M 1 - - - - - - - 1 - - - - - - - - - -F - - - - - - - - - - - - - - - - - - -
Q03 Congenital hydrocephalus M 2 - - - - 1 - - - - - 1 - - - - - - -F 2 - - - - - - - - - - - - - - 1 - 1 -
Q04 Other congenital malformations of brain M 3 2 1 - - - - - - - - - - - - - - - -F 2 - - - - - 1 - - 1 - - - - - - - - -
Q05 Spina bifida M 5 2 - - - 1 - - - - - - 1 - 1 - - - -F 5 1 - - - - - - - - - 2 1 - - 1 - - -
Q07 Other congenital malformations of nervous system M - - - - - - - - - - - - - - - - - - -F 1 - - - - - - - - - - - - 1 - - - - -
Q10-18 Congenital malformations of eye, ear, face and neck M - - - - - - - - - - - - - - - - - - -F 1 1 - - - - - - - - - - - - - - - - -
Q18 Other congenital malformations of face and neck M - - - - - - - - - - - - - - - - - - -F 1 1 - - - - - - - - - - - - - - - - -
Q20-28 Congenital malformations of the circulatory system M 18 5 2 - - 1 2 1 1 1 1 2 1 - 1 - - - -F 19 10 1 - - - 2 - - - - 1 2 1 1 1 - - -
Q20 Congenital malformations of cardiac chambers and connections M 1 1 - - - - - - - - - - - - - - - - -F 1 - 1 - - - - - - - - - - - - - - - -
Q21 Congenital malformations of cardiac septa M 4 1 - - - 1 1 - - - - - 1 - - - - - -F 4 2 - - - - - - - - - - - - 1 1 - - -
Q22 Congenital malformations of pulmonary and tricuspid valves M 1 - - - - - 1 - - - - - - - - - - - -F - - - - - - - - - - - - - - - - - - -
Q23 Congenital malformations of aortic and mitral valves M 3 1 1 - - - - 1 - - - - - - - - - - -F 3 2 - - - - - - - - - 1 - - - - - - -
Q24 Other congenital malformations of heart M 6 1 1 - - - - - 1 - - 2 - - 1 - - - -F 10 5 - - - - 2 - - - - - 2 1 - - - - -
Q25 Congenital malformations of great arteries M 1 - - - - - - - - - 1 - - - - - - - -F 1 1 - - - - - - - - - - - - - - - - -
Q26 Congenital malformations of great veins M 1 1 - - - - - - - - - - - - - - - - -F - - - - - - - - - - - - - - - - - - -
Q28 Other congenital malformations of circulatory system M 1 - - - - - - - - 1 - - - - - - - - -F - - - - - - - - - - - - - - - - - - -
Q30-34 Congenital malformations of the respiratory system M 3 3 - - - - - - - - - - - - - - - - -F - - - - - - - - - - - - - - - - - - -
Q32 Congenital malformations of trachea and bronchus M 2 2 - - - - - - - - - - - - - - - - -F - - - - - - - - - - - - - - - - - - -
Q34 Other congenital malformations of respiratory system M 1 1 - - - - - - - - - - - - - - - - -F - - - - - - - - - - - - - - - - - - -
Q38-45 Other congenital malformations of the digestive system M 2 - - 1 - - - - - 1 - - - - - - - - -F 1 - - - - - - - - - - - - - - - 1 - -
Q39 Congenital malformations of oesophagus M - - - - - - - - - - - - - - - - - - -F 1 - - - - - - - - - - - - - - - 1 - -
Q44 Congenital malformations of gallbladder, bile ducts and liver M 2 - - 1 - - - - - 1 - - - - - - - - -F - - - - - - - - - - - - - - - - - - -
Q60-64 Congenital malformations of the urinary system M 11 5 - - - - - - - - 1 1 - 1 - - 2 - -F 8 1 - - - - - - - - - 1 - 1 1 - 1 2 1
Q60 Renal agenesis and other reduction defects of kidney M 1 1 - - - - - - - - - - - - - - - - -F 1 - - - - - - - - - - - - - - - - 1 -
Q61 Cystic kidney disease M 9 3 - - - - - - - - 1 1 - 1 - - 2 - -F 7 1 - - - - - - - - - 1 - 1 1 - 1 1 1
Q64 Other congenital malformations of urinary system M 1 1 - - - - - - - - - - - - - - - - -F - - - - - - - - - - - - - - - - - - -
Q65-79 M 12 8 - - - - - - - 1 - - - - - - 1 1 1F 7 2 1 - - 1 1 - - - - - - - - - - 1 1
Q67 M 2 - - - - - - - - - - - - - - - 1 - 1F 3 - - - - 1 1 - - - - - - - - - - 1 -
Q75 Other congenital malformations of skull and face bones M 2 - - - - - - - - 1 - - - - - - - 1 -F - - - - - - - - - - - - - - - - - - -
Q76 Congenital malformations of spine and bony thorax M - - - - - - - - - - - - - - - - - - -F 1 - - - - - - - - - - - - - - - - - 1
Q77 M - - - - - - - - - - - - - - - - - - -F 1 - 1 - - - - - - - - - - - - - - - -
Q78 Other osteochondrodysplasias M 1 1 - - - - - - - - - - - - - - - - -F - - - - - - - - - - - - - - - - - - -
Q79 M 7 7 - - - - - - - - - - - - - - - - -F 2 2 - - - - - - - - - - - - - - - - -
Q80-89 Other congenital malformations M 12 5 - - - - - 1 2 - 1 1 - 1 - 1 - - -F 4 - 1 - - - - - - - - - - 1 - 1 - - -
Q82 Other congenital malformations of skin M - - - - - - - - - - - - - - - - - - -F 1 - - - - - - - - - - - - - - - - - -
Q85 Phakomatoses, not elsewhere classified M 3 - - - - - - 1 1 - - - - 1 - - - - -F 2 - 1 - - - - - - - - - - 1 - - - - -
Q87 M 3 1 - - - - - - - - 1 1 - - - - - - -F 1 - - - - - - - - - - - - - - 1 - - -
Q89 Other congenital malformations, not elsewhere classified M 6 4 - - - - - - 1 - - - - - - 1 - - -F - - - - - - - - - - - - - - - - - - -
Q90-99 Chromosomal abnormalities, not elsewhere classified M 31 3 - 1 1 1 - 2 - 1 2 - 3 5 2 9 - 1 -F 29 7 - - - - - - - - 1 - 6 8 3 1 2 1 -
Q90 Down's syndrome M 27 2 - 1 1 1 - - - 1 2 - 3 5 2 9 - - -F 22 - - - - - - - - - 1 - 6 8 3 1 2 1 -
Q91 Edwards' syndrome and Patau syndrome M 1 1 - - - - - - - - - - - - - - - - -F 6 6 - - - - - - - - - - - - - - - - -
Q93 M 1 - - - - - - 1 - - - - - - - - - - -F 1 1 - - - - - - - - - - - - - - - - -
Q99 Other chromosome abnormalities, not elsewhere classified M 2 - - - - - - 1 - - - - - - - - - 1 -F - - - - - - - - - - - - - - - - - - -
R00-R99 M 197 11 4 - - 3 4 4 2 11 14 9 14 11 22 14 6 8 6F 288 7 1 1 1 - 1 1 2 3 1 4 7 5 7 7 6 4 20
R00-09 M 1 - - - - - - - - - - - - - - - - 1 -F 1 - - - - - - - - - - - - - - - - - -
R02 Gangrene, not elsewhere classified M - - - - - - - - - - - - - - - - - - -F 1 - - - - - - - - - - - - - - - - - -
R04 Haemorrhage from respiratory passages M 1 - - - - - - - - - - - - - - - - 1 -F - - - - - - - - - - - - - - - - - - -
R10-19 M - - - - - - - - - - - - - - - - - - -F 1 - - - - - - - - - - - - - - - - - -
R13 Dysphagia M - - - - - - - - - - - - - - - - - - -F 1 - - - - - - - - - - - - - - - - - -
R25-29 M - - - - - - - - - - - - - - - - - - -F 1 - - - - - - - - - - - - - - - - - 1
R26 Abnormalities of gait and mobility M - - - - - - - - - - - - - - - - - - -F 1 - - - - - - - - - - - - - - - - - 1
R30-39 Symptoms and signs involving the urinary system M 1 - - - - - - - - - - - - - - 1 - - -F - - - - - - - - - - - - - - - - - - -
R33 Retention of urine M 1 - - - - - - - - - - - - - - 1 - - -
XVII. CONGENITAL MALFORMATIONS, DEFORMATIONS AND CHROMOSOMAL ABNORMALITIES
Congenital malformations and deformations of the musculoskeletal systemCongenital musculoskeletal deformities of head, face, spine and chest
Osteochondrodysplasia with defects of growth of tubular bones and spine
Congenital malformations of the musculoskeletal system, not elsewhere classified
Other specified congenital malformation syndromes affecting multiple systems
Monosomies and deletions from the autosomes, not elsewhere classified
XVIII. SYMPTOMS, SIGNS AND ABNORMAL CLINICAL AND LABORATORY FINDINGS, NOT ELSEWHERE CLASSIFIEDSymptoms and signs involving the circulatory and respiratory systems
Symptoms and signs involving the digestive system and abdomen
Symptoms and signs involving the nervous and musculoskeletal systems
Page 133
ICD Codes Cause of death All ages Age group0 1-4 5-9 10-14 15-19 20-24 25-29 30-34 35-39 40-44 45-49 50-54 55-59 60-64 65-69 70-74 75-79 80-84
Retention of urineF - - - - - - - - - - - - - - - - - - -
R40-46 M - - - - - - - - - - - - - - - - - - -F 4 - - - - - - - - - - - - - - - - - 2
R41 M - - - - - - - - - - - - - - - - - - -F 4 - - - - - - - - - - - - - - - - - 2
R50-69 General symptoms and signs M 55 - - - - - - 1 - - - - - - - - - 1 3F 220 - - - - - - - - - - - 1 1 - 1 - 2 11
R53 Malaise and fatigue M 1 - - - - - - - - - - - - - - - - - -F 2 - - - - - - - - - - - - - - - - - -
R54 Senility M 46 - - - - - - - - - - - - - - - - 1 3F 161 - - - - - - - - - - - - - - - - 1 6
R56 Convulsions, not elsewhere classified M - - - - - - - - - - - - - - - - - - -F 1 - - - - - - - - - - - - - - - - - -
R57 Shock, not elsewhere classified M - - - - - - - - - - - - - - - - - - -F 1 - - - - - - - - - - - 1 - - - - - -
R58 Haemorrhage, not elsewhere classified M - - - - - - - - - - - - - - - - - - -F 3 - - - - - - - - - - - - 1 - 1 - 1 -
R63 Symptoms and signs concerning food and fluid intake M - - - - - - - - - - - - - - - - - - -F 2 - - - - - - - - - - - - - - - - - -
R64 Cachexia M - - - - - - - - - - - - - - - - - - -F 6 - - - - - - - - - - - - - - - - - 1
R68 Other general symptoms and signs M 8 - - - - - - 1 - - - - - - - - - - -F 44 - - - - - - - - - - - - - - - - - 4
R90-94 M - - - - - - - - - - - - - - - - - - -F 1 - - - - - - - - - - - - - - - - - -
R91 Abnormal findings on diagnostic imaging of lung M - - - - - - - - - - - - - - - - - - -F 1 - - - - - - - - - - - - - - - - - -
R95-99 Ill-defined and unknown causes of mortality M 140 11 4 - - 3 4 3 2 11 14 9 14 11 22 13 6 6 3F 60 7 1 1 1 - 1 1 2 3 1 4 6 4 7 6 6 2 6
R95 Sudden infant death syndrome M 11 11 - - - - - - - - - - - - - - - - -F 7 7 - - - - - - - - - - - - - - - - -
R96 Other sudden death, cause unknown M 2 - 1 - - 1 - - - - - - - - - - - - -F 1 - - - 1 - - - - - - - - - - - - - -
R98 Unattended death M 12 - - - - 1 1 - - - - - 2 2 4 2 - - -F 2 - - - - - - - - - - 1 - - - - 1 - -
R99 Other ill-defined and unspecified causes of mortality M 115 - 3 - - 1 3 3 2 11 14 9 12 9 18 11 6 6 3F 50 - 1 1 - - 1 1 2 3 1 3 6 4 7 6 5 2 6
V01-Y98 XX. EXTERNAL CAUSES OF MORBIDITY AND MORTALITY M 1,915 1 1 4 4 36 74 139 162 164 223 181 147 104 89 85 81 93 120F 1,156 5 3 2 3 20 36 36 54 59 79 88 58 48 38 42 46 73 104
V01-99 Transport accidents M 147 - 1 3 2 8 20 15 19 6 8 10 7 15 6 3 7 5 8F 59 - 2 2 2 4 7 4 4 3 1 8 2 3 2 2 1 3 3
V01-09 Pedestrian injured in transport accident M 27 - - 1 1 1 1 - 3 - 2 - 2 8 2 - 2 1 3F 13 - 1 - - - 1 - 1 - - 3 - - 1 1 - 1 1
V03 Pedestrian injured in collision with car, pick-up truck or van M 12 - - 1 - 1 - - 2 - 2 - - 2 1 - 1 - 2F 11 - 1 - - - 1 - 1 - - 2 - - 1 1 - 1 1
V04 Pedestrian injured in collision with heavy transport vehicle or bus M 7 - - - 1 - 1 - - - - - - 3 - - - 1 1F 2 - - - - - - - - - - 1 - - - - - - -
V09 Pedestrian injured in other and unspecified transport accidents M 8 - - - - - - - 1 - - - 2 3 1 - 1 - -F - - - - - - - - - - - - - - - - - - -
V10-19 Pedal cyclist injured in transport accident M 8 - - 1 - 1 1 - - 1 - 1 - 2 - - 1 - -F - - - - - - - - - - - - - - - - - - -
V13 Pedal cyclist injured in collision with car, pick-up truck or van M 4 - - 1 - 1 - - - 1 - - - 1 - - - - -F - - - - - - - - - - - - - - - - - - -
V14 Pedal cyclist injured in collision with heavy transport vehicle or bus M 2 - - - - - - - - - - 1 - 1 - - - - -F - - - - - - - - - - - - - - - - - - -
V18 Pedal cyclist injured in noncollision transport accident M 2 - - - - - 1 - - - - - - - - - 1 - -F - - - - - - - - - - - - - - - - - - -
V20-29 Motorcycle rider injured in transport accident M 28 - - - 1 - 5 4 7 - 1 3 1 1 2 1 2 - -F 2 - - - - - 1 - - - - - - 1 - - - - -
V22 M 2 - - - - - - - - - - - - 1 - 1 - - -F - - - - - - - - - - - - - - - - - - -
V23 Motorcycle rider injured in collision with car, pick-up truck or van M 19 - - - 1 - 4 3 6 - 1 1 - - 2 - 1 - -F 2 - - - - - 1 - - - - - - 1 - - - - -
V24 M 1 - - - - - - 1 - - - - - - - - - - -F - - - - - - - - - - - - - - - - - - -
V27 Motorcycle rider injured in collision with fixed or stationary object M 2 - - - - - 1 - 1 - - - - - - - - - -F - - - - - - - - - - - - - - - - - - -
V28 Motorcycle rider injured in noncollision transport accident M 2 - - - - - - - - - - - 1 - - - 1 - -F - - - - - - - - - - - - - - - - - - -
V29 M 2 - - - - - - - - - - 2 - - - - - - -F - - - - - - - - - - - - - - - - - - -
V30-39 M 1 - - - - - - - - - - - - - - - - - 1F - - - - - - - - - - - - - - - - - - -
V32 M 1 - - - - - - - - - - - - - - - - - 1F - - - - - - - - - - - - - - - - - - -
V40-49 Car occupant injured in transport accident M 66 - 1 1 - 5 12 8 7 4 2 4 2 4 1 2 2 4 3F 41 - 1 2 2 4 4 4 3 3 1 4 1 2 1 1 1 2 2
V43 Car occupant injured in collision with car, pick-up truck or van M 33 - - - - 3 6 3 2 2 2 2 2 2 - 2 1 3 1F 22 - - 2 1 2 - 3 2 2 1 1 1 2 1 1 1 1 -
V44 M 12 - - 1 - - 2 2 1 - - 1 - 1 1 - 1 1 1F 6 - - - - - - - 1 1 - 1 - - - - - 1 1
V47 Car occupant injured in collision with fixed or stationary object M 19 - - - - 2 4 3 4 2 - 1 - 1 - - - - 1F 9 - - - 1 1 4 1 - - - 2 - - - - - - -
V48 Car occupant injured in noncollision transport accident M 1 - 1 - - - - - - - - - - - - - - - -F 3 - 1 - - 1 - - - - - - - - - - - - 1
V49 Car occupant injured in other and unspecified transport accidents M 1 - - - - - - - - - - - - - - - - - -F 1 - - - - - - - - - - - - - - - - - -
V50-59 Occupant of pick-up truck or van injured in transport accident M 5 - - - - 1 - - - - 2 2 - - - - - - -F 1 - - - - - 1 - - - - - - - - - - - -
V53 M 3 - - - - - - - - - 1 2 - - - - - - -F - - - - - - - - - - - - - - - - - - -
V54 M 2 - - - - 1 - - - - 1 - - - - - - - -F 1 - - - - - 1 - - - - - - - - - - - -
V70-79 Bus occupant injured in transport accident M 1 - - - - - - - - 1 - - - - - - - - -F 1 - - - - - - - - - - 1 - - - - - - -
V73 Bus occupant injured in collision with car, pick-up truck or van M - - - - - - - - - - - - - - - - - - -F 1 - - - - - - - - - - 1 - - - - - - -
V77 Bus occupant injured in collision with fixed or stationary object M 1 - - - - - - - - 1 - - - - - - - - -F - - - - - - - - - - - - - - - - - - -
V80-89 Other land transport accidents M 5 - - - - - 1 - 1 - - - 1 - 1 - - - 1F 1 - - - - - - - - - - - 1 - - - - - -
V80 M - - - - - - - - - - - - - - - - - - -F 1 - - - - - - - - - - - 1 - - - - - -
V83 M 2 - - - - - 1 - - - - - 1 - - - - - -F - - - - - - - - - - - - - - - - - - -
V85 M 1 - - - - - - - 1 - - - - - - - - - -F - - - - - - - - - - - - - - - - - - -
V86 M 2 - - - - - - - - - - - - - 1 - - - 1F - - - - - - - - - - - - - - - - - - -
V90-94 Water transport accidents M 6 - - - - - - 3 1 - 1 - 1 - - - - - -F - - - - - - - - - - - - - - - - - - -
Symptoms and signs involving cognition, perception, emotional state and behaviourOther symptoms and signs involving cognitive functions and awareness
Abnormal findings on diagnostic imaging and in function studies, without diagnosis
Motorcycle rider injured in collision with two- or three-wheeled motor vehicle
Motorcycle rider injured in collision with heavy transport vehicle or bus
Motorcycle rider injured in other and unspecified transport accidentsOccupant of three-wheeled motor vehicle injured in transport accidentOccupant of three-wheeled motor vehicle injured in collision with two- or three-wheeled motor vehicle
Car occupant injured in collision with heavy transport vehicle or bus
Occupant of pick-up truck or van injured in collision with car, pick-up truck or vanOccupant of pick-up truck or van injured in collision with heavy transport vehicle or bus
Animal-rider or occupant of animal-drawn vehicle injured in transport accidentOccupant of special vehicle mainly used on industrial premises injured in transport accidentOccupant of special construction vehicle injured in transport accidentOccupant of special all-terrain or other motor vehicle designed primarily for off-road use, injured in transport accident
Page 134
ICD Codes Cause of death All ages Age group0 1-4 5-9 10-14 15-19 20-24 25-29 30-34 35-39 40-44 45-49 50-54 55-59 60-64 65-69 70-74 75-79 80-84
V90 Accident to watercraft causing drowning and submersion M 3 - - - - - - 2 - - - - 1 - - - - - -F - - - - - - - - - - - - - - - - - - -
V92 M 3 - - - - - - 1 1 - 1 - - - - - - - -F - - - - - - - - - - - - - - - - - - -
W00-X59 Other external causes of accidental injury M 1,162 1 - 1 1 8 19 66 94 111 139 100 72 43 45 53 57 73 96F 825 2 1 - - 7 13 17 33 35 54 49 33 26 16 27 32 62 85
W00-19 Falls M 388 - - - 1 - 4 - 4 4 5 4 6 6 10 19 28 53 74F 490 - - - - - 1 1 1 - - - 2 4 7 17 18 51 77
W01 Fall on same level from slipping, tripping and stumbling M 6 - - - - - - - - - - - - 1 - - 2 2 1F 10 - - - - - - - - - - - - - 2 2 2 2 2
W05 Fall involving wheelchair M - - - - - - - - - - - - - - - - - - -F 1 - - - - - - - - - - - - - - - - - -
W06 Fall involving bed M 4 - - - - - - - - - - - - - - - - 3 1F 2 - - - - - - - - - - - - - - 1 - 1 -
W07 Fall involving chair M 1 - - - - - - - - - - - - - - - - - 1F 2 - - - - - - - - - - - - - - - - 1 1
W08 Fall involving other furniture M - - - - - - - - - - - - - - - - - - -F 1 - - - - - - - - - - - - - - 1 - - -
W10 Fall on and from stairs and steps M 26 - - - - - - - - 1 - 1 1 2 3 6 5 2 3F 13 - - - - - - - - - - - 1 2 2 2 1 2 1
W11 Fall on and from ladder M 1 - - - - - - - - - - - - - - 1 - - -F - - - - - - - - - - - - - - - - - - -
W13 Fall from, out of or through building or structure M 5 - - - - - - - - - 1 1 - 1 - 2 - - -F - - - - - - - - - - - - - - - - - - -
W14 Fall from tree M 1 - - - 1 - - - - - - - - - - - - - -F - - - - - - - - - - - - - - - - - - -
W15 Fall from cliff M 15 - - - - - 3 - 2 1 3 - 1 - 1 2 1 1 -F - - - - - - - - - - - - - - - - - - -
W17 Other fall from one level to another M 5 - - - - - 1 - 1 1 - - - - - - - - 2F 3 - - - - - 1 1 1 - - - - - - - - - -
W18 Other fall on same level M - - - - - - - - - - - - - - - - - - -F 1 - - - - - - - - - - - 1 - - - - - -
W19 Unspecified fall M 324 - - - - - - - 1 1 1 2 4 2 6 8 20 45 66F 457 - - - - - - - - - - - - 2 3 11 15 45 73
W20-49 Exposure to inanimate mechanical forces M 12 - - - - 1 1 - 1 1 - 2 - 2 1 - 3 - -F - - - - - - - - - - - - - - - - - - -
W20 Struck by thrown, projected or falling object M 5 - - - - - - - 1 - - 2 - 1 - - 1 - -F - - - - - - - - - - - - - - - - - - -
W23 Caught, crushed, jammed or pinched in or between objects M 2 - - - - - - - - - - - - 1 - - 1 - -F - - - - - - - - - - - - - - - - - - -
W24 M 1 - - - - - - - - - - - - - 1 - - - -F - - - - - - - - - - - - - - - - - - -
W33 Rifle, shotgun and larger firearm discharge M 1 - - - - 1 - - - - - - - - - - - - -F - - - - - - - - - - - - - - - - - - -
W34 Discharge from other and unspecified firearms M 2 - - - - - 1 - - 1 - - - - - - - - -F - - - - - - - - - - - - - - - - - - -
W49 Exposure to other and unspecified inanimate mechanical forces M 1 - - - - - - - - - - - - - - - 1 - -F - - - - - - - - - - - - - - - - - - -
W65-74 Accidental drowning and submersion M 19 - - 1 - - 1 2 - 1 4 1 1 1 - 3 2 1 1F 9 - - - - 1 - - - 1 - - - 3 2 1 - - 1
W65 Drowning and submersion while in bath-tub M 1 - - - - - - - - - - - 1 - - - - - -F - - - - - - - - - - - - - - - - - - -
W69 Drowning and submersion while in natural water M 9 - - - - - - 1 - - 3 - - - - 3 2 - -F 2 - - - - 1 - - - - - - - - - - - - 1
W70 Drowning and submersion following fall into natural water M 2 - - - - - - - - 1 1 - - - - - - - -F - - - - - - - - - - - - - - - - - - -
W74 Unspecified drowning and submersion M 7 - - 1 - - 1 1 - - - 1 - 1 - - - 1 1F 7 - - - - - - - - 1 - - - 3 2 1 - - -
W75-84 Other accidental threats to breathing M 32 1 - - - - - - 1 - 2 3 3 3 4 3 6 2 2F 22 2 1 - - - - - - 1 - 2 1 - - 1 2 2 2
W75 Accidental suffocation and strangulation in bed M 1 1 - - - - - - - - - - - - - - - - -F 1 1 - - - - - - - - - - - - - - - - -
W76 Other accidental hanging and strangulation M 2 - - - - - - - - - 1 1 - - - - - - -F - - - - - - - - - - - - - - - - - - -
W78 Inhalation of gastric contents M 3 - - - - - - - - - 1 - 1 - - 1 - - -F 5 1 - - - - - - - - - - - - - - 1 - -
W79 M 18 - - - - - - - - - - 2 - 3 2 2 5 2 -F 10 - - - - - - - - 1 - 1 - - - 1 1 1 2
W80 M 7 - - - - - - - 1 - - - 2 - 1 - 1 - 2F 5 - 1 - - - - - - - - 1 - - - - - 1 -
W84 Unspecified threat to breathing M 1 - - - - - - - - - - - - - 1 - - - -F 1 - - - - - - - - - - - 1 - - - - - -
W85-99 M 1 - - - - - - - - - - 1 - - - - - - -F - - - - - - - - - - - - - - - - - - -
W94 Exposure to high and low air pressure and changes in air pressure M 1 - - - - - - - - - - 1 - - - - - - -F - - - - - - - - - - - - - - - - - - -
X00-09 Exposure to smoke, fire and flames M 28 - - - - - 1 1 2 - 3 2 2 1 4 2 2 2 2F 15 - - - - - - 1 - 1 1 1 1 1 - 2 1 2 3
X00 Exposure to uncontrolled fire in building or structure M 23 - - - - - 1 1 2 - 3 1 1 1 3 2 2 1 2F 13 - - - - - - 1 - 1 1 1 1 1 - 2 1 2 1
X02 Exposure to controlled fire in building or structure M 1 - - - - - - - - - - - - - 1 - - - -F - - - - - - - - - - - - - - - - - - -
X09 Exposure to unspecified smoke, fire and flames M 4 - - - - - - - - - - 1 1 - - - - 1 -F 2 - - - - - - - - - - - - - - - - - 2
X10-19 Contact with heat and hot substances M 1 - - - - - - - - - 1 - - - - - - - -F - - - - - - - - - - - - - - - - - - -
X11 Contact with hot tap-water M 1 - - - - - - - - - 1 - - - - - - - -F - - - - - - - - - - - - - - - - - - -
X30-39 Exposure to forces of nature M 11 - - - - - - 1 - 1 - - 3 - - 1 2 2 -F 8 - - - - - 1 - - - - - 1 - - - - 1 1
X30 Exposure to excessive natural heat M - - - - - - - - - - - - - - - - - - -F 1 - - - - - - - - - - - - - - - - - -
X31 Exposure to excessive natural cold M 9 - - - - - - - - 1 - - 2 - - 1 2 2 -F 6 - - - - - - - - - - - 1 - - - - 1 1
X36 Victim of avalanche, landslide and other earth movements M 2 - - - - - - 1 - - - - 1 - - - - - -F 1 - - - - - 1 - - - - - - - - - - - -
X40-49 Accidental poisoning by and exposure to noxious substances M 607 - - - - 6 12 60 85 101 121 84 51 24 16 16 8 9 10F 243 - - - - 6 11 14 31 32 51 46 26 14 4 3 2 1 -
X40 M 1 - - - - - - - - - - 1 - - - - - - -F 2 - - - - - 1 - - - - - - - - - - 1 -
X41 M 73 - - - - 4 3 5 11 13 13 10 9 1 2 1 - - 1F 47 - - - - 5 1 4 5 5 10 12 4 1 - - - - -
X42 M 451 - - - - 2 9 51 72 82 101 65 32 20 9 7 1 - -F 176 - - - - 1 8 8 25 27 37 31 21 10 3 2 2 - -
X43 M 2 - - - - - - 1 - - - - 1 - - - - - -F - - - - - - - - - - - - - - - - - - -
X44 M 7 - - - - - - 1 - 1 2 2 1 - - - - - -F 1 - - - - - - - - - - - - - - - - - -
X45 Accidental poisoning by and exposure to alcohol M 39 - - - - - - 2 1 3 5 6 8 2 4 3 3 1 1
Water-transport-related drowning and submersion without accident to watercraft
Contact with lifting and transmission devices, not elsewhere classified
Inhalation and ingestion of food causing obstruction of respiratory tractInhalation and ingestion of other objects causing obstruction of respiratory tract
Exposure to electric current, radiation and extreme ambient air temperature and pressure
Accidental poisoning by and exposure to nonopioid analgesics, antipyretics and antirheumaticsAccidental poisoning by and exposure to antiepileptic, sedative-hypnotic, antiparkinsonism and psychotropic drugs, not elsewhere classifiedAccidental poisoning by and exposure to narcotics and psychodysleptics [hallucinogens], not elsewhere classifiedAccidental poisoning by and exposure to other drugs acting on the autonomic nervous systemAccidental poisoning by and exposure to other and unspecified drugs, medicaments and biological substances
Page 135
ICD Codes Cause of death All ages Age group0 1-4 5-9 10-14 15-19 20-24 25-29 30-34 35-39 40-44 45-49 50-54 55-59 60-64 65-69 70-74 75-79 80-84
X45 Accidental poisoning by and exposure to alcoholF 15 - - - - - 1 - 1 - 4 3 1 3 1 1 - - -
X46 M 1 - - - - - - - 1 - - - - - - - - - -F 1 - - - - - - 1 - - - - - - - - - - -
X47 Accidental poisoning by and exposure to other gases and vapours M 1 - - - - - - - - 1 - - - - - - - - -F 1 - - - - - - 1 - - - - - - - - - - -
X49 M 32 - - - - - - - - 1 - - - 1 1 5 4 8 8F - - - - - - - - - - - - - - - - - - -
X58-59 Accidental exposure to other and unspecified factors M 63 - - - - 1 - 2 1 3 3 3 6 6 10 9 6 4 7F 38 - - - - - - 1 1 - 2 - 2 4 3 3 9 5 1
X59 Exposure to unspecified factor M 63 - - - - 1 - 2 1 3 3 3 6 6 10 9 6 4 7F 38 - - - - - - 1 1 - 2 - 2 4 3 3 9 5 1
X60-84 Intentional self-harm M 439 - - - 1 14 28 49 38 38 54 54 55 33 31 17 10 8 6F 164 - - - 1 8 15 11 12 15 13 25 14 15 12 7 8 3 3
X60 M 7 - - - - - - - - - 1 1 1 1 - 1 - 1 -F 6 - - - - - - - - 1 - 1 - 1 1 - - - 1
X61 M 11 - - - - - 1 2 2 - 2 3 1 - - - - - -F 14 - - - - - - - - 3 3 3 2 1 1 - 1 - -
X62 M 8 - - - - 1 1 - - - - 2 - 2 1 1 - - -F 23 - - - - - 1 - 2 1 1 3 2 7 4 - - 2 -
X63 M 5 - - - - - - - - - 3 2 - - - - - - -F 6 - - - - 1 1 3 - - - - - - 1 - - - -
X64 M 11 - - - - 1 2 - 2 1 1 1 1 - 2 - - - -F 11 - - - - 1 1 - - - 3 - 1 1 - - 4 - -
X66 M - - - - - - - - - - - - - - - - - - -F 1 - - - - - - - - - - 1 - - - - - - -
X67 M 13 - - - - 2 - 1 - 2 1 1 1 1 - 2 1 1 -F 2 - - - - - - - - - - 1 - - 1 - - - -
X69 M 1 - - - - - - - - - - - - - - - - 1 -F - - - - - - - - - - - - - - - - - - -
X70 Intentional self-harm by hanging, strangulation and suffocation M 294 - - - 1 8 20 36 29 29 36 33 40 24 20 9 3 1 5F 64 - - - - 5 10 6 7 7 5 8 6 1 4 1 3 - 1
X71 Intentional self-harm by drowning and submersion M 17 - - - - - 2 1 2 1 - 2 2 - 3 1 2 - 1F 13 - - - - 1 - - 1 1 1 2 1 1 - 2 - 1 1
X73 Intentional self-harm by rifle, shotgun and larger firearm discharge M 2 - - - - - - - - - - - - - 1 - 1 - -F - - - - - - - - - - - - - - - - - - -
X76 Intentional self-harm by smoke, fire and flames M 3 - - - - - - - - - 1 1 1 - - - - - -F 2 - - - - - - 1 - - - 1 - - - - - - -
X78 Intentional self-harm by sharp object M 15 - - - - - - 1 - 1 3 3 1 1 3 1 - 1 -F 1 - - - - - - - - - - 1 - - - - - - -
X80 Intentional self-harm by jumping from a high place M 28 - - - - 1 1 2 2 4 5 2 3 2 1 1 1 3 -F 14 - - - 1 - 1 1 2 1 - 2 2 2 - 2 - - -
X81 Intentional self-harm by jumping or lying before moving object M 20 - - - - 1 1 6 1 - 1 3 3 2 - - 1 - -F 5 - - - - - - - - - - 2 - 1 - 2 - - -
X82 Intentional self-harm by crashing of motor vehicle M - - - - - - - - - - - - - - - - - - -F 1 - - - - - - - - 1 - - - - - - - - -
X84 Intentional self-harm by unspecified means M 4 - - - - - - - - - - - 1 - - 1 1 - -F 1 - - - - - 1 - - - - - - - - - - - -
X85-Y09 Assault M 40 - - - - 1 5 3 4 1 11 7 2 1 1 2 - 2 -F 13 1 - - - 1 - 1 - 5 2 - 1 - 1 - - - 1
X91 Assault by hanging, strangulation and suffocation M - - - - - - - - - - - - - - - - - - -F 1 - - - - - - - - 1 - - - - - - - - -
X95 Assault by other and unspecified firearm discharge M 1 - - - - - - 1 - - - - - - - - - - -F - - - - - - - - - - - - - - - - - - -
X99 Assault by sharp object M 24 - - - - 1 3 2 2 - 9 4 1 - - - - 2 -F 5 - - - - 1 - 1 - 2 1 - - - - - - - -
Y00 Assault by blunt object M 2 - - - - - - - - - - 2 - - - - - - -F - - - - - - - - - - - - - - - - - - -
Y09 Assault by unspecified means M 13 - - - - - 2 - 2 1 2 1 1 1 1 2 - - -F 7 1 - - - - - - - 2 1 - 1 - 1 - - - 1
Y10-34 Event of undetermined intent M 74 - - - - 4 2 6 7 7 10 8 10 6 2 6 3 - 2F 44 1 - - - - 1 3 3 1 9 5 5 2 5 4 2 - 1
Y10 M 4 - - - - - - - - 1 - - - 2 1 - - - -F 3 - - - - - - - - - - 1 - - - 1 - - 1
Y11 M 8 - - - - - - - 2 - 2 1 1 - - 1 - - -F 5 - - - - - - 1 - - 1 - 1 - - 2 - - -
Y12 M 31 - - - - 3 1 1 3 5 6 4 5 1 1 1 - - -F 20 - - - - - 1 - 3 - 6 3 3 - 3 - 1 - -
Y14 M 5 - - - - - - 1 - - - 1 - - - 2 - - 1F 4 - - - - - - - - 1 - 1 - - 1 - - - -
Y17 M 2 - - - - - - - 1 - - - 1 - - - - - -F - - - - - - - - - - - - - - - - - - -
Y21 Drowning and submersion, undetermined intent M 6 - - - - - - 1 - - 1 - 1 - - - 2 - 1F - - - - - - - - - - - - - - - - - - -
Y23 Rifle, shotgun and larger firearm discharge, undetermined intent M 1 - - - - - - - - - - - 1 - - - - - -F - - - - - - - - - - - - - - - - - - -
Y28 Contact with sharp object, undetermined intent M 1 - - - - - - - 1 - - - - - - - - - -F - - - - - - - - - - - - - - - - - - -
Y30 Falling, jumping or pushed from a high place, undetermined intent M 10 - - - - - 1 2 - - 1 2 - 2 - 1 1 - -F 8 - - - - - - 1 - - 2 - 1 2 - - 1 - -
Y31 M 2 - - - - - - 1 - 1 - - - - - - - - -F 1 - - - - - - 1 - - - - - - - - - - -
Y34 Unspecified event, undetermined intent M 4 - - - - 1 - - - - - - 1 1 - 1 - - -F 3 1 - - - - - - - - - - - - 1 1 - - -
Y40-84 Complications of medical and surgical care M 34 - - - - - - - - - - - - 4 - 3 3 3 6F 34 1 - - - - - - 1 - - - 3 1 1 2 2 2 8
Y40-59 M 12 - - - - - - - - - - - - 2 - 1 2 1 4F 12 - - - - - - - - - - - 1 - - 2 - - 5
Y44 Agents primarily affecting blood constituents M 6 - - - - - - - - - - - - 1 - - 1 1 1F 8 - - - - - - - - - - - - - - 1 - - 4
Y45 Analgesics, antipyretics and anti-inflammatory drugs M 3 - - - - - - - - - - - - - - - 1 - 2F 2 - - - - - - - - - - - 1 - - 1 - - -
Y49 Psychotropic drugs, not elsewhere classified M 1 - - - - - - - - - - - - 1 - - - - -F - - - - - - - - - - - - - - - - - - -
Y52 Agents primarily affecting the cardiovascular system M 1 - - - - - - - - - - - - - - - - - 1F 1 - - - - - - - - - - - - - - - - - 1
Y57 Other and unspecified drugs and medicaments M 1 - - - - - - - - - - - - - - 1 - - -F 1 - - - - - - - - - - - - - - - - - -
Y60-69 Misadventures to patients during surgical and medical care M - - - - - - - - - - - - - - - - - - -F 1 1 - - - - - - - - - - - - - - - - -
Y60 M - - - - - - - - - - - - - - - - - - -F 1 1 - - - - - - - - - - - - - - - - -
Y83-84 M 22 - - - - - - - - - - - - 2 - 2 1 2 2F 21 - - - - - - - 1 - - - 2 1 1 - 2 2 3
Y83 M 17 - - - - - - - - - - - - 1 - 2 1 2 1F 18 - - - - - - - 1 - - - 1 1 1 - 2 2 2
Accidental poisoning by and exposure to organic solvents and halogenated hydrocarbons and their vapours
Accidental poisoning by and exposure to other and unspecified chemicals and noxious substances
Intentional self-poisoning by and exposure to nonopioid analgesics, antipyretics and antirheumaticsIntentional self-poisoning by and exposure to antiepileptic, sedative-hypnotic, antiparkinsonism and psychotropic drugs, not elsewhere classifiedIntentional self-poisoning by and exposure to narcotics and psychodysleptics [hallucinogens], not elsewhere classifiedIntentional self-poisoning by and exposure to other drugs acting on the autonomic nervous systemIntentional self-poisoning by and exposure to other and unspecified drugs, medicaments and biological substancesIntentional self-poisoning by and exposure to organic solvents and halogenated hydrocarbons and their vapoursIntentional self-poisoning by and exposure to other gases and vapoursIntentional self-poisoning by and exposure to other and unspecified chemicals and noxious substances
Poisoning by and exposure to nonopioid analgesics, antipyretics and antirheumatics, undetermined intentPoisoning by and exposure to antiepileptic, sedative-hypnotic, antiparkinsonism and psychotropic drugs, not elsewhere classified, undetermined intentPoisoning by and exposure to narcotics and psychodysleptics [hallucinogens], not elsewhere classified, undetermined intentPoisoning by and exposure to other and unspecified drugs, medicaments and biological substances, undetermined intentPoisoning by and exposure to other gases and vapours, undetermined intent
Falling, lying or running before or into moving object, undetermined intent
Drugs, medicaments and biological substances causing adverse effects in therapeutic use
Unintentional cut, puncture, perforation or haemorrhage during surgical and medical careSurgical and other medical procedures as the cause of abnormal reaction of the patient, or of later complication, without mention of misadventure at the time of the procedure
Surgical operation and other surgical procedures as the cause of abnormal reaction of the patient, or of later complication, without mention of misadventure at the time of the procedure
Page 136
ICD Codes Cause of death All ages Age group0 1-4 5-9 10-14 15-19 20-24 25-29 30-34 35-39 40-44 45-49 50-54 55-59 60-64 65-69 70-74 75-79 80-84
Y84 M 5 - - - - - - - - - - - - 1 - - - - 1
F 3 - - - - - - - - - - - 1 - - - - - 1
Y85-89 Sequelae of external causes of morbidity and mortality M 19 - - - - 1 - - - 1 1 2 1 2 4 1 1 2 2F 17 - - - - - - - 1 - - 1 - 1 1 - 1 3 3
Y85 Sequelae of transport accidents M 3 - - - - - - - - - - - - 1 1 - - 1 -F 2 - - - - - - - - - - 1 - - - - - - -
Y850 Sequelae of motor-vehicle accident M 2 - - - - - - - - - - - - 1 1 - - - -F 2 - - - - - - - - - - 1 - - - - - - -
Y859 Sequelae of other and unspecified transport accidents M 1 - - - - - - - - - - - - - - - - 1 -F - - - - - - - - - - - - - - - - - - -
Y86 Sequelae of other accidents M 8 - - - - 1 - - - - 1 1 - 1 2 - - - 2F 10 - - - - - - - - - - - - - - - 1 2 2
Y87 M 5 - - - - - - - - 1 - 1 1 - - 1 1 - -F 3 - - - - - - - 1 - - - - 1 1 - - - -
Y871 Sequelae of assault M 1 - - - - - - - - - - - - - - 1 - - -F - - - - - - - - - - - - - - - - - - -
Y872 Sequelae of events of undetermined intent M 4 - - - - - - - - 1 - 1 1 - - - 1 - -F 3 - - - - - - - 1 - - - - 1 1 - - - -
Y88 Sequelae with surgical and medical care as external cause M 3 - - - - - - - - - - - - - 1 - - 1 -F 2 - - - - - - - - - - - - - - - - 1 1
Footnote1) Where a cause of death is omitted there were no events registered.
© Crown Copyright 2017
Other medical procedures as the cause of abnormal reaction of the patient, or of later complication, without mention of misadventure at the time of procedure
Sequelae of intentional self-harm, assault and events of undetermined intent
Page 137
Age group85-89 90+
9,333 9,2703,828 2,9335,505 6,337
46 3586 73
7 925 24
- 211 6
2 12 75 6
12 111 21 -1 21 -- -- -- -- -- -- -- -- -- -- -
33 2255 39
- -- -- -- -- -- -1 -1 1
27 1746 30
- -- -5 58 8- -- -- -- -- -- -1 -3 51 -1 -- -- -- -2 5- -- -- -- -- -- -- -- -- -- -- -- -- -- -- -- -- -- -- -- -1 -1 11 -- -- -- 1- -- -- -- -- -1 -1 1- 1- 1- 1- -- -1 -- -- -- -- -- -2 11 11 -- 11 1- -- -
Page 138
Age group85-89 90+
1 -- -- 2- -- 2
929 5011,019 704
898 479989 650
10 213 11
- -- -- 1- -4 1
2 3- -1 -- -2 -- -- -1 -5 62 -2 1- -- -- -- -1 -- -- -1 -- -- -1 -- 11 -- -
241 128292 190
38 2031 2126 1129 11
3 14 4
56 3083 6810 721 1023 1528 15
2 -3 2
34 1731 8
2 15 42 4- 1
29 1337 2216 920 24
197 89217 104
- -1 -- -- 16 32 -- -- -
186 85213 103
1 -1 -3 1- -1 -- -1 12 -- -- -1 12 -
24 1111 16
8 87 9
16 34 7
19 913 517 6
2 1- -1 -1 16 11 24 31 1
127 1261 1
Page 139
Age group85-89 90+
127 12675 48
5 51 1
11 416 16
9 131 20
2 1
- -168 107
- 2168 105
- -86 5459 3822 1320 7
- -- -7 11 2
52 3837 24
5 21 5
10 16 11 -- -- -1 -9 15 1- -- -2 24 12 24 1- -- -- -- -
56 2986 53
4 319 6
- -3 -- -- -
52 2664 4773 4277 54
1 -1 -4 11 1
12 610 3
- -2 -
20 1017 13
3 1- 1
14 1017 15
4 56 6
14 720 11
- -1 1- 22 31 -- -
10 37 3
10 37 3- 1- -- 1- -5 22 6- 1- -1 1- -- -- -- -1 -- -- -- -4 -1 5- -- 1- -- -- -- -
26 19
Page 140
Age group85-89 90+
28 483 11 42 31 -- 1
1 -1 5- -1 2- -1 1- -- 12 -- 3
13 1313 21
5 29 8- -1 24 69 161 11 41 11 4- -- -- 2- 1- -- -- 2- 12 12 8- -- -1 -- -1 12 81 -4 1- -2 1- -- -1 -- -- -2 -- 12 2- 12 2- -- -- -- -- 1- -- -- -- -- -- -- -- -- -- 1- -- -- -
67 3679 83
- -2 1- -1 1- -1 -- -- -
64 3063 61
2 -3 1
49 2550 5113 510 9
- -1 -- -- -- -1 -- -1 5- -- -- -- 3- -- -- -
Page 141
Age group85-89 90+
- 1- -1 1- -- -- -- -- -1 -- -1 -- -- -- -1 -- -- -- -1 -- -2 -- -2 -3 68 16- -- -- -- -- -- -- -- -- 14 2- -- -- -- -1 12 -1 31 91 11 4- -- 1
392 330689 1,104386 329677 1,097216 172290 448166 153382 637
4 44 12- -1 -4 -2 -4 -2 -- -- -- -- -- -- -- -- -- -- -- -- -- -2 3- -- 3- -1 -- -1 -2 17 4- -1 12 -6 2- 1- 1- -- -- -- -- -- -- -- -- -1 -- -1 -- -- -
258 185506 538
- -2 1- -- -
Page 142
Age group85-89 90+
- -- -- -1 1- -1 -- -- -3 19 4- -1 -- -1 -3 17 4
60 2049 3656 1847 36
4 21 -- -- -- -1 -
179 158421 487157 150405 469
22 816 18
- -4 -- -4 -- -- -4 2
12 73 -9 2- -1 -1 22 4- -- 1- 1- -- 1- -4 -1 -- -- -2 -- -2 -1 -2 23 11 23 11 -- -- -- -1 -5 11 -- -- -1 -- -4 -- -- 15 1- 11 1- -- -- 11 -- -3 -- -- -- -- -- 1- -- -- -- -- -- 1- -- 1- -- 1- -- -- -- -- -- 1- -- -- -
Page 143
Age group85-89 90+
- 11,167 9311,691 1,954
- -- -- -- -7 3
22 162 1
14 51 -- -- -2 34 24 7- -2 1
38 2664 10210 830 5419 1325 43
6 48 33 11 2
480 371623 609
- -3 3
272 200340 311
10 913 10
198 162267 285
16 620 22
9 415 13
7 25 9- -- -
193 184297 418
- -- -2 -- -3 21 18 5
10 744 4559 75
1 314 8
- -- -4 12 23 33 41 2- 21 11 11 11 1
67 60131 177
3 -3 1
32 4043 9123 2129 48
344 283581 701
4 37 4
36 1159 2928 1732 1648 3282 9474 81
188 21820 2135 51
134 118178 289
80 5681 79
7 34 2
51 2536 13
- 1- -
20 2739 64
- -- -2 -2 -
Page 144
Age group85-89 90+
9 23 65 11 2- -- -- -- -2 11 4- -- -- -1 -2 -- -- -- 1- -- 1- -- -
581 532773 943
- -- 1- -- -- -- 1
158 208240 439
- -- -- -7 3- 12 1- -2 1- 41 -1 -- -1 1- -
156 202228 434
22 3845 79
- 1- -- -- -
22 3745 79
2 31 4- -- -1 1- 11 21 3
222 123329 192
- -1 -7 47 4
200 109284 148
4 614 26
- -- -
11 423 1472 7268 89
- -- -6 2- -- -- -
66 7068 89
- -- -
54 2432 22
- -- -2 -- 2- -- -
52 2432 20
2 -- 1- -- -2 -- 15 53 21 12 1
Page 145
Age group85-89 90+
1 1- -2 3- -1 -1 1
44 5955 114
1 -- -
43 5955 114
133 111255 241
1 -- 1- -- 1- -- -- -- -1 -- -
15 2132 45
2 21 3- -1 1- 56 101 -3 53 35 63 32 2- -- -- 23 16 6
11 17- 11 -- 11 -- -- -9 7
10 86 3- 1- -- 3- -1 -2 12 -1 14 2- -- -- 23 21 -6 51 -3 3- -1 1- -2 1
53 26107 90
13 432 2616 1127 20
9 332 29
3 11 21 -- -- 42 3
11 313 10
1 22 21 11 2- 11 -
12 412 2
2 -- -- -- -4 11 -- -- -4 -8 11 -3 -1 3
Page 146
Age group85-89 90+
- 121 2461 44
5 817 13
3 611 6
- -1 -6 6
25 225 46 32 -1 -
20 2624 44
- -- -
20 2624 4414 826 21
6 217 13
1 -- 14 1
16 111 -- -- 11 1- 11 -- 11 -- 1- 1- 1- -- -- 1- -- -- -- -- -- -- -- -- -- -8 48 7- -- -1 11 2- -- -- -1 -6 35 51 -1 -
14 2045 57
4 716 18
- 13 1- 13 14 3
13 9- -1 -4 3
11 9- -- -- -- -- -- -- -1 -- 3- 7- -- -- -- -- -- 2- 3- 5- -- 1- -- 1- -- -2 -5 3- -- -2 -1 2
Page 147
Age group85-89 90+
- -1 1- -- -- -3 -- -- -- 26 3- -4 3- -2 -- -2 3- 21 -- -- -- 2- -- -1 -- -- -- -1 -- -- -- -1 -3 33 22 23 11 -1 -1 22 11 -- -1 -- -- 1- 1- -- 1- 1- -- -- -5 8
15 314 7
13 284 23 11- 49 17- 11 -- -- -1 12 31 -1 3- 1- -- -1 -
101 98137 218
23 2543 69
- -- -- -1 -
23 2341 69
- 21 -- -- -4 41 3- 1- 1- -- 11 -- -3 31 1- -- -- -- -
26 2434 46
9 1016 2014 914 18
3 54 8- 1- 1- -
Page 148
Age group85-89 90+
- 1- 1- -1 -1 -- -- -1 -- -- -1 -
40 4257 96
- -2 13 1- 1
37 4155 94
7 26 2- -1 -
- -- -- -1 3- -- 2- 1
- -1 -
- -- -
- -- -
- -- -- -
- -
- -- -- -- -- -- -- -- -- -- -- -- -- -- -- -- -- -- -- -- -- -- -- -- -- -- -- -- -- -- -- -- -- -- -- -- -- -- -- -- -- -- -- -- -- -- -- -- -- -- -- -- -- -- -- -- -- -- -- -- -- -- -
Page 149
Age group85-89 90+
1 -- 1- -- -- -- -- -- -- -- -- -- -- -- -- -- -- -- -- -- -- -- -- -- -- -- -- -- -- -- -- -- -- -- -- -- -- -- -- -- -- -- -- -- -- -- -- -- -- -- -1 -- -- -- -1 -- -- -- -- -- -- -- -- -- -- -- -- -- -- -- -- -- -- -- 1- -- 1- -- -- -- -- -- -- -- -- -- -- -- -- -- -- -- -
14 4033 177
- -- 1- -- 1- -- -- -- 1- -- 1- -- -- -- -- -- -- -
Page 150
Age group85-89 90+
- -- -1 1- -1 1
10 4032 172
- 11 19 33
19 135- -1 -- -- -- -- -- -- 2- -2 31 69 31- -- 1- -- 14 -- 1- -- -- -- -- -- -4 -- 1
107 100157 205
2 23 3- -2 1- -1 1- -1 -- -- -- -- -- -- -- -- -- -- -- -- -- -- -- -- -- -- -- -- -- -- -- -- -- -- -- -- -2 21 22 -1 -- -- 1- 1- -- -- -- 1- 1- -- -- -- -- -- -- -- -- -- -- -- -- -- -- -- -- -- -- -- -- -- -- -- -
Page 151
Age group85-89 90+
- -- -- -- -
92 91140 193
81 89130 181
- -- -- -- 1- -- -- -- -- -- -2 -2 -- -- -- -- -- -- -- -- -- -- -- -- -
79 89128 180
- -- -- -- -- -- -- -- -- -- -- -- -- -- -- -- -- -- -- -- -- -- -- -- -2 -6 2- -- -- -- -- -2 12 -2 1- -2 -- -- -- -- -- -- -3 1- 13 -- 1- -- -- 1- -- -- -- -- -- 12 2- -- 1- 12 1- -- -4 -2 -- -- -- -- -
- -1 -- -- -- -1 -- -
Page 152
Age group85-89 90+
- -- -- -- -- -4 -- -2 -- 72 -- 71 22 -1 -1 -- -- -
- -- -- -- -- -- -- -- -- -- -- -- -- -- -- -1 -- -- -- -- -- -- -- -- -- 1- -- -- -- 1- -- -- -- -- -- -- -- -- -- -- -- -- -- 12 -- -- -- 1- -
- -- -- -1 -- -- -- -- -- -- -- -- -- -1 -- -- -- -- -
12 38 52 -3 12 -2 1- -- -- -- -- -- -- -1 -- -- -- -- -
10 35 4
7 35 3
Page 153
Age group85-89 90+
3 -
- 1
- 1
2 4- -1 -- -1 -- -- -- -1 4- -- -- -- -- -- -- 1- -
Page 154
Table 6.05: Deaths by frequency of cause by sex, numbers and percentages, Scotland, 1986 to 2016
Cause of death 1986 1991 1996 2001 2006 2011 2016(ICD Codes) P M F P M F P M F P M F P M F P M F P M F
Numbers
All causes 63,467 31,111 32,356 61,041 29,312 31,729 60,654 29,209 31,445 57,382 27,324 30,058 55,093 26,251 28,842 53,661 25,913 27,748 56,728 27,760 28,968Malignant neoplasms (C00-97) 14,534 7,443 7,091 14,876 7,589 7,287 15,171 7,707 7,464 15,196 7,772 7,424 15,084 7,728 7,356 15,457 8,005 7,452 15,901 8,303 7,598
Ischaemic heart disease (I20-25) 18,138 10,019 8,119 16,866 8,963 7,903 14,647 7,887 6,760 11,914 6,258 5,656 9,532 5,099 4,433 7,636 4,320 3,316 6,697 3,917 2,780
Cerebrovascular disease (I60-69) 8,590 3,243 5,347 7,968 2,936 5,032 7,128 2,649 4,479 6,621 2,438 4,183 5,466 2,060 3,406 4,594 1,765 2,829 4,142 1,712 2,430
582 143 439 706 191 515 759 209 550 2,133 586 1,547 2,553 704 1,849 3,911 1,236 2,675 5,571 1,818 3,753
Respiratory diseases (J00-99) 7,469 3,685 3,784 7,068 3,374 3,694 7,859 3,611 4,248 6,435 2,897 3,538 7,183 3,161 4,022 6,791 3,138 3,653 7,296 3,373 3,923
2,068 1,164 904 1,750 942 808 1,522 789 733 1,350 749 601 1,264 722 542 1,657 970 687 2,216 1,320 896
Intentional self-harm (X60-84, Y87.0) 568 410 158 525 394 131 597 435 162 609 441 168 542 427 115 527 393 134 603 439 164
11,518 5,004 6,514 11,282 4,923 6,359 12,971 5,922 7,049 13,124 6,183 6,941 13,469 6,350 7,119 13,088 6,086 7,002 14,302 6,878 7,424
Percentages
All causes 100 100 100 100 100 100 100 100 100 100 100 100 100 100 100 100 100 100 100 100 100Malignant neoplasms (C00-97) 22.9 23.9 21.9 24.4 25.9 23.0 25.0 26.4 23.7 26.5 28.4 24.7 27.4 29.4 25.5 28.8 30.9 26.9 28.0 29.9 26.2
Ischaemic heart disease (I20-25) 28.6 32.2 25.1 27.6 30.6 24.9 24.1 27.0 21.5 20.8 22.9 18.8 17.3 19.4 15.4 14.2 16.7 12.0 11.8 14.1 9.6
Cerebrovascular disease (I60-69) 13.5 10.4 16.5 13.1 10.0 15.9 11.8 9.1 14.2 11.5 8.9 13.9 9.9 7.8 11.8 8.6 6.8 10.2 7.3 6.2 8.4
0.9 0.5 1.4 1.2 0.7 1.6 1.3 0.7 1.8 3.7 2.1 5.1 4.6 2.7 6.4 7.3 4.8 9.6 9.8 6.5 13.0
Respiratory diseases (J00-99) 11.8 11.8 11.7 11.6 11.5 11.6 13.0 12.4 13.5 11.2 10.6 11.8 13.0 12.0 13.9 12.7 12.1 13.2 12.9 12.2 13.5
3.2 3.7 2.7 2.7 3.0 2.4 2.3 2.5 2.0 2.4 2.7 2.0 2.3 2.8 1.9 3.1 3.7 2.5 3.9 4.8 3.1
Intentional self-harm (X60-84, Y87.0) 0.9 1.3 0.5 0.9 1.3 0.4 1.0 1.5 0.5 1.1 1.6 0.6 1.0 1.6 0.4 1.0 1.5 0.5 1.1 1.6 0.6
18.1 16.1 20.1 18.5 16.8 20.0 21.4 20.3 24.2 22.4 22.6 23.1 24.4 24.2 24.7 24.4 23.5 25.2 25.2 24.8 25.6
Footnotes1) The ICD-9 codes used for dementia and Alzheimer's for the period before 2000 (290 and 331.0) aren't directly comparable with the ICD-10 codes used from 2000 onwards (F01, F03, G30). Care should be taken when interpreting the trend over this period. 2) Affected by the change in coding rules between 2010 and 2011 - refer to the notes on the page which lists all the Section 6 tables.
© Crown Copyright 2017
Dementia and Alzheimer's (F01,F03,G30) 1
Accidents (V01-X59, Y85-86) 2
Other causes 2
Dementia and Alzheimer's (F01,F03,G30) 1
Accidents (V01-X59, Y85-86) 2
Other causes 2
Page 155
Year All agesAge group
< 25 25-34 35-44 45-54 55-64 65-74 75-8485-89 90+
85+
Males - rates per 100,000 population
1950-52 206 9 23 66 234 555 1,066 1,690 1,6331960-62 241 9 20 61 232 664 1,243 1,854 2,1941970-72 272 8 19 56 217 663 1,423 2,150 2,4611980-82 291 7 14 46 189 615 1,423 2,385 2,7831990-92 314 5 10 42 171 576 1,416 2,445 3,3612000-02 315 4 10 31 138 509 1,234 2,305 3,339 4,021 2010-12 309 3 10 27 101 385 1,013 2,105 3,273 3,986
2000 308 4 11 32 127 502 1,242 2,280 3,432 3,634 2001 319 4 7 29 148 524 1,227 2,352 3,381 3,895 2002 319 5 11 33 138 500 1,233 2,284 3,203 4,534 2003 313 4 12 25 121 475 1,164 2,319 3,360 4,351 2004 313 4 10 28 129 442 1,192 2,233 3,320 4,373 2005 311 3 11 33 128 429 1,135 2,266 3,210 3,995 2006 312 5 12 28 120 427 1,105 2,247 3,374 4,217 2007 312 4 9 26 114 426 1,096 2,245 3,113 4,569 2008 307 4 6 29 118 419 1,101 2,056 3,179 4,554 2009 305 2 8 28 112 404 1,065 2,100 3,077 4,087 2010 306 3 10 22 110 401 1,004 2,156 3,102 3,961 2011 311 3 11 29 95 378 1,045 2,125 3,309 4,065 2012 310 3 8 29 98 377 991 2,034 3,408 3,931 2013 314 3 8 26 104 369 971 2,034 3,431 3,916 2014 314 3 6 28 99 369 958 1,967 3,469 3,632 2015 321 3 12 27 111 362 980 1,959 3,115 4,456 2016 316 3 9 28 113 348 929 1,950 3,175 3,986
Females - rates per 100,000 population
1950-52 185 6 21 83 198 394 758 1,228 1,4491960-62 195 6 20 80 212 385 674 1,130 1,5601970-72 218 5 19 68 219 407 688 1,139 1,6601980-82 247 5 17 66 205 441 756 1,148 1,6721990-92 278 4 16 58 183 446 854 1,276 1,7632000-02 281 3 11 42 144 373 803 1,409 1,787 2,138 2010-12 279 2 10 40 120 327 734 1,376 1,880 2,208
2000 284 2 11 45 144 362 835 1,456 1,809 2,107 2001 282 3 10 43 144 389 791 1,421 1,814 2,020 2002 277 4 12 38 145 369 782 1,351 1,738 2,286 2003 284 3 12 40 132 375 800 1,418 1,727 2,426 2004 280 4 13 39 124 354 790 1,391 1,779 2,375 2005 282 3 11 46 131 363 766 1,404 1,813 2,265 2006 277 3 9 39 132 330 776 1,405 1,688 2,202 2007 280 3 12 38 134 340 781 1,355 1,797 2,433 2008 281 3 8 39 116 327 765 1,415 1,935 2,307 2009 276 3 12 39 122 329 743 1,352 1,887 2,285 2010 277 3 7 43 115 325 750 1,380 1,797 2,266 2011 273 3 11 37 124 323 728 1,323 1,865 2,060 2012 288 2 11 39 120 334 725 1,426 1,979 2,299 2013 283 3 11 38 116 318 725 1,349 1,980 2,250 2014 280 3 8 38 113 301 693 1,334 2,052 2,205 2015 279 2 14 30 118 280 703 1,316 2,005 2,376 2016 274 2 10 42 107 279 655 1,313 1,990 2,238
© Crown Copyright 2017
Table 6.06: Death rates from malignant neoplasms (all sites), by sex and age, Scotland, 1950 to 2016
Page 156
Table 6.07: Death rates from malignant neoplasms, by sex, age and selected sites, Scotland, 1950 to 2016
Year All agesAge group
< 25 25-34 35-44 45-54 55-64 65-74 75-8485-89 90+
85+
Males - rates per 100,000 population
1950-52 206 9 23 66 234 555 1,066 1,690 1,6331960-62 241 9 20 61 232 664 1,243 1,854 2,1941970-72 272 8 19 56 217 663 1,423 2,150 2,4611980-82 291 7 14 46 189 615 1,423 2,385 2,7831990-92 314 5 10 42 171 576 1,416 2,445 3,3612000-02 315 4 10 31 138 509 1,234 2,306 3,339 4,0212010-12 309 3 10 27 101 385 1,013 2,105 3,273 3,986
2000 308 4 11 32 127 502 1,242 2,280 3,432 3,6342001 319 4 7 29 148 524 1,227 2,352 3,381 3,8952002 319 5 11 33 138 500 1,233 2,284 3,203 4,5342003 313 4 12 25 121 475 1,164 2,319 3,360 4,3512004 313 4 10 28 129 442 1,192 2,233 3,320 4,3732005 311 3 11 33 128 429 1,135 2,266 3,210 3,9952006 312 5 12 28 120 427 1,105 2,247 3,374 4,2172007 312 4 9 26 114 426 1,096 2,245 3,113 4,5692008 307 4 6 29 118 419 1,101 2,056 3,179 4,5542009 305 2 8 28 112 404 1,065 2,100 3,077 4,0872010 306 3 10 22 110 401 1,004 2,156 3,102 3,9612011 311 3 11 29 95 378 1,045 2,125 3,309 4,0652012 310 3 8 29 98 377 991 2,034 3,408 3,9312013 314 3 8 26 104 369 971 2,034 3,431 3,9162014 314 3 6 28 99 369 958 1,967 3,469 3,6322015 321 3 12 27 111 362 980 1,959 3,115 4,4562016 316 3 9 28 113 348 929 1,950 3,175 3,986
1950-52 8 - - 2 5 19 47 71 761960-62 7 - - 1 4 15 38 75 871970-72 8 - - 1 8 18 44 63 891980-82 12 - 1 2 8 28 53 92 911990-92 15 - - 3 11 36 70 94 1192000-02 19 - - 2 12 39 71 123 127 1342010-12 21 - 1 2 10 38 73 120 142 153
2000 18 - - 3 9 38 72 114 120 1182001 19 - - 2 16 40 71 122 144 1572002 19 - - 2 12 38 69 134 118 1262003 21 - - 2 10 42 77 133 153 2402004 21 - - 3 11 38 77 144 117 2652005 20 - - 2 11 38 72 133 166 1252006 20 - - 3 10 39 72 116 155 1512007 19 - - 1 11 35 71 122 146 1492008 21 - - 3 12 37 80 119 135 1042009 20 - - 1 12 40 67 114 145 1732010 21 - 1 1 10 42 72 117 138 1742011 21 - - 3 9 33 81 120 160 1442012 21 - - 3 10 38 66 122 129 1422013 21 - - 1 12 31 70 109 177 2332014 21 - - 1 8 37 71 100 184 1372015 21 - - 1 10 34 68 110 159 2192016 21 - - 2 11 28 77 107 134 166
Site(ICD Codes)
All sites(C00-97)
Oesophagus(C15)
Page 157
YearAll ages
Age group
< 25 25-34 35-44 45-54 55-64 65-74 75-8485-89 90+
85+
Males - rates per 100,000 population
1950-52 39 - 2 11 41 103 222 333 2721960-62 34 - 1 10 34 84 185 287 3271970-72 29 - 1 5 22 74 148 242 2951980-82 24 - - 3 19 49 125 191 2271990-92 20 - - 2 8 36 94 158 2252000-02 15 - 1 2 6 24 59 116 169 2152010-12 12 - - 1 5 10 39 94 123 148
2000 15 - - 2 6 21 61 118 168 2022001 15 - - 2 5 26 54 118 180 1732002 16 - 1 2 7 25 61 111 160 2712003 15 - - 1 7 22 61 109 153 1882004 15 - 1 1 5 15 58 111 154 2982005 14 - - 2 4 15 52 115 155 1722006 14 - - 2 5 13 53 110 115 1812007 12 - - - 5 11 51 90 155 1052008 12 - - 1 4 16 37 90 153 1492009 13 - - 2 4 15 45 100 111 1012010 13 - - 1 5 11 48 103 113 1742011 11 - - 1 3 11 34 92 111 882012 12 - - 1 6 9 36 86 145 1832013 10 - - - 3 12 27 77 133 1072014 11 - - 1 3 13 28 70 158 2002015 10 - - 1 2 13 29 68 100 962016 10 - 1 1 4 13 24 73 92 92
1950-52 25 - 2 5 17 48 149 310 3121960-62 21 - 1 3 13 44 105 244 3811970-72 20 - 1 5 14 41 99 208 3491980-82 20 - 1 3 10 37 91 204 2901990-92 22 - 1 4 12 35 93 190 3132000-02 21 - 1 2 9 30 81 169 283 2822010-12 18 - 1 1 5 19 58 135 215 283
2000 22 - 1 2 9 27 86 184 270 2362001 21 - - 2 6 33 82 168 306 2672002 21 - - 3 12 31 74 156 272 3432003 21 - 1 1 4 26 75 182 220 2742004 20 - - 2 7 25 80 152 210 4142005 20 - - 1 7 28 70 161 265 2972006 19 - - 1 9 23 59 154 255 2422007 18 - - 1 7 19 58 153 217 3282008 21 - - 3 6 27 76 133 261 3872009 17 - - 1 5 23 57 128 170 2602010 17 - 1 1 5 20 52 124 243 2742011 19 - 1 1 5 18 63 143 226 2102012 19 - 1 1 4 20 59 137 177 3662013 19 - 1 1 5 21 56 144 236 2332014 17 - - 2 5 17 50 117 196 3192015 19 - 1 2 4 20 50 124 251 3242016 19 - - 2 8 18 49 132 209 258
Site(ICD Codes)
Stomach(C16)
Intestine(ex. rectum)(C17, C18)
Page 158
YearAll ages
Age group
< 25 25-34 35-44 45-54 55-64 65-74 75-8485-89 90+
85+
Males - rates per 100,000 population
1950-52 14 - 1 3 10 34 86 147 1361960-62 12 - 1 3 8 25 67 142 2071970-72 12 - 1 2 9 22 61 116 1681980-82 11 - - 1 9 22 53 106 1271990-92 13 - - 2 7 26 55 96 1752000-02 14 - - 1 7 25 57 91 114 2522010-12 15 - 1 1 5 20 46 100 154 207
2000 14 - - - 5 25 58 88 180 1852001 14 - - 2 8 29 49 94 66 2832002 14 - 1 2 8 20 63 90 95 2892003 14 - - 1 8 24 52 100 165 1542004 15 - 1 1 9 18 56 113 154 2322005 15 - 1 2 4 24 65 97 127 1872006 15 - 1 1 6 22 57 108 125 2122007 15 - 1 1 6 26 56 97 127 1942008 13 - - 2 8 20 48 86 112 1492009 17 - 1 1 8 22 57 113 157 2462010 15 - 1 1 4 20 52 107 130 1872011 15 - 1 2 6 21 43 92 160 2322012 15 - 1 1 5 18 42 102 173 2032013 16 - 1 2 7 19 52 98 157 1742014 14 - - 1 6 18 35 91 177 1912015 15 - 1 1 7 21 53 73 125 1752016 16 - - 2 5 17 44 106 124 183
1950-52 48 - 3 20 99 194 191 132 601960-62 86 - 3 20 105 326 454 326 1561970-72 112 - 2 17 98 318 649 680 3491980-82 119 - 1 11 75 288 627 879 6711990-92 111 - 1 7 54 227 563 822 7822000-02 93 - 1 4 35 162 418 680 748 5672010-12 83 - 1 4 24 110 316 564 739 590
2000 91 - 1 4 34 160 404 695 833 5382001 94 - - 4 35 165 423 680 689 5502002 95 - - 3 37 161 428 665 722 6142003 90 - 1 3 31 146 374 678 643 7192004 88 - 1 4 35 139 377 614 654 5962005 89 - - 5 35 138 358 649 696 6242006 87 - 1 4 28 129 353 634 776 5892007 90 - - 5 30 138 337 663 730 6872008 84 - - 3 27 127 337 575 710 5802009 87 - - 6 27 128 336 586 727 6642010 83 - - 4 29 111 311 565 750 6732011 86 - 1 3 22 108 341 582 731 6082012 81 - 1 6 20 110 295 544 737 4882013 82 - - 4 24 102 295 525 762 6592014 82 - - 5 26 95 295 517 673 5832015 79 - - 5 26 89 293 481 586 6922016 79 - - 5 26 94 261 490 658 707
Site(ICD Codes)
Rectum(C19-21)
Trachea, bronchus and
lung (C33, C34)
Page 159
YearAll ages
Age group
< 25 25-34 35-44 45-54 55-64 65-74 75-8485-89 90+
85+
Males - rates per 100,000 population
1950-52 13 - - - 2 16 87 211 2221960-62 16 - - - 1 15 90 283 4071970-72 14 - - - 1 16 73 234 4311980-82 19 - - - 2 17 91 251 4531990-92 27 - - - 2 20 107 332 6132000-02 32 - - - 3 22 104 310 668 1,1192010-12 34 - - - 1 19 80 292 658 1,059
2000 32 - - - 2 21 108 321 701 9932001 32 - - - 3 23 99 317 653 1,0992002 32 - - - 3 23 104 291 651 1,2642003 32 - - - 2 23 99 303 747 1,0452004 33 - - - 2 20 109 302 666 1,0772005 31 - - - 2 15 92 296 669 1,0302006 31 - - - 3 23 83 294 681 8312007 32 - - - 1 18 97 275 570 1,2992008 31 - - - 2 20 88 268 607 1,2062009 31 - - - 2 17 89 282 536 9532010 33 - - - 2 21 80 306 583 9842011 35 - - - 1 18 82 301 673 1,1382012 34 - - - 1 19 77 270 717 1,0562013 34 - - - 3 17 77 272 644 9112014 35 - - - 1 18 88 270 632 7832015 38 - - - 3 21 93 264 564 1,2612016 34 - - - 1 20 75 254 594 874
1950-52 4 3 2 3 4 7 17 13 51960-62 6 3 2 3 5 9 25 30 441970-72 7 2 2 3 5 11 28 49 571980-82 6 2 1 2 5 9 23 52 631990-92 6 1 1 2 4 9 22 45 502000-02 8 1 1 2 2 10 27 54 90 1102010-12 9 1 1 1 2 10 28 62 71 163
2000 7 1 1 1 1 10 24 53 78 672001 8 1 - 1 3 12 30 53 90 632002 8 2 2 4 2 8 29 54 101 1992003 8 1 2 2 3 6 25 67 98 342004 7 1 2 1 3 9 23 45 136 172005 8 1 2 1 3 7 29 52 99 1092006 8 1 1 1 2 8 27 62 105 1362007 8 1 1 1 4 8 30 59 75 1492008 8 1 - 1 2 8 30 61 99 742009 9 1 1 2 3 9 30 68 102 1162010 9 - - 1 1 12 26 75 59 1992011 9 1 1 1 3 9 30 62 74 2102012 8 1 - 1 2 8 28 48 81 812013 9 - 1 2 2 7 26 65 102 1262014 8 - 1 1 2 7 22 64 68 1002015 9 - 1 - 3 6 25 66 74 1052016 9 - 1 1 2 5 31 64 64 117
Site(ICD Codes)
Prostate(C61)
Leukaemia(C91-95)
Page 160
Table 6.7 (continued)Year
All agesAge group
< 25 25-34 35-44 45-54 55-64 65-74 75-8485-89 90+
85+
Females - rates per 100,000 population
1950-52 185 6 21 83 198 394 758 1,228 1,4491960-62 195 6 20 80 212 385 674 1,130 1,5601970-72 218 5 19 68 219 407 688 1,139 1,6601980-82 247 5 17 66 205 441 756 1,148 1,6721990-92 278 4 16 58 183 446 854 1,276 1,7632000-02 281 3 11 42 144 373 802 1,409 1,787 2,1382010-12 279 2 10 40 119 327 734 1,376 1,880 2,208
2000 284 2 11 45 144 362 835 1,456 1,809 2,1072001 282 3 10 43 144 389 791 1,421 1,814 2,0202002 277 4 12 38 145 369 782 1,351 1,738 2,2862003 284 3 12 40 132 375 800 1,418 1,727 2,4262004 280 4 13 39 124 354 790 1,391 1,779 2,3752005 282 3 11 46 131 363 766 1,404 1,813 2,2652006 277 3 9 39 132 330 776 1,405 1,688 2,2022007 280 3 12 38 134 340 781 1,355 1,797 2,4332008 281 3 8 39 116 327 765 1,415 1,935 2,3072009 276 3 12 39 122 329 743 1,352 1,887 2,2852010 277 3 7 43 115 325 750 1,380 1,797 2,2662011 273 3 11 37 124 323 728 1,323 1,865 2,0602012 288 2 11 39 120 334 725 1,426 1,979 2,2992013 283 3 11 38 116 318 725 1,349 1,980 2,2502014 280 3 8 38 113 301 693 1,334 2,052 2,2052015 279 2 14 30 118 280 703 1,316 2,005 2,3762016 274 2 10 42 107 279 655 1,313 1,990 2,238
1950-52 5 - - 1 4 10 23 54 341960-62 5 - - 1 4 9 22 35 711970-72 7 - - 1 4 10 22 47 801980-82 9 - - 1 4 13 28 53 731990-92 11 - - 1 4 15 31 62 1042000-02 11 - - - 3 10 29 65 93 1042010-12 10 - - - 2 10 26 59 87 84
2000 11 - - - 3 12 29 64 77 1032001 11 - - 1 3 7 30 67 87 1002002 11 - - - 4 11 29 63 115 1092003 10 - - - 2 11 24 63 85 1502004 11 - - - 3 12 31 57 103 1192005 11 - - 1 3 10 33 69 64 1182006 10 - - - 2 12 25 71 56 852007 11 - - - 2 10 33 69 88 772008 12 - - - 4 10 27 67 100 1152009 9 - 1 - 2 10 25 46 63 872010 10 - - - 3 10 23 65 90 622011 10 - - - 2 9 30 60 84 732012 10 - - - 1 12 25 52 86 1182013 11 - - 1 4 8 23 60 80 1242014 11 - - 1 3 8 25 67 104 952015 10 - - - 2 10 22 51 78 852016 10 - - 1 3 12 19 55 62 72
Site(ICD Codes)
All sites(C00-97)
Oesophagus(C15)
Page 161
YearAll ages
Age group
< 25 25-34 35-44 45-54 55-64 65-74 75-8485-89 90+
85+
Females - rates per 100,000 population
1950-52 32 - 2 8 20 60 159 279 3161960-62 27 - 1 5 15 42 110 219 3641970-72 23 - 1 3 10 31 79 166 2591980-82 18 - 1 2 6 18 56 114 1801990-92 14 - - 1 4 18 40 79 1182000-02 11 - 1 2 3 8 27 66 81 932010-12 7 - - 1 2 5 15 42 59 54
2000 11 - 1 1 3 8 29 70 89 892001 12 - - 1 2 10 33 75 98 962002 9 - 1 3 3 7 19 53 55 942003 8 - - - 1 4 22 51 57 1222004 10 - 1 1 4 5 28 51 90 1242005 9 - - 1 4 7 23 62 60 812006 8 - - 2 2 6 22 42 74 852007 8 - - 1 3 8 16 41 60 822008 8 - - 1 3 5 20 45 69 872009 8 - - 1 4 6 18 49 63 512010 6 - 1 1 2 4 18 35 52 372011 7 - - 1 2 5 12 48 59 652012 7 - - 1 2 4 14 42 67 592013 8 - 1 1 3 7 18 47 67 552014 7 - - 1 2 7 12 36 79 562015 7 - 1 2 2 4 14 32 61 702016 5 - - 1 2 5 6 25 58 38
1950-52 29 - 1 7 22 49 127 287 3821960-62 26 - 2 6 16 47 94 207 3421970-72 29 - 1 3 14 47 90 199 3601980-82 26 - 1 4 11 34 71 161 2851990-92 24 - - 2 10 30 68 134 2242000-02 20 - 1 1 6 19 51 113 203 2342010-12 17 - - 1 6 15 36 90 148 220
2000 21 - - 1 6 17 53 119 220 2372001 22 - 1 2 6 21 52 117 227 2432002 18 - - 1 6 19 47 102 161 2222003 19 - - 2 6 21 44 103 180 2112004 18 - - 1 4 15 44 100 165 2202005 19 - - 1 10 18 43 100 181 1812006 18 - - 1 6 17 42 99 165 2102007 18 - 1 2 9 17 41 84 165 2362008 17 - - 1 5 19 49 84 133 2022009 16 - - 1 7 16 36 82 157 2252010 17 - - 1 6 16 37 86 151 2432011 17 - 1 1 6 18 31 90 162 1952012 17 - 1 1 7 12 39 93 131 2222013 17 - - 1 6 17 32 88 183 2012014 18 - - - 6 17 31 95 178 2352015 18 - - 1 6 15 35 84 188 2472016 19 - 1 2 7 13 41 86 175 248
Site(ICD Codes)
Stomach(C16)
Intestine (ex. Rectum) (C17, C18)
Page 162
YearAll ages
Age group
< 25 25-34 35-44 45-54 55-64 65-74 75-8485-89 90+
85+
Females - rates per 100,000 population
1950-52 9 - 1 2 8 19 43 58 581960-62 9 - - 2 8 18 33 64 861970-72 10 - - 1 6 15 34 61 1131980-82 10 - - 1 5 14 29 55 1071990-92 10 - - 2 5 15 29 53 912000-02 9 - - 1 4 11 24 49 78 1002010-12 11 - - 2 6 13 25 55 92 102
2000 9 - - 1 4 10 24 46 73 982001 9 - 1 - 3 13 23 49 77 1092002 10 - 1 1 6 9 24 53 84 942003 11 - - - 8 14 27 55 77 1412004 11 - 1 1 4 11 26 56 85 1332005 9 - - - 5 10 19 48 83 772006 10 - - 2 4 12 25 52 69 1252007 11 - - - 3 11 29 56 84 1272008 11 - - 2 5 13 28 52 92 1422009 12 - - 1 7 12 32 54 94 872010 11 - - 1 6 13 20 54 94 1032011 10 - 1 1 5 12 28 46 80 922012 13 - - 2 6 15 26 66 101 1112013 10 - - 2 4 11 20 49 86 772014 11 - - 2 6 12 24 43 85 1442015 10 - 1 1 4 10 20 55 65 922016 11 - - 2 5 11 21 48 105 93
1950-52 10 - 1 6 12 29 40 50 241960-62 13 - 1 6 17 32 50 60 421970-72 24 - 1 8 33 61 77 94 761980-82 41 - 1 6 37 103 155 138 1071990-92 57 - - 6 32 106 239 233 1832000-02 64 - - 4 29 91 242 332 256 2072010-12 74 - - 3 23 98 241 378 402 299
2000 65 - 1 6 33 88 247 343 241 2332001 62 - - 3 28 90 232 324 248 1952002 65 - 1 4 27 94 246 329 278 1942003 65 - 1 4 22 93 225 349 297 2162004 67 - 1 5 26 97 221 367 312 1982005 68 - - 5 23 100 225 373 317 2402006 71 - - 5 24 106 243 371 361 1922007 70 - - 3 27 93 245 365 332 2902008 73 - 1 3 26 93 249 396 359 2762009 72 - - 6 24 94 246 377 385 2482010 72 - - 4 24 95 247 377 314 2922011 72 - - 2 22 96 242 366 427 2832012 77 - - 4 21 104 235 390 465 3212013 73 - - 2 19 93 235 364 439 2672014 73 - - 2 19 92 230 362 404 3192015 71 - - 3 19 80 230 351 399 3602016 70 - - 4 17 76 208 367 429 355
Site(ICD Codes)
Rectum(C19-21)
Trachea, bronchus and
lung(C33, C34)
Page 163
YearAll ages
Age group
< 25 25-34 35-44 45-54 55-64 65-74 75-8485-89 90+
85+
Females - rates per 100,000 population
1950-52 31 - 2 22 48 66 110 151 1811960-62 35 - 3 23 59 75 99 154 2371970-72 40 - 5 24 62 86 110 151 2401980-82 45 - 4 26 67 97 114 151 2341990-92 48 - 5 19 58 90 119 177 2812000-02 43 - 2 15 44 72 99 161 244 3452010-12 38 - 2 13 33 57 81 147 228 302
2000 42 - 2 17 43 71 108 151 260 3002001 43 - 2 15 47 80 90 170 232 3392002 42 - 3 12 41 66 99 161 240 3972003 43 - 3 14 38 74 105 166 200 4182004 41 - 3 14 32 67 104 143 250 4002005 43 - 2 15 41 71 89 161 250 4482006 42 - 2 13 35 59 103 177 185 3842007 40 - 3 12 34 65 91 144 231 3852008 39 - 1 15 30 54 86 154 252 3862009 37 - 3 14 29 56 80 149 175 4092010 38 - 1 12 28 56 79 158 232 3382011 38 - 2 15 35 57 83 142 200 2802012 39 - 2 11 36 58 81 143 253 2882013 37 - 3 10 31 52 76 142 198 3542014 35 - 2 14 26 50 70 133 234 2662015 36 - 3 10 32 43 74 128 215 3982016 37 - 2 16 30 40 67 132 256 434
1950-52 4 2 2 3 4 7 9 10 101960-62 5 2 1 2 4 10 15 17 161970-72 5 2 1 2 4 7 12 27 261980-82 5 1 1 2 3 5 14 26 401990-92 5 1 2 2 3 6 13 24 372000-02 6 1 1 1 3 6 12 29 46 492010-12 6 1 1 1 2 5 13 35 41 79
2000 6 1 1 2 4 4 11 37 54 492001 6 1 - 1 3 8 15 25 59 562002 5 1 - 1 3 5 10 26 46 492003 7 1 1 1 3 7 17 26 67 752004 7 1 2 1 2 6 16 33 52 732005 6 1 1 1 2 5 18 28 45 542006 6 1 1 1 2 4 10 36 45 672007 5 1 - 1 2 4 15 21 49 592008 6 - 1 - 2 3 14 32 52 602009 6 - 1 1 2 6 14 29 43 602010 6 1 1 2 2 4 13 34 40 872011 6 1 - - 1 5 14 35 42 572012 6 1 1 - 2 4 13 35 40 922013 5 - - 1 1 4 12 28 38 802014 6 - 1 - 2 4 13 26 37 742015 6 - 1 1 3 3 12 29 61 602016 6 - - 1 1 6 12 31 58 72
© Crown Copyright 2017
Site(ICD Codes)
Breast (C50)
Leukaemia(C91-95)
Page 164
Table 6.08: Death rates from ischaemic heart disease, by sex and age, Scotland, 1950 to 2016
Year All agesAge group
< 25 25-34 35-44 45-54 55-64 65-74 75-8485-89 90+
85+
Males - rates per 100,000 population
1950-52 276 - 6 46 212 632 1,428 3,254 7,1611960-62 360 - 9 72 300 836 1,795 3,601 7,8141970-72 407 - 9 85 351 911 1,955 3,702 6,8901980-82 408 - 6 64 333 863 1,851 3,427 5,2391990-92 367 - 4 43 199 642 1,577 3,051 4,9322000-02 261 - 3 28 118 347 908 2,077 3,696 5,1622010-12 171 - 3 22 79 191 455 1,126 2,383 3,766
2000 270 - 4 29 127 383 977 2,180 3,755 4,4752001 257 - 2 27 118 341 901 2,024 3,639 5,2142002 254 - 4 29 110 316 847 2,027 3,694 5,7982003 254 - 4 29 94 320 848 1,971 3,678 6,1492004 238 - 5 27 97 288 745 1,845 3,579 5,5992005 229 - 2 29 91 276 723 1,755 3,160 4,9472006 206 - 4 29 97 247 604 1,499 2,803 5,2152007 211 - 5 31 93 255 624 1,489 2,939 4,8972008 193 - 4 23 86 235 569 1,350 2,658 4,2862009 182 - 3 22 86 205 495 1,254 2,691 4,3762010 180 - 3 22 84 201 487 1,233 2,431 4,3972011 168 - 2 24 76 184 448 1,112 2,377 3,5792012 165 - 4 20 77 187 428 1,032 2,340 3,3222013 161 - 4 21 74 179 400 1,021 1,963 3,4802014 154 - 3 23 68 149 381 948 1,964 3,4222015 160 - 3 21 63 168 393 940 2,120 3,4752016 149 - 3 17 70 164 357 885 1,697 3,087
Females - rates per 100,000 population
1950-52 203 - 1 9 44 227 832 2,482 6,1651960-62 262 - 2 12 62 287 939 2,640 6,5281970-72 289 - 2 19 84 314 898 2,327 5,1281980-82 304 - 1 13 78 302 924 2,026 3,7511990-92 297 - 1 10 51 243 760 1,852 3,6442000-02 215 - 1 7 29 115 426 1,274 2,564 4,1232010-12 124 - 1 5 19 50 192 660 1,527 2,757
2000 222 - 1 8 29 130 446 1,353 2,587 3,9192001 215 - 1 5 28 108 425 1,256 2,631 4,0622002 209 - 1 7 29 106 407 1,214 2,474 4,3882003 199 - - 7 25 101 369 1,127 2,380 4,6552004 188 - 2 6 23 85 337 1,098 2,318 4,2262005 178 - 1 6 25 78 319 1,020 2,144 3,9242006 167 - 1 7 21 82 293 907 1,991 3,8862007 153 - 1 5 25 73 267 829 1,881 3,3802008 148 - - 7 23 71 243 802 1,803 3,5302009 136 - 2 7 23 64 213 731 1,671 3,2192010 130 - 1 7 18 58 213 693 1,565 3,0032011 121 - 1 4 23 44 182 660 1,442 2,7952012 120 - 2 5 17 47 182 628 1,573 2,4722013 113 - 1 5 18 48 156 575 1,369 2,5682014 105 - 1 8 16 51 141 520 1,250 2,3112015 108 - - 7 15 44 148 530 1,297 2,4642016 100 - 1 5 13 49 160 452 1,254 2,096
© Crown Copyright 2017
Page 165
Table 6.09: Death rates from cerebrovascular disease, by sex and age, Scotland, 1950 to 2016
Year All agesAge group
< 25 25-34 35-44 45-54 55-64 65-74 75-8485-89 90+
85+
Males - rates per 100,000 population
1950-52 155 2 5 12 58 259 883 2,331 4,0731960-62 166 2 5 14 58 232 843 2,552 4,9031970-72 158 2 5 18 52 207 761 2,149 5,0231980-82 139 1 4 12 42 156 590 1,709 3,9611990-92 119 1 2 9 30 105 406 1,366 3,0922000-02 101 - 3 7 22 66 264 948 2,540 4,1102010-12 69 1 2 6 12 38 134 551 1,395 2,655
2000 105 - 2 7 22 68 293 1,028 2,540 3,7012001 100 - 4 8 22 69 251 941 2,434 4,0052002 99 1 2 5 24 61 247 874 2,646 4,6242003 99 - 3 7 24 59 236 873 2,515 4,7622004 94 - 2 7 17 59 208 851 2,320 4,5722005 87 - 2 7 19 44 188 813 1,956 3,7612006 83 - 3 8 20 52 179 704 1,927 3,4762007 82 - 2 6 23 45 172 668 1,879 3,6882008 82 - 3 8 22 49 182 648 1,767 3,3342009 73 - 1 8 16 41 149 564 1,675 3,0762010 74 1 1 8 14 39 139 624 1,517 2,8522011 69 - 2 5 11 39 147 516 1,604 3,1432012 65 - 2 5 12 37 115 514 1,289 2,4182013 69 - 2 4 13 35 124 508 1,331 2,5982014 62 - - 5 10 33 104 431 1,253 2,3762015 66 - 1 6 12 34 109 456 1,305 2,4252016 65 - 1 4 14 38 106 433 1,216 2,355
Females - rates per 100,000 population
1950-52 213 1 5 19 89 332 1,127 3,175 8,1311960-62 230 2 4 16 64 238 1,109 3,771 9,5441970-72 226 1 5 16 59 165 593 2,043 5,0041980-82 210 1 4 14 42 122 440 1,551 4,0771990-92 191 - 2 9 26 83 307 1,234 3,4052000-02 162 - 2 7 17 56 196 844 2,418 4,7812010-12 104 - 1 4 12 26 100 497 1,519 3,117
2000 162 1 2 7 17 54 212 873 2,390 4,5372001 159 - 1 7 19 60 191 814 2,338 4,6572002 164 - 1 6 16 56 184 845 2,527 5,1492003 155 - 1 9 14 46 178 794 2,455 4,9462004 146 1 3 6 19 39 156 774 2,194 4,7492005 138 - 1 7 15 39 148 717 1,851 4,7432006 128 1 1 3 15 39 129 646 1,887 4,1012007 123 - 2 5 16 33 123 617 1,771 4,0512008 123 - 2 5 13 37 125 632 1,791 3,8792009 114 - 1 6 16 32 117 560 1,573 3,7802010 106 - 1 3 12 30 98 527 1,604 3,1432011 104 1 1 4 12 25 99 498 1,524 3,1052012 102 - 1 4 14 23 103 465 1,430 3,1042013 97 - 2 4 10 29 100 454 1,390 2,7582014 92 - 1 3 12 24 83 410 1,299 2,6572015 93 - 1 5 10 23 86 427 1,178 2,8972016 87 - 1 6 10 26 86 400 1,169 2,413
© Crown Copyright 2017
Page 166
Year All agesAge group
0-4 5-14 15-34 35-64 65+
Both sexes
1946-50 549 69 102 118 140 119 1951-55 571 58 89 144 160 118 1956-60 627 45 66 161 219 136 1961-65 754 50 80 207 259 158 1966-70 835 44 83 257 282 170 1971-75 868 37 83 277 280 191 1976-80 829 20 61 313 252 183 1981-85 675 12 52 279 188 144 1986-90 576 13 36 239 159 129 1991-95 438 9 26 183 122 98
1996-2000 363 5 19 150 118 71 2001-05 332 2 12 138 117 64 2006-10 271 2 8 108 100 54 2011-15 194 1 4 59 81 49
2012 189 1 3 56 80 49 2013 185 1 5 64 67 48 2014 212 2 5 57 90 58 2015 181 - 5 51 79 46 2016 199 3 9 75 70 42
Males
1946-50 394 48 67 98 105 76 1951-55 422 39 61 123 122 76 1956-60 467 27 44 138 172 86 1961-65 549 31 57 175 195 90 1966-70 592 27 57 211 209 88 1971-75 613 23 59 224 206 101 1976-80 588 12 44 254 183 95 1981-85 481 6 35 226 144 69 1986-90 412 8 25 194 115 70 1991-95 305 5 16 143 88 53
1996-2000 255 3 12 119 84 36 2001-05 242 1 7 109 90 35 2006-10 200 1 6 86 77 32 2011-15 142 1 3 47 64 27
2012 140 1 2 47 64 26 2013 132 - 4 50 53 25 2014 151 1 4 46 68 32 2015 138 - 4 43 67 24 2016 138 1 5 56 50 26
Females
1946-50 155 21 35 20 35 43 1951-55 149 19 28 21 38 42 1956-60 160 18 22 23 47 50 1961-65 205 19 23 32 64 68 1966-70 243 17 26 46 73 82 1971-75 255 14 24 53 74 90 1976-80 241 8 17 59 69 88 1981-85 194 6 17 53 44 75 1986-90 164 5 11 45 44 59 1991-95 133 4 10 40 34 45
1996-2000 108 2 6 31 34 34 2001-05 90 1 4 29 26 29 2006-10 71 1 2 22 23 23 2011-15 52 - 1 11 17 23
2012 49 - 1 9 16 23 2013 53 1 1 14 14 23 2014 61 1 1 11 22 26 2015 43 - 1 8 12 22 2016 61 2 4 19 20 16
Footnote
© Crown Copyright 2017
Table 6.10: Deaths from road transport accidents 1, by sex and age, Scotland, 1946 to 2016
1) For 2000 onwards, ICD-10 codes V01-V80, V87, V89 and Y850 are used to produce the number of deaths from 'road transport' accidents. These codes relate to the types of transport used, rather than the location of the accidents, so these figures will include (for example) deaths from accidents involving cars in car parks and other 'off-road' locations.
Page 167
Table 6.11: Intentional self-harm and events of undetermined intent¹, Scotland, 1981 to 2016
ICD CodesCause of death 1981 1986 1991 1996 2001 2006 2011 2016
ICD9 list ICD10 list
Intentional self harm
Males 340 410 394 435 441 427 393 439
E950-E952 X60-69 poisoning 141 155 187 170 101 98 58 56 E953 X70 hanging, strangulation and suffocation 99 131 120 179 256 249 270 294 E954 X71 drowning and submersion 33 31 28 12 21 14 12 17 E955 X72-75 firearms and explosives 23 27 18 10 8 9 5 2 E957 X80 jumping from a high place 16 26 19 20 27 21 25 28
other and unspecified means 28 40 22 44 28 36 23 42
Females 177 158 131 161 168 115 134 164
E950-E952 X60-69 poisoning 96 80 72 94 95 48 44 63 E953 X70 hanging, strangulation and suffocation 20 17 21 30 39 36 63 64 E954 X71 drowning and submersion 34 30 14 15 11 11 8 13 E955 X72-75 firearms and explosives - 4 1 1 - - 1 - E957 X80 jumping from a high place 14 21 13 7 11 6 11 14
other and unspecified means 13 6 10 14 12 14 7 10
Males 132 133 129 185 205 165 246 78
E980-E982 Y10-19 66 35 62 62 75 78 177 50 E983 Y20 hanging, strangulation and suffocation 1 2 2 1 - - 6 - E984 Y21 drowning and submersion 34 59 45 56 58 39 26 6 E985 Y22-25 firearms and explosives 1 6 1 4 1 1 2 1 E987 Y30 jumping from a high place 20 16 9 25 27 14 11 10
other and unspecified means 10 15 10 37 44 33 24 11
Females 79 64 52 64 73 58 116 47
E980-E982 Y10-19 46 38 34 27 54 41 95 32 E983 Y20 hanging, strangulation and suffocation 3 - 1 1 - 1 - - E984 Y21 drowning and submersion 19 16 11 7 8 8 9 - E985 Y22-25 firearms and explosives - 1 - - - - 1 - E987 Y30 jumping from a high place 5 3 3 5 4 5 6 8
other and unspecified means 6 6 3 24 7 3 5 7
Footnotes
© Crown Copyright 2017
E956, E958, E959
X76-79, X81-84, Y87.0
E956, E958, E959
X76-79, X81-84, Y87.0
Events of undetermined intent 2
poisoning2
E986, E988, E989
Y26-29, Y31-34, Y87.2
poisoning2
E986, E988, E989
Y26-29, Y31-34, Y87.2
1) During 2009, there was a change to the way in which National Records of Scotland (NRS) was told which deaths should be counted as suicides. This changed the balance between the number of deaths counted as being due to 'events of undetermined intent' and 'intentional self-harm' but appears to have had little effect on the overall total of the two categories taken together. Further information is available from the 'Probable Suicides' section on the NRS website.
2) Following a World Health Organisation update to the International Statistical Classification of Diseases and Related Health Problems, which NRS implemented for 2011, 'alcohol / drug abuse' deaths from 'acute intoxication' that would previously have been counted under 'mental & behavioural disorders' are now counted under 'poisoning' - so more deaths are counted under 'undetermined intent'. (Note: 'intentional self-harm' drug deaths were always counted as such, so those figures are unaffected.)
A note on the changes to the coding is available in the Background Information section of the NRS website.
Estimates of figures on the basis of the old coding rules are available in the Suicides section of the NRS website.
Page 168
Table 6.12: Deaths from poisoning, by sex and cause, Scotland, 2016
Both Males Females
1130 766 364
ACCIDENTS 850 607 243X40 - X49 Accidental poisoning by and exposure to …
X40 - Nonopioid analgesics, antipyretics and antirheumaticsParacetamol 2 1 1Paracetamol, Cocaine, Amphetamine || 1 0 1
X41 - Antiepileptic, sedative-hypnotic, antiparkinsonism and psychotropic drugs, not elsewhere classifiedAlprazolam, MDMA, Cocaine || Cannabis, Alcohol 1 1 0Alprazolam, Methadone || Pregabalin, Tramadol, Gabapentin, Cannabis 1 1 0Alprazolam, Morphine, Heroin, Dihydrocodeine, Buprenorphine || Alcohol 1 1 0Alprazolam, Oxycodone, Alcohol || Paracetamol 1 0 1Amitriptyline, Cocaine, Etizolam || Paracetamol, Codeine, Hydrocodone, Alcohol 1 1 0Amitriptyline, Dihydrocodeine || Diazepam, Paracetamol, Verapamil, Alcohol 1 1 0Amitriptyline, Fluoxetine, Alcohol 1 0 1Amitriptyline, Methadone, Diazepam || 1 1 0Amitriptyline, Methadone, Morphine, Etizolam || Gabapentin, Cannabis, Alcohol 1 1 0Amitriptyline, Venlafaxine 1 0 1Amphetamine 1 1 0Amphetamine || 1 1 0Amphetamine || Alcohol 1 1 0Amphetamine || Chlorpromazine 1 1 0Amphetamine || Fluoxetine 1 1 0Amphetamine, Dihydrocodeine, Alcohol || Procyclidine, Tramadol, Duloxetine, Haloperidol 1 0 1Amphetamine, MDMA || Diclazepam, Cannabis, Alcohol 1 1 0Amphetamine, Methadone || 1 1 0Amphetamine, Oxycodone, Gabapentin, Zopiclone, Diazepam || Paracetamol, Alcohol 1 0 1Amphetamine, Tramadol || Mirtazapine, Alcohol 1 1 0Benzodiazepine || 1 1 0Chlorpromazine, Venlafaxine || Alcohol 1 1 0Citalopram, Alcohol 2 0 2Diazepam, Cocaine || Methadone, Alcohol 1 1 0Diazepam, Dihydrocodeine, Mirtazapine, Sertraline || Cannabis 1 1 0Diazepam, Etizolam, Alcohol 1 0 1Diazepam, Gabapentin || Pregabalin, Dihydrocodeine, Morphine 1 1 0Diazepam, Heroin, Methadone, Alcohol || Cannabis 1 1 0Diazepam, Methadone || Sertraline, Amitriptyline 1 0 1Diclazepam, Codeine, Gabapentin || Pregabalin, Paracetamol, Alcohol 1 0 1Diclazepam, Etizolam, Alcohol || 1 0 1Diclazepam, Etizolam, Morphine, Methadone || Promethazine, Cannabis 1 1 0Ecstasy || Benzoylecgonine, Levamisole, Naloxone 1 1 0Etizolam, Alcohol || Cannabis 1 1 0Etizolam, Cocaine || Mirtazapine, Paracetamol, Levetiracetam, Cannabis 1 1 0Etizolam, Diclazepam, Methadone, Dihydrocodeine || Codeine, Pregabalin, Cocaine 1 1 0Etizolam, Gabapentin, Amitriptyline, Codeine || Zopiclone, Mirtazapine, Diazepam, Paracetamol 1 0 1Etizolam, Heroin || 1 0 1Etizolam, Methadone || Benzodiazepine 1 1 0Etizolam, Methadone || Lamotrigine, Mirtazapine, Pregabalin 1 0 1Etizolam, Methadone || Olanzapine 1 0 1Etizolam, Methadone || Pregabalin, Nitrazepam, Mirtazapine, Naproxen, Codeine, Quinine 1 1 0Etizolam, Methadone, Fluoxetine || Dihydrocodeine, Paracetamol, Alcohol 1 0 1Etizolam, Methadone, Gabapentin || Amisulpride, Venlafaxine 1 1 0Etizolam, Methadone, Gabapentin, Tramadol || Paroxetine, Lorazepam, Cannabis 1 1 0Etizolam, Morphine || Cocaine 1 0 1Etizolam, Morphine, Cocaine || Alcohol 1 1 0Etizolam, Pregabalin, Alcohol 1 1 0Fluoxetine, Alcohol || Diazepam, Pregabalin 1 0 1Fluoxetine, Olanzapine || 1 0 1Gabapentin, Alcohol 1 0 1Gabapentin, Diazepam, Dihydrocodeine, Co-codamol || Amitriptyline, Ketamine, Paracetamol, Lignocaine 1 1 0Gabapentin, Etizolam, Diclazepam, Cocaine || Alcohol 1 1 0Gabapentin, Etizolam, Methadone || Diazepam, Sertraline, Cannabis, Alcohol 1 0 1Gabapentin, Methadone || 1 1 0Gabapentin, Methadone || Amitriptyline, Etizolam, Mirtazapine, Alcohol 1 0 1Gabapentin, Methadone, Diclazepam, Cloxazolam || Mirtazapine, Amitriptyline 1 0 1Gabapentin, Methadone, Etizolam 1 0 1Gabapentin, Methadone, Etizolam || Cannabis, Morphine, Diazepam, Amitriptyline 1 0 1Gabapentin, Methadone, Etizolam || Diazepam, Paracetamol 1 1 0Gabapentin, Methadone, Etizolam || Zopiclone, Cannabis 1 1 0Gabapentin, Methadone, Heroin || Etizolam, Diazepam, Cocaine, Cannabis 1 0 1Gabapentin, Methadone, Mirtazapine, Alcohol || Cannabis 1 0 1Gabapentin, Methadone, Morphine || Cannabis, Tramadol, Sertraline 1 0 1Gabapentin, Methadone, Morphine, Diazepam, Alprazolam || 1 0 1
ICD code(s), cause of death and substance(s) 1
ALL DEATHS FROM POISONING 2
Page 169
Both Males FemalesICD code(s), cause of death and substance(s) 1
Gabapentin, Methadone, Morphine, Etizolam || 1 1 0Gabapentin, Morphine, Methadone, Etizolam || Amitriptyline 1 1 0Gabapentin, Pregabalin, Methadone, Benzodiazepine, Cocaine || Amitriptyline 1 0 1Gabapentin, Pregabalin, Morphine, Methadone || Diazepam, Mirtazapine, Alcohol 1 1 0Lamotrigine 1 1 0Lorazepam, Delorazepam, Cannabis, Propranolol, Alcohol || 1 1 0MDMA 1 1 0MDMA || 4 3 1MDMA || Alcohol 1 1 0MDMA || Alprazolam, Diazepam, Chlorpromazine, MDA, Alcohol 1 1 0MDMA || Cannabis 1 1 0MDMA || MDA, Cannabis 1 0 1MDMA || MDA, Cannabis, Alcohol 1 1 0MDMA, Amphetamine || Alcohol 1 1 0MDMA, Amphetamine, Cocaine, Buprenorphine, Diazepam || Clozapine, Cannabis 1 1 0MDMA, Cocaine || Alcohol 1 0 1MDMA, Cocaine, Alcohol || 2 2 0MDMA, MDA, 4F-EPH || Lignocaine, Alcohol 1 1 0MDMA, PMMA, PMA || Cannabis 1 1 0MXP || Citalopram, Cannabis, Alcohol 1 0 1Mirtazapine, Alprazolam 1 0 1PMMA, PMA, Amphetamine || 1 0 1Pregabalin, Diazepam, Alcohol || 1 1 0Pregabalin, Methadone || Diazepam, Quetiapine, Cannabis 1 1 0Pregabalin, Methadone, Cocaine || Diazepam, Gabapentin, Cannabis, Alcohol 1 0 1Pregabalin, Paracetamol 1 1 0Sedative, Benzodiazepine, Pregabalin, Zopiclone, Methadone, Fluoxetine || Amlodipine, Salbutamol 1 0 1Sedative, Buprenorphine, Alprazolam, Gabapentin, Lamotrigine || Cocaine, Alcohol 1 1 0Sedative, Co-codamol, Dihydrocodeine, Temazepam, Zopiclone || 1 0 1Sedative, Diamorphine, Diazepam, Methadone, Gabapentin || Quetiapine, Promethazine, Alcohol 1 1 0Sedative, Diazepam, Diamorphine, Morphine, Methadone || Cyclizine 1 1 0Sedative, Diazepam, Heroin, Morphine, Methadone || Paracetamol, Cannabis 1 0 1Sedative, Diazepam, Methadone, Sertraline, Cyclizine || Temazepam, Oxazepam 1 0 1Sedative, Diazepam, Pregabalin, Dihydrocodeine, Methadone || Salbutamol 1 1 0Sedative, Diazepam, Zopiclone, Methadone || Benzoylecgonine, Levamisole 1 0 1Sedative, Diazepam, Zopiclone, Methadone || Gabapentin, Quetiapine, Mirtazapine, Alcohol 1 0 1Sedative, Gabapentin, Diazepam, Mirtazapine, Zopiclone, Methadone || 1 1 0Sedative, Methadone, Diazepam, Pregabalin, Sertraline || Cannabis 1 0 1
Sedative, Methadone, Dihydrocodeine, Diazepam, Diphenhydramine, Olanzapine, Buprenorphine || Paracetamol, Naloxone 1 1 0
Sedative, Morphine, Codeine, Dihydrocodeine, Zopiclone || Ibuprofen, Mirtazapine, Alcohol 1 0 1Sedative, Morphine, Heroin, Diazepam, Alprazolam, Methadone, Amitriptyline || Paracetamol, Cocaine 1 1 0Sedative, Morphine, Heroin, Diazepam, Fluoxetine || Paracetamol, Alcohol 1 1 0Sedative, Morphine, Heroin, Dihydrocodeine, Methadone, Diazepam || Amitriptyline, Mirtazapine 1 1 0Sedative, Morphine, Heroin, Methadone, Diazepam || Salbutamol, Alcohol 1 1 0Sedative, Morphine, Heroin, Tramadol, Diazepam || Naloxone, Buprenorphine, Alcohol 1 1 0Sertraline 1 1 0Sertraline, Alcohol 1 1 0Sertraline, Pregabalin || Paracetamol, Codeine, Citalopram, Phenethazine, Mirtazapine, Alcohol 1 0 1Venlafaxine 1 0 1Zopiclone, Cyclizine, Dipipanone, Diazepam, Pregabalin, Fluoxetine, Methadone, Cocaine || Paracetamol 1 1 0
X42 - Narcotics and psychodysleptics [hallucinogens], not elsewhere classifiedBuprenorphine, Diclazepam || Amphetamine, Mirtazapine 1 1 0Buprenorphine, Diclazepam, Alcohol || Cannabis 1 1 0
1 0 1
Buprenorphine, Etizolam || Cannabis, Alcohol 1 1 0Buprenorphine, Etizolam, Alcohol || Chlorpheniramine 1 0 1Buprenorphine, Etizolam, Delorazepam || Pregabalin, Sertraline 1 0 1Buprenorphine, Etizolam, Gabapentin, Alcohol || Mirtazapine 1 0 1Buprenorphine, Etizolam, Morphine || 1 1 0Buprenorphine, Gabapentin, Etizolam || Propranolol, Sertraline, Alcohol 1 1 0Buprenorphine, Methadone, Etizolam, Diazepam, Diclazepam || Cannabis 1 0 1Co-codamol, Paracetamol, Codeine || Diphenhydramine, Pregabalin, Citalopram, Zopiclone 1 0 1Co-codamol, Zopiclone, Alcohol 1 1 0Cocaine 1 1 0Cocaine || 1 1 0Cocaine || Alcohol 1 1 0Cocaine || Amitriptyline, Pregabalin, Diazepam 1 1 0Cocaine || Cannabis 1 1 0Cocaine || Diazepam 1 1 0Cocaine || Diazepam, Etizolam, Delorazepam, Lorazepam 1 1 0Cocaine || Diazepam, Methadone 1 1 0Cocaine || Etizolam, Alcohol 1 1 0Cocaine || Etizolam, Diazepam, Alcohol 1 1 0Cocaine || Etizolam, Diazepam, Cannabis, Alcohol 1 1 0Cocaine || Levamisole 1 1 0Cocaine || Levamisole, Morphine, Benzodiazepine, Methadone 1 1 0Cocaine || Procyclidine, Zuclopenthixol, Alcohol 1 1 0Cocaine, Alcohol || 1 0 1
Buprenorphine, Diclazepam, Etizolam, Gabapentin, Dihydrocodeine || Amitriptyline, Nitrazepam, Quetiapine, Olanzapine, Cannabis, Alcohol
Page 170
Both Males FemalesICD code(s), cause of death and substance(s) 1
Cocaine, Alcohol || Diazepam 1 1 0Cocaine, Amitriptyline, Methadone, Diclazepam || Gabapentin, Paracetamol, Diazepam 1 0 1Cocaine, Buprenorphine, Diclazepam, Etizolam || Diazepam, Cannabis 1 1 0
1 0 1
Cocaine, Codeine, Tramadol 1 1 0Cocaine, Diazepam, Delorazepam, Pregabalin, Dihydrocodeine || Citalopram, Cannabis, Alcohol 1 1 0Cocaine, Diazepam, Ecstasy || 1 1 0Cocaine, Dihydrocodeine, Diazepam, Dipipanone, Cyclizine || Cannabis 1 1 0Cocaine, Etizolam || Mirtazapine 1 1 0Cocaine, Gabapentin, Etizolam, Delorazepam, Lorazepam, Alcohol || Cannabis 1 1 0Cocaine, Heroin || Diazepam 1 1 0Cocaine, Heroin, Diazepam, Alcohol || 1 1 0Cocaine, Heroin, Methadone, Gabapentin, Diclazepam, Diazepam || Cannabis, Alcohol 1 1 0Cocaine, MDMA || 1 1 0Cocaine, Methadone || Diazepam, Cannabis 1 1 0Cocaine, Methadone || Dihydrocodeine, Cannabis, Morphine, Codeine 1 1 0Cocaine, Methadone || Fluoxetine, Mirtazapine 1 1 0Cocaine, Methadone, Etizolam || Amitriptyline, Gabapentin, Diazepam, Naproxen, Codeine, Alcohol 1 0 1Cocaine, Methadone, Gabapentin || Sodium valproate, Mirtazapine, Alcohol 1 0 1Cocaine, Methadone, Gabapentin, Etizolam || Amitriptyline, Fluoxetine, Risperidone, Codeine 1 0 1Cocaine, Methadone, Gabapentin, Etizolam || Sertraline 1 1 0Cocaine, Methadone, Heroin, Gabapentin, Etizolam, Sertraline, Codeine || Alcohol 1 1 0Cocaine, Methadone, Methylphenidate, Clozapine || Alcohol 1 1 0Cocaine, Methadone, Tramadol, Gabapentin || Amitriptyline, Sertraline, Propranolol, Mirtazapine, Cyclizine 1 1 0Cocaine, Morphine, Gabapentin, Methadone, Buprenorphine, Etizolam || Mirtazapine 1 1 0Cocaine, Morphine, Heroin, Gabapentin, Dihydrocodeine, Mirtazapine, Diazepam, Cyclizine || Cannabis 1 0 1Cocaine, Morphine, Heroin, Methadone, Diazepam || Alcohol 1 1 0Cocaine, Morphine, Methadone, Alprazolam, Diazepam, Pregabalin || Levamisole, Cannabis 1 1 0Cocaine, Morphine, Methadone, Gabapentin, Mirtazapine, Olanzapine || Diazepam, Cannabis 1 1 0Cocaine, Tramadol, Alcohol || Pregabalin, Diphenhydramine, Propranolol, Sertraline, Paracetamol 1 0 1Cocaine, Venlafaxine || 1 1 0Codeine 1 1 0Codeine || Citalopram, Mirtazapine, Paracetamol, Diazepam, Pregabalin 1 0 1Codeine, Co-codamol || Cocaine, Alcohol 1 1 0Codeine, Diclazepam || Paracetamol, Mirtazapine, Promethazine 1 0 1Codeine, Dihydrocodeine, Amitriptyline, Alcohol || 1 1 0Codeine, Gabapentin, Morphine || Diazepam, Trazodone, Alcohol 1 1 0Codeine, Gabapentin, Paracetamol || Citalopram, Tramadol, Alcohol 1 0 1Codeine, Methadone, Etizolam, Pregabalin || 1 1 0Codeine, Morphine, Trazodone, Cocaine || Paracetamol 1 0 1Codeine, Paracetamol, Ethanol 1 0 1Codeine, Paracetamol, Quetiapine, Alcohol 1 0 1Diamorphine || 1 1 0Dihydrocodeine 3 1 2Dihydrocodeine || Amitriptyline, Diazepam 1 1 0Dihydrocodeine || Diazepam, Cannabis 1 1 0Dihydrocodeine || Diazepam, Clomipramine, Gabapentin, Alcohol 1 1 0Dihydrocodeine || Diclazepam, Sertraline 1 1 0Dihydrocodeine, Alcohol || Diazepam, Paracetamol, Hydrocodone 1 1 0Dihydrocodeine, Amitriptyline || 1 0 1Dihydrocodeine, Amitriptyline, Citalopram || 1 1 0Dihydrocodeine, Amitriptyline, Clomipramine, Pregabalin, Alcohol || Cannabis, Naproxen, Diazepam 1 0 1Dihydrocodeine, Diclazepam || Flecainide, Tramadol, Cannabis, Alcohol 1 1 0Dihydrocodeine, Diclazepam || Mirtazapine, Paracetamol 1 1 0Dihydrocodeine, Etizolam || Mirtazapine 1 1 0Dihydrocodeine, Flubromazepam, Pyrazolam, Hydrocodone || Sertraline, Quetiapine, Cannabis 1 1 0Dihydrocodeine, Gabapentin || 1 0 1Dihydrocodeine, Gabapentin, Amitriptyline 1 0 1Dihydrocodeine, Gabapentin, Amitriptyline || Etizolam, Oxazepam, Cannabis, Alcohol 1 1 0Dihydrocodeine, Gabapentin, Diazepam || 1 1 0Dihydrocodeine, Gabapentin, Diazepam || Olanzapine, Cannabis, Alcohol 1 1 0Dihydrocodeine, Gabapentin, Etizolam || 1 1 0Dihydrocodeine, Gabapentin, Etizolam || Mirtazapine, Alcohol 1 0 1Dihydrocodeine, Methadone || Paracetamol, Gabapentin, Mirtazapine 1 1 0Dihydrocodeine, Methadone, Heroin || Citalopram, Amitriptyline, Diazepam, Clorazepam, Cannabis 1 0 1Dihydrocodeine, Mirtazapine, Methadone, Heroin || Zopiclone, Diazepam, Temazepam, Pregabalin 1 0 1Dihydrocodeine, Morphine, Alcohol 1 0 1Dihydrocodeine, Morphine, Gabapentin, Diclazepam || 1 1 0Dihydrocodeine, Paracetamol || Cyclizine 1 0 1Dihydrocodeine, Pregabalin 1 0 1Fentanyl, Alcohol 1 1 0Fentanyl, Dihydrocodeine, Codeine 1 0 1Fentanyl, Methadone || Amitriptyline, Diazepam, Gabapentin, Etizolam 1 1 0Heroin 3 3 0Heroin || 2 0 2Heroin || Amfetamine, Amitriptyline, Gabapentin, Diazepam, Cannabis 1 1 0Heroin || Amitriptyline, Mirtazapine, Sertraline, Quetiapine, Pregabalin 1 1 0Heroin || Chlorpheniramine, Mirtazapine, Cannabis, Gabapentin, Diazepam, Delorazepam, Alprazolam 1 1 0Heroin || Diazepam 1 1 0Heroin || Diazepam, Alcohol 2 2 0
Cocaine, Buprenorphine, Methadone, Gabapentin, Promethazine, Benzodiazepine || Amitriptyline, Mirtazapine, Fluoxetine, Alcohol
Page 171
Both Males FemalesICD code(s), cause of death and substance(s) 1
Heroin || Diazepam, Buprenorphine, Dihydrocodeine 1 1 0Heroin || Diazepam, Cannabis 1 1 0Heroin || Diazepam, Citalopram, Paracetamol, Cannabis 1 1 0Heroin || Diazepam, Cocaine 1 1 0Heroin || Diazepam, Diclazepam, Cannabis, Alcohol 1 1 0Heroin || Diazepam, Etizolam 1 1 0Heroin || Diazepam, Etizolam, Cannabis 1 1 0Heroin || Diazepam, Lorazepam, Alcohol 1 0 1Heroin || Diazepam, Venlafaxine, Cannabis 1 1 0Heroin || Diclazepam, Cannabis 1 1 0Heroin || Dihydrocodeine 1 1 0Heroin || Dihydrocodeine, Diazepam, Codeine 1 0 1Heroin || Dihydrocodeine, Etizolam, Cannabis, Alcohol 1 1 0Heroin || Etizolam 1 1 0Heroin || Etizolam, Paracetamol, Alcohol 1 1 0Heroin || Etizolam, Sertraline, Diazepam 1 1 0Heroin || Gabapentin, Mirtazapine, Flupenthixol, Etizolam 1 0 1Heroin || Lignocaine 1 1 0Heroin || Methadone, Etizolam, Dihydrocodeine, Cannabis 1 1 0Heroin || Mirtazapine 1 1 0Heroin || Mirtazapine, Diazepam 1 1 0Heroin || Mirtazapine, Dihydrocodeine, Naproxen, Cannabis 1 1 0Heroin || Paracetamol, Diazepam, Alcohol 1 1 0Heroin || Phenytoin, Diazepam 1 1 0Heroin || Phenytoin, Pregabalin, Cannabis 1 1 0Heroin, AKB48 || Alcohol 1 1 0Heroin, Alcohol || 2 1 1Heroin, Alcohol || Amitriptyline, Chlorpromazine, Zopiclone, Paracetamol 1 1 0Heroin, Alcohol || Amitriptyline, Mirtazapine, Cannabis 1 1 0Heroin, Alcohol || Citalopram, Chlordiazepoxide, Paracetamol 1 0 1Heroin, Alcohol || Codeine 1 1 0Heroin, Alcohol || Delorazepam, Diazepam 1 1 0Heroin, Alcohol || Diazepam 3 2 1Heroin, Alcohol || Diazepam, Tramadol 1 1 0Heroin, Alcohol || Diclazepam, Diazepam, Dihydrocodeine, Mirtazapine 1 1 0Heroin, Alcohol || Mirtazapine 1 1 0Heroin, Alcohol || Pregabalin, Olanzapine, Codeine 1 0 1Heroin, Alcohol || Procyclidine, Sertraline, Zopiclone 1 1 0Heroin, Alprazolam, Diazepam || Cannabis, Alcohol 1 1 0
1 1 0
Heroin, Amphetamine, Methamphetamine, Delorazepam, Lorazepam || Cannabis 1 1 0Heroin, Buprenorphine || Diazepam, Cannabis 1 1 0Heroin, Buprenorphine || Pregabalin, Gabapentin, Diazepam, Cannabis, Alcohol 1 1 0Heroin, Buprenorphine, Diazepam, Phenazepam, Cocaine || Pregabalin, Amitriptyline, Gabapentin, Alcohol 1 1 0Heroin, Buprenorphine, Diclazepam || 1 1 0Heroin, Buprenorphine, Diclazepam, Diazepam || Sertraline, Mirtazapine, Levetiracetam 1 1 0Heroin, Buprenorphine, Etizolam || Diazepam 1 1 0Heroin, Buprenorphine, Etizolam || Sertraline, Alcohol 1 0 1Heroin, Buprenorphine, Etizolam, Delorazepam, Lorazepam || Amitriptyline, Mirtazapine, Alcohol 1 1 0Heroin, Buprenorphine, Gabapentin || Diazepam, Olanzapine 1 1 0Heroin, Buprenorphine, Mirtazapine, Pregabalin, Diazepam || Cannabis 1 1 0Heroin, Cocaine || 1 1 0Heroin, Cocaine || Delorazepam, Lorazepam, Alcohol 1 1 0Heroin, Cocaine || Diazepam 1 1 0Heroin, Cocaine || Diazepam, Chlorpheniramine 1 0 1Heroin, Cocaine || Diazepam, Gabapentin, Tramadol, Cannabis, Alcohol 1 1 0Heroin, Cocaine || Gabapentin, Diazepam, Dihydrocodeine, Buprenorphine 1 1 0Heroin, Cocaine || Paracetamol, Gabapentin, Etizolam, Mirtazapine 1 1 0Heroin, Cocaine || Sertraline, Diazepam, Cannabis 1 0 1Heroin, Cocaine, Alcohol || 2 1 1Heroin, Cocaine, Alcohol || Sertraline, Diazepam 1 1 0Heroin, Cocaine, Diclazepam || Cannabis 1 1 0Heroin, Cocaine, Etizolam, Diclazepam, Alcohol || Diazepam, Gabapentin 1 1 0Heroin, Cocaine, Gabapentin, Buprenorphine, Diazepam || 1 1 0Heroin, Delorazepam || Paracetamol, Mirtazapine, Tramadol, Alcohol 1 1 0Heroin, Diazepam || Alcohol 1 1 0Heroin, Diazepam || Cannabis, Alcohol 1 1 0Heroin, Diazepam, Alcohol || 1 1 0Heroin, Diazepam, Alcohol || Mirtazapine 1 1 0Heroin, Diazepam, Etizolam || 1 1 0Heroin, Diazepam, Etizolam, Amphetamine || Cannabis, Dihydrocodeine 1 0 1Heroin, Diazepam, Methadone || Cannabis, Alcohol 1 1 0Heroin, Diazepam, Temazepam, Oxazepam || Methadone, Alcohol 1 1 0Heroin, Diclazepam || Cannabis 1 1 0Heroin, Diclazepam || Diazepam, Citalopram, Paracetamol, Cannabis, Alcohol 1 1 0Heroin, Diclazepam || Dihydrocodeine 1 1 0Heroin, Diclazepam || Paracetamol, Pregabalin, Buprenorphine, Cannabis, Alcohol 1 1 0Heroin, Diclazepam, Alcohol || 2 1 1Heroin, Diclazepam, Alcohol || Buprenorphine 1 1 0Heroin, Diclazepam, Cocaine || 1 1 0
Heroin, Alprazolam, Lorazepam, Oxazepam, Temazepam, Diazepam, Delorazepam || Olanzapine, Pregabalin, Codeine, Alcohol
Page 172
Both Males FemalesICD code(s), cause of death and substance(s) 1
Heroin, Diclazepam, Cocaine || Diazepam 1 1 0Heroin, Diclazepam, Cocaine, Alcohol || 1 1 0Heroin, Diclazepam, Etizolam || Cannabis 1 1 0Heroin, Diclazepam, Etizolam, Alcohol || Cannabis 1 1 0Heroin, Diclazepam, Etizolam, Gabapentin, Mirtazapine, Cocaine || Cannabis, Alcohol 1 1 0Heroin, Dihydrocodeine || Diazepam, Delorazepam 1 1 0Heroin, Dihydrocodeine || Diazepam, Mirtazapine, Cannabis, Alcohol 1 1 0Heroin, Dihydrocodeine || Mirtazapine, Pregabalin, Alcohol 1 0 1Heroin, Dihydrocodeine, Diazepam || Paracetamol, Cannabis, Alcohol 1 1 0Heroin, Dihydrocodeine, Etizolam || Diazepam, Cannabis 1 1 0Heroin, Dihydrocodeine, Gabapentin, Cocaine || Diazepam, Venlafaxine, Mirtazapine, Paracetamol 1 0 1Heroin, Dihydrocodeine, Methadone, Diazepam, Gabapentin, Amitriptyline || Cannabis, Alcohol 1 1 0Heroin, Etizolam || 4 3 1Heroin, Etizolam || Buprenorphine, Mirtazapine, Quinine, Diazepam, Cannabis, Alcohol 1 1 0Heroin, Etizolam || Cannabis 1 1 0Heroin, Etizolam || Cocaine 1 1 0Heroin, Etizolam || Diazepam, Alcohol 2 1 1Heroin, Etizolam || Diclazepam, Pregabalin, Lignocaine, Cannabis 1 0 1Heroin, Etizolam || Dihydrocodeine 1 0 1Heroin, Etizolam || Gabapentin, Diazepam 1 1 0Heroin, Etizolam || Gabapentin, Diazepam, Quetiapine, Trazodone, Cannabis 1 1 0Heroin, Etizolam || Methadone, Cocaine, Cannabis 1 1 0Heroin, Etizolam || Mirtazapine 1 0 1Heroin, Etizolam || Mirtazapine, Alcohol 1 1 0Heroin, Etizolam || Mirtazapine, Dihydrocodeine 1 1 0Heroin, Etizolam || Paracetamol, Pregabalin 1 1 0Heroin, Etizolam || Venlafaxine, Diazepam, Alcohol 1 1 0Heroin, Etizolam, Alcohol || 1 1 0Heroin, Etizolam, Alcohol || Cannabis 1 1 0Heroin, Etizolam, Alcohol || Diazepam, Pregabalin 1 1 0Heroin, Etizolam, Alcohol || Dihydrocodeine, Mirtazapine 1 1 0Heroin, Etizolam, Alcohol || Mirtazapine, Cannabis, Cyclizine 1 1 0Heroin, Etizolam, Alcohol || Pregabalin, Mirtazapine, Buprenorphine 1 1 0Heroin, Etizolam, Amphetamine || Diazepam, Citalopram 1 1 0Heroin, Etizolam, Buprenorphine || Diazepam 1 0 1Heroin, Etizolam, Buprenorphine || Promethazine, Mirtazapine, Alcohol 1 1 0Heroin, Etizolam, Cocaine || 1 1 0Heroin, Etizolam, Diclazepam || 1 1 0Heroin, Etizolam, Diclazepam || Cannabis 1 1 0Heroin, Etizolam, Diclazepam, Cocaine || Cannabis, Alcohol 1 1 0Heroin, Etizolam, Diclazepam, Methadone, Gabapentin || Mirtazapine 1 0 1Heroin, Etizolam, Diclazepam, Pregabalin || Dihydrocodeine, Temazepam 1 0 1Heroin, Etizolam, Gabapentin 1 1 0Heroin, Etizolam, Gabapentin || Dihydrocodeine, Cannabis 1 1 0Heroin, Etizolam, Gabapentin, Amitriptyline || 1 1 0Heroin, Etizolam, Methadone || Chlorpromazine, Mirtazapine, Quetiapine 1 0 1Heroin, Etizolam, Methadone || Dihydrocodeine, Cannabis 1 1 0Heroin, Etizolam, Methadone || Mirtazapine, Dihydrocodeine, Cannabis 1 1 0Heroin, Etizolam, Methadone, Cocaine || 1 0 1Heroin, Gabapentin || Amitriptyline, Quetiapine, Cannabis 1 1 0Heroin, Gabapentin || Cannabis 1 1 0Heroin, Gabapentin || Diazepam, Etizolam, Temazepam 1 1 0Heroin, Gabapentin || Dihydrocodeine 1 1 0Heroin, Gabapentin || Venlafaxine, Paracetamol, Olanzapine, Diazepam 1 0 1Heroin, Gabapentin, Alcohol || 2 2 0Heroin, Gabapentin, Alcohol || Amisulpride, Duloxetine 1 1 0Heroin, Gabapentin, Diclazepam, Methadone || 1 0 1Heroin, Gabapentin, Dothiepin, Diazepam || Codeine, Alcohol 1 1 0Heroin, Gabapentin, Methadone || Diazepam, Cannabis 1 1 0Heroin, Gabapentin, Methadone, Alcohol || 1 0 1Heroin, Gabapentin, Methadone, Diclazepam || Mirtazapine, Cannabis, Diazepam 1 1 0Heroin, Gabapentin, Mirtazapine, Chlorpromazine || Alcohol 1 1 0Heroin, MDMA || Codeine, Mirtazapine, Alcohol 1 1 0Heroin, MDMA || Paracetamol, Alcohol 1 1 0Heroin, Methadone 1 0 1Heroin, Methadone || 3 1 2Heroin, Methadone || Amitriptyline, Gabapentin, Mirtazapine, Diazepam, Alcohol 1 1 0Heroin, Methadone || Diazepam, Cannabis, Trazodone, Alcohol 1 1 0Heroin, Methadone || Diazepam, Diclazepam, Etizolam, Dihydrocodeine, Alcohol 1 1 0Heroin, Methadone || Diazepam, Pregabalin, Trazodone, Etizolam 1 1 0Heroin, Methadone || Diazepam, Sertraline, Mirtazapine 1 1 0Heroin, Methadone || Etizolam, Alcohol 1 1 0Heroin, Methadone || Etizolam, Amitriptyline 1 0 1Heroin, Methadone || Etizolam, Delorazepam, Mirtazapine, Alcohol 1 0 1Heroin, Methadone || Etizolam, Valproic acid, Lamotrigine 1 1 0Heroin, Methadone || Gabapentin, Amitriptyline, Quetiapine, Diazepam 1 1 0Heroin, Methadone || Gabapentin, Pregabalin, Diazepam 1 1 0Heroin, Methadone || Lorazepam, Etizolam 1 1 0Heroin, Methadone || Mirtazapine, Diazepam, Cannabis 1 1 0Heroin, Methadone || Mirtazapine, Olanzapine, Etizolam, Citalopram 1 0 1Heroin, Methadone || Pregabalin, Gabapentin, Diazepam, Phenazepam, Cannabis 1 1 0
Page 173
Both Males FemalesICD code(s), cause of death and substance(s) 1
Heroin, Methadone, Alcohol || Diazepam, Cannabis 1 1 0Heroin, Methadone, Alcohol || Pregabalin 1 0 1Heroin, Methadone, Buprenorphine || Pregabalin, Temazepam, Lorazepam, Etizolam, Alcohol 1 1 0Heroin, Methadone, Cocaine || Diazepam 1 1 0Heroin, Methadone, Cocaine || Diazepam, Diclazepam, Alcohol 1 1 0Heroin, Methadone, Cocaine || Diazepam, Pregabalin, Alcohol 1 1 0Heroin, Methadone, Cocaine, Alcohol || Zuclopenthixol 1 1 0Heroin, Methadone, Delorazepam, Lorazepam || Mirtazapine 1 1 0Heroin, Methadone, Diazepam || Mirtazapine 1 1 0
1 0 1
Heroin, Methadone, Diazepam, Diclazepam, Gabapentin, Pregabalin || 1 1 0Heroin, Methadone, Diazepam, Pregabalin || 1 0 1Heroin, Methadone, Diclazepam || 1 1 0Heroin, Methadone, Diclazepam || Fluoxetine, Pregabalin, Diazepam, Carbamazepine 1 1 0Heroin, Methadone, Diclazepam || Pregabalin, Risperidone, Diazepam, Alcohol 1 0 1Heroin, Methadone, Diclazepam, Alcohol || Carbamazepine 1 1 0Heroin, Methadone, Dihydrocodeine || Diazepam, Alprazolam, Tramadol, Sertraline 1 1 0Heroin, Methadone, Dihydrocodeine, Tramadol, Pregabalin || Duloxetine 1 1 0Heroin, Methadone, Etizolam || Alcohol 1 1 0Heroin, Methadone, Etizolam || Amitriptyline, Diazepam 1 0 1Heroin, Methadone, Etizolam || Cannabis 1 1 0Heroin, Methadone, Etizolam || Dihydrocodeine, Mirtazapine, Cannabis 1 1 0Heroin, Methadone, Etizolam || Mirtazapine 1 0 1Heroin, Methadone, Etizolam || Mirtazapine, Cannabis 1 1 0Heroin, Methadone, Etizolam || Olanzapine, Sertraline, Zopiclone 1 1 0Heroin, Methadone, Etizolam || Paracetamol, Cannabis 1 1 0Heroin, Methadone, Etizolam || Pregabalin, Diazepam, Amitriptyline 1 0 1Heroin, Methadone, Etizolam || Pregabalin, Mirtazapine 1 1 0Heroin, Methadone, Etizolam || Pregabalin, Olanzapine 1 1 0Heroin, Methadone, Etizolam || Propranolol, Sertraline, Diazepam 1 0 1Heroin, Methadone, Etizolam, Delorazepam || Mirtazapine, Diazepam, Cannabis 1 1 0Heroin, Methadone, Etizolam, Diclazepam || Risperidone 1 0 1Heroin, Methadone, Etizolam, Gabapentin || 1 1 0Heroin, Methadone, Etizolam, Gabapentin || Diazepam, Mirtazapine 1 1 0Heroin, Methadone, Etizolam, Pregabalin || Sertraline, Cannabis 1 0 1Heroin, Methadone, Gabapentin || Etizolam, Chlorpromazine, Cannabis, Mirtazapine 1 1 0Heroin, Methadone, Gabapentin || Promethazine, Etizolam, Alcohol 1 0 1Heroin, Methadone, Gabapentin || Sertraline, Paracetamol 1 1 0Heroin, Methadone, Gabapentin, Amitriptyline, Mirtazapine || Paracetamol, Diazepam, Cannabis, Alcohol 1 0 1Heroin, Methadone, Gabapentin, Diazepam || 1 1 0Heroin, Methadone, Gabapentin, Diazepam, Etizolam || 1 0 1Heroin, Methadone, Gabapentin, Diazepam, Olanzapine, Dihydrocodeine, MDMA, Alcohol || Codeine 1 1 0Heroin, Methadone, Gabapentin, Etizolam 2 1 1Heroin, Methadone, Gabapentin, Etizolam || Diclazepam, Amitriptyline, Diazepam 1 1 0Heroin, Methadone, Gabapentin, Etizolam, Pyrazolam, Mexedrone || Cannabis, Alcohol 1 1 0Heroin, Methadone, Gabapentin, Unspecified solvent || Cyclizine 1 1 0Heroin, Methadone, Mirtazapine, Alcohol || Cannabis 1 1 0Heroin, Methadone, Mirtazapine, Diazepam || Pregabalin 1 0 1Heroin, Methadone, Pregabalin || Cannabis, Mirtazapine 1 1 0Heroin, Methadone, Pregabalin, Cocaine || Diclazepam, Gabapentin 1 1 0Heroin, Methadone, Pregabalin, Etizolam 1 1 0Heroin, Methadone, Pregabalin, Gabapentin, Diazepam, Chlorpromazine, Mirtazapine || Cannabis 1 1 0Heroin, Methadone, Pregabalin, Zopiclone || Alcohol 1 1 0Heroin, Methadone, Propane, Butane, Isobutane || Olanzapine, Mirtazapine, Diazepam, Alcohol 1 0 1Heroin, Methadone, Sertraline || Etizolam, Diazepam, Gabapentin, Mirtazapine, Amitriptyline 1 1 0Heroin, Methadone, Tramadol || Diazepam 1 1 0Heroin, Methadone, Tramadol, Etizolam || Pregabalin, Diazepam 1 1 0Heroin, Methadone, Tramadol, Pregabalin || Mirtazapine, Alcohol 1 0 1Heroin, Morphine || Diazepam, Cannabis, Alcohol 1 1 0Heroin, Morphine || Fluoxetine, Gabapentin, Propranolol, Codeine, Amitriptyline, Diazepam, Mirtazapine, Cannabis 1 0 1Heroin, Morphine || Pregabalin, Mirtazapine, Dihydrocodeine, Alcohol 1 1 0Heroin, Morphine, 6 MAM, Codeine || Diazepam 1 1 0Heroin, Morphine, Alcohol || Diazepam, Cannabis 1 1 0Heroin, Morphine, Buprenorphine, Cocaine, Diazepam || Mirtazapine, Labetalol, Paracetamol, Pregabalin, Alcohol 1 0 1Heroin, Morphine, Dihydrocodeine || Pregabalin, Trimethoprim, Amlodipine, Tramadol, Alcohol 1 1 0Heroin, Morphine, Methadone || Gabapentin, Diazepam 1 1 0Heroin, Oxycodone, Etizolam, Diazepam || Alcohol 1 1 0Heroin, Pregabalin, Methadone || Promethazine, Zopiclone, Mirtazapine, Dihydrocodeine, Diazepam, Cannabis 1 1 0Heroin, Pregabalin, Tramadol, Diazepam, Etizolam || Cannabis, Paracetamol 1 1 0MDMB-CHMICA || Alcohol 1 1 0Methadone || Amitriptyline, Diazepam, Etizolam, Gabapentin, Dihydrocodeine 1 0 1Methadone || Cannabis, Alcohol 1 1 0Methadone || Diazepam, Cannabis 1 1 0Methadone || Diazepam, Nitrazepam, Procyclidine, Gabapentin, Valproic acid, Olanzapine 1 1 0Methadone || Etizolam 1 1 0Methadone || Mirtazapine, Cannabis, Diazepam 1 1 0Methadone || Mirtazapine, Diazepam, Alcohol 1 1 0Methadone || Mirtazapine, Diazepam, Cannabis, Alcohol 1 1 0Methadone || Mirtazapine, Zopiclone, Alcohol 1 1 0Methadone || Olanzapine, Diazepam, Sertraline, Alcohol 1 1 0
Heroin, Methadone, Diazepam, Delorazepam, Lorazepam, Cyclizine, Gabapentin || Mirtazapine, Olanzapine, Citalopram, Alcohol
Page 174
Both Males FemalesICD code(s), cause of death and substance(s) 1
Methadone || Paracetamol, Codeine, Clozapine, Diazepam 1 0 1Methadone || Promethazine, Olanzapine, Lamotrigine, Alcohol 1 1 0Methadone || Tramadol, Diazepam, Mirtazapine, Cannabis 1 1 0Methadone || Valproic acid, Haloperidol, Citalopram, Diazepam, Procyclidine 1 0 1Methadone || Zuclopenthixol, Alcohol 1 1 0Methadone, Alcohol || 1 1 0Methadone, Alcohol || Citalopram 1 0 1Methadone, Alcohol || Diclazepam, Fluoxetine, Propranolol 1 0 1Methadone, Alcohol || Etizolam 1 1 0Methadone, Alcohol || Mirtazapine, Diazepam, Etizolam 1 0 1Methadone, Alprazolam || Cocaine 1 1 0Methadone, Alprazolam || Gabapentin, Alcohol 1 1 0Methadone, Alprazolam, Gabapentin 1 1 0Methadone, Amitriptyline, Etizolam || Cocaine, Amphetamine 1 0 1Methadone, Amitriptyline, Mirtazapine, Codeine, Diazepam, Alcohol || Paracetamol, Cannabis 1 1 0Methadone, Amitriptyline, Tramadol || Fluoxetine, Diazepam, Codeine 1 0 1Methadone, Amphetamine || Mirtazapine, Pregabalin 1 1 0Methadone, Amphetamine, Etizolam, Delorazepam, Diazepam || Quetiapine, Sertraline 1 1 0Methadone, Buprenorphine, Diclazepam, Cocaine || Cannabis 1 1 0Methadone, Butane, Propane, Etizolam, Phenazepam || Gabapentin 1 0 1Methadone, Cocaine || Diazepam, Olanzapine, Mirtazapine, Cannabis 1 1 0Methadone, Codeine, Tramadol, Diazepam || Sertraline 1 1 0Methadone, Cyclizine, Diazepam || 1 1 0Methadone, Diazepam || Chlordiazepoxide, Mirtazapine, Cannabis 1 0 1Methadone, Diazepam, Alprazolam || Dihydrocodeine 1 1 0Methadone, Diazepam, Amfetamine, Cocaine, Zopiclone || Quetiapine 1 0 1Methadone, Diazepam, Amitriptyline, Gabapentin, Cocaine || Levamisole, Mirtazapine, Paracetamol 1 1 0Methadone, Diazepam, Etizolam || Cannabis 1 1 0Methadone, Diazepam, Etizolam, Dihydrocodeine, Codeine, Amitriptyline || Cannabis, Fluoxetine 1 1 0Methadone, Diazepam, Gabapentin || Mirtazapine 1 1 0Methadone, Diazepam, Morphine || Cannabis 1 1 0Methadone, Diazepam, Pregabalin || Cannabis, Alcohol 1 1 0Methadone, Diazepam, Pregabalin || Citalopram, Cannabis 1 1 0Methadone, Diazepam, Pregabalin, Gabapentin, MDMA, MDA, Ethylene, Diclazepam, Cloxazolam, Alcohol || 1 1 0Methadone, Diclazepam || Amitriptyline, Trazodone, Cannabis 1 0 1Methadone, Diclazepam || Gabapentin, Dihydrocodeine, Diazepam 1 1 0Methadone, Diclazepam || Mirtazapine 1 1 0Methadone, Diclazepam, Alcohol || Cannabis, Diazepam 1 1 0Methadone, Diclazepam, Etizolam || Sertraline, Mirtazapine, Alcohol 1 0 1Methadone, Dihydrocodeine, Delorazepam, Alprazolam, Etizolam || Cyclizine, Mirtazapine, Chlorpheniramine, Codeine 1 0 1Methadone, Dihydrocodeine, Diazepam || Cannabis, Zopiclone, Temazepam, Oxazepam 1 0 1Methadone, Dihydrocodeine, Etizolam, Diclazepam, Cloxazolam || Mirtazapine, Olanzapine 1 0 1Methadone, Dihydrocodeine, Morphine || 1 1 0Methadone, Dihydrocodeine, Morphine, Diazepam || 1 1 0Methadone, Diphenhydramine, Pregabalin || Chlorpromazine, Cannabis, Alcohol 1 1 0Methadone, Etizolam 2 1 1Methadone, Etizolam || 2 1 1Methadone, Etizolam || Alcohol 1 0 1Methadone, Etizolam || Cocaine, Olanzapine, Mirtazapine, Amitriptyline 1 0 1Methadone, Etizolam || Diazepam 1 1 0Methadone, Etizolam || Diazepam, Amitriptyline, Sertraline, Cyclizine 1 1 0Methadone, Etizolam || Diazepam, Gabapentin, Heroin 1 1 0Methadone, Etizolam || Gabapentin, Diazepam 1 1 0Methadone, Etizolam || Gabapentin, Mirtazapine, Citalopram, Chlorpromazine 1 1 0Methadone, Etizolam || Haloperidol 1 1 0Methadone, Etizolam || Mirtazapine 1 1 0Methadone, Etizolam || Mirtazapine, Cannabis 1 1 0Methadone, Etizolam || Mirtazapine, Propranolol, Naproxen, Alcohol 1 1 0Methadone, Etizolam || Olanzapine, Levetiracetam 1 1 0Methadone, Etizolam || Pregabalin, Gabapentin, Tramadol, Trazodone, Amitriptyline, Cannabis 1 0 1Methadone, Etizolam || Tramadol, Morphine, Gabapentin, Promethazine, Diclazepam, Cannabis 1 1 0Methadone, Etizolam, Alcohol || Diazepam 1 1 0Methadone, Etizolam, Cocaine || Codeine, Pregabalin, Mirtazapine, Gabapentin 1 0 1Methadone, Etizolam, Cocaine || Pregabalin, Levetiracetam, Lamotrigine, Mirtazapine, Warfarin 1 0 1Methadone, Etizolam, Cocaine, Unspecified solvent || Cannabis, Alcohol 1 1 0Methadone, Etizolam, Delorazepam, Diphenhydramine || 1 1 0Methadone, Etizolam, Diazepam, Heroin || 1 1 0Methadone, Etizolam, Diazepam, Nitrazepam, Pregabalin, Gabapentin || Mirtazapine 1 1 0Methadone, Etizolam, Diclazepam, Fluoxetine, Tramadol || 1 0 1Methadone, Etizolam, Diclazepam, Pregabalin || Amitriptyline, Fluoxetine, Olanzapine, Cannabis 1 0 1Methadone, Etizolam, Gabapentin || 1 1 0Methadone, Etizolam, Gabapentin || Olanzapine, Naproxen, Alcohol 1 1 0Methadone, Etizolam, Gabapentin, Morphine, Cocaine || Codeine 1 1 0Methadone, Etizolam, Gabapentin, Pregabalin || Cannabis, Buprenorphine 1 1 0Methadone, Etizolam, Morphine || Gabapentin, Benzodiazepine 1 0 1Methadone, Etizolam, Morphine, Alcohol || 1 1 0Methadone, Etizolam, Morphine, Cocaine || Alcohol 1 1 0Methadone, Etizolam, Morphine, Cocaine || Pregabalin, Dihydrocodeine 1 1 0Methadone, Etizolam, Morphine, Pregabalin || Mirtazapine, Levetiracetam 1 0 1Methadone, Etizolam, Pregabalin || Morphine, Mirtazapine, Diazepam, Alcohol 1 1 0
Page 175
Both Males FemalesICD code(s), cause of death and substance(s) 1
Methadone, Etizolam, Tramadol, Morphine || Pregabalin 1 0 1Methadone, Gabapentin || Diazepam, Temazepam, Trazodone, Alcohol 1 0 1Methadone, Gabapentin || Etizolam, Diazepam, Cannabis 1 1 0Methadone, Gabapentin, Amitriptyline || Diazepam, Zopiclone, Mirtazapine, Alcohol 1 0 1Methadone, Gabapentin, Amitriptyline, Pregabalin || Diazepam 1 1 0Methadone, Gabapentin, Etizolam || Dothiepin, Mirtazapine 1 0 1Methadone, Gabapentin, Etizolam || Mirtazapine, Diazepam, Cannabis 1 0 1Methadone, Gabapentin, Etizolam || Naproxen, Alcohol 1 0 1Methadone, Gabapentin, Etizolam || Valproic acid 1 1 0Methadone, Gabapentin, Etizolam, Phenazepam, Delorazepam || Alcohol 1 1 0Methadone, Gabapentin, Pregabalin, Morphine, Codeine, Alcohol || Fluoxetine, Diazepam, Cyclizine 1 0 1Methadone, Heroin, Alprazolam || Diazepam, Pregabalin, Mirtazapine 1 1 0Methadone, Heroin, Diazepam, Lorazepam || Citalopram, Sertraline, Alcohol 1 1 0Methadone, Heroin, Dihydrocodeine, Cocaine, Diazepam, Pregabalin, Alcohol || 1 1 0Methadone, Heroin, Etizolam || Cannabis 1 1 0Methadone, Heroin, Etizolam || Mirtazapine, Cannabis 1 1 0Methadone, Heroin, Etizolam, Pregabalin || Codeine, Alcohol 1 0 1Methadone, Heroin, Pregabalin, Alprazolam || Dihydrocodeine, Amphetamine, Alcohol 1 1 0Methadone, Heroin, Tramadol || Diazepam 1 1 0Methadone, Ivermectin, Etizolam || Diazepam 1 1 0Methadone, Mirtazapine || Pregabalin, Fluoxetine, Duloxetine, Zopiclone, Diazepam 1 0 1Methadone, Mirtazapine, Quetiapine, Tramadol, Dihydrocodeine, Diazepam || 1 1 0Methadone, Morphine 1 1 0Methadone, Morphine, Amitriptyline, Mirtazapine, Amisulpride || Alcohol 1 1 0Methadone, Morphine, Codeine, Etizolam, Diazepam, Gabapentin, Mirtazapine, Alcohol || 1 1 0Methadone, Morphine, Diazepam || Alcohol 1 1 0Methadone, Morphine, Diazepam, Amitriptyline, Mirtazapine, Pregabalin || Cannabis 1 0 1Methadone, Morphine, Diclazepam || Codeine, Cannabis 1 1 0Methadone, Morphine, Dihydrocodeine || Diazepam, Chlorpromazine 1 0 1Methadone, Morphine, Dihydrocodeine, Etizolam, Pregabalin || Cocaine 1 1 0Methadone, Morphine, Dihydrocodeine, Tramadol, Diazepam, Amitriptyline, Mirtazapine, Pregabalin || 1 1 0Methadone, Morphine, Etizolam || Gabapentin, Diazepam, Mirtazapine, Cannabis 1 0 1Methadone, Morphine, Etizolam || Mirtazapine, Cannabis, Alcohol 1 0 1Methadone, Morphine, Etizolam, Gabapentin || Cannabis 1 1 0Methadone, Morphine, Etizolam, Gabapentin || Mirtazapine 1 0 1Methadone, Morphine, Gabapentin, Etizolam, Buprenorphine || MDMA, Cocaine 1 1 0Methadone, Morphine, Heroin || 1 1 0Methadone, Morphine, Heroin, Diazepam, Gabapentin, Quetiapine, Mirtazapine || Alcohol 1 1 0Methadone, Morphine, Heroin, Diazepam, Pregabalin, Mirtazapine || 1 1 0Methadone, Morphine, Pregabalin || Olanzapine, Codeine, Cannabis 1 1 0Methadone, Morphine, Pregabalin, Cocaine, Etizolam, Delorazepam || Alcohol 1 1 0Methadone, Norfluoxetine, Dihydrocodeine, Morphine, Fluoxetine, Mirtazapine, Diazepam || 1 1 0Methadone, Phenazepam, Etizolam || Mirtazapine, Gabapentin 1 0 1Methadone, Pregabalin || Alcohol 1 0 1Methadone, Pregabalin, Cocaine || Diazepam, Etizolam, Quetiapine 1 1 0Methadone, Pregabalin, Cocaine, Citalopram || Diazepam, Paracetamol, Alcohol 1 1 0Methadone, Pregabalin, Dihydrocodeine, Gabapentin || Paracetamol, Mirtazapine, Cannabis 1 1 0Methadone, Pregabalin, Etizolam, Diclazepam || Duloxetine, Quetiapine, Mirtazapine, Paracetamol 1 0 1Methadone, Pregabalin, Mirtazapine, Diazepam, Diclazepam || 1 0 1Methadone, Pregabalin, Tramadol, Morphine, Etizolam, Delorazepam || 1 0 1Methadone, Tramadol, Alprazolam || Cocaine 1 1 0Methadone, Tramadol, Gabapentin || Amitriptyline 1 1 0Methadone, Zopiclone, Cocaine || 1 1 0Morphine 1 1 0Morphine || Alcohol 2 2 0Morphine || Alprazolam, Mirtazapine, Diazepam 1 1 0Morphine || Amitriptyline, Diazepam 1 0 1Morphine || Citalopram, Gabapentin, Amitriptyline 1 1 0Morphine || Diazepam 1 1 0Morphine || Diazepam, Mirtazapine, Venlafaxine 1 0 1Morphine || Diazepam, Paracetamol, Lignocaine, Cannabis 1 1 0Morphine || Diazepam, Pregabalin, Mirtazapine, Olanzapine, Alcohol 1 1 0Morphine || Diazepam, Temazepam, Mirtazapine, Quetiapine 1 1 0Morphine || Etizolam, Cannabis 1 1 0Morphine || Gabapentin, Pregabalin, Oxycodone, Haloperidol, Diazepam 1 1 0Morphine || Heroin, Diazepam, Gabapentin, Alcohol 1 0 1Morphine || Mirtazapine 1 1 0Morphine, Alcohol 1 1 0Morphine, Alcohol || 1 1 0Morphine, Alcohol || Diazepam 1 1 0Morphine, Alcohol || Dihydrocodeine, Pregabalin, Etizolam 1 1 0Morphine, Alcohol || Tramadol 1 1 0Morphine, Amitriptyline, Fluoxetine, Gabapentin || Olanzapine, Diazepam, Cannabis 1 0 1Morphine, Amphetamine, Gabapentin, Diazepam, Olanzapine, Amitriptyline, Mitragynine, Zopiclone, Alcohol || 1 1 0Morphine, Citalopram || Trimethoprim, Alcohol 1 0 1Morphine, Cocaine || Cannabis, Diazepam, Alcohol 1 1 0Morphine, Codeine 1 0 1Morphine, Codeine, Diphenhydramine || Amitriptyline 1 1 0Morphine, Diazepam 1 0 1Morphine, Diazepam, Alcohol 1 1 0Morphine, Diazepam, Alcohol || Citalopram, Lignocaine 1 1 0
Page 176
Both Males FemalesICD code(s), cause of death and substance(s) 1
Morphine, Diazepam, Diclazepam || Cannabis, Alcohol 1 1 0Morphine, Diazepam, Gabapentin || 1 1 0Morphine, Diazepam, Gabapentin, Sertraline || Alcohol 1 0 1Morphine, Diclazepam || 2 1 1Morphine, Diclazepam, Oxycodone, Gabapentin, Methadone || Trazodone, Zopiclone 1 0 1Morphine, Dihydrocodeine || 1 0 1Morphine, Dihydrocodeine, Codeine, Gabapentin, Amitriptyline, Diazepam || Fluoxetine 1 0 1Morphine, Dihydrocodeine, Diazepam, Gabapentin 1 0 1Morphine, Dihydrocodeine, Etizolam || Fluoxetine 1 1 0Morphine, Dihydrocodeine, Methadone, Alcohol || Mirtazapine, Diazepam, Cannabis 1 1 0Morphine, Etizolam 1 1 0Morphine, Etizolam || Diazepam, Mirtazapine, Gabapentin 1 1 0Morphine, Etizolam, Buprenorphine, Cocaine || Pregabalin 1 1 0Morphine, Etizolam, Diazepam, Methadone || Cannabis, Alcohol 1 0 1Morphine, Gabapentin, Amitriptyline, Citalopram || 1 0 1Morphine, Gabapentin, Dihydrocodeine, Diazepam, Procyclidine, Zuclopenthixol || Codeine 1 1 0Morphine, Heroin || Diazepam, Paracetamol, Alcohol 1 1 0Morphine, Heroin || Paracetamol 1 1 0Morphine, Heroin, Amitriptyline, Diazepam || Dihydrocodeine, Paracetamol, Alcohol 1 0 1Morphine, Heroin, Buprenorphine, Diazepam || Paracetamol, Alcohol 1 1 0Morphine, Heroin, Cocaine || Mirtazapine, Paracetamol 1 1 0Morphine, Heroin, Cocaine, Diazepam || Paracetamol 1 1 0Morphine, Heroin, Cocaine, Methadone, Dihydrocodeine || Paracetamol, Levamisole, Salbutamol 1 1 0Morphine, Heroin, Diazepam || Cannabis, Codeine 1 1 0Morphine, Heroin, Diazepam || Fluoxetine, Pregabalin 1 1 0Morphine, Heroin, Diazepam || Paracetamol 1 1 0Morphine, Heroin, Diazepam, Alprazolam, Alcohol || Paracetamol 1 1 0Morphine, Heroin, Diazepam, Gabapentin || Alcohol 1 0 1Morphine, Heroin, Diazepam, Methadone, Cocaine || Mirtazapine, Paracetamol, Cannabis 1 0 1Morphine, Heroin, Dihydrocodeine, Diazepam || Carbamazepine, Paracetamol 1 1 0Morphine, Heroin, Dihydrocodeine, Ethanol || Tramadol, Gabapentin, Codeine, Diazepam 1 1 0Morphine, Heroin, Dihydrocodeine, Etizolam || Mirtazapine 1 0 1Morphine, Heroin, Etizolam || Sertraline, Nefopam 1 1 0Morphine, Heroin, Etizolam, Codeine, Ethanol || Carbamazepine, Citalopram 1 0 1Morphine, Heroin, Methadone || Diazepam 1 1 0Morphine, Heroin, Methadone || Etizolam, Amitriptyline 1 1 0Morphine, Heroin, Methadone, Alprazolam, Mirtazapine, Olanzapine || Quinine, Levamisole 1 1 0Morphine, Heroin, Methadone, Diclazepam || Pregabalin, Mirtazapine, Codeine 1 0 1Morphine, Heroin, Methadone, Dihydrocodeine, Diazepam, Etizolam, Lorazepam || Mirtazapine 1 0 1Morphine, Heroin, Methadone, Etizolam || Cannabis 1 1 0Morphine, Heroin, Methadone, Etizolam || Cannabis, Mirtazapine 1 1 0Morphine, Heroin, Methadone, Etizolam, Gabapentin || Paracetamol 1 0 1Morphine, Heroin, Phenazepam, Etizolam || Mirtazapine 1 1 0Morphine, Ketamine, Diazepam, Tramadol || Cocaine, Alprazolam 1 1 0Morphine, MDMA || Codeine, Flupentixol, Etizolam, Cannabis 1 1 0Morphine, Methadone || Diazepam, Cyclizine, Paracetamol 1 0 1Morphine, Methadone || Diazepam, Delorazepam 1 1 0Morphine, Methadone || Diclazepam, Quetiapine, Diazepam, Alcohol 1 1 0Morphine, Methadone, Amitriptyline, Sertraline 1 1 0Morphine, Methadone, Diazepam, Mirtazapine || Valproic acid 1 0 1Morphine, Methadone, Diclazepam || Alcohol 1 1 0Morphine, Methadone, Dihydrocodeine, Etizolam || Gabapentin, Mirtazapine 1 0 1Morphine, Methadone, Dihydrocodeine, Etizolam, Delorazepam, Lorazepam, Diazepam || Alcohol 1 0 1Morphine, Methadone, Etizolam || Alcohol 1 1 0Morphine, Methadone, Etizolam || Cannabis 1 1 0Morphine, Methadone, Etizolam || Mirtazapine, Amitriptyline, Sertraline, Pregabalin, Alcohol 1 0 1Morphine, Methadone, Etizolam || Quetiapine, Lorazepam, Alcohol 1 1 0Morphine, Methadone, Etizolam, Diclazepam || Naproxen 1 1 0Morphine, Methadone, Gabapentin, Alcohol || Sertraline, Olanzapine, Etizolam 1 0 1Morphine, Methadone, Tramadol, Etizolam, Diclazepam || Amitriptyline, Mirtazapine, Cannabis 1 1 0Morphine, Methadone, Tramadol, Pregabalin, Etizolam, Alprazolam, Diazepam 1 0 1Morphine, Pregabalin || Olanzapine, Lorazepam, Mirtazapine, Alcohol 1 1 0Morphine, Pregabalin, Dihydrocodeine || Diazepam, Alcohol 1 1 0Morphine, Tramadol, Alcohol || Diazepam, Dihydrocodeine, Codeine 1 1 0Morphine, Zopiclone 1 0 1Narcotic, Morphine, Buprenorphine, Diazepam || Mirtazapine, Cocaine, Alcohol 1 1 0Opioid, Tramadol, Dihydrocodeine || Atenolol, Paracetamol, Alcohol 1 0 1Oramorph, Diazepam, Pregabalin, Alcohol || Zopiclone, Cannabis 1 1 0Oxycodone || Cocaine 1 1 0Oxycodone, Amitriptyline, Venlafaxine, Cocaine || Etizolam, Diclazepam 1 1 0Oxycodone, Diazepam || Cannabis, Alcohol 1 1 0Oxycodone, Diclazepam, Cocaine || Chlorpromazine, Mirtazapine, Codeine 1 0 1Oxycodone, Venlafaxine 1 0 1Tramadol 4 1 3Tramadol || Codeine, Amitriptyline, Alcohol 1 1 0Tramadol || Codeine, Paracetamol, Sertraline, Quetiapine, Cannabis, Propranolol, Alcohol 1 1 0Tramadol || Dihydrocodeine, Diazepam, Paracetamol, Sertraline 1 1 0Tramadol, Alcohol || Pregabalin, Chlorpromazine, Citalopram 1 0 1Tramadol, Alprazolam, Dihydrocodeine, Cocaine || 1 0 1Tramadol, Dihydrocodeine, Alcohol || Codeine, Morphine, Paracetamol, Diazepam 1 1 0Tramadol, Etizolam 1 1 0
Page 177
Both Males FemalesICD code(s), cause of death and substance(s) 1
Tramadol, Etizolam || Citalopram, Cannabis 1 1 0Tramadol, Fentanyl || Sertraline, Dihydrocodeine, Amitriptyline, Paracetamol 1 0 1Tramadol, Gabapentin 1 1 0Tramadol, Gabapentin, Citalopram, Amitriptyline, Mirtazapine || 1 0 1Tramadol, Gabapentin, Etizolam || Cannabis 1 1 0Tramadol, Gabapentin, Methadone, Cocaine || Diclazepam, Venlafaxine, Mirtazapine 1 1 0Tramadol, Morphine || 1 1 0Tramadol, Morphine, Diclazepam || Mirtazapine 1 1 0Tramadol, Morphine, Zopiclone 1 0 1Tramadol, Promethazine, Alcohol || 1 1 0|| Methadone, Amitriptyline, Pregabalin, Cannabis 1 1 0
X43 - Other drugs acting on the autonomic nervous systemAtenolol, Diphenhydramine, Pentazocine 1 1 0Propranolol, Fluoxetine, Temazepam, Lorazepam, Diazepam, Nefopam || Alcohol 1 1 0
Doxylamine, Alcohol 1 1 0Helium 1 1 0Unspecified drug 5 4 1Unspecified drug, Alcohol 1 1 0
X45 - AlcoholAlcohol 51 37 14Alcohol || 1 0 1Ethanol 1 1 0Unspecified drug, Alcohol || 1 1 0
X46 - Organic solvents and halogenated hydrocarbons and their vapoursHydrocarbon, Butane, Isobutane, Propane || Diazepam, Mirtazapine, Cannabis, Alcohol 1 1 0Hydrocarbon, Methadone, Butane, Isobutane, Propane, Methane || Diazepam, Cannabis, Delorazepam, Lorazepam 1 0 1
X47 - Other gases and vapoursButane, Isobutane, Propane, Lighter fluid, Morphine, Methadone, Diazepam 1 1 0Butane, Propane, Isobutane, Methadone, Morphine, Fluoxetine, Gabapentin || Diazepam, Mirtazapine, Alcohol 1 0 1
X49 - Other and unspecified chemicals and noxious substancesAsbestos 31 31 0DNP || Morphine, Tramadol, Caffeine, Diazepam 1 1 0
INTENTIONAL SELF-HARM 119 56 63X60 - X69 Intentional self-poisoning by and exposure to…
X60 - Nonopioid analgesics, antipyretics and antirheumaticsNefopam, Lofepramine, Quetiapine || Alcohol 1 1 0Paracetamol 10 5 5Paracetamol, Clozapine, Diphenhydramine 1 1 0Paracetamol, Codeine, Tramadol, Amitriptyline || 1 0 1
X61 - Antiepileptic, sedative-hypnotic, antiparkinsonism and psychotropic drugs, not elsewhere classifiedAmitriptyline || Fluoxetine, Cannabis, Alcohol 1 1 0Amitriptyline, Alcohol 2 0 2Amitriptyline, Fluoxetine, Alcohol || 1 0 1Amitriptyline, Tramadol, Gabapentin || Diazepam, Methadone, Flupenthixol 1 0 1Amphetamine, Gamma hydroxybutyrate, Alcohol || Trazodone 1 1 0Baclofen, Dihydrocodeine || Pregabalin, Amitriptyline, Paracetamol, Paroxetine, Olanzapine, Diazepam 1 1 0Caffeine 1 0 1Carbamazepine, Amitriptyline || Fluoxetine, Tramadol, Cyclizine, Dihydrocodeine 1 0 1Carbamazepine, Sertraline, Alcohol 1 0 1Chlorpromazine, Sertraline || Cannabis, Alcohol 1 1 0Citalopram 2 0 2Moclobemide, Zopiclone, Venlafaxine, Paracetamol, Codeine, Propranolol 1 0 1Olanzapine 1 1 0Olanzapine, Alcohol || 1 1 0Pentobarbitone 2 1 1Pentobarbitone || Dihydrocodeine, Alcohol 1 1 0Pentobarbitone || Tramadol, Codeine, Amitriptyline, Paracetamol 1 0 1Quetiapine || Lithium, Lamotrigine, Lignocaine, Atropine, Diazepam 1 1 0Quetiapine, Lofepramine, Paracetamol || Ibuprofen 1 1 0Quetiapine, Zopiclone 1 0 1Sertraline, Amitriptyline 1 1 0Zopiclone 1 0 1
X62 - Narcotics and psychodysleptics [hallucinogens], not elsewhere classifiedCo-codamol, Codeine, Paracetamol || Sertraline, Diazepam, Etizolam, Alcohol 1 0 1Codeine, Amitriptyline, Citalopram || Paracetamol, Quinine, Diazepam, Alcohol 1 0 1
X44 - Other and unspecified drugs, medicaments and biological substances 3
Page 178
Both Males FemalesICD code(s), cause of death and substance(s) 1
Codeine, Citalopram, Etizolam || Cannabis, Paracetamol, Alcohol 1 1 0Codeine, Dihydrocodeine, Mirtazapine || Amitriptyline, Paracetamol, Chlorpromazine, Tramadol, Diazepam 1 0 1Dihydrocodeine || Alcohol 1 0 1Dihydrocodeine || Mirtazapine, Diazepam, Olanzapine 1 0 1Dihydrocodeine, Codeine, Paracetamol, Gabapentin || Diazepam, Sertraline, Quetiapine, Alcohol 1 0 1Dihydrocodeine, Etizolam || 1 1 0Dihydrocodeine, Olanzapine, Sertraline, Alcohol || 1 0 1Dihydrocodeine, Pregabalin, Alcohol || Diazepam, Mirtazapine, Cannabis 1 1 0Dihydrocodeine, Pregabalin, Hydroxychloroquine || Diazepam, Zopiclone, Lignocaine, Alcohol 1 0 1Dihydrocodeine, Tramadol, Propranolol || Paracetamol, Amitriptyline 1 0 1Flecainide, Paracetamol 1 0 1Methadone, Tramadol, Diphenhydramine || Diazepam, Quetiapine, Duloxetine, Alcohol 1 0 1Morphine 1 0 1Morphine || Amitriptyline, Venlafaxine, Zopiclone, Alcohol 1 0 1Morphine, Dothiepin, Mirtazapine, Dihydrocodeine, Paracetamol || Chlorpromazine, Alcohol 1 0 1Morphine, Fentanyl, Oxycodone 1 0 1Morphine, Morphine sulphate, Oramorph 1 0 1Morphine, Propranolol, Fluoxetine || 1 0 1Opioid, Tramadol, Dihydrocodeine || 1 1 0Oxycodone 1 1 0Oxycodone, Dihydrocodeine, Amitriptyline, Codeine 1 0 1Tramadol || Gabapentin, Temazepam, Alcohol 1 1 0Tramadol, Amitriptyline, Nefopam || Diazepam, Quetiapine, Fluoxetine 1 0 1Tramadol, Dihydrocodeine, Amitriptyline || Paracetamol, Sertraline, Atenolol, Lamotrigine, Pregabalin 1 1 0Tramadol, Dosulepin || Alcohol 1 0 1Tramadol, Gabapentin, Dihydrocodeine, Phenytoin, Amitriptyline, Paracetamol || Alcohol 1 0 1Tramadol, Gabapentin, Temazepam, Duloxetine, Diazepam, Alcohol || 1 0 1Tramadol, Moclobemide, Procyclidine, Chlorpromazine || Diazepam, Alcohol 1 0 1Tramadol, Morphine || Alcohol 1 1 0
X63 - Other drugs acting on the autonomic nervous systemAtenolol 1 0 1Propranolol 5 1 4Propranolol || Citalopram, Alcohol 1 1 0Propranolol, Alcohol 1 1 0Propranolol, Alcohol || 2 1 1Propranolol, Mirtazapine, Zopiclone, Alcohol || Fluoxetine 1 1 0
Baclofen, Quetiapine || Propranolol, Zopiclone, Mirtazapine, Alcohol 1 1 0Colchicine 1 0 1Diazepam, Oxazepam, Temazepam, Mirtazapine, Gabapentin, Dihydrocodeine || 1 0 1Diphenhydramine 1 1 0Helium 4 4 0Hydroxychloroquine, Naproxen, Paracetamol, Amitriptyline || Alcohol 1 0 1Insulin 4 2 2Insulin, Fluoxetine, Zopiclone 1 1 0Propafenone 1 0 1Unspecified drug 6 2 4Verapamil, Ramipril, Dihydrocodeine || Cyclizine 1 0 1
X66 - Organic solvents and halogenated hydrocarbons and their vapoursHydrocarbon, Unspecified drug 1 0 1
X67 - Other gases and vapoursButane 1 1 0Butane, Isobutane, Propane || Cannabis 1 1 0Carbon monoxide 11 9 2Carbon monoxide, Tramadol 1 1 0Propane 1 1 0
X69 - Other and unspecified chemicals and noxious substancesStrychnine, Paracetamol 1 1 0
EVENTS OF UNDETERMINED INTENT 82 50 32Y10 - Y19 Poisoning by and exposure to…
Y10 - Nonopioid analgesics, antipyretics and antirheumaticsParacetamol 7 4 3
Y11 - Antiepileptic, sedative-hypnotic, antiparkinsonism and psychotropic drugs, not elsewhere classifiedAlprazolam 1 1 0Benzodiazepine 1 1 0Dothiepin 1 0 1Fluoxetine, Alcohol 1 0 1
X64 - Other and unspecified drugs, medicaments and biological substances 3
Page 179
Both Males FemalesICD code(s), cause of death and substance(s) 1
Gabapentin, Amitriptyline, Codeine, Carbamazepine 1 0 1Gabapentin, Tramadol, Diazepam || Alcohol 1 0 1MDMA, Alcohol || 1 1 0Olanzapine, Valproic acid || Diazepam, Sertraline, Quetiapine 1 1 0Quetiapine 1 1 0Sertraline, Dihydrocodeine 1 0 1Venlafaxine 1 1 0Venlafaxine, Alcohol || 1 1 0Zopiclone 1 1 0
Y12 - Narcotics and psychodysleptics [hallucinogens], not elsewhere classifiedCocaine || Mirtazapine, Levamisole, Cannabis, Alcohol 1 1 0Cocaine || Phenytoin 1 1 0Cocaine, Fentanyl || Diazepam, Alcohol 1 1 0Cocaine, Oxycodone, Fluoxetine || Tramadol, Diazepam, Gabapentin, Lamotrigine, Amitriptyline 1 0 1Dihydrocodeine || Diazepam, Cocaine, Alcohol 1 1 0Dihydrocodeine, Codeine || Citalopram, Mirtazapine, Paracetamol, Pregabalin, Diazepam 1 1 0Dihydrocodeine, Pregabalin || Amphetamine, Diazepam, Diclazepam, Olanzapine, Cannabis 1 1 0Fentanyl, Diazepam, Alcohol || 1 1 0Heroin || Temazepam, Alcohol 1 1 0Heroin, Alcohol || Diazepam 1 1 0Heroin, Diazepam, Diclazepam, Mirtazapine, Methadone || 1 1 0Heroin, Diazepam, Methadone || Gabapentin, Mirtazapine, Cannabis 1 1 0Heroin, Etizolam, Buprenorphine || Gabapentin, Diazepam, Cannabis, Alcohol 1 1 0Heroin, Gabapentin, Etizolam || Cannabis 1 0 1Heroin, Methadone || Diazepam, Alcohol 1 0 1Heroin, Methadone, Diazepam, Cocaine, Alcohol || Gabapentin, Cannabis 1 1 0Heroin, Methadone, Dihydrocodeine, Diazepam, Temazepam, Cocaine, Gabapentin || Cannabis 1 0 1Heroin, Morphine || Diazepam 1 1 0Heroin, Phenazepam || 1 0 1Methadone 1 0 1Methadone, Alcohol || Mirtazapine, Co-codamol, Gabapentin 1 1 0Methadone, Amitriptyline, Diazepam, Olanzapine, Amphetamine, Alcohol || Cannabis 1 1 0Methadone, Diazepam, Etizolam 1 1 0Methadone, Diazepam, Gabapentin || Alcohol 1 1 0Methadone, Diazepam, Gabapentin, Pregabalin || Venlafaxine, Cannabis, Alcohol 1 1 0Methadone, Etizolam, Gabapentin || Diazepam, Cannabis 1 0 1Methadone, Gabapentin, Diazepam || Olanzapine, Pregabalin, Norfluoxetine 1 0 1Methadone, Heroin, Codeine, Mirtazapine || Lorazepam, Lignocaine, Alcohol 1 1 0Methadone, Morphine, Diazepam, Cocaine || Sertraline 1 1 0Morphine || Cannabis 1 1 0Morphine || Citalopram, Alcohol 1 1 0Morphine, Amitriptyline || Fluoxetine, Gabapentin 1 0 1Morphine, Codeine || Paracetamol, Cyclizine 1 1 0Morphine, Codeine, Oxycodone, Hydrocodone, Diazepam, Gabapentin, Pregabalin || Alcohol 1 1 0Morphine, Diclazepam || Lamotrigine, Mirtazapine, Clobazam, Diazepam, Alcohol 1 0 1Morphine, Dihydrocodeine || 1 1 0Morphine, Dihydrocodeine || Diazepam, Temazepam, Cannabis 1 0 1Morphine, Gabapentin, Codeine || Diazepam, Quetiapine, Duloxetine, Alcohol 1 0 1Morphine, Heroin, Methadone, Diazepam, Gabapentin, Mirtazapine || Alcohol 1 1 0Morphine, MXP || Diazepam, Paracetamol 1 1 0Morphine, Methadone || Cannabis, Alcohol 1 1 0Morphine, Methadone, Diazepam, Alcohol || 1 1 0Morphine, Methadone, Gabapentin, Etizolam || Mirtazapine, Paracetamol, Cannabis, Alcohol 1 0 1Opiate 2 0 2Oxycodone 2 0 2Oxycodone, Gabapentin || Cannabis 1 1 0Tramadol 2 0 2Tramadol, Morphine || Amitriptyline, Paracetamol 1 0 1
Hydroxychloroquine, Paracetamol, Alcohol 1 0 1Iron, Theophylline || 1 1 0Unspecified drug 6 3 3Unspecified drug, Alcohol 1 1 0
Y17 - Other gases and vapoursCarbon monoxide 1 1 0Hydrogen sulfide 1 1 0
MENTAL DISORDERS 55 41 14F11 - F19 - Mental and behavioural disorders due to psychoactive substance use
F11 - OpioidsHeroin 1 1 0
Y14 - Other and unspecified drugs, medicaments and biological substances 3
Page 180
Both Males FemalesICD code(s), cause of death and substance(s) 1
Heroin, Buprenorphine || Diazepam, Cannabis 1 1 0Methadone || 1 1 0Methadone, Alcohol 1 1 0
F12 - CannabinoidsCannabis 1 1 0
F13 - Sedatives or hypnoticsDelorazepam || 1 1 0
F14 - CocaineCocaine || 1 1 0
F18 - Volatile solventsUnspecified solvent 1 1 0
F19 - Multiple drug use and use of other psychoactive substancesAmitriptyline, Methadone, Oxazepam, Diazepam, Temazepam, Cannabis 1 0 1Buprenorphine, Diclazepam, Pregabalin, Diazepam, Flubromazepam, Etizolam || 1 1 0Diazepam, Dihydrocodeine || Gamma hydroxybutyrate, Alcohol 1 1 0Diclazepam, Delorazepam, MDMA || Cannabis 1 1 0Dihydrocodeine, Morphine, Diazepam || Gamma hydroxybutyrate, Alcohol 1 1 0Methadone, Diazepam, Etizolam, Pregabalin, Gabapentin 1 1 0Methadone, Gabapentin || 1 1 0Methadone, Morphine, Dihydrocodeine, Diazepam, Pregabalin || 1 0 1Methadone, Morphine, Heroin, Amphetamine || Diazepam 1 1 0Morphine, Heroin, Dihydrocodeine, Diazepam, Zopiclone, Sertraline, Trazodone || 1 0 1Morphine, Heroin, Methadone, Diazepam || 1 1 0Morphine, Heroin, Methadone, Diclazepam, Delorazepam || Cannabis 1 1 0Non-steroidal anti-inflammatory drugs 2 1 1Opiate, Benzodiazepine, Unspecified drug 1 0 1Pregabalin, Diazepam || 1 0 1Unspecified drug 11 8 3Unspecified drug || 7 6 1Unspecified drug || Alcohol 2 1 1|| Cocaine, Diclazepam, MDMA, Mirtazapine, Sertraline 1 1 0|| Diclazepam, Morphine, Diazepam, Mirtazapine, Olanzapine, Buprenorphine 1 1 0|| Methadone, Citalopram, Diazepam, Alcohol 1 1 0|| Methadone, Codeine, Chlorpromazine, Alprazolam, Diazepam, Diclazepam, Cloxazolam 1 0 1|| Methadone, Etizolam 1 1 0|| Methadone, Morphine, Codeine, Alcohol 1 1 0|| Methadone, Morphine, Paracetamol, Benzodiazepine, Alcohol 1 1 0|| Methadone, Quetiapine, Diazepam, Cannabis 1 0 1|| Morphine, Diazepam 1 0 1|| Morphine, Diazepam, Mirtazapine, Paracetamol 1 1 0|| Psilocin, Cannabis, Gamma hydroxybutyrate, Alcohol 1 1 0
COMPLICATIONS OF MEDICAL AND SURGICAL CARE 24 12 12Y40 - Y59 - Drugs, medicaments and biological substances causing adverse effects in therapeutic use
Y44 - Agents primarily affecting blood constituentsAnticoagulant 6 2 4Anticoagulant, Naproxen 1 0 1Thrombolytic drugs 1 1 0Warfarin 6 3 3
Y45 - Analgesics, antipyretics and anti-inflammatory drugsAntirheumatic drug 1 0 1Aspirin 2 2 0Naproxen, Aspirin 1 1 0Paracetamol 1 0 1
Y49 - Psychotropic drugs, not elsewhere classifiedNeuroleptic drug 1 1 0
Y52 - Agents primarily affecting the cardiovascular systemAmiodarone 2 1 1
Y57 - Other and unspecified drugs and medicamentsLevoflumanide 1 1 0Tazocin 1 0 1
Footnotes
Page 181
Both Males FemalesICD code(s), cause of death and substance(s) 1
1) Where it appears, '||' distinguishes between substances which, a pathologist believed, (i) were implicated in, or potentially contributed to, the cause of death; and (ii) were present, but were not considered to have had any direct contribution to the death. In addition, where it appears, '//' distinguishes between substances which, according to advice from someone other than a pathologist, (i) caused the death; and (ii) were present, but may not have caused the death.
Pathologists are asked to distinguish between the drugs or solvents: (i) which, the pathologists believe, were implicated in, or which potentially contributed to, the cause of death; and (ii) which were present, but which were not considered to have had any direct contribution to this death.In this table, the symbol '||' is used to distinguish between the substances which were mentioned under (i) and (ii): - anything listed before '||' was, a pathologist believed, implicated in, or potentially contributed to, the cause of death; - anything listed after '||' was present but not considered to have had any direct contribution to the death.
There is no '||' if NRS did not receive an 'ME4' form.Further information about the 'ME4' form can be found in 'Drug-related Deaths in Scotland', which is available on the NRS website.
In such cases, '//' is used in this table to distinguish between any substances which (i) were believed to have caused the death; and (ii) were present, but may not have caused the death.The '//' appears at the start of the list of substances if whoever provided the information could not say that any of the substances caused the death.Please note that NRS may edit slightly a list of substance names, if it contains any 'duplicates'. For example:(a) 'Opiate' should be removed if specific opiates (e.g. Morphine) were also reported;(b) 'Benzodiazepine' should be removed if specific benzodiazepines (e.g. Diazepam) were also reported;(c) 'Ecstasy' should be removed if specific ecstasy-type drugs (e.g. MDMA) were also reported.Where '||' appears, NRS edits the parts of the list before and after '||' separately, so the list as a whole could contain 'duplicates; and likewise for '//'. 2) This table does not include any deaths, counted against the specified ICD-10 codes, for which the substance(s) concerned were not mentioned.No such deaths were registered in 2016.
© Crown Copyright 2017
In most cases of deaths involving or resulting from the use of drugs or solvents, pathologists supply National Records of Scotland (NRS) with further information, using form ME4, including details of the drugs or solvents which were found in the body.
The '||' appears at the start of the list of substances in cases where the pathologist indicated that all the substances were present but not considered to have had any direct contribution to the death.The '||' appears at the end of the list of substances in cases where the pathologist believed that all the substances were implicated in, or potentially contributed, to the cause of death.
For almost all the other deaths, the only information about substances that NRS obtains is that which is given in the description of the cause of the death. For example, if the cause of death were given as 'toxic effects of heroin', the death would be counted in the table against 'Heroin', with no '||' or '//' symbols.However, in a few cases, NRS may be informed by someone (other than a pathologist) that, say, certain substances were present in the body but were not thought to have caused the death, or that it is not known whether they caused the death.
3) The ICD-10 code-lists specify that helium and 'therapeutic gases' should be counted under X44, X64 or Y14 (the one that is appropriate in each case will depend upon what, if anything, is known about any intent involved), rather than (say) one of the '… other gases' codes (X47, X67 and Y17)
Page 182
ICD Codes Cause of death
Deaths aged under 90 Years of life lost
Number
Working life (age 15-64) Life to age 90
All causes All 47,458 88 72 144 267 810 1,499Males 24,827 94 71 90 343 467 1,776
Females 22,631 81 74 54 195 343 1,236C00-97 Malignant neoplasms M 7,824 30 72 15 59 138 525
F 6,948 25 72 16 59 121 437C18-21 Malignant neoplasm of colon and rectum M 820 3 72 2 6 14 54
F 694 2 73 2 6 11 41C33-34 M 1,996 8 72 3 12 35 134
F 1,851 7 73 2 9 31 111C50 Malignant neoplasm of breast M 8 - 63 - - - 1
F 894 3 68 4 15 19 69C51-68 Malignant neoplasm of genitourinary organs M 1,404 5 75 1 5 20 75
F 1,044 4 71 3 10 19 69C91-95 Leukaemia M 219 1 73 - 2 4 14
F 150 1 74 - 1 2 9I00-I99 M 6,714 26 73 14 53 109 416
F 5,532 20 78 6 22 65 236I20-25 Ischaemic heart diseases M 3,546 13 72 8 31 62 237
F 2,171 8 77 2 7 27 97I05-15 Certain ther heart disease and hypertension M 269 1 74 - 1 4 16
F 294 1 78 - 1 3 12I60-69 Cerebrovascular diseases M 1,429 5 76 2 7 19 72
F 1,729 6 79 2 6 19 67J00-J99 M 2,841 11 75 4 13 40 151
F 2,980 11 77 3 10 38 135J12-18 Pneumonia M 582 2 76 1 4 8 30
F 576 2 79 1 3 6 23J40-46 Bronchitis, emphysema and asthma M 1,333 5 75 1 5 19 74
F 1,648 6 76 1 5 23 82Rem. J00- Other diseases of the respiratory system M 926 4 76 1 4 12 47
99 F 756 3 78 1 2 9 31Q00-Q99 M 100 - 31 3 11 6 22
F 79 - 38 2 7 4 15
R95 Sudden infant death syndrome M 11 - 0 1 2 1 4F 7 - 0 - 1 1 2
V01-X59 All accidental deaths M 1,216 5 53 20 75 44 169F 688 2 62 8 28 19 69
Motor vehicle traffic accidents M 137 1 43 3 12 6 24F 58 - 44 1 5 3 10
X60-X84 Intentional self-harm M 437 2 44 9 35 20 75Y87.0 F 164 1 45 3 12 7 26
Footnotes1) The figures in this table relate only to people who died before their 90th birthdays.
4) This is calculated using the actual age (in whole years) at death.
5) The population of all ages (including people aged 90 and over) is used as the denominator for the rate.6) The methodology for calculating years of life lost was revised on publication of the 2013 reference tables to bring it into line with other sources.
© Crown Copyright 2017
Table 6.13: Deaths aged under 90¹, years of 'working life'² lost and years of 'life to age 90'³ lost due to mortality from selected causes, per 10,000 population, Scotland, 2016
Mean age at death 4 (if died under
90)
Rate per 10,000
population (all ages)5
Years lost (thousands)
Years lost per 10,000
population (all ages) 5
Years lost (thousands)
Years lost per 10,000 population (all ages) 5
Malignant neoplasm of trachea, bronchus and lung
IX. DISEASES OF THE CIRCULATORY SYSTEM
X. DISEASES OF THE RESPIRATORY SYSTEM
XVII. CONGENITAL MALFORMATIONS, DEFORMATIONS AND CHROMOSOMAL ABNORMALITIES
V01-80, V87, V89, Y85
2) Defined as: 50 for deaths aged under 15; (65 minus age at death) for deaths aged 15-64; and 0 for deaths aged 65 and over. For example, someone dying at 38 would be counted as losing 27 years of working life and someone dying at 53 would be counted as losing 12 years of working life.
3) Defined as: (90 minus age at death) for deaths aged 0-89; and 0 for deaths aged 90 and over. For example, someone dying at 38 would be counted as losing 52 years of life, and someone dying at 53 would be counted as losing 37 years of life.
Page 183
Table 6.14: Average age at death, selected causes, Scotland, 1979 to 2016
Year All causes Cancer
1979 70.4 68.3 71.3 76.2 74.9 81.51980 70.6 68.4 71.6 76.4 75.3 81.61981 70.9 68.8 71.9 76.5 75.9 80.21982 71.3 68.7 72.3 76.8 76.5 82.61983 71.6 69.0 72.2 76.9 76.6 82.01984 71.6 69.1 72.5 77.4 76.6 83.31985 72.1 69.4 72.9 77.4 77.0 82.41986 72.3 69.8 73.0 77.7 77.4 83.41987 72.3 69.8 73.3 78.1 77.3 83.11988 72.4 69.9 73.5 78.3 77.8 83.41989 73.1 70.3 74.0 78.6 78.4 84.31990 72.9 70.3 74.1 78.8 78.1 84.01991 73.2 70.5 74.2 78.7 78.6 84.71992 73.3 70.6 74.5 79.1 78.8 84.11993 73.9 70.9 74.8 79.6 79.1 84.21994 73.6 70.9 75.0 79.4 79.0 84.81995 73.9 71.3 75.2 79.8 79.2 85.01996 74.0 71.3 75.5 80.3 79.3 85.01997 74.2 71.6 75.6 80.1 79.6 84.91998 74.2 71.6 75.6 80.3 79.7 85.41999 74.6 71.7 76.0 80.5 80.1 85.72000 74.5 72.2 76.0 80.7 78.9 85.62001 74.6 72.1 76.6 80.9 79.8 85.82002 74.7 72.0 76.6 81.3 79.6 86.12003 75.1 72.4 76.8 81.3 79.9 86.02004 75.0 72.3 77.0 81.5 79.8 85.72005 75.1 72.4 76.8 81.5 80.0 86.42006 75.0 72.6 76.9 81.4 79.8 86.22007 75.2 72.8 76.7 81.6 80.2 86.12008 75.3 73.0 77.0 81.3 80.3 86.02009 75.4 73.0 77.1 81.7 80.0 86.12010 75.6 73.2 77.3 81.8 80.5 86.42011 75.7 73.3 77.3 82.1 79.9 86.82012 76.3 73.6 77.3 82.1 80.6 86.72013 76.4 73.6 77.3 81.9 80.6 86.82014 76.5 73.8 77.5 82.4 80.3 86.92015 76.9 73.9 77.8 82.3 80.8 87.02016 76.4 73.9 77.2 81.8 80.3 86.9
Footnote
© Crown Copyright 2017
Ischaemic Heart Disease
Cerebrovascular Disease
Respiratory System Diseases
Dementia and Alzheimer's 1
1) The ICD-9 codes used for dementia and Alzheimer's for the period 1979 to 1999 (290 and 331.0) aren't directly comparable with the ICD-10 codes used from 2000 onwards (F01, F03, G30). Care should be taken when interpreting the trend over this period.
Page 184
Table 7.01a: Marriages, by sex and age, Scotland, 1946-50 to 2011-15
Year All ages Age group16-19 20-24 25-29 30-34 35-39 40-44 45-49 50-54 55+
Males1946-50 43,206 1,041 14,580 14,294 6,065 3,028 1,650 963 565 1,020 1951-55 41,718 1,382 16,552 12,787 5,032 2,195 1,324 848 602 996 1956-60 41,671 2,526 18,815 11,328 3,889 1,822 967 763 540 1,020 1961-65 40,235 3,545 19,361 9,738 3,088 1,478 864 579 502 1,080 1966-70 42,832 4,889 22,509 8,502 2,574 1,290 843 641 454 1,131 1971-75 41,404 5,061 20,740 8,454 2,594 1,284 838 668 536 1,229 1976-80 37,801 4,034 17,678 8,005 3,116 1,440 937 726 570 1,295 1981-85 35,756 2,327 15,390 8,917 3,600 1,913 1,110 763 580 1,156 1986-90 35,440 1,071 12,168 10,979 4,563 2,391 1,524 964 642 1,136 1991-95 32,866 379 7,364 11,024 6,055 2,984 1,821 1,268 749 1,223
1996-2000 29,966 206 3,502 9,311 7,014 3,921 2,178 1,499 1,040 1,295 2001-05 30,648 158 2,592 7,396 7,683 4,921 2,978 1,915 1,315 1,690 2006-10 28,934 84 1,899 6,704 6,581 4,679 3,194 2,316 1,499 1,979
29,135 60 1,610 6,752 6,869 4,071 3,017 2,453 1,823 2,480
Females1946-50 43,206 5,764 19,080 9,828 3,766 2,091 1,190 712 380 394 1951-55 41,718 6,749 19,905 8,008 3,041 1,476 983 687 414 455 1956-60 41,671 9,026 20,274 6,471 2,334 1,267 779 601 401 520 1961-65 40,235 10,752 19,283 5,100 1,800 1,054 707 519 408 609 1966-70 42,832 12,193 21,078 4,647 1,622 948 709 575 392 666 1971-75 41,404 12,117 18,877 5,119 1,739 1,004 721 599 455 774 1976-80 37,801 9,787 16,884 5,167 2,100 1,172 796 618 468 811 1981-85 35,756 6,254 16,689 6,272 2,414 1,425 914 679 446 662 1986-90 35,440 3,280 15,164 8,782 3,387 1,742 1,194 791 468 631 1991-95 32,866 1,337 10,482 10,079 4,940 2,364 1,415 1,031 569 648
1996-2000 29,966 719 5,912 9,638 6,107 3,159 1,763 1,217 745 706 2001-05 30,648 541 4,586 8,540 6,962 4,081 2,450 1,575 973 939 2006-10 28,934 257 3,433 8,194 6,148 4,031 2,688 1,912 1,152 1,120
29,255 197 2,855 8,287 6,540 3,511 2,653 2,179 1,497 1,537
Footnote1) Figures for 2011-15 include same-sex marriages.
© Crown Copyright 2017
2011-151
2011-151
Page 185
Table 7.01b: Marriages, by sex and age, Scotland, 1974 to 2016
Year All agesAge group
16-19 20-24 25-29 30-34 35-39 40-44 45-49 50-54Males
1974 41,171 5,156 19,768 8,817 2,709 1,313 895 668 581 1975 39,191 4,767 18,748 8,208 2,636 1,473 872 710 548 1976 37,543 4,468 17,661 8,014 2,736 1,344 881 701 528 1977 37,288 4,259 17,585 7,728 2,948 1,379 873 726 560 1978 37,811 4,043 17,396 7,910 3,246 1,377 1,014 792 622 1979 37,860 3,810 17,841 8,108 3,201 1,494 884 683 515 1980 38,500 3,591 17,907 8,263 3,447 1,605 1,034 728 626 1981 36,237 3,074 16,592 8,273 3,362 1,534 990 715 528 1982 34,942 2,692 15,484 8,215 3,333 1,811 1,007 708 551 1983 34,962 2,217 15,080 8,590 3,503 1,942 1,079 772 603 1984 36,253 2,014 15,154 9,602 3,752 2,037 1,198 769 602 1985 36,385 1,640 14,640 9,903 4,052 2,239 1,276 851 615 1986 35,790 1,433 13,610 10,322 4,125 2,292 1,332 879 604 1987 35,813 1,305 13,217 10,883 4,191 2,289 1,366 878 631 1988 35,599 1,001 12,214 11,140 4,609 2,377 1,576 949 609 1989 35,326 891 11,445 11,122 4,832 2,481 1,654 1,036 685 1990 34,672 725 10,355 11,430 5,061 2,518 1,692 1,080 680 1991 33,762 569 9,381 11,244 5,290 2,572 1,811 1,046 687 1992 35,057 468 8,662 11,587 6,022 3,031 1,919 1,296 787 1993 33,366 339 7,433 11,266 6,214 3,041 1,762 1,331 762 1994 31,480 274 6,099 10,812 6,176 3,045 1,819 1,320 730 1995 30,663 247 5,245 10,209 6,574 3,229 1,792 1,346 778 1996 30,241 209 4,434 10,056 6,574 3,472 1,940 1,428 860 1997 29,611 190 3,709 9,495 6,911 3,646 2,003 1,496 963 1998 29,668 210 3,358 9,439 6,987 3,833 2,112 1,398 1,014 1999 29,940 247 3,096 9,030 7,179 4,149 2,321 1,503 1,072 2000 30,367 174 2,910 8,536 7,419 4,503 2,515 1,669 1,291 2001 29,621 178 2,682 7,949 7,463 4,593 2,622 1,592 1,224 2002 29,826 158 2,604 7,467 7,692 4,596 2,731 1,771 1,262 2003 30,757 161 2,707 7,219 7,751 5,013 2,994 1,930 1,283 2004 32,154 152 2,685 7,365 7,992 5,339 3,214 2,096 1,407 2005 30,881 140 2,284 6,981 7,516 5,062 3,328 2,187 1,401 2006 29,898 102 2,138 6,795 6,935 5,015 3,219 2,369 1,403 2007 29,866 85 1,966 6,902 6,744 5,067 3,290 2,285 1,520 2008 28,903 71 1,837 6,654 6,370 4,626 3,324 2,397 1,608 2009 27,524 83 1,772 6,421 6,253 4,370 3,070 2,225 1,457 2010 28,480 79 1,782 6,748 6,601 4,317 3,066 2,304 1,507 2011 29,135 72 1,818 6,912 6,766 4,257 3,217 2,430 1,508 2012 30,534 59 1,902 7,019 7,284 4,363 3,214 2,561 1,748 2013 27,547 53 1,492 6,537 6,662 3,748 2,847 2,247 1,740
29,048 60 1,525 6,678 6,845 3,933 2,962 2,437 1,998 2015 29,412 55 1,312 6,616 6,789 4,054 2,845 2,588 2,122 2016 29,013 43 1,230 6,395 6,764 4,020 2,703 2,520 2,140
Year All agesAge group
16-19 20-24 25-29 30-34 35-39 40-44 45-49 50-54Females
1974 41,171 11,963 18,273 5,323 1,840 1,132 729 638 492 1975 39,191 11,302 17,223 5,126 1,907 986 779 576 468 1976 37,543 10,416 16,436 5,168 1,858 1,117 762 577 430
20141*
Page 186
1977 37,288 10,331 16,267 4,954 1,982 1,122 764 603 466 1978 37,811 9,781 16,676 5,054 2,208 1,231 794 632 525 1979 37,860 9,379 17,403 5,181 2,124 1,156 763 612 434 1980 38,500 9,028 17,637 5,476 2,326 1,232 895 665 482 1981 36,237 7,801 17,065 5,347 2,175 1,259 827 631 439 1982 34,942 6,908 16,283 5,594 2,251 1,294 872 638 445 1983 34,962 5,978 16,334 6,105 2,394 1,388 932 688 477 1984 36,253 5,685 16,906 6,922 2,502 1,515 957 723 407 1985 36,385 4,900 16,855 7,393 2,746 1,670 982 717 463 1986 35,790 4,306 16,255 7,720 2,926 1,697 1,023 739 470 1987 35,813 3,952 16,050 8,315 3,044 1,577 1,109 745 412 1988 35,599 3,128 15,365 8,959 3,311 1,734 1,230 796 437 1989 35,326 2,729 14,609 9,163 3,727 1,820 1,301 827 518 1990 34,672 2,285 13,542 9,755 3,925 1,885 1,309 850 501 1991 33,762 1,898 12,426 9,771 4,331 1,991 1,342 885 501 1992 35,057 1,589 11,974 10,457 4,822 2,370 1,477 1,065 608 1993 33,366 1,229 10,738 10,368 5,002 2,388 1,386 1,038 568 1994 31,480 1,046 9,204 9,895 5,145 2,499 1,418 1,071 577 1995 30,663 925 8,067 9,904 5,401 2,573 1,452 1,098 591 1996 30,241 742 7,155 9,818 5,674 2,822 1,555 1,163 631 1997 29,611 750 6,120 9,574 5,927 3,056 1,666 1,160 684 1998 29,668 729 5,808 9,763 6,036 3,067 1,658 1,149 751 1999 29,940 719 5,381 9,539 6,432 3,275 1,875 1,206 788 2000 30,367 654 5,098 9,495 6,463 3,572 2,061 1,407 872 2001 29,621 635 4,819 8,994 6,618 3,670 2,041 1,275 872 2002 29,826 555 4,612 8,520 6,832 3,794 2,321 1,416 906 2003 30,757 576 4,630 8,321 7,110 4,104 2,478 1,618 971 2004 32,154 545 4,767 8,528 7,235 4,522 2,641 1,788 1,033 2005 30,881 392 4,104 8,339 7,016 4,315 2,768 1,780 1,082 2006 29,898 314 3,794 8,230 6,511 4,280 2,723 1,939 1,036 2007 29,866 280 3,599 8,500 6,289 4,264 2,799 1,841 1,175 2008 28,903 233 3,338 8,128 5,906 4,197 2,806 1,953 1,196 2009 27,524 240 3,177 7,840 5,859 3,732 2,578 1,873 1,150 2010 28,480 219 3,255 8,274 6,176 3,680 2,532 1,953 1,201 2011 29,135 227 3,216 8,463 6,333 3,644 2,728 2,067 1,245 2012 30,534 252 3,220 8,786 6,743 3,640 2,824 2,176 1,411 2013 27,547 186 2,621 7,921 6,392 3,253 2,458 2,002 1,354
29,090 176 2,766 8,113 6,591 3,439 2,578 2,174 1,617 2015 29,970 142 2,452 8,152 6,639 3,579 2,676 2,478 1,856 2016 29,445 112 2,262 8,049 6,605 3,555 2,396 2,405 1,977
Footnote1) Figures for 2014 onwards include same-sex marriages.
Note
© Crown Copyright 2017
20141*
Some of the figures for earlier years, or those published previously, may differ slightly from those in other tables due to being produced at different times.
Page 187
Age group55+
Males1,264 1,229 1,210 1,230 1,411 1,324 1,299 1,169 1,141 1,176 1,125 1,169 1,193 1,053 1,124 1,180 1,131 1,162 1,285 1,218 1,205 1,243 1,268 1,198 1,317 1,343 1,350 1,318 1,545 1,699 1,904 1,982 1,922 2,007 2,016 1,873 2,076 2,155 2,384 2,221 2,610 3,031 3,198
Age group55+
Females781 824 779
Back to contents
Page 188
799 910 808 759 693 657 666 636 659 654 609 639 632 620 617 695 649 625 652 681 674 707 725 745 697 870 949
1,095 1,085 1,071 1,119 1,146 1,075 1,190 1,212 1,482 1,360 1,636 1,996 2,084
Some of the figures for earlier years, or those published previously, may differ slightly from those in other tables due to being produced at different
Page 189
Table 7.02: Same-sex marriages, by sex and marital status, Scotland, 2016
Marital Status of party 2Male Couples Female Couples
Single All Single
Single 261 22 1 - 284 360 69 222 9 - - 31 50 24 -
- - - - - 3 2 - - - - 76 76 - - -
All 283 31 1 76 391 413 95 2
Footnotes1) Includes those whose previous civil partnership was disolved.2) Includes surviving civil partners.
© Crown Copyright 2017
Marital status of party 1 Divorced1 Widowed2 Civil Partner3 Divorced1 Widowed2
Divorced1
Widowed2
Civil Partner3
3) From 16 December 2014, couples in a civil partnership registered in Scotland were able to change their civil partnership to a marriage. From 31 October 2015, couples in a civil partnership registered outside Scotland were able to change their civil partnership to a marriage.
Page 190
Table 7.02: Same-sex marriages, by sex and marital status, Scotland, 2016
Marital Status of party 2Female Couples
All
- 431 - 74 - 597 9797 607
Back to contents
Civil Partner3
3) From 16 December 2014, couples in a civil partnership registered in Scotland were able to change their civil partnership to a marriage. From 31 October 2015,
Page 191
Table 7.03(a): Mean age at marriage, by sex and marital status, Scotland, 1855 to 2016
Year
Males - mean age at marriage
All men
Bachelors who married Widowers who married
Divorcees
1855-60 28.8 27.0 42.5 - - 26.8 32.6 - 41.31861-70 28.6 26.8 42.1 - - 26.6 32.8 - 40.81871-80 28.5 26.6 41.7 - - 26.4 32.7 - 40.31881-90 28.5 26.8 41.8 - - 26.6 33.6 - 40.3
1891-1900 28.7 27.2 42.2 - - 27.0 33.6 - 40.51901-10 28.9 27.5 43.2 - - 27.4 34.0 - 41.71911-20 29.6 28.2 44.9 - - 27.9 34.3 - 43.41921-30 29.4 28.1 46.2 - - 27.8 36.2 - 44.41931-40¹ 29.4 28.2 47.2 38.9 - 28.0 37.7 34.1 45.51941-50 29.0 27.6 48.3 37.6 - 27.3 35.3 32.9 46.41951-60 27.9 26.4 52.2 38.5 - 26.0 39.3 33.2 49.41961-70 26.5 24.8 55.4 37.7 - 24.5 40.7 32.2 52.11971-80 26.8 24.3 56.9 36.6 - 23.7 41.0 30.3 53.01981-90 28.9 25.6 57.5 38.3 - 25.0 40.8 30.6 51.9
1991-2000 32.7 28.8 58.4 41.1 - 28.1 41.0 32.7 51.42001-2010 36.2 31.8 59.4 45.4 - 30.9 43.3 37.2 53.2
1998 33.8 29.8 58.2 41.9 - 29.0 42.6 33.6 50.41999 34.1 30.1 58.9 42.3 - 29.2 40.9 34.1 52.82000 34.6 30.5 58.2 43.0 - 29.7 42.5 34.6 52.72001 34.8 30.7 57.2 43.1 - 29.9 40.0 35.1 50.62002 35.2 31.0 59.5 43.7 - 30.2 41.9 35.3 54.92003 35.6 31.4 58.5 44.3 - 30.5 41.8 36.0 51.82004 35.9 31.6 59.4 44.8 - 30.7 42.7 36.6 52.82005 36.3 31.9 59.5 45.3 - 30.9 44.1 37.2 53.52006 36.5 32.1 59.0 45.8 - 31.1 43.6 37.7 53.32007 36.7 32.2 60.2 46.2 - 31.3 43.3 38.1 54.02008 37.0 32.5 59.5 46.8 - 31.4 43.0 38.7 53.22009 36.9 32.5 60.6 46.9 - 31.5 46.5 38.7 54.02010 36.9 32.5 60.3 47.4 - 31.6 46.0 38.9 54.12011 37.0 32.6 60.4 47.8 - 31.7 43.9 39.1 55.22012 37.2 32.9 60.5 48.3 - 31.9 44.5 39.8 55.82013 37.4 33.0 61.0 48.8 - 32.0 44.0 40.1 55.7
37.8 33.2 61.2 49.3 46.4 32.2 46.6 40.7 57.02015 38.4 33.6 62.0 50.1 46.8 32.6 46.6 41.4 55.42016 38.6 33.9 62.0 50.7 45.8 32.8 48.4 42.4 56.7
Year
Females - mean age at marriageSpinsters who married Widows who married
1855-60 25.6 24.9 36.7 - - 24.2 31.8 - 33.6
All bachelors
1
All widowers2
All divorced
men3
All Civil partners4
Spinsters /
Bachelors
Widows / Widowers
Spinsters /
Bachelors
20145*
All women
All spinsters1
All widows2
All divorced women3
All Civil partners4
Spinsters /
Bachelors
Widows / Widowers
Divorcees
Spinsters /
Bachelors
Page 192
1861-70 25.6 24.9 37.1 - - 24.2 32.0 - 33.61871-80 25.6 24.8 37.1 - - 24.1 32.2 - 33.81881-90 25.7 24.9 38.0 - - 24.2 32.3 - 34.6
1891-1900 25.9 25.2 38.4 - - 24.6 32.6 - 34.61901-10 26.2 25.6 38.6 - - 25.0 33.4 - 35.21911-20 26.7 26.0 37.7 - - 25.4 34.5 - 34.21921-30 26.5 25.8 40.2 - - 25.3 35.0 - 36.31931-40¹ 26.4 25.9 42.5 35.8 - 25.3 35.6 30.7 38.31941-50 26.0 25.2 40.0 33.7 - 24.6 37.0 30.5 35.11951-60 25.1 24.0 45.9 35.2 - 23.5 39.8 30.4 40.01961-70 24.1 22.8 49.2 34.8 - 22.3 42.4 28.7 42.01971-80 24.7 22.5 51.0 34.0 - 21.9 42.9 27.2 42.61981-90 26.6 23.8 51.7 35.7 - 23.2 41.6 27.6 42.4
1991-2000 30.4 27.0 52.6 38.4 - 26.3 40.6 30.5 43.52001-2010 33.7 29.9 53.8 42.7 - 29.0 43.1 34.5 46.1
1998 31.4 27.9 53.2 39.0 - 27.2 40.8 31.4 45.11999 31.8 28.2 52.6 39.5 - 27.4 42.0 31.8 43.42000 32.2 28.6 52.5 40.3 - 27.7 41.3 32.2 44.72001 32.3 28.8 51.4 40.3 - 27.9 41.2 32.4 42.92002 32.8 29.1 52.9 41.0 - 28.2 44.3 32.8 45.12003 33.2 29.4 53.2 41.7 - 28.5 41.1 33.6 43.32004 33.4 29.6 53.0 42.0 - 28.7 41.4 33.9 44.52005 33.8 29.9 53.6 42.6 - 29.0 44.2 34.3 46.62006 34.0 30.2 53.7 42.9 - 29.3 43.8 34.6 47.42007 34.2 30.3 54.1 43.4 - 29.3 44.1 35.0 46.52008 34.5 30.6 54.8 43.9 - 29.5 43.9 35.8 46.42009 34.4 30.7 55.3 44.3 - 29.6 43.4 36.1 50.22010 34.4 30.7 55.5 44.6 - 29.7 43.1 36.2 48.22011 34.5 30.9 54.5 45.0 - 29.8 44.4 36.7 47.42012 34.8 31.0 54.8 45.6 - 30.0 46.5 37.0 47.62013 35.0 31.2 54.7 46.0 - 30.2 45.4 37.7 46.3
35.4 31.4 55.2 46.6 42.2 30.4 45.7 38.1 49.12015 36.1 31.9 56.5 47.3 43.9 30.7 47.9 39.1 49.02016 36.3 32.2 56.6 47.9 47.7 31.0 46.0 39.7 49.4
Footnotes1) Before 1933 divorced men were included with bachelors and divorced women with spinsters.2) Includes surviving civil partners.3) Includes those whose previous civil partnership was disolved.
5) Figures for 2014 onwards include same-sex marriages.
© Crown Copyright 2017
20145*
4) From 16 December 2014, couples in a civil partnership registered in Scotland were able to change their civil partnership to a marriage. From 31 October 2015, couples in a civil partnership registered outside Scotland were able to change their civil partnership to a marriage.
Page 193
Table 7.03(a): Mean age at marriage, by sex and marital status, Scotland, 1855 to 2016
Males - mean age at marriageWidowers who married Divorced men who married
Divorcees Divorcees
46.0 - - - -45.8 - - - -45.6 - - - -45.8 - - - -46.7 - - - -47.2 - - - -48.0 - - - -50.8 - - - -53.3 49.6 38.0 43.5 40.353.9 47.5 37.3 41.7 39.457.5 49.9 36.9 44.2 40.659.8 51.9 35.5 46.5 39.861.7 52.6 33.6 47.3 38.963.7 54.0 34.6 49.2 41.065.6 56.2 37.5 51.1 43.466.7 58.3 41.8 53.9 47.666.2 55.7 38.3 51.6 44.266.3 56.6 38.8 50.8 44.664.3 56.8 39.5 51.3 45.265.3 56.1 39.7 52.2 45.466.1 57.8 40.1 52.3 45.965.9 57.5 40.8 53.0 46.365.9 58.8 41.2 53.8 46.967.7 57.8 41.7 54.0 47.466.2 57.8 41.9 53.7 48.268.2 58.7 42.6 54.1 48.267.1 58.4 43.3 54.8 48.866.9 60.7 43.3 54.9 49.068.1 59.4 43.6 56.0 49.767.3 59.5 44.0 54.5 50.366.0 60.0 44.3 56.5 50.868.5 60.1 44.9 56.1 51.367.8 60.4 45.2 56.3 51.869.9 61.2 46.2 56.9 52.568.5 61.8 46.7 57.8 53.0
Females - mean age at marriageWidows who married Divorced women who married
39.6 - - - -
Back to contents
Widows / Widowers
Spinsters /
Bachelors
Widows / Widowers
Widows / Widowers
Divorcees
Spinsters /
Bachelors
Widows / Widowers
Divorcees
Page 194
40.1 - - - -40.3 - - - -41.1 - - - -42.0 - - - -42.4 - - - -42.7 - - - -45.1 - - - -47.5 41.2 33.9 41.7 36.548.2 39.2 32.5 40.1 35.952.4 42.7 33.1 42.1 37.055.2 45.4 32.2 44.0 36.357.4 46.4 30.8 44.8 35.659.4 47.8 31.9 46.3 37.661.3 49.5 34.7 49.1 40.262.7 52.2 38.8 52.0 44.461.9 50.1 35.3 48.9 40.961.8 49.8 35.8 50.0 41.360.6 50.2 36.4 49.8 42.161.0 50.2 36.8 49.8 42.161.8 51.1 37.3 50.8 42.762.2 52.3 38.1 51.0 43.362.0 52.0 38.3 52.4 43.863.6 51.2 38.8 51.7 44.362.8 51.7 39.1 51.9 44.663.7 52.1 39.5 52.5 45.063.2 53.3 40.1 52.0 45.662.3 54.1 40.1 54.7 45.964.1 54.2 40.3 53.5 46.463.4 53.0 40.6 53.1 47.162.3 54.5 41.2 54.4 47.665.0 53.9 41.2 54.6 48.263.8 54.1 42.0 54.6 48.565.8 55.0 42.7 55.5 49.265.6 55.6 43.5 56.9 49.8
4) From 16 December 2014, couples in a civil partnership registered in Scotland were able to change their civil partnership to a marriage. From 31 October 2015, couples in a civil partnership
Page 195
Table 7.03(b): Marriages, by sex and marital status, Scotland, 1974 to 2016
Year
Males
All men
Bachelors who married Widowers who married
Divorcees
1974 41,174 35,781 1,588 3,805 - 33,299 356 2,126 459 1975 39,191 33,551 1,478 4,162 - 31,070 381 2,100 444 1976 37,543 31,690 1,435 4,418 - 29,119 326 2,245 364 1977 37,288 31,099 1,326 4,863 - 28,528 329 2,242 330 1978 37,814 31,047 1,348 5,419 - 28,262 300 2,485 336 1979 37,860 31,571 1,273 5,016 - 28,967 286 2,318 314 1980 38,501 31,472 1,252 5,777 - 28,692 258 2,522 291 1981 36,237 29,622 1,153 5,462 - 27,012 255 2,355 274 1982 34,942 28,357 1,169 5,416 - 25,752 237 2,368 236 1983 34,962 27,765 1,086 6,111 - 24,991 203 2,571 204 1984 36,253 28,753 1,012 6,488 - 25,951 212 2,590 217 1985 36,385 28,475 1,034 6,876 - 25,674 199 2,602 225 1986 35,790 27,860 1,040 6,890 - 24,958 183 2,719 204 1987 35,813 28,126 947 6,740 - 25,147 174 2,805 201 1988 35,599 27,622 915 7,062 - 24,628 185 2,809 165 1989 35,326 27,186 916 7,224 - 24,032 192 2,962 167 1990 34,672 26,636 928 7,108 - 23,529 183 2,924 172 1991 33,762 25,549 869 7,344 - 22,401 147 3,001 177 1992 35,057 26,106 924 8,027 - 22,588 192 3,326 156 1993 33,366 24,609 878 7,879 - 21,214 172 3,223 182 1994 31,480 23,004 822 7,654 - 19,644 153 3,207 142 1995 30,663 22,126 796 7,741 - 18,822 152 3,152 146 1996 30,241 21,456 739 8,046 - 18,073 152 3,231 142 1997 29,611 20,994 772 7,845 - 17,751 145 3,098 131 1998 29,668 20,988 747 7,933 - 17,678 140 3,170 116 1999 29,940 21,053 746 8,141 - 17,681 139 3,233 131 2000 30,367 21,201 739 8,427 - 17,864 131 3,206 132 2001 29,621 20,738 646 8,237 - 17,469 133 3,136 138 2002 29,826 20,671 680 8,475 - 17,426 138 3,107 126 2003 30,757 21,477 706 8,574 - 18,232 141 3,104 141 2004 32,154 22,526 698 8,930 - 19,039 153 3,334 139 2005 30,881 21,421 664 8,796 - 18,221 125 3,075 122 2006 29,898 20,912 656 8,330 - 17,922 126 2,864 116 2007 29,866 20,851 654 8,361 - 18,005 123 2,723 109 2008 29,803 20,245 623 8,035 - 17,462 100 2,683 128 2009 27,524 19,703 592 7,229 - 17,218 108 2,377 117 2010 28,480 20,609 617 7,254 - 18,115 116 2,378 124
Year
Males
All men
Bachelors who married Widowers who married
Divorcees
2011 29,135 21,308 575 7,252 - 18,753 109 2,446 122 2012 30,534 22,471 586 7,477 - 19,717 120 2,634 113 2013 27,547 20,378 518 6,651 - 17,995 102 2,281 95
29,048 21,160 604 6,944 340 18,787 113 2,260 122
All bachelors
1
All widowers2
All divorced
men3
All Civil partners4
Spinsters /
Bachelors
Widows / Widowers
Spinsters /
Bachelors
All bachelors
1
All widowers2
All divorced
men3
All Civil partners4
Spinsters /
Bachelors
Widows / Widowers
Spinsters /
Bachelors
20145*
Page 196
2015 29,412 21,173 617 6,862 760 18,797 107 2,269 111 2016 29,013 21,235 617 7,008 153 18,852 107 2,276 143
Year
Females Spinsters who married Widows who married
1974 41,174 35,920 1,438 3,816 - 33,299 459 2,162 356 1975 39,191 33,758 1,394 4,039 - 31,070 444 2,244 381 1976 37,543 31,875 1,330 4,338 - 29,119 364 2,392 326 1977 37,288 31,455 1,263 4,570 - 28,528 330 2,597 329 1978 37,814 31,420 1,269 5,125 - 28,262 336 2,822 300 1979 37,860 31,989 1,219 4,652 - 28,967 314 2,708 286 1980 38,501 31,968 1,178 5,355 - 28,692 291 2,985 258 1981 36,237 30,103 1,069 5,065 - 27,012 274 2,817 255 1982 34,942 28,736 1,043 5,163 - 25,752 236 2,748 237 1983 34,962 28,185 1,022 5,755 - 24,991 204 2,990 203 1984 36,253 29,358 947 5,948 - 25,951 217 3,190 212 1985 36,385 29,208 944 6,233 - 25,674 225 3,309 199 1986 35,790 28,414 924 6,452 - 24,958 204 3,252 183 1987 35,813 28,588 876 6,349 - 25,147 201 3,240 174 1988 35,599 28,150 875 6,574 - 24,628 165 3,357 185 1989 35,326 27,606 888 6,832 - 24,032 167 3,407 192 1990 34,672 26,940 863 6,869 - 23,529 172 3,239 183 1991 33,762 25,979 735 7,048 - 22,401 177 3,401 147 1992 35,057 26,274 848 7,935 - 22,588 156 3,530 192 1993 33,366 25,103 794 7,469 - 21,214 182 3,707 172 1994 31,480 23,248 745 7,487 - 19,644 142 3,462 153 1995 30,663 22,410 711 7,542 - 18,822 146 3,442 152 1996 30,241 21,800 724 7,717 - 18,073 142 3,585 152 1997 29,611 21,303 687 7,621 - 17,751 131 3,421 145 1998 29,668 21,241 673 7,754 - 17,678 116 3,447 140 1999 29,940 21,309 683 7,948 - 17,681 131 3,497 139 2000 30,367 21,608 618 8,141 - 17,864 132 3,612 131 2001 29,621 21,223 573 7,825 - 17,469 138 3,616 133 2002 29,826 21,180 638 8,008 - 17,426 126 3,628 138 2003 30,757 21,974 626 8,157 - 18,232 141 3,601 141 2004 32,154 22,884 648 8,622 - 19,039 139 3,706 153 2005 30,881 21,991 646 8,244 - 18,221 122 3,648 125 2006 29,898 21,460 636 7,802 - 17,922 116 3,422 126 2007 29,866 21,482 591 7,793 - 18,005 109 3,368 123 2008 29,803 20,891 542 7,470 - 17,462 128 3,301 100 2009 27,524 20,359 481 6,684 - 17,218 117 3,024 108 2010 28,480 21,236 534 6,710 - 18,115 124 2,997 116
Year
Females Spinsters who married Widows who married
2011 29,135 21,957 520 6,658 - 18,753 122 3,082 109 2012 30,534 22,920 549 7,065 - 19,717 113 3,090 120
All women
All spinsters1
All widows2
All divorced women3
All Civil partners4
Spinsters /
Bachelors
Widows / Widowers
Divorcees
Spinsters /
Bachelors
All women
All spinsters1
All widows2
All divorced women3
All Civil partners4
Spinsters /
Bachelors
Widows / Widowers
Divorcees
Spinsters /
Bachelors
Page 197
2013 27,547 20,792 452 6,303 - 17,995 95 2,702 102 29,090 21,713 517 6,482 378 18,793 122 2,798 113
2015 29,970 21,753 521 6,584 1,112 18,829 110 2,814 106 2016 29,445 22,090 563 6,597 195 19,050 147 2,893 111
Footnotes1) Includes annulled marriages and cases where the marial status was not stated.
2) Includes surviving civil partners.3) Includes those whose previous civil partnership was disolved.
5) Figures for 2014 onwards include same-sex marriages.
© Crown Copyright 2017
20145*
4) From 16 December 2014, couples in a civil partnership registered in Scotland were able to change their civil partnership to a marriage. From 31 October 2015, couples in a civil partnership registered outside Scotland were able to change their civil partnership to a marriage.
Page 198
Males Widowers who married Divorced men who married
Divorcees Divorcees
776 353 2,162 306 1,337 714 320 2,244 299 1,619 695 376 2,392 309 1,717 597 399 2,597 337 1,929 598 414 2,822 371 2,226 584 375 2,708 349 1,959 546 415 2,985 374 2,418 498 381 2,817 316 2,329 514 419 2,748 292 2,376 459 423 2,990 360 2,761 407 388 3,190 328 2,970 407 402 3,309 338 3,229 413 423 3,252 328 3,310 377 369 3,240 325 3,175 372 378 3,357 318 3,387 355 394 3,407 341 3,476 348 408 3,239 332 3,537 311 381 3,401 277 3,666 335 433 3,530 321 4,176 307 389 3,707 315 3,857 283 397 3,462 309 3,883 256 394 3,442 303 3,996 242 355 3,585 330 4,131 244 397 3,421 298 4,126 235 396 3,447 298 4,188 232 383 3,497 312 4,332 207 400 3,612 280 4,535 155 353 3,616 285 4,336 186 368 3,628 314 4,533 182 383 3,601 303 4,670 381 178 3,706 317 4,907 170 372 3,648 351 4,797 161 379 3,422 349 4,559 157 388 3,368 311 4,682 154 341 3,301 288 4,446 120 355 3,024 253 3,952 139 354 2,997 279 3,978
Males Widowers who married Divorced men who married
Divorcees Divorcees
136 317 3,082 275 3,895 125 348 3,090 304 4,083 104 319 2,702 246 3,703 120 362 2,798 284 3,862
Back to contents
Widows / Widowers
Spinsters /
Bachelors
Widows / Widowers
Widows / Widowers
Spinsters /
Bachelors
Widows / Widowers
Page 199
132 374 2,746 283 3,833 122 352 2,818 328 3,862
Females Widows who married Divorced women who married
776 306 2,126 353 1,337 714 299 2,100 320 1,619 695 309 2,245 376 1,717 597 337 2,242 399 1,929 598 371 2,485 414 2,226 584 349 2,318 375 1,959 546 374 2,522 415 2,418 498 316 2,355 381 2,329 514 292 2,368 419 2,376 459 360 2,571 423 2,761 407 328 2,590 388 2,970 407 338 2,602 402 3,229 413 328 2,719 423 3,310 377 325 2,805 369 3,175 372 318 2,809 378 3,387 355 341 2,962 394 3,476 348 332 2,924 408 3,537 311 277 3,001 381 3,666 335 321 3,326 433 4,176 307 315 3,223 389 3,857 283 309 3,207 397 3,883 256 303 3,152 394 3,996 242 330 3,231 355 4,131 244 298 3,098 397 4,126 235 298 3,170 396 4,188 232 312 3,233 383 4,332 207 280 3,206 400 4,535 155 285 3,136 353 4,336 186 314 3,107 368 4,533 182 303 3,104 383 4,670 178 317 3,334 381 4,907 170 351 3,075 372 4,797 161 349 2,864 379 4,559 157 311 2,723 388 4,682 154 288 2,683 341 4,446 120 253 2,377 355 3,952 139 279 2,378 354 3,978
Females Widows who married Divorced women who married
136 275 2,446 317 3,895 125 304 2,634 348 4,083
Widows / Widowers
Divorcees
Spinsters /
Bachelors
Widows / Widowers
Divorcees
Widows / Widowers
Divorcees
Spinsters /
Bachelors
Widows / Widowers
Divorcees
Page 200
104 246 2,281 319 3,703 120 284 2,260 362 3,860 132 283 2,337 374 3,873 122 330 2,351 354 3,892
4) From 16 December 2014, couples in a civil partnership registered in Scotland were able to change their civil partnership to a marriage. From 31 October 2015, couples in a civil partnership
Page 201
Table 7.04: Marriages, percentages by marital status of persons marrying, Scotland, 1855 to 2016
Year Percentage of males marrying who were Percentage of females marrying who were
1855-60 84.3 11.2 - - 80.1 5.4 - - 4.5 1861-70 87.3 11.5 - - 93.6 5.2 - - 1.2 1871-80 87.8 12.0 - - 93.5 6.3 - - 0.2 1881-90 88.6 11.4 - - 94.2 5.8 - - -
1891-1900 90.1 9.9 - - 94.6 5.3 - - - 1901-10 91.4 8.5 - - 95.0 4.9 - - - 1911-20 91.7 8.3 - - 93.4 6.6 - - - 1921-30 92.6 7.4 - - 95.2 4.8 - - -
93.4 5.9 0.7 - 96.3 3.0 0.7 - - 1941-50 91.7 5.7 2.6 - 93.3 4.3 2.4 - - 1951-60 92.5 4.4 3.1 - 93.4 3.3 3.3 - - 1961-70 92.4 3.7 3.9 - 92.9 3.1 4.0 - - 1971-80 85.8 3.6 10.6 - 86.4 3.3 10.3 - - 1981-90 78.8 2.9 18.4 - 80.1 2.7 17.2 - -
1991-2000 72.3 2.6 25.2 - 73.3 2.3 24.4 - - 2001-2010 70.2 2.2 27.6 - 72.1 2.0 26.0 - -
1971 90.7 3.5 5.8 - 90.9 3.1 5.9 - - 1972 89.8 3.7 6.5 - 90.1 3.2 6.7 - - 1973 88.1 3.9 8.1 - 88.2 3.4 8.3 - - 1974 86.9 3.9 9.2 - 87.2 3.5 9.3 - - 1975 85.6 3.8 10.6 - 86.1 3.6 10.3 - - 1976 84.4 3.8 11.8 - 84.9 3.5 11.6 - - 1977 83.4 3.6 13.0 - 84.4 3.4 12.3 - - 1978 82.1 3.6 14.3 - 83.1 3.4 13.6 - - 1979 83.4 3.4 13.2 - 84.5 3.2 12.3 - - 1980 81.7 3.3 15.0 - 83.0 3.1 13.9 - - 1981 81.7 3.2 15.1 - 83.1 3.0 14.0 - - 1982 81.2 3.3 15.5 - 82.2 3.0 14.8 - - 1983 79.4 3.1 17.5 - 80.6 2.9 16.5 - - 1984 79.3 2.8 17.9 - 81.0 2.6 16.4 - - 1985 78.3 2.8 18.9 - 80.3 2.6 17.1 - - 1986 77.8 2.9 19.3 - 79.4 2.6 18.0 - - 1987 78.5 2.6 18.8 - 79.8 2.4 17.7 - - 1988 77.6 2.6 19.8 - 79.1 2.5 18.5 - - 1989 77.0 2.6 20.4 - 78.1 2.5 19.3 - - 1990 76.8 2.7 20.5 - 77.7 2.5 19.8 - - 1991 75.7 2.6 21.8 - 76.9 2.2 20.9 - - 1992 74.5 2.6 22.9 - 74.9 2.4 22.6 - - 1993 73.8 2.6 23.6 - 75.2 2.4 22.4 - - 1994 73.1 2.6 24.3 - 73.9 2.4 23.8 - - 1995 72.2 2.6 25.2 - 73.1 2.3 24.6 - - 1996 70.9 2.4 26.6 - 72.1 2.4 25.5 - - 1997 70.9 2.6 26.5 - 71.9 2.3 25.7 - - 1998 70.7 2.5 26.7 - 71.6 2.3 26.1 - - 1999 70.3 2.5 27.2 - 71.2 2.3 26.5 - - 2000 69.8 2.4 27.8 - 71.2 2.0 26.8 - - 2001 70.0 2.2 27.8 - 71.6 1.9 26.4 - - 2002 69.3 2.3 28.4 - 71.0 2.1 26.8 - - 2003 69.8 2.3 27.9 - 71.4 2.0 26.5 - - 2004 70.1 2.2 27.8 - 71.2 2.0 26.8 - - 2005 69.4 2.2 28.5 - 71.2 2.1 26.7 - - 2006 69.9 2.2 27.9 - 71.8 2.1 26.1 - - 2007 69.8 2.2 28.0 - 71.9 2.0 26.1 - - 2008 70.0 2.2 27.8 - 72.2 1.9 25.8 - - 2009 71.6 2.2 26.3 - 73.9 1.7 24.3 - - 2010 72.4 2.2 25.5 - 74.6 1.9 23.6 - - 2011 73.1 2.0 24.9 - 75.4 1.8 22.9 - - 2012 73.6 1.9 24.5 - 75.1 1.8 23.1 - - 2013 74.0 1.9 24.1 - 75.5 1.6 22.9 - -
72.8 2.1 23.9 1.2 74.6 1.8 22.3 1.3 - 2015 72.0 2.1 23.3 2.6 72.6 1.7 22.0 3.7 - 2016 70.6 2.5 26.3 0.6 70.9 2.4 25.3 1.5 -
Footnotes1) Before 1933 divorced men were included with bachelors and divorced women with spinsters.2) Includes surviving civil partners.3) Includes those whose previous civil partnership was disolved.
5) Figures for 2014 onwards include same-sex marriages.
© Crown Copyright 2017
Not stated (either spouse)Bachelors1 Widowers2 Divorcees3 Civil Partners4 Spinsters1 Widows2 Divorcees3 Civil Partners4
1931-40 1
20145*
4) From 16 December 2014, couples in a civil partnership registered in Scotland were able to change their civil partnership to a marriage. From 31 October 2015, couples in a civil partnership registered outside Scotland were able to change their civil partnership to a marriage.
Page 202
2006 2007 2008 2009 2010 2011 2012 2013 2015 2016
Church of Scotland 8,021 7,685 7,007 6,143 6,005 5,557 5,508 4,616 4,505 4,052 3,675
Humanist Society Scotland 434 710 1,026 1,544 2,092 2,486 3,052 3,185 3,551 3,378 3,040
Roman Catholic Church 2,006 1,953 1,873 1,788 1,776 1,729 1,827 1,582 1,555 1,438 1,346
Assemblies of God 469 631 671 675 879 865 886 722 570 524 625 735 758 727 703 695 694 589 485 507 435 410
Methodist Church in Scotland 771 564 525 538 522 485 484 301 171 205 167
Baptist Union of Scotland 390 326 264 282 283 278 240 233 218 209 202
Temporary Authorisation - Non Christian 10 26 29 54 56 37 165 355 180 353 623
Independent Humanist Ceremonies 0 0 0 0 0 0 0 0 291 557 936
Temporary Authorisation - Christian 142 138 119 140 148 125 150 145 181 161 205
One Spirit Interfaith Seminary 0 0 0 0 2 93 193 233 305 340 374
River of Life Church 1 1 1 3 3 25 123 193 269 363 432
Bathgate Community Church 99 90 87 86 148 207 182 139 144 107 101
United Reformed Church 137 114 127 103 100 95 110 115 90 94 53
United Free Church of Scotland 184 132 126 112 105 92 77 65 57 62 45
Church of Christ 137 103 79 95 122 113 134 91 69 45 50
Free Church of Scotland 83 92 96 78 83 89 87 91 115 94 89
Humanist Fellowship of Scotland 0 0 0 0 0 0 0 0 91 355 519
Fuze Foundation 0 0 0 0 0 0 0 0 171 290 372
Christian Brethren 78 72 68 63 58 67 66 57 57 42 29
Church of the Nazarene 65 66 61 38 56 59 56 44 32 47 39
Glasgow Central Mosque 48 23 35 34 37 58 55 62 75 51 39
Christian Spiritualist Society 58 62 43 63 36 21 18 17 27 51 54
Jehovah's Witnesses 35 47 36 46 41 40 37 30 30 38 32
Salvation Army 46 35 33 31 43 40 36 30 47 37 32
Elim Pentecostal Church 21 19 26 27 22 28 58 63 44 37 56 30 38 38 35 53 49 44 29 27 35 17
Scottish Unitarian Association 82 56 44 39 43 31 22 20 17 15 13
The Pagan Federation (Scotland) 13 14 16 26 15 27 48 35 43 31 34
Findhorn Foundation 32 39 32 32 30 41 18 14 19 21 11
Spiritualists' National Union 22 24 21 14 31 29 43 19 18 15 7 19 16 18 19 26 21 27 30 22 22 22
The Shore Fellowship 0 0 0 7 14 20 27 32 42 51 47 7 9 19 11 16 24 32 20 23 20 26
Jamia Islamia 11 16 10 11 24 40 32 10 22 19 11
Madrasa Ta'Aleem-Ul-Islam 8 15 12 19 20 21 13 28 23 21 16
United Kingdom Islamic Mission 10 13 12 14 14 28 14 13 17 20 11 14 29 13 12 11 6 20 9 14 22 13
Parkhead Congregational Church 12 11 10 13 17 15 17 12 10 8 15
Lanarkshire Muslim Welfare Society 6 8 7 7 9 15 13 19 19 21 13
Destiny Church 3 10 11 12 10 11 8 9 6 17 26
Kilwinning Congregational Church 13 14 13 9 12 9 13 10 9 10 7
The Scottish Humanists 0 0 0 0 0 0 0 0 33 41 45 43 44 4 0 1 4 4 3 2 0 3
Sikh Sabha Association, Glasgow 4 5 6 6 9 6 11 8 22 14 10
Hebrew Congregation (Jews) 10 12 11 7 10 15 12 5 9 7 0
The Apostolic Church 5 5 3 13 5 12 11 8 7 14 6
Masjid Noor 3 4 4 5 3 8 15 8 10 11 16
Free Presbyterian Church of Scotland 14 8 7 4 8 8 6 4 5 10 11
Dundee Islamic Society 2 4 9 13 8 6 9 8 13 9 4
Footnotes1) The 50 denominations which had the largest total numbers of marriages in the period covered by the table. They are listed in descending order of those totals.
3) Figures for 2014 onwards include same-sex marriages.
Table 7.05: Marriages, religious forms and other beliefs, by selected denomination1, 2006 to 2016
Denomination2 2014 3
Scottish Episcopal Church and other churches of the Anglican Communion
Church of Jesus Christ of Latter-Day Saints
Pakistan Association Edinburgh and East of Scotland
Anjuman Ehl-I-Sunnat, Wal Jumaat (Masjid-I-Khizra)
Royal National Mission to Deep Sea Fishermen
Fellowship of Independent Evangelical Churches
2) If a denomination's name has changed, what appears here is the name that is given in the version of National Records of Scotland (NRS)'s 'denomination codes' list that is available on the NRS website.
Page 203
Table 7.06: Marriages, numbers and percentages, by method of celebration, Scotland, 1946 to 2016
Year
Number of marriages Percentage of all marriagesReligious, etc.
Civil
Religious, etc.
Civil Irregular
1946-50 43,206 25,551 5,743 4,432 7,469 11 59.1 13.3 10.3 17.3 0.03 1951-55 41,718 23,908 6,308 3,952 7,542 8 57.3 15.1 9.5 18.1 0.02 1956-60 41,671 23,568 6,961 3,694 7,444 4 56.6 16.7 8.9 17.9 0.01 1961-65 40,235 21,761 6,780 3,365 8,325 4 54.1 16.9 8.4 20.7 0.01 1966-70 42,832 21,301 6,924 3,266 11,338 3 49.7 16.2 7.6 26.5 0.01 1971-75 41,404 18,279 6,500 2,726 13,897 2 44.1 15.7 6.6 33.6 0.00 1976-80 37,801 15,370 5,590 2,222 14,616 3 40.7 14.8 5.9 38.7 0.01 1981-85 35,756 14,177 4,932 2,204 14,437 5 39.6 13.8 6.2 40.4 0.01 1986-90 35,440 14,093 4,432 2,250 14,661 4 39.8 12.5 6.3 41.4 0.01 1991-95 32,866 12,396 3,394 2,270 14,800 5 37.7 10.3 6.9 45.0 0.02
1996-2000 29,966 10,591 2,367 4,070 12,931 6 35.3 7.9 13.6 43.2 0.02 2001-05 30,648 10,180 2,013 4,807 13,644 4 33.2 6.6 15.7 44.5 0.01 2006-10 28,934 6,972 1,879 5,170 14,911 2 24.1 6.5 17.9 51.5 0.01 2011-15 29,195 4,848 1,626 7,663 15,058 - 16.6 5.6 26.2 51.6 -
1961 40,562 22,580 6,940 3,469 7,568 5 55.7 17.1 8.6 18.7 0.01 1962 40,244 21,843 6,858 3,430 8,111 2 54.3 17.0 8.5 20.2 0.00 1963 39,653 21,519 6,715 3,348 8,066 5 54.3 16.9 8.4 20.3 0.01 1964 40,242 21,568 6,702 3,361 8,610 1 53.6 16.7 8.4 21.4 0.00 1965 40,475 21,297 6,687 3,216 9,270 5 52.6 16.5 8.0 22.9 0.01 1966 41,851 21,572 6,756 3,263 10,256 4 51.5 16.1 7.8 24.5 0.01 1967 42,116 21,284 6,940 3,298 10,590 4 50.5 16.5 7.8 25.1 0.01 1968 43,696 21,938 6,949 3,336 11,470 3 50.2 15.9 7.6 26.3 0.01 1969 43,294 21,046 6,875 3,313 12,057 3 48.6 15.9 7.7 27.8 0.01 1970 43,203 20,664 7,099 3,122 12,318 - 47.8 16.4 7.2 28.5 0.00 1971 42,500 19,534 6,930 2,952 13,083 1 46.0 16.3 7.0 30.8 0.00 1972 42,139 18,911 6,598 2,836 13,793 1 44.9 15.7 6.7 32.7 0.00 1973 42,018 18,307 6,603 2,710 14,395 3 43.6 15.7 6.5 34.3 0.01 1974 41,174 17,768 6,368 2,699 14,335 4 43.2 15.5 6.6 34.8 0.01 1975 39,191 16,874 6,003 2,431 13,880 3 43.1 15.3 6.2 35.4 0.01 1976 37,543 15,675 5,620 2,148 14,100 - 41.8 15.0 5.7 37.6 0.00 1977 37,288 15,385 5,518 2,115 14,267 3 41.3 14.8 5.7 38.3 0.01 1978 37,814 15,154 5,480 2,215 14,960 5 40.1 14.5 5.9 39.6 0.01 1979 37,860 15,271 5,666 2,272 14,645 6 40.3 15.0 6.0 38.7 0.02 1980 38,501 15,367 5,665 2,358 15,109 2 39.9 14.7 6.1 39.2 0.01 1981 36,237 14,542 5,237 2,291 14,162 5 40.1 14.5 6.3 39.1 0.01 1982 34,942 13,817 4,870 2,296 13,948 11 39.5 13.9 6.6 39.9 0.03 1983 34,962 13,812 4,766 2,069 14,313 2 39.5 13.6 5.9 40.9 0.01 1984 36,253 14,402 4,974 2,117 14,758 2 39.7 13.7 5.8 40.7 0.01 1985 36,385 14,314 4,813 2,249 15,002 7 39.3 13.2 6.2 41.2 0.02 1986 35,790 14,094 4,684 2,212 14,796 4 39.4 13.1 6.2 41.3 0.01 1987 35,813 14,131 4,438 2,312 14,928 4 39.5 12.4 6.5 41.7 0.01 1988 35,599 14,065 4,534 2,153 14,841 6 39.5 12.7 6.0 41.7 0.02 1989 35,326 14,115 4,368 2,228 14,613 2 40.0 12.4 6.3 41.4 0.01 1990 34,672 14,061 4,134 2,343 14,128 6 40.6 11.9 6.8 40.7 0.02 1991 33,762 13,124 3,911 2,218 14,505 4 38.9 11.6 6.6 43.0 0.01 1992 35,057 13,195 3,726 2,343 15,789 4 37.6 10.6 6.7 45.0 0.01 1993 33,366 12,711 3,355 2,273 15,018 9 38.1 10.1 6.8 45.0 0.03 1994 31,480 11,767 3,029 2,206 14,474 4 37.4 9.6 7.0 46.0 0.01 1995 30,663 11,185 2,948 2,309 14,215 6 36.5 9.6 7.5 46.4 0.02 1996 30,241 10,649 2,500 3,041 14,044 8 35.2 8.3 10.1 46.4 0.03 1997 29,611 10,291 2,488 3,628 13,200 4 34.8 8.4 12.2 44.6 0.01 1998 29,668 10,357 2,360 4,047 12,898 6 34.9 8.0 13.6 43.5 0.02 1999 29,940 10,393 2,237 4,868 12,434 8 34.7 7.5 16.2 41.5 0.03 2000 30,367 11,267 2,249 4,766 12,079 6 37.1 7.4 15.7 39.8 0.02 2001 29,621 11,396 2,050 4,684 11,487 4 38.5 6.9 15.8 38.8 0.01 2002 29,826 11,115 2,031 5,225 11,449 6 37.3 6.8 17.5 38.4 0.02 2003 30,757 10,016 2,029 4,845 13,861 6 32.6 6.6 15.8 45.1 0.02 2004 32,154 9,507 1,951 4,784 15,911 1 29.6 6.1 14.9 49.5 0.00 2005 30,881 8,868 2,004 4,496 15,510 3 28.7 6.5 14.6 50.2 0.01 2006 29,898 8,021 2,006 4,682 15,188 1 26.8 6.7 15.7 50.8 0.00 2007 29,866 7,685 1,953 4,743 15,480 5 25.7 6.5 15.9 51.8 0.02 2008 28,903 7,007 1,873 4,822 15,199 2 24.2 6.5 16.7 52.6 0.01 2009 27,524 6,143 1,788 5,354 14,238 1 22.3 6.5 19.5 51.7 0.00 2010 28,480 6,005 1,776 6,249 14,449 1 21.1 6.2 21.9 50.7 0.00 2011 29,135 5,557 1,729 6,757 15,092 - 19.1 5.9 23.2 51.8 -2012 30,534 5,508 1,827 7,607 15,592 - 18.0 6.0 24.9 51.1 -2013 27,547 4,616 1,582 7,325 14,024 - 16.8 5.7 26.6 50.9 -
29,069 4,505 1,555 8,009 15,000 - 15.5 5.3 27.6 51.6 -2015 29,691 4,052 1,438 8,618 15,583 - 13.6 4.8 29.0 52.5 -2016 29,229 3,675 1,346 9,142 15,066 - 12.6 4.6 31.3 51.5 -
Footnotes
2) Figures for 2014 onwards include same-sex marriages.
© Crown Copyright 2017
All marriages Irregular 1Church of
Scotland
Roman Catholic church
Other religions,
etc.
Church of Scotland
Roman Catholic church
Other religions,
etc.
20142*
1) By the Marriage (Scotland) Act 1939, which came into operation on 1 July 1940, civil marriages were introduced and irregular marriages, other than marriages by cohabitation with habit and repute, were abolished. Although two of the three types of irregular marriage were abolished in 1940 all three types of irregular marriage can be established by Decree of Declarator of the Court of Session. The irregular marriages shown in Table 7.6 are those established by Decree of Declarator of the Court of Session in the years shown although the events took place earlier.
Page 204
Denomination All marriagesAll Marriages 29,229Civil Marriages 15,066Registration office 6,382
Hospitals, residential homes etc 14Other Civil Marriages 8,670
Irregular Marriages 0All Religious Forms and Other Beliefs 14,163
Church of Scotland 3,675Humanist Society Scotland 3,040Roman Catholic Church 1,346Independent Humanist Ceremonies 936Assemblies of God 625Temporary Authorised non-Christian 623Humanist Fellowship of Scotland 519River of Life Church 432Scottish Episcopal Church and other churches of the Anglican Communion 410One Spirit Interfaith Seminary 374Fuze Foundation 372Temporary Authorised Christian 205Baptist Union of Scotland 202Methodist Church in Scotland 167Bathgate Community Church 101Free Church of Scotland 89Elim Pentecostal Church 56Christian Spiritualist Society 54United Reformed Church 53Church of Christ 50The Shore Fellowship 47United Free Church of Scotland 45The Scottish Humanists 45Church of the Nazarene 39Glasgow Central Mosque 39The Pagan Federation (Scotland) 34Salvation Army 32Jehovah's Witnesses 32Christian Brethren 29Anjuman Ehl-I-Sunnat, Wal Jumaat (Masjid-I-Khizra) 26Destiny Church 26Pakistan Association Edinburgh and East of Scotland 22Church of Jesus Christ of Latter-Day Saints 17Masjid Noor 16Madrasa Ta'Aleem-Ul-Islam 16Parkhead Congregational Church 15Scottish Unitarian Association 13Royal National Mission to Deep Sea Fishermen 13Lanarkshire Muslim Welfare Society 13Free Presbyterian Church of Scotland 11United Kingdom Islamic Mission 11Jamia Islamia 11Findhorn Foundation 11Sikh Sabha Association, Glasgow 10Other Religious Forms and Other Beliefs 261
Footnote1) Figures include same-sex marriages.
© Crown Copyright 2017
Table 7.07: Marriages1, by denomination, Scotland, 2016
Page 205
Country of birth of party 1
Country of birth of party 2Commonwealth
Total Africa
All countries 29,229 25,903 149 1,300 807 321 141 16 256 73 1,070 -
United Kingdom, Isle of Man, Channel Islands 26,415 24,556 98 674 479 222 42 9 161 45 608 -
Irish Republic, including Ireland, part not stated 200 151 35 1 5 3 - - 2 - 8 -
Other European Union 998 424 5 460 37 10 8 - 10 9 72 -
Commonwealth, Total 915 516 6 98 249 72 85 6 75 11 46 -
Australia, Canada, New Zealand 285 185 1 12 76 71 - 2 1 2 11 -
India, Bangladesh, Sri Lanka, Pakistan 262 106 1 55 86 - 83 - 2 1 14 -
West Indies, Belize, Guyana 27 20 - 1 4 - 1 2 1 - 2 -
Africa 282 162 4 27 76 1 1 2 71 1 13 -
Other Commonwealth 59 43 - 3 7 - - - - 7 6 -
Other countries 701 256 5 67 37 14 6 1 8 8 336 -
Footnote1) Figures include same-sex marriages.
© Crown Copyright 2017
Table 7.08: Marriages1, by country of birth, Scotland, 2016
All countries of birth
United Kingdom,
Isle of Man,
Channel Islands
Irish Republic including Ireland, part not stated
Other European
Union
Other countries
Not stated
Australia, Canada,
New Zealand
India, Bangladesh, Sri Lanka, Pakistan
West Indies, Beliza, Guyana
Other Common-
wealth
Page 206
Country of residence of party 1
Country of residence of party 2
Scotland
Commonwealth
Total Africa
All countries 29,229 22,604 5,453 75 333 321 286 5 3 11 16 443 -
Scotland 22,546 22,247 133 2 25 28 14 4 - 5 5 111 -Other United Kingdom, Isle of Man, Channel Islands 5,597 245 5,291 3 13 13 11 - - 1 1 32 -Irish Republic, including Ireland, part not stated 76 4 1 70 - - - - - - - 1 -
Other European Union 331 26 6 - 293 2 2 - - - - 4 -
Commonwealth, Total 308 28 6 - - 274 257 - 3 4 10 - -Australia, Canada, New Zealand 271 12 2 - - 257 257 - - - - - -India, Bangladesh, Sri Lanka, Pakistan 6 6 - - - - - - - - - - -West Indies, Belize, Guyana 9 3 3 - - 3 - - 3 - - - - Africa 10 5 1 - - 4 - - - 4 - - -Other Commonwealth 12 2 - - - 10 - - - - 10 - -
Other countries 371 54 16 - 2 4 2 1 - 1 - 295 -
Footnote1) Figures include same-sex marriages.
© Crown Copyright 2017
Table 7.09: Marriages1, by country of residence, Scotland, 2016
All countries
of residence
United Kingdom, Isle
of Man, Channel Islands
Irish Republic including Ireland, part not stated
Other European
Union
Other countries
Not stated
Australia, Canada,
New Zealand
India, Bangladesh, Sri Lanka, Pakistan
West Indies, Beliza, Guyana
Other Common-
wealth
Page 207
Table 7.10: Civil Partnerships, by sex, Scotland, 2005 to 2016
Year Both sexes Male Female
2005 84 53 312006 1,047 578 4692007 688 340 3482008 525 245 2802009 498 219 2792010 465 197 2682011 554 229 3252012 574 257 3172013 530 217 3132014 436 193 2432015 64 33 312016 70 42 28
© Crown Copyright 2017
Page 208
Sex
Younger Partner's age at formation
Total Under 25 25-34 35-44 45-54 55-64
Both sexesTotal 70 7 19 7 17 13 7Under 25 4 4 - - - - -25-34 11 2 9 - - - -35-44 6 - 5 1 - - -45-54 15 - 4 3 8 - -55-64 15 - 1 1 6 7 -65 and over 19 1 - 2 3 6 7
MalesTotal 42 3 14 5 9 7 4Under 25 1 1 - - - - -25-34 6 1 5 - - - -35-44 5 - 4 1 - - -45-54 9 - 4 1 4 - -55-64 8 - 1 1 2 4 -65 and over 13 1 - 2 3 3 4
FemalesTotal 28 4 5 2 8 6 3Under 25 3 3 - - - - -25-34 5 1 4 - - - -35-44 1 - 1 - - - -45-54 6 - - 2 4 - -55-64 7 - - - 4 3 -65 and over 6 - - - - 3 3
© Crown Copyright 2017
Table 7.11: Civil Partnerships, sex and age groups in combination of younger partner and older partner, 2016
Older Partner's age at
formation65 and
over