S‐1
Zero-Field Slow Magnetic Relaxation from Single Co(II) Ion A Transition
Metal Single-Molecule Magnet with High Anisotropy Barrier
Yuan-Yuan Zhuab Chang Cuia Yi-Quan Zhanga Jun-Hua Jiaa Xiao Guoa Chen Gaoa Kang Qiana
Shang-Da Jianga Bing-Wu Wanga Zhe-Ming Wanga and Song Gaoa
aBeijing National Laboratory of Molecular Science State Key Laboratory of Rare Earth Materials
Chemistry and Applications College of Chemistry and Molecular Engineering Peking University Beijing
100871 P R China
bKey Laboratory of Advanced Functional Materials and Devices Anhui Province School of Chemical
Engineering Hefei University of Technology Anhui 230009 Peoplersquos Republic of China
To whom correspondence should be addressed E-mail gaosongpkueducn wangbwpkueducn Fax
(+86) 10-6275-1708
Physical measurement
Magnetic measurements were performed on a Quantum Design MPMS XL-5 and PPMS-9T (EC-II)
SQUID magnetometer on polycrystalline samples Data were corrected for the diamagnetism of the samples
using Pascal constants and of the sample holder by measurement Dc magnetic susceptibility measurement
up to 12 T was performed on Wuhan High Magnetic Field Center (WHMFC) with PPMS-16
The X-ray measurements of 1 were carried on a Nonius KappaCCD diffractometer with Mo K radiation
(λ = 071073 Aring) at 200 K Empirical absorption corrections were applied using the Sortav program The
structure was solved using SHELXS-97 program1 and refined by a full matrix least squares technique based
on F2 using SHELXL 97 program2
Experimental Section
Electronic Supplementary Material (ESI) for Chemical ScienceThis journal is copy The Royal Society of Chemistry 2013
S‐2
Caution Although not encountered in our experiments perchlorate salts in the presence of organic
ligands are potentially explosive Only a small amount of the materials should be prepared and handled with
care
Synthesis
All starting materials were purchased as reagent grade and were used without further purification The
synthesis procedure of the Schiff base ligands are described as below
Scheme S1 The synthesis route of ligand H2L
Compound 5-bromo-2-hydroxybenzaldehyde was synthesizd according to the literature method3 1H
NMR (400 MHz CDCl3) δ 1093 (s 1 H) 984 (s H) 768 (d J = 24 Hz 1 H) 760 (d d J1 = 88 Hz J2 =
24 Hz 1 H) 691 (d J = 88 Hz)
Compound H2L A solution of 5-bromo-2-hydroxybenzaldehyde (201 g 100 mmol) and
(R)-2-amino-2-phenylethanol (137 g 100 mmol) in ethanol was stirred under reflux for 3 h and the color of
the solution was turned to yellow After removal of the solvents under reduced pressure the crude product
was purified by recrystallization in the mixture solvent of ethanol and petroleum ether to give compound
H2L as needlelike crystals (304 g 95 ) 1H NMR (400 MHz CDCl3) δ 1330 (br 1 H) 840 (s 1 H)
741729 (m 7 H) 687 (d J = 84 Hz 1 H) 448 (t J = 64 Hz 1 H) 393 (d J = 64 Hz 2 H) Anal
Calcd for C15H14BrNO2 C 5627 H 441 N 437 Found C 5613 H 435 N 435 MS (ESI) mz
32008 [M + 1]+ IR (pure sample) ν = 3480(m) 3417(m) 3085(w) 3060(w) 3028(w) 3004(w) 2983(w)
2969(w) 2923(w) 2882(w) 2865(w) 2743(w) 2682(w) 1952(w) 1881(w) 1831(w) 1812(w) 1770(w)
1698(w) 1630(s) 1570(m) 1476(s) 1454(m) 1374(m) 1340(w) 1313(w) 1280(s) 1222(w) 1207(m)
1184(m) 1130(w) 1078(m) 1057(m) 1033(m) 1028(m) 1000(w) 985(w) 974(w) 948(w) 915(m)
894(m) 854(w) 825(s) 810(m) 778(w) 764(m) 734(w) 699(m) 681(w) 640(w) 626(w)
Electronic Supplementary Material (ESI) for Chemical ScienceThis journal is copy The Royal Society of Chemistry 2013
S‐3
Synthesis of (HNEt3)+[CoIICoIII
3(L)6] 1 A mixture of H2L (480 mg 15 mmol) and Et3N (43 mL 3
mmol) in methanol (200 mL) was stirred at room temperature A dark brown precipitate was generated as
soon as the solution of Co(ClO4)26H2O (366 mg 1 mmol) in methanol (100 mL) was added dropwise and
the mixture was stirred at room temperature for 12 h The resulting solution was filtered and the solvent was
removed under vacuum The dark brown precipitate obtained was dried under vacuum then redissoved in hot
DMF (400 mL) Dark red block crystals were obtained within two weeks in 50-60 yield by slow
evaporation of the resulting solution The crystals are stable at room temperature and no loss of solvent is
observed Anal Calcd for C96H88Br6Co4N7O12middot5DMFmiddot2H2O C 5034 H 483 N 635 Found C 5042 H
473 N 666 IR (pure sample) ν = 3647(w) 3060(w) 3028(w) 2920(w) 2857(w) 2694(w) 1890(w)
1668(m) 1637(s) 1590(m) 1521(m) 1494(w) 1461(s) 1420(m) 1373(m) 1331(w) 1315(m) 1247(w)
1196(w) 1174(m) 1135(w) 1092(w) 1065(w) 1030(m) 963(w) 947(w) 909(w) 870(w) 821(m) 763(w)
731(w) 706(w) 691(w) 653(m) 611(w) HRMS (ESI-MS) Calcd For C96H89Br6Co4N7O12+ 224689361
Found 224686759 (cation mode)
Crystal data for 1 C11010H109Br6Co4N1170O1750 Mr = 253930 Orthorhombic P212121 a = 126611(1) b =
190777(1) c = 475848(4) Aring α = 90 β = 90 γ = 90deg V = 114939(2) Aring3 Z = 4 T = 200(2) K GOF = 0971
Flack parameters 0014(6) R1(final) = 00450 wR2 = 01078 CCDC 881924
Table S1 Selected bond lengths (Aring) and angles () for 1
Co(1)-O(2) 2135(4) Co(1)-O(4) 2154(4) Co(1)-O(6) 2121(4) Co(1)-O(8) 2168(4) Co(1)-O(10) 2171(4) Co(1)-O(12) 2087(4) Co(2)-O(1) 1896(4) Co(2)-O(2) 1900(4) Co(2)-O(3) 1887(4) Co(2)-O(4) 1899(4) Co(2)-N(1) 1901(4) Co(2)-N(2) 1914(5) Co(3)-O(5) 1898(4) Co(3)-O(6) 1887(4) Co(3)-O(7) 1890(4) Co(3)-O(8) 1902(4) Co(3)-N(3) 1906(5) Co(3)-N(4) 1886(5) Co(4)-O(9) 1883(4) Co(4)-O(10) 1901(4) Co(4)-O(11) 1900(4) Co(4)-O(12) 1908(4) Co(4)-N(5) 1902(5) Co(4)-N(6) 1900(5)
Electronic Supplementary Material (ESI) for Chemical ScienceThis journal is copy The Royal Society of Chemistry 2013
S‐4
O(12)-Co(1)-O(6) 11747(15) O(12)-Co(1)-O(2) 14456(14) O(6)-Co(1)-O(2) 9156(14) O(6)-Co(1)-O(4) 14356(14) O(12)-Co(1)-O(4) 9195(14) O(12)-Co(1)-O(8) 8924(14) O(2)-Co(1)-O(4) 7189(14) O(2)-Co(1)-O(8) 12080(14) O(6)-Co(1)-O(8) 7146(14) O(12)-Co(1)-O(10) 7228(14) O(4)-Co(1)-O(8) 8911(14) O(2)-Co(1)-O(10) 8883(14) O(6)-Co(1)-O(10) 9021(14) O(8)-Co(1)-O(10) 14454(14) O(4)-Co(1)-O(10) 12067(14) O(3)-Co(2)-O(1) 9034(18) O(3)-Co(2)-O(4) 17624(17) O(1)-Co(2)-O(4) 9341(16) O(3)-Co(2)-O(2) 9323(16) O(1)-Co(2)-O(2) 17586(17) O(4)-Co(2)-O(2) 8303(16) O(3)-Co(2)-N(1) 8538(18) O(1)-Co(2)-N(1) 9407(18) O(4)-Co(2)-N(1) 9462(18) O(2)-Co(2)-N(1) 8414(18) O(3)-Co(2)-N(2) 9462(19) O(1)-Co(2)-N(2) 8625(18) O(4)-Co(2)-N(2) 8535(18) O(2)-Co(2)-N(2) 9554(18) N(1)-Co(2)-N(2) 1797(2) N(4)-Co(3)-O(7) 9469(19) O(6)-Co(3)-O(7) 9397(17) N(4)-Co(3)-O(5) 8563(19) O(6)-Co(3)-O(5) 17521(18) O(7)-Co(3)-O(5) 9078(18) N(4)-Co(3)-O(8) 8416(18) O(6)-Co(3)-O(8) 8276(16) O(7)-Co(3)-O(8) 17642(18) O(5)-Co(3)-O(8) 9250(16) N(4)-Co(3)-N(3) 1789(2) O(6)-Co(3)-N(3) 8476(18) O(7)-Co(3)-N(3) 8449(19) O(5)-Co(3)-N(3) 9511(18) O(8)-Co(3)-N(3) 9662(18) N(4)-Co(3)-O(6) 9458(19) N(5)-Co(4)-O(12) 9654(18) O(9)-Co(4)-N(6) 8650(18) O(9)-Co(4)-O(11) 9085(18) N(6)-Co(4)-O(11) 9417(18) O(9)-Co(4)-O(10) 17498(17) N(6)-Co(4)-O(10) 9396(18) O(11)-Co(4)-O(10) 9410(17) O(9)-Co(4)-N(5) 9451(19) N(6)-Co(4)-N(5) 1787(2) O(11)-Co(4)-N(5) 8502(18) O(10)-Co(4)-N(5) 8510(18) O(9)-Co(4)-O(12) 9255(17) N(6)-Co(4)-O(12) 8420(17) O(11)-Co(4)-O(12) 17613(17) O(10)-Co(4)-O(12) 8252(16)
Table S2 The BVS calculation result using PLATON software45
Co1
Bond Valence Analysis - Assume Valence = 2 -- Min BondVal Contribution = 004 Cation Val
Nr Bond Dist R B BVal Sum Diff 1 Co1 O12 20941 16920 037 0337 0337 16632 Co1 O6 21231 16920 037 0312 0649 13513 Co1 O2 21351 16920 037 0302 0951 10494 Co1 O4 21477 16920 037 0292 1243 07575 Co1 O8 21641 16920 037 0279 1522 04786 Co1 O10 21708 16920 037 0274 1796 0204
Electronic Supplementary Material (ESI) for Chemical ScienceThis journal is copy The Royal Society of Chemistry 2013
S‐5
Bond Valence Analysis - Assume Valence = 3 -- Min BondVal Contribution = 004 Cation Val
Nr Bond Dist R B BVal Sum Diff 1 Co1 O12 20941 16370 037 0291 0291 27092 Co1 O6 21231 16370 037 0269 0560 24403 Co1 O2 21351 16370 037 0260 0820 21804 Co1 O4 21477 16370 037 0252 1071 19295 Co1 O8 21641 16370 037 0241 1312 16886 Co1 O10 21708 16370 037 0236 1548 1452
Co2
Bond Valence Analysis - Assume Valence = 2 -- Min BondVal Contribution = 004 Cation Val
Nr Bond Dist R B BVal Sum Diff 1 Co2 O3 18924 16920 037 0582 0582 14182 Co2 O1 18933 16920 037 0580 1162 08383 Co2 O4 19005 16920 037 0569 1731 02694 Co2 O2 19005 16920 037 0569 2301 03015 Co2 N1 19053 16500 037 0502 2802 08026 Co2 N2 19114 16500 037 0493 3296 1296
Bond Valence Analysis - Assume Valence = 3 -- Min BondVal Contribution = 004 Cation Val
Nr Bond Dist R B BVal Sum Diff 1 Co2 O3 18924 16370 037 0501 0501 24992 Co2 O1 18933 16370 037 0500 1002 19983 Co2 O4 19005 16370 037 0491 1492 15084 Co2 O2 19005 16370 037 0491 1983 10175 Co2 N1 19053 17500 037 0657 2640 03606 Co2 N2 19114 17500 037 0646 3287 0287
Co3
Bond Valence Analysis - Assume Valence = 2 -- Min BondVal Contribution = 004 Cation Val
Nr Bond Dist R B BVal Sum Diff 1 Co3 O6 18903 16920 037 0585 0585 14152 Co3 N4 18951 16500 037 0516 1101 08993 Co3 O7 18982 16920 037 0573 1673 03274 Co3 O5 18990 16920 037 0572 2245 02455 Co3 O8 18990 16920 037 0571 2816 08166 Co3 N3 19034 16500 037 0504 3321 1321
Electronic Supplementary Material (ESI) for Chemical ScienceThis journal is copy The Royal Society of Chemistry 2013
S‐6
Bond Valence Analysis - Assume Valence = 3 -- Min BondVal Contribution = 004 Cation Val
Nr Bond Dist R B BVal Sum Diff 1 Co3 O6 18903 16370 037 0504 0504 24962 Co3 N4 18951 17500 037 0676 1180 18203 Co3 O7 18982 16370 037 0494 1673 13274 Co3 O5 18990 16370 037 0493 2166 08345 Co3 O8 18990 16370 037 0493 2659 03416 Co3 N3 19034 17500 037 0661 3319 0319
Co4
Bond Valence Analysis - Assume Valence = 2 -- Min BondVal Contribution = 004 Cation Val
Nr Bond Dist R B BVal Sum Diff 1 Co4 O9 18854 16920 037 0593 0593 14072 Co4 N6 18993 16500 037 0510 1103 08973 Co4 O11 19001 16920 037 0570 1672 03284 Co4 O10 19001 16920 037 0570 2242 02425 Co4 O12 19041 16920 037 0564 2806 08066 Co4 N5 19043 16500 037 0503 3309 1309
Bond Valence Analysis - Assume Valence = 3 -- Min BondVal Contribution = 004 Cation Val
Nr Bond Dist R B BVal Sum Diff 1 Co4 O9 18854 16370 037 0511 0511 24892 Co4 N6 18993 17500 037 0668 1179 18213 Co4 O11 19001 16370 037 0491 1670 13304 Co4 O10 19001 16370 037 0491 2161 08395 Co4 O12 19041 16370 037 0486 2647 03536 Co4 N5 19043 17500 037 0659 3306 0306
Magnetic susceptibility data fitting
Three ligand field parameters B20 B40 and B43 in Wybourne notation are needed for the description of
central Co(II) ion in D3 symmetry These parameters obtained from magnetic susceptibility data fitting for 1
are B20 = 4416 times 104 cm-1 B40 = 3479 times 104 cm-1 B43 = 1342 times 103 cm-1
CASSCF calculations on model structure of individual molecule 1 have been carried out with MOLCAS
Electronic Supplementary Material (ESI) for Chemical ScienceThis journal is copy The Royal Society of Chemistry 2013
S‐7
76 program package6 The influence of the diamagnetic Co(III) ions is simulated by the closed-shell Zn2+ ab
initio embedding model potentials (AIMP)7 The only removed atoms are those connected to the Co3+ AIMP
from the opposite side of the molecule The basis sets for all atoms were atomic natural orbitals from the
MOLCAS ANO-RCC library The following contractions are used [6s5p3d2f1g] for Co [4s3p2d] for C N
and O and [2s] for H The spin-orbit coupling is calculated by the RASSI program
Structure and characterization data
Figure S1 The ESI-MS spectrum of 1 by cation mode
Electronic Supplementary Material (ESI) for Chemical ScienceThis journal is copy The Royal Society of Chemistry 2013
S‐8
Figure S2 The molecular packing of 1 in a crystal cell which demonstrates the arrangements of anisotropic
axis of Co(II) are in different orientations The shortest distance of paramagnetic Co(II) ions between
neighbor clusters are 12661 Aring The ligands are omitted for clarity
Figure S3 UV-vis absorption spectrum of 1 (10-5 M) from 200 to 1000 nm at 298 K
The magnetic data of compound 1
Electronic Supplementary Material (ESI) for Chemical ScienceThis journal is copy The Royal Society of Chemistry 2013
S‐9
Figure S4 Dc magnetic susceptibility of 1 measured at different temperatures (2 K 4 K and 8 K) up to 12
T (hollow point) in PPMS-16 and fitting result using ANISOFIT 20 program (solid line)
Figure S5 The temperature dependence of ac susceptibility under zero dc field at frequencies from 1 to
1000 Hz for 1 in MPMS
Electronic Supplementary Material (ESI) for Chemical ScienceThis journal is copy The Royal Society of Chemistry 2013
S‐10
Figure S6 χ (in-phase) against temperature for 1 under 1500 Oe dc field range from 3 to 30 K in PPMS
Figure S7 χ (in-phase) against temperature for 1 under 1500 Oe dc field range from 3 to 30 K in PPMS
Electronic Supplementary Material (ESI) for Chemical ScienceThis journal is copy The Royal Society of Chemistry 2013
S‐11
Figure S8 Arrhenius plots of relaxation times of 1 under 1500 Oe dc field the data was collected from the
peaks of χ (out-of-phase) against temperature at different frequency
Figure S9 χ (in-phase) against frequency of 1 under zero dc field range from 100 to 10000 Hz at different
temperature (5 to 25 K 05 K interval) in PPMS
Electronic Supplementary Material (ESI) for Chemical ScienceThis journal is copy The Royal Society of Chemistry 2013
S‐12
Figure S10 χ (in-phase) against frequency of 1 under zero dc field range from 100 to 10000 Hz at different
temperature (5 to 25 K 05 K interval) in PPMS
Figure S11 Arrhenius plots of relaxation times of 1 under zero dc field the data was collected from the
peaks of χ (out-of-phase) against frequency at different temperature
Electronic Supplementary Material (ESI) for Chemical ScienceThis journal is copy The Royal Society of Chemistry 2013
S‐13
Figure S12 Cole-Cole diagram of 1 under zero applied dc field (ac frequencies range from 100 to 10000
Hz)
Electronic Supplementary Material (ESI) for Chemical ScienceThis journal is copy The Royal Society of Chemistry 2013
S‐14
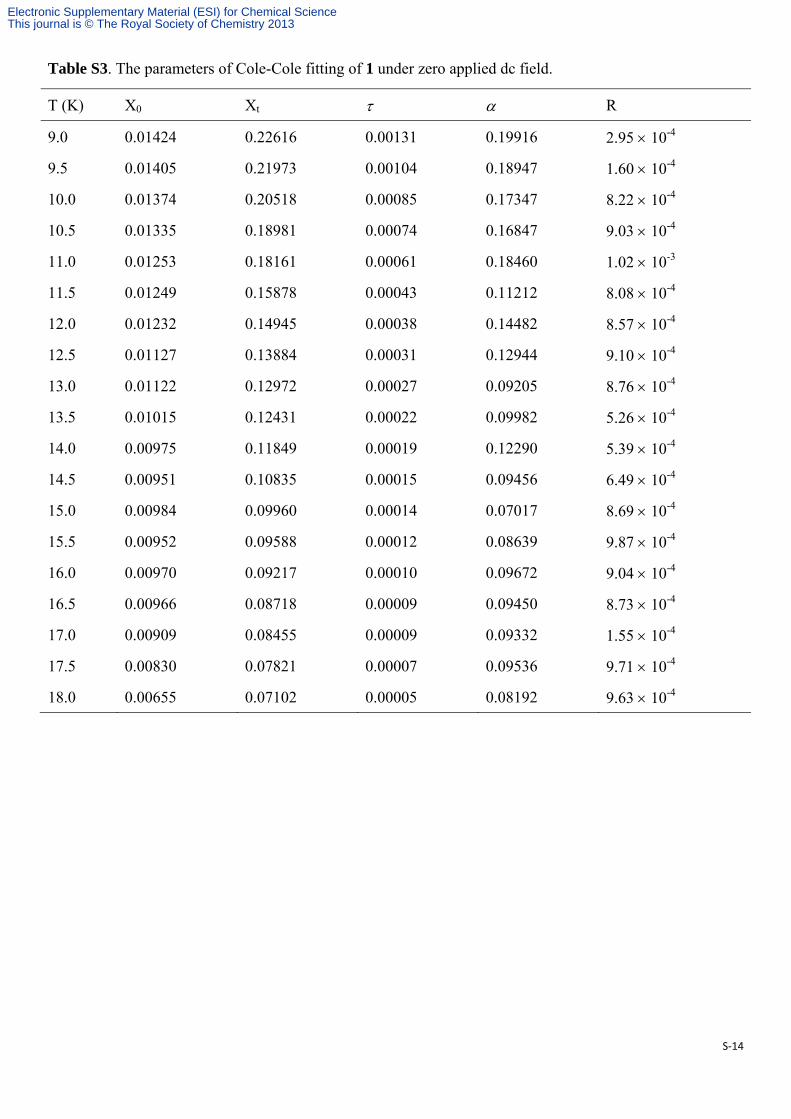
Table S3 The parameters of Cole-Cole fitting of 1 under zero applied dc field
T (K) X0 Xt R
90 001424 022616 000131 019916 295 10-4
95 001405 021973 000104 018947 160 10-4
100 001374 020518 000085 017347 822 10-4
105 001335 018981 000074 016847 903 10-4
110 001253 018161 000061 018460 102 10-3
115 001249 015878 000043 011212 808 10-4
120 001232 014945 000038 014482 857 10-4
125 001127 013884 000031 012944 910 10-4
130 001122 012972 000027 009205 876 10-4
135 001015 012431 000022 009982 526 10-4
140 000975 011849 000019 012290 539 10-4
145 000951 010835 000015 009456 649 10-4
150 000984 009960 000014 007017 869 10-4
155 000952 009588 000012 008639 987 10-4
160 000970 009217 000010 009672 904 10-4
165 000966 008718 000009 009450 873 10-4
170 000909 008455 000009 009332 155 10-4
175 000830 007821 000007 009536 971 10-4
180 000655 007102 000005 008192 963 10-4
Electronic Supplementary Material (ESI) for Chemical ScienceThis journal is copy The Royal Society of Chemistry 2013
S‐15
Figure S13 χ (in-phase) against frequency of 1 under 1500 Oe dc field from 100 to 10000 Hz at different
temperatures (5 to 25 K 05 K interval) in PPMS
Figure S14 χ (out-of-phase) against frequency of 1 under 1500 Oe dc field from 100 to 10000 Hz at
different temperatures (5 to 25 K 05 K interval) in PPMS
Electronic Supplementary Material (ESI) for Chemical ScienceThis journal is copy The Royal Society of Chemistry 2013
S‐16
Figure S15 Arrhenius plots of relaxation times of 1 under 1500 Oe dc field the data was collected from the
peaks of χ (out-of-phase) against frequency at different temperature
Figure S16 The merge of Arrhenius plots of relaxation times of 1 under different measured conditions (a)
scan temperatures under zero dc field (b) scan frequencies under zero dc field (c) scan temperatures under
1500 Oe dc field and (d) scan frequencies under 1500 dc field
Electronic Supplementary Material (ESI) for Chemical ScienceThis journal is copy The Royal Society of Chemistry 2013
S‐17
Figure S17 Arrhenius plots of the temperature dependences of relaxation times of 1 under zero dc field
Black line represent fit to multiple relaxation processes (containing Raman plus Orbach processes) which
has discussed in the below
The following equation was used to fit the relationship of relaxation time and temperature taking Raman and
Orbach processes into account
1 = CTn + 0-1 exp(-UeffkT) (n ge 4)
In this equation CTn represents Raman relaxation process and 0-1 exp(-UeffkT) represents Orbach relaxation
process Many sets of parameters and relaxation time have been tried that heavily correlated with both
Raman and Orbach process The best fits were obtained with n = 46 and corresponding C = 0037 0 = 63
10-10 and Ueff = 251 K which was much higher than the fitted value of 109 K involved only Orbach
process We tried the fitting with n = 4 or 5 but failed to get reasonable results The newly fitting Ueff value
of 251 K was consistent with the calculated relaxation barrier (289 K and 311 K) using the spin-Hamiltonian
approach and ab initio calculations The results indicated that the Raman Process influenced heavily the
Orbach process and reduced dramatically the barrier of slow magnetic relaxation
The four parameters (C 0 n and Ueff) were fitted only from the limited temperature range that the
Electronic Supplementary Material (ESI) for Chemical ScienceThis journal is copy The Royal Society of Chemistry 2013
S‐18
out-of-phase ac peaks appeared At low temperature the relaxation barrier was also influenced by the QTM
process For the convenience to compare with the reported single TM based SMMs the relaxation barrier
fitted with Arrhenius law was used in the manuscript The fitting results with both Raman and Orbach
process were provided in the SI
Electronic Supplementary Material (ESI) for Chemical ScienceThis journal is copy The Royal Society of Chemistry 2013
S‐19
Figure S18 Magnetization versus field measured for the 1 at 18 K from -5 T to 5 T in MPMS no hysteresis
loop was observed
Figure S19 Magnetization versus field measured for the 1 at 06 K from -1 T to 1 T in MPMS small
bifurcation was observed
Electronic Supplementary Material (ESI) for Chemical ScienceThis journal is copy The Royal Society of Chemistry 2013
S‐20
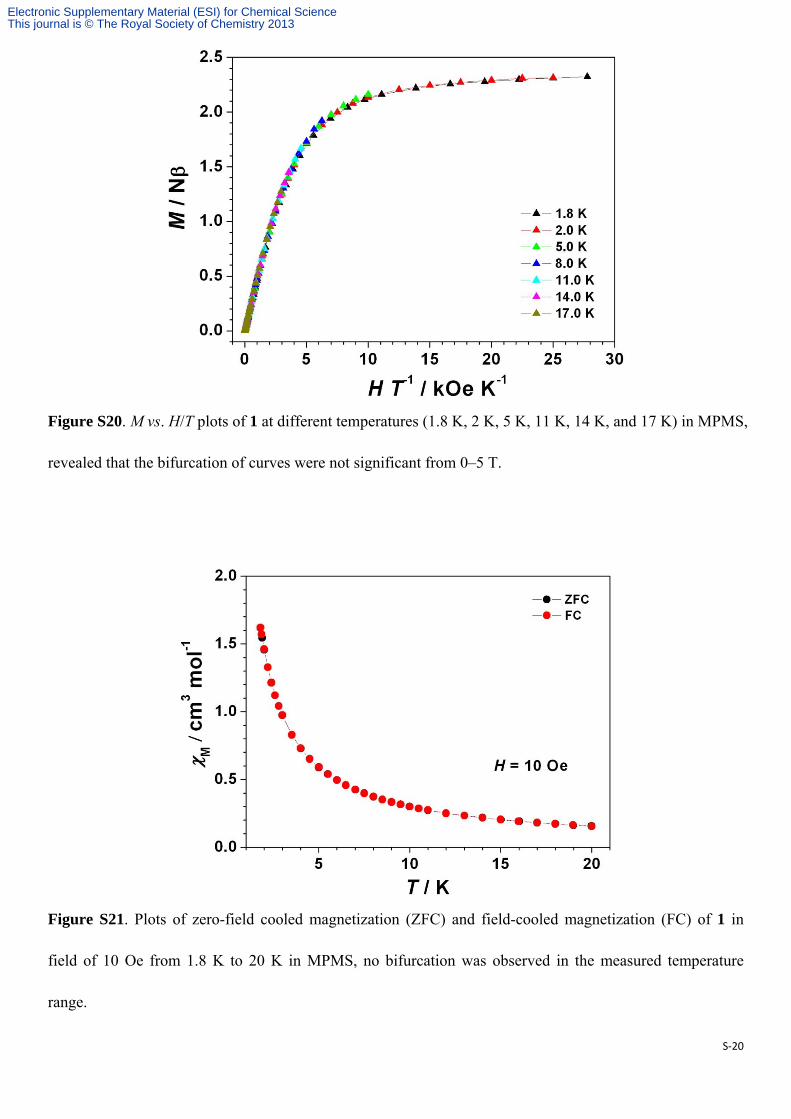
Figure S20 M vs HT plots of 1 at different temperatures (18 K 2 K 5 K 11 K 14 K and 17 K) in MPMS
revealed that the bifurcation of curves were not significant from 0ndash5 T
Figure S21 Plots of zero-field cooled magnetization (ZFC) and field-cooled magnetization (FC) of 1 in
field of 10 Oe from 18 K to 20 K in MPMS no bifurcation was observed in the measured temperature
range
Electronic Supplementary Material (ESI) for Chemical ScienceThis journal is copy The Royal Society of Chemistry 2013
S‐21
Figure S22 Plots of M-1 versus T for 1 under 1 kOe field (The red solid line represents the best fit to the
Curie-Weiss expression)
Figure S23 The energy diagram of central Co(II) ion in compound 1 from spin-Hamiltonian approach and
ab initio calculations
References
Electronic Supplementary Material (ESI) for Chemical ScienceThis journal is copy The Royal Society of Chemistry 2013
S‐22
1 G M Sheldrick SHELXS-97 University of Gottingen Gottingen Germany 1990
2 G M Sheldrick SHELXS-97 University of Gottingen Gottingen Germany 1997
3 X-L Yu D Scheller O Rademacher and T Wolff J Org Chem 2003 68 7386ndash7399
4 N E Brese and M OKeeffe Acta Cryst B 1991 47 192ndash197
5 ID Brown The Chemical Bond in Inorganic Chemistry The Bond Valence Model Oxford University
Press 2002
6 G Karlstrom R Lindh P A Malmqvist B O Roos U Ryde V Veryazov P O Widmark M Cossi B
Schimmelpfennig P Neogrady and L Seijo Comput Mater Sci 2003 28 222ndash239
7 L Seijo and Z Barandiaraacuten Computational Chemistry Reviews of Current Trends 1999 4 ed by J
Leszcynski (World Scientific Singapur) 55ndash152
Electronic Supplementary Material (ESI) for Chemical ScienceThis journal is copy The Royal Society of Chemistry 2013
S‐2
Caution Although not encountered in our experiments perchlorate salts in the presence of organic
ligands are potentially explosive Only a small amount of the materials should be prepared and handled with
care
Synthesis
All starting materials were purchased as reagent grade and were used without further purification The
synthesis procedure of the Schiff base ligands are described as below
Scheme S1 The synthesis route of ligand H2L
Compound 5-bromo-2-hydroxybenzaldehyde was synthesizd according to the literature method3 1H
NMR (400 MHz CDCl3) δ 1093 (s 1 H) 984 (s H) 768 (d J = 24 Hz 1 H) 760 (d d J1 = 88 Hz J2 =
24 Hz 1 H) 691 (d J = 88 Hz)
Compound H2L A solution of 5-bromo-2-hydroxybenzaldehyde (201 g 100 mmol) and
(R)-2-amino-2-phenylethanol (137 g 100 mmol) in ethanol was stirred under reflux for 3 h and the color of
the solution was turned to yellow After removal of the solvents under reduced pressure the crude product
was purified by recrystallization in the mixture solvent of ethanol and petroleum ether to give compound
H2L as needlelike crystals (304 g 95 ) 1H NMR (400 MHz CDCl3) δ 1330 (br 1 H) 840 (s 1 H)
741729 (m 7 H) 687 (d J = 84 Hz 1 H) 448 (t J = 64 Hz 1 H) 393 (d J = 64 Hz 2 H) Anal
Calcd for C15H14BrNO2 C 5627 H 441 N 437 Found C 5613 H 435 N 435 MS (ESI) mz
32008 [M + 1]+ IR (pure sample) ν = 3480(m) 3417(m) 3085(w) 3060(w) 3028(w) 3004(w) 2983(w)
2969(w) 2923(w) 2882(w) 2865(w) 2743(w) 2682(w) 1952(w) 1881(w) 1831(w) 1812(w) 1770(w)
1698(w) 1630(s) 1570(m) 1476(s) 1454(m) 1374(m) 1340(w) 1313(w) 1280(s) 1222(w) 1207(m)
1184(m) 1130(w) 1078(m) 1057(m) 1033(m) 1028(m) 1000(w) 985(w) 974(w) 948(w) 915(m)
894(m) 854(w) 825(s) 810(m) 778(w) 764(m) 734(w) 699(m) 681(w) 640(w) 626(w)
Electronic Supplementary Material (ESI) for Chemical ScienceThis journal is copy The Royal Society of Chemistry 2013
S‐3
Synthesis of (HNEt3)+[CoIICoIII
3(L)6] 1 A mixture of H2L (480 mg 15 mmol) and Et3N (43 mL 3
mmol) in methanol (200 mL) was stirred at room temperature A dark brown precipitate was generated as
soon as the solution of Co(ClO4)26H2O (366 mg 1 mmol) in methanol (100 mL) was added dropwise and
the mixture was stirred at room temperature for 12 h The resulting solution was filtered and the solvent was
removed under vacuum The dark brown precipitate obtained was dried under vacuum then redissoved in hot
DMF (400 mL) Dark red block crystals were obtained within two weeks in 50-60 yield by slow
evaporation of the resulting solution The crystals are stable at room temperature and no loss of solvent is
observed Anal Calcd for C96H88Br6Co4N7O12middot5DMFmiddot2H2O C 5034 H 483 N 635 Found C 5042 H
473 N 666 IR (pure sample) ν = 3647(w) 3060(w) 3028(w) 2920(w) 2857(w) 2694(w) 1890(w)
1668(m) 1637(s) 1590(m) 1521(m) 1494(w) 1461(s) 1420(m) 1373(m) 1331(w) 1315(m) 1247(w)
1196(w) 1174(m) 1135(w) 1092(w) 1065(w) 1030(m) 963(w) 947(w) 909(w) 870(w) 821(m) 763(w)
731(w) 706(w) 691(w) 653(m) 611(w) HRMS (ESI-MS) Calcd For C96H89Br6Co4N7O12+ 224689361
Found 224686759 (cation mode)
Crystal data for 1 C11010H109Br6Co4N1170O1750 Mr = 253930 Orthorhombic P212121 a = 126611(1) b =
190777(1) c = 475848(4) Aring α = 90 β = 90 γ = 90deg V = 114939(2) Aring3 Z = 4 T = 200(2) K GOF = 0971
Flack parameters 0014(6) R1(final) = 00450 wR2 = 01078 CCDC 881924
Table S1 Selected bond lengths (Aring) and angles () for 1
Co(1)-O(2) 2135(4) Co(1)-O(4) 2154(4) Co(1)-O(6) 2121(4) Co(1)-O(8) 2168(4) Co(1)-O(10) 2171(4) Co(1)-O(12) 2087(4) Co(2)-O(1) 1896(4) Co(2)-O(2) 1900(4) Co(2)-O(3) 1887(4) Co(2)-O(4) 1899(4) Co(2)-N(1) 1901(4) Co(2)-N(2) 1914(5) Co(3)-O(5) 1898(4) Co(3)-O(6) 1887(4) Co(3)-O(7) 1890(4) Co(3)-O(8) 1902(4) Co(3)-N(3) 1906(5) Co(3)-N(4) 1886(5) Co(4)-O(9) 1883(4) Co(4)-O(10) 1901(4) Co(4)-O(11) 1900(4) Co(4)-O(12) 1908(4) Co(4)-N(5) 1902(5) Co(4)-N(6) 1900(5)
Electronic Supplementary Material (ESI) for Chemical ScienceThis journal is copy The Royal Society of Chemistry 2013
S‐4
O(12)-Co(1)-O(6) 11747(15) O(12)-Co(1)-O(2) 14456(14) O(6)-Co(1)-O(2) 9156(14) O(6)-Co(1)-O(4) 14356(14) O(12)-Co(1)-O(4) 9195(14) O(12)-Co(1)-O(8) 8924(14) O(2)-Co(1)-O(4) 7189(14) O(2)-Co(1)-O(8) 12080(14) O(6)-Co(1)-O(8) 7146(14) O(12)-Co(1)-O(10) 7228(14) O(4)-Co(1)-O(8) 8911(14) O(2)-Co(1)-O(10) 8883(14) O(6)-Co(1)-O(10) 9021(14) O(8)-Co(1)-O(10) 14454(14) O(4)-Co(1)-O(10) 12067(14) O(3)-Co(2)-O(1) 9034(18) O(3)-Co(2)-O(4) 17624(17) O(1)-Co(2)-O(4) 9341(16) O(3)-Co(2)-O(2) 9323(16) O(1)-Co(2)-O(2) 17586(17) O(4)-Co(2)-O(2) 8303(16) O(3)-Co(2)-N(1) 8538(18) O(1)-Co(2)-N(1) 9407(18) O(4)-Co(2)-N(1) 9462(18) O(2)-Co(2)-N(1) 8414(18) O(3)-Co(2)-N(2) 9462(19) O(1)-Co(2)-N(2) 8625(18) O(4)-Co(2)-N(2) 8535(18) O(2)-Co(2)-N(2) 9554(18) N(1)-Co(2)-N(2) 1797(2) N(4)-Co(3)-O(7) 9469(19) O(6)-Co(3)-O(7) 9397(17) N(4)-Co(3)-O(5) 8563(19) O(6)-Co(3)-O(5) 17521(18) O(7)-Co(3)-O(5) 9078(18) N(4)-Co(3)-O(8) 8416(18) O(6)-Co(3)-O(8) 8276(16) O(7)-Co(3)-O(8) 17642(18) O(5)-Co(3)-O(8) 9250(16) N(4)-Co(3)-N(3) 1789(2) O(6)-Co(3)-N(3) 8476(18) O(7)-Co(3)-N(3) 8449(19) O(5)-Co(3)-N(3) 9511(18) O(8)-Co(3)-N(3) 9662(18) N(4)-Co(3)-O(6) 9458(19) N(5)-Co(4)-O(12) 9654(18) O(9)-Co(4)-N(6) 8650(18) O(9)-Co(4)-O(11) 9085(18) N(6)-Co(4)-O(11) 9417(18) O(9)-Co(4)-O(10) 17498(17) N(6)-Co(4)-O(10) 9396(18) O(11)-Co(4)-O(10) 9410(17) O(9)-Co(4)-N(5) 9451(19) N(6)-Co(4)-N(5) 1787(2) O(11)-Co(4)-N(5) 8502(18) O(10)-Co(4)-N(5) 8510(18) O(9)-Co(4)-O(12) 9255(17) N(6)-Co(4)-O(12) 8420(17) O(11)-Co(4)-O(12) 17613(17) O(10)-Co(4)-O(12) 8252(16)
Table S2 The BVS calculation result using PLATON software45
Co1
Bond Valence Analysis - Assume Valence = 2 -- Min BondVal Contribution = 004 Cation Val
Nr Bond Dist R B BVal Sum Diff 1 Co1 O12 20941 16920 037 0337 0337 16632 Co1 O6 21231 16920 037 0312 0649 13513 Co1 O2 21351 16920 037 0302 0951 10494 Co1 O4 21477 16920 037 0292 1243 07575 Co1 O8 21641 16920 037 0279 1522 04786 Co1 O10 21708 16920 037 0274 1796 0204
Electronic Supplementary Material (ESI) for Chemical ScienceThis journal is copy The Royal Society of Chemistry 2013
S‐5
Bond Valence Analysis - Assume Valence = 3 -- Min BondVal Contribution = 004 Cation Val
Nr Bond Dist R B BVal Sum Diff 1 Co1 O12 20941 16370 037 0291 0291 27092 Co1 O6 21231 16370 037 0269 0560 24403 Co1 O2 21351 16370 037 0260 0820 21804 Co1 O4 21477 16370 037 0252 1071 19295 Co1 O8 21641 16370 037 0241 1312 16886 Co1 O10 21708 16370 037 0236 1548 1452
Co2
Bond Valence Analysis - Assume Valence = 2 -- Min BondVal Contribution = 004 Cation Val
Nr Bond Dist R B BVal Sum Diff 1 Co2 O3 18924 16920 037 0582 0582 14182 Co2 O1 18933 16920 037 0580 1162 08383 Co2 O4 19005 16920 037 0569 1731 02694 Co2 O2 19005 16920 037 0569 2301 03015 Co2 N1 19053 16500 037 0502 2802 08026 Co2 N2 19114 16500 037 0493 3296 1296
Bond Valence Analysis - Assume Valence = 3 -- Min BondVal Contribution = 004 Cation Val
Nr Bond Dist R B BVal Sum Diff 1 Co2 O3 18924 16370 037 0501 0501 24992 Co2 O1 18933 16370 037 0500 1002 19983 Co2 O4 19005 16370 037 0491 1492 15084 Co2 O2 19005 16370 037 0491 1983 10175 Co2 N1 19053 17500 037 0657 2640 03606 Co2 N2 19114 17500 037 0646 3287 0287
Co3
Bond Valence Analysis - Assume Valence = 2 -- Min BondVal Contribution = 004 Cation Val
Nr Bond Dist R B BVal Sum Diff 1 Co3 O6 18903 16920 037 0585 0585 14152 Co3 N4 18951 16500 037 0516 1101 08993 Co3 O7 18982 16920 037 0573 1673 03274 Co3 O5 18990 16920 037 0572 2245 02455 Co3 O8 18990 16920 037 0571 2816 08166 Co3 N3 19034 16500 037 0504 3321 1321
Electronic Supplementary Material (ESI) for Chemical ScienceThis journal is copy The Royal Society of Chemistry 2013
S‐6
Bond Valence Analysis - Assume Valence = 3 -- Min BondVal Contribution = 004 Cation Val
Nr Bond Dist R B BVal Sum Diff 1 Co3 O6 18903 16370 037 0504 0504 24962 Co3 N4 18951 17500 037 0676 1180 18203 Co3 O7 18982 16370 037 0494 1673 13274 Co3 O5 18990 16370 037 0493 2166 08345 Co3 O8 18990 16370 037 0493 2659 03416 Co3 N3 19034 17500 037 0661 3319 0319
Co4
Bond Valence Analysis - Assume Valence = 2 -- Min BondVal Contribution = 004 Cation Val
Nr Bond Dist R B BVal Sum Diff 1 Co4 O9 18854 16920 037 0593 0593 14072 Co4 N6 18993 16500 037 0510 1103 08973 Co4 O11 19001 16920 037 0570 1672 03284 Co4 O10 19001 16920 037 0570 2242 02425 Co4 O12 19041 16920 037 0564 2806 08066 Co4 N5 19043 16500 037 0503 3309 1309
Bond Valence Analysis - Assume Valence = 3 -- Min BondVal Contribution = 004 Cation Val
Nr Bond Dist R B BVal Sum Diff 1 Co4 O9 18854 16370 037 0511 0511 24892 Co4 N6 18993 17500 037 0668 1179 18213 Co4 O11 19001 16370 037 0491 1670 13304 Co4 O10 19001 16370 037 0491 2161 08395 Co4 O12 19041 16370 037 0486 2647 03536 Co4 N5 19043 17500 037 0659 3306 0306
Magnetic susceptibility data fitting
Three ligand field parameters B20 B40 and B43 in Wybourne notation are needed for the description of
central Co(II) ion in D3 symmetry These parameters obtained from magnetic susceptibility data fitting for 1
are B20 = 4416 times 104 cm-1 B40 = 3479 times 104 cm-1 B43 = 1342 times 103 cm-1
CASSCF calculations on model structure of individual molecule 1 have been carried out with MOLCAS
Electronic Supplementary Material (ESI) for Chemical ScienceThis journal is copy The Royal Society of Chemistry 2013
S‐7
76 program package6 The influence of the diamagnetic Co(III) ions is simulated by the closed-shell Zn2+ ab
initio embedding model potentials (AIMP)7 The only removed atoms are those connected to the Co3+ AIMP
from the opposite side of the molecule The basis sets for all atoms were atomic natural orbitals from the
MOLCAS ANO-RCC library The following contractions are used [6s5p3d2f1g] for Co [4s3p2d] for C N
and O and [2s] for H The spin-orbit coupling is calculated by the RASSI program
Structure and characterization data
Figure S1 The ESI-MS spectrum of 1 by cation mode
Electronic Supplementary Material (ESI) for Chemical ScienceThis journal is copy The Royal Society of Chemistry 2013
S‐8
Figure S2 The molecular packing of 1 in a crystal cell which demonstrates the arrangements of anisotropic
axis of Co(II) are in different orientations The shortest distance of paramagnetic Co(II) ions between
neighbor clusters are 12661 Aring The ligands are omitted for clarity
Figure S3 UV-vis absorption spectrum of 1 (10-5 M) from 200 to 1000 nm at 298 K
The magnetic data of compound 1
Electronic Supplementary Material (ESI) for Chemical ScienceThis journal is copy The Royal Society of Chemistry 2013
S‐9
Figure S4 Dc magnetic susceptibility of 1 measured at different temperatures (2 K 4 K and 8 K) up to 12
T (hollow point) in PPMS-16 and fitting result using ANISOFIT 20 program (solid line)
Figure S5 The temperature dependence of ac susceptibility under zero dc field at frequencies from 1 to
1000 Hz for 1 in MPMS
Electronic Supplementary Material (ESI) for Chemical ScienceThis journal is copy The Royal Society of Chemistry 2013
S‐10
Figure S6 χ (in-phase) against temperature for 1 under 1500 Oe dc field range from 3 to 30 K in PPMS
Figure S7 χ (in-phase) against temperature for 1 under 1500 Oe dc field range from 3 to 30 K in PPMS
Electronic Supplementary Material (ESI) for Chemical ScienceThis journal is copy The Royal Society of Chemistry 2013
S‐11
Figure S8 Arrhenius plots of relaxation times of 1 under 1500 Oe dc field the data was collected from the
peaks of χ (out-of-phase) against temperature at different frequency
Figure S9 χ (in-phase) against frequency of 1 under zero dc field range from 100 to 10000 Hz at different
temperature (5 to 25 K 05 K interval) in PPMS
Electronic Supplementary Material (ESI) for Chemical ScienceThis journal is copy The Royal Society of Chemistry 2013
S‐12
Figure S10 χ (in-phase) against frequency of 1 under zero dc field range from 100 to 10000 Hz at different
temperature (5 to 25 K 05 K interval) in PPMS
Figure S11 Arrhenius plots of relaxation times of 1 under zero dc field the data was collected from the
peaks of χ (out-of-phase) against frequency at different temperature
Electronic Supplementary Material (ESI) for Chemical ScienceThis journal is copy The Royal Society of Chemistry 2013
S‐13
Figure S12 Cole-Cole diagram of 1 under zero applied dc field (ac frequencies range from 100 to 10000
Hz)
Electronic Supplementary Material (ESI) for Chemical ScienceThis journal is copy The Royal Society of Chemistry 2013
S‐14
Table S3 The parameters of Cole-Cole fitting of 1 under zero applied dc field
T (K) X0 Xt R
90 001424 022616 000131 019916 295 10-4
95 001405 021973 000104 018947 160 10-4
100 001374 020518 000085 017347 822 10-4
105 001335 018981 000074 016847 903 10-4
110 001253 018161 000061 018460 102 10-3
115 001249 015878 000043 011212 808 10-4
120 001232 014945 000038 014482 857 10-4
125 001127 013884 000031 012944 910 10-4
130 001122 012972 000027 009205 876 10-4
135 001015 012431 000022 009982 526 10-4
140 000975 011849 000019 012290 539 10-4
145 000951 010835 000015 009456 649 10-4
150 000984 009960 000014 007017 869 10-4
155 000952 009588 000012 008639 987 10-4
160 000970 009217 000010 009672 904 10-4
165 000966 008718 000009 009450 873 10-4
170 000909 008455 000009 009332 155 10-4
175 000830 007821 000007 009536 971 10-4
180 000655 007102 000005 008192 963 10-4
Electronic Supplementary Material (ESI) for Chemical ScienceThis journal is copy The Royal Society of Chemistry 2013
S‐15
Figure S13 χ (in-phase) against frequency of 1 under 1500 Oe dc field from 100 to 10000 Hz at different
temperatures (5 to 25 K 05 K interval) in PPMS
Figure S14 χ (out-of-phase) against frequency of 1 under 1500 Oe dc field from 100 to 10000 Hz at
different temperatures (5 to 25 K 05 K interval) in PPMS
Electronic Supplementary Material (ESI) for Chemical ScienceThis journal is copy The Royal Society of Chemistry 2013
S‐16
Figure S15 Arrhenius plots of relaxation times of 1 under 1500 Oe dc field the data was collected from the
peaks of χ (out-of-phase) against frequency at different temperature
Figure S16 The merge of Arrhenius plots of relaxation times of 1 under different measured conditions (a)
scan temperatures under zero dc field (b) scan frequencies under zero dc field (c) scan temperatures under
1500 Oe dc field and (d) scan frequencies under 1500 dc field
Electronic Supplementary Material (ESI) for Chemical ScienceThis journal is copy The Royal Society of Chemistry 2013
S‐17
Figure S17 Arrhenius plots of the temperature dependences of relaxation times of 1 under zero dc field
Black line represent fit to multiple relaxation processes (containing Raman plus Orbach processes) which
has discussed in the below
The following equation was used to fit the relationship of relaxation time and temperature taking Raman and
Orbach processes into account
1 = CTn + 0-1 exp(-UeffkT) (n ge 4)
In this equation CTn represents Raman relaxation process and 0-1 exp(-UeffkT) represents Orbach relaxation
process Many sets of parameters and relaxation time have been tried that heavily correlated with both
Raman and Orbach process The best fits were obtained with n = 46 and corresponding C = 0037 0 = 63
10-10 and Ueff = 251 K which was much higher than the fitted value of 109 K involved only Orbach
process We tried the fitting with n = 4 or 5 but failed to get reasonable results The newly fitting Ueff value
of 251 K was consistent with the calculated relaxation barrier (289 K and 311 K) using the spin-Hamiltonian
approach and ab initio calculations The results indicated that the Raman Process influenced heavily the
Orbach process and reduced dramatically the barrier of slow magnetic relaxation
The four parameters (C 0 n and Ueff) were fitted only from the limited temperature range that the
Electronic Supplementary Material (ESI) for Chemical ScienceThis journal is copy The Royal Society of Chemistry 2013
S‐18
out-of-phase ac peaks appeared At low temperature the relaxation barrier was also influenced by the QTM
process For the convenience to compare with the reported single TM based SMMs the relaxation barrier
fitted with Arrhenius law was used in the manuscript The fitting results with both Raman and Orbach
process were provided in the SI
Electronic Supplementary Material (ESI) for Chemical ScienceThis journal is copy The Royal Society of Chemistry 2013
S‐19
Figure S18 Magnetization versus field measured for the 1 at 18 K from -5 T to 5 T in MPMS no hysteresis
loop was observed
Figure S19 Magnetization versus field measured for the 1 at 06 K from -1 T to 1 T in MPMS small
bifurcation was observed
Electronic Supplementary Material (ESI) for Chemical ScienceThis journal is copy The Royal Society of Chemistry 2013
S‐20
Figure S20 M vs HT plots of 1 at different temperatures (18 K 2 K 5 K 11 K 14 K and 17 K) in MPMS
revealed that the bifurcation of curves were not significant from 0ndash5 T
Figure S21 Plots of zero-field cooled magnetization (ZFC) and field-cooled magnetization (FC) of 1 in
field of 10 Oe from 18 K to 20 K in MPMS no bifurcation was observed in the measured temperature
range
Electronic Supplementary Material (ESI) for Chemical ScienceThis journal is copy The Royal Society of Chemistry 2013
S‐21
Figure S22 Plots of M-1 versus T for 1 under 1 kOe field (The red solid line represents the best fit to the
Curie-Weiss expression)
Figure S23 The energy diagram of central Co(II) ion in compound 1 from spin-Hamiltonian approach and
ab initio calculations
References
Electronic Supplementary Material (ESI) for Chemical ScienceThis journal is copy The Royal Society of Chemistry 2013
S‐22
1 G M Sheldrick SHELXS-97 University of Gottingen Gottingen Germany 1990
2 G M Sheldrick SHELXS-97 University of Gottingen Gottingen Germany 1997
3 X-L Yu D Scheller O Rademacher and T Wolff J Org Chem 2003 68 7386ndash7399
4 N E Brese and M OKeeffe Acta Cryst B 1991 47 192ndash197
5 ID Brown The Chemical Bond in Inorganic Chemistry The Bond Valence Model Oxford University
Press 2002
6 G Karlstrom R Lindh P A Malmqvist B O Roos U Ryde V Veryazov P O Widmark M Cossi B
Schimmelpfennig P Neogrady and L Seijo Comput Mater Sci 2003 28 222ndash239
7 L Seijo and Z Barandiaraacuten Computational Chemistry Reviews of Current Trends 1999 4 ed by J
Leszcynski (World Scientific Singapur) 55ndash152
Electronic Supplementary Material (ESI) for Chemical ScienceThis journal is copy The Royal Society of Chemistry 2013