138
2016 Annual Report
| Date post: | 25-Mar-2023 |
| Category: |
Documents |
| Upload: | khangminh22 |
| View: | 0 times |
| Download: | 0 times |

2016 Annual Report

Our BusinessesDuring fiscal 2016, Air Products manufactured and distributed products in two principal lines of business: Industrial Gases and Materials Technologies.
At the beginning of the fiscal year, Air Products reported results under seven segments:
• Industrial Gases – Americas• Industrial Gases – EMEA (Europe, Middle East, and Africa)• Industrial Gases – Asia• Industrial Gases – Global• Materials Technologies*• Energy-from-Waste**• Corporate and other
Each of the three regional Industrial Gases segments (Americas, EMEA, Asia) includes onsite air separation units (ASUs) (producing primarily oxygen, nitrogen and argon), hydrogen/HyCO plants (producing primarily hydrogen, carbon monoxide, syngas and steam), and the regional merchant gases business (including liquid/bulk, packaged gases and related equipment).
The Industrial Gases – Global segment includes atmospheric sale of equipment businesses, such as ASUs and noncryogenic generators, as well as global resources associated with the Industrial Gases business.
On 16 September 2015, the Company announced that its Board of Directors approved a preliminary plan to spin off Materials Technologies*, which contained the Electronic Materials and Performance Materials businesses. On 6 May 2016, the Company entered into an agreement to sell certain subsidiaries and assets comprising the Performance Materials business to Evonik Industries AG for $3.8 billion in cash and the assumption of certain liabilities. The Company also announced its intention to proceed with the spin-off of the Electronic Materials business. On 1 October 2016, Air Products distributed all of the shares of Versum Materials, Inc. to its shareholders, creating a new, publicly traded corporation. As of 30 September 2016, the results of operations, financial condition, and cash flows for the Electronic Materials and Performance Materials businesses are presented within the Company’s consolidated financial statements as continuing operations.
** On 29 March 2016, the Board of Directors approved the exit of the Energy-from-Waste** business. The segment is now presented as a discontinued operation.
The Corporate and other segment includes two global businesses: the liquefied natural gas (LNG) sale of equipment and process technology business, and the helium storage and distribution vessel sale of equipment business. It also includes corporate support functions that benefit all of the business segments.
I

IIAir Products | 2016 Annual Report
Millions of dollars, except per share 2016 2015 Change
FOR THE YEAR (all from continuing operations)GAAP
Sales $9,524 $9,895 (4%)Operating income 2,106 1,708 23 %Operating margin 22.1% 17.3% 480 bpNet income attributable to Air Products 1,515 1,285 18%Net income 1,546 1,324 17%Capital expenditures 1,056 1,304 (19%)Return on capital employed (ROCE) 12.8% 10.8% 200 bpReturn on average shareholders’ equity 21.2% 17.4 % 380 bp
NON-GAAPAdjusted operating income (A) 2,199 1,893 16%Adjusted operating margin(A) 23.1% 19.1% 400 bpAdjusted net income attributable to Air Products(A) 1,648 1,434 15%Adjusted EBITDA(A)(B) 3,273 2,984 10%Adjusted EBITDA margin(A)(B) 34.4% 30.2% 420 bpAdjusted capital expenditures(A) 1,083 1,678 (35%)Adjusted ROCE(B) 13.8% 12.0% 180 bpAdjusted return on average Air Products shareholders’ equity(B) 23.1% 19.4 % 370 bp
PER SHAREGAAP earnings per share (EPS) $ 6.94 $ 5.91 17%Adjusted EPS(A) 7.55 6.60 14%Dividends declared 3.39 3.20 6%Book value 32.57 33.66 (3%)
AT YEAR END Air Products shareholders’ equity $7,080 $ 7,249Shares outstanding (in millions) 217 215 Shareholders 6,000 6,400Employees (C) 18,600 19,700
Financial highlightsConsolidated sales by business segmentn Industrial Gases – Americas
n Industrial Gases – EMEA
n Industrial Gases – Asia
n Industrial Gases – Global
n Materials Technologies
n Corporate and other
Consolidated sales by destinationn U.S./Canada
n Europe
n Asia (excluding China)
n China
n Latin America
Adjusted EBITDA Margin Trend(B)36%
34%
32%
30%
28%
26%
24%Q214 Q314 Q414 Q115 Q215 Q315 Q415 Q116 Q216 Q316 Q416
25.1%
26.5%
28.7% 28.3%
29.5%30.8%
32.2%33.5%
35.1%34.2% 34.7%
39%16%
13%
18%
21%
27%
5%
3%
5%
35%
18%
(A) Amounts are non-GAAP measures. See reconciliation to GAAP results within Item 7, Management’s Discussion and Analysis of Financial Condition and Results of Operations, of the accompanying Form 10-K.(B) Amounts are non-GAAP measures. See pages III – V for reconciliation to GAAP results.(C) Includes full- and part-time employees from continuing and discontinued operations.
III
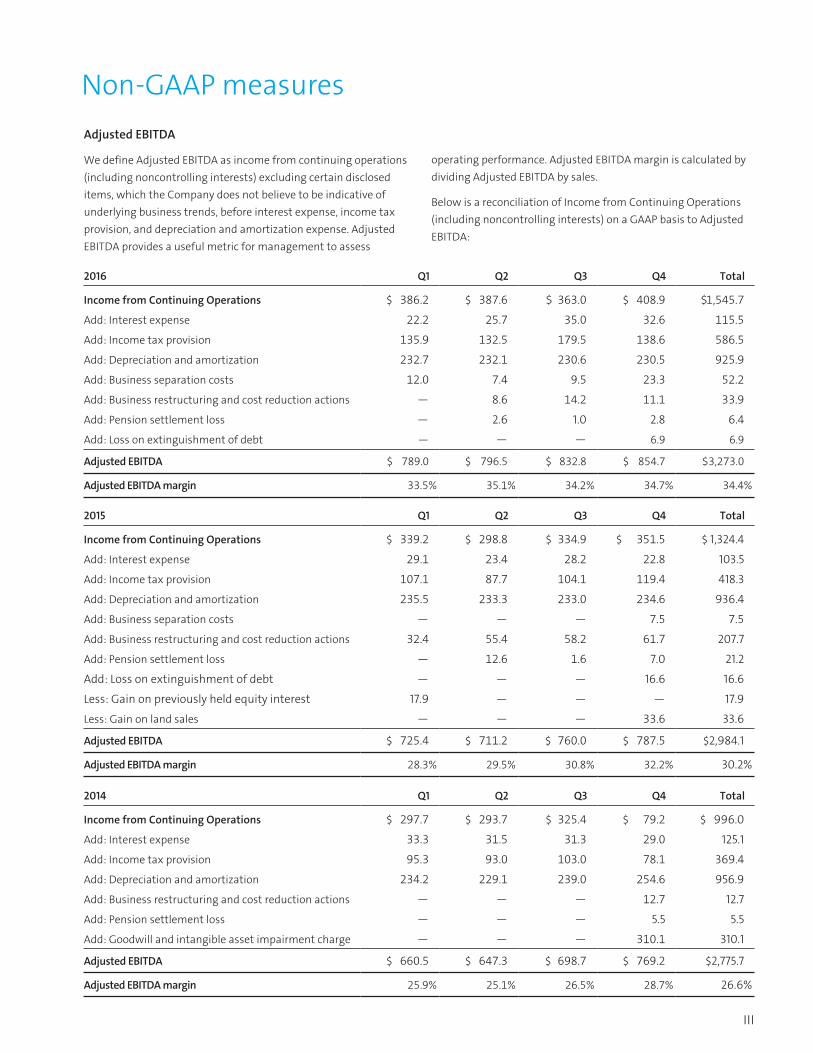
Non-GAAP measuresAdjusted EBITDA
We define Adjusted EBITDA as income from continuing operations (including noncontrolling interests) excluding certain disclosed items, which the Company does not believe to be indicative of underlying business trends, before interest expense, income tax provision, and depreciation and amortization expense. Adjusted EBITDA provides a useful metric for management to assess
2016 Q1 Q2 Q3 Q4 Total
Income from Continuing Operations $ 386.2 $ 387.6 $ 363.0 $ 408.9 $1,545.7
Add: Interest expense 22.2 25.7 35.0 32.6 115.5
Add: Income tax provision 135.9 132.5 179.5 138.6 586.5
Add: Depreciation and amortization 232.7 232.1 230.6 230.5 925.9
Add: Business separation costs 12.0 7.4 9.5 23.3 52.2
Add: Business restructuring and cost reduction actions — 8.6 14.2 11.1 33.9
Add: Pension settlement loss — 2.6 1.0 2.8 6.4
Add: Loss on extinguishment of debt — — — 6.9 6.9
Adjusted EBITDA $ 789.0 $ 796.5 $ 832.8 $ 854.7 $3,273.0
Adjusted EBITDA margin 33.5% 35.1% 34.2% 34.7% 34.4%
2015 Q1 Q2 Q3 Q4 Total
Income from Continuing Operations $ 339.2 $ 298.8 $ 334.9 $ 351.5 $ 1,324.4
Add: Interest expense 29.1 23.4 28.2 22.8 103.5
Add: Income tax provision 107.1 87.7 104.1 119.4 418.3
Add: Depreciation and amortization 235.5 233.3 233.0 234.6 936.4
Add: Business separation costs — — — 7.5 7.5
Add: Business restructuring and cost reduction actions 32.4 55.4 58.2 61.7 207.7
Add: Pension settlement loss — 12.6 1.6 7.0 21.2
Add: Loss on extinguishment of debt — — — 16.6 16.6
Less: Gain on previously held equity interest 17.9 — — — 17.9
Less: Gain on land sales — — — 33.6 33.6
Adjusted EBITDA $ 725.4 $ 711.2 $ 760.0 $ 787.5 $2,984.1
Adjusted EBITDA margin 28.3% 29.5% 30.8% 32.2% 30.2%
2014 Q1 Q2 Q3 Q4 Total
Income from Continuing Operations $ 297.7 $ 293.7 $ 325.4 $ 79.2 $ 996.0
Add: Interest expense 33.3 31.5 31.3 29.0 125.1
Add: Income tax provision 95.3 93.0 103.0 78.1 369.4
Add: Depreciation and amortization 234.2 229.1 239.0 254.6 956.9
Add: Business restructuring and cost reduction actions — — — 12.7 12.7
Add: Pension settlement loss — — — 5.5 5.5
Add: Goodwill and intangible asset impairment charge — — — 310.1 310.1
Adjusted EBITDA $ 660.5 $ 647.3 $ 698.7 $ 769.2 $2,775.7
Adjusted EBITDA margin 25.9% 25.1% 26.5% 28.7% 26.6%
operating performance. Adjusted EBITDA margin is calculated by dividing Adjusted EBITDA by sales.
Below is a reconciliation of Income from Continuing Operations (including noncontrolling interests) on a GAAP basis to Adjusted EBITDA:

IVAir Products | 2016 Annual Report
Non-GAAP measures
2016 2015
Net income from continuing operations attributable to Air Products $ 1,515.3 $ 1,284.7Interest expense 115.5 103.5Interest expense tax impact (32.2) (24.8) Interest expense, after-tax 83.3 78.7Net income attributable to noncontrolling interests 30.4 39.7
Earnings After-Tax—GAAP $ 1,629.0 $ 1,403.1
Disclosed items, after-taxBusiness separation costs 48.3 7.5Tax costs associated with business separation 51.8 —Business restructuring and cost reduction actions 24.0 153.2Pension settlement loss 4.1 13.7Gain on previously held equity interest — (11.2)Gain on land sales — (28.3)Loss on extinguishment of debt 4.3 14.2Adjusted Earnings After-Tax $ 1,761.5 $ 1,552.2
Five-Quarter Average Total Capital $12,772.0 $ 12,976.8
ROCE—GAAP 12.8% 10.8%
Change GAAP Measure 200bp
Adjusted ROCE 13.8% 12.0%
Change Non-GAAP Measure 180bp
Return on capital employed (ROCE)
Return on capital employed (ROCE) is calculated on a continuing operations basis as earnings after-tax divided by five-quarter average total capital. Earnings after-tax is defined as the sum of net income from continuing operations attributable to Air Products, interest expense, after-tax, at our effective quarterly tax rate, and
net income attributable to noncontrolling interests. On a non-GAAP basis, the GAAP measure has been adjusted for the impact of the disclosed items detailed below. Total capital consists of total debt, total equity, and redeemable noncontrolling interest less assets of discontinued operations.
V
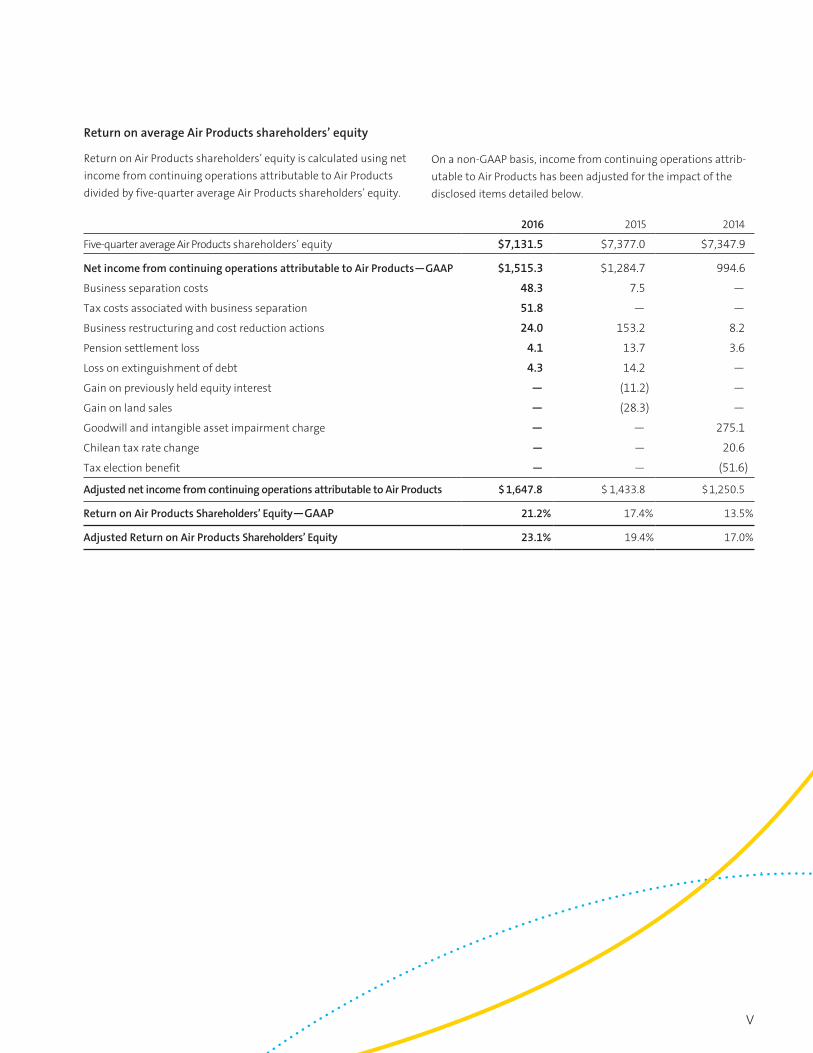
Return on average Air Products shareholders’ equity
Return on Air Products shareholders’ equity is calculated using net income from continuing operations attributable to Air Products divided by five-quarter average Air Products shareholders’ equity.
2016 2015 2014
Five-quarter average Air Products shareholders’ equity $7,131.5 $7,377.0 $7,347.9
Net income from continuing operations attributable to Air Products—GAAP $1,515.3 $1,284.7 994.6
Business separation costs 48.3 7.5 —
Tax costs associated with business separation 51.8 — —
Business restructuring and cost reduction actions 24.0 153.2 8.2
Pension settlement loss 4.1 13.7 3.6
Loss on extinguishment of debt 4.3 14.2 —
Gain on previously held equity interest — (11.2) —
Gain on land sales — (28.3) —
Goodwill and intangible asset impairment charge — — 275.1
Chilean tax rate change — — 20.6
Tax election benefit — — (51.6)
Adjusted net income from continuing operations attributable to Air Products $ 1,647.8 $ 1,433.8 $ 1,250.5
Return on Air Products Shareholders’ Equity—GAAP 21.2% 17.4% 13.5%
Adjusted Return on Air Products Shareholders’ Equity 23.1% 19.4% 17.0%
On a non-GAAP basis, income from continuing operations attrib-utable to Air Products has been adjusted for the impact of the disclosed items detailed below.

VIAir Products | 2016 Annual Report
To our shareholders*
Our management principlesIn managing Air Products, we are guided by the following key principles:
• Cash is king. We are focused on generating cash, and our incentive systems are based on adjusted EBITDA.
• In the long-term, what creates value for our shareholders is the increase in per-share value of our stock, not EPS or growth rate.
• Capital allocation is the most important job of any CEO.
• Decentralized organizations promote entrepreneurial spirit, reduce costs and help decrease corporate politics.
• We nurture core values such as safety, integrity, respect and innovation, which are all at the heart of every successful enterprise.
My fellow shareholders,Our mission at Air Products is to be a best-in-class, thriving and profitable commercial enterprise in order to create value for our shareholders. The only way to serve our customers with excellence, develop and reward our employees, and support our communities is to have a profitable company with satisfied shareholders.
Safety is job #1 for all of us at Air Products. I am very pleased to report that we made significant progress in improving our safety performance in fiscal year 2016. Our goal remains to achieve zero accidents and incidents in our operations worldwide.
*The results included in this letter are non-GAAP. See reconciliation to GAAP results within Item 7, Management’s Discussion and Analysis of Financial Condition and Results of Operations, of the accompanying Form 10-K.
Seifi GhasemiChairman, President and Chief Executive Officer of Air Products
Safety results
FY15 FY16 Change
Employee lost time 0.20 0.16 20% better injury rate
Employee recordable 0.49 0.43 12% better injury rate
In line with our stated mission, last year we committed to deliver fiscal year 2016 adjusted earnings per share (EPS) of $7.25 to $7.50 per share. Despite weaker than forecast economic activity and a currency headwind of $0.16 per share, our people delivered an adjusted EPS of $7.55 per share, a 14 percent improvement over last year, while increasing the adjusted operating margin by 400 basis points to 23.1 percent and adjusted EBITDA margin by 420 basis points to 34.4 percent.
You can read more about our fiscal year 2016 perfor-mance in the detailed report that follows this letter. But I wanted to acknowledge and thank our talented, committed and motivated employees for delivering these outstanding results and moving Air Products forward. Their performance shows their determination to achieve our goal, which is to be the safest and most profitable industrial gas company in the world, providing excellent service to our customers.

VII
Two-and-a-half years ago, we launched a strategic Five-Point Plan to achieve our stated goal of becoming the safest and most profitable industrial gas company in the world. I am very pleased to report that during fiscal 2016, we made further progress in implementing our Plan:
1. Focus on the coreAir Products is determined to focus on its core business and core competency, that is, industrial gases. In September 2015, we announced the intention to separate Materials Technologies, which included the Performance Materials and Electronic Materials businesses. In May 2016, we announced an agreement to sell our Performance Materials business to Evonik for $3.8 billion in cash, and we said we would proceed with the spin-off of Electronic Materials as a stand-alone company. I am very pleased to report that Versum Materials, Inc. spun off on October 1, 2016, and we are working to complete the sale of our Performance Materials business as soon as possible. These actions will further enhance our ability to take advantage of exciting investment opportunities to grow our core industrial gases business.
2. Restructure the companySuccessfully executing the second point of our Plan hinged on our ability to run our industrial gases business on a geographically focused structure. Last year, we embarked on the largest organizational restructuring that Air Products has ever undertaken, creating more than 40 teams with individual incentive plans and the empowered, decentralized structure that we have today. We also eliminated significant layers of management and the global structure on top of the local structure. This fundamental restructuring of the company is now complete and fully functional, delivering the excellent results you see in this Annual Report.
3. Company cultureI have always believed that the culture of the company is a key element of success. No matter how strong the strategy, it must be executed by every employee in the company. Therefore, the fundamental culture of the enterprise, and the commitment and motivation of our people, will guarantee our success.
To that end, we relentlessly promote the following key principles at Air Products:
• Safety: The only acceptable goal is zero accidents and incidents. All accidents are preventable. Everyone is responsible and accountable for safety at Air Products.
• Simplicity: We constantly endeavor to simplify our organization and work processes. This is essential to improve productivity and enhance our ability to serve our customers. We focus not only on doing things right, but on doing the right things. We eliminate unnecessary work so that we have time and energy to do what is necessary.
• Speed: We believe speed of execution is a key competitive advantage.
• Self-confidence: As a team, we believe we have the capability and the capacity to be the best in the industry.
4. Controlling capital and costsWe made excellent progress this year in the responsible use of cash and controlling costs. Our CFO and I review every capital investment of more than $3 million, and we’ve established a minimum hurdle rate of 10 percent internal rate of return for all new projects. Meanwhile, we significantly reduced our cost structure through our major reorganization, lowering overhead costs by $300 million run rate. We have a detailed plan to achieve an additional $300 million of operational cost savings. In fiscal year 2016, we delivered more than $75 million of this cost saving initiative, and we are well on our way to deliver the balance in the next three years.
5. Align rewardsWe have completely changed the incentive reward program. Annual performance bonus is based on adjusted EBITDA results, and people are rewarded on what they achieve in their specific business unit. This has created differentiation. Some units in 2016 will get up to 200 percent of their targeted rewards – well deserved. And our long-term incentive plan is now based on the relative total shareholder return as described in our Proxy Statement.
Progress implementing our Five-Point Plan
VIIIAir Products | 2016 Annual Report
Seifi GhasemiChairman, President and Chief Executive Officer of Air Products
Promoting growthWhile improving our cost structure and delivering on our financial commitments, we also remained focused on winning profitable projects to ensure future growth.
During the year, we were successful in bringing onstream several large projects in China and around the world. We were honored to have Saudi Aramco, the world’s largest oil company, award us the right to build the world’s largest industrial gas complex with an investment of more than $2 billion. This project was awarded to us in fiscal year 2015, and we are making significant progress in executing this project.
During the year, we also started up a world-scale hydrogen plant in Canada to support our pipeline customers. In the U.S., we completed and successfully started up the facilities to supply gases to Big River Steel in Arkansas; won the right to build and operate a plant to support the activities of Chemours in Tennessee; and broke ground on a new, world-class hydrogen plant for Covestro in Texas, connecting to our existing Gulf Coast pipeline system. We will also build a major air separation unit to support our customers in Ulsan, Korea.
AcknowledgmentsI want to close by thanking those who have supported us throughout the year and helped us achieve our success.
To our customers . . . We thank you for giving us your business. At the end of the day, we recognize that Air Products could not exist without your confidence and support. That’s why we strive to provide you with solutions and innovations that you need to be successful. Your success is our success. Providing excellent service to you, our customers, remains the foundation of all we are aiming to achieve.
To our employees . . . I want to thank everyone at Air Products for your commitment to excellence, dedication, collaboration and hard work. The collective success of Air Products depends on each one of our people coming to work, acting as if he or she is the CEO of the company, and doing his or her best to improve our performance. I know that our people are committed to making Air Products successful, and that is the main reason I am optimistic about the future of our company.
To our shareholders . . . Thank you for your confidence and investment in our company. We are focused on creating shareholder value; that is our priority at Air Products.
To our shareholders
Our goal is to be the safest and most
profitable industrial gas company
in the world, providing excellent
service to our customers.
IX
Executive OfficersSeifi Ghasemi Chairman, President and Chief Executive Officer
M. Scott Crocco Executive Vice President and Chief Financial Officer
Jennifer L. Grant Vice President and Chief Human Resources Officer
Corning F. Painter Executive Vice President Industrial Gases
Board of Directors
Susan K. Carter Senior Vice President and Chief Financial Officer of Ingersoll-Rand Plc. Director of the Company since 2011.
Charles I. Cogut Senior Mergers and Acquisitions Counsel and Retired Partner, Simpson Thacher & Bartlett LLP. Director of the Company since 2015.
Chadwick C. (Chad) Deaton (Lead Director) Retired Chairman and Chief Executive Officer of Baker Hughes Incorporated. Director of the Company since 2010.
Seifi Ghasemi Chairman, President and Chief Executive Officer of the Company. Director of the Company since 2013.
For more information about corporate governance practices at Air Products, visit our Governance website at www.airproducts.com/company/governance.
David H. Y. Ho Chairman and Founder of Kiina Investment Ltd. Director of the Company since 2013.
Margaret G. McGlynn Retired President, International AIDS Vaccine Initiative and Merck & Co., Inc. Global Vaccine and Infectious Disease Division. Director of the Company since 2005.
Edward L. Monser President and Chief Operating Officer of Emerson Electric Co. Director of the Company since 2013.
Matthew H. Paull Former Senior Executive Vice President and Chief Financial Officer of McDonald’s Corporation. Director of the Company since 2013.
UNITED STATES
SECURITIES AND EXCHANGE COMMISSION
WASHINGTON, D.C. 20549
FORM 10-KÈ ANNUAL REPORT PURSUANT TO SECTION 13 OR 15(d) OF THE SECURITIES
EXCHANGE ACT OF 1934 For the fiscal year ended 30 September 2016
OR
‘ TRANSITION REPORT PURSUANT TO SECTION 13 OR 15(d) OF THE SECURITIES
EXCHANGE ACT OF 1934 For the transition period from to
Commission file number 1-4534
AIR PRODUCTS AND CHEMICALS, INC.7201 Hamilton Boulevard State of incorporation: Delaware
Allentown, Pennsylvania, 18195-1501 I.R.S. identification number: 23-1274455
Tel. (610) 481-4911
Securities registered pursuant to Section 12(b) of the Act:
Title of Each Class: Registered on:
Common Stock, par value $1.00 per share New York Stock Exchange
2.0% Euro Notes due 2020 New York Stock Exchange
.375% Euro Notes due 2021 New York Stock Exchange
1.0% Euro Notes due 2025 New York Stock Exchange
Securities registered pursuant to Section 12(g) of the Act: None
Indicate by check mark if the registrant is a well-known seasoned issuer, as defined in Rule 405 of the Securities Act. YES È NO ‘
Indicate by check mark if the registrant is not required to file reports pursuant to Section 13 or Section 15(d) of the Act. YES ‘ NO È
Indicate by check mark whether the registrant (1) has filed all reports required to be filed by Section 13 or 15(d) of theSecurities Exchange Act of 1934 during the preceding 12 months (or for such shorter period that the registrant wasrequired to file such reports), and (2) has been subject to such filing requirements for the past 90 days. YES È NO ‘
Indicate by check mark whether the registrant has submitted electronically and posted on its corporate Web site, if any,every Interactive Data File required to be submitted and posted pursuant to Rule 405 of Regulation S-T (§232.405 ofthis chapter) during the preceding 12 months (or for such shorter period that the registrant was required to submit andpost such files). YES È NO ‘
Indicate by check mark if disclosure of delinquent filers pursuant to Item 405 of Regulation S-K (§ 229.405) is not contained herein, andwill not be contained, to the best of registrant’s knowledge, in definitive proxy or information statements incorporated by reference inPart III of this Form 10-K or any amendment to this Form 10-K. È
Indicate by check mark whether the registrant is a large accelerated filer, an accelerated filer, a non-accelerated filer, or a smaller reportingcompany. See the definitions of “large accelerated filer,” “accelerated filer,” and “smaller reporting company” in Rule 12b-2 of the ExchangeAct.
Large accelerated filer È Accelerated filer ‘ Non-accelerated filer ‘ Smaller reporting company ‘
Indicate by check mark whether the registrant is a shell company (as defined in Rule 12b-2 of the Act). YES ‘ NO È
The aggregate market value of the voting stock held by non-affiliates of the registrant on 31 March 2016 was approximately $31.0 billion. Forpurposes of the foregoing calculations all directors and/or executive officers have been deemed to be affiliates, but the registrant disclaims thatany such director and/or executive officer is an affiliate.
The number of shares of common stock outstanding as of 31 October 2016 was 217,375,097.
DOCUMENTS INCORPORATED BY REFERENCE
Portions of the registrant’s definitive Proxy Statement for the Annual Meeting of Shareholders to be held on 26 January 2017 are incorporatedby reference into Part III.
AIR PRODUCTS AND CHEMICALS, INC.
ANNUAL REPORT ON FORM 10-K
For the fiscal year ended 30 September 2016
TABLE OF CONTENTS
ITEM 1. BUSINESS . . . . . . . . . . . . . . . . . . . . . . . . . . . . . . . . . . . . . . . . . . . . . . . . . . . . . . . . . . . . . . . . 3
ITEM 1A. RISK FACTORS . . . . . . . . . . . . . . . . . . . . . . . . . . . . . . . . . . . . . . . . . . . . . . . . . . . . . . . . . . . 10
ITEM 1B. UNRESOLVED STAFF COMMENTS . . . . . . . . . . . . . . . . . . . . . . . . . . . . . . . . . . . . . . . . . . 15
ITEM 2. PROPERTIES . . . . . . . . . . . . . . . . . . . . . . . . . . . . . . . . . . . . . . . . . . . . . . . . . . . . . . . . . . . . . 15
ITEM 3. LEGAL PROCEEDINGS . . . . . . . . . . . . . . . . . . . . . . . . . . . . . . . . . . . . . . . . . . . . . . . . . . . . . 16
ITEM 4. SUBMISSION OF MATTERS TO A VOTE OF SECURITY HOLDERS . . . . . . . . . . . . . . . 18
ITEM 5. MARKET FOR REGISTRANT’S COMMON EQUITY, RELATED STOCKHOLDERMATTERS, AND ISSUER PURCHASES OF EQUITY SECURITIES . . . . . . . . . . . . . . . . . 18
ITEM 6. SELECTED FINANCIAL DATA . . . . . . . . . . . . . . . . . . . . . . . . . . . . . . . . . . . . . . . . . . . . . . . 20
ITEM 7. MANAGEMENT’S DISCUSSION AND ANALYSIS OF FINANCIAL CONDITION ANDRESULTS OF OPERATIONS . . . . . . . . . . . . . . . . . . . . . . . . . . . . . . . . . . . . . . . . . . . . . . . . 22
ITEM 7A. QUANTITATIVE AND QUALITATIVE DISCLOSURES ABOUT MARKET RISK . . . . . . . . 55
ITEM 8. FINANCIAL STATEMENTS AND SUPPLEMENTARY DATA . . . . . . . . . . . . . . . . . . . . . . . 58
ITEM 9. CHANGES IN AND DISAGREEMENTS WITH ACCOUNTANTS ON ACCOUNTINGAND FINANCIAL DISCLOSURE . . . . . . . . . . . . . . . . . . . . . . . . . . . . . . . . . . . . . . . . . . . . . . 116
ITEM 9A. CONTROLS AND PROCEDURES . . . . . . . . . . . . . . . . . . . . . . . . . . . . . . . . . . . . . . . . . . . . 116
ITEM 9B. OTHER INFORMATION . . . . . . . . . . . . . . . . . . . . . . . . . . . . . . . . . . . . . . . . . . . . . . . . . . . . . 116
ITEM 10. DIRECTORS, EXECUTIVE OFFICERS AND CORPORATE GOVERNANCE . . . . . . . . . 116
ITEM 11. EXECUTIVE COMPENSATION . . . . . . . . . . . . . . . . . . . . . . . . . . . . . . . . . . . . . . . . . . . . . . . 117
ITEM 12. SECURITY OWNERSHIP OF CERTAIN BENEFICIAL OWNERS AND MANAGEMENTAND RELATED STOCKHOLDER MATTERS . . . . . . . . . . . . . . . . . . . . . . . . . . . . . . . . . . . . 117
ITEM 13. CERTAIN RELATIONSHIPS AND RELATED TRANSACTIONS, AND DIRECTORINDEPENDENCE . . . . . . . . . . . . . . . . . . . . . . . . . . . . . . . . . . . . . . . . . . . . . . . . . . . . . . . . . . 118
ITEM 14. PRINCIPAL ACCOUNTANT FEES AND SERVICES . . . . . . . . . . . . . . . . . . . . . . . . . . . . . . 118
ITEM 15. EXHIBITS AND FINANCIAL STATEMENT SCHEDULES . . . . . . . . . . . . . . . . . . . . . . . . . . 118
SIGNATURES . . . . . . . . . . . . . . . . . . . . . . . . . . . . . . . . . . . . . . . . . . . . . . . . . . . . . . . . . . . . . . . . . . . . . . . . . . . 119
2

PART I
ITEM 1. BUSINESS
General Description of Business
Air Products and Chemicals, Inc. (“we,” “our,” “us,” the “Company,” “Air Products,” or “registrant”), a Delawarecorporation originally founded in 1940, serves energy, electronics, chemicals, metals, and manufacturingcustomers globally with a unique portfolio of products, services, and solutions that include atmospheric gases,process and specialty gases, electronics and performance materials, equipment, and services. The Company isthe world’s largest supplier of hydrogen and has built leading positions in growth markets such as helium, refineryhydrogen, semiconductor materials, natural gas liquefaction, and advanced coatings and adhesives. As used inthis report, unless the context indicates otherwise, the terms “we,” “our,” “us,” the “Company,” or “registrant”include controlled subsidiaries, affiliates, and predecessors of Air Products and its controlled subsidiaries andaffiliates.
During its fiscal year ended 30 September 2016 (“fiscal year 2016”), the Company manufactured and distributedproducts in two principal lines of business: Industrial Gases and Materials Technologies. Industrial Gases’ primaryproducts were atmospheric gases, process gases, and equipment for air separation. Materials Technologies’primary products were performance materials and chemicals, such as epoxy amine curing agents, polyurethanecatalysts, additives, and specialty surfactants, and electronic materials such as specialty gases, chemicalmechanical planarization slurries, and specialty chemicals. The Company also designs and manufacturesequipment for natural gas liquefaction and helium distribution.
At the beginning of the fiscal year, the Company reported its business in seven reporting segments under which itmanaged its operations, assessed performance, and reported earnings: Industrial Gases – Americas; IndustrialGases – EMEA (Europe, Middle East, and Africa); Industrial Gases – Asia; Industrial Gases – Global; MaterialsTechnologies; Energy-from-Waste; and Corporate and other. On 29 March 2016, the Board of Directors approvedthe Company’s exit of its Energy-from-Waste business based on continued difficulties encountered in making itstwo Energy-from-Waste projects operational and the Company’s conclusion, based on testing and analysiscompleted during the second quarter of fiscal year 2016, that significant additional time and resources would berequired to make the projects operational. The Energy-from-Waste segment is now presented as a discontinuedoperation. Refer to Note 26, Business Segment and Geographic Information, to the consolidated financialstatements for additional details on our reportable business segments.
On 16 September 2015, the Company announced that its Board of Directors approved a preliminary plan to spinoff its Materials Technologies business, which contained the Electronic Materials and Performance Materialsbusinesses. On 6 May 2016, the Company entered into an agreement to sell certain subsidiaries and assetscomprising the Performance Materials business to Evonik Industries AG for $3.8 billion in cash and theassumption of certain liabilities. The Company also announced its intention to proceed with the spin-off of theElectronic Materials business. In preparation for the spin-off, Air Products transferred operations, employees,assets, and liabilities of the Electronic Materials business to its wholly owned subsidiary, Versum Materials, Inc.(Versum). On 1 October 2016, Air Products distributed all of the shares of Versum Materials, Inc. to itsshareholders, creating a new publicly traded corporation. As of 30 September 2016, the results of operations,financial condition, and cash flows for the Electronic Materials and Performance Materials businesses arepresented within the Company’s consolidated financial statements as continuing operations. Beginning with thefirst quarter of fiscal year 2017, the historical results of Electronic Materials will be presented as a discontinuedoperation. The historical results of Performance Materials will be reflected as a discontinued operation when itbecomes probable for the sale to occur and actions required to meet the plan of sale indicate that it is unlikely thatsignificant changes will occur.
3

Narrative Description of Business by Segments
Industrial Gases Business
The Company’s Industrial Gases business produces atmospheric gases (oxygen, nitrogen, argon, and raregases), process gases (hydrogen, helium, carbon dioxide, carbon monoxide, syngas and specialty gases) andequipment for the production or processing of gases such as air separation units and non-cryogenic generators.Atmospheric gases are produced through various air separation processes of which cryogenic is the mostprevalent. Process gases are produced by methods other than air separation. For example, hydrogen is producedby steam methane reforming of natural gas or by purifying byproduct sources obtained from the chemical andpetrochemical industries; and helium is produced as a byproduct of gases extracted from underground reservoirs,primarily natural gas, but also carbon dioxide purified before resale.
The Company’s Industrial Gases business is organized and operated regionally. The regional Industrial Gasessegments (Americas, EMEA, and Asia) supply gases and related equipment in the relevant region to diversifiedcustomers in many industries, including those in metals, glass, chemical processing, electronics, energyproduction and refining, food processing, metallurgical industries, medical, and general manufacturing. Hydrogenis used by refiners to facilitate the conversion of heavy crude feedstock and lower the sulfur content of gasolineand diesel fuels. The chemicals industry uses hydrogen, oxygen, nitrogen, carbon monoxide and syngas asfeedstocks in the production of many basic chemicals. The energy production industry uses nitrogen injection forenhanced recovery of oil and natural gas and oxygen for gasification. Oxygen is used in combustion and industrialheating applications, including in the steel, certain nonferrous metals, glass and cement industries. Nitrogenapplications are used in food processing for freezing and preserving flavor and nitrogen for inerting is used invarious fields, including the metallurgical, chemical, and semiconductor industries. Helium is used in laboratoriesand healthcare for cooling and in other industries for pressurizing, purging and lifting. Argon is used in the metalsand other industries for its unique inerting, thermal conductivity and other properties. Industrial gases are alsoused in welding and providing healthcare and are utilized in various manufacturing processes to make them moreefficient and to optimize performance.
We distribute gases to our customers through a variety of supply modes:
Liquid Bulk—Product is delivered in bulk (in liquid or gaseous form) by tanker or tube trailer and stored,usually in its liquid state, in equipment designed and installed typically by the Company at the customer’ssite for vaporizing into a gaseous state as needed. Liquid bulk sales are usually governed by three- to five-year contracts.
Packaged Gases—Small quantities of product are delivered in either cylinders or dewars. The Companyoperates packaged gas businesses in Europe, Asia, and Latin America. In the United States, theCompany’s packaged gas business sells products only for the electronics and magnetic resonance imaging(principally helium) industries.
On-Site Gases—Large quantities of hydrogen, nitrogen, oxygen, carbon monoxide, and syngas (a mixtureof hydrogen and carbon monoxide) are provided to customers, principally the energy production andrefining, chemical, and metallurgical industries worldwide who require large volumes of gases that haverelatively constant demand. Gases are produced at large facilities located adjacent to customers’ facilitiesor by pipeline systems from centrally located production facilities and are generally governed by 15- to 20-year contracts. The Company also delivers small quantities of product through small on-site plants(cryogenic or non-cryogenic generators), typically either via a 10- to 15- year sale of gas contract orthrough the sale of the equipment to the customer.
Electricity is the largest cost component in the production of atmospheric gases, and natural gas is the principalraw material for hydrogen, carbon monoxide, and syngas production. We mitigate energy and natural gas pricefluctuations contractually through pricing formulas, surcharges, and cost pass-through arrangements. Duringfiscal year 2016, no significant difficulties were encountered in obtaining adequate supplies of power and naturalgas.
The regional Industrial Gases segments also include our share of the results of several joint ventures accountedfor by the equity method. The largest of these joint ventures operate in Mexico, Italy, South Africa, India, SaudiArabia, and Thailand.
4
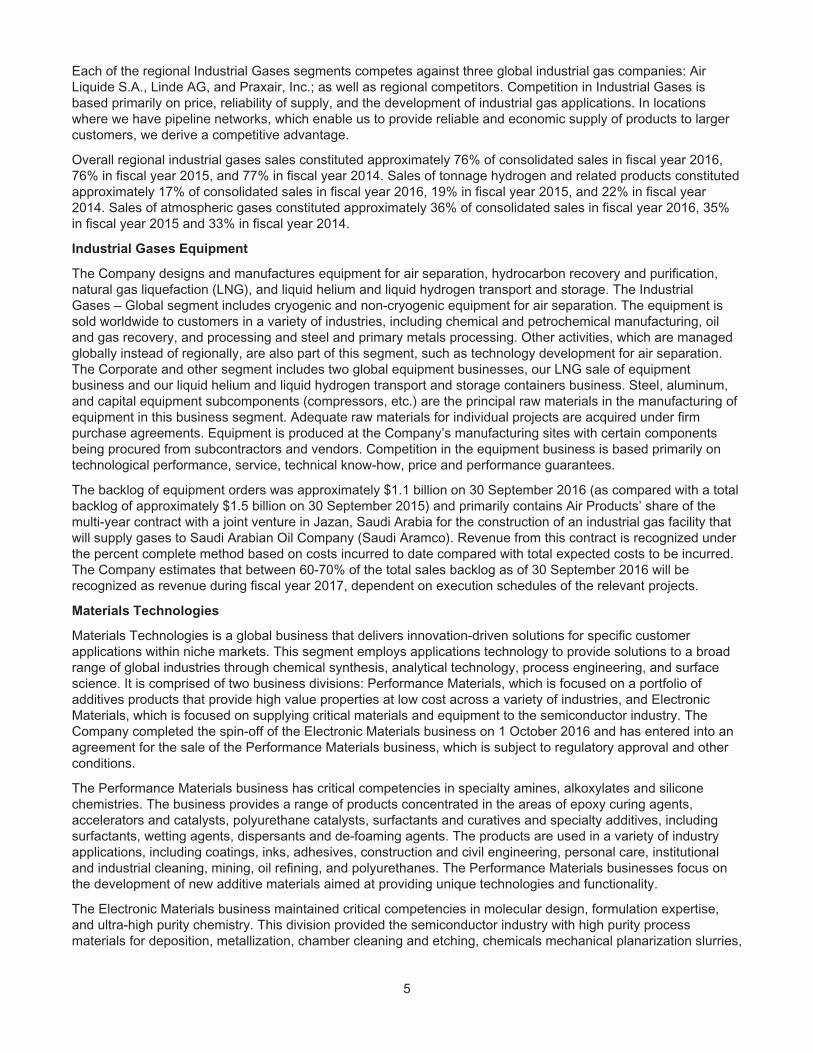
Each of the regional Industrial Gases segments competes against three global industrial gas companies: AirLiquide S.A., Linde AG, and Praxair, Inc.; as well as regional competitors. Competition in Industrial Gases isbased primarily on price, reliability of supply, and the development of industrial gas applications. In locationswhere we have pipeline networks, which enable us to provide reliable and economic supply of products to largercustomers, we derive a competitive advantage.
Overall regional industrial gases sales constituted approximately 76% of consolidated sales in fiscal year 2016,76% in fiscal year 2015, and 77% in fiscal year 2014. Sales of tonnage hydrogen and related products constitutedapproximately 17% of consolidated sales in fiscal year 2016, 19% in fiscal year 2015, and 22% in fiscal year2014. Sales of atmospheric gases constituted approximately 36% of consolidated sales in fiscal year 2016, 35%in fiscal year 2015 and 33% in fiscal year 2014.
Industrial Gases Equipment
The Company designs and manufactures equipment for air separation, hydrocarbon recovery and purification,natural gas liquefaction (LNG), and liquid helium and liquid hydrogen transport and storage. The IndustrialGases – Global segment includes cryogenic and non-cryogenic equipment for air separation. The equipment issold worldwide to customers in a variety of industries, including chemical and petrochemical manufacturing, oiland gas recovery, and processing and steel and primary metals processing. Other activities, which are managedglobally instead of regionally, are also part of this segment, such as technology development for air separation.The Corporate and other segment includes two global equipment businesses, our LNG sale of equipmentbusiness and our liquid helium and liquid hydrogen transport and storage containers business. Steel, aluminum,and capital equipment subcomponents (compressors, etc.) are the principal raw materials in the manufacturing ofequipment in this business segment. Adequate raw materials for individual projects are acquired under firmpurchase agreements. Equipment is produced at the Company’s manufacturing sites with certain componentsbeing procured from subcontractors and vendors. Competition in the equipment business is based primarily ontechnological performance, service, technical know-how, price and performance guarantees.
The backlog of equipment orders was approximately $1.1 billion on 30 September 2016 (as compared with a totalbacklog of approximately $1.5 billion on 30 September 2015) and primarily contains Air Products’ share of themulti-year contract with a joint venture in Jazan, Saudi Arabia for the construction of an industrial gas facility thatwill supply gases to Saudi Arabian Oil Company (Saudi Aramco). Revenue from this contract is recognized underthe percent complete method based on costs incurred to date compared with total expected costs to be incurred.The Company estimates that between 60-70% of the total sales backlog as of 30 September 2016 will berecognized as revenue during fiscal year 2017, dependent on execution schedules of the relevant projects.
Materials Technologies
Materials Technologies is a global business that delivers innovation-driven solutions for specific customerapplications within niche markets. This segment employs applications technology to provide solutions to a broadrange of global industries through chemical synthesis, analytical technology, process engineering, and surfacescience. It is comprised of two business divisions: Performance Materials, which is focused on a portfolio ofadditives products that provide high value properties at low cost across a variety of industries, and ElectronicMaterials, which is focused on supplying critical materials and equipment to the semiconductor industry. TheCompany completed the spin-off of the Electronic Materials business on 1 October 2016 and has entered into anagreement for the sale of the Performance Materials business, which is subject to regulatory approval and otherconditions.
The Performance Materials business has critical competencies in specialty amines, alkoxylates and siliconechemistries. The business provides a range of products concentrated in the areas of epoxy curing agents,accelerators and catalysts, polyurethane catalysts, surfactants and curatives and specialty additives, includingsurfactants, wetting agents, dispersants and de-foaming agents. The products are used in a variety of industryapplications, including coatings, inks, adhesives, construction and civil engineering, personal care, institutionaland industrial cleaning, mining, oil refining, and polyurethanes. The Performance Materials businesses focus onthe development of new additive materials aimed at providing unique technologies and functionality.
The Electronic Materials business maintained critical competencies in molecular design, formulation expertise,and ultra-high purity chemistry. This division provided the semiconductor industry with high purity processmaterials for deposition, metallization, chamber cleaning and etching, chemicals mechanical planarization slurries,
5

organosilanes, organometalics and liquid dopants for thin film deposition, formulated chemical products for post-etch cleaning and delivery equipment and services primarily for the manufacture of silicon and compoundsemiconductors and thin film transistor liquid crystal displays.
Both businesses are based on strong customer relationships and collaborative development, technology andinnovation leadership, unique product positioning, and a strong global infrastructure with in-region flexiblemanufacturing capabilities. The segment maintains manufacturing operations in North America, Europe and Asiaand manages a complex global supply chain. Products are delivered in bulk containers of different sizes, some ofwhich are returnable.
Materials Technologies uses a wide variety of raw materials including amines and amine derivatives, alcohols andsurfactants, tungsten powder, ethylene oxide, and ketones. During fiscal year 2016, no significant difficulties wereencountered in obtaining adequate supplies of energy or raw materials.
Materials Technologies faces competition on a product-by-product basis against competitors ranging from nichesuppliers with a single product to larger and more vertically integrated companies. Competition is principallyconducted on the basis of price, quality, product performance, reliability of product supply, technical innovation,service, and global infrastructure.
Total sales from Materials Technologies constituted approximately 21% of consolidated sales in fiscal year 2016,21% of consolidated sales in fiscal year 2015, and 20% in fiscal year 2014. Performance Materials Division salesconstituted approximately 11% of consolidated sales in fiscal year 2016, 11% in fiscal year 2015, and 11% infiscal year 2014, and Electronic Materials Division sales constituted approximately 10% of consolidated sales infiscal year 2016, 10% of consolidated sales in fiscal year 2015, and 9% in fiscal year 2014.
Narrative Description of the Company’s Business Generally
The Company, through subsidiaries, affiliates, and less-than-controlling interests, conducts business in 50countries outside the United States. Its international businesses are subject to risks customarily encountered inforeign operations, including fluctuations in foreign currency exchange rates and controls; import and exportcontrols; and other economic, political, and regulatory policies of local governments.
The Company has majority or wholly owned foreign subsidiaries that operate in Canada, 17 European countries(including the United Kingdom, the Netherlands, and Spain), 11 Asian countries (including China, Korea, andTaiwan), 7 Latin American countries (including Chile and Brazil), 2 African countries, and 1 Middle Easterncountry. The Company also owns less-than-controlling interests in entities operating in Europe, Asia, Africa, theMiddle East, and Latin America (including Italy, Germany, China, India, Saudi Arabia, Singapore, Thailand, UnitedArab Emirates, South Africa, and Mexico).
Financial information about the Company’s foreign operations and investments is included in Note 8, SummarizedFinancial Information of Equity Affiliates; Note 23, Income Taxes; and Note 26, Business Segment andGeographic Information, to the consolidated financial statements included under Item 8, herein. Information aboutforeign currency translation is included under “Foreign Currency” in Note 1, Major Accounting Policies, andinformation on the Company’s exposure to currency fluctuations is included in Note 13, Financial Instruments, tothe consolidated financial statements, included under Item 8, below, and in “Foreign Currency Exchange RateRisk,” included under Item 7A, below. Export sales from operations in the United States to third-party customersamounted to $307.7 million, $398.8 million, and $378.7 million in fiscal years 2016, 2015, and 2014, respectively.
Technology Development
The Company pursues a market-oriented approach to technology development through research anddevelopment, engineering, and commercial development processes. It conducts research and developmentprincipally in its laboratories located in the United States (Trexlertown, Pennsylvania; Carlsbad, California; Milton,Wisconsin; and Phoenix, Arizona), Canada (Vancouver), the United Kingdom (Basingstoke and Carrington),Germany (Hamburg), the Netherlands (Utrecht), Spain (Barcelona), Japan (Kawasaki), China (Shanghai), Korea(Giheung), and Taiwan (Chupei and Hsinchu City). The Company also funds and cooperates in research anddevelopment programs conducted by a number of major universities and undertakes research work funded byothers—principally the United States government.
The Company’s research groups are aligned with and support the research efforts of various businessesthroughout the Company. Development of technology for use within the Industrial Gases business focuses
6
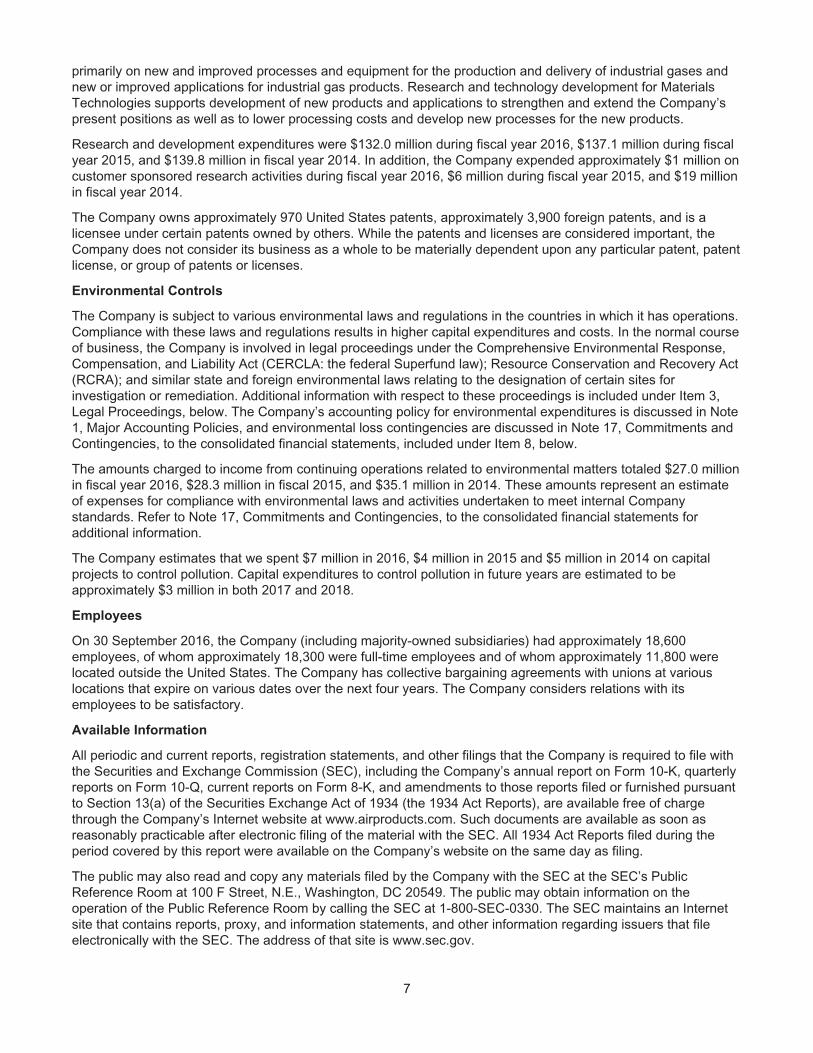
primarily on new and improved processes and equipment for the production and delivery of industrial gases andnew or improved applications for industrial gas products. Research and technology development for MaterialsTechnologies supports development of new products and applications to strengthen and extend the Company’spresent positions as well as to lower processing costs and develop new processes for the new products.
Research and development expenditures were $132.0 million during fiscal year 2016, $137.1 million during fiscalyear 2015, and $139.8 million in fiscal year 2014. In addition, the Company expended approximately $1 million oncustomer sponsored research activities during fiscal year 2016, $6 million during fiscal year 2015, and $19 millionin fiscal year 2014.
The Company owns approximately 970 United States patents, approximately 3,900 foreign patents, and is alicensee under certain patents owned by others. While the patents and licenses are considered important, theCompany does not consider its business as a whole to be materially dependent upon any particular patent, patentlicense, or group of patents or licenses.
Environmental Controls
The Company is subject to various environmental laws and regulations in the countries in which it has operations.Compliance with these laws and regulations results in higher capital expenditures and costs. In the normal courseof business, the Company is involved in legal proceedings under the Comprehensive Environmental Response,Compensation, and Liability Act (CERCLA: the federal Superfund law); Resource Conservation and Recovery Act(RCRA); and similar state and foreign environmental laws relating to the designation of certain sites forinvestigation or remediation. Additional information with respect to these proceedings is included under Item 3,Legal Proceedings, below. The Company’s accounting policy for environmental expenditures is discussed in Note1, Major Accounting Policies, and environmental loss contingencies are discussed in Note 17, Commitments andContingencies, to the consolidated financial statements, included under Item 8, below.
The amounts charged to income from continuing operations related to environmental matters totaled $27.0 millionin fiscal year 2016, $28.3 million in fiscal 2015, and $35.1 million in 2014. These amounts represent an estimateof expenses for compliance with environmental laws and activities undertaken to meet internal Companystandards. Refer to Note 17, Commitments and Contingencies, to the consolidated financial statements foradditional information.
The Company estimates that we spent $7 million in 2016, $4 million in 2015 and $5 million in 2014 on capitalprojects to control pollution. Capital expenditures to control pollution in future years are estimated to beapproximately $3 million in both 2017 and 2018.
Employees
On 30 September 2016, the Company (including majority-owned subsidiaries) had approximately 18,600employees, of whom approximately 18,300 were full-time employees and of whom approximately 11,800 werelocated outside the United States. The Company has collective bargaining agreements with unions at variouslocations that expire on various dates over the next four years. The Company considers relations with itsemployees to be satisfactory.
Available Information
All periodic and current reports, registration statements, and other filings that the Company is required to file withthe Securities and Exchange Commission (SEC), including the Company’s annual report on Form 10-K, quarterlyreports on Form 10-Q, current reports on Form 8-K, and amendments to those reports filed or furnished pursuantto Section 13(a) of the Securities Exchange Act of 1934 (the 1934 Act Reports), are available free of chargethrough the Company’s Internet website at www.airproducts.com. Such documents are available as soon asreasonably practicable after electronic filing of the material with the SEC. All 1934 Act Reports filed during theperiod covered by this report were available on the Company’s website on the same day as filing.
The public may also read and copy any materials filed by the Company with the SEC at the SEC’s PublicReference Room at 100 F Street, N.E., Washington, DC 20549. The public may obtain information on theoperation of the Public Reference Room by calling the SEC at 1-800-SEC-0330. The SEC maintains an Internetsite that contains reports, proxy, and information statements, and other information regarding issuers that fileelectronically with the SEC. The address of that site is www.sec.gov.
7

Seasonality
Although the Company’s businesses are not subject to seasonal fluctuations to any material extent, MaterialsTechnologies is susceptible to the cyclical nature of the electronics industry and to seasonal fluctuations inunderlying end-use performance materials markets.
Working Capital
Our working capital balance was a positive $1,034 at 30 September 2016. The cash and cash items balance ishigher than our historical trend and primarily results from transactions related to the anticipated spin-off of Versumand positive operating cash flows.
The Company maintains inventory where required to facilitate the supply of products to customers on areasonable delivery schedule. Industrial Gases’ inventory consists primarily of industrial gas, specialty gas, andcrude helium inventories supplied to customers through liquid bulk and packaged gases supply modes. MaterialsTechnologies’ inventories consist primarily of bulk and packaged specialty gases and chemicals, bulk andpackaged performance chemical solutions and also include inventories to support sales of equipment andservices.
Customers
We do not have a homogeneous customer base or end market, and no single customer accounts for more than10% of our consolidated revenues. We do have concentrations of customers in specific industries, primarilyrefining, chemicals, and electronics. Within each of these industries, the Company has several large-volumecustomers with long-term contracts. A negative trend affecting one of these industries, or the loss of one of thesemajor customers, although not material to our consolidated revenue, could have an adverse impact on theaffected segment.
Governmental Contracts
No segment’s business is subject to a government entity’s renegotiation of profits or termination of contracts thatwould be material to our business as a whole.
8

Executive Officers of the Company
The Company’s executive officers and their respective positions and ages on 21 November 2016 follow.Information with respect to offices held is stated in fiscal years.
Name Age Office
M. Scott Crocco 52 Executive Vice President and Chief Financial Officer (becameExecutive Vice President and Chief Financial Officer in 2016;Senior Vice President and Chief Financial Officer in 2013; and VicePresident and Corporate Controller in 2008).
Russell A. Flugel 47 Vice President, Corporate Controller and Principal AccountingOfficer (became Vice President, Corporate Controller and PrincipalAccounting Officer in 2015; Corporate Controller in 2014; Director,Accounting and Corporate Decision Support in 2013; and Director,Corporate Decision Support, Technical Accounting andConsolidation in 2011).
Seifi Ghasemi 72 Chairman, President, and Chief Executive Officer (becameChairman, President and Chief Executive Officer in 2014 andChairman and Chief Executive Officer of Rockwood Holdings, Inc.in 2001). Mr. Ghasemi is a member and Chairman of the Board ofDirectors and the Chairman of the Executive Committee of theBoard of Directors.
Jennifer L. Grant 44 Vice President and Chief Human Resources Officer (became VicePresident and Chief Human Resources Officer in 2013). Prior tojoining Air Products, was Vice President of Human Resources forPfizer Inc. Specialty Products and Oncology Divisions from 2009-2013.
Corning F. Painter 54 Executive Vice President Industrial Gases (became Executive VicePresident Industrial Gases in 2015; Senior Vice President andGeneral Manager –Merchant Gases in 2014; Senior VicePresident – Supply Chain in 2012; Senior Vice President –Corporate Strategy and Technology in 2011; and Vice Presidentand General Manager, Global Electronics in 2007).
9
ITEM 1A. RISK FACTORS
In conjunction with evaluating an investment in the Company and the forward-looking information contained in thisAnnual Report on Form 10-K or presented elsewhere by management from time to time, you should carefully readthe following risk factors. Any of the following risks could have a material adverse effect on our business,operating results, financial condition, and the actual outcome of matters as to which forward-looking statementsare made and could adversely affect the value of an investment in our common stock as well. While we believewe have identified and discussed below the key risk factors affecting our business, there may be additional risksand uncertainties that adversely affect our business, performance, or financial condition in the future that are notpresently known, are not currently believed to be significant, or are not identified below because they are commonto all businesses.
Overall Economic and Supply/Demand Conditions, Customer Vitality—A weakening economy or product
supply versus demand imbalance in markets in which the Company does business may decrease the
demand for its goods and services and adversely impact its revenues, operating results, and cash flows.
Cyclical downturns in the industries served by our customers or adverse economic events or conditions
affecting specific customers can in turn have an adverse effect on our business.
Demand for the Company’s products and services depends in part on the general economic conditions affectingthe countries and markets in which the Company does business. In the past few years, uncertain economicconditions in certain geographies and changing supply and demand balances in markets served by the Companyhave impacted and may in the future impact demand for the Company’s products and services, in turn negativelyimpacting the Company’s revenues and earnings. Unfavorable conditions can depress sales in a given market orto a particular customer, affect our margins, constrain our operating flexibility, impact utilization of the Company’smanufacturing capacity, or result in charges which are unusual or nonrecurring. Excess capacity in theCompany’s or its competitors’ manufacturing facilities could decrease the Company’s ability to maintain pricingand generate profits.
Our operating results in one or more segments may also be affected by uncertain or deteriorating economicconditions particularly germane to that segment or to particular customer markets within that segment. A declinein the industries served by our customers or adverse events or circumstances affecting individual customers canimpair the ability of such customers to satisfy their obligations to the Company, resulting in uncollectedreceivables, unanticipated contract terminations, project delays, or inability to recover plant investmentsnegatively impacting our financial results.
Weak overall demand or specific customer conditions may also cause elimination of product lines, customershutdowns or default, or other inabilities to profitably operate facilities and may force sale or abandonment offacilities and equipment or projects not to reach on-stream. These or other events associated with weak economicconditions or specific end market, product, or customer events may require the Company to record an impairmenton tangible assets, such as facilities and equipment, or intangible assets, such as intellectual property or goodwill,which would have a negative impact on its financial results.
Operational, Economic, Political, and Legal Risks of International Operations—The Company’s foreign
operations can be adversely impacted by operational, economic, political and legal risks that could
impact our profitability. Developing market operations present special risks.
The Company has extensive international operations. In addition, the Company is actively investing significantcapital and other resources in emerging markets, including joint ventures and other alliances. The Company’soperations in certain foreign jurisdictions may be subject to project delays due to unanticipated governmentactions, inadequate investment in infrastructure, undeveloped property rights and legal systems, or politicalinstability. Some of the Company’s contractual relationships within these jurisdictions are subject to cancellationwithout full compensation for loss. Economic and political conditions within foreign jurisdictions, nationalizationand expropriation risk, social unrest, strained relations between countries, or imposition of international sanctionscan cause fluctuations in demand, price volatility, supply disruptions, or loss of property. The occurrence of any ofthese risks could have a material adverse impact on the Company’s financial condition, results of operation, andcash flows.
Our developing market operations may be subject to greater risks than those faced by our operations in matureeconomies, including geopolitical, legal, economic, and talent risks. Our success will depend, in part, on our ability
10
to manage the risks inherent in operating in a developing market, including unfamiliar regulatory environments,relationships with local partners, language and cultural differences, and tailoring products for acceptance by localmarkets.
Further, our operations outside the United States require us to comply with a number of United States andinternational regulations, including anti-corruption laws such as the United States Foreign Corrupt Practices Act,the United Kingdom Bribery Act, and the China Anti-Unfair Competition Law, as well as U.S. and internationaleconomic sanctions. We have policies and procedures to foster compliance with these laws, including complianceand training programs for our employees and established due diligence procedures with regard to third parties;however, these cannot eliminate the risk that violations could be committed by our employees, agents or jointventure partners. Violations of such laws and regulations could result in disruptive investigations of the Company,significant fines and sanctions which could adversely affect our consolidated results of operations.
Currency Fluctuations—Changes in foreign currencies may adversely affect the Company’s financial
results.
The majority of the Company’s revenue is generated from sales outside the United States, exposing it tofluctuations in foreign currency exchange rates. Our Industrial Gases business is primarily exposed totranslational currency risk as the results of its foreign operations are translated into U.S. dollars at currentexchange rates throughout the fiscal period. Our Performance Materials business is also significantly exposed totransactional currency impacts as many of its products are manufactured in one country and sold in another.
The Company uses certain financial instruments to mitigate some of these effects. The Company’s policy is tominimize cash flow volatility from changes in currency exchange rates. The Company chooses not to hedge thetranslation of its foreign subsidiaries’ earnings into dollars. Accordingly, reported sales, net earnings, cash flows,and fair values have been and in the future will be affected by changes in foreign exchange rates. For a moredetailed discussion of currency exposure, see Item 7A, below.
Raw Material and Energy Cost and Availability—Interruption in ordinary sources of supply or an inability
to recover increases in energy and raw material costs from customers could result in lost sales or
reduced profitability.
Hydrocarbons, including natural gas, are the primary feedstock for the production of hydrogen, carbon monoxide,and syngas. Energy, including electricity, natural gas, and diesel fuel for delivery trucks, is the largest costcomponent of the Company’s business. Because the Company’s industrial gas facilities use substantial amountsof electricity, energy price fluctuations could materially impact the Company’s revenues and earnings. A disruptionin the supply of energy, components, or raw materials, whether due to market conditions, legislative or regulatoryactions, natural events, or other disruption, could prevent the Company from meeting its contractualcommitments, harming its business and financial results.
The Company’s supply of crude helium for purification and resale is largely dependent upon natural gasproduction by crude helium suppliers. Lower natural gas production (which may result from natural gas pricing orsupplier operating issues) or interruptions in sales from other crude helium suppliers, can reduce the Company’ssupplies of crude helium available for processing and resale to its customers.
The Company typically contracts to pass through cost increases in energy and raw materials to its customers, butcost variability can still have a negative impact on its results. The Company may not be able to raise prices asquickly as costs rise, or competitive pressures may prevent full recovery. Increases in energy or raw materialcosts that cannot be passed on to customers for competitive or other reasons would negatively impact theCompany’s revenues and earnings. Even where costs are passed through, price increases can cause lower salesvolume.
Regulatory Compliance—The Company is subject to extensive government regulation in jurisdictions
around the globe in which it does business. Changes in regulations addressing, among other things,
environmental compliance, import/export restrictions, anti-bribery and corruption, and taxes, can
negatively impact the Company’s financial condition, results of operation, and cash flows.
The Company is subject to government regulation in the United States and foreign jurisdictions in which itconducts its business. The application of laws and regulations to the Company’s business is sometimes unclear.
11

Compliance with laws and regulations may involve significant costs or require changes in business practice thatcould result in reduced profitability. Determination of noncompliance can result in penalties or sanctions that couldalso impact financial results. Compliance with changes in laws or regulations can require additional capitalexpenditures or increase operating costs. Export controls or other regulatory restrictions could prevent theCompany from shipping its products to and from some markets or increase the cost of doing so. Exportrestrictions continue to attract external focus by multiple customs and export enforcement authorities. Changes intax laws and regulations and international tax treaties could affect the financial results of the Company’sbusinesses. Increasingly aggressive enforcement of anti-bribery and anti-corruption requirements, including theU.S. Foreign Corrupt Practices Act, the United Kingdom Bribery Act and the China Anti-Unfair Competition Law,could subject the Company to criminal or civil sanctions if a violation occurs.
Environmental Compliance—Costs and expenses resulting from compliance with environmental
regulations may negatively impact the Company’s operations and financial results.
The Company is subject to extensive federal, state, local, and foreign environmental and safety laws andregulations concerning, among other things, emissions in the air; discharges to land and water; and thegeneration, handling, treatment, and disposal of hazardous waste and other materials. The Company takes itsenvironmental responsibilities very seriously, but there is a risk of environmental impact inherent in ourmanufacturing operations and transportation of chemicals. Future developments and more stringentenvironmental regulations may require the Company to make additional unforeseen environmental expenditures.In addition, laws and regulations may require significant expenditures for environmental protection equipment,compliance, and remediation. These additional costs may adversely affect financial results. For a more detaileddescription of these matters, see “Narrative Description of the Company’s Business Generally—EnvironmentalControls,” above.
We may not be able to successfully control or reduce costs to improve productivity and streamline
operations. Reorganization and cost reduction efforts can disrupt operations.
Achieving our financial goals including continued profitability and margin growth depends significantly on ourefforts to control or reduce our operating costs, including our ability to eliminate stranded costs related to ourdivested businesses. Because many of our costs are affected by factors outside or substantially outside ourcontrol, we generally must seek to control or reduce costs through operating efficiency and repositioning actions.If we are not able to identify and execute efforts designed to control or reduce costs and increase operatingefficiency, our ability to attain our goals could be adversely impacted.
Ongoing restructuring and cost reduction actions may reduce our available talent and other resources, impact ourability to attract and retain key employees, slow improvements in our products and services, and adversely affectour ability to respond to customers. Failure to achieve targeted improvements may diminish the operational andfinancial benefits we realize from such actions. These circumstances could adversely impact our business andfinancial statements.
Interest Rate Increases—The Company’s earnings, cash flows, and financial position can be impacted by
interest rate increases and access to credit.
At 30 September 2016, the Company had total consolidated debt of $6,225.2 million (including Versum debt of$997.2 million), of which $1,307.1 million (including Versum debt of $5.8 million) will mature in the next twelvemonths. The Company expects to continue to incur indebtedness to fund new projects and replace maturing debt.Although the Company actively manages its interest rate risk through the use of derivatives and diversified debtobligations, not all borrowings at variable rates are hedged, and new debt will be priced at market rates. If interestrates increase, the Company’s interest expense could increase significantly, affecting earnings and reducing cashflow available for working capital, capital expenditures, acquisitions, and other purposes. In addition, changes byany rating agency to the Company’s outlook or credit ratings could increase the Company’s cost of borrowing andweaken our ability to access capital and credit markets on terms commercially acceptable to us. For a moredetailed discussion of interest rate risk, see Item 7A, below.
We may be unable to successfully execute or effectively integrate acquisitions, and divestitures may not
occur as planned.
We regularly review our portfolio of businesses and pursue growth through acquisitions and seek to divest non-core businesses. We may not be able to complete transactions on favorable terms, on a timely basis or at all. In
12

addition, our results of operations and cash flows may be adversely impacted by the failure of acquiredbusinesses to meet expected returns, the failure to integrate acquired businesses, the inability to dispose of non-core assets and businesses on satisfactory terms and conditions, and the discovery of unanticipated liabilities orother problems in acquired businesses for which we lack contractual protections or insurance. With respect todivested businesses, our results may be impacted by claims by purchasers to whom we have providedcontractual indemnification.
Catastrophic Events—Catastrophic events could disrupt the Company’s operations or the operations of
its suppliers or customers, having a negative impact on the Company’s business, financial results, and
cash flows.
The Company’s operations could be impacted by catastrophic events outside the Company’s control, includingsevere weather conditions such as hurricanes, floods, earthquakes, storms, epidemics, or acts of war andterrorism. Any such event could cause a serious business disruption that could affect the Company’s ability toproduce and distribute its products and possibly expose it to third-party liability claims. Additionally, such eventscould impact the Company’s suppliers or customers, in which event energy and raw materials may be unavailableto the Company, or its customers may be unable to purchase or accept the Company’s products and services.Any such occurrence could have a negative impact on the Company’s operations and financial results.
Operational Risks—Operational and execution risks may adversely affect the Company’s operations or
financial results.
The Company’s operation of its facilities, pipelines, and delivery systems inherently entails hazards that requirecontinuous oversight and control, such as pipeline leaks and ruptures, fire, explosions, toxic releases, mechanicalfailures, or vehicle accidents. If operational risks materialize, they could result in loss of life, damage to theenvironment, or loss of production, all of which could negatively impact the Company’s ongoing operations,reputation, financial results, and cash flows. In addition, the Company’s operating results are dependent on thecontinued operation of its production facilities and its ability to meet customer requirements, which depends, inpart, on the Company’s ability to properly maintain and replace aging assets. Operating results are alsodependent on the Company’s ability to complete new construction projects on time, on budget, and in accordancewith performance requirements, which depends, in part, on the availability of adequate sources of labor in thegeographies where the Company intends to build new plants. Failure to do so may expose the Company to lossof revenue, potential litigation, and loss of business reputation.
Information Security—The security of the Company’s Information Technology systems could be
compromised, which could adversely affect its ability to operate.
We depend on information technology to enable us to operate efficiently and interface with customers as well asto maintain financial accuracy and efficiency. Our information technology capabilities are delivered through acombination of internal and external services and services providers. If we do not allocate and effectively managethe resources necessary to build and sustain the proper technology infrastructure, we could be subject totransaction errors, processing inefficiencies, the loss of customers, business disruptions, or the loss of or damageto our confidential business information or multiple site impact through a security breach. As with all largesystems, our information systems could be penetrated by outside parties intent on extracting information,corrupting information, disrupting business processes, or causing harm to persons or property. The Company’ssystems have in the past been and likely will in the future be subject to sophisticated cyber security threats. Todate, the Company is not aware of any significant impact on its operations or financial results from such attempts;however, unauthorized access could disrupt our business operations, result in the loss of assets, and have amaterial adverse effect on our business, financial condition, or results of operations.
The Company’s business involves the use, storage, and transmission of information about its employees,vendors, and customers. The protection of such information, as well as the Company’s information, is critical tothe Company. The regulatory environment surrounding information security and privacy is increasinglydemanding, with the frequent imposition of new and constantly changing requirements. The Company hasestablished policies and procedures to help protect the security and privacy of this information. The Companyalso, from time to time, exports sensitive customer data and technical information to recipients outside the UnitedStates. Breaches of our security measures or the accidental loss, inadvertent disclosure, or unapproveddissemination of proprietary information or sensitive or confidential data about us or our customers, including thepotential loss or disclosure of such information or data as a result of fraud, trickery, or other forms of deception,
13

could expose us, our customers, or the individuals affected to a risk of loss or misuse of this information, result inlitigation and potential liability for us, damage our reputation, or otherwise harm our business.
Litigation and Regulatory Proceedings—The Company’s financial results may be affected by various legal
and regulatory proceedings, including those involving antitrust, tax, environmental, or other matters.
The Company is subject to litigation and regulatory investigations and proceedings in the normal course ofbusiness and could become subject to additional claims in the future, some of which could be material. While theCompany seeks to limit its liability in its commercial contractual arrangements, there are no guarantees that eachcontract will contain suitable limitations of liability or that limitations of liability will be enforceable at law. Also, theoutcome of existing legal proceedings may differ from the Company’s expectations because the outcomes oflitigation, including regulatory matters, are often difficult to predict reliably. Various factors or developments canlead the Company to change current estimates of liabilities and related insurance receivables, where applicable,or make such estimates for matters previously not susceptible to reasonable estimates, such as a significantjudicial ruling or judgment, a significant settlement, significant regulatory developments, or changes in applicablelaw. A future adverse ruling, settlement, or unfavorable development could result in charges that could have amaterial adverse effect on the Company’s financial condition, results of operations, and cash flows in anyparticular period.
Greenhouse Gases—Legislative and regulatory responses to global climate change create financial risk.
Some of the Company’s operations are within jurisdictions that have or are developing regulatory regimesgoverning emissions of greenhouse gases (GHG). These include existing coverage under the European UnionEmission Trading Scheme, California’s cap and trade scheme, Alberta’s Emission Reduction Program, China’sEmission Trading Scheme pilots, South Korea’s Emission Trading Scheme, and mandatory reporting andanticipated constraints on GHG emissions under an Ontario cap and trade scheme, nation-wide expansion of theChina Emission Trading Scheme, and federal emission performance standards in Canada. In addition, the U.S.Environmental Protection Agency (EPA) requires mandatory reporting of GHG emissions and is regulating GHGemissions for new construction and major modifications to existing facilities. Moreover, some jurisdictions havevarious mechanisms to target the power sector (e.g. U.S. EPA Clean Power Plan) to achieve emission reductions.These reductions often result in higher power costs.
Increased public concern may result in more international, U.S. federal, and/or regional requirements to reduce ormitigate the effects of GHG. Although uncertain, these developments could increase the Company’s costs relatedto consumption of electric power, hydrogen production, and fluorinated gases production. The Company believesit will be able to mitigate some of the increased costs through its contractual terms, but the lack of definitivelegislation or regulatory requirements prevents an accurate estimate of the long-term impact on the Company.Any legislation that limits or taxes GHG emissions could impact the Company’s growth, increase its operatingcosts, or reduce demand for certain of its products.
The results of the United Kingdom’s (“UK”) European Union (“EU”) membership referendum could
adversely affect customer demand, our relationships with customers and suppliers and our business and
financial statements.
The results of the UK’s EU membership referendum, advising for the exit of the UK from the EU, has caused andmay continue to cause significant volatility in global stock markets, currency exchange rate fluctuations and globaleconomic uncertainty, which could adversely affect customer demand, our relationships with customers andsuppliers and our business and financial statements.
Competition—Inability to compete effectively in a segment could adversely impact sales and financial
performance.
The Company faces strong competition from several large global competitors and many smaller regional ones inmany of its business segments. Introduction by competitors of new technologies, competing products, oradditional capacity could weaken demand for or impact pricing of the Company’s products, negatively impactingfinancial results. In addition, competitors’ pricing policies could affect the Company’s profitability or its marketshare.
14

We could incur significant liability if the distribution of Versum common stock to our stockholders is
determined to be a taxable transaction.
We have received an opinion from outside tax counsel to the effect that the spin-off of Versum qualifies as atransaction that is described in Sections 355(a) and 368(a)(1)(D) of the Internal Revenue Code. The opinion relieson certain facts, assumptions, representations and undertakings from Versum and us regarding the past andfuture conduct of the companies’ respective businesses and other matters. If any of these facts, assumptions,representations or undertakings are incorrect or not satisfied, our shareholders and we may not be able to rely onthe opinion of tax counsel and could be subject to significant tax liabilities. Notwithstanding the opinion of taxcounsel we have received, the IRS could determine on audit that the spin-off is taxable if it determines that any ofthese facts, assumptions, representations or undertakings are not correct or have been violated or if it disagreeswith the conclusions in the opinion. If the spin-off is determined to be taxable for U.S. federal income taxpurposes, our shareholders that are subject to U.S. federal income tax and we could incur significant U.S. federalincome tax liabilities.
ITEM 1B. UNRESOLVED STAFF COMMENTS
We have not received any written comments from the Commission staff that remain unresolved.
ITEM 2. PROPERTIES
Air Products and Chemicals, Inc. owns its principal administrative offices, which are the Company’s headquarterslocated in Trexlertown, Pennsylvania, as well as Hersham, England and Santiago, Chile. The Company leasesadministrative offices in Spain, Malaysia, and China for its Global Business Support organization.
The following is a description of the properties used by our six business segments and the Energy-from-Wastebusiness discontinued operation. We believe that our facilities are suitable and adequate for our current andanticipated future levels of operation.
Industrial Gases – Global
Management, sales, and engineering support for this business segment is based in our principal administrativeoffices noted above, and an office in India.
Air separation equipment is manufactured in Missouri, Pennsylvania, and China.
Research and development (R&D) activities for this business segment are conducted at owned locations in theU.S. and the United Kingdom, and 4 leased locations in Canada, Europe, and Asia.
Helium is processed at multiple sites in the U.S. and then distributed to/from transfill sites globally.
Industrial Gases – Americas
This business segment currently operates from over 295 production and distribution facilities in North and SouthAmerica (approximately 1/4th of which are located on owned property), and 10% of which are integrated sites thatserve dedicated customers as well as merchant customers. The Company has sufficient property rights andpermits for the ongoing operation of our pipeline systems in the Gulf Coast, California, and Arizona in the UnitedStates and Alberta and Ontario, Canada. Management and sales support is based in our Trexlertown andSantiago offices referred to above, and at 10 leased properties located throughout North and South America.
Hydrogen fueling stations built by the Company support commercial markets in California and Japan as well asdemonstration projects in Europe and other parts of Asia.
Industrial Gases – EMEA
This business segment currently operates from over 150 production and distribution facilities in Europe, theMiddle East, and Africa (approximately 1/3rd of which are on owned property). The Company has sufficientproperty rights and permits for the ongoing operation of our pipeline systems in the Netherlands, the UnitedKingdom, Belgium, France, and Germany. Management and sales support for this business segment is based inHersham, England referred to above, Barcelona, Spain and at 12 leased office sites located throughout theregion.
15

Industrial Gases – Asia
Industrial Gases – Asia currently operates from over 150 production and distribution facilities within Asia(approximately 1/4th of which are on owned property or long duration term grants). The Company has sufficientproperty rights and permits for the ongoing operation of our pipeline systems in China, Korea, Taiwan, Malaysia,Singapore, and Indonesia. Management and sales support for this business segment is based in Shanghai, Chinaand Kuala Lumpur, Malaysia, and in 7 leased office locations throughout the region.
Materials Technologies
This business segment was comprised of two divisions, Electronic Materials and Performance Materials, prior tothe 1 October 2016 spin-off of Electronic Materials.
The Electronic Materials portion of this segment was spun off into the separate legal entity, Versum Materials,Inc., along with its production, equipment manufacturing, and distribution operations at 24 sites in the UnitedStates, Europe, and Asia (1/3rd of which are owned sites, and the remainder of which are on leased sites or onsites where long duration term grants have been obtained).
The headquarters for this new entity will be based in Tempe, Arizona with supporting administration and researchand development activities at 4 locations in Taiwan, 2 locations in South Korea, Singapore, China, theNetherlands, and Pennsylvania in the United States.
The Performance Materials portion of this segment is under an announced Purchase Agreement for the sale ofthis division, including its operations at 12 production sites globally, 50% of which are owned.
This segment conducts R&D related activities at 8 locations worldwide, including: Pennsylvania, California, andWisconsin in the United States, the Netherlands, China, Japan, and multiple sites in Germany.
The management and sales support for Performance Materials is currently based in our Trexlertown officesreferred to above, and at offices located in Utrecht, the Netherlands, Shanghai, China, Kawasaki, Japan, andSingapore.
Corporate and other
Corporate administrative functions are based in the Company’s administrative offices referred to above.
The Gardner Cryogenic business operates at facilities in Pennsylvania and Kansas in the United States and inFrance.
The LNG business has owned manufacturing facilities in Pennsylvania and Florida in the United States withmanagement, engineering, and sales support based in the Trexlertown offices referred to above and a nearbyleased office.
Energy-from-Waste
On 29 March 2016, the Board of Directors approved the Company’s exit of its Energy-from-Waste business. As aresult, the Energy-from-Waste segment is presented as a discontinued operation. The real estate interests for thisbusiness, which are comprised of a leased office, two leased production sites, and rights for utility infrastructure,will be exited with the assets of this business.
ITEM 3. LEGAL PROCEEDINGS
In the normal course of business, the Company and its subsidiaries are involved in various legal proceedings,including contract, product liability, intellectual property, insurance, and regulatory matters. Although litigation withrespect to these matters is routine and incidental to the conduct of our business, such litigation could result inlarge monetary awards, especially if a civil jury is allowed to determine compensatory and/or punitive damages.However, we believe that litigation currently pending to which we are a party will be resolved without any materialadverse effect on our financial position, earnings, or cash flows.
From time to time, we are also involved in proceedings, investigations, and audits involving governmentalauthorities in connection with environmental, health, safety, competition, and tax matters.
The Company is a party to proceedings under the Comprehensive Environmental Response, Compensation, andLiability Act (CERCLA: the federal Superfund law); Resource Conservation and Recovery Act (RCRA); and similar
16

state and foreign environmental laws relating to the designation of certain sites for investigation or remediation.Presently there are approximately 33 sites on which a final settlement has not been reached where the Company,along with others, has been designated a potentially responsible party by the Environmental Protection Agency oris otherwise engaged in investigation or remediation, including cleanup activity at certain of its current and formermanufacturing sites. We do not expect that any sums we may have to pay in connection with these environmentalmatters would have a material adverse impact on our consolidated financial position. Additional information on theCompany’s environmental exposure is included under “Narrative Description of the Company’s BusinessGenerally—Environmental Controls.”
In September 2010, the Brazilian Administrative Council for Economic Defense (CADE) issued a decision againstour Brazilian subsidiary, Air Products Brasil Ltda., and several other Brazilian industrial gas companies for allegedanticompetitive activities. CADE imposed a civil fine of R$179.2 million (approximately $55 million at30 September 2016) on Air Products Brasil Ltda. This fine was based on a recommendation by a unit of theBrazilian Ministry of Justice, whose investigation began in 2003, alleging violation of competition laws with respectto the sale of industrial and medical gases. The fines are based on a percentage of the Company’s total revenuein Brazil in 2003.
We have denied the allegations made by the authorities and filed an appeal in October 2010 to the Braziliancourts. On 6 May 2014, our appeal was granted and the fine against Air Products Brasil Ltda. was dismissed.CADE has appealed that ruling and the matter remains pending. The Company, with advice of its outside legalcounsel, has assessed the status of this matter and has concluded that, although an adverse final judgment afterexhausting all appeals is possible, such a judgment is not probable. As a result, no provision has been made inthe consolidated financial statements.
Other than this matter, we do not currently believe there are any legal proceedings, individually or in theaggregate, that are reasonably possible to have a material impact on our financial condition, results of operations,or cash flows. A future charge for regulatory fines or damage awards could have a significant impact on our netincome in the period in which it is recorded.
17

ITEM 4. SUBMISSION OF MATTERS TO A VOTE OF SECURITY HOLDERS
Not applicable
PART II
ITEM 5. MARKET FOR REGISTRANT’S COMMON EQUITY, RELATED STOCKHOLDER MATTERS, AND
ISSUER PURCHASES OF EQUITY SECURITIES
Our common stock (ticker symbol APD) is listed on the New York Stock Exchange. Our transfer agent andregistrar is Broadridge Corporate Issuer Solutions, Inc., P.O. Box 1342, Brentwood, New York 11717, telephone(844) 318-0129 (U.S.) or (720) 358-3595 (all other locations); Internet website, http://shareholder.broadridge.com/airproducts; and e-mail address, [email protected]. As of 31 October 2016, there were 5,974 recordholders of our common stock. Quarterly stock prices, as reported on the New York Stock Exchange compositetape of transactions, and dividend information for the last two fiscal years appear below. Cash dividends on theCompany’s common stock are paid quarterly. It is our expectation that we will continue to pay cash dividends inthe future at comparable or increased levels. The Board of Directors determines whether to declare dividends andthe timing and amount based on financial condition and other factors it deems relevant.
Quarterly Stock Information
2016 High Low Close Dividend
First $143.83 $126.65 $130.11 $0.81
Second 147.16 114.64 144.05 0.86
Third 152.16 134.15 142.04 0.86
Fourth 157.84 137.31 150.34 0.86
$3.39
2015 High Low Close Dividend
First $149.61 $118.20 $144.23 $0.77
Second 158.20 137.07 151.28 0.81
Third 153.93 136.69 136.83 0.81
Fourth 148.56 123.66 127.58 0.81
$3.20
Purchases of Equity Securities by the Issuer
On 15 September 2011, the Board of Directors authorized the repurchase of up to $1.0 billion of our outstandingcommon stock. This program does not have a stated expiration date. We repurchase shares pursuant toRules 10b5-1 and 10b-18 under the Securities Exchange Act of 1934, as amended, through repurchaseagreements established with several brokers. There were no purchases of stock during fiscal year 2016. At30 September 2016, $485.3 million in share repurchase authorization remained. Additional purchases will becompleted at the Company’s discretion while maintaining sufficient funds for investing in its businesses andgrowth opportunities.
18

Performance Graph
The performance graph below compares the five-year cumulative returns of the Company’s common stock withthose of the Standard & Poor’s 500 Index (S&P 500 Index) and the Standard & Poor’s 500 Materials Index (S&P500 Materials Index). The figures assume an initial investment of $100 and the reinvestment of all dividends.
COMPARISON OF FIVE YEAR CUMULATIVE SHAREHOLDER RETURNAir Products, S&P 500 Index, and S&P 500 Materials Index
Comparative Growth of a $100 Investment(Assumes Reinvestment of All Dividends)
Air Products S&P 500 Index S&P 500 Materials Index
Sept 201150
75
100
125
150
175
200
225
Sept 2012 Sept 2013 Sept 2014 Sept 2015 Sept 2016
Air Products
S&P 500 Index
S&P 500 Materials Index
100
100
100
112
130
129
148
155
151
185
186
181
186
185
149
223
213
182
19

ITEM 6. SELECTED FINANCIAL DATA
(Millions of dollars, except per share) 2016(A) 2015(A) 2014(A) 2013(A) 2012(A)
Operating Results
Sales $9,524 $9,895 $10,439 $10,180 $9,612Cost of sales 6,403 6,939 7,630 7,470 7,052Selling and administrative 849 939 1,055 1,063 947Research and development 132 137 140 132 126Business restructuring and cost reduction actions 34 208 13 232 327Operating income 2,106 1,708 1,339 1,332 1,282Equity affiliates’ income 149 155 151 168 154Income from continuing operations attributable to Air Products 1,515 1,285 995 1,009 999Net income attributable to Air Products 631 1,278 992 994 1,167Basic earnings per common share attributable to Air Products:
Income from continuing operations 7.00 5.98 4.68 4.81 4.73Net income 2.92 5.95 4.66 4.74 5.53
Diluted earnings per common share attributable to Air Products:Income from continuing operations 6.94 5.91 4.62 4.75 4.66Net income 2.89 5.88 4.61 4.68 5.44
Year-End Financial Position
Plant and equipment, at cost $20,190 $19,463 $19,633 $19,234 $17,965Total assets(H) 18,055 17,335 17,668 17,761 16,831Working capital 1,034 (851) 199 100 605Total debt(B) 6,225 5,879 6,119 6,274 5,292Redeemable noncontrolling interest — — 287 376 393Air Products shareholders’ equity 7,080 7,249 7,366 7,042 6,477Total equity 7,213 7,381 7,521 7,199 6,623
Financial Ratios
Return on average Air Products shareholders’ equity(C) 21.2 % 17.4 % 13.5 % 15.4 % 16.1 %Operating margin 22.1 % 17.3 % 12.8 % 13.1 % 13.3 %Selling and administrative as a percentage of sales 8.9 % 9.5 % 10.1 % 10.4 % 9.9 %Total debt to total capitalization(B)(D) 46.3 % 44.3 % 43.9 % 45.3 % 43.0 %
Other Data
Income from continuing operations including noncontrolling interests $1,546 $1,324 $996 $1,048 $1,025Adjusted EBITDA(E) 3,273 2,984 2,776 2,648 2,528Depreciation and amortization 926 936 957 907 841Capital expenditures on a GAAP basis(F) 1,056 1,304 1,361 1,459 2,480Capital expenditures on a non-GAAP basis(F) 1,083 1,678 1,564 1,708 2,698Cash provided by operating activities 2,707 2,446 2,190 1,548 1,760Cash used for investing activities 972 1,251 1,317 1,407 2,356Cash (used for) provided by financing activities (271) (945) (504) 115 (78)Dividends declared per common share 3.39 3.20 3.02 2.77 2.50
Weighted Average Common Shares – Basic (in millions) 216 215 213 210 211Weighted Average Common Shares – Diluted (in millions) 218 217 215 212 215
Book value per common share at year-end $32.57 $33.66 $34.49 $33.35 $30.48Shareholders at year-end 6,000 6,400 6,600 7,000 7,500Employees at year-end(G) 18,600 19,700 21,200 21,600 21,300
20

(A) Unless otherwise stated, selected financial data is presented on a GAAP basis. Our operating results were impacted by certain items whichmanagement does not believe to be indicative of ongoing business trends and are excluded from the non-GAAP measure. Refer to pages35-40 for a reconciliation of the GAAP to non-GAAP measures for 2016, 2015, and 2014. Descriptions of the excluded items appear onpages 27-29. For 2013, these items include: (i) a charge to operating income of $232 ($158 after-tax, or $.74 per share) related to businessrestructuring and cost reduction actions, and (ii) expenses of $10 ($6 after-tax, or $.03 per share) related to advisory costs. For 2012, theseitems include: (i) a charge to operating income of $327 ($222 after-tax, or $1.03 per share) related to business restructuring and costreduction actions, (ii) a gain of $86 ($55 after-tax, or $.25 per share) related to the gain on our previously held equity interest in DANanoMaterials, (iii) a charge of $10 ($6 after-tax, or $.03 per share) related to a customer bankruptcy, (iv) a tax expense of $44 ($.20 pershare) for a Spanish tax settlement, and (v) a tax benefit of $58 ($.27 per share) for a favorable Spanish tax ruling.
(B) Total debt includes long-term debt, current portion of long-term debt, and short-term borrowings as of the end of the year.(C) Calculated using income from continuing operations attributable to Air Products and five-quarter average Air Products shareholders’ equity.(D) Total capitalization includes total debt plus total equity plus redeemable noncontrolling interest as of the end of the year.(E) A reconciliation of reported GAAP results to Adjusted EBITDA is presented on pages 37-39.(F) Capital expenditures on a GAAP basis include additions to plant and equipment, investment in and advances to unconsolidated affiliates,
and acquisitions. The Company utilizes a non-GAAP measure in the computation of capital expenditures and includes spending associatedwith facilities accounted for as capital leases and purchases of noncontrolling interests. Refer to page 42 for a reconciliation of the GAAP tonon-GAAP measures for 2016, 2015, and 2014. For 2013, the GAAP measure was adjusted by $235 and $14 for spending associated withfacilities accounted for as capital leases and purchases of noncontrolling interests, respectively. For 2012, the GAAP measure wasadjusted by $212 and $6 for spending associated with facilities accounted for as capital leases and purchases noncontrolling interests,respectively.
(G) Includes full- and part-time employees from continuing and discontinued operations.(H) Reflects adoption of guidance on the presentation of deferred income taxes on a retrospective basis. Refer to Note 2, New Accounting
Guidance, for additional Information.
21
ITEM 7. MANAGEMENT’S DISCUSSION AND ANALYSIS OF FINANCIAL CONDITION AND RESULTS OF
OPERATIONS
Business Overview . . . . . . . . . . . . . . . . . . . . . . . . . . . . . . . . . . . . . . . . . . . . . . . . . . . . . . . . . . . . . . . . . . . . . . . . . 222016 in Summary . . . . . . . . . . . . . . . . . . . . . . . . . . . . . . . . . . . . . . . . . . . . . . . . . . . . . . . . . . . . . . . . . . . . . . . . . . 232017 Outlook . . . . . . . . . . . . . . . . . . . . . . . . . . . . . . . . . . . . . . . . . . . . . . . . . . . . . . . . . . . . . . . . . . . . . . . . . . . . . . 24Results of Operations . . . . . . . . . . . . . . . . . . . . . . . . . . . . . . . . . . . . . . . . . . . . . . . . . . . . . . . . . . . . . . . . . . . . . . . 25Reconciliation of Non-GAAP Financial Measures . . . . . . . . . . . . . . . . . . . . . . . . . . . . . . . . . . . . . . . . . . . . . . . . 35Liquidity and Capital Resources . . . . . . . . . . . . . . . . . . . . . . . . . . . . . . . . . . . . . . . . . . . . . . . . . . . . . . . . . . . . . . 41Contractual Obligations . . . . . . . . . . . . . . . . . . . . . . . . . . . . . . . . . . . . . . . . . . . . . . . . . . . . . . . . . . . . . . . . . . . . . 45Pension Benefits . . . . . . . . . . . . . . . . . . . . . . . . . . . . . . . . . . . . . . . . . . . . . . . . . . . . . . . . . . . . . . . . . . . . . . . . . . . 46Environmental Matters . . . . . . . . . . . . . . . . . . . . . . . . . . . . . . . . . . . . . . . . . . . . . . . . . . . . . . . . . . . . . . . . . . . . . . 48Off-Balance Sheet Arrangements . . . . . . . . . . . . . . . . . . . . . . . . . . . . . . . . . . . . . . . . . . . . . . . . . . . . . . . . . . . . . 49Related Party Transactions . . . . . . . . . . . . . . . . . . . . . . . . . . . . . . . . . . . . . . . . . . . . . . . . . . . . . . . . . . . . . . . . . . 49Inflation . . . . . . . . . . . . . . . . . . . . . . . . . . . . . . . . . . . . . . . . . . . . . . . . . . . . . . . . . . . . . . . . . . . . . . . . . . . . . . . . . . 49Critical Accounting Policies and Estimates . . . . . . . . . . . . . . . . . . . . . . . . . . . . . . . . . . . . . . . . . . . . . . . . . . . . . . 49New Accounting Guidance . . . . . . . . . . . . . . . . . . . . . . . . . . . . . . . . . . . . . . . . . . . . . . . . . . . . . . . . . . . . . . . . . . . 55Forward-Looking Statements . . . . . . . . . . . . . . . . . . . . . . . . . . . . . . . . . . . . . . . . . . . . . . . . . . . . . . . . . . . . . . . . . 55
The following discussion should be read in conjunction with the consolidated financial statements and theaccompanying notes contained in this report. All comparisons in the discussion are to the corresponding prioryear unless otherwise stated. All amounts presented are in accordance with U.S. generally accepted accountingprinciples (GAAP), except as noted. All amounts are presented in millions of dollars, except for share data, unlessotherwise indicated.
Items such as income from continuing operations attributable to Air Products, net income attributable toAir Products, and diluted earnings per share attributable to Air Products (EPS) are simply referred to as “incomefrom continuing operations,” “net income,” and “diluted earnings per share” throughout this Management’sDiscussion and Analysis, unless otherwise stated.
The discussion of results that follows includes comparisons to non-GAAP financial measures. The presentation ofnon-GAAP measures is intended to enhance the usefulness of financial information by providing measures which,when viewed together with our financial results reported in accordance with GAAP, provide a more completeunderstanding of the factors and trends affecting our historical financial performance and projected future results.The reconciliation of reported GAAP results to non-GAAP measures is presented on pages 35-40. Descriptions ofthe excluded items appear on pages 27-29.
BUSINESS OVERVIEW
Air Products and Chemicals, Inc. is a world-leading Industrial Gases company in operation for over 75 years. TheCompany’s core Industrial Gases business provides atmospheric and process gases and related equipment tomanufacturing markets, including refining and petrochemical, metals, electronics, and food and beverage. AirProducts is also the world’s leading supplier of liquefied natural gas process technology and equipment. TheCompany’s Materials Technologies business serves the semiconductor, polyurethanes, cleaning and coatings,and adhesives industry.
With operations in over 50 countries, in 2016 we had sales of $9.5 billion, assets of $18.1 billion, and a worldwideworkforce of approximately 18,600 employees.
As of 30 September 2016, our operations were organized into six reportable business segments: IndustrialGases- Americas, Industrial Gases- EMEA (Europe, Middle East, and Africa), Industrial Gases- Asia, IndustrialGases- Global, Materials Technologies, and Corporate and other. The financial statements and analysis thatfollow discuss our results based on these operations.
During the second quarter of fiscal year 2016, we committed to exit the Energy-from-Waste (EfW) business. TheEfW segment is presented as a discontinued operation. Accordingly, prior year EfW business segmentinformation has been reclassified to conform to current year presentation.
The Company’s Materials Technologies business contains the Electronic Materials Division (EMD) andPerformance Materials Division (PMD). We completed the spin-off of EMD as Versum Materials, Inc. on1 October 2016. PMD is under a sales agreement subject to regulatory approval.
22
Refer to Note 26, Business Segment and Geographic Information, to the consolidated financial statements foradditional details on our reportable business segments and Note 3, Materials Technologies Separation, foradditional information on EMD and PMD.
2016 IN SUMMARY
In 2016, we delivered strong results driven by cost improvement actions despite weakness in the worldwideeconomy and currency headwinds. We made significant progress on our strategy by focusing on our coreindustrial gases business and have significantly improved our profitability as measured by operating margin,adjusted operating margin, and adjusted EBITDA margin which all increased by at least 400 bp versus the prioryear. During the year, we committed to exit our EfW business and completed the spin-off of our ElectronicMaterials division as a publicly traded company on 1 October 2016. We improved our focus on safety, deliveredon our cost reduction targets, and increased accountability by aligning pay with performance. These changesdrove increased profitability as we delivered operating margins of 22.1%, adjusted operating margins of 23.1%,and adjusted EBITDA margins of 34.4%. Also, EPS of $6.94 increased 17% from the prior year. On a non-GAAPbasis, EPS of $7.55 increased 14%.
Highlights for 2016
• Sales of $9,524.4 decreased 4%, or $370.5. Underlying sales growth of 2% was more than offset byunfavorable currency and lower energy contractual cost pass-through to customers. Underlying salesincreased from higher volumes in Industrial Gases – Global and Industrial Gases – Asia.
• Operating income of $2,106.0 increased 23%, or $397.7, primarily due to better cost performance. On a non-GAAP basis, operating income of $2,198.5 increased 16%, or $305.3. Adjusted EBITDA of $3,273.0increased 10%, or $288.9.
• Income from continuing operations of $1,515.3 increased 18%, or $230.6, and diluted earnings per sharefrom continuing operations of $6.94 increased 17%, or $1.03. On a non-GAAP basis, income from continuingoperations of $1,647.8 increased 15%, or $214.0, and diluted earnings per share from continuing operationsof $7.55 increased 14%, or $0.95. A summary table of changes in diluted earnings per share, including anon-GAAP reconciliation, is presented below.
• We entered into a sales agreement to sell the Performance Materials division of our Materials Technologiessegment to Evonik, which is subject to regulatory approval and other closing conditions.
• We completed the spin-off of the Electronic Materials division as Versum Materials, Inc. on 1 October 2016.
• We committed to exit the Energy-from-Waste business.
• We increased our quarterly dividend by 6% from $.81 to $.86 per share. This represents the 34th consecutiveyear that we have increased our dividend payment.
For a discussion of the challenges, risks, and opportunities on which management is focused, refer to our 2017Outlook below.
23

Changes in Diluted Earnings per Share Attributable to Air Products
2016 2015Increase
(Decrease)
Diluted Earnings per Share
Net income $2.89 $5.88 $(2.99)Loss from discontinued operations (4.05) (.03) (4.02)
Income from Continuing Operations—GAAP Basis $6.94 $5.91 $1.03
Operating income (after-tax)
Underlying businessVolume (.01)Price/raw materials .29Costs/other .94
Currency (.16)Business separation costs (.19)Business restructuring and cost reduction actions .60Pension settlement loss .04Gain on previously held equity interest (.05)Gain on land sales (.13)
Operating Income 1.33
Other (after-tax)
Equity affiliates’ income (.02)Interest expense (.04)Loss on extinguishment of debt .05Income tax (.06)Tax costs related to business separation (.24)Noncontrolling interests .04Average shares outstanding (.03)
Other (.30)
Total Change in Diluted Earnings per Share from Continuing
Operations—GAAP Basis $1.03
2016 2015Increase
(Decrease)
Income from Continuing Operations—GAAP Basis $6.94 $5.91 $1.03
Business separation costs .22 .03 .19Tax costs related to business separation .24 — .24Business restructuring and cost reduction actions .11 .71 (.60)Pension settlement loss .02 .06 (.04)Gain on previously held equity interest — (.05) .05Gain on land sales — (.13) .13Loss on extinguishment of debt .02 .07 (.05)
Income from Continuing Operations—Non-GAAP Basis $7.55 $6.60 $.95
2017 OUTLOOK
For 2017, we intend to remain focused on key actions we can control to continue to drive earnings growth. Weintend to accomplish this by bringing new industrial gas plant investments on-stream, making progress on theJazan sale of equipment project, and continuing to deliver on cost reduction actions. We expect continuedweakness in new LNG equipment orders primarily driven by low oil and natural gas prices.
24
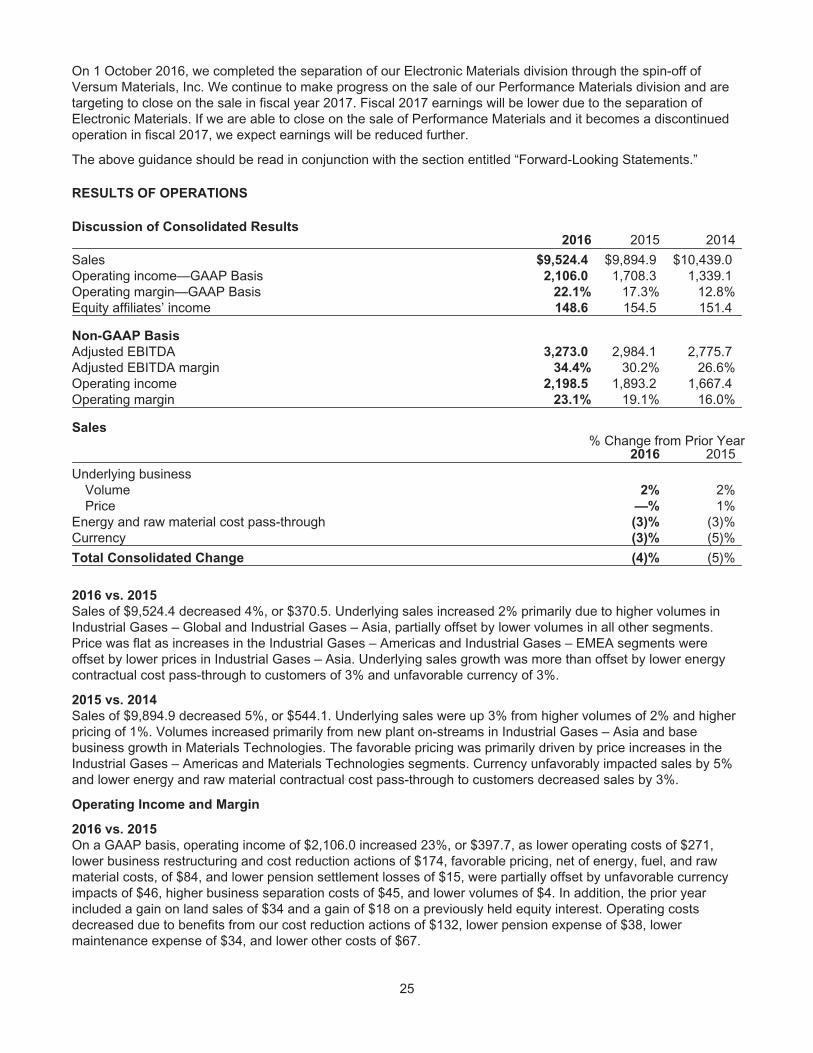
On 1 October 2016, we completed the separation of our Electronic Materials division through the spin-off ofVersum Materials, Inc. We continue to make progress on the sale of our Performance Materials division and aretargeting to close on the sale in fiscal year 2017. Fiscal 2017 earnings will be lower due to the separation ofElectronic Materials. If we are able to close on the sale of Performance Materials and it becomes a discontinuedoperation in fiscal 2017, we expect earnings will be reduced further.
The above guidance should be read in conjunction with the section entitled “Forward-Looking Statements.”
RESULTS OF OPERATIONS
Discussion of Consolidated Results2016 2015 2014
Sales $9,524.4 $9,894.9 $10,439.0Operating income—GAAP Basis 2,106.0 1,708.3 1,339.1Operating margin—GAAP Basis 22.1% 17.3% 12.8%Equity affiliates’ income 148.6 154.5 151.4
Non-GAAP Basis
Adjusted EBITDA 3,273.0 2,984.1 2,775.7Adjusted EBITDA margin 34.4% 30.2% 26.6%Operating income 2,198.5 1,893.2 1,667.4Operating margin 23.1% 19.1% 16.0%
Sales% Change from Prior Year
2016 2015
Underlying businessVolume 2% 2%Price —% 1%
Energy and raw material cost pass-through (3)% (3)%Currency (3)% (5)%
Total Consolidated Change (4)% (5)%
2016 vs. 2015
Sales of $9,524.4 decreased 4%, or $370.5. Underlying sales increased 2% primarily due to higher volumes inIndustrial Gases – Global and Industrial Gases – Asia, partially offset by lower volumes in all other segments.Price was flat as increases in the Industrial Gases – Americas and Industrial Gases – EMEA segments wereoffset by lower prices in Industrial Gases – Asia. Underlying sales growth was more than offset by lower energycontractual cost pass-through to customers of 3% and unfavorable currency of 3%.
2015 vs. 2014
Sales of $9,894.9 decreased 5%, or $544.1. Underlying sales were up 3% from higher volumes of 2% and higherpricing of 1%. Volumes increased primarily from new plant on-streams in Industrial Gases – Asia and basebusiness growth in Materials Technologies. The favorable pricing was primarily driven by price increases in theIndustrial Gases – Americas and Materials Technologies segments. Currency unfavorably impacted sales by 5%and lower energy and raw material contractual cost pass-through to customers decreased sales by 3%.
Operating Income and Margin
2016 vs. 2015
On a GAAP basis, operating income of $2,106.0 increased 23%, or $397.7, as lower operating costs of $271,lower business restructuring and cost reduction actions of $174, favorable pricing, net of energy, fuel, and rawmaterial costs, of $84, and lower pension settlement losses of $15, were partially offset by unfavorable currencyimpacts of $46, higher business separation costs of $45, and lower volumes of $4. In addition, the prior yearincluded a gain on land sales of $34 and a gain of $18 on a previously held equity interest. Operating costsdecreased due to benefits from our cost reduction actions of $132, lower pension expense of $38, lowermaintenance expense of $34, and lower other costs of $67.
25
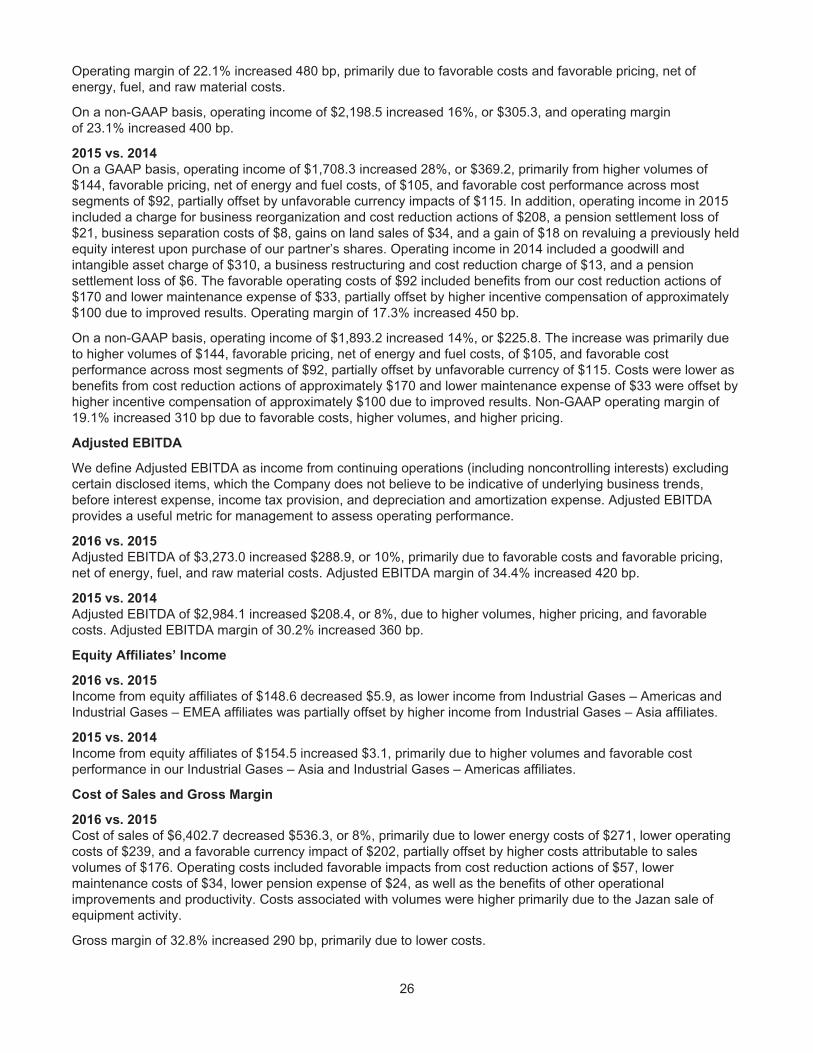
Operating margin of 22.1% increased 480 bp, primarily due to favorable costs and favorable pricing, net ofenergy, fuel, and raw material costs.
On a non-GAAP basis, operating income of $2,198.5 increased 16%, or $305.3, and operating marginof 23.1% increased 400 bp.
2015 vs. 2014
On a GAAP basis, operating income of $1,708.3 increased 28%, or $369.2, primarily from higher volumes of$144, favorable pricing, net of energy and fuel costs, of $105, and favorable cost performance across mostsegments of $92, partially offset by unfavorable currency impacts of $115. In addition, operating income in 2015included a charge for business reorganization and cost reduction actions of $208, a pension settlement loss of$21, business separation costs of $8, gains on land sales of $34, and a gain of $18 on revaluing a previously heldequity interest upon purchase of our partner’s shares. Operating income in 2014 included a goodwill andintangible asset charge of $310, a business restructuring and cost reduction charge of $13, and a pensionsettlement loss of $6. The favorable operating costs of $92 included benefits from our cost reduction actions of$170 and lower maintenance expense of $33, partially offset by higher incentive compensation of approximately$100 due to improved results. Operating margin of 17.3% increased 450 bp.
On a non-GAAP basis, operating income of $1,893.2 increased 14%, or $225.8. The increase was primarily dueto higher volumes of $144, favorable pricing, net of energy and fuel costs, of $105, and favorable costperformance across most segments of $92, partially offset by unfavorable currency of $115. Costs were lower asbenefits from cost reduction actions of approximately $170 and lower maintenance expense of $33 were offset byhigher incentive compensation of approximately $100 due to improved results. Non-GAAP operating margin of19.1% increased 310 bp due to favorable costs, higher volumes, and higher pricing.
Adjusted EBITDA
We define Adjusted EBITDA as income from continuing operations (including noncontrolling interests) excludingcertain disclosed items, which the Company does not believe to be indicative of underlying business trends,before interest expense, income tax provision, and depreciation and amortization expense. Adjusted EBITDAprovides a useful metric for management to assess operating performance.
2016 vs. 2015
Adjusted EBITDA of $3,273.0 increased $288.9, or 10%, primarily due to favorable costs and favorable pricing,net of energy, fuel, and raw material costs. Adjusted EBITDA margin of 34.4% increased 420 bp.
2015 vs. 2014
Adjusted EBITDA of $2,984.1 increased $208.4, or 8%, due to higher volumes, higher pricing, and favorablecosts. Adjusted EBITDA margin of 30.2% increased 360 bp.
Equity Affiliates’ Income
2016 vs. 2015
Income from equity affiliates of $148.6 decreased $5.9, as lower income from Industrial Gases – Americas andIndustrial Gases – EMEA affiliates was partially offset by higher income from Industrial Gases – Asia affiliates.
2015 vs. 2014
Income from equity affiliates of $154.5 increased $3.1, primarily due to higher volumes and favorable costperformance in our Industrial Gases – Asia and Industrial Gases – Americas affiliates.
Cost of Sales and Gross Margin
2016 vs. 2015
Cost of sales of $6,402.7 decreased $536.3, or 8%, primarily due to lower energy costs of $271, lower operatingcosts of $239, and a favorable currency impact of $202, partially offset by higher costs attributable to salesvolumes of $176. Operating costs included favorable impacts from cost reduction actions of $57, lowermaintenance costs of $34, lower pension expense of $24, as well as the benefits of other operationalimprovements and productivity. Costs associated with volumes were higher primarily due to the Jazan sale ofequipment activity.
Gross margin of 32.8% increased 290 bp, primarily due to lower costs.
26

2015 vs. 2014
Cost of sales of $6,939.0 decreased $690.9, or 9%, primarily due to a favorable currency impact of $368, lowerenergy costs of $313, and lower operating costs of $102, partially offset by costs attributable to higher salesvolumes of $92. Operating costs included favorable impacts from cost reduction actions of $48 and lower othercosts, including maintenance, of $115, partially offset by higher incentive compensation of $61.
Gross margin of 29.9% increased 300 bp, due to lower costs of 120 bp, higher price, net of raw materials, of 100bp, and higher volumes of 80 bp.
Selling and Administrative Expense
2016 vs. 2015
Selling and administrative expense of $849.3 decreased $90.0, or 10%, primarily due to the benefits of costreduction actions of $68 and favorable currency effects of $28, partially offset by higher other costs of $6. Sellingand administrative expense as a percent of sales decreased to 8.9% from 9.5%.
2015 vs. 2014
Selling and administrative expense of $939.3 decreased $115.4, or 11%, primarily due to the benefits of costreduction actions of $122 and favorable currency effects of $62, partially offset by higher other costs of $69,driven by higher incentive compensation. Selling and administrative expense as a percent of sales decreased to9.5% from 10.1%.
Research and Development
2016 vs. 2015
Research and development expense of $132.0 decreased $5.1, or 4%. Fiscal year 2016 and 2015 research anddevelopment expense as a percent of sales was 1.4%.
2015 vs. 2014
Research and development expense of $137.1 decreased $2.7, or 2%. Fiscal year 2015 and 2014 research anddevelopment expense as a percent of sales was 1.4% and 1.3%, respectively.
Business Separation Costs
On 16 September 2015, the Company announced plans to separate its Materials Technologies business, whichcontains two divisions, Electronic Materials (EMD) and Performance Materials (PMD), into an independentpublicly traded company and distribute to Air Products shareholders all of the shares of the new public companyin a tax free distribution (a “spin-off”). Versum Materials, LLC, or Versum, was formed as the new company tohold the Materials Technologies business subject to the spin-off. On 6 May 2016, the Company entered into anagreement to sell certain subsidiaries and assets comprising the PMD division to Evonik Industries AG for $3.8billion in cash and the assumption of certain liabilities. As a result, the Company moved forward with the plannedspin-off of Versum containing only the EMD division.
On 1 October 2016, Air Products completed the separation of its EMD division through the spin-off of Versum. Asa result, the historical results of EMD will be presented as a discontinued operation beginning in fiscal year 2017.We continue to evaluate the progress of the sale of the PMD division to determine when it should be presented asa discontinued operation.
In fiscal year 2016, we incurred separation costs of $52.2 ($48.3 after-tax, or $.22 per share), primarily related tolegal, advisory, and indirect tax costs associated with these transactions. The costs are reflected on theconsolidated income statements as “Business separation costs.” A significant portion of these costs were not taxdeductible because they were directly related to the plan for the tax-free spin-off of Versum. Our income taxprovision includes additional tax expense related to the separation of $51.8 ($.24 per share), of which $45.7resulted from a dividend declared during the third quarter of 2016 to repatriate $443.8 from a subsidiary in SouthKorea to the U.S. Previously, most of these foreign earnings were considered to be indefinitely reinvested.
We expect to incur additional legal and advisory fees in fiscal 2017.
On 30 September 2016, in anticipation of the spin-off, Versum entered into certain financing transactions to allowfor a cash distribution of $550.0 and a distribution in-kind of notes issued by Versum with an aggregate principalamount of $425.0 to Air Products. Air Products then exchanged these notes with certain financial institutions for
27
$418.3 of Air Products’ outstanding commercial paper. The exchange resulted in a loss of $6.9 ($4.3 after-tax, or$.02 per share) and has been reflected on the consolidated income statements as “Loss on extinguishment ofdebt.” This loss is deductible for tax purposes.
Business Restructuring and Cost Reduction Actions
We recorded charges in 2016, 2015, and 2014 for business restructuring and cost reduction actions. The chargesfor these actions are excluded from segment operating income.
Cost Reduction Actions
In fiscal year 2016, we recognized an expense of $33.9 ($24.0 after-tax, or $.11 per share) for severance andother benefits related to cost reduction actions resulting from the elimination of approximately 700 positions. Theexpense related primarily to the Industrial Gases – Americas and the Industrial Gases – EMEA segments.
Business Realignment and Reorganization
On 18 September 2014, we announced plans to reorganize the Company, including realignment of ourbusinesses in new reporting segments and other organizational changes, effective as of 1 October 2014, which atthe time resulted in the largest transformational change in the history of the Company. As a result of thisreorganization, we incurred severance and other charges.
In fiscal year 2015, we recognized an expense of $207.7 ($153.2 after-tax, or $.71 per share). Severance andother benefits totaled $151.9 and related to the elimination of approximately 2,000 positions. Asset andassociated contract actions totaled $55.8 and related primarily to a plant shutdown in the Corporate and othersegment and the exit of product lines within Industrial Gases – Global and Materials Technologies segments.
During the fourth quarter of 2014, an expense of $12.7 ($8.2 after-tax, or $.04 per share) was incurred relating tothe elimination of approximately 50 positions.
Refer to Note 5, Business Restructuring and Cost Reduction Actions, to the consolidated financial statements foradditional details on these actions.
Pension Settlement Loss
Certain of our pension plans provide for a lump sum benefit payment option at the time of retirement, or forcorporate officers, six months after the retirement date. Pension settlements are recognized when cash paymentsexceed the sum of the service and interest cost components of net periodic pension cost of the plan for the fiscalyear. We recognized $6.4 ($4.1 after-tax, or $.02 per share), $21.2 ($13.7 after-tax, or $.06 per share), and $5.5($3.6 after-tax, or $.02 per share) of settlement charges in 2016, 2015, and 2014, respectively. The settlementaccelerated the recognition of a portion of actuarial losses deferred in accumulated other comprehensive lossprimarily related to our U.S. Supplementary Pension Plan.
Goodwill and Intangible Asset Impairment Charge
During the fourth quarter of 2014, we concluded that the goodwill and indefinite-lived intangible assets (primarilyacquired trade names) associated with our Latin America reporting unit of our Industrial Gases – Americassegment were impaired and recorded a noncash impairment charge of $310.1 ($275.1 attributable to Air Productsafter-tax, or $1.27 per share).
Gain on Previously Held Equity Interest
On 30 December 2014, we acquired our partner’s equity ownership interest in a liquefied atmospheric industrialgases production joint venture in North America for $22.6 which increased our ownership from 50% to 100%. Thetransaction was accounted for as a business combination, and subsequent to the acquisition, the results areconsolidated within our Industrial Gases – Americas segment. The assets acquired, primarily plant andequipment, were recorded at their fair value as of the acquisition date.
The acquisition date fair value of the previously held equity interest was determined using a discounted cash flowanalysis under the income approach. During the first quarter of 2015, we recorded a gain of $17.9 ($11.2 after-tax, or $.05 per share) as a result of revaluing our previously held equity interest to fair value as of the acquisitiondate.
28

Other Income (Expense), Net
Items recorded to other income (expense), net arise from transactions and events not directly related to ourprincipal income earning activities. The detail of other income (expense), net is presented in Note 24,Supplemental Information, to the consolidated financial statements.
2016 vs. 2015
Other income (expense), net of $58.1 increased $10.8 primarily due to lower foreign exchange losses, favorablecontract settlements, and receipt of a government subsidy. The prior year included a gain of $33.6 ($28.3after-tax, or $.13 per share) resulting from the sale of two parcels of land. No other individual items weresignificant in comparison to the prior year.
2015 vs. 2014
Other income (expense), net of $47.3 decreased $5.5 and included a gain of $33.6 ($28.3 after-tax, or $.13 pershare) resulting from the sale of two parcels of land. The gain was partially offset by unfavorable foreignexchange impacts and lower gains on other sales of assets and emissions credits. No other individual items weresignificant in comparison to fiscal year 2014.
Interest Expense2016 2015 2014
Interest incurred $148.4 $152.6 $158.1Less: Capitalized interest 32.9 49.1 33.0
Interest Expense $115.5 $103.5 $125.1
2016 vs. 2015
Interest incurred decreased $4.2. The decrease primarily resulted from a stronger U.S. dollar on the translation offoreign currency interest of $6, partially offset by a higher average debt balance of $2. The change in capitalizedinterest was driven by a decrease in the carrying value of projects under construction, primarily as a result of ourexit from the Energy-from-Waste business.
2015 vs. 2014
Interest incurred decreased $5.5. The decrease was driven by the impact of a stronger U.S. dollar on thetranslation of foreign currency interest of $12, partially offset by a higher average debt balance of $7. The changein capitalized interest was driven by a higher carrying value in construction in progress.
Loss on Extinguishment of Debt
On 30 September 2016, in anticipation of the Versum spin-off, Versum issued $425.0 of notes to Air Products,who then exchanged these notes with certain financial institutions for $418.3 of Air Products’ outstandingcommercial paper. The exchange resulted in a loss of $6.9 ($4.3 after-tax, or $.02 per share).
In September 2015, we made a payment of $146.6 to redeem 3,000,000 Unidades de Fomento (“UF”) Series E6.30% Bonds due 22 January 2030 that had a carrying value of $130.0 and resulted in a net loss of $16.6 ($14.2after-tax, or $.07 per share).
Effective Tax Rate
The effective tax rate equals the income tax provision divided by income from continuing operations before taxes.Refer to Note 23, Income Taxes, to the consolidated financial statements for details on factors affecting theeffective tax rate.
2016 vs. 2015
On a GAAP basis, the effective tax rate was 27.5% and 24.0% in 2016 and 2015, respectively. The changeincluded a 240 bp impact from tax costs associated with business separation, primarily resulting from a dividenddeclared in 2016 to repatriate cash from a foreign subsidiary, as discussed above in “Business Separation Costs.”The remaining 110 bp change was primarily due to the increase in mix of income in jurisdictions with a highereffective tax rate and the impact of business separation costs for which a tax benefit was not available. On a non-GAAP basis, the effective tax rate increased from 24.2% in 2015 to 24.8% in 2016, primarily due to the increasein and mix of income in jurisdictions with a higher effective tax rate.
29

2015 vs. 2014
On a GAAP basis, the effective tax rate was 24.0% and 27.1% in 2015 and 2014, respectively. The effective taxrate was higher in fiscal year 2014 primarily due to the goodwill impairment charge of $305.2, which was notdeductible for tax purposes, and the Chilean tax reform enacted in September 2014 which increased income taxexpense by $20.6. These impacts were partially offset by an income tax benefit of $51.6 associated with lossesfrom transactions and a tax election in a non-U.S. subsidiary. Refer to Note 10, Goodwill, and Note 23, IncomeTaxes, to the consolidated financial statements for additional information. On a non-GAAP basis, the effective taxrate was 24.2% and 24.1% in 2015 and 2014, respectively.
Discontinued Operations
On 29 March 2016, the Board of Directors approved the Company’s exit of its Energy-from-Waste (EfW)business. As a result, efforts to start up and operate its two EfW projects located in Tees Valley, United Kingdom,have been discontinued. The decision to exit the business and stop development of the projects was based oncontinued difficulties encountered and the Company’s conclusion, based on testing and analysis completed duringthe second quarter of fiscal year 2016, that significant additional time and resources would be required to makethe projects operational. In addition, the decision allows the Company to execute its strategy of focusingresources on its core Industrial Gases business. The EfW segment has been presented as a discontinuedoperation. Prior year EfW business segment information has been reclassified to conform to current yearpresentation.
In fiscal 2016, our loss from discontinued operations, net of tax, of $884.2 primarily resulted from the write downof assets to their estimated net realizable value and to record a liability for plant disposition and other costs.Income tax benefits related only to one of the projects, as the other did not qualify for a local tax deduction. Theloss from discontinued operations also includes land lease costs, commercial and administrative costs, and costsincurred for ongoing project exit activities.
We expect additional exit costs of $50 to $100 to be recorded in future periods.
In fiscal 2015, our loss from discontinued operations, net of tax, related to EfW was $6.8. This resulted from costsfor land leases and commercial and administrative expenses.
In fiscal 2014, our loss from discontinued operations, net of tax, was $2.9. This included a loss, net of tax, of $7.5for the cost of EfW land leases and commercial and administrative expenses. This loss was partially offset by again of $3.9 for the sale of the remaining Homecare business and settlement of contingencies related to a sale ofa separate portion of the business to The Linde Group in 2012.
Refer to Note 4, Discontinued Operations, for additional details.
Segment Analysis
Industrial Gases – Americas2016 2015 2014
Sales $3,343.6 $3,693.9 $4,078.5Operating income 895.2 808.4 762.6Operating margin 26.8 % 21.9 % 18.7 %Equity affiliates’ income 52.7 64.6 60.9Adjusted EBITDA 1,390.4 1,289.9 1,237.9Adjusted EBITDA margin 41.6 % 34.9 % 30.4 %
30

Industrial Gases – Americas Sales
% Change from Prior Year2016 2015
Underlying businessVolume (2)% —%Price 1% 2%
Energy and raw material cost pass-through (6)% (8)%Currency (2)% (3)%
Total Industrial Gases – Americas Change (9)% (9)%
2016 vs. 2015
Underlying sales decreased 1% from lower volumes of 2%, partially offset by higher pricing of 1%. Volumes weredown due to weakness in Latin America and lower steel demand in North America. Pricing was higher due to thebenefit of pricing actions, mainly the recovery of inflationary and power cost increases in Latin America. Lowerenergy contractual cost pass-through to customers, primarily natural gas, decreased sales by 6%. Currencydecreased sales by 2% primarily due to the impacts of the Chilean Peso, Brazilian Real, and Canadian Dollar.
Operating income of $895.2 increased 11%, or $86.8, due to lower operating costs of $108 and higher pricing, netof energy and fuel costs, of $26, partially offset by lower volumes of $33 and unfavorable currency impacts of $14.Operating costs were lower due to benefits from cost reduction actions. Operating margin increased 490 bp fromthe prior year, primarily due to the lower costs, with additional benefits from lower energy pass-through and higherpricing.
Equity affiliates’ income of $52.7 decreased $11.9 primarily due to unfavorable currency impacts and highermaintenance expense.
2015 vs. 2014
Underlying sales increased 2% from higher pricing. Volumes were flat as growth in liquid oxygen and nitrogen andgaseous hydrogen were offset by lower helium and gaseous oxygen demand. Pricing was higher due to strengthin helium and price increases to recover higher costs. Currency decreased sales by 3% primarily due to theimpacts of the Chilean Peso, Brazilian Real, and Canadian Dollar. Lower energy contractual cost pass-through tocustomers, primarily natural gas, decreased sales by 8%.
Operating income of $808.4 increased 6%, or $45.8, due to higher pricing net of energy and fuel costs of $65 andfavorable volume mix impacts of $6, partially offset by unfavorable currency impacts of $21 and higher costs of $4mainly due to higher incentive compensation mostly offset by the benefits of our recent restructuring actions.Operating margin increased 320 bp from the prior year, primarily due to the higher pricing and lower energycontractual cost pass-through to customers.
Equity affiliates’ income of $64.6 increased $3.7 due to improved performance in our Mexican equity affiliate.
Industrial Gases – EMEA2016 2015 2014
Sales $1,700.3 $1,864.9 $2,150.7Operating income 382.8 330.7 351.2Operating margin 22.5 % 17.7 % 16.3 %Equity affiliates’ income 36.5 42.4 44.1Adjusted EBITDA 605.0 567.4 615.5Adjusted EBITDA margin 35.6 % 30.4 % 28.6 %
31
Industrial Gases – EMEA Sales% Change from Prior Year
2016 2015
Underlying businessVolume (2)% —%Price 1% 1%
Energy and raw material cost pass-through (4)% (1)%Currency (4)% (13)%
Total Industrial Gases – EMEA Change (9)% (13)%
2016 vs. 2015
Underlying sales decreased 1% as lower volumes of 2% were partially offset by higher pricing of 1%. Volumesdecreased primarily due to continued weakness in the European economy. Lower energy and natural gascontractual cost pass-through to customers decreased sales by 4%. Unfavorable currency effects from the Euroand the British Pound Sterling reduced sales by 4%. Other than the impact on currency, the Brexit vote did nothave a notable impact on our business.
Operating income of $382.8 increased 16%, or $52.1, primarily due to favorable operating costs of $59 and higherpricing, net of energy and fuel costs, of $20, partially offset by unfavorable currency impacts of $18 and lowervolumes of $9. Operating margin increased 480 bp from the prior year primarily due to favorable costperformance, higher pricing, and lower energy pass-through.
Equity affiliates’ income of $36.5 decreased $5.9 primarily due to unfavorable currency impacts.
As a result of our exit from the Energy-from-Waste segment, the Company is evaluating the disposition of an airseparation unit in the Industrial Gases – EMEA segment that was constructed primarily to provide oxygen to oneof the Tees Valley plants. The current value of this asset is approximately £40 million ($52 million).
2015 vs. 2014
Underlying sales increased 1% from pricing improvement in both packaged gas and liquid bulk. Volumes were flatas higher liquid oxygen and nitrogen volumes were offset by lower cylinder and helium volumes. Unfavorablecurrency effects, primarily from the Euro, the British Pound Sterling, and the Polish Zloty, reduced sales by 13%.Lower energy contractual cost pass-through to customers decreased sales by 1%.
Operating income of $330.7 decreased 6%, or $20.5, due to unfavorable currency impacts of $44, partially offsetby lower costs of $13 resulting from restructuring actions, favorable volume mix impacts of $5, and higher pricing,net of energy and fuel costs, of $5. Operating margin increased 140 bp from 2014 primarily due to the lowercosts.
Equity affiliates’ income of $42.4 decreased $1.7.
Industrial Gases – Asia2016 2015 2014
Sales $1,716.1 $1,637.5 $1,527.0Operating income 449.1 380.5 310.4Operating margin 26.2 % 23.2 % 20.3 %Equity affiliates’ income 57.8 46.1 38.0Adjusted EBITDA 704.0 629.5 553.7Adjusted EBITDA margin 41.0 % 38.4 % 36.3 %
Industrial Gases – Asia Sales% Change from Prior Year
2016 2015
Underlying businessVolume 11% 12%Price (1)% (2)%
Energy and raw material cost pass-through —% 1%Currency (5)% (4)%
Total Industrial Gases – Asia Change 5% 7%
32
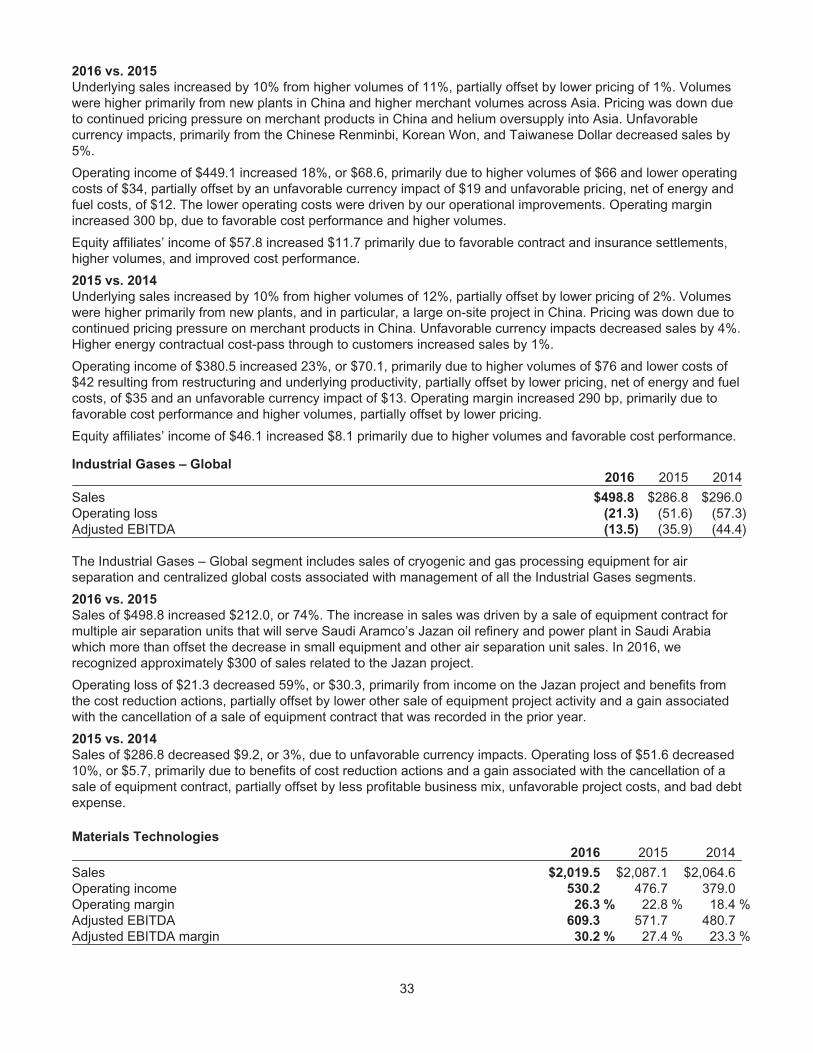
2016 vs. 2015
Underlying sales increased by 10% from higher volumes of 11%, partially offset by lower pricing of 1%. Volumeswere higher primarily from new plants in China and higher merchant volumes across Asia. Pricing was down dueto continued pricing pressure on merchant products in China and helium oversupply into Asia. Unfavorablecurrency impacts, primarily from the Chinese Renminbi, Korean Won, and Taiwanese Dollar decreased sales by5%.
Operating income of $449.1 increased 18%, or $68.6, primarily due to higher volumes of $66 and lower operatingcosts of $34, partially offset by an unfavorable currency impact of $19 and unfavorable pricing, net of energy andfuel costs, of $12. The lower operating costs were driven by our operational improvements. Operating marginincreased 300 bp, due to favorable cost performance and higher volumes.
Equity affiliates’ income of $57.8 increased $11.7 primarily due to favorable contract and insurance settlements,higher volumes, and improved cost performance.
2015 vs. 2014
Underlying sales increased by 10% from higher volumes of 12%, partially offset by lower pricing of 2%. Volumeswere higher primarily from new plants, and in particular, a large on-site project in China. Pricing was down due tocontinued pricing pressure on merchant products in China. Unfavorable currency impacts decreased sales by 4%.Higher energy contractual cost-pass through to customers increased sales by 1%.
Operating income of $380.5 increased 23%, or $70.1, primarily due to higher volumes of $76 and lower costs of$42 resulting from restructuring and underlying productivity, partially offset by lower pricing, net of energy and fuelcosts, of $35 and an unfavorable currency impact of $13. Operating margin increased 290 bp, primarily due tofavorable cost performance and higher volumes, partially offset by lower pricing.
Equity affiliates’ income of $46.1 increased $8.1 primarily due to higher volumes and favorable cost performance.
Industrial Gases – Global2016 2015 2014
Sales $498.8 $286.8 $296.0Operating loss (21.3) (51.6) (57.3)Adjusted EBITDA (13.5) (35.9) (44.4)
The Industrial Gases – Global segment includes sales of cryogenic and gas processing equipment for airseparation and centralized global costs associated with management of all the Industrial Gases segments.
2016 vs. 2015
Sales of $498.8 increased $212.0, or 74%. The increase in sales was driven by a sale of equipment contract formultiple air separation units that will serve Saudi Aramco’s Jazan oil refinery and power plant in Saudi Arabiawhich more than offset the decrease in small equipment and other air separation unit sales. In 2016, werecognized approximately $300 of sales related to the Jazan project.
Operating loss of $21.3 decreased 59%, or $30.3, primarily from income on the Jazan project and benefits fromthe cost reduction actions, partially offset by lower other sale of equipment project activity and a gain associatedwith the cancellation of a sale of equipment contract that was recorded in the prior year.
2015 vs. 2014
Sales of $286.8 decreased $9.2, or 3%, due to unfavorable currency impacts. Operating loss of $51.6 decreased10%, or $5.7, primarily due to benefits of cost reduction actions and a gain associated with the cancellation of asale of equipment contract, partially offset by less profitable business mix, unfavorable project costs, and bad debtexpense.
Materials Technologies
2016 2015 2014
Sales $2,019.5 $2,087.1 $2,064.6Operating income 530.2 476.7 379.0Operating margin 26.3 % 22.8 % 18.4 %Adjusted EBITDA 609.3 571.7 480.7Adjusted EBITDA margin 30.2 % 27.4 % 23.3 %
33
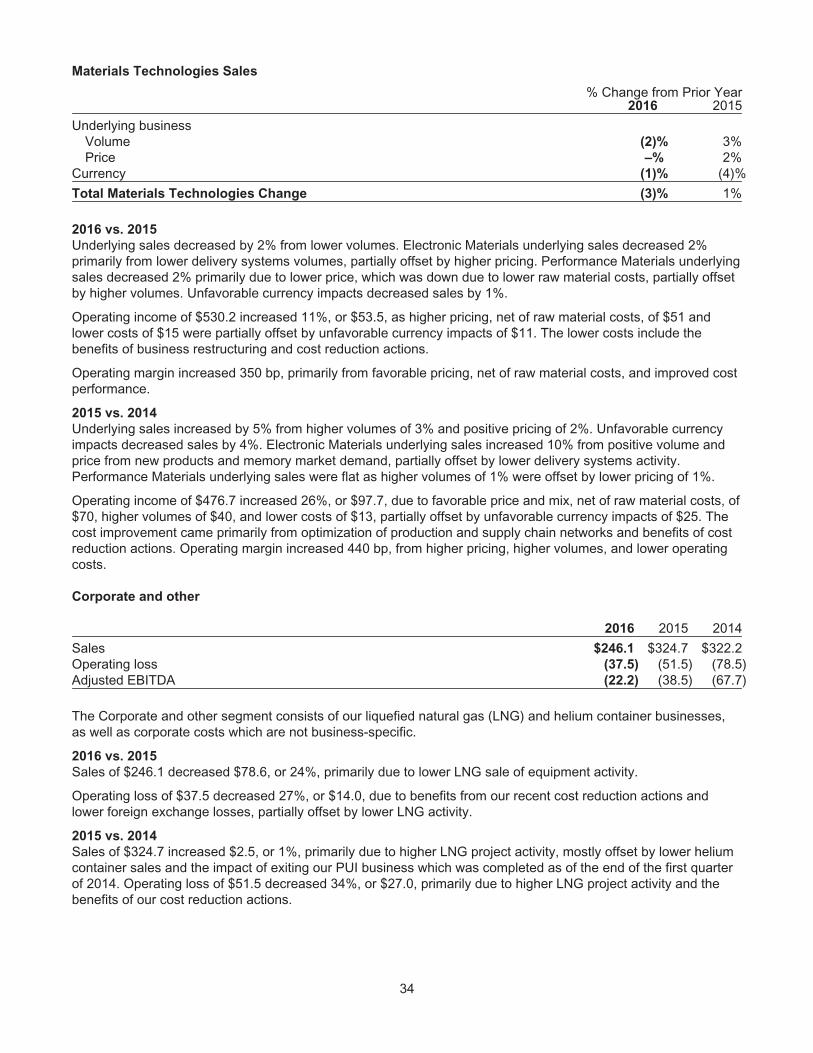
Materials Technologies Sales
% Change from Prior Year2016 2015
Underlying businessVolume (2)% 3%Price –% 2%
Currency (1)% (4)%
Total Materials Technologies Change (3)% 1%
2016 vs. 2015
Underlying sales decreased by 2% from lower volumes. Electronic Materials underlying sales decreased 2%primarily from lower delivery systems volumes, partially offset by higher pricing. Performance Materials underlyingsales decreased 2% primarily due to lower price, which was down due to lower raw material costs, partially offsetby higher volumes. Unfavorable currency impacts decreased sales by 1%.
Operating income of $530.2 increased 11%, or $53.5, as higher pricing, net of raw material costs, of $51 andlower costs of $15 were partially offset by unfavorable currency impacts of $11. The lower costs include thebenefits of business restructuring and cost reduction actions.
Operating margin increased 350 bp, primarily from favorable pricing, net of raw material costs, and improved costperformance.
2015 vs. 2014
Underlying sales increased by 5% from higher volumes of 3% and positive pricing of 2%. Unfavorable currencyimpacts decreased sales by 4%. Electronic Materials underlying sales increased 10% from positive volume andprice from new products and memory market demand, partially offset by lower delivery systems activity.Performance Materials underlying sales were flat as higher volumes of 1% were offset by lower pricing of 1%.
Operating income of $476.7 increased 26%, or $97.7, due to favorable price and mix, net of raw material costs, of$70, higher volumes of $40, and lower costs of $13, partially offset by unfavorable currency impacts of $25. Thecost improvement came primarily from optimization of production and supply chain networks and benefits of costreduction actions. Operating margin increased 440 bp, from higher pricing, higher volumes, and lower operatingcosts.
Corporate and other
2016 2015 2014
Sales $246.1 $324.7 $322.2Operating loss (37.5) (51.5) (78.5)Adjusted EBITDA (22.2) (38.5) (67.7)
The Corporate and other segment consists of our liquefied natural gas (LNG) and helium container businesses,as well as corporate costs which are not business-specific.
2016 vs. 2015
Sales of $246.1 decreased $78.6, or 24%, primarily due to lower LNG sale of equipment activity.
Operating loss of $37.5 decreased 27%, or $14.0, due to benefits from our recent cost reduction actions andlower foreign exchange losses, partially offset by lower LNG activity.
2015 vs. 2014
Sales of $324.7 increased $2.5, or 1%, primarily due to higher LNG project activity, mostly offset by lower heliumcontainer sales and the impact of exiting our PUI business which was completed as of the end of the first quarterof 2014. Operating loss of $51.5 decreased 34%, or $27.0, primarily due to higher LNG project activity and thebenefits of our cost reduction actions.
34
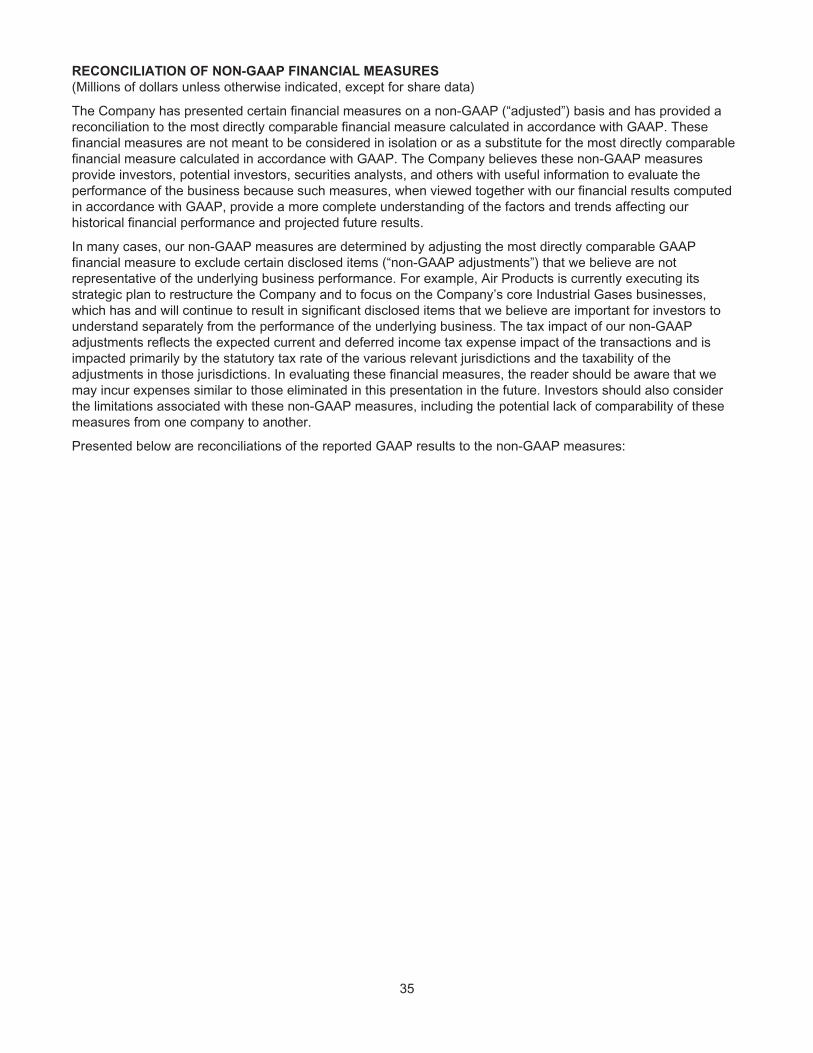
RECONCILIATION OF NON-GAAP FINANCIAL MEASURES
(Millions of dollars unless otherwise indicated, except for share data)
The Company has presented certain financial measures on a non-GAAP (“adjusted”) basis and has provided areconciliation to the most directly comparable financial measure calculated in accordance with GAAP. Thesefinancial measures are not meant to be considered in isolation or as a substitute for the most directly comparablefinancial measure calculated in accordance with GAAP. The Company believes these non-GAAP measuresprovide investors, potential investors, securities analysts, and others with useful information to evaluate theperformance of the business because such measures, when viewed together with our financial results computedin accordance with GAAP, provide a more complete understanding of the factors and trends affecting ourhistorical financial performance and projected future results.
In many cases, our non-GAAP measures are determined by adjusting the most directly comparable GAAPfinancial measure to exclude certain disclosed items (“non-GAAP adjustments”) that we believe are notrepresentative of the underlying business performance. For example, Air Products is currently executing itsstrategic plan to restructure the Company and to focus on the Company’s core Industrial Gases businesses,which has and will continue to result in significant disclosed items that we believe are important for investors tounderstand separately from the performance of the underlying business. The tax impact of our non-GAAPadjustments reflects the expected current and deferred income tax expense impact of the transactions and isimpacted primarily by the statutory tax rate of the various relevant jurisdictions and the taxability of theadjustments in those jurisdictions. In evaluating these financial measures, the reader should be aware that wemay incur expenses similar to those eliminated in this presentation in the future. Investors should also considerthe limitations associated with these non-GAAP measures, including the potential lack of comparability of thesemeasures from one company to another.
Presented below are reconciliations of the reported GAAP results to the non-GAAP measures:
35

CONSOLIDATED RESULTS
Continuing OperationsOperating
IncomeOperating
Margin(A)Income Tax
Provision(B)Net
IncomeDiluted
EPS2016 GAAP $2,106.0 22.1% $586.5 $1,515.3 $6.942015 GAAP 1,708.3 17.3% 418.3 1,284.7 5.91
Change GAAP $397.7 480bp $168.2 $230.6 $1.03% Change GAAP 23% 40% 18% 17%
2016 GAAP $2,106.0 22.1% $586.5 $1,515.3 $6.94Business separation costs(C) 52.2 .5% 3.9 48.3 .22Tax costs associated with business separation(C) — — (51.8) 51.8 .24Business restructuring and cost reduction actions 33.9 .4% 9.9 24.0 .11Pension settlement loss 6.4 .1% 2.3 4.1 .02Loss on extinguishment of debt(D) — — 2.6 4.3 .022016 Non-GAAP Measure $2,198.5 23.1% $553.4 $1,647.8 $7.55
2015 GAAP $1,708.3 17.3% $418.3 $1,284.7 $5.91Business separation costs(C) 7.5 .1% — 7.5 .03Business restructuring and cost reduction actions 207.7 2.1% 54.5 153.2 .71Pension settlement loss 21.2 .2% 7.5 13.7 .06Gain on previously held equity interest (17.9) (.2)% (6.7) (11.2) (.05)Gain on land sales(E) (33.6) (.4)% (5.3) (28.3) (.13)Loss on extinguishment of debt(D) — — 2.4 14.2 .072015 Non-GAAP Measure $1,893.2 19.1% $470.7 $1,433.8 $6.60
Change Non-GAAP Measure $305.3 400bp $82.7 $214.0 $.95% Change Non-GAAP Measure 16% 18% 15% 14%
Continuing OperationsOperating
IncomeOperating
Margin(A)Income Tax
Provision(B)Net
IncomeDiluted
EPS2015 GAAP $1,708.3 17.3% $418.3 $1,284.7 $5.912014 GAAP 1,339.1 12.8% 369.4 994.6 4.62
Change GAAP $369.2 450bp $48.9 $290.1 $1.29% Change GAAP 28% 13% 29% 28%
2015 GAAP $1,708.3 17.3% $418.3 $1,284.7 $5.91Business separation costs(C) 7.5 .1% — 7.5 .03Business restructuring and cost reduction actions 207.7 2.1% 54.5 153.2 .71Pension settlement loss 21.2 .2% 7.5 13.7 .06Gain on previously held equity interest (17.9) (.2)% (6.7) (11.2) (.05)Gain on land sales(E) (33.6) (.4)% (5.3) (28.3) (.13)Loss on extinguishment of debt(D) — — 2.4 14.2 .072015 Non-GAAP Measure $1,893.2 19.1% $470.7 $1,433.8 $6.60
2014 GAAP $1,339.1 12.8% $369.4 $994.6 $4.62Business restructuring and cost reduction actions 12.7 .1% 4.5 8.2 .04Pension settlement loss 5.5 .1% 1.9 3.6 .02Goodwill and intangible asset impairment charge(F) 310.1 3.0% 1.3 275.1 1.27Chilean tax rate change — — (20.6) 20.6 .10Tax election benefit — — 51.6 (51.6) (.24)2014 Non-GAAP Measure $1,667.4 16.0% $408.1 $1,250.5 $5.81
Change Non-GAAP Measure $225.8 310bp $62.6 $183.3 $.79% Change Non-GAAP Measure 14% 15% 15% 14%
(A) Operating margin is calculated by dividing operating income by sales.
36

(B) The tax impact of our non-GAAP adjustments reflects the expected current and deferred income tax expense impact ofthe transactions and is impacted primarily by the statutory tax rate of the various relevant jurisdictions and the taxability ofthe adjustments in those jurisdictions.
(C) Refer to Note 3, Materials Technologies Separation, to the consolidated financial statements for additional information.(D) Income from continuing operations before taxes impact of $6.9 and $16.6 in 2016 and 2015, respectively.(E) Reflected on the consolidated income statements in “Other income (expense), net.”(F) Net income attributable to noncontrolling interests impact of $33.7.
ADJUSTED EBITDA
We define Adjusted EBITDA as income from continuing operations (including noncontrolling interests) excludingcertain disclosed items, which the Company does not believe to be indicative of underlying business trends,before interest expense, income tax provision, and depreciation and amortization expense. Adjusted EBITDAprovides a useful metric for management to assess operating performance.
Below is a reconciliation of Income from Continuing Operations on a GAAP basis to Adjusted EBITDA:
2016 2015 2014 2013 2012
Income from Continuing Operations(A) $1,545.7 $1,324.4 $996.0 $1,047.6 $1,025.2Add: Interest expense 115.5 103.5 125.1 141.8 123.7Add: Income tax provision 586.5 418.3 369.4 310.2 287.3Add: Depreciation and amortization 925.9 936.4 956.9 907.0 840.8Add: Business separation costs 52.2 7.5 — — —Add: Business restructuring and cost reduction actions 33.9 207.7 12.7 231.6 327.4Add: Pension settlement loss 6.4 21.2 5.5 — —Add: Goodwill and intangible asset impairment charge — — 310.1 — —Less: Gain on previously held equity interest — 17.9 — — 85.9Add: Advisory costs — — — 10.1 —Add: Customer bankruptcy — — — — 9.8Less: Gain on land sales(B) — 33.6 — — —Add: Loss on early retirement of debt 6.9 16.6 — — —
Adjusted EBITDA $3,273.0 $2,984.1 $2,775.7 $2,648.3 $2,528.3
Change GAAP
Income from continuing operations change $221.3 $328.4 $(51.6) $22.4Income from continuing operations % change 17% 33% (5)% 2%
Change Non-GAAP
Adjusted EBITDA change $288.9 $208.4 $127.4 $120.0Adjusted EBITDA % change 10% 8% 5% 5%
(A) Includes net income attributable to noncontrolling interests.(B) Reflected on the consolidated income statements in “Other income (expense), net.”
37

Below is a summary of segment operating income:
IndustrialGases–
Americas
IndustrialGases–
EMEA
IndustrialGases–
Asia
IndustrialGases–
GlobalMaterials
TechnologiesCorporateand other
SegmentTotal
GAAP MeasureTwelve Months Ended
30 September 2016
Operating income (loss) $895.2 $382.8 $449.1 $(21.3) $530.2 $(37.5) $2,198.5Operating margin 26.8% 22.5% 26.2% 26.3% 23.1%
Twelve Months Ended
30 September 2015
Operating income (loss) $808.4 $330.7 $380.5 $(51.6) $476.7 $(51.5) $1,893.2Operating margin 21.9% 17.7% 23.2% 22.8% 19.1%
Twelve Months Ended
30 September 2014
Operating income (loss) $762.6 $351.2 $310.4 $(57.3) $379.0 $(78.5) $1,667.4Operating margin 18.7% 16.3% 20.3% 18.4% 16.0%
2016 vs. 2015
Operating income (loss) change $86.8 $52.1 $68.6 $30.3 $53.5 $14.0 $305.3Operating income (loss) % change 11% 16% 18% 59% 11% 27% 16%Operating margin change 490bp 480bp 300bp 350bp 400bp
2015 vs. 2014
Operating income (loss) change $45.8 $(20.5) $70.1 $5.7 $97.7 $27.0 $225.8Operating income (loss) % change 6% (6)% 23% 10% 26% 34% 14%Operating margin change 320bp 140bp 290bp 440bp 310bp
38

Below is a reconciliation of segment operating income to adjusted EBITDA:
IndustrialGases–
Americas
IndustrialGases–
EMEA
IndustrialGases–
Asia
IndustrialGases–
GlobalMaterials
TechnologiesCorporateand other
SegmentTotal
Non-GAAP MeasureTwelve Months Ended
30 September 2016
Operating income (loss) $895.2 $382.8 $449.1 $(21.3) $530.2 $(37.5) $2,198.5Add: Depreciation and amortization 442.5 185.7 197.1 7.9 77.4 15.3 925.9Add: Equity affiliates’ income (loss) 52.7 36.5 57.8 (.1) 1.7 — 148.6
Adjusted EBITDA $1,390.4 $605.0 $704.0 $(13.5) $609.3 $(22.2) $3,273.0Adjusted EBITDA margin(A) 41.6% 35.6% 41.0% 30.2% 34.4%
Twelve Months Ended
30 September 2015
Operating income (loss) $808.4 $330.7 $380.5 $(51.6) $476.7 $(51.5) $1,893.2Add: Depreciation and amortization 416.9 194.3 202.9 16.5 92.8 13.0 936.4Add: Equity affiliates’ income 64.6 42.4 46.1 (.8) 2.2 — 154.5
Adjusted EBITDA $1,289.9 $567.4 $629.5 $(35.9) $571.7 $(38.5) $2,984.1Adjusted EBITDA margin(A) 34.9% 30.4% 38.4% 27.4% 30.2%
Twelve Months Ended
30 September 2014
Operating income (loss) $762.6 $351.2 $310.4 $(57.3) $379.0 $(78.5) $1,667.4Add: Depreciation and amortization 414.4 220.2 205.3 7.1 99.1 10.8 956.9Add: Equity affiliates’ income 60.9 44.1 38.0 5.8 2.6 — 151.4
Adjusted EBITDA $1,237.9 $615.5 $553.7 $(44.4) $480.7 $(67.7) $2,775.7Adjusted EBITDA margin(A) 30.4% 28.6% 36.3% 23.3% 26.6%
2016 vs. 2015
Adjusted EBITDA change $100.5 $37.6 $74.5 $22.4 $37.6 $16.3 $288.9Adjusted EBITDA % change 8% 7% 12% 62% 7% 42% 10%Adjusted EBITDA margin change 670bp 520bp 260bp 280bp 420bp
2015 vs. 2014
Adjusted EBITDA change $52.0 $(48.1) $75.8 $8.5 $91.0 $29.2 $208.4Adjusted EBITDA % change 4% (8)% 14% 19% 19% 43% 8%Adjusted EBITDA margin change 450bp 180bp 210bp 410bp 360bp(A) Adjusted EBITDA margin is calculated by dividing Adjusted EBITDA by sales.
39

INCOME TAXES
The tax impact of our non-GAAP adjustments reflects the expected current and deferred income tax expenseimpact of the transactions and is impacted primarily by the statutory tax rate of the various relevant jurisdictionsand the taxability of the adjustments in those jurisdictions.
Effective Tax Rate
2016 2015 2014
Income Tax Provision—GAAP $586.5 $418.3 $369.4
Income from Continuing Operations before Taxes—GAAP $2,132.2 $1,742.7 $1,365.4
Effective Tax Rate—GAAP 27.5% 24.0% 27.1%
Income Tax Provision—GAAP $586.5 $418.3 $369.4Business separation costs 3.9 — —Tax costs associated with business separation (51.8) — —Business restructuring and cost reduction actions 9.9 54.5 4.5Pension settlement loss 2.3 7.5 1.9Goodwill and intangible asset impairment charge — — 1.3Gain on previously held equity interest — (6.7) —Gain on land sales — (5.3) —Loss on extinguishment of debt 2.6 2.4 —Chilean tax rate change — — (20.6)Tax election benefit — — 51.6
Income Tax Provision—Non-GAAP Measure $553.4 $470.7 $408.1
Income from Continuing Operations before Taxes—GAAP $2,132.2 $1,742.7 $1,365.4Business separation costs 52.2 7.5 —Business restructuring and cost reduction actions 33.9 207.7 12.7Pension settlement loss 6.4 21.2 5.5Goodwill and intangible asset impairment charge — — 310.1Gain on previously held equity interest — (17.9) —Gain on land sales — (33.6) —Loss on extinguishment of debt 6.9 16.6 —
Income from Continuing Operations Before Taxes—Non-GAAP Measure $2,231.6 $1,944.2 $1,693.7
Effective Tax Rate—Non-GAAP Measure 24.8% 24.2% 24.1%
40
LIQUIDITY AND CAPITAL RESOURCES
We maintained a strong financial position throughout 2016 and as of 30 September 2016 our consolidatedbalance sheet included cash and cash items of $1,501.3. The cash and cash items balance is higher than ourhistorical trend and primarily results from transactions related to the anticipated spin-off of Versum and positiveoperating cash flows. Approximately $1,000.0 of debt was raised by Versum in September which included a$575.0 term loan that drove an increase in cash and cash items. We expect our cash balance and cash flowsfrom operating and financing activities to meet liquidity needs for the foreseeable future.
As of 30 September 2016, we had $545.3 of foreign cash and cash items compared to a total amount of cash andcash items of $1,501.3. If the foreign cash and cash items are needed for operations in the U.S. or we otherwiseelect to repatriate the funds, we may be required to accrue and pay U.S. taxes on a significant portion of theseamounts. However, since we have significant current investment plans outside the U.S., it is our intent topermanently reinvest the majority of our foreign cash and cash items outside the U.S. Current financingalternatives do not require the repatriation of foreign funds.
Our cash flows from operating, investing, and financing activities from continuing operations, as reflected in theconsolidated statements of cash flows, are summarized in the following table:
2016 2015 2014
Cash provided by (used for)
Operating activities $2,707.4 $2,446.4 $2,190.1Investing activities (972.0) (1,250.5) (1,316.5)Financing activities (271.1) (945.4) (504.3)
Operating Activities
For the year ended 2016, cash provided by operating activities was $2,707.4. Income from continuing operationsof $1,515.3 included a loss on extinguishment of debt of $6.9. Income from continuing operations is adjusted forreconciling items that include depreciation and amortization, deferred income taxes, share-based compensation,noncurrent capital lease receivables, and undistributed earnings of unconsolidated affiliates. Other adjustments of$155.2 were primarily driven by the remeasurement of intercompany transactions as the related hedginginstruments that eliminate the earnings impact are included in other receivables and payables and accruedliabilities. The working capital accounts were a use of cash of $20.1 that were primarily driven by tradereceivables and other working capital partially offset by payables and accrued liabilities. The use of cash fromother working capital of $57.4 was primarily driven by advances associated with the purchase of helium. Theincrease in payables and accrued liabilities of $57.0 was primarily related to an increase in customer advanceswhich includes payment from our joint venture in Jazan, Saudi Arabia and was partially offset by the changes inthe fair value of foreign exchange contracts that hedge intercompany loans.
For the year ended 2015, cash provided by operating activities was $2,446.4. Income from continuing operationsof $1,284.7 included the write-down of long-lived assets associated with business restructuring of $47.4, a non-cash gain on the previously held equity interest of $17.9, and a loss on extinguishment of debt of $16.6. Otheradjustments included pension and postretirement expense of $141.4 and contributions to our pension plans of$137.5, primarily for plans in the U.S. and U.K. Management considers various factors when making pensionfunding decisions, including tax, cash flow, and regulatory implications. The working capital accounts were asource of cash of $224.7. The increase of payables and accrued liabilities of $156.2 includes an increase inaccrued incentive compensation of $97.0.
For the year ended 2014, cash provided by operating activities was $2,190.1. Income from continuing operationsof $994.6 included the goodwill and intangible asset impairment charge of $310.1. Other adjustments included$143.2 for pension and other postretirement expense, partially offset by a use of cash of $78.2 for pensioncontributions. The working capital accounts were a use of cash of $250.0. Inventory was a use of cash of $23.5primarily due to the timing of helium purchases. The reduction of payables and accrued liabilities of $237.9includes $148.5 for payments associated with projects accounted for as capital leases and $52.5 of paymentsrelated to the 2013 business restructuring and cost reduction plan.
41

Investing Activities
For the year ended 30 September 2016, cash used for investing activities was $972.0, driven by capitalexpenditures for plant and equipment of $1,055.8. Proceeds from the sale of assets and investments of $85.5was primarily driven by the receipt of $30.0 for our rights to a corporate aircraft that was under construction, $15.9for the sale of our 20% equity investment in Daido Air Products Electronics, Inc., and $14.9 for the sale of a whollyowned subsidiary located in Wuhu, China.
For the year ended 30 September 2015, cash used for investing activities was $1,250.5, primarily capitalexpenditures for plant and equipment. On 30 December 2014, we acquired our partner’s equity ownership interestin a liquefied atmospheric industrial gases production joint venture in North America which increased ourownership from 50% to 100%. Refer to Note 6, Business Combination, to the consolidated financial statementsfor additional information.
For the year ended 30 September 2014, cash used for investing activities was $1,316.5, primarily capitalexpenditures for plant and equipment. Refer to the Capital Expenditures section below for additional detail.
Capital Expenditures
Capital expenditures are detailed in the following table:
2016 2015 2014
Additions to plant and equipment $1,055.8 $1,265.6 $1,362.7Acquisitions, less cash acquired — 34.5 —Investments in and advances to unconsolidated affiliates — 4.3 (2.0)
Capital Expenditures on a GAAP Basis $1,055.8 $1,304.4 $1,360.7Capital lease expenditures(A) 27.2 95.6 202.4Purchase of noncontrolling interests in a subsidiary(A) — 278.4 .5
Capital Expenditures on a Non-GAAP Basis $1,083.0 $1,678.4 $1,563.6(A) We utilize a non-GAAP measure in the computation of capital expenditures and include spending associated with facilities
accounted for as capital leases and purchases of noncontrolling interests. Certain contracts associated with facilities that are builtto provide product to a specific customer are required to be accounted for as leases, and such spending is reflected as a use ofcash within cash provided by operating activities, if the arrangement qualifies as a capital lease. Additionally, the purchase ofsubsidiary shares from noncontrolling interests is accounted for as a financing activity in the statement of cash flows. Thepresentation of this non-GAAP measure is intended to enhance the usefulness of information by providing a measure that ourmanagement uses internally to evaluate and manage our expenditures.
Capital expenditures on a GAAP basis in 2016 totaled $1,055.8, compared to $1,265.6 in 2015. The decrease of$209.8 was primarily due to the completion of major projects in 2016 and 2015. Additions to plant and equipmentalso included support capital of a routine, ongoing nature, including expenditures for distribution equipment andfacility improvements. Spending in 2016 and 2015 included plant and equipment constructed to provide oxygenfor coal gasification in China, hydrogen to the global market, oxygen to the steel industry, nitrogen to theelectronic semiconductor industry, and capacity expansion for the Materials Technologies segment.
Capital expenditures on a non-GAAP basis in 2016 totaled $1,083.0 compared to $1,678.4 in 2015. The decreaseof $595.4 was primarily due to the prior year purchase of the 30.5% equity interest in our Indura S.A. subsidiaryfrom the largest minority shareholder for $277.9. Refer to Note 21, Noncontrolling Interests, to the consolidatedfinancial statements for additional details. Additionally, capital lease expenditures of $27.2, decreased by $68.4,reflecting lower project spending.
On 19 April 2015, a joint venture between Air Products and ACWA Holding entered into a 20-year oxygen andnitrogen supply agreement to supply Saudi Aramco’s oil refinery and power plant being built in Jazan, SaudiArabia. Air Products owns 25% of the joint venture. During 2016 and 2015, we recorded noncash transactionswhich resulted in an increase of $26.9 and $67.5, respectively, to our investment in net assets of and advances toequity affiliates for our obligation to invest in the joint venture. These noncash transactions have been excludedfrom the consolidated statements of cash flows. In total, we expect to invest approximately $100 in this jointventure. Air Products has also entered into a sale of equipment contract with the joint venture to engineer,procure, and construct the industrial gas facilities that will supply the gases to Saudi Aramco.
42
Sales backlog represents our estimate of revenue to be recognized in the future on our share of Air Products’ saleof equipment orders and related process technology that are under firm contracts. The sales backlog for theCompany at 30 September 2016 was $1,057, compared to $1,535 at 30 September 2015. The decrease wasdriven by progress on the Jazan project and completion of LNG orders.
2017 Outlook
Excluding acquisitions, capital expenditures for new plant and equipment in 2017 are expected to beapproximately $1,200. A majority of the total capital expenditures is expected to be for new plants that arecurrently under construction or expected to start construction. It is anticipated that capital expenditures will befunded principally with cash from continuing operations. In addition, we intend to continue to evaluate acquisitionopportunities and investments in equity affiliates.
Financing Activities
For the year ended 2016, cash used for financing activities was $271.1. Our borrowings (short- and long-termproceeds, net of repayments) were a net source of cash (issuance) of $331.2 and included debt proceeds fromthe issuance of a .375% Eurobond of €350 million ($386.9) on 1 June 2016 and the issuance of a $575.0 termloan by Versum in anticipation of the spin-off, partially offset by the repayment of long-term debt, including the2.0% Senior Note of $350.0 million on 2 August 2016, and a $144.2 use of cash for net commercial paper andother short-term debt borrowings. Versum distributed in-kind notes with an aggregate principal amount of $425.0to Air Products. However, since Air Products exchanged these notes with certain financial institutions for $418.3of Air Products’ outstanding commercial paper, this non-cash debt for debt exchange was excluded from theconsolidated statement of cash flows. Refer to Note 15, Debt, to the consolidated financial statements foradditional details. We also used cash to pay dividends of $721.2 and received proceeds from stock optionexercises of $141.3.
For the year ended 2015, cash used for financing activities was $945.4 primarily attributable to cash used to paydividends of $677.5 and payments for subsidiary shares from noncontrolling interest of $278.4, which waspartially offset by proceeds from stock option exercises of $121.3. Our borrowings were a net use of cash of $84.4and included $284.0 of net commercial paper and other short-term debt issuances, debt proceeds from theissuance of a 1.0% Eurobond of €300 million ($335.3), repayment of a 3.875% Eurobond of €300 million ($335.9),repayment of Industrial Revenue Bonds totaling $147.2, and repayment of 3,000,000 Unidades de Fomento(“UF”) Series E 6.30% Bonds totaling $146.6. Refer to Note 15, Debt, to the consolidated financial statements foradditional details.
For the year ended 2014, cash used for financing activities was $504.3 primarily attributable to cash used to paydividends of $627.7 which was partially offset by proceeds from stock options exercised of $141.6. Ourborrowings were a net use of cash (issuance) of $3.5 and included $148.7 of net commercial paper and othershort-term debt issuances, debt proceeds from the issuance of a $400 senior fixed-rate 3.35% note on 31 July2014 and $61.0 of other, primarily international, debt issuances and debt repayments of a 3.75% Eurobond of€300 million ($401.0) in November 2013 and $207.6 of other, primarily international, debt.
Discontinued Operations
For the year ended 2016, discontinued operations primarily includes the Energy-from-Waste business which theCompany decided to exit in the second quarter of 2016. Cash used by discontinued operations was $176.9primarily driven by capital expenditures for plant and equipment of $97.0 and the loss from discontinuedoperations of $37.6. Refer to Note 4, Discontinued Operations, to the consolidated financial statements foradditional information.
For the year ended 2015, cash used by discontinued operations was $357.8. The use of cash was primarilydriven by expenditures for plant and equipment of $349.2 related to the Energy-from-Waste facilities. Refer toNote 4, Discontinued Operations, to the consolidated financial statements for additional information.
For the year ended 2014, cash used by discontinued operations was $471.8. The use of cash was driven bycapital expenditures of $321.5 for our Energy-from-Waste facilities and a payment made to the Linde Group forcontingent proceeds we were obligated to return from the sale of our Homecare business of $157.1. Refer to Note4, Discontinued Operations, to the consolidated financial statements for additional information.
43
Financing and Capital Structure
Capital needs in 2016 were satisfied primarily with cash from operations. At the end of 2016, total debtoutstanding was $6,225.2 compared to $5,879.0 at the end of 2015, and cash and cash items were $1,501.3compared to $206.4 at the end of 2015. Total debt at 30 September 2016 and 2015, expressed as a percentageof total capitalization (total debt plus total equity), was 46.3% and 44.3%, respectively.
During fiscal 2013, we entered into a five-year $2,500.0 revolving credit agreement maturing 30 April 2018 with asyndicate of banks (the “2013 Credit Agreement”), under which senior unsecured debt is available to both theCompany and certain of its subsidiaries. There have been subsequent amendments to the 2013 CreditAgreement, and as of 30 September 2016, the maximum borrowing capacity was $2,690.0. The 2013 CreditAgreement provides a source of liquidity for the Company and supports its commercial paper program. This creditfacility includes a financial covenant for a maximum ratio of total debt to total capitalization no greater than 70%.No borrowings were outstanding under the 2013 Credit Agreement as of 30 September 2016.
During September 2016, in anticipation of the Versum spin-off, Versum entered into certain financing transactionsto allow for a cash distribution of $550.0 and a distribution in-kind of notes issued by Versum with an aggregateprincipal amount of $425.0 to Air Products. Air Products then exchanged these notes with certain financialinstitutions for $418.3 of Air Products’ outstanding commercial paper. Since Versum debt was issued inSeptember but Versum did not become a separate entity until 1 October 2016, Air Products’ consolidated balancesheet includes the Versum debt. The $575.0 term loan and the $425.0 of notes were included in the Versum spin-off transaction and do not represent obligation of the Company in the future. In addition, Versum entered into asenior secured first lien revolving credit facility (Versum Revolving Facility) in an aggregate principal amount of$200.0 that matures on 30 September 2021. Lenders under the Revolving Facility have a maximum first lien netleverage ratio covenant (total debt net of cash on hand to total adjusted EBITDA) of 3.25:1.00 and certain othercustomary covenants. No borrowings were outstanding on the Versum Revolving Facility as of 30 September2016. Refer to Note 3, Materials Technologies Separation, to the consolidated financial statements for additionaldetails.
Commitments totaling $51.3 are maintained by our foreign subsidiaries, all of which was borrowed andoutstanding at 30 September 2016.
As of 30 September 2016, we are in compliance with all of the financial and other covenants under our debtagreements.
On 15 September 2011, the Board of Directors authorized the repurchase of up to $1,000 of our outstandingcommon stock. We did not purchase any of our outstanding shares during fiscal years 2016, 2015 or 2014. At30 September 2016, $485.3 in share repurchase authorization remains.
2017 Outlook
Cash flows from operations and financing activities are expected to meet liquidity needs for the foreseeable futureand our working capital balance was $1,034.0 at 30 September 2016. We expect that we will continue to be incompliance with all of our financial covenants.
We expect to utilize the proceeds from the distribution from Versum to pay down debt, largely commercial paper,in the first quarter of fiscal 2017.
Dividends
Dividends are declared by the Board of Directors and are usually paid during the sixth week after the close of thefiscal quarter. During 2016, the Board of Directors increased the quarterly dividend from $.81 per share to $.86per share.
44

CONTRACTUAL OBLIGATIONS
We are obligated to make future payments under various contracts, such as debt agreements, lease agreements,unconditional purchase obligations, and other long-term obligations. The following table summarizes ourobligations as of 30 September 2016:
Total 2017 2018 2019 2020 2021 Thereafter
Long-term debt obligationsDebt maturities $5,289 $371 $419 $407 $353 $417 $3,322Contractual interest 880 131 119 117 99 91 323
Capital leases 31 2 1 2 2 3 21Operating leases 355 71 62 50 38 32 102Pension obligations 1,211 67 50 51 52 56 935Unconditional purchase obligations 5,331 942 525 307 298 276 2,983Obligation for future contribution to an equity affiliate 100 — — — 100 — —
Total Contractual Obligations $13,197 $1,584 $1,176 $934 $942 $875 $7,686
Long-Term Debt Obligations
The long-term debt obligations include the maturity payments of long-term debt, including current portion, and therelated contractual interest obligations. Refer to Note 15, Debt, to the consolidated financial statements foradditional information on long-term debt.
Contractual interest is the interest we are contracted to pay on the long-term debt obligations without taking intoaccount the interest impact of interest rate swaps related to any of this debt, which at current interest rates wouldslightly decrease contractual interest. We had $1,396 of long-term debt subject to variable interest rates at30 September 2016, excluding fixed-rate debt that has been swapped to variable-rate debt. The rate assumed forthe variable interest component of the contractual interest obligation was the rate in effect at 30 September 2016.Variable interest rates are primarily determined by interbank offer rates and by U.S. short-term tax-exemptinterest rates.
Consistent with the debt maturities table within Note 15, Debt, the long-term debt obligations reflect financingentered into in anticipation of the spin-off of EMD as Versum Materials, Inc. The spin-off was completed on1 October 2016 and the related debt of $997.2 was maintained by Versum.
Leases
Refer to Note 12, Leases, to the consolidated financial statements for additional information on capital andoperating leases.
Pension Obligations
The amounts in the table above represent the current estimated cash payments to be made by us that in totalequal the recognized pension liabilities. Refer to Note 16, Retirement Benefits, to the consolidated financialstatements. These payments are based upon the current valuation assumptions and regulatory environment.
The total accrued liability for pension benefits is impacted by interest rates, plan demographics, actual return onplan assets, continuation or modification of benefits, and other factors. Such factors can significantly impact theamount of the liability and related contributions.
Unconditional Purchase Obligations
Approximately $4,000 of our unconditional purchase obligations relate to helium purchases, which include crudefeedstock supply to multiple helium refining plants in North America as well as refined helium purchases fromsources around the world. As a rare byproduct of natural gas production in the energy sector, these heliumsourcing agreements are medium- to long-term and contain take-or-pay provisions. The refined helium isdistributed globally and sold as a merchant gas, primarily under medium-term requirements contracts. Whilecontract terms in the energy sector are longer than those in merchant, helium is a rare gas used in applicationswith few or no substitutions because of its unique physical and chemical properties.
Approximately $330 of our long-term unconditional purchase obligations relate to feedstock supply for numerousHyCO (hydrogen, carbon monoxide, and syngas) facilities. The price of feedstock supply is principally related to
45
the price of natural gas. However, long-term take-or-pay sales contracts to HyCO customers are generallymatched to the term of the feedstock supply obligations and provide recovery of price increases in the feedstocksupply. Due to the matching of most long-term feedstock supply obligations to customer sales contracts, we donot believe these purchase obligations would have a material effect on our financial condition or results ofoperations. Refer to Note 17, Commitments and Contingencies, to the consolidated financial statements foradditional information on our unconditional purchase obligations.
The unconditional purchase obligations also include other product supply and purchase commitments and electricpower and natural gas supply purchase obligations, which are primarily pass-through contracts with ourcustomers.
Purchase commitments to spend approximately $350 for additional plant and equipment are included in theunconditional purchase obligations in 2017. In addition, we have purchase commitments totaling approximately$500 in 2017 and 2018 relating to our long-term sale of equipment project for Saudi Aramco’s Jazan oil refinery.
We also purchase materials, energy, capital equipment, supplies, and services as part of the ordinary course ofbusiness under arrangements that are not unconditional purchase obligations. The majority of such purchases arefor raw materials and energy, which are obtained under requirements-type contracts at market prices.
Obligation for Future Contribution to an Equity Affiliate
On 19 April 2015, a joint venture between Air Products and ACWA Holding entered into a 20-year oxygen andnitrogen supply agreement to supply Saudi Aramco’s oil refinery and power plant being built in Jazan, SaudiArabia. Air Products owns 25% of the joint venture and guarantees the repayment of its share of an equity bridgeloan. In total, we expect to invest approximately $100 in this joint venture. As of 30 September 2016, we recordeda noncurrent liability of $94.4 for our obligation to make future equity contributions based on our proportionateshare of the advances received by the joint venture under the loan.
Income Tax Liabilities
Noncurrent deferred income tax liabilities as of 30 September 2016 were $767.1. Tax liabilities related tounrecognized tax benefits as of 30 September 2016 were $106.9. These tax liabilities were excluded from theContractual Obligations table, as it is impractical to determine a cash impact by year given that payments will varyaccording to changes in tax laws, tax rates, and our operating results. In addition, there are uncertainties in timingof the effective settlement of our uncertain tax positions with respective taxing authorities. Refer to Note 23,Income Taxes, to the consolidated financial statements for additional information.
PENSION BENEFITS
The Company and certain of its subsidiaries sponsor defined benefit pension plans and defined contribution plansthat cover a substantial portion of its worldwide employees. The principal defined benefit pension plans are theU.S. salaried pension plan and the U.K. pension plan. These plans were closed to new participants in 2005 andwere replaced with defined contribution plans. Over the long run, the shift to defined contribution plans isexpected to reduce volatility of both plan expense and contributions.
The fair market value of plan assets for our defined benefit pension plans as of the 30 September 2016measurement date increased to $4,116.4 from $3,916.4 at the end of fiscal year 2015. The projected benefitobligation for these plans was $5,327.3 and $4,787.8 at the end of the fiscal years 2016 and 2015, respectively.The net unfunded liability increased by approximately $340 from $871 to $1,211 due primarily to lower discountrates. Refer to Note 16, Retirement Benefits, to the consolidated financial statements for comprehensive anddetailed disclosures on our postretirement benefits.
46

Pension Expense
2016 2015 2014
Pension expense $68.1 $135.6 $135.9Special terminations, settlements, and curtailments (included above) 7.3 35.2 5.8Weighted average discount rate(A) 4.1% 4.0% 4.6%Weighted average expected rate of return on plan assets 7.5% 7.4% 7.7%Weighted average expected rate of compensation increase 3.5% 3.5% 3.9%(A) Effective in 2016, the Company began to measure the service cost and interest cost components of pension expense by
applying spot rates along the yield curve to the relevant projected cash flows, as we believe this provides a bettermeasurement of these costs. The Company has accounted for this as a change in accounting estimate and, accordinglyhas accounted for it on a prospective basis. This change does not affect the measurement of the total benefit obligation.
2016 vs. 2015
Pension expense, excluding special items, decreased from the prior year due to the adoption of the spot rateapproach which reduced service cost and interest cost, the impact from expected return on assets anddemographic gains, partially offset by the impact of the adoption of new mortality tables for our major plans.Special items of $7.3 included pension settlement losses of $6.4, special termination benefits of $2.0, andcurtailment gains of $1.1. These resulted primarily from our recent business restructuring and cost reductionactions.
2015 vs. 2014
The decrease in pension expense, excluding special items, was due to the impact from expected return onassets, a 40 bp reduction in the weighted average compensation increase assumption, and lower service costand interest cost. The decrease was partially offset by the impact of higher amortization of actuarial losses, whichresulted primarily from a 60 bp decrease in weighted average discount rate. Special items of $35.2 includedpension settlement losses of $21.2, special termination benefits of $8.7, and curtailment losses of $5.3. Theseresulted primarily from our recent business restructuring and cost reduction actions.
2017 Outlook
In 2017, pension expense, excluding special items, is estimated to be approximately $70 to $75, an increase of$10 to $15 from 2016, resulting primarily from a decrease in discount rates, offset by favorable asset experience,effects of the Versum spin-off and the adoption of new mortality tables. Pension settlement losses of $10 to $15are expected, dependent on the timing of retirements. In 2017, we expect pension expense to includeapproximately $164 for amortization of actuarial losses compared to $121 in 2016. Net actuarial losses of $484were recognized in accumulated other comprehensive income in 2016, primarily attributable to lower discountrates and improved mortality projections. Actuarial gains/losses are amortized into pension expense overprospective periods to the extent they are not offset by future gains or losses. Future changes in the discount rateand actual returns on plan assets different from expected returns would impact the actuarial gains/losses andresulting amortization in years beyond 2017.
During the first quarter of 2017, the Company expects to record a curtailment loss estimated to be $5 to $10related to employees transferring to Versum. The loss will be reflected in the results from discontinued operationson the consolidated income statements. We continue to evaluate opportunities to manage the liabilities associatedwith our pension plans.
Pension Funding
Pension funding includes both contributions to funded plans and benefit payments for unfunded plans, which areprimarily non-qualified plans. With respect to funded plans, our funding policy is that contributions, combined withappreciation and earnings, will be sufficient to pay benefits without creating unnecessary surpluses.
In addition, we make contributions to satisfy all legal funding requirements while managing our capacity to benefitfrom tax deductions attributable to plan contributions. With the assistance of third party actuaries, we analyze theliabilities and demographics of each plan, which help guide the level of contributions. During 2016 and 2015, ourcash contributions to funded plans and benefit payments for unfunded plans were $79.3 and $137.5, respectively.
For 2017, cash contributions to defined benefit plans are estimated to be $65 to $85. The estimate is based onexpected contributions to certain international plans and anticipated benefit payments for unfunded plans, which
47

are dependent upon the timing of retirements and future cost reduction actions. Actual future contributions willdepend on future funding legislation, discount rates, investment performance, plan design, and various otherfactors. Refer to the Contractual Obligations discussion on page 45 for a projection of future contributions.
ENVIRONMENTAL MATTERS
We are subject to various environmental laws and regulations in the countries in which we have operations.Compliance with these laws and regulations results in higher capital expenditures and costs. In the normal courseof business, we are involved in legal proceedings under the Comprehensive Environmental Response,Compensation, and Liability Act (CERCLA: the federal Superfund law); Resource Conservation and Recovery Act(RCRA); and similar state and foreign environmental laws relating to the designation of certain sites forinvestigation or remediation. Our accounting policy for environmental expenditures is discussed in Note 1, MajorAccounting Policies, to the consolidated financial statements, and environmental loss contingencies are discussedin Note 17, Commitments and Contingencies, to the consolidated financial statements.
The amounts charged to income from continuing operations related to environmental matters totaled $27.0,$28.3, and $35.1 in 2016, 2015, and 2014, respectively. These amounts represent an estimate of expenses forcompliance with environmental laws and activities undertaken to meet internal Company standards. Future costsare not expected to be materially different from these amounts. Refer to Note 17, Commitments andContingencies, to the consolidated financial statements for additional information.
Although precise amounts are difficult to determine, we estimate that we spent $7 and $4 in 2016 and 2015,respectively, on capital projects to control pollution. Capital expenditures to control pollution in future years areestimated to be approximately $3 in both 2017 and 2018.
We accrue environmental investigatory and remediation costs for identified sites when it is probable that a liabilityhas been incurred and the amount of loss can be reasonably estimated. The potential exposure for such costs isestimated to range from $81 to a reasonably possible upper exposure of $95 as of 30 September 2016. Theconsolidated balance sheets at 30 September 2016 and 2015 included an accrual of $81.4 and $80.6,respectively. The accrual for the environmental obligations includes amounts for the Pace, Florida; Piedmont,South Carolina; and Pasadena, Texas, locations which were a part of previously divested chemicals businesses.Refer to Note 17, Commitments and Contingencies, to the consolidated financial statements for further details onthese facilities.
Actual costs to be incurred at identified sites in future periods may vary from the estimates, given inherentuncertainties in evaluating environmental exposures. Subject to the imprecision in estimating future environmentalcosts, we do not expect that any sum we may have to pay in connection with environmental matters in excess ofthe amounts recorded or disclosed above would have a material adverse impact on our financial position orresults of operations in any one year.
Some of our operations are within jurisdictions that have or are developing regulations governing emissions ofgreenhouse gases (GHG). These include existing and expanding coverage under the European Union EmissionsTrading Scheme, California’s cap and trade scheme, South Korea’s Emission Trading Scheme, Alberta’sSpecified Gases Emitter Regulation and, beginning in 2017, the Ontario cap and trade scheme and ChinaNational Emission Trading Scheme. Where these regulations impose compliance costs on our hydrogenproduction facilities (California, Alberta, and Ontario), we have been able to mitigate the majority of such coststhrough our contractual terms.
Increased public awareness and concern may result in more international, U.S. federal, and/or regionalrequirements to reduce or mitigate the effects of GHG. Although uncertain, these developments could increaseour costs related to consumption of electric power, hydrogen production, and fluorinated gases production. Webelieve we will be able to mitigate some of the potential costs through our contractual terms, but the lack ofdefinitive legislation or regulatory requirements in some of the jurisdictions where we operate prevents accurateprediction of the long-term impact on us. Any legislation that limits or taxes GHG emissions from our facilitiescould impact our growth by increasing our operating costs or reducing demand for certain of our products.
Regulation of GHG may also produce new opportunities for us. We continue to develop technologies to help ourfacilities and our customers lower energy consumption, improve efficiency, and lower emissions. We are alsodeveloping a portfolio of technologies that capture carbon dioxide from power and chemical plants before itreaches the atmosphere, enable cleaner transportation fuels, and facilitate alternate fuel source development. In
48
addition, the potential demand for clean coal and our carbon capture solutions could increase demand for oxygen,one of our main products, and our proprietary technology for delivering low-cost oxygen.
OFF-BALANCE SHEET ARRANGEMENTS
We have entered into certain guarantee agreements as discussed in Note 17, Commitments and Contingencies,to the consolidated financial statements. We are not a primary beneficiary in any material variable interest entity.Our off-balance sheet arrangements are not reasonably likely to have a material impact on financial condition,changes in financial condition, results of operations, or liquidity.
RELATED PARTY TRANSACTIONS
Our principal related parties are equity affiliates operating in the industrial gas business. In 2015, we entered intoa long-term sale of equipment contract to engineer, procure, and construct industrial gas facilities with a 25%owned joint venture for Saudi Aramco’s Jazan oil refinery and power plant in Saudi Arabia. The agreementincluded terms that are consistent with those that we believe would have been negotiated at an arm’s length withan independent party. Sales related to this contract are included in the results of our Industrial Gases – Globalsegment and were approximately $300 during fiscal year 2016 and were not material during fiscal year 2015.
INFLATION
We operate in many countries that experience volatility in inflation and foreign exchange rates. The ability to passon inflationary cost increases is an uncertainty due to general economic conditions and competitive situations. It isestimated that the cost of replacing our plant and equipment today is greater than its historical cost. Accordingly,depreciation expense would be greater if the expense were stated on a current cost basis.
CRITICAL ACCOUNTING POLICIES AND ESTIMATES
Note 1, Major Accounting Policies, to the consolidated financial statements describes our major accountingpolicies. Judgments and estimates of uncertainties are required in applying our accounting policies in many areas.However, application of the critical accounting policies discussed below requires management’s significantjudgments, often as the result of the need to make estimates of matters that are inherently uncertain. If actualresults were to differ materially from the estimates made, the reported results could be materially affected. Ourmanagement has reviewed these critical accounting policies and estimates and related disclosures with our auditcommittee.
Depreciable Lives of Plant and Equipment
Net plant and equipment at 30 September 2016 totaled $8,852.7, and depreciation expense totaled $893.0 during2016. Plant and equipment is recorded at cost and depreciated using the straight-line method, which deductsequal amounts of the cost of each asset from earnings every year over its estimated economic useful life.
Economic useful life is the duration of time an asset is expected to be productively employed by us, which may beless than its physical life. Assumptions on the following factors, among others, affect the determination ofestimated economic useful life: wear and tear, obsolescence, technical standards, contract life, market demand,competitive position, raw material availability, and geographic location.
The estimated economic useful life of an asset is monitored to determine its appropriateness, especially in light ofchanged business circumstances. For example, changes in technology, changes in the estimated future demandfor products, or excessive wear and tear may result in a shorter estimated useful life than originally anticipated. Inthese cases, we would depreciate the remaining net book value over the new estimated remaining life, therebyincreasing depreciation expense per year on a prospective basis. Likewise, if the estimated useful life isincreased, the adjustment to the useful life decreases depreciation expense per year on a prospective basis.
The regional Industrial Gases segments have numerous long-term customer supply contracts for which we constructan on-site plant adjacent to or near the customer’s facility. These contracts typically have initial contract terms of 10to 20 years. Depreciable lives of the production assets related to long-term contracts are matched to the contractlives. Extensions to the contract term of supply frequently occur prior to the expiration of the initial term. As contractterms are extended, the depreciable life of the remaining net book value of the production assets is adjusted tomatch the new contract term, as long as it does not exceed the remaining physical life of the asset.
Our regional Industrial Gases segments also have contracts for liquid or gaseous bulk supply and, for smallercustomers, packaged gases. The depreciable lives of production facilities associated with these contracts are
49

generally 15 years. The depreciable lives of production facilities within the Materials Technologies segment,where there is not an associated long-term supply agreement, range from 10 to 15 years. These depreciable liveshave been determined based on historical experience combined with judgment on future assumptions such astechnological advances, potential obsolescence, competitors’ actions, etc. Management monitors its assumptionsand may potentially need to adjust depreciable life as circumstances change.
A change in the weighted average remaining depreciable life by one year for assets associated with our regionalIndustrial Gases segments and Materials Technologies segment would impact annual depreciation expense assummarized below:
Decrease Life Increase LifeBy 1 Year By 1 Year
Industrial Gases – Regional $36 $(31)Materials Technologies $4 $(3)
Impairment of Assets
Plant and Equipment
Plant and equipment held for use is grouped for impairment testing at the lowest level for which there isidentifiable cash flows. Impairment testing of the asset group occurs whenever events or changes incircumstances indicate that the carrying amount of the assets may not be recoverable. Such circumstances wouldinclude a significant decrease in the market value of a long-lived asset grouping, a significant adverse change inthe manner in which the asset grouping is being used or in its physical condition, an accumulation of costssignificantly in excess of the amount originally expected for the acquisition or construction of the long-lived asset,a history of operating or cash flow losses associated with the use of the asset grouping, or changes in theexpected useful life of the long-lived assets.
If such circumstances are determined to exist, an estimate of undiscounted future cash flows produced by thatasset group is compared to the carrying value to determine whether impairment exists. If an asset group isdetermined to be impaired, the loss is measured based on the difference between the asset group’s fair value andits carrying value. An estimate of the asset group’s fair value is based on the discounted value of its estimatedcash flows. Assets that meet the held for sale criteria are reported at the lower of carrying amount or fair valueless cost to sell.
The assumptions underlying the undiscounted future cash flow projections require significant managementjudgment. Factors that management must estimate include industry and market conditions, sales volume andprices, costs to produce, inflation, etc. The assumptions underlying the cash flow projections representmanagement’s best estimates at the time of the impairment review. Changes in key assumptions or actualconditions that differ from estimates could result in an impairment charge. We use reasonable and supportableassumptions when performing impairment reviews and cannot predict the occurrence of future events andcircumstances that could result in impairment charges.
On 29 March 2016, the Board of Directors approved the Company’s exit of its Energy-from-Waste business.Accordingly, we assessed the recoverability of capital costs for the two projects associated with this business andrecorded an impairment charge of $913.5 to reduce the carrying values of plant assets to their estimated netrealizable value of $20. We estimated the net realizable value of the projects assuming an orderly liquidation ofassets capable of being marketed on a secondary equipment market based on market quotes and our experiencewith selling similar equipment. An asset’s orderly liquidation value is the amount that could be realized from aliquidation sale, given a reasonable period of time to find a buyer, selling the asset in the existing condition whereit is located, and assuming the highest and best use of the asset by market participants. The valuation includesinputs that are unobservable and therefore considered Level 3 inputs in the fair value hierarchy. The loss wasmeasured as the difference between the orderly liquidation value of the assets and the net book value of theassets. Refer to Note 4, Discontinued Operations, for additional information. There have been no significantchanges in the estimated net realizable value as of 30 September 2016.
Goodwill
The acquisition method of accounting for business combinations requires us to make use of estimates andjudgments to allocate the purchase price paid for acquisitions to the fair value of the net tangible and identifiable
50

intangible assets. Goodwill represents the excess of the aggregate purchase price over the fair value ofidentifiable net assets of an acquired entity. Goodwill was $1,150.2 as of 30 September 2016. Disclosures relatedto goodwill are included in Note 10, Goodwill, to the consolidated financial statements.
We review goodwill for impairment annually in the fourth quarter of the fiscal year and whenever events orchanges in circumstances indicate the need for more frequent testing. The tests are done at the reporting unitlevel, which is defined as being equal to or one level below the operating segment for which discrete financialinformation is available and whose operating results are reviewed by segment managers regularly. As of30 September 2016, we had six business segments and thirteen reporting units. Reporting units are primarilybased on products and subregions within each business segment. The majority of our goodwill is assigned toreporting units within the three regional Industrial Gases segments and the Materials Technologies segment.
As part of the goodwill impairment testing, we have the option to first assess qualitative factors to determinewhether it is more likely than not that the fair value of a reporting unit is less than its carrying value. If we choosenot to complete a qualitative assessment for a given reporting unit, or if the initial assessment indicates that it ismore likely than not that the carrying value of a reporting unit exceeds its estimated fair value, a two-stepquantitative test is required. We chose to bypass the qualitative assessment and conduct quantitative testing, asfurther described below.
The first step of the quantitative test requires that we compare the fair value of our reporting units to their carryingvalue, including assigned goodwill. To determine the fair value of a reporting unit, we initially use an incomeapproach valuation model, representing the present value of estimated future cash flows. Our valuation modeluses a discrete growth period and an estimated exit trading multiple. The income approach is an appropriatevaluation method due to our capital-intensive nature, the long-term contractual nature of our business, and therelatively consistent cash flows generated by our reporting units. The principal assumptions utilized in our incomeapproach valuation model include revenue growth rates, operating profit margins, discount rate, and exit multiple.Projected revenue growth rates and operating profit assumptions are consistent with those utilized in ouroperating plan and long-term financial planning process. The discount rate assumption is calculated based on anestimated market-participant risk-adjusted weighted-average cost of capital, which includes factors such as therisk-free rate of return, cost of debt, and expected equity premiums. The exit multiple is determined fromcomparable industry transactions and where appropriate, reflects expected long-term growth rates. If our initialreview under the income approach indicates there may be impairment, we incorporate results under the marketapproach to further evaluate the existence of impairment. When the market approach is utilized, fair value isestimated based on market multiples of revenue and earnings derived from comparable publicly-traded industrialgases companies engaged in the same or similar lines of business as the reporting unit, adjusted to reflectdifferences in size and growth prospects. When both the income and market approach are utilized, we reviewrelevant facts and circumstances and make a qualitative assessment to determine the proper weighting.Management judgment is required in the determination of each assumption utilized in the valuation model, andactual results could differ from the estimates.
If the estimated fair value of the reporting unit is less than the carrying value, we perform the second step of theimpairment test to measure the amount of impairment loss, if any. In the second step, the reporting unit’s fairvalue is allocated to all of the assets and liabilities of the reporting unit, including any unrecognized intangibleassets, in an analysis that calculates the implied fair value of goodwill in the same manner as if the reporting unitwere being acquired in a business combination. If the implied fair value of the reporting unit’s goodwill is less thanthe carrying value, the difference is recorded as an impairment loss.
In 2014, we conducted our annual goodwill impairment testing as of 1 July 2014 and concluded that the goodwillassociated with the Latin America reporting unit was impaired and recorded a non-cash impairment charge of$305.2. The Latin America reporting unit is composed predominately of our Indura business with business units inChile, Colombia, and other Latin America countries, which the Company acquired in 2012.
During the fourth quarter of 2016, we conducted our annual goodwill impairment testing noting no indications ofimpairment. The fair value of all of our reporting units substantially exceeded their carrying value.
The excess of fair value over carrying value for our reporting units ranged from approximately 30% toapproximately 350%. Management judgment is required in the determination of each assumption utilized in thevaluation model, and actual results could differ from the estimates. In order to evaluate the sensitivity of the fairvalue calculation on the goodwill impairment test, we applied a hypothetical 10% decrease to the fair value of
51

these reporting units. In this scenario, the fair value of our reporting units continued to exceed their carrying valueby a range of approximately 15% to 300%.
Future events that could have a negative impact on the level of excess fair value over carrying value of thereporting units include, but are not limited to: long-term economic weakness, decline in market share, pricingpressures, inability to successfully implement cost improvement measures, increases to our cost of capital, andchanges to the structure of our business as a result of future reorganizations or divestitures of assets orbusinesses. Negative changes in one or more of these factors, among others, could result in impairment charges.
We will continue to evaluate goodwill on an annual basis as of the beginning of our fourth fiscal quarter andwhenever there are indicators of potential impairment, such as significant adverse changes in business climate oroperating results or changes in management’s business outlook or strategy.
Intangible Assets
Intangible assets with determinable lives at 30 September 2016 totaled $425.3 and consisted primarily ofcustomer relationships, purchased patents and technology, and land use rights. These intangible assets aretested for impairment as part of the long-lived asset grouping impairment tests. Impairment testing of the assetgroup occurs whenever events or changes in circumstances indicate that the carrying amount of the assets maynot be recoverable. See the impairment discussion above under Plant and Equipment for a description of howimpairment losses are determined.
Indefinite-lived intangible assets at 30 September 2016 totaled $62.7 and consisted of trade names andtrademarks. Indefinite-lived intangibles are subject to impairment testing at least annually or more frequently ifevents or changes in circumstances indicate that potential impairment exists. The impairment test for indefinite-lived intangible assets encompasses calculating the fair value of the indefinite-lived intangible assets andcomparing the fair value to their carrying value. If the fair value is less than the carrying value, the difference isrecorded as an impairment loss. To determine fair value, we utilize the royalty savings method, a form of theincome approach. This method values an intangible asset by estimating the royalties avoided through ownershipof the asset.
In the fourth quarter of 2014, we conducted our annual impairment test and determined that our indefinite-livedintangible assets were impaired. Refer to Note 11, Intangible Assets, to the consolidated financial statements foradditional information.
In the fourth quarter of 2016, we conducted our annual impairment test of indefinite-lived intangibles and found noindications of impairment.
Equity Investments
Investments in and advances to equity affiliates totaled $1,288.1 at 30 September 2016. The majority of ourinvestments are non-publicly traded ventures with other companies in the industrial gas business. Summarizedfinancial information of equity affiliates is included in Note 8, Summarized Financial Information of Equity Affiliates,to the consolidated financial statements. Equity investments are reviewed for impairment whenever events orchanges in circumstances indicate that the carrying amount of the investment may not be recoverable.
In the event that a decline in fair value of an investment occurs, and the decline in value is considered to be otherthan temporary, an impairment loss would be recognized. Management’s estimate of fair value of an investment isbased on estimated discounted future cash flows expected to be generated by the investee. Changes in keyassumptions about the financial condition of an investee or actual conditions that differ from estimates could resultin an impairment charge.
Revenue Recognition- Percentage-of-Completion Method
Revenue from equipment sale contracts is recorded primarily using the percentage-of-completion method. Underthis method, revenue from the sale of major equipment, such as liquefied natural gas (LNG) heat exchangers andlarge air separation units, is recognized based on labor hours or costs incurred to date compared with totalestimated labor hours or costs to be incurred, depending on the nature of the project and the best measure ofprogress toward completion. We estimate the profit on a contract as the difference between the total estimatedrevenue and expected costs to complete the contract and recognize the profit over the life of the contract.
Accounting for contracts using the percentage-of-completion method requires management judgment relative toassessing risks and their impact on the estimate of revenues and costs. Our estimates are impacted by factors
52
such as the potential for incentives or penalties on performance, schedule and technical issues, labor productivity,the complexity of work performed, the cost and availability of materials, and performance of subcontractors. Whenadjustments in estimated total contract revenues or estimated total costs or labor hours are required, any changesin the estimated profit from prior estimates are recognized in the current period for the inception-to-date effect ofsuch change. When estimates of total costs to be incurred on a contract exceed estimates of total revenues to beearned, a provision for the entire estimated loss on the contract is recorded in the period in which the loss isdetermined.
Our Jazan large air separation unit sale of equipment project within our Industrial Gases – Global segment spansseveral years. In addition to the typical risks associated with underlying performance of project procurement andconstruction activities, this project requires monitoring of risks associated with schedule, geography, and otheraspects of the contract and their effects on our estimates of total revenues and total costs to complete thecontract. Given the revenue and cost uncertainties associated with these risks, we recognized revenue and costwith no estimated profit through the third quarter of 2016. During the fourth quarter of 2016, as a result ofprogress toward completion and a reassessment of revenue and cost risks, we changed our estimated profit onthe project and recognized the inception-to-date effect of that change associated with approximately $300 ofrevenue.
Changes in estimates on projects accounted for under the percentage-of-completion method, including the Jazanproject, favorably impacted operating income by approximately $20 in fiscal year 2016, primarily during the fourthquarter. Our changes in estimates would not have significantly impacted amounts recorded in prior years.Changes in estimates during fiscal years 2015 and 2014 were not significant.
We assess the performance of our sale of equipment projects as they progress. Our earnings could be positivelyor negatively impacted by changes to our forecast of revenues and costs on these projects.
Income Taxes
We account for income taxes under the asset and liability method. Under this method, deferred tax assets andliabilities are recognized for the tax effects of temporary differences between the financial reporting and tax basesof assets and liabilities measured using enacted tax rates in effect for the year in which the differences areexpected to be recovered or settled. At 30 September 2016, accrued income taxes and net deferred tax liabilitiesamounted to $146.6 and $574.4, respectively. Tax liabilities related to uncertain tax positions as of 30 September2016 were $106.9, excluding interest and penalties. Income tax expense for the year ended 30 September 2016was $586.5. Disclosures related to income taxes are included in Note 23, Income Taxes, to the consolidatedfinancial statements.
Management judgment is required concerning the ultimate outcome of tax contingencies and the realization ofdeferred tax assets.
Actual income taxes paid may vary from estimates, depending upon changes in income tax laws, actual results ofoperations, and the final audit of tax returns by taxing authorities. Tax assessments may arise several years aftertax returns have been filed. We believe that our recorded tax liabilities adequately provide for these assessments.
Deferred tax assets are recorded for operating losses and tax credit carryforwards. However, when we do notexpect sufficient sources of future taxable income to realize the benefit of the operating losses or tax creditcarryforwards, these deferred tax assets are reduced by a valuation allowance. A valuation allowance isrecognized if, based on the weight of available evidence, it is considered more likely than not that some portion orall of the deferred tax asset will not be realized. The factors used to assess the likelihood of realization includeforecasted future taxable income and available tax planning strategies that could be implemented to realize orrenew net deferred tax assets in order to avoid the potential loss of future tax benefits. The effect of a change inthe valuation allowance is reported in the income tax expense.
A 1% point increase/decrease in our effective tax rate would decrease/increase net income by approximately $21.
Pension and Other Postretirement Benefits
The amounts recognized in the consolidated financial statements for pension and other postretirement benefitsare determined on an actuarial basis utilizing numerous assumptions. The discussion that follows providesinformation on the significant assumptions and expense associated with the defined benefit plans.
53
Actuarial models are used in calculating the expense and liability related to the various defined benefit plans.These models have an underlying assumption that the employees render service over their service lives on arelatively consistent basis; therefore, the expense of benefits earned should follow a similar pattern.
Several assumptions and statistical variables are used in the models to calculate the expense and liability relatedto the plans. We determine assumptions about the discount rate, the expected rate of return on plan assets, andthe rate of compensation increase. Note 16, Retirement Benefits, to the consolidated financial statementsincludes disclosure of these rates on a weighted-average basis for both the domestic and international plans. Theactuarial models also use assumptions about demographic factors such as retirement age, mortality, and turnoverrates. We believe the actuarial assumptions are reasonable. However, actual results could vary materially fromthese actuarial assumptions due to economic events and different rates of retirement, mortality, and turnover. Infiscal year 2016, the beginning-of-year projected benefit obligation and benefit costs for the U.S. plans reflect theadoption of the new Society of Actuaries RP-2014 mortality table projected with Scale BB-2D. As of30 September 2016, the projected benefit obligation reflects the adoption of the new mortality projection scaleMP-2016 for the U.S. plans. Our mortality assumptions will differ from the IRS mortality assumptions used todetermine funding valuations, as the IRS is not expected to adopt the new tables until 2018 or later.
One of the assumptions used in the actuarial models is the discount rate used to measure benefit obligations.This rate reflects the prevailing market rate for high-quality, fixed-income debt instruments with maturitiescorresponding to the expected timing of benefit payments as of the annual measurement date for each of thevarious plans. Effective in 2016, the Company began to measure the service cost and interest cost components ofpension expense by applying spot rates along the yield curve to the relevant projected cash flows, as we believethis provides a better measurement of these costs. The Company has accounted for this as a change inaccounting estimate and, accordingly has accounted for it on a prospective basis. This change does not affect themeasurement of the total benefit obligation. The rate is used to discount the future cash flows of benefitobligations back to the measurement date. This rate will change from year-to-year based on market conditionsthat affect corporate bond yields. A higher discount rate decreases the present value of the benefit obligationsand results in lower pension expense. A 50 bp increase/decrease in the discount rate decreases/increasespension expense by approximately $33 per year.
The expected rate of return on plan assets represents an estimate of the average rate of return to be earned byplan assets over the period that the benefits included in the benefit obligation are to be paid. The expected returnon plan assets assumption is based on a weighted average of estimated long-term returns of major asset classesand the historical performance of plan assets. In determining estimated asset class returns, we take into accounthistorical and future expected long-term returns and the value of active management, as well as the interest rateenvironment. Asset allocation is determined based on long-term return, volatility and correlation characteristics ofthe asset classes, the profiles of the plans’ liabilities, and acceptable levels of risk. Lower returns on the planassets result in higher pension expense. A 50 bp increase/decrease in the estimated rate of return on plan assetsdecreases/increases pension expense by approximately $19 per year.
We use a market-related valuation method for recognizing certain investment gains or losses for our significantpension plans. Investment gains or losses are the difference between the expected return and actual return onplan assets. The expected return on plan assets is determined based on a market-related value of plan assets.For equities, this is a calculated value that recognizes investment gains and losses in fair value related to equitiesover a five-year period from the year in which they occur and reduces year-to-year volatility. The market-relatedvalue for fixed income investments equals the actual fair value. Expense in future periods will be impacted asgains or losses are recognized in the market-related value of assets.
The expected rate of compensation increase is another key assumption. We determine this rate based on reviewof the underlying long-term salary increase trend characteristic of labor markets and historical experience, as wellas comparison to peer companies. A 50 bp increase/decrease in the expected rate of compensation increases/decreases pension expense by approximately $16 per year.
Loss Contingencies
In the normal course of business we encounter contingencies, i.e., situations involving varying degrees ofuncertainty as to the outcome and effect on us. We accrue a liability for loss contingencies when it is consideredprobable that a liability has been incurred and the amount of loss can be reasonably estimated. When only arange of possible loss can be established, the most probable amount in the range is accrued. If no amount within
54
this range is a better estimate than any other amount within the range, the minimum amount in the range isaccrued.
Contingencies include those associated with litigation and environmental matters, for which our accounting policyis discussed in Note 1, Major Accounting Policies, to the consolidated financial statements, and particulars areprovided in Note 17, Commitments and Contingencies, to the consolidated financial statements. Significantjudgment is required in both determining probability and whether the amount of loss associated with acontingency can be reasonably estimated. These determinations are made based on the best availableinformation at the time. As additional information becomes available, we reassess probability and estimates ofloss contingencies. Revisions in the estimates associated with loss contingencies could have a significant impacton our results of operations in the period in which an accrual for loss contingencies is recorded or adjusted. Forexample, due to the inherent uncertainties related to environmental exposures, a significant increase toenvironmental liabilities could occur if a new site is designated, the scope of remediation is increased, or ourproportionate share is increased. Similarly, a future charge for regulatory fines or damage awards associated withlitigation could have a significant impact on our net income in the period in which it is recorded.
NEW ACCOUNTING GUIDANCE
As of the first quarter of fiscal year 2016, we adopted guidance on the presentation of deferred income taxes thatresulted in all deferred tax liabilities and assets being classified as noncurrent on the balance sheet. Accordingly,prior year amounts were reclassified to conform to the current year presentation. The guidance, which did notchange the existing requirement to net deferred tax assets and liabilities within a jurisdiction, resulted in areclassification adjustment that increased noncurrent deferred tax assets by $13.7 and decreased noncurrentdeferred tax liabilities by $99.9 as of 30 September 2015.
See Note 2, New Accounting Guidance, to the consolidated financial statements for information concerning theimplementation and impact of new accounting guidance.
FORWARD-LOOKING STATEMENTS
This Management’s Discussion and Analysis contains “forward-looking statements” within the safe harborprovisions of the Private Securities Litigation Reform Act of 1995, including statements about business outlook.These forward-looking statements are based on management’s reasonable expectations and assumptions as ofthe date of this report. Actual performance and financial results may differ materially from projections andestimates expressed in the forward-looking statements because of many factors not anticipated by management,including, without limitation, global or regional economic conditions and supply and demand dynamics in marketsegments into which the Company sells; significant fluctuations in interest rates and foreign currencies from thatcurrently anticipated; future financial and operating performance of major customers; unanticipated contractterminations or customer cancellations or postponement of projects and sales; asset impairments due toeconomic conditions or specific customer or other events; the impact of competitive products and pricing; ability toprotect and enforce the Company’s intellectual property rights; unexpected changes in raw material supply andmarkets; the impact of price fluctuations in natural gas and disruptions in markets and the economy due to oilprice volatility; the ability to recover increased energy and raw material costs from customers; costs and outcomesof litigation or regulatory investigations; the success of productivity and cost reduction programs; the timing,impact, and other uncertainties of future acquisitions or divestitures; political risks, including the risks ofunanticipated government actions; acts of war or terrorism; the impact of changes in environmental, tax or otherlegislation and regulatory activities in jurisdictions in which the Company and its affiliates operate; and other riskfactors described in Section 1A, Risk Factors. The Company disclaims any obligation or undertaking todisseminate any updates or revisions to any forward-looking statements contained in this document to reflect anychange in the Company’s assumptions, beliefs or expectations or any change in events, conditions, orcircumstances upon which any such forward-looking statements are based.
ITEM 7A. QUANTITATIVE AND QUALITATIVE DISCLOSURES ABOUT MARKET RISK
Our earnings, cash flows, and financial position are exposed to market risks relating to fluctuations in interestrates and foreign currency exchange rates. It is our policy to minimize our cash flow exposure to adverse changesin currency exchange rates and to manage the financial risks inherent in funding with debt capital.
We address these financial exposures through a controlled program of risk management that includes the use ofderivative financial instruments. We have established counterparty credit guidelines and generally enter into
55
transactions with financial institutions of investment grade or better, thereby minimizing the risk of credit loss. Allinstruments are entered into for other than trading purposes. For details on the types and use of these derivativeinstruments and the major accounting policies, see Note 1, Major Accounting Policies, and Note 13, FinancialInstruments, to the consolidated financial statements, for additional information. Additionally, we mitigate adverseenergy price impacts through our cost pass-through contracts with customers and price increases.
Our derivative and other financial instruments consist of long-term debt (including current portion), interest rateswaps, cross currency interest rate swaps, and foreign exchange-forward contracts. The net market value ofthese financial instruments combined is referred to below as the net financial instrument position and is disclosedin Note 14, Fair Value Measurements, to the consolidated financial statements.
At 30 September 2016 and 2015, the net financial instrument position was a liability of $5,187.7 and $4,452.0,respectively. The increase in the net financial instrument position was primarily due to the issuance of long-termdebt by Versum, which included senior unsecured notes ($425.0) and a fully drawn term loan facility ($575.0).
The analysis below presents the sensitivity of the market value of our financial instruments to selected changes inmarket rates and prices. Market values are the present value of projected future cash flows based on the marketrates and prices chosen. The market values for interest rate risk and foreign currency risk are calculated by ususing a third-party software model that utilizes standard pricing models to determine the present value of theinstruments based on market conditions (interest rates, spot and forward exchange rates, and implied volatilities)as of the valuation date.
Interest Rate Risk
Our debt portfolio as of 30 September 2016, including the effect of currency swap agreements, primarilycomprised debt denominated in U.S. dollars (37%) and Euros (33%). This debt portfolio is composed of 53%fixed-rate debt and 47% variable-rate debt. Changes in interest rates have different impacts on the fixed- andvariable-rate portions of our debt portfolio. A change in interest rates on the fixed portion of the debt portfolioimpacts the net financial instrument position but has no impact on interest incurred or cash flows. A change ininterest rates on the variable portion of the debt portfolio impacts the interest incurred and cash flows but does notimpact the net financial instrument position.
The sensitivity analysis related to the interest rate risk on the fixed portion of our debt portfolio assumes aninstantaneous 100 bp move in interest rates from the level at 30 September 2016, with all other variables heldconstant. A 100 bp increase in market interest rates would result in a decrease of $161 and $139 in the netliability position of financial instruments at 30 September 2016 and 2015, respectively. A 100 bp decrease inmarket interest rates would result in an increase of $178 and $151 in the net liability position of financialinstruments at 30 September 2016 and 2015, respectively.
Based on the variable-rate debt included in our debt portfolio, including the interest rate swap agreements, a 100bp increase in interest rates would result in an additional $29 and $30 of interest incurred per year at the end of30 September 2016 and 2015, respectively. A 100 bp decline in interest rates would lower interest incurred by$29 and $30 per year at 30 September 2016 and 2015, respectively.
Foreign Currency Exchange Rate Risk
The sensitivity analysis related to foreign currency exchange rates assumes an instantaneous 10% change in theforeign currency exchange rates from their levels at 30 September 2016 and 2015, with all other variables heldconstant. A 10% strengthening or weakening of the functional currency of an entity versus all other currencieswould result in a decrease or increase, respectively, of $438 and $421 in the net liability position of financialinstruments at 30 September 2016 and 2015, respectively.
The primary currency pairs for which we have exchange rate exposure are Euros and U.S. dollars and BritishPound Sterling and U.S. dollars. Foreign currency debt, cross currency interest rate swaps, and foreignexchange-forward contracts are used in countries where we do business, thereby reducing our net assetexposure. Foreign exchange-forward contracts and cross currency interest rate swaps are also used to hedge ourfirm and highly anticipated foreign currency cash flows. Thus, there is either an asset/liability or cash flowexposure related to all of the financial instruments in the above sensitivity analysis for which the impact of amovement in exchange rates would be in the opposite direction and materially equal to the impact on theinstruments in the analysis.
56

The majority of the Company’s sales are derived from outside of the United States and denominated in foreigncurrencies. Financial results therefore will be affected by changes in foreign currency rates. The Euro and theChinese Renminbi represent the largest exposures in terms of our foreign earnings. We estimate that a 10%reduction in either the Euro or the Chinese Renminbi versus the U.S. dollar would lower our annual operatingincome by approximately $20 and $15, respectively.
57
ITEM 8. FINANCIAL STATEMENTS AND SUPPLEMENTARY DATA
MANAGEMENT’S REPORT ON INTERNAL CONTROL OVER FINANCIAL REPORTING
Air Products’ management is responsible for establishing and maintaining adequate internal control over financialreporting. Our internal control over financial reporting, which is defined in the following sentences, is a processdesigned to provide reasonable assurance regarding the reliability of our financial reporting and the preparation offinancial statements for external purposes in accordance with U.S. generally accepted accounting principles andincludes those policies and procedures that:
(i) pertain to the maintenance of records that, in reasonable detail, accurately and fairly reflect the transactionsand dispositions of the assets of the Company;
(ii) provide reasonable assurance that the transactions are recorded as necessary to permit preparation offinancial statements in accordance with U.S. generally accepted accounting principles, and that receipts andexpenditures of the Company are being made only in accordance with authorizations of management anddirectors of the Company; and
(iii) provide reasonable assurance regarding prevention or timely detection of unauthorized acquisition, use ordisposition of the Company’s assets that could have a material effect on the financial statements.
Because of inherent limitations, internal control over financial reporting can only provide reasonable assuranceand may not prevent or detect misstatements. Further, because of changes in conditions, the effectiveness of ourinternal control over financial reporting may vary over time. Our processes contain self-monitoring mechanisms,and actions are taken to correct deficiencies as they are identified.
Management has evaluated the effectiveness of its internal control over financial reporting based on criteriaestablished in Internal Control—Integrated Framework (2013) issued by the Committee of SponsoringOrganizations of the Treadway Commission (COSO). Based on this evaluation, management concluded that, asof 30 September 2016, the Company’s internal control over financial reporting was effective.
KPMG LLP, an independent registered public accounting firm, has issued their opinion on the Company’s internalcontrol over financial reporting as of 30 September 2016 as stated in their report which appears herein.
/s/ Seifi Ghasemi /s/ M. Scott Crocco
Seifi Ghasemi M. Scott CroccoChairman, President, and Executive Vice President and
Chief Executive Officer Chief Financial Officer21 November 2016 21 November 2016
58
REPORT OF INDEPENDENT REGISTERED PUBLIC ACCOUNTING FIRM
The Board of Directors and Shareholders of Air Products and Chemicals, Inc.:
We have audited the accompanying consolidated balance sheets of Air Products and Chemicals, Inc. andSubsidiaries (the Company) as of 30 September 2016 and 2015, and the related consolidated income statements,consolidated comprehensive income statements, consolidated statements of cash flows, and equity for each ofthe years in the three-year period ended 30 September 2016. In connection with our audits of the consolidatedfinancial statements, we also have audited the financial statement schedule referred to in Item 15(a)(2) in thisForm 10-K. We have audited the Company’s internal control over financial reporting as of 30 September 2016,based on criteria established in Internal Control – Integrated Framework (2013) issued by the Committee ofSponsoring Organizations of the Treadway Commission. The Company’s management is responsible for theseconsolidated financial statements and financial statement schedule, for maintaining effective internal control overfinancial reporting, and for its assessment of the effectiveness of internal control over financial reporting, includedin the accompanying “Management’s Report on Internal Control over Financial Reporting.” Our responsibility is toexpress an opinion on these consolidated financial statements and financial statement schedule and an opinionon the Company’s internal control over financial reporting based on our audits.
We conducted our audits in accordance with the standards of the Public Company Accounting Oversight Board(United States). Those standards require that we plan and perform the audits to obtain reasonable assuranceabout whether the financial statements are free of material misstatement and whether effective internal controlover financial reporting was maintained in all material respects. Our audits of the consolidated financialstatements included examining, on a test basis, evidence supporting the amounts and disclosures in the financialstatements, assessing the accounting principles used and significant estimates made by management, andevaluating the overall financial statement presentation. Our audit of internal control over financial reportingincluded obtaining an understanding of internal control over financial reporting, assessing the risk that a materialweakness exists, and testing and evaluating the design and operating effectiveness of internal control based onthe assessed risk. Our audits also included performing such other procedures as we considered necessary in thecircumstances. We believe that our audits provide a reasonable basis for our opinions.
A company’s internal control over financial reporting is a process designed to provide reasonable assuranceregarding the reliability of financial reporting and the preparation of financial statements for external purposes inaccordance with generally accepted accounting principles. A company’s internal control over financial reportingincludes those policies and procedures that (1) pertain to the maintenance of records that, in reasonable detail,accurately and fairly reflect the transactions and dispositions of the assets of the company; (2) provide reasonableassurance that transactions are recorded as necessary to permit preparation of financial statements inaccordance with generally accepted accounting principles, and that receipts and expenditures of the company arebeing made only in accordance with authorizations of management and directors of the company; and (3) providereasonable assurance regarding prevention or timely detection of unauthorized acquisition, use, or disposition ofthe company’s assets that could have a material effect on the financial statements.
Because of its inherent limitations, internal control over financial reporting may not prevent or detectmisstatements. Also, projections of any evaluation of effectiveness to future periods are subject to the risk thatcontrols may become inadequate because of changes in conditions, or that the degree of compliance with thepolicies or procedures may deteriorate.
In our opinion, the consolidated financial statements referred to above present fairly, in all material respects, thefinancial position of Air Products and Chemicals, Inc. and Subsidiaries as of 30 September 2016 and 2015, andthe results of their operations and their cash flows for each of the years in the three-year period ended30 September 2016, in conformity with U.S. generally accepted accounting principles. Also in our opinion, therelated financial statement schedule, when considered in relation to the basic consolidated financial statementstaken as a whole, presents fairly, in all material respects, the information set forth therein. Also in our opinion, AirProducts and Chemicals, Inc. and Subsidiaries maintained, in all material respects, effective internal control overfinancial reporting as of 30 September 2016, based on criteria established in Internal Control – IntegratedFramework (2013) issued by the Committee of Sponsoring Organizations of the Treadway Commission.
/s/ KPMG LLP
Philadelphia, Pennsylvania
21 November 2016
59

The Consolidated Financial Statements
Air Products and Chemicals, Inc. and SubsidiariesCONSOLIDATED INCOME STATEMENTS
Year ended 30 September (Millions of dollars, except for share data) 2016 2015 2014
Sales $9,524.4 $9,894.9 $10,439.0Cost of sales 6,402.7 6,939.0 7,629.9Selling and administrative 849.3 939.3 1,054.7Research and development 132.0 137.1 139.8Business separation costs 52.2 7.5 —Business restructuring and cost reduction actions 33.9 207.7 12.7Pension settlement loss 6.4 21.2 5.5Goodwill and intangible asset impairment charge — — 310.1Gain on previously held equity interest — 17.9 —Other income (expense), net 58.1 47.3 52.8
Operating Income 2,106.0 1,708.3 1,339.1Equity affiliates’ income 148.6 154.5 151.4Interest expense 115.5 103.5 125.1Loss on extinguishment of debt 6.9 16.6 —
Income From Continuing Operations Before Taxes 2,132.2 1,742.7 1,365.4Income tax provision 586.5 418.3 369.4
Income From Continuing Operations 1,545.7 1,324.4 996.0Loss from Discontinued Operations, net of tax (884.2) (6.8) (2.9)
Net Income 661.5 1,317.6 993.1Less: Net Income Attributable to Noncontrolling Interests 30.4 39.7 1.4
Net Income Attributable to Air Products $631.1 $1,277.9 $991.7
Net Income Attributable to Air Products
Income from continuing operations $1,515.3 $1,284.7 $994.6Loss from discontinued operations (884.2) (6.8) (2.9)
Net Income Attributable to Air Products $631.1 $1,277.9 $991.7
Basic Earnings Per Common Share Attributable to Air Products
Income from continuing operations $7.00 $5.98 $4.68Loss from discontinued operations (4.08) (.03) (.02)
Net Income Attributable to Air Products $2.92 $5.95 $4.66
Diluted Earnings Per Common Share Attributable to Air Products
Income from continuing operations $6.94 $5.91 $4.62Loss from discontinued operations (4.05) (.03) (.01)
Net Income Attributable to Air Products $2.89 $5.88 $4.61
Weighted Average Common Shares — Basic (in millions) 216.4 214.9 212.7Weighted Average Common Shares — Diluted (in millions) 218.3 217.3 215.2
The accompanying notes are an integral part of these statements.
60

Air Products and Chemicals, Inc. and SubsidiariesCONSOLIDATED COMPREHENSIVE INCOME STATEMENTS
Year ended 30 September (Millions of dollars) 2016 2015 2014
Net Income $661.5 $1,317.6 $993.1
Other Comprehensive Loss, net of tax:
Translation adjustments, net of tax of ($19.8), $45.2, and $36.5 9.9 (699.3) (213.1)Net gain (loss) on derivatives, net of tax of $9.1, ($16.0), and ($13.6) 13.7 (35.0) (15.2)Pension and postretirement benefits, net of tax of ($157.4), ($148.5),
and ($28.0) (335.1) (278.5) (74.2)Reclassification adjustments:
Currency translation adjustment 2.7 — —Derivatives, net of tax of ($9.4), $7.0, and ($1.9) (36.0) 20.8 (9.1)Pension and postretirement benefits, net of tax of $43.0, $47.7,
and $40.0 87.2 97.0 84.7
Total Other Comprehensive Loss (257.6) (895.0) (226.9)
Comprehensive Income 403.9 422.6 766.2
Net Income Attributable to Noncontrolling Interests 30.4 39.7 1.4Other Comprehensive Income (Loss) Attributable to Noncontrolling Interests 4.8 (11.0) (5.6)
Comprehensive Income Attributable to Air Products $368.7 $393.9 $770.4
The accompanying notes are an integral part of these statements.
61

Air Products and Chemicals, Inc. and SubsidiariesCONSOLIDATED BALANCE SHEETS
30 September (Millions of dollars, except for share data) 2016 2015
Assets
Current Assets
Cash and cash items $1,501.3 $206.4Trade receivables, net 1,439.9 1,406.2Inventories 619.9 657.8Contracts in progress, less progress billings 81.6 110.8Prepaid expenses 99.6 67.0Other receivables and current assets 555.6 343.5Current assets of discontinued operations 19.4 1.8
Total Current Assets 4,317.3 2,793.5
Investment in net assets of and advances to equity affiliates 1,288.1 1,265.7Plant and equipment, net 8,852.7 8,745.1Goodwill, net 1,150.2 1,131.3Intangible assets, net 488.0 508.3Noncurrent capital lease receivables 1,221.7 1,350.2Other noncurrent assets 737.3 648.6Noncurrent assets of discontinued operations — 891.8
Total Noncurrent Assets 13,738.0 14,541.0
Total Assets $18,055.3 $17,334.5
Liabilities and Equity
Current Liabilities
Payables and accrued liabilities $1,810.6 $1,641.7Accrued income taxes 146.6 55.8Short-term borrowings 935.8 1,494.3Current portion of long-term debt 371.3 435.6Current liabilities of discontinued operations 19.0 17.0
Total Current Liabilities 3,283.3 3,644.4
Long-term debt 4,918.1 3,949.1Other noncurrent liabilities 1,873.4 1,554.0Deferred income taxes 767.1 803.4Noncurrent liabilities of discontinued operations — 2.5
Total Noncurrent Liabilities 7,558.6 6,309.0
Total Liabilities 10,841.9 9,953.4
Commitments and Contingencies – See Note 17Air Products Shareholders’ Equity
Common stock (par value $1 per share; issued 2016 and 2015 – 249,455,584 shares) 249.4 249.4Capital in excess of par value 970.0 904.7Retained earnings 10,475.5 10,580.4Accumulated other comprehensive loss (2,388.3) (2,125.9)Treasury stock, at cost (2016–32,104,759 shares; 2015–34,096,471 shares) (2,227.0) (2,359.6)
Total Air Products Shareholders’ Equity 7,079.6 7,249.0Noncontrolling Interests 133.8 132.1
Total Equity 7,213.4 7,381.1
Total Liabilities and Equity $18,055.3 $17,334.5
The accompanying notes are an integral part of these statements.
62

Air Products and Chemicals, Inc. and SubsidiariesCONSOLIDATED STATEMENTS OF CASH FLOWS
Year ended 30 September (Millions of dollars) 2016 2015 2014Operating Activities
Net Income $661.5 $1,317.6 $993.1Less: Net income attributable to noncontrolling interests 30.4 39.7 1.4
Net income attributable to Air Products 631.1 1,277.9 991.7Loss from discontinued operations 884.2 6.8 2.9
Income from continuing operations attributable to Air Products 1,515.3 1,284.7 994.6Adjustments to reconcile income to cash provided by operating activities:
Depreciation and amortization 925.9 936.4 956.9Deferred income taxes 62.9 2.9 125.5Loss on extinguishment of debt 6.9 16.6 —Gain on previously held equity interest — (17.9) —Undistributed earnings of unconsolidated affiliates (51.8) (102.6) (76.0)(Gain) Loss on sale of assets and investments (10.0) (30.1) 4.3Share-based compensation 37.6 45.7 44.0Noncurrent capital lease receivables 85.5 (9.5) 20.0Goodwill and intangible asset impairment charge — — 310.1Write-down of long-lived assets associated with restructuring — 47.4 —Other adjustments 155.2 48.1 60.7
Working capital changes that provided (used) cash, excluding effects of acquisitions anddivestitures:Trade receivables (61.7) (29.7) (2.7)Inventories 32.9 8.3 (23.5)Contracts in progress, less progress billings 21.3 36.4 (5.6)Other receivables (12.2) 57.6 (33.0)Payables and accrued liabilities 57.0 156.2 (237.9)Other working capital (57.4) (4.1) 52.7
Cash Provided by Operating Activities 2,707.4 2,446.4 2,190.1
Investing Activities
Additions to plant and equipment (1,055.8) (1,265.6) (1,362.7)Acquisitions, less cash acquired — (34.5) —Investment in and advances to unconsolidated affiliates — (4.3) 2.0Proceeds from sale of assets and investments 85.5 55.3 45.6Other investing activities (1.7) (1.4) (1.4)
Cash Used for Investing Activities (972.0) (1,250.5) (1,316.5)
Financing Activities
Long-term debt proceeds 960.4 340.3 463.4Payments on long-term debt (485.0) (708.7) (608.6)Net (decrease) increase in commercial paper and short-term borrowings (144.2) 284.0 148.7Debt issuance costs (11.7) (2.2) (2.4)Dividends paid to shareholders (721.2) (677.5) (627.7)Proceeds from stock option exercises 141.3 121.3 141.6Excess tax benefit from share-based compensation 33.2 31.9 28.3Payment for subsidiary shares to noncontrolling interests — (278.4) (.5)Other financing activities (43.9) (56.1) (47.1)
Cash Used for Financing Activities (271.1) (945.4) (504.3)
Discontinued Operations
Cash used for operating activities (79.9) (8.6) (3.0)Cash used for investing activities (97.0) (349.2) (311.7)Cash used for financing activities — — (157.1)
Cash Used for Discontinued Operations (176.9) (357.8) (471.8)
Effect of Exchange Rate Changes on Cash 7.5 (22.9) (11.3)
Increase (Decrease) in Cash and Cash Items 1,294.9 (130.2) (113.8)Cash and Cash Items – Beginning of Year 206.4 336.6 450.4
Cash and Cash Items – End of Period $1,501.3 $206.4 $336.6
The accompanying notes are an integral part of these statements.
63

Air Products and Chemicals, Inc. and SubsidiariesCONSOLIDATED STATEMENTS OF EQUITY
Year ended 30 September(Millions of dollars)
CommonStock
Capitalin Excess
of ParValue
RetainedEarnings
AccumulatedOther
ComprehensiveLoss
TreasuryStock
Air ProductsShareholders’
Equity
Non-controlling
InterestsTotal
Equity
Balance 30 September 2013 $249.4 $799.2 $9,646.4 $(1,020.6) $(2,632.3) $7,042.1 $156.8 $7,198.9
Net income 991.7 991.7 28.8 1,020.5Other comprehensive loss (221.3) (221.3) (5.6) (226.9)Cash dividends ($3.02 per share) (641.8) (641.8) (641.8)Share-based compensation expense 44.0 44.0 44.0Issuance of treasury shares for stock
option and award plans (30.0) 155.4 125.4 125.4Tax benefit of stock option and award plans 29.3 29.3 29.3Dividends to noncontrolling interests (24.4) (24.4)Purchase of noncontrolling interests (.5) (.5) (.5)Other (3.1) (3.1) (3.1)
Balance 30 September 2014 $249.4 $842.0 $9,993.2 $(1,241.9) $(2,476.9) $7,365.8 $155.6 $7,521.4
Net income 1,277.9 1,277.9 28.2 1,306.1Other comprehensive loss (884.0) (884.0) (11.0) (895.0)Cash dividends ($3.20 per share) (687.9) (687.9) (687.9)Share-based compensation expense 43.7 43.7 43.7Issuance of treasury shares for stock
option and award plans (15.1) 117.3 102.2 102.2Tax benefit of stock option and award plans 32.0 32.0 32.0Dividends to noncontrolling interests (38.0) (38.0)Purchase of noncontrolling interests (.3) (.3) (.2) (.5)Other 2.4 (2.8) (.4) (2.5) (2.9)
Balance 30 September 2015 $249.4 $904.7 $10,580.4 $(2,125.9) $(2,359.6) $7,249.0 $132.1 $7,381.1
Net income 631.1 631.1 30.4 661.5Other comprehensive income (loss) (262.4) (262.4) 4.8 (257.6)Cash dividends ($3.39 per share) (733.7) (733.7) (733.7)Share-based compensation expense 37.6 37.6 37.6Issuance of treasury shares for stock
option and award plans (5.5) 132.6 127.1 127.1Tax benefit of stock option and award plans 33.2 33.2 33.2Dividends to noncontrolling interests (33.6) (33.6)Other (2.3) (2.3) .1 (2.2)
Balance 30 September 2016 $249.4 $970.0 $10,475.5 $(2,388.3) $(2,227.0) $7,079.6 $133.8 $7,213.4
The accompanying notes are an integral part of these statements.
64

NOTES TO THE CONSOLIDATED FINANCIAL STATEMENTS(Millions of dollars, except for share data)
1. Major Accounting Policies . . . . . . . . . . . . . . . . . . . . . . . . . . . . . . . . . . . . . . . . . . . . . . . . . . . . . . . . . . . . . . . . . . 652. New Accounting Guidance . . . . . . . . . . . . . . . . . . . . . . . . . . . . . . . . . . . . . . . . . . . . . . . . . . . . . . . . . . . . . . . . . . 713. Materials Technologies Separation . . . . . . . . . . . . . . . . . . . . . . . . . . . . . . . . . . . . . . . . . . . . . . . . . . . . . . . . . . . 724. Discontinued Operations . . . . . . . . . . . . . . . . . . . . . . . . . . . . . . . . . . . . . . . . . . . . . . . . . . . . . . . . . . . . . . . . . . . 735. Business Restructuring and Cost Reduction Actions . . . . . . . . . . . . . . . . . . . . . . . . . . . . . . . . . . . . . . . . . . . . . 756. Business Combination . . . . . . . . . . . . . . . . . . . . . . . . . . . . . . . . . . . . . . . . . . . . . . . . . . . . . . . . . . . . . . . . . . . . . 767. Inventories . . . . . . . . . . . . . . . . . . . . . . . . . . . . . . . . . . . . . . . . . . . . . . . . . . . . . . . . . . . . . . . . . . . . . . . . . . . . . . . 768. Summarized Financial Information of Equity Affiliates . . . . . . . . . . . . . . . . . . . . . . . . . . . . . . . . . . . . . . . . . . . . 779. Plant and Equipment, net . . . . . . . . . . . . . . . . . . . . . . . . . . . . . . . . . . . . . . . . . . . . . . . . . . . . . . . . . . . . . . . . . . . 78
10. Goodwill . . . . . . . . . . . . . . . . . . . . . . . . . . . . . . . . . . . . . . . . . . . . . . . . . . . . . . . . . . . . . . . . . . . . . . . . . . . . . . . . . 7811. Intangible Assets . . . . . . . . . . . . . . . . . . . . . . . . . . . . . . . . . . . . . . . . . . . . . . . . . . . . . . . . . . . . . . . . . . . . . . . . . 7912. Leases . . . . . . . . . . . . . . . . . . . . . . . . . . . . . . . . . . . . . . . . . . . . . . . . . . . . . . . . . . . . . . . . . . . . . . . . . . . . . . . . . . 8013. Financial Instruments . . . . . . . . . . . . . . . . . . . . . . . . . . . . . . . . . . . . . . . . . . . . . . . . . . . . . . . . . . . . . . . . . . . . . . 8114. Fair Value Measurements . . . . . . . . . . . . . . . . . . . . . . . . . . . . . . . . . . . . . . . . . . . . . . . . . . . . . . . . . . . . . . . . . . 8415. Debt . . . . . . . . . . . . . . . . . . . . . . . . . . . . . . . . . . . . . . . . . . . . . . . . . . . . . . . . . . . . . . . . . . . . . . . . . . . . . . . . . . . . 8616. Retirement Benefits . . . . . . . . . . . . . . . . . . . . . . . . . . . . . . . . . . . . . . . . . . . . . . . . . . . . . . . . . . . . . . . . . . . . . . . 8817. Commitments and Contingencies . . . . . . . . . . . . . . . . . . . . . . . . . . . . . . . . . . . . . . . . . . . . . . . . . . . . . . . . . . . . 9618. Capital Stock . . . . . . . . . . . . . . . . . . . . . . . . . . . . . . . . . . . . . . . . . . . . . . . . . . . . . . . . . . . . . . . . . . . . . . . . . . . . . 9919. Share-Based Compensation . . . . . . . . . . . . . . . . . . . . . . . . . . . . . . . . . . . . . . . . . . . . . . . . . . . . . . . . . . . . . . . . 10020. Accumulated Other Comprehensive Loss . . . . . . . . . . . . . . . . . . . . . . . . . . . . . . . . . . . . . . . . . . . . . . . . . . . . . 10321. Noncontrolling Interests . . . . . . . . . . . . . . . . . . . . . . . . . . . . . . . . . . . . . . . . . . . . . . . . . . . . . . . . . . . . . . . . . . . . 10322. Earnings per Share . . . . . . . . . . . . . . . . . . . . . . . . . . . . . . . . . . . . . . . . . . . . . . . . . . . . . . . . . . . . . . . . . . . . . . . . 10423. Income Taxes . . . . . . . . . . . . . . . . . . . . . . . . . . . . . . . . . . . . . . . . . . . . . . . . . . . . . . . . . . . . . . . . . . . . . . . . . . . . 10524. Supplemental Information . . . . . . . . . . . . . . . . . . . . . . . . . . . . . . . . . . . . . . . . . . . . . . . . . . . . . . . . . . . . . . . . . . 10825. Summary by Quarter (Unaudited) . . . . . . . . . . . . . . . . . . . . . . . . . . . . . . . . . . . . . . . . . . . . . . . . . . . . . . . . . . . . 11026. Business Segment and Geographic Information . . . . . . . . . . . . . . . . . . . . . . . . . . . . . . . . . . . . . . . . . . . . . . . . 112
1. MAJOR ACCOUNTING POLICIES
Basis of Presentation and Consolidation Principles
The accompanying consolidated financial statements of Air Products and Chemicals, Inc. were prepared inaccordance with accounting principles generally accepted in the United States of America (“U.S. GAAP”) andinclude the accounts of Air Products and Chemicals, Inc. and those of its controlled subsidiaries (“we,” “our,” “us,”the “Company,” “Air Products,” or “registrant”), which are generally majority owned. Intercompany transactionsand balances are eliminated in consolidation.
We consolidate all entities that we control. The general condition for control is ownership of a majority of thevoting interests of an entity. Control may also exist in arrangements where we are the primary beneficiary of avariable interest entity (VIE). An entity that has both the power to direct the activities that most significantly impactthe economic performance of a VIE and the obligation to absorb the losses or receive the benefits significant tothe VIE is considered the primary beneficiary of that entity. We have determined that we are not a primarybeneficiary in any material VIE.
Certain prior year information has been reclassified to conform to the 2016 presentation.
Estimates and Assumptions
The preparation of the financial statements in conformity with U.S. GAAP requires management to makeestimates and assumptions that affect amounts reported in the financial statements and accompanying notes.Actual results could differ from those estimates.
Revenue Recognition
Revenue from product sales is recognized as risk and title to the product transfer to the customer (which generallyoccurs at the time shipment is made), the sales price is fixed or determinable, and collectability is reasonablyassured. Sales returns and allowances are not a business practice in the industry.
65

Revenue from equipment sale contracts is recorded primarily using the percentage-of-completion method. Underthis method, revenue from the sale of major equipment, such as liquefied natural gas (LNG) heat exchangers andlarge air separation units, is recognized based on labor hours or costs incurred to date compared with totalestimated labor hours or costs to be incurred. When adjustments in estimated total contract revenues orestimated total costs or labor hours are required, any changes in the estimated profit from prior estimates arerecognized in the current period for the inception-to-date effect of such change. Changes in estimates on projectsaccounted for under the percentage-of-completion method favorably impacted operating income by approximately$20 in fiscal year 2016, primarily during the fourth quarter. Our changes in estimates would not have significantlyimpacted amounts recorded in prior years. Changes in estimates during fiscal years 2015 and 2014 were notsignificant.
Certain contracts associated with facilities that are built to provide product to a specific customer are required tobe accounted for as leases. In cases where operating lease treatment is necessary, there is no difference inrevenue recognition over the life of the contract as compared to accounting for the contract as product sales. Incases where capital lease treatment is necessary, the timing of revenue and expense recognition is impacted.Revenue and expense are recognized up front for the sale of equipment component of the contract as comparedto revenue recognition over the life of the arrangement under contracts not qualifying as capital leases.Additionally, a portion of the revenue representing interest income from the financing component of the leasereceivable is reflected as sales over the life of the contract. Allowances for credit losses associated with capitallease receivables are recorded using the specific identification method. As of 30 September 2016 and 2015, thecredit quality of capital lease receivables did not require an allowance for credit losses.
If an arrangement involves multiple deliverables, the delivered items are considered separate units of accountingif the items have value on a stand-alone basis. Revenues are allocated to each deliverable based upon relativeselling prices derived from company specific evidence.
Amounts billed for shipping and handling fees are classified as sales in the consolidated income statements.
Amounts billed for sales and use taxes, value-added taxes, and certain excise and other specific transactionaltaxes imposed on revenue-producing transactions are presented on a net basis and excluded from sales in theconsolidated income statements. We record a liability until remitted to the respective taxing authority.
Cost of Sales
Cost of sales predominantly represents the cost of tangible products sold. These costs include labor, rawmaterials, plant engineering, power, depreciation, production supplies and materials packaging costs, andmaintenance costs. Costs incurred for shipping and handling are also included in cost of sales.
Depreciation
Depreciation is recorded using the straight-line method, which deducts equal amounts of the cost of each assetfrom earnings every year over its expected economic useful life. The principal lives for major classes of plant andequipment are summarized in Note 9, Plant and Equipment, net.
Selling and Administrative
The principal components of selling and administrative expenses are compensation, advertising, and promotionalcosts.
Postemployment Benefits
We provide termination benefits to employees as part of ongoing benefit arrangements and record a liability fortermination benefits when probable and estimable. These criteria are met when management, with theappropriate level of authority, approves and commits to its plan of action for termination; the plan identifies theemployees to be terminated and their related benefits; and the plan is to be completed within one year. We do notprovide one-time benefit arrangements of significance.
Fair Value Measurements
We are required to measure certain assets and liabilities at fair value, either upon initial measurement or forsubsequent accounting or reporting. For example, fair value is used in the initial measurement of net assetsacquired in a business combination; on a recurring basis in the measurement of derivative financial instruments;and on a nonrecurring basis when long-lived assets are written down to fair value when held for sale ordetermined to be impaired. Refer to Note 14, Fair Value Measurements, for information on the methods andassumptions used in our fair value measurements.
66
Financial Instruments
We address certain financial exposures through a controlled program of risk management that includes the use ofderivative financial instruments. The types of derivative financial instruments permitted for such risk managementprograms are specified in policies set by management. Refer to Note 13, Financial Instruments, for further detailon the types and use of derivative instruments into which we enter.
Major financial institutions are counterparties to all of these derivative contracts. We have establishedcounterparty credit guidelines and generally enter into transactions with financial institutions of investment gradeor better. Management believes the risk of incurring losses related to credit risk is remote, and any losses wouldbe immaterial to the consolidated financial results, financial condition, or liquidity.
We recognize derivatives on the balance sheet at fair value. On the date the derivative instrument is entered into,we generally designate the derivative as either (1) a hedge of a forecasted transaction or of the variability of cashflows to be received or paid related to a recognized asset or liability (cash flow hedge), (2) a hedge of a netinvestment in a foreign operation (net investment hedge), or (3) a hedge of the fair value of a recognized asset orliability (fair value hedge).
The following details the accounting treatment of our cash flow, fair value, net investment, and non-designatedhedges:
• Changes in the fair value of a derivative that is designated as and meets the cash flow hedge criteria arerecorded in Accumulated other comprehensive loss (AOCL) to the extent effective and then recognized inearnings when the hedged items affect earnings.
• Changes in the fair value of a derivative that is designated as and meets all the required criteria for a fairvalue hedge, along with the gain or loss on the hedged asset or liability that is attributable to the hedged risk,are recorded in current period earnings.
• Changes in the fair value of a derivative and foreign currency debt that are designated as and meet all therequired criteria for a hedge of a net investment are recorded as translation adjustments in AOCL.
• Changes in the fair value of a derivative that is not designated as a hedge are recorded immediately inearnings.
We formally document the relationships between hedging instruments and hedged items, as well as our riskmanagement objective and strategy for undertaking various hedge transactions. This process includes relatingderivatives that are designated as fair value or cash flow hedges to specific assets and liabilities on the balancesheet or to specific firm commitments or forecasted transactions. We also formally assess, at the inception of thehedge and on an ongoing basis, whether derivatives are highly effective in offsetting changes in fair values orcash flows of the hedged item. If it is determined that a derivative is not highly effective as a hedge, or if aderivative ceases to be a highly effective hedge, we will discontinue hedge accounting with respect to thatderivative prospectively.
Foreign Currency
Since we do business in many foreign countries, fluctuations in currency exchange rates affect our financialposition and results of operations.
In most of our foreign operations, the local currency is considered the functional currency. Foreign subsidiariestranslate their assets and liabilities into U.S. dollars at current exchange rates in effect at the end of the fiscalperiod. The gains or losses that result from this process are shown as translation adjustments in AOCI in theequity section of the balance sheet.
The revenue and expense accounts of foreign subsidiaries are translated into U.S. dollars at the averageexchange rates that prevail during the period. Therefore, the U.S. dollar value of these items on the incomestatement fluctuates from period to period, depending on the value of the dollar against foreign currencies. Sometransactions are made in currencies different from an entity’s functional currency. Gains and losses from theseforeign currency transactions are generally included in other income (expense), net on our consolidated incomestatements as they occur.
Environmental Expenditures
Accruals for environmental loss contingencies are recorded when it is probable that a liability has been incurredand the amount of loss can be reasonably estimated. Remediation costs are capitalized if the costs improve the
67

Company’s property as compared with the condition of the property when originally constructed or acquired, or ifthe costs prevent environmental contamination from future operations. We expense environmental costs relatedto existing conditions resulting from past or current operations and from which no current or future benefit isdiscernible. The amounts charged to income from continuing operations related to environmental matters totaled$27.0 in fiscal 2016, $28.3 in 2015, and $35.1 in 2014.
The measurement of environmental liabilities is based on an evaluation of currently available information withrespect to each individual site and considers factors such as existing technology, presently enacted laws andregulations, and prior experience in remediation of contaminated sites. An environmental liability related tocleanup of a contaminated site might include, for example, a provision for one or more of the following types ofcosts: site investigation and testing costs, cleanup costs, costs related to soil and water contamination resultingfrom tank ruptures, post-remediation monitoring costs, and outside legal fees. These liabilities include costsrelated to other potentially responsible parties to the extent that we have reason to believe such parties will notfully pay their proportionate share. They do not take into account any claims for recoveries from insurance orother parties and are not discounted.
As assessments and remediation progress at individual sites, the amount of projected cost is reviewed, and theliability is adjusted to reflect additional technical and legal information that becomes available. Management hasan established process in place to identify and monitor the Company’s environmental exposures. Anenvironmental accrual analysis is prepared and maintained that lists all environmental loss contingencies, evenwhere an accrual has not been established. This analysis assists in monitoring the Company’s overallenvironmental exposure and serves as a tool to facilitate ongoing communication among the Company’s technicalexperts, environmental managers, environmental lawyers, and financial management to ensure that requiredaccruals are recorded and potential exposures disclosed.
Given inherent uncertainties in evaluating environmental exposures, actual costs to be incurred at identified sitesin future periods may vary from the estimates. Refer to Note 17, Commitments and Contingencies, for additionalinformation on the Company’s environmental loss contingencies.
The accruals for environmental liabilities are reflected in the consolidated balance sheets, primarily as part ofother noncurrent liabilities.
Litigation
In the normal course of business, we are involved in legal proceedings. We accrue a liability for such matterswhen it is probable that a liability has been incurred and the amount can be reasonably estimated. When only arange of possible loss can be established, the most probable amount in the range is accrued. If no amount withinthis range is a better estimate than any other amount within the range, the minimum amount in the range isaccrued. The accrual for a litigation loss contingency includes estimates of potential damages and other directlyrelated costs expected to be incurred. Refer to Note 17, Commitments and Contingencies, for additionalinformation on our current legal proceedings.
Share-Based Compensation
We have various share-based compensation programs, which include deferred stock units, stock options, andrestricted stock. We expense the grant-date fair value of these awards over the vesting period during whichemployees perform related services. Expense recognition is accelerated for retirement-eligible individuals whowould meet the requirements for vesting of awards upon their retirement. We utilize a Black Scholes model tovalue stock option awards. The grant-date fair value of the deferred stock units tied to a market condition isestimated using a Monte Carlo simulation model.
Income Taxes
We account for income taxes under the asset and liability method. Under this method, deferred tax assets andliabilities are recognized for the tax effects of temporary differences between the financial reporting and tax basesof assets and liabilities using enacted tax rates in effect for the year in which the differences are expected to berecovered or settled. A principal temporary difference results from the excess of tax depreciation over bookdepreciation because accelerated methods of depreciation and shorter useful lives are used for income taxpurposes. The cumulative impact of a change in tax rates or regulations is included in income tax expense in theperiod that includes the enactment date. We recognize deferred tax assets net of existing valuation allowance tothe extent we believe that these assets are more likely than not to be realized considering all available evidence.
68

A tax benefit for an uncertain tax position is recognized when it is more likely than not that the position will besustained upon examination based on its technical merits. This position is measured as the largest amount of taxbenefit that is greater than 50% likely of being realized. Interest and penalties related to unrecognized tax benefitsare recognized as a component of income tax expense. For additional information regarding our income taxes,refer to Note 23, Income Taxes.
Cash and Cash Items
Cash and cash items include cash, time deposits, and certificates of deposit acquired with an original maturity ofthree months or less.
Trade Receivables, net
Trade receivables comprise amounts owed to us through our operating activities and are presented net ofallowances for doubtful accounts. The allowances for doubtful accounts represent estimated uncollectiblereceivables associated with potential customer defaults on contractual obligations. A provision for customerdefaults is made on a general formula basis when it is determined that the risk of some default is probable andestimable but cannot yet be associated with specific customers. The assessment of the likelihood of customerdefaults is based on various factors, including the length of time the receivables are past due, historicalexperience, and existing economic conditions. The allowance also includes amounts for certain customers wherea risk of default has been specifically identified, considering factors such as the financial condition of the customerand customer disputes over contractual terms and conditions. Allowance for doubtful accounts were $56.8 and$48.5 as of fiscal year end 30 September 2016 and 2015, respectively. Provisions to the allowance for doubtfulaccounts charged against income were $22.8, $26.3 and $16.4 in 2016, 2015, and 2014, respectively.
Inventories
Inventories are stated at the lower of cost or market. We write down our inventories for estimated obsolescence orunmarketable inventory based upon assumptions about future demand and market conditions.
We utilize the last-in, first-out (LIFO) method for determining the cost of inventories in the United States for theIndustrial Gases and the Materials Technologies segments. Inventories for these segments outside of the UnitedStates are accounted for on the first-in, first-out (FIFO) method, as the LIFO method is not generally permitted inthe foreign jurisdictions where these segments operate. The inventories of the Industrial Gases – Global and theCorporate and other segments on a worldwide basis, as well as all other inventories, are accounted for on theFIFO basis.
At the business segment level, inventories are recorded at FIFO and the LIFO pool adjustments are not allocatedto the business segments.
Equity Investments
The equity method of accounting is used when we exercise significant influence but do not have operating control,generally assumed to be 20% – 50% ownership. Under the equity method, original investments are recorded atcost and adjusted by our share of undistributed earnings or losses of these companies. Equity investments arereviewed for impairment whenever events or changes in circumstances indicate that the carrying amount of theinvestment may not be recoverable.
Plant and Equipment
Plant and equipment is stated at cost less accumulated depreciation. Construction costs, labor, and applicableoverhead related to installations are capitalized. Expenditures for additions and improvements that extend thelives or increase the capacity of plant assets are capitalized. The costs of maintenance and repairs of plant andequipment are charged to expense as incurred.
Fully depreciated assets are retained in the gross plant and equipment and accumulated depreciation accountsuntil they are removed from service. In the case of disposals, assets and related depreciation are removed fromthe accounts, and the net amounts, less proceeds from disposal, are included in income. Refer to Note 9, Plantand Equipment, net, for further detail.
Computer Software
We capitalize costs incurred to purchase or develop software for internal use. Capitalized costs include purchasedcomputer software packages, payments to vendors/consultants for development and implementation ormodification to a purchased package to meet our requirements, payroll and related costs for employees directly
69
involved in development, and interest incurred while software is being developed. Capitalized computer softwarecosts are included in the balance sheet classification plant and equipment, net and depreciated over theestimated useful life of the software, generally a period of three to ten years.
Capitalized Interest
As we build new plant and equipment, we include in the cost of these assets a portion of the interest payments wemake during the year. The amount of capitalized interest was $32.9, $49.1, and $33.0 in 2016, 2015, and 2014,respectively.
Impairment of Long-Lived Assets
Long-lived assets are grouped for impairment testing at the lowest level for which there are identifiable cash flowsthat are largely independent of the cash flows of other assets and liabilities and are evaluated for impairmentwhenever events or changes in circumstances indicate that the carrying amount of an asset group may not berecoverable. We assess recoverability by comparing the carrying amount of the asset group to estimatedundiscounted future cash flows expected to be generated by the asset group. If an asset group is consideredimpaired, the impairment loss to be recognized is measured as the amount by which the asset group’s carryingamount exceeds its fair value. Long-lived assets to be sold are reported at the lower of carrying amount or fairvalue less cost to sell.
Asset Retirement Obligations
The fair value of a liability for an asset retirement obligation is recognized in the period in which it is incurred. Thefair value of the liability is measured using discounted estimated cash flows and is adjusted to its present value insubsequent periods as accretion expense is recorded. The corresponding asset retirement costs are capitalizedas part of the carrying amount of the related long-lived asset and depreciated over the asset’s useful life. Ourasset retirement obligations are primarily associated with Industrial Gases on-site long-term supply contracts,under which we have built a facility on land owned by the customer and are obligated to remove the facility at theend of the contract term. Our asset retirement obligations totaled $119.9 and $109.4 at 30 September 2016 and2015, respectively.
Goodwill
Business combinations are accounted for using the acquisition method. The purchase price is allocated to theassets acquired and liabilities assumed based on their estimated fair market values. Any excess purchase priceover the fair market value of the net assets acquired, including identified intangibles, is recorded as goodwill.Preliminary purchase price allocations are made at the date of acquisition and finalized when information neededto affirm underlying estimates is obtained, within a maximum allocation period of one year.
Goodwill is subject to impairment testing at least annually. In addition, goodwill is tested more frequently if achange in circumstances or the occurrence of events indicates that potential impairment exists. Refer to Note 10,Goodwill, for further detail.
Intangible Assets
Intangible assets with determinable lives primarily consist of customer relationships, purchased patents andtechnology, and land use rights. The cost of intangible assets with determinable lives is amortized on a straight-line basis over the estimated period of economic benefit. No residual value is estimated for these intangibleassets. Indefinite-lived intangible assets consist of trade names and trademarks. Indefinite-lived intangibles aresubject to impairment testing at least annually. In addition, intangible assets are tested more frequently if achange in circumstances or the occurrence of events indicates that potential impairment exists.
Customer relationships are generally amortized over periods of five to twenty-five years. Purchased patents andtechnology and other are generally amortized over periods of five to twenty years. Land use rights, which areincluded in other intangibles, are generally amortized over a period of fifty years. Amortizable lives are adjustedwhenever there is a change in the estimated period of economic benefit. Refer to Note 11, Intangible Assets, forfurther detail.
Retirement Benefits
The cost of pension benefits is recognized over the employees’ service period. We are required to use actuarialmethods and assumptions in the valuation of defined benefit obligations and the determination of expense.Differences between actual and expected results or changes in the value of obligations and plan assets are notrecognized in earnings as they occur but, rather, systematically and gradually over subsequent periods. Refer toNote 16, Retirement Benefits, for disclosures related to our pension and other postretirement benefits.
70

2. NEW ACCOUNTING GUIDANCE
Accounting Guidance Implemented in 2016
Balance Sheet Classification of Deferred Taxes
In November 2015, the Financial Accounting Standards Board (FASB) issued guidance to simplify thepresentation of deferred income taxes by requiring that all deferred tax liabilities and assets be classified asnoncurrent on the balance sheet. As of the first quarter of fiscal year 2016, we adopted this guidance on aretrospective basis. Accordingly, prior year amounts have been reclassified to conform to the current yearpresentation. The guidance, which did not change the existing requirement to net deferred tax assets andliabilities within a jurisdiction, resulted in a reclassification adjustment that increased noncurrent deferred taxassets by $13.7 and decreased noncurrent deferred tax liabilities by $99.9 as of 30 September 2015.
Discontinued Operations
In April 2014, the FASB issued an update to change the criteria for determining which disposals qualify as adiscontinued operation and to expand related disclosure requirements. Under the new guidance, a disposal isrequired to be reported in discontinued operations if the disposal represents a strategic shift that has or will havea major effect on operations and financial results. We adopted this guidance prospectively for new disposals andnew disposal groups classified as held for sale beginning in the first quarter of fiscal year 2016. This guidance hadno impact on our consolidated financial statements upon adoption. As a result of actions taken during the secondquarter of 2016, our Energy-from-Waste segment has been reported as a discontinued operation. Refer to Note 4,Discontinued Operations, for additional information.
New Accounting Guidance to be Implemented
Revenue Recognition
In May 2014, the FASB issued guidance based on the principle that revenue is recognized in an amount expectedto be collected and to which the entity expects to be entitled in exchange for the transfer of goods or services. Asoriginally issued, this guidance was effective for us beginning in fiscal year 2018. In August 2015, the FASBdeferred the effective date by one year while providing the option to early adopt the standard on the originaleffective date. Accordingly, we will have the option to adopt the standard in either fiscal year 2018 or 2019. Theguidance can be adopted either retrospectively or as a cumulative-effect adjustment as of the date of adoption.
We are in the initial stages of evaluating the adoption alternatives allowed by the new standard and the impact thestandard is expected to have on our consolidated financial statements. As the new standard will supersedesubstantially all existing revenue guidance affecting us under U.S. GAAP, it could impact the timing of revenueand cost recognition across all of our business segments, in addition to our business processes and ourinformation technology systems. As a result, our evaluation of the effect of the new standard will extend overfuture periods.
Consolidation Analysis
In February 2015, the FASB issued an update to amend current consolidation guidance. The guidance impactsthe analysis an entity must perform in determining if it should consolidate certain legal entities such as limitedpartnerships, limited liability corporations, and securitization structures. The guidance is effective beginning fiscalyear 2017, with early adoption permitted. The guidance may be applied retrospectively or using a modifiedretrospective approach by recording a cumulative-effect adjustment to equity as of the beginning of the fiscal yearof adoption. This guidance will not have a significant impact on our consolidated financial statements.
Debt Issuance Costs
In April 2015, the FASB issued guidance requiring that debt issuance costs related to a recognized debt liabilitybe presented in the balance sheet as a direct deduction from the carrying amount of the debt instead of as aseparate deferred asset. In August 2015, the FASB issued an update to incorporate the U.S. Securities andExchange Commission (SEC) Staff guidance which allows debt issuance costs associated with a line-of-creditarrangement to be presented as a deferred asset that is subsequently amortized over the term of thearrangement, regardless of whether there are any outstanding borrowings. This change in accounting principlewill be adopted retrospectively beginning in fiscal year 2017. This guidance will not have a significant impact onour consolidated financial statements.
71

Leases
In February 2016, the FASB issued guidance which requires lessees to recognize a right-of-use asset and leaseliability on the balance sheet for all leases, including operating leases, with a term in excess of 12 months. Theguidance also expands the quantitative and qualitative disclosure requirements. The guidance is effective in fiscalyear 2020, with early adoption permitted, and must be applied using a modified retrospective approach. We arecurrently evaluating the impact of adopting this new guidance on the consolidated financial statements, and wehave started the assessment process by evaluating the population of leases under the revised definition of whatqualifies as a leased asset. The Company is the lessee under various agreements for real estate, distributionequipment, aircraft, and vehicles that are currently accounted for as operating leases as discussed in Note 12,Leases. The new guidance requires the lessee to record operating leases on the balance sheet with a right-of-useasset and corresponding liability for future payment obligations.
Share-Based Compensation
In March 2016, the FASB issued an update to simplify the accounting for employee share-based payments,including the income tax impacts, the classification on the statement of cash flows, and forfeitures. Theamendments are effective for fiscal year 2018, with early adoption permitted. We continue to evaluate the impactof this guidance on our consolidated financial statements and the timing of adoption. Upon adoption, we currentlyanticipate a greater degree of volatility in the income tax provision and effective income tax rate as a result of thenew guidance, which requires excess tax benefits and deficiencies to be recognized in the income statementrather than in additional paid-in capital on the balance sheet.
Derivative Contract Novations
In March 2016, the FASB issued guidance to clarify that a change in the counterparty to a derivative instrumentthat has been designated as a hedging instrument does not, in and of itself, require re-designation of that hedgingrelationship provided that all other hedge accounting criteria continue to be met. This guidance is effective in fiscalyear 2018, with early adoption permitted. We do not expect adoption of this guidance to have a significant impacton our consolidated financial statements.
Credit Losses on Financial Instruments
In June 2016, the FASB issued an update on the measurement of credit losses, which requires measurement andrecognition of expected credit losses for financial assets, including trade receivables and capital leasereceivables, held at the reporting date based on historical experience, current conditions, and reasonable andsupportable forecasts. The method to determine a loss is different from the existing guidance, which requires acredit loss to be recognized when it is probable. The guidance is effective beginning fiscal year 2021, with earlyadoption permitted beginning fiscal year 2020. We are currently evaluating the impact this update will have on ourconsolidated financial statements.
Cash Flow Statement Classification
In August 2016, the FASB issued guidance to reduce diversity in practice on how certain cash receipts and cashpayments are classified in the statement of cash flows. The guidance is effective beginning fiscal year 2019, withearly adoption permitted, and should be applied retrospectively. We are currently evaluating the impact ofadopting this new guidance on the consolidated financial statements.
3. MATERIALS TECHNOLOGIES SEPARATION
On 16 September 2015, the Company announced plans to separate its Materials Technologies business, whichcontains two divisions, Electronic Materials (EMD) and Performance Materials (PMD), into an independentpublicly traded company and distribute to Air Products shareholders all of the shares of the new public companyin a tax-free distribution (a “spin-off”). Versum Materials, Inc., or Versum, was formed as the new company to holdthe Materials Technologies business subject to spin-off. On 6 May 2016, the Company entered into an agreementto sell certain subsidiaries and assets comprising the PMD division to Evonik Industries AG for $3.8 billion in cashand the assumption of certain liabilities. As a result, the Company moved forward with the planned spin-off ofVersum containing only the EMD division.
As further discussed below, Air Products completed the separation of its EMD division through the spin-off ofVersum on 1 October 2016. As a result, the historical results of the EMD division will be presented as a
72

discontinued operation beginning in fiscal year 2017. The historical results of the PMD division will be reflected asa discontinued operation when it becomes probable for the sale to occur and actions required to meet the plan ofsale indicate that it is unlikely that significant changes will occur. The PMD division is not classified as held forsale due to certain conditions of the sale, including regulatory and anti-trust requirements. We continue toevaluate the progress of the sale of the PMD division to determine when it should be presented as a discontinuedoperation.
In fiscal year 2016, we incurred separation costs of $52.2 ($48.3 after-tax, or $.22 per share), primarily related tolegal, advisory, and indirect tax costs associated with these transactions. The costs are reflected on theconsolidated income statements as “Business separation costs.” A significant portion of these costs were not taxdeductible because they were directly related to the plan for the tax-free spin-off of Versum. Our income taxprovision includes additional tax expense related to the separation of $51.8 ($.24 per share), of which $45.7resulted from a dividend declared during the third quarter of 2016 to repatriate $443.8 from a subsidiary in SouthKorea to the U.S. due to the intended separation of the EMD division from the industrial gases business in SouthKorea. Previously, most of these foreign earnings were considered to be indefinitely reinvested.
On 30 September 2016, in anticipation of the spin-off, Versum entered into certain financing transactions to allowfor a cash distribution of $550.0 and a distribution in-kind of notes issued by Versum with an aggregate principalamount of $425.0 to Air Products. Air Products then exchanged these notes with certain financial institutions for$418.3 of Air Products’ outstanding commercial paper. The exchange resulted in a loss of $6.9 ($4.3 after-tax, or$.02 per share) and has been reflected on the consolidated income statements as “Loss on extinguishment ofdebt.” This loss is deductible for tax purposes. This non-cash exchange was excluded from the consolidatedstatements of cash flows. Refer to Note 15, Debt, for additional information on the Versum financing.
Subsequent Event
On 1 October 2016 (the distribution date), Air Products completed the spin-off of Versum into a separate andindependent public company by way of a distribution to the Air Products’ stockholders of all of the then issued andoutstanding shares of common stock of Versum on the basis of one share of Versum common stock for every twoshares of Air Products’ common stock held as of the close of business on 21 September 2016 (the record date forthe distribution). Fractional shares of Versum common stock were not distributed to Air Products commonstockholders. Air Products’ stockholders received cash in lieu of fractional shares. As a result of the distribution,Versum Materials, Inc. is now an independent public company and its common stock is listed under the symbol“VSM” on the New York Stock Exchange.
4. DISCONTINUED OPERATIONS
Energy-from-Waste (EfW)
On 29 March 2016, the Board of Directors approved the Company’s exit of its EfW business. As a result, efforts tostart up and operate the two EfW projects located in Tees Valley, United Kingdom, have been discontinued. Thedecision to exit the business and stop development of the projects was based on continued difficultiesencountered and the Company’s conclusion, based on testing and analysis completed during the second quarterof fiscal year 2016, that significant additional time and resources would be required to make the projectsoperational. The EfW segment is presented as a discontinued operation. Prior year EfW business segmentinformation has been reclassified to conform to current year presentation.
During the second quarter of fiscal year 2016, we recorded a loss of $945.7 ($846.6 after-tax) for the disposal ofthe business. Income tax benefits related only to one of the projects, as the other did not qualify for a local taxdeduction. This loss included $913.5 to write down plant assets, previously recorded as construction in progress,to their estimated net realizable value of $20.0 and $32.2 to record a liability for plant disposition and other costs.We estimated the net realizable value of the projects as of 31 March 2016 assuming an orderly liquidation ofassets capable of being marketed on a secondary equipment market based on market quotes and our experiencewith selling similar equipment. An asset’s orderly liquidation value is the amount that could be realized from aliquidation sale, given a reasonable period of time to find a buyer, selling the asset in the existing condition whereit is located, and assuming the highest and best use of the asset by market participants. There have been nosignificant changes in the estimated net realizable value as of 30 September 2016. A valuation allowance of $58.0and unrecognized tax benefits of $7.9 were recorded relating to deferred tax assets on capital assets generatedfrom the loss.
73
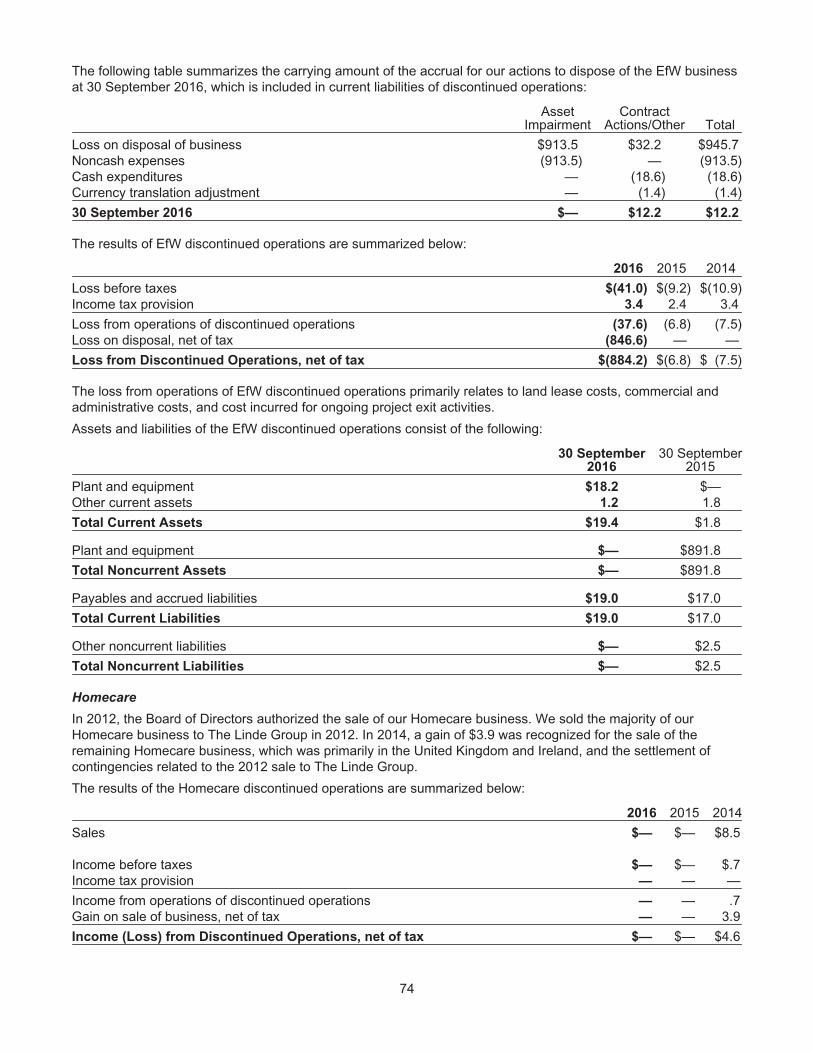
The following table summarizes the carrying amount of the accrual for our actions to dispose of the EfW businessat 30 September 2016, which is included in current liabilities of discontinued operations:
AssetImpairment
ContractActions/Other Total
Loss on disposal of business $913.5 $32.2 $945.7Noncash expenses (913.5) — (913.5)Cash expenditures — (18.6) (18.6)Currency translation adjustment — (1.4) (1.4)
30 September 2016 $— $12.2 $12.2
The results of EfW discontinued operations are summarized below:
2016 2015 2014
Loss before taxes $(41.0) $(9.2) $(10.9)Income tax provision 3.4 2.4 3.4
Loss from operations of discontinued operations (37.6) (6.8) (7.5)Loss on disposal, net of tax (846.6) — —
Loss from Discontinued Operations, net of tax $(884.2) $(6.8) $ (7.5)
The loss from operations of EfW discontinued operations primarily relates to land lease costs, commercial andadministrative costs, and cost incurred for ongoing project exit activities.
Assets and liabilities of the EfW discontinued operations consist of the following:
30 September2016
30 September2015
Plant and equipment $18.2 $—Other current assets 1.2 1.8
Total Current Assets $19.4 $1.8
Plant and equipment $— $891.8
Total Noncurrent Assets $— $891.8
Payables and accrued liabilities $19.0 $17.0
Total Current Liabilities $19.0 $17.0
Other noncurrent liabilities $— $2.5
Total Noncurrent Liabilities $— $2.5
Homecare
In 2012, the Board of Directors authorized the sale of our Homecare business. We sold the majority of ourHomecare business to The Linde Group in 2012. In 2014, a gain of $3.9 was recognized for the sale of theremaining Homecare business, which was primarily in the United Kingdom and Ireland, and the settlement ofcontingencies related to the 2012 sale to The Linde Group.
The results of the Homecare discontinued operations are summarized below:
2016 2015 2014
Sales $— $— $8.5
Income before taxes $— $— $.7Income tax provision — — —
Income from operations of discontinued operations — — .7Gain on sale of business, net of tax — — 3.9
Income (Loss) from Discontinued Operations, net of tax $— $— $4.6
74
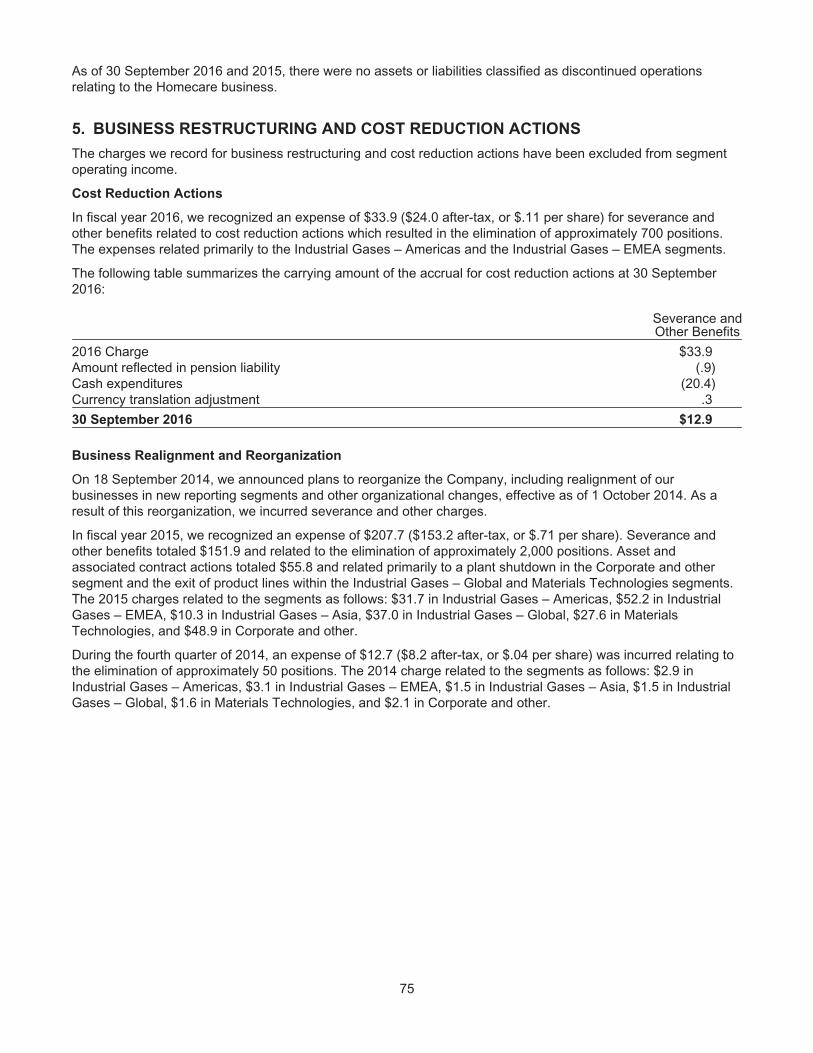
As of 30 September 2016 and 2015, there were no assets or liabilities classified as discontinued operationsrelating to the Homecare business.
5. BUSINESS RESTRUCTURING AND COST REDUCTION ACTIONS
The charges we record for business restructuring and cost reduction actions have been excluded from segmentoperating income.
Cost Reduction Actions
In fiscal year 2016, we recognized an expense of $33.9 ($24.0 after-tax, or $.11 per share) for severance andother benefits related to cost reduction actions which resulted in the elimination of approximately 700 positions.The expenses related primarily to the Industrial Gases – Americas and the Industrial Gases – EMEA segments.
The following table summarizes the carrying amount of the accrual for cost reduction actions at 30 September2016:
Severance andOther Benefits
2016 Charge $33.9Amount reflected in pension liability (.9)Cash expenditures (20.4)Currency translation adjustment .3
30 September 2016 $12.9
Business Realignment and Reorganization
On 18 September 2014, we announced plans to reorganize the Company, including realignment of ourbusinesses in new reporting segments and other organizational changes, effective as of 1 October 2014. As aresult of this reorganization, we incurred severance and other charges.
In fiscal year 2015, we recognized an expense of $207.7 ($153.2 after-tax, or $.71 per share). Severance andother benefits totaled $151.9 and related to the elimination of approximately 2,000 positions. Asset andassociated contract actions totaled $55.8 and related primarily to a plant shutdown in the Corporate and othersegment and the exit of product lines within the Industrial Gases – Global and Materials Technologies segments.The 2015 charges related to the segments as follows: $31.7 in Industrial Gases – Americas, $52.2 in IndustrialGases – EMEA, $10.3 in Industrial Gases – Asia, $37.0 in Industrial Gases – Global, $27.6 in MaterialsTechnologies, and $48.9 in Corporate and other.
During the fourth quarter of 2014, an expense of $12.7 ($8.2 after-tax, or $.04 per share) was incurred relating tothe elimination of approximately 50 positions. The 2014 charge related to the segments as follows: $2.9 inIndustrial Gases – Americas, $3.1 in Industrial Gases – EMEA, $1.5 in Industrial Gases – Asia, $1.5 in IndustrialGases – Global, $1.6 in Materials Technologies, and $2.1 in Corporate and other.
75

The following table summarizes the carrying amount of the accrual for the business realignment andreorganization at 30 September 2016:
Severance andOther Benefits
AssetActions/Other Total
2014 Charge $12.7 $— $12.7Cash expenditures (2.2) — (2.2)
30 September 2014 $10.5 $— $10.5
2015 Charge 151.9 55.8 207.7Amount reflected in pension liability (14.0) — (14.0)Noncash expenses — (47.4) (47.4)Cash expenditures (113.5) (1.2) (114.7)Currency translation adjustment (.4) — (.4)
30 September 2015 $34.5 $7.2 $41.7
Cash expenditures (34.1) (3.8) (37.9)Currency translation adjustment (.4) — (.4)
30 September 2016 $— $3.4 $3.4
6. BUSINESS COMBINATION
On 30 December 2014, we acquired our partner’s equity ownership interest in a liquefied atmospheric industrialgases production joint venture in North America for $22.6, which increased our ownership from 50% to 100%. Thetransaction was accounted for as a business combination, and subsequent to the acquisition, the results areconsolidated within our Industrial Gases – Americas segment. The assets acquired, primarily plant andequipment, were recorded at their fair market values as of the acquisition date.
The acquisition date fair value of the previously held equity interest was determined using a discounted cash flowanalysis under the income approach. The twelve months ended 30 September 2015 include a gain of $17.9($11.2 after-tax, or $.05 per share) as a result of revaluing our previously held equity interest to fair value as of theacquisition date. This gain is reflected on the consolidated income statements as “Gain on previously held equityinterest.”
7. INVENTORIES
The components of inventories are as follows:
30 September 2016 2015
Inventories at FIFO costFinished goods $456.7 $494.9Work in process 38.2 34.4Raw materials, supplies and other 204.0 229.3
698.9 758.6Less: Excess of FIFO cost over LIFO cost (79.0) (100.8)
Inventories $619.9 $657.8
Inventories valued using the LIFO method comprised 34.9% and 35.8% of consolidated inventories before LIFOadjustment at 30 September 2016 and 2015, respectively. Liquidation of LIFO inventory layers in 2016, 2015, and2014 did not materially affect the results of operations.
FIFO cost approximates replacement cost.
76

8. SUMMARIZED FINANCIAL INFORMATION OF EQUITY AFFILIATES
The summarized financial information below is on a combined 100% basis and has been compiled based onfinancial statements of the companies accounted for by the equity method. The amounts presented include theaccounts of the following equity affiliates:
Abdullah Hashim Industrial Gases & Equipment Co., Ltd. (25%); INOX Air Products Limited (50%);Air Products South Africa (Proprietary) Limited (50%); Jazan Gas Projects Company (25%);Bangkok Cogeneration Company Limited (49%); Kulim Industrial Gases Sdn. Bhd. (50%);Bangkok Industrial Gases Co., Ltd. (49%); Sapio Produzione Idrogeno Ossigeno S.r.l. (49%);Chengdu Air & Gas Products Ltd. (50%); Tecnologia en Nitrogeno S. de R.L. de C.V. (50%);Helap S.A. (50%); Tyczka Industrie-Gases GmbH (50%);High-Tech Gases (Beijing) Co., Ltd. (50%); WuXi Hi-Tech Gas Co., Ltd. (50%);INFRA Group (40%); and principally, other industrial gas producers.
30 September 2016 2015
Current assets $1,449.8 $1,296.4Noncurrent assets 3,063.9 2,607.4Current liabilities 699.2 654.0Noncurrent liabilities 1,540.6 988.0
Year Ended 30 September 2016 2015 2014
Net sales $2,308.5 $2,604.3 $2,808.7Sales less cost of sales 882.6 949.2 984.7Operating income 487.8 524.0 542.9Net income 338.0 351.0 359.5
On 19 April 2015, a joint venture between Air Products and ACWA Holding entered into a 20-year oxygen andnitrogen supply agreement to supply Saudi Aramco’s oil refinery and power plant being built in Jazan, SaudiArabia. Air Products owns 25% of the joint venture and guarantees the repayment of its share of an equity bridgeloan. ACWA also guarantees their share of the loan. As of 30 September 2016 and 2015, other noncurrentliabilities included $94.4 and $67.5, respectively, for our obligation to make future equity contributions based onour proportionate share of the advances received by the joint venture under the loan. During 2016 and 2015, werecorded noncash transactions which resulted in an increase of $26.9 and $67.5, respectively, to our investmentin net assets of and advances to equity affiliates. These noncash transactions have been excluded from theconsolidated statements of cash flows. In total, we expect to invest approximately $100 in this joint venture. Wedetermined that the joint venture is a variable interest entity, for which we are not the primary beneficiary. AirProducts has a long-term sale of equipment contract with the joint venture to engineer, procure, and construct theindustrial gas facilities that will supply the gases to Saudi Aramco.
In December 2015, we sold our investment in Daido Air Products Electronics, Inc. for $15.9, which resulted in again of $.7. The carrying value at time of sale included a $12.8 investment in net assets of and advances to equityaffiliates and a $2.4 foreign currency translation loss that had been deferred in accumulated other comprehensiveloss.
In January 2016, we sold our investment in SembCorp Air Products (HyCo) Pte. Ltd. The transaction did not havea material impact on the financial statements.
There have been no other significant changes to our investments in equity affiliates during fiscal year 2016.
Dividends received from equity affiliates were $96.8, $51.9, and $75.4 in 2016, 2015, and 2014, respectively.
The investment in net assets of and advances to equity affiliates as of 30 September 2016 and 2015 includedinvestment in foreign affiliates of $1,286.0 and $1,262.8, respectively.
As of 30 September 2016 and 2015, the amount of investment in companies accounted for by the equity methodincluded goodwill in the amount of $109.5 and $112.0, respectively.
77

9. PLANT AND EQUIPMENT, NET
The major classes of plant and equipment are as follows:
30 SeptemberUseful Life
in years 2016 2015
Land $232.9 $226.2Buildings 30 1,119.8 1,080.2Production facilities
Industrial Gases – Regional(A) 10 to 20 12,372.1 11,873.8Materials Technologies 10 to 15 859.2 902.7Other 5 to 20 36.0 43.0
Total production facilities 13,267.3 12,819.5Distribution and other machinery and equipment(B) 5 to 25 4,042.1 3,963.1Construction in progress 1,528.0 1,373.8
Plant and equipment, at cost 20,190.1 19,462.8Less: accumulated depreciation 11,337.4 10,717.7
Plant and equipment, net $8,852.7 $8,745.1(A) Depreciable lives of production facilities related to long-term customer supply contracts are matched to the contract lives.(B) The depreciable lives for various types of distribution equipment are 10 to 25 years for cylinders, depending on the nature
and properties of the product; 20 years for tanks; 7.5 years for customer stations; and 5 to 15 years for tractors andtrailers.
Depreciation expense was $893.0, $900.4, and $914.8 in 2016, 2015, and 2014, respectively.
10. GOODWILL
Changes to the carrying amount of consolidated goodwill by segment are as follows:
IndustrialGases–
Americas
IndustrialGases–
EMEA
IndustrialGases–
Asia
IndustrialGases–
GlobalMaterials
Technologies TotalGoodwill, net at 30 September 2014 $327.2 $433.3 $140.0 $21.4 $315.4 $1,237.3Acquisitions and adjustments 2.2 3.2 — — — 5.4Currency translation and other (31.8) (50.0) (6.9) (1.5) (21.2) (111.4)
Goodwill, net at 30 September 2015 $297.6 $386.5 $133.1 $19.9 $294.2 $1,131.3Currency translation and other 11.5 (5.9) 2.1 .3 10.9 18.9
Goodwill, net at 30 September 2016 $309.1 $380.6 $135.2 $20.2 $305.1 $1,150.2
30 September 2016 2015 2014
Goodwill, gross $1,408.8 $1,375.0 $1,522.1Accumulated impairment losses(A) (258.6) (243.7) (284.8)
Goodwill, net $1,150.2 $1,131.3 $1,237.3(A) Amount is attributable to the Industrial Gases – Americas segment and includes currency translation of $46.6, $61.5, and
$20.4 as of 30 September 2016, 2015, and 2014, respectively.
We conduct goodwill impairment testing in the fourth quarter of each fiscal year and whenever events andchanges in circumstances indicate that the carrying value of goodwill might not be recoverable. Our goodwillimpairment test involves a two-step process. In the first step, we estimate the fair value of each reporting unit andcompare it to its carrying value. If the fair value of the reporting unit exceeds its carrying value, goodwill is notimpaired and no further testing is required. If the fair value of the reporting unit is less than its carrying value, weperform a second step to determine the amount of goodwill impairment loss, if any. In the second step, thereporting unit’s fair value is allocated to the assets and liabilities of the reporting unit, including any unrecognizedintangible assets, in an analysis that calculates the implied fair value of goodwill in the same manner as if thereporting unit were being acquired in a business combination. If the implied fair value of the reporting unit’sgoodwill is less than its carrying value, the difference is recorded as a goodwill impairment charge.
78

In the fourth quarter of 2014, we determined that the fair value of each reporting unit exceeded its carrying value,with the exception of the Latin America reporting unit within the Industrial Gases – Americas segment. The LatinAmerica reporting unit is composed predominately of our Indura business with assets and goodwill associatedwith operations in Chile and other Latin American countries. In 2014, economic conditions in Latin America,including the impact of tax legislation in Chile, became less favorable due to increasing inflation, a decline inChilean manufacturing growth, and weaker export demand for many commodities. As a result, our growthprojections for this reporting unit were lowered and we determined that the associated goodwill was impaired. Anoncash goodwill impairment charge of $305.2 was recorded to write down goodwill to its implied fair value as of1 July 2014. This impairment is reflected on our consolidated income statements within “Goodwill and intangibleassets impairment charge.” As of 30 September 2016, accumulated impairment losses were $258.6, due to thecurrency impacts since the loss was recorded on 1 July 2014.
During the fourth quarter of 2016, we conducted our annual goodwill impairment test. We determined that the fairvalue of all our reporting units exceeded their carrying value. There were no indications of impairment.
11. INTANGIBLE ASSETS
The table below provides details of acquired intangible assets:
30 September 2016 30 September 2015
Gross
AccumulatedAmortization/
Impairment Net Gross
AccumulatedAmortization/
Impairment Net
Customer relationships $517.4 $(155.2) $362.2 $507.4 $(129.6) $377.8Patents and technology 76.6 (57.9) 18.7 76.9 (53.3) 23.6Other 81.7 (37.3) 44.4 81.8 (35.0) 46.8
Total finite-lived intangibles 675.7 (250.4) 425.3 666.1 (217.9) 448.2Trade names and trademarks, indefinite-lived 66.2 (3.5) 62.7 63.4 (3.3) 60.1
Total Intangible Assets $741.9 $(253.9) $488.0 $729.5 $(221.2) $508.3
The decrease in net intangible assets from 2015 to 2016 is primarily due to amortization. Amortization expensefor intangible assets was $32.9, $36.0, and $42.1 in 2016, 2015, and 2014, respectively. Refer to Note 1, MajorAccounting Policies, for amortization periods associated with our intangible assets.
In the fourth quarter of 2016, we conducted our annual impairment test of indefinite-lived intangibles and found noindications of impairment.
In the fourth quarter of 2014, we conducted our annual impairment test of indefinite-lived intangibles utilizing theroyalty savings method, a form of the income approach. We determined that the carrying value of trade namesand trademarks were in excess of their fair value, and as a result, we recorded an impairment charge of $4.9 toreduce these assets to their fair value. This impairment is reflected within “Goodwill and intangible assetimpairment charge” on our consolidated income statements. These trade names and trademarks are included inour Industrial Gases – Americas segment.
Projected annual amortization expense for intangible assets as of 30 September 2016 is as follows:
2017 $31.22018 29.52019 27.92020 27.52021 26.1Thereafter 283.1
Total $425.3
79

12. LEASES
Lessee Accounting
Capital leases, primarily for the right to use machinery and equipment, are included with owned plant andequipment on the consolidated balance sheet in the amount of $22.7 and $12.8 at 30 September 2016 and 2015,respectively. Related amounts of accumulated depreciation are $4.8 and $4.3, respectively.
Operating leases principally relate to real estate and also include aircraft, distribution equipment, and vehicles.Certain leases include escalation clauses, renewal, and/or purchase options. Rent expense is recognized on astraight-line basis over the minimum lease term. Rent expense under operating leases, including month-to-monthagreements, was $80.8 in 2016, $88.2 in 2015, and $97.9 in 2014.
At 30 September 2016, minimum payments due under leases are as follows:
CapitalLeases
OperatingLeases
2017 $2.0 $70.52018 1.8 62.52019 1.6 49.92020 1.6 38.42021 2.7 31.6Thereafter 21.3 102.2
Total $31.0 $355.1
The present value of the above future capital lease payments totaled $10.2. Refer to Note 15, Debt.
In addition to the operating lease payments disclosed above, future minimum payments due under leases relatedto discontinued operations (i.e., Tees Valley, United Kingdom ) include approximately $2 in each of the next fiveyears and $40 thereafter, for a total lease commitment of approximately $50.
Lessor Accounting
As discussed under Revenue Recognition in Note 1, Major Accounting Policies, certain contracts associated withfacilities that are built to provide product to a specific customer are required to be accounted for as leases. Leasereceivables, net, are primarily included in noncurrent capital lease receivables on our consolidated balancesheets, with the remaining balance in other receivables and current assets.
The components of lease receivables were as follows:
30 September 2016 2015
Gross minimum lease payments receivable $2,072.6 $2,322.5Unearned interest income (762.7) (888.1)
Lease Receivables, net $1,309.9 $1,434.4
Lease payments collected in 2016, 2015, and 2014 were $186.0, $148.1, and $134.4, respectively. Thesepayments reduced the lease receivable balance by $85.5, $69.3, and $72.7 in 2016, 2015, and 2014,respectively.
At 30 September 2016, minimum lease payments expected to be collected are as follows:
2017 $182.72018 181.42019 175.92020 171.12021 165.1Thereafter 1,196.4
Total $2,072.6
80

13. FINANCIAL INSTRUMENTS
Currency Price Risk Management
Our earnings, cash flows, and financial position are exposed to foreign currency risk from foreign currencydenominated transactions and net investments in foreign operations. It is our policy to minimize our cash flowvolatility from changes in currency exchange rates. This is accomplished by identifying and evaluating the risk thatour cash flows will change in value due to changes in exchange rates and by executing the appropriate strategiesnecessary to manage such exposures. Our objective is to maintain economically balanced currency riskmanagement strategies that provide adequate downside protection.
Forward Exchange Contracts
We enter into forward exchange contracts to reduce the cash flow exposure to foreign currency fluctuationsassociated with highly anticipated cash flows and certain firm commitments, such as the purchase of plant andequipment. We also enter into forward exchange contracts to hedge the cash flow exposure on intercompanyloans. This portfolio of forward exchange contracts consists primarily of Euros and U.S. dollars. The maximumremaining term of any forward exchange contract currently outstanding and designated as a cash flow hedge at30 September 2016 is 2.8 years.
Forward exchange contracts are also used to hedge the value of investments in certain foreign subsidiaries andaffiliates by creating a liability in a currency in which we have a net equity position. The primary currency pairs inthis portfolio of forward exchange contracts are Euros and U.S. dollars and British Pound Sterling and U.S.dollars.
In addition to the forward exchange contracts that are designated as hedges, we utilize forward exchangecontracts that are not designated as hedges. These contracts are used to economically hedge foreign currency-denominated monetary assets and liabilities, primarily working capital. The primary objective of these forwardexchange contracts is to protect the value of foreign currency-denominated monetary assets and liabilities fromthe effects of volatility in foreign exchange rates that might occur prior to their receipt or settlement. This portfolioof forward exchange contracts consists of many different foreign currency pairs, with a profile that changes fromtime to time depending on business activity and sourcing decisions.
The table below summarizes our outstanding currency price risk management instruments:
30 September 2016 30 September 2015
US$Notional
YearsAverageMaturity
US$Notional
YearsAverageMaturity
Forward Exchange Contracts
Cash flow hedges $4,130.3 .5 $4,543.8 .5Net investment hedges 968.2 2.7 491.3 4.0Not designated 2,850.5 .4 863.3 .7
Total Forward Exchange Contracts $7,949.0 .7 $5,898.4 .9
The notional value of forward exchange contracts not designated in the table above increased as a result ofrepayment of certain outstanding intercompany loans prior to their original maturity dates in anticipation of thespin-off of Versum. The forward exchange contracts no longer qualified as cash flow hedges due to the earlyrepayment of the loans. We entered into additional forward exchange contracts to offset these outstandingpositions to eliminate any future earnings impact.
In addition to the above, we use foreign currency-denominated debt to hedge the foreign currency exposures ofour net investment in certain foreign subsidiaries. The designated foreign currency denominated debt and relatedaccrued interest included €920.7 million ($1,034.4) at 30 September 2016 and €687.7 million ($768.4) at30 September 2015. The designated foreign currency-denominated debt is located on the balance sheet in thelong-term debt and current portion of long-term debt line items.
Debt Portfolio Management
It is our policy to identify on a continuing basis the need for debt capital and evaluate the financial risks inherent infunding the Company with debt capital. Reflecting the result of this ongoing review, the debt portfolio and hedging
81

program are managed with the objectives and intent to (1) reduce funding risk with respect to borrowings made byus to preserve our access to debt capital and provide debt capital as required for funding and liquidity purposes,and (2) manage the aggregate interest rate risk and the debt portfolio in accordance with certain debtmanagement parameters.
Interest Rate Management Contracts
We enter into interest rate swaps to change the fixed/variable interest rate mix of our debt portfolio in order tomaintain the percentage of fixed- and variable-rate debt within the parameters set by management. In accordancewith these parameters, the agreements are used to manage interest rate risks and costs inherent in our debtportfolio. Our interest rate management portfolio generally consists of fixed-to-floating interest rate swaps (whichare designated as fair value hedges), pre-issuance interest rate swaps and treasury locks (which hedge theinterest rate risk associated with anticipated fixed-rate debt issuances and are designated as cash flow hedges),and floating-to-fixed interest rate swaps (which are designated as cash flow hedges). At 30 September 2016, theoutstanding interest rate swaps were denominated in U.S. dollars. The notional amount of the interest rate swapagreements is equal to or less than the designated debt being hedged. When interest rate swaps are used tohedge variable-rate debt, the indices of the swaps and the debt to which they are designated are the same. It isour policy not to enter into any interest rate management contracts which lever a move in interest rates on agreater than one-to-one basis.
Cross Currency Interest Rate Swap Contracts
We enter into cross currency interest rate swap contracts when our risk management function deems necessary.These contracts may entail both the exchange of fixed- and floating-rate interest payments periodically over thelife of the agreement and the exchange of one currency for another currency at inception and at a specified futuredate. These contracts effectively convert the currency denomination of a debt instrument into another currency inwhich we have a net equity position while changing the interest rate characteristics of the instrument. Thecontracts are used to hedge either certain net investments in foreign operations or nonfunctional currency cashflows related to intercompany loans. The current cross currency interest rate swap portfolio consists of fixed-to-fixed swaps primarily between U.S. dollars and offshore Chinese Renminbi, U.S. dollars and Chilean Pesos, andU.S. dollars and British Pound Sterling.
The following table summarizes our outstanding interest rate management contracts and cross currency interestrate swaps:
30 September 2016 30 September 2015
US$Notional Pay %
AverageReceive
%
YearsAverageMaturity
US$Notional Pay %
AverageReceive
%
YearsAverageMaturity
Interest rate swaps(fair value hedge) $600.0 LIBOR 2.28% 2.3 $600.0 LIBOR 2.77% 3.3
Cross currency interest rateswaps (net investment hedge) $517.7 3.24% 2.43% 2.6 $609.9 4.06% 2.61% 3.2
Cross currency interest rateswaps (cash flow hedge) $1,088.9 4.77% 2.72% 3.3 $1,055.2 4.29% 2.63% 3.9
Cross currency interest rateswaps (not designated) $27.4 3.62% .81% 1.8 $12.9 3.12% 3.08% 4.1
82

The table below summarizes the fair value and balance sheet location of our outstanding derivatives:
Balance Sheet 30 September Balance Sheet 30 SeptemberLocation 2016 2015 Location 2016 2015
Derivatives Designated as HedgingInstruments:
Forward exchange contracts Other receivables $72.3 $52.1 Accrued liabilities $44.0 $110.7Interest rate management contracts Other receivables 19.9 17.6 Accrued liabilities — —
Other noncurrent Other noncurrentForward exchange contracts assets 44.4 68.5 liabilities 9.1 9.2
Other noncurrent Other noncurrentInterest rate management contracts assets 160.0 153.4 liabilities 12.0 .8
Total Derivatives Designated as HedgingInstruments $296.6 $291.6 $65.1 $120.7
Derivatives Not Designated as HedgingInstruments:
Forward exchange contracts Other receivables $78.7 $3.2 Accrued liabilities $30.0 $3.9Other noncurrent Other noncurrent
Forward exchange contracts assets — 23.3 liabilities — .6Other noncurrent Other noncurrent
Interest rate management contracts assets — .8 liabilities .7 —Total Derivatives Not Designated as
Hedging Instruments $78.7 $27.3 $30.7 $4.5Total Derivatives $375.3 $318.9 $95.8 $125.2
Refer to Note 14, Fair Value Measurements, which defines fair value, describes the method for measuring fairvalue, and provides additional disclosures regarding fair value measurements.
The table below summarizes the gain or loss related to our cash flow hedges, fair value hedges, net investmenthedges, and derivatives not designated as hedging instruments:
Year Ended 30 September
ForwardExchange Contracts
ForeignCurrency
Debt Other(A) Total2016 2015 2016 2015 2016 2015 2016 2015
Cash Flow Hedges, net of tax:Net gain (loss) recognized in OCI (effective portion) $10.5 $(44.9) $— $— $3.2 $9.9 $13.7 $(35.0)Net (gain) loss reclassified from OCI to sales/cost of
sales (effective portion) .2 .6 — — — — .2 .6Net (gain) loss reclassified from OCI to other income
(expense), net (effective portion) (25.7) 35.6 — — (20.3) (20.2) (46.0) 15.4Net (gain) loss reclassified from OCI to interest expense
(effective portion) 6.7 .7 — — 3.3 2.6 10.0 3.3Net (gain) loss reclassified from OCI to other income
(expense), net (ineffective portion) (.2) 1.5 — — — — (.2) 1.5Fair Value Hedges:Net gain (loss) recognized in interest expense(B) $— $— $— $— $(8.8) $9.9 $(8.8) $9.9Net Investment Hedges, net of tax:Net gain (loss) recognized in OCI $17.4 $60.1 $(9.6)$91.4 $35.0 $49.5 $42.8 $201.0Derivatives Not Designated as Hedging
Instruments:Net gain (loss) recognized in other income (expense),
net(C) $(.8) $(7.3) $— $— $(1.6) $.6 $(2.4) $(6.7)(A) Other includes the impact on other comprehensive income (OCI) and earnings primarily related to interest rate and cross
currency interest rate swaps.(B) The impact of fair value hedges noted above was largely offset by recognized gains and losses resulting from the impact
of changes in related interest rates on outstanding debt.(C) The impact of the non-designated hedges noted above was largely offset by recognized gains and losses resulting from
the impact of changes in exchange rates on assets and liabilities denominated in nonfunctional currencies.
83

The amount of cash flow hedges’ unrealized gains and losses at 30 September 2016 that are expected to bereclassified to earnings in the next twelve months is not material.
The cash flows related to all derivative contracts are reported in the operating activities section of theconsolidated statements of cash flows.
Credit Risk-Related Contingent Features
Certain derivative instruments are executed under agreements that require us to maintain a minimum credit ratingwith both Standard & Poor’s and Moody’s. If our credit rating falls below this threshold, the counterparty to thederivative instruments has the right to request full collateralization on the derivatives’ net liability position. The netliability position of derivatives with credit risk-related contingent features was $11.2 as of 30 September 2016 and$.2 as of 30 September 2015. Because our current credit rating is above the various pre-established thresholds,no collateral has been posted on these liability positions.
Counterparty Credit Risk Management
We execute financial derivative transactions with counterparties that are highly rated financial institutions, all ofwhich are investment grade at this time. Some of our underlying derivative agreements give us the right to requirethe institution to post collateral if its credit rating falls below the pre-established thresholds with Standard & Poor’sor Moody’s. The collateral that the counterparties would be required to post was $267.6 as of 30 September 2016and $226.9 as of 30 September 2015. No financial institution is required to post collateral at this time, as all havecredit ratings at or above the threshold.
14. FAIR VALUE MEASUREMENTS
Fair value is defined as an exit price, i.e., the price that would be received to sell an asset or paid to transfer aliability in an orderly transaction between market participants at the measurement date.
The fair value hierarchy prioritizes the inputs to valuation techniques used to measure fair value into three broadlevels as follows:
Level 1—Quoted prices (unadjusted) in active markets for identical assets or liabilities.
Level 2—Inputs that are observable for the asset or liability, either directly or indirectly through marketcorroboration, for substantially the full term of the asset or liability.
Level 3—Inputs that are unobservable for the asset or liability based on our own assumptions (about theassumptions market participants would use in pricing the asset or liability).
The methods and assumptions used to measure the fair value of financial instruments are as follows:
Derivatives
The fair value of our interest rate management contracts and forward exchange contracts are quantified using theincome approach and are based on estimates using standard pricing models. These models take into account thevalue of future cash flows as of the balance sheet date, discounted to a present value using discount factors thatmatch both the time to maturity and currency of the underlying instruments. The computation of the fair values ofthese instruments is generally performed by the Company. These standard pricing models utilize inputs which arederived from or corroborated by observable market data such as interest rate yield curves and currency spot andforward rates. Therefore, the fair value of our derivatives is classified as a level 2 measurement. On an ongoingbasis, we randomly test a subset of our valuations against valuations received from the transaction’s counterpartyto validate the accuracy of our standard pricing models. Counterparties to these derivative contracts are highlyrated financial institutions.
Refer to Note 13, Financial Instruments, for a description of derivative instruments, including details on thebalance sheet line classifications.
Long-term Debt
The fair value of our debt is based on estimates using standard pricing models that take into account the value offuture cash flows as of the balance sheet date, discounted to a present value using discount factors that match
84

both the time to maturity and currency of the underlying instruments. These standard valuation models utilizeobservable market data such as interest rate yield curves and currency spot rates. Therefore, the fair value of ourdebt is classified as a level 2 measurement. We generally perform the computation of the fair value of theseinstruments.
The carrying values and fair values of financial instruments were as follows:
30 September 2016 30 September 2015Carrying Value Fair Value Carrying Value Fair Value
Assets
DerivativesForward exchange contracts $195.4 $195.4 $147.1 $147.1Interest rate management contracts 179.9 179.9 171.8 171.8
Liabilities
DerivativesForward exchange contracts $83.1 $83.1 $124.4 $124.4Interest rate management contracts 12.7 12.7 .8 .8
Long-term debt, including current portion 5,289.4 5,467.2 4,384.7 4,645.7
The carrying amounts reported in the balance sheet for cash and cash items, trade receivables, payables andaccrued liabilities, accrued income taxes, and short-term borrowings approximate fair value due to the short-termnature of these instruments. Accordingly, these items have been excluded from the above table.
The following table summarizes assets and liabilities measured at fair value on a recurring basis in theconsolidated balance sheets:
30 September 2016 30 September 2015Total Level 1 Level 2 Level 3 Total Level 1 Level 2 Level 3
Assets at Fair Value
DerivativesForward exchange contracts $195.4 $— $195.4 $— $147.1 $— $147.1 $—Interest rate management contracts 179.9 — 179.9 — 171.8 — 171.8 —
Total Assets at Fair Value $375.3 $— $375.3 $— $318.9 $— $318.9 $—
Liabilities at Fair Value
DerivativesForward exchange contracts $83.1 $— $83.1 $— $124.4 $— $124.4 $—Interest rate management contracts 12.7 — 12.7 — .8 — .8 —
Total Liabilities at Fair Value $95.8 $— $95.8 $— $125.2 $— $125.2 $—
The following is a tabular presentation of nonrecurring fair value measurements along with the level within the fairvalue hierarchy in which the fair value measurement in its entirety falls:
31 March 2016
Total Level 1 Level 2 Level 3 2016 Loss
Plant and Equipment — Discontinued operations(A) $20.0 $— $— $20.0 $913.5
(A) As a result of our exit from the Energy-from-Waste business, we assessed the recoverability of assets capable of beingmarketed on a secondary equipment market using an orderly liquidation valuation resulting in an impairment loss for thedifference between the orderly liquidation value and net book value of the assets as of 31 March 2016. There have beenno significant changes in the estimated net realizable value as of 30 September 2016. For additional information, see Note4, Discontinued Operations.
85

15. DEBT
The tables below summarize our outstanding debt at 30 September 2016 and 2015:
Total Debt
30 September 2016 2015Short-term borrowings $935.8 $1,494.3Current portion of long-term debt 371.3 435.6Long-term debt 4,918.1 3,949.1Total Debt $6,225.2 $5,879.0
Short-term Borrowings
30 September 2016 2015Bank obligations $133.1 $234.3Commercial paper 802.7 1,260.0Total Short-term Borrowings $935.8 $1,494.3
The weighted average interest rate of short-term borrowings outstanding at 30 September 2016 and 2015 was1.1% and .8%, respectively.
Cash paid for interest, net of amounts capitalized, was $121.1 in 2016, $97.5 in 2015, and $132.4 in 2014.
86
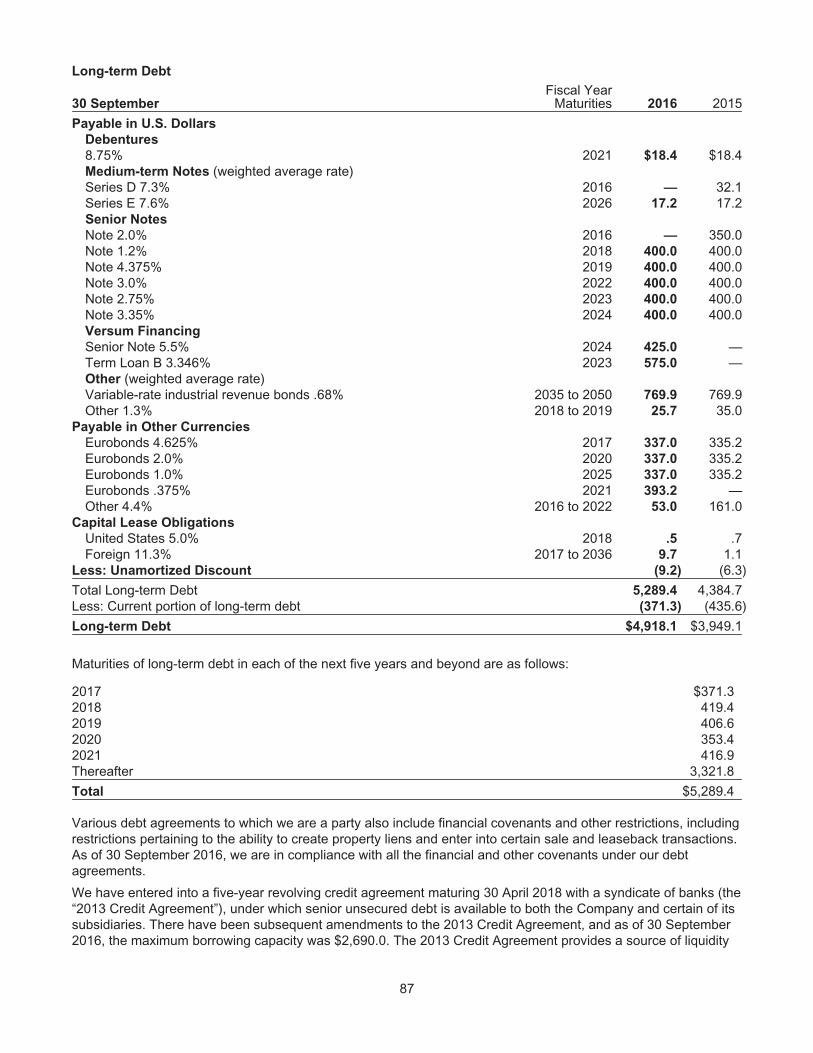
Long-term Debt
30 SeptemberFiscal Year
Maturities 2016 2015
Payable in U.S. Dollars
Debentures
8.75% 2021 $18.4 $18.4Medium-term Notes (weighted average rate)Series D 7.3% 2016 — 32.1Series E 7.6% 2026 17.2 17.2Senior Notes
Note 2.0% 2016 — 350.0Note 1.2% 2018 400.0 400.0Note 4.375% 2019 400.0 400.0Note 3.0% 2022 400.0 400.0Note 2.75% 2023 400.0 400.0Note 3.35% 2024 400.0 400.0Versum Financing
Senior Note 5.5% 2024 425.0 —Term Loan B 3.346% 2023 575.0 —Other (weighted average rate)Variable-rate industrial revenue bonds .68% 2035 to 2050 769.9 769.9Other 1.3% 2018 to 2019 25.7 35.0
Payable in Other Currencies
Eurobonds 4.625% 2017 337.0 335.2Eurobonds 2.0% 2020 337.0 335.2Eurobonds 1.0% 2025 337.0 335.2Eurobonds .375% 2021 393.2 —Other 4.4% 2016 to 2022 53.0 161.0
Capital Lease Obligations
United States 5.0% 2018 .5 .7Foreign 11.3% 2017 to 2036 9.7 1.1
Less: Unamortized Discount (9.2) (6.3)
Total Long-term Debt 5,289.4 4,384.7Less: Current portion of long-term debt (371.3) (435.6)
Long-term Debt $4,918.1 $3,949.1
Maturities of long-term debt in each of the next five years and beyond are as follows:
2017 $371.32018 419.42019 406.62020 353.42021 416.9Thereafter 3,321.8
Total $5,289.4
Various debt agreements to which we are a party also include financial covenants and other restrictions, includingrestrictions pertaining to the ability to create property liens and enter into certain sale and leaseback transactions.As of 30 September 2016, we are in compliance with all the financial and other covenants under our debtagreements.
We have entered into a five-year revolving credit agreement maturing 30 April 2018 with a syndicate of banks (the“2013 Credit Agreement”), under which senior unsecured debt is available to both the Company and certain of itssubsidiaries. There have been subsequent amendments to the 2013 Credit Agreement, and as of 30 September2016, the maximum borrowing capacity was $2,690.0. The 2013 Credit Agreement provides a source of liquidity
87

for the Company and supports its commercial paper program. The Company’s only financial covenant is amaximum ratio of total debt to total capitalization no greater than 70%. No borrowings were outstanding under the2013 Credit Agreement as of 30 September 2016.
On 1 June 2016, we issued a .375% Eurobond for €350 million ($386.9) that matures on 1 June 2021. Theproceeds were used to repay a 2.0% Senior Note of $350.0 that matured on 2 August 2016.
In September 2015, we made a payment of $146.6 to redeem 3,000,000 Unidades de Fomento (“UF”) Series E6.30% Bonds due 22 January 2030 that had a carrying value of $130.0 and resulted in a net loss of $16.6 ($14.2after-tax, or $.07 per share). The loss is reflected on the consolidated income statements as “Loss onextinguishment of debt.”
Additional commitments totaling $51.3 are maintained by our foreign subsidiaries, all of which was borrowed andoutstanding at 30 September 2016.
Versum Financing
On 30 September 2016, in connection with the spin-off, Versum entered into certain financing transactions.Versum continued to maintain the financing, further described below, subsequent to the spin-off which occurredon 1 October 2016. Refer to Note 3, Materials Technologies Separation, for additional information on the spin-off.
Versum issued $425.0 aggregate principal amount of senior unsecured notes (the “Notes”). The Notes bearinterest at a fixed interest rate of 5.50% per annum and will mature on September 30, 2024. In addition, Versumentered into a credit agreement providing for (i) a senior secured first lien term loan B facility in an aggregateprincipal amount of $575.0 (the “Term Facility”) and (ii) a senior secured first lien revolving credit facility in anaggregate principal amount of $200.0 (the “Revolving Facility”). Borrowings under the Term Facility bear interestat a rate per annum of, at Versum’s option, LIBOR, subject to a minimum floor of 0.75%, plus a margin of 2.50%or an alternate base rate, subject to a minimum floor of 1.75%, plus a margin of 1.50%. Borrowings under theRevolving Facility bear interest initially at a rate per annum of, at Versum’s option, LIBOR plus a margin of 2.00%or an alternate base rate plus a margin of 1.00%. The Term Facility amortizes in equal quarterly installments inaggregate annual amounts equal to 1.00% of the original principal amount of the Term Facility, with the balancepayable on 30 September 2023. The Revolving Facility matures on 30 September 2021. Lenders under theRevolving Facility have a maximum first lien net leverage ratio covenant (total debt net of cash on hand to totaladjusted EBITDA) of 3.25:1.00 and certain other customary covenants. On 30 September 2016, the Term Facilitywas fully drawn and no borrowings were outstanding under the Revolving Facility.
16. RETIREMENT BENEFITS
The Company and certain of its subsidiaries sponsor defined benefit pension plans and defined contribution plansthat cover a substantial portion of its worldwide employees. The principal defined benefit pension plans are theU.S. salaried pension plan and the U.K. pension plan. These plans were closed to new participants in 2005 andwere replaced with defined contribution plans. The principal defined contribution plan is the Retirement SavingsPlan, in which a substantial portion of the U.S. employees participate; a similar plan is offered to U.K. employees.We also provide other postretirement benefits consisting primarily of healthcare benefits to U.S. retirees who meetage and service requirements.
88
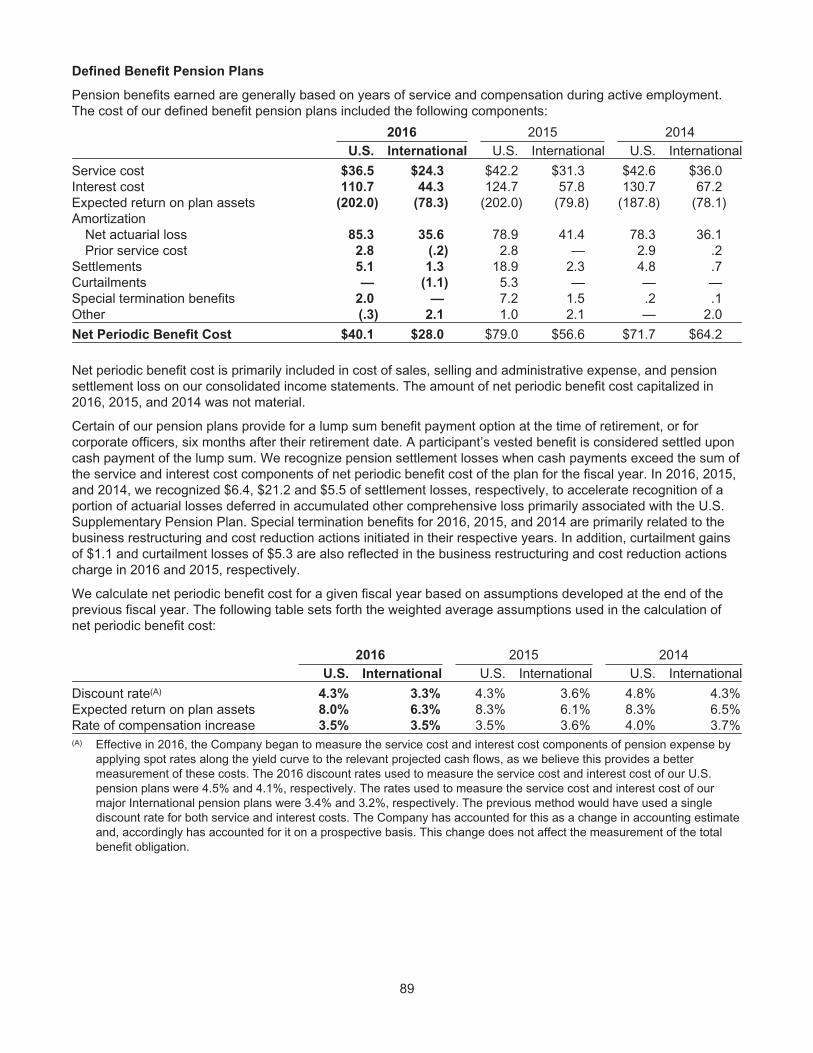
Defined Benefit Pension Plans
Pension benefits earned are generally based on years of service and compensation during active employment.The cost of our defined benefit pension plans included the following components:
2016 2015 2014U.S. International U.S. International U.S. International
Service cost $36.5 $24.3 $42.2 $31.3 $42.6 $36.0Interest cost 110.7 44.3 124.7 57.8 130.7 67.2Expected return on plan assets (202.0) (78.3) (202.0) (79.8) (187.8) (78.1)Amortization
Net actuarial loss 85.3 35.6 78.9 41.4 78.3 36.1Prior service cost 2.8 (.2) 2.8 — 2.9 .2
Settlements 5.1 1.3 18.9 2.3 4.8 .7Curtailments — (1.1) 5.3 — — —Special termination benefits 2.0 — 7.2 1.5 .2 .1Other (.3) 2.1 1.0 2.1 — 2.0
Net Periodic Benefit Cost $40.1 $28.0 $79.0 $56.6 $71.7 $64.2
Net periodic benefit cost is primarily included in cost of sales, selling and administrative expense, and pensionsettlement loss on our consolidated income statements. The amount of net periodic benefit cost capitalized in2016, 2015, and 2014 was not material.
Certain of our pension plans provide for a lump sum benefit payment option at the time of retirement, or forcorporate officers, six months after their retirement date. A participant’s vested benefit is considered settled uponcash payment of the lump sum. We recognize pension settlement losses when cash payments exceed the sum ofthe service and interest cost components of net periodic benefit cost of the plan for the fiscal year. In 2016, 2015,and 2014, we recognized $6.4, $21.2 and $5.5 of settlement losses, respectively, to accelerate recognition of aportion of actuarial losses deferred in accumulated other comprehensive loss primarily associated with the U.S.Supplementary Pension Plan. Special termination benefits for 2016, 2015, and 2014 are primarily related to thebusiness restructuring and cost reduction actions initiated in their respective years. In addition, curtailment gainsof $1.1 and curtailment losses of $5.3 are also reflected in the business restructuring and cost reduction actionscharge in 2016 and 2015, respectively.
We calculate net periodic benefit cost for a given fiscal year based on assumptions developed at the end of theprevious fiscal year. The following table sets forth the weighted average assumptions used in the calculation ofnet periodic benefit cost:
2016 2015 2014U.S. International U.S. International U.S. International
Discount rate(A) 4.3% 3.3% 4.3% 3.6% 4.8% 4.3%Expected return on plan assets 8.0% 6.3% 8.3% 6.1% 8.3% 6.5%Rate of compensation increase 3.5% 3.5% 3.5% 3.6% 4.0% 3.7%(A) Effective in 2016, the Company began to measure the service cost and interest cost components of pension expense by
applying spot rates along the yield curve to the relevant projected cash flows, as we believe this provides a bettermeasurement of these costs. The 2016 discount rates used to measure the service cost and interest cost of our U.S.pension plans were 4.5% and 4.1%, respectively. The rates used to measure the service cost and interest cost of ourmajor International pension plans were 3.4% and 3.2%, respectively. The previous method would have used a singlediscount rate for both service and interest costs. The Company has accounted for this as a change in accounting estimateand, accordingly has accounted for it on a prospective basis. This change does not affect the measurement of the totalbenefit obligation.
89
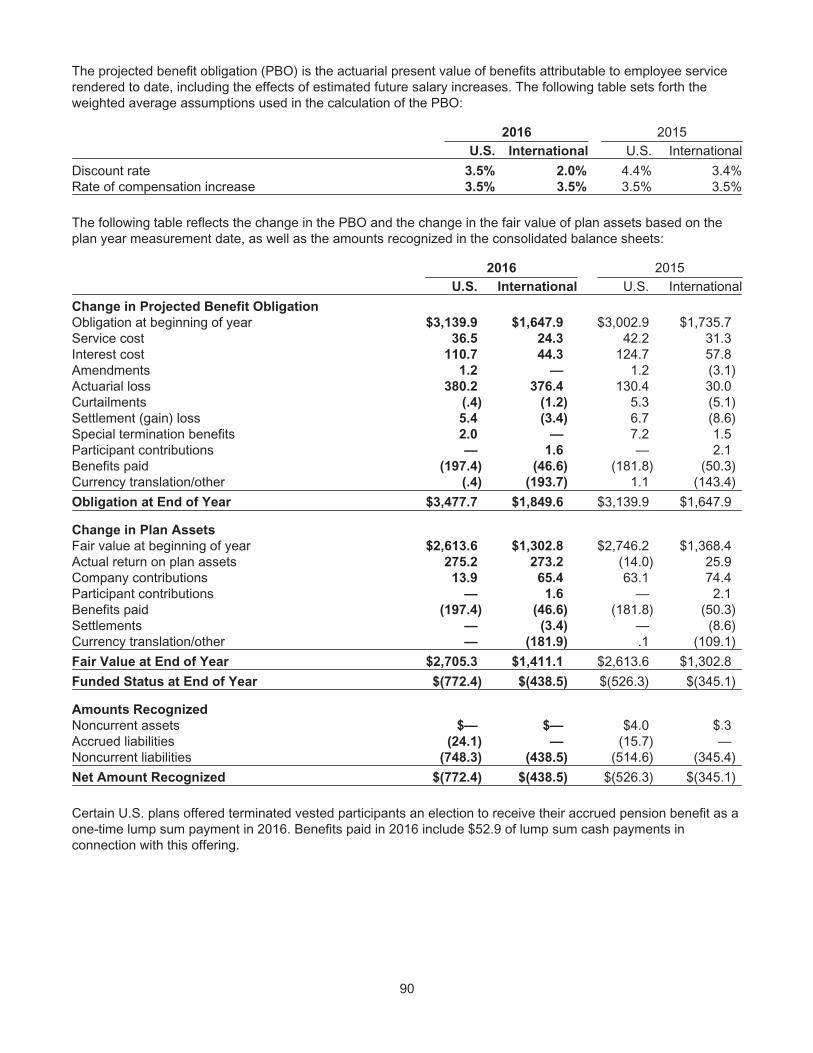
The projected benefit obligation (PBO) is the actuarial present value of benefits attributable to employee servicerendered to date, including the effects of estimated future salary increases. The following table sets forth theweighted average assumptions used in the calculation of the PBO:
2016 2015U.S. International U.S. International
Discount rate 3.5% 2.0% 4.4% 3.4%Rate of compensation increase 3.5% 3.5% 3.5% 3.5%
The following table reflects the change in the PBO and the change in the fair value of plan assets based on theplan year measurement date, as well as the amounts recognized in the consolidated balance sheets:
2016 2015U.S. International U.S. International
Change in Projected Benefit Obligation
Obligation at beginning of year $3,139.9 $1,647.9 $3,002.9 $1,735.7Service cost 36.5 24.3 42.2 31.3Interest cost 110.7 44.3 124.7 57.8Amendments 1.2 — 1.2 (3.1)Actuarial loss 380.2 376.4 130.4 30.0Curtailments (.4) (1.2) 5.3 (5.1)Settlement (gain) loss 5.4 (3.4) 6.7 (8.6)Special termination benefits 2.0 — 7.2 1.5Participant contributions — 1.6 — 2.1Benefits paid (197.4) (46.6) (181.8) (50.3)Currency translation/other (.4) (193.7) 1.1 (143.4)
Obligation at End of Year $3,477.7 $1,849.6 $3,139.9 $1,647.9
Change in Plan Assets
Fair value at beginning of year $2,613.6 $1,302.8 $2,746.2 $1,368.4Actual return on plan assets 275.2 273.2 (14.0) 25.9Company contributions 13.9 65.4 63.1 74.4Participant contributions — 1.6 — 2.1Benefits paid (197.4) (46.6) (181.8) (50.3)Settlements — (3.4) — (8.6)Currency translation/other — (181.9) .1 (109.1)
Fair Value at End of Year $2,705.3 $1,411.1 $2,613.6 $1,302.8
Funded Status at End of Year $(772.4) $(438.5) $(526.3) $(345.1)
Amounts Recognized
Noncurrent assets $— $— $4.0 $.3Accrued liabilities (24.1) — (15.7) —Noncurrent liabilities (748.3) (438.5) (514.6) (345.4)
Net Amount Recognized $(772.4) $(438.5) $(526.3) $(345.1)
Certain U.S. plans offered terminated vested participants an election to receive their accrued pension benefit as aone-time lump sum payment in 2016. Benefits paid in 2016 include $52.9 of lump sum cash payments inconnection with this offering.
90

The changes in plan assets and benefit obligation that have been recognized in other comprehensive income on apretax basis during 2016 and 2015 consist of the following:
2016 2015U.S. International U.S. International
Net actuarial loss arising during the period $311.8 $172.1 $351.8 $79.4Amortization of net actuarial loss (90.4) (36.5) (97.8) (43.3)Prior service cost (credit) arising during the period 1.2 (.1) 1.2 (3.1)Amortization of prior service cost (2.8) .2 (2.8) —
Total $219.8 $135.7 $252.4 $33.0
The net actuarial loss represents the actual changes in the estimated obligation and plan assets that have not yetbeen recognized in the consolidated income statements and are included in accumulated other comprehensiveloss. Actuarial losses arising during 2016 are primarily attributable to lower discount rates, partially offset by ahigher than expected return on plan assets. Accumulated actuarial gains and losses that exceed a corridor areamortized over the average remaining service period of participants, which was approximately 10 years as of30 September 2016.
The components recognized in accumulated other comprehensive loss on a pretax basis at 30 Septemberconsisted of:
2016 2015U.S. International U.S. International
Net actuarial loss $1,273.6 $769.6 $1,052.2 $634.0Prior service cost 8.5 (1.9) 10.1 (2.0)Net transition liability — .4 — .4
Total $1,282.1 $768.1 $1,062.3 $632.4
The amount of accumulated other comprehensive loss at 30 September 2016 that is expected to be recognizedas a component of net periodic pension cost during fiscal year 2017, excluding amounts that may be recognizedthrough settlement losses, is as follows:
U.S. International
Net actuarial loss $103.0 $58.3Prior service cost 2.8 (.2)
The accumulated benefit obligation (ABO) is the actuarial present value of benefits attributed to employee servicerendered to a particular date, based on current salaries. The ABO for all defined benefit pension plans was$4,954.9 and $4,444.8 as of 30 September 2016 and 2015, respectively.
The following table provides information on pension plans where the benefit liability exceeds the value of planassets:
30 September 2016 30 September 2015U.S. International U.S. International
Pension Plans with PBO in Excess of Plan Assets:
PBO $3,477.7 $1,849.6 $2,917.1 $1,644.5Fair value of plan assets 2,705.3 1,411.1 2,386.7 1,299.1
Pension Plans with ABO in Excess of Plan Assets:
ABO $3,242.5 $1,673.6 $2,689.2 $1,498.0Fair value of plan assets 2,705.3 1,370.1 2,386.7 1,263.2
Included in the tables above are several pension arrangements that are not funded because of jurisdictionalpractice. The ABO and PBO related to these plans for 2016 were $108.0 and $115.3, respectively.
91

Pension Plan Assets
Our pension plan investment strategy is to invest in diversified portfolios to earn a long-term return consistent withacceptable risk in order to pay retirement benefits and meet regulatory funding requirements while minimizingcompany cash contributions over time. The plans invest primarily in passive and actively managed equity anddebt securities. Equity investments are diversified geographically and by investment style and marketcapitalization. Fixed income investments include sovereign, corporate and asset-backed securities generallydenominated in the currency of the plan.
Asset allocation targets are established based on the long-term return, volatility and correlation characteristics ofthe asset classes, the profiles of the plans’ liabilities, and acceptable levels of risk. Actual allocations vary fromtarget due to market changes and are reviewed regularly. Assets are routinely rebalanced through contributions,benefit payments, and otherwise as deemed appropriate. The actual and target allocations at the measurementdate are as follows:
2016 Target Allocation 2016 Actual Allocation 2015 Actual AllocationU.S. International U.S. International U.S. International
Asset CategoryEquity securities 60–80% 55–67% 65% 60% 68% 59%Debt securities 20–30% 32–43% 28% 38% 25% 40%Real estate/other 0–10% 0–2% 7% 1% 7% 0%Cash — — 0% 1% 0% 1%Total 100% 100% 100% 100%
The 8.0% expected return for U.S. plan assets is based on a weighted average of estimated long-term returns ofmajor asset classes and the historical performance of plan assets. The estimated long-term return for equity, debtsecurities, and real estate is 8.3%, 5.1%, and 6.9%, respectively. In determining asset class returns, we take intoaccount historical long-term returns and the value of active management, as well as other economic and marketfactors.
The 6.3% expected rate of return for international plan assets is based on a weighted average return for plansoutside the U.S., which vary significantly in size, asset structure and expected returns. The expected asset returnfor the U.K. plan, which represents over 80% of the assets of our International plans, is 6.6% and was derivedfrom expected equity and debt security returns of 7.3% and 3.5%, respectively.
92

The following table summarizes pension plan assets measured at fair value by asset class (see Note 14, FairValue Measurements, for definition of the levels):
30 September 2016 30 September 2015Total Level 1 Level 2 Level 3 Total Level 1 Level 2 Level 3
U.S. Qualified Pension PlansCash and cash equivalents $12.7 $12.7 $— $— $11.1 $11.1 $— $—Equity securities 637.0 637.0 — — 681.7 681.7 — —Equity mutual funds 300.2 300.2 — — 480.1 480.1 — —Equity pooled funds 815.5 — 815.5 — 615.1 — 615.1 —Fixed income:
Bonds (governmentand corporate) 747.8 — 747.8 — 651.4 — 651.4 —
Real estate pooled funds 192.1 — — 192.1 174.2 — — 174.2
Total U.S. Qualified Pension Plans $2,705.3 $949.9 $1,563.3 $192.1 $2,613.6 $1,172.9 $1,266.5 $174.2
International Pension PlansCash and cash equivalents $6.6 $6.6 $— $— $10.1 $10.1 $— $—Equity pooled funds 854.8 — 854.8 — 766.9 — 766.9 —Fixed income pooled funds 486.9 — 486.9 — 465.6 — 465.6 —Other pooled funds 17.0 — 9.7 7.3 14.9 — 8.3 6.6Insurance contracts 45.8 — — 45.8 45.3 — — 45.3Total International Pension Plans $1,411.1 $6.6 $1,351.4 $53.1 $1,302.8 $10.1 $1,240.8 $51.9
The following table summarizes changes in fair value of the pension plan assets classified as Level 3, by assetclass:
Real EstatePooled Funds
OtherPooled Funds
InsuranceContracts Total
30 September 2014 $150.2 $9.3 $59.7 $219.2Actual return on plan assets:
Assets held at end of year 24.0 (.2) (11.1) 12.7Assets sold during the period — .5 — .5
Purchases, sales, and settlements, net — (3.0) (3.3) (6.3)
30 September 2015 $174.2 $6.6 $45.3 $226.1
Actual return on plan assets:Assets held at end of year 17.9 .1 3.2 21.2Assets sold during the period — .3 — .3
Purchases, sales, and settlements, net — .3 (2.7) (2.4)
30 September 2016 $192.1 $7.3 $45.8 $245.2
The descriptions and fair value methodologies for the U.S. and International pension plan assets are as follows:
Cash and Cash Equivalents
The carrying amounts of cash and cash equivalents approximate fair value due to the short-term maturity.
Equity Securities
Equity securities are valued at the closing market price reported on a U.S. or international exchange where thesecurity is actively traded and are therefore classified as Level 1 assets.
Mutual and Pooled Funds
Shares of mutual funds are valued at the net asset value (NAV) of the fund and are classified as Level 1 assets.Units of pooled funds are valued at the per unit NAV determined by the fund manager and are classified as Level2 assets. The investments are utilizing NAV as a practical expedient for fair value.
93
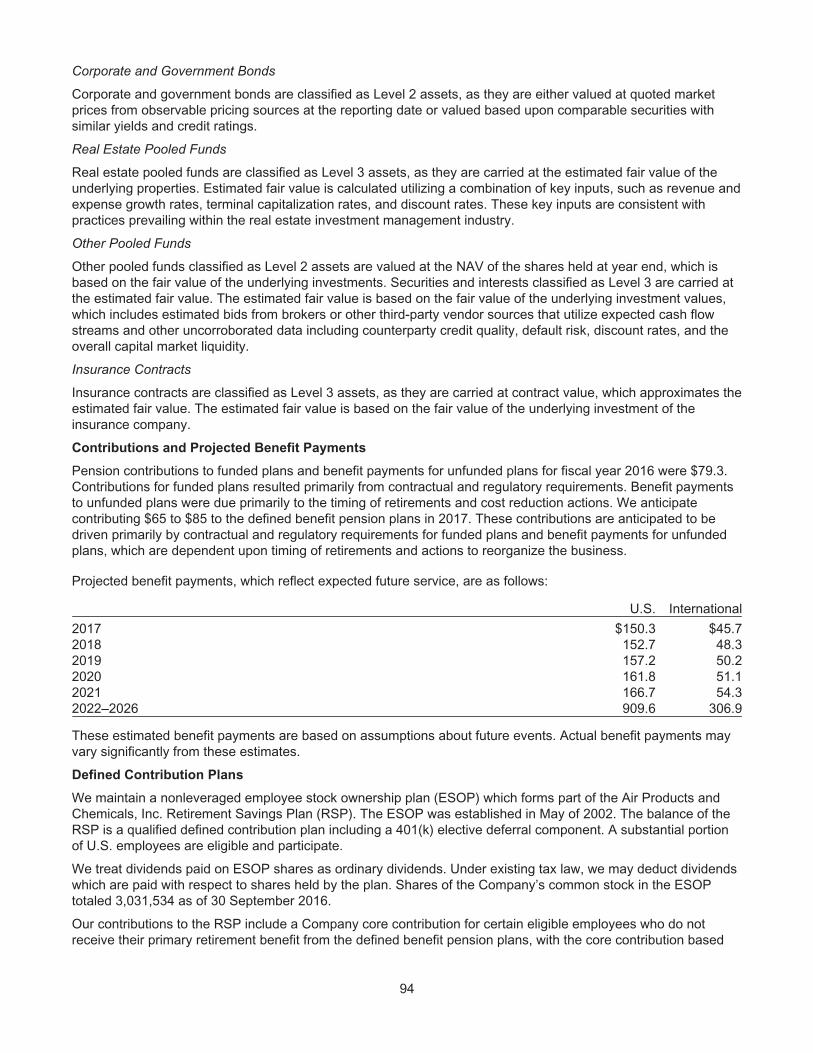
Corporate and Government Bonds
Corporate and government bonds are classified as Level 2 assets, as they are either valued at quoted marketprices from observable pricing sources at the reporting date or valued based upon comparable securities withsimilar yields and credit ratings.
Real Estate Pooled Funds
Real estate pooled funds are classified as Level 3 assets, as they are carried at the estimated fair value of theunderlying properties. Estimated fair value is calculated utilizing a combination of key inputs, such as revenue andexpense growth rates, terminal capitalization rates, and discount rates. These key inputs are consistent withpractices prevailing within the real estate investment management industry.
Other Pooled Funds
Other pooled funds classified as Level 2 assets are valued at the NAV of the shares held at year end, which isbased on the fair value of the underlying investments. Securities and interests classified as Level 3 are carried atthe estimated fair value. The estimated fair value is based on the fair value of the underlying investment values,which includes estimated bids from brokers or other third-party vendor sources that utilize expected cash flowstreams and other uncorroborated data including counterparty credit quality, default risk, discount rates, and theoverall capital market liquidity.
Insurance Contracts
Insurance contracts are classified as Level 3 assets, as they are carried at contract value, which approximates theestimated fair value. The estimated fair value is based on the fair value of the underlying investment of theinsurance company.
Contributions and Projected Benefit Payments
Pension contributions to funded plans and benefit payments for unfunded plans for fiscal year 2016 were $79.3.Contributions for funded plans resulted primarily from contractual and regulatory requirements. Benefit paymentsto unfunded plans were due primarily to the timing of retirements and cost reduction actions. We anticipatecontributing $65 to $85 to the defined benefit pension plans in 2017. These contributions are anticipated to bedriven primarily by contractual and regulatory requirements for funded plans and benefit payments for unfundedplans, which are dependent upon timing of retirements and actions to reorganize the business.
Projected benefit payments, which reflect expected future service, are as follows:
U.S. International
2017 $150.3 $45.72018 152.7 48.32019 157.2 50.22020 161.8 51.12021 166.7 54.32022–2026 909.6 306.9
These estimated benefit payments are based on assumptions about future events. Actual benefit payments mayvary significantly from these estimates.
Defined Contribution Plans
We maintain a nonleveraged employee stock ownership plan (ESOP) which forms part of the Air Products andChemicals, Inc. Retirement Savings Plan (RSP). The ESOP was established in May of 2002. The balance of theRSP is a qualified defined contribution plan including a 401(k) elective deferral component. A substantial portionof U.S. employees are eligible and participate.
We treat dividends paid on ESOP shares as ordinary dividends. Under existing tax law, we may deduct dividendswhich are paid with respect to shares held by the plan. Shares of the Company’s common stock in the ESOPtotaled 3,031,534 as of 30 September 2016.
Our contributions to the RSP include a Company core contribution for certain eligible employees who do notreceive their primary retirement benefit from the defined benefit pension plans, with the core contribution based
94
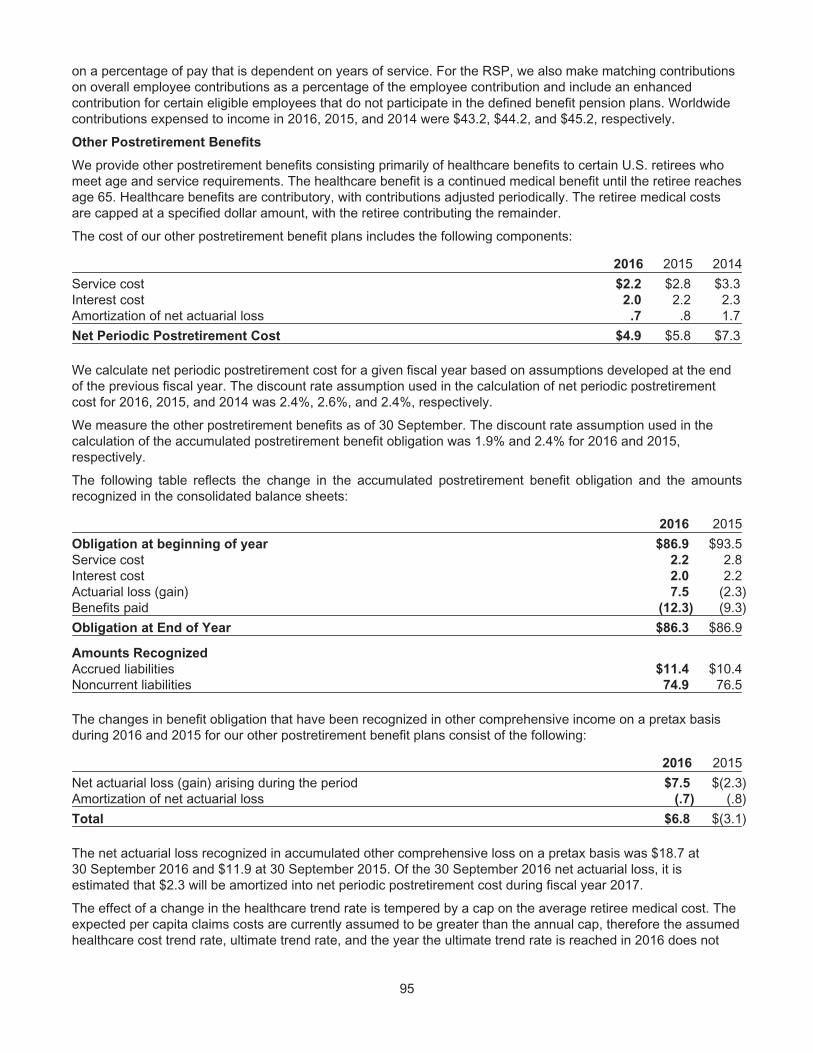
on a percentage of pay that is dependent on years of service. For the RSP, we also make matching contributionson overall employee contributions as a percentage of the employee contribution and include an enhancedcontribution for certain eligible employees that do not participate in the defined benefit pension plans. Worldwidecontributions expensed to income in 2016, 2015, and 2014 were $43.2, $44.2, and $45.2, respectively.
Other Postretirement Benefits
We provide other postretirement benefits consisting primarily of healthcare benefits to certain U.S. retirees whomeet age and service requirements. The healthcare benefit is a continued medical benefit until the retiree reachesage 65. Healthcare benefits are contributory, with contributions adjusted periodically. The retiree medical costsare capped at a specified dollar amount, with the retiree contributing the remainder.
The cost of our other postretirement benefit plans includes the following components:
2016 2015 2014
Service cost $2.2 $2.8 $3.3Interest cost 2.0 2.2 2.3Amortization of net actuarial loss .7 .8 1.7
Net Periodic Postretirement Cost $4.9 $5.8 $7.3
We calculate net periodic postretirement cost for a given fiscal year based on assumptions developed at the endof the previous fiscal year. The discount rate assumption used in the calculation of net periodic postretirementcost for 2016, 2015, and 2014 was 2.4%, 2.6%, and 2.4%, respectively.
We measure the other postretirement benefits as of 30 September. The discount rate assumption used in thecalculation of the accumulated postretirement benefit obligation was 1.9% and 2.4% for 2016 and 2015,respectively.
The following table reflects the change in the accumulated postretirement benefit obligation and the amountsrecognized in the consolidated balance sheets:
2016 2015
Obligation at beginning of year $86.9 $93.5Service cost 2.2 2.8Interest cost 2.0 2.2Actuarial loss (gain) 7.5 (2.3)Benefits paid (12.3) (9.3)
Obligation at End of Year $86.3 $86.9
Amounts Recognized
Accrued liabilities $11.4 $10.4Noncurrent liabilities 74.9 76.5
The changes in benefit obligation that have been recognized in other comprehensive income on a pretax basisduring 2016 and 2015 for our other postretirement benefit plans consist of the following:
2016 2015
Net actuarial loss (gain) arising during the period $7.5 $(2.3)Amortization of net actuarial loss (.7) (.8)
Total $6.8 $(3.1)
The net actuarial loss recognized in accumulated other comprehensive loss on a pretax basis was $18.7 at30 September 2016 and $11.9 at 30 September 2015. Of the 30 September 2016 net actuarial loss, it isestimated that $2.3 will be amortized into net periodic postretirement cost during fiscal year 2017.
The effect of a change in the healthcare trend rate is tempered by a cap on the average retiree medical cost. Theexpected per capita claims costs are currently assumed to be greater than the annual cap, therefore the assumedhealthcare cost trend rate, ultimate trend rate, and the year the ultimate trend rate is reached in 2016 does not
95

apply as it has no impact on plan obligations. For 2015, the healthcare trend rate was 7%, the ultimate trend ratewas 5%, and the year the ultimate trend rate is reached was 2019.
Projected benefit payments are as follows:
2017 $11.52018 11.02019 10.72020 10.22021 9.72022–2026 35.3
These estimated benefit payments are based on assumptions about future events. Actual benefit payments mayvary significantly from these estimates.
17. COMMITMENTS AND CONTINGENCIES
LITIGATION
We are involved in various legal proceedings, including commercial, competition, environmental, health, safety,product liability, and insurance matters. In September 2010, the Brazilian Administrative Council for EconomicDefense (CADE) issued a decision against our Brazilian subsidiary, Air Products Brasil Ltda., and several otherBrazilian industrial gas companies for alleged anticompetitive activities. CADE imposed a civil fine of R$179.2million (approximately $55 at 30 September 2016) on Air Products Brasil Ltda. This fine was based on arecommendation by a unit of the Brazilian Ministry of Justice, whose investigation began in 2003, allegingviolation of competition laws with respect to the sale of industrial and medical gases. The fines are based on apercentage of our total revenue in Brazil in 2003.
We have denied the allegations made by the authorities and filed an appeal in October 2010 with the Braziliancourts. On 6 May 2014, our appeal was granted and the fine against Air Products Brasil Ltda. was dismissed.CADE has appealed that ruling and the matter remains pending. We, with advice of our outside legal counsel,have assessed the status of this matter and have concluded that, although an adverse final judgment afterexhausting all appeals is possible, such a judgment is not probable. As a result, no provision has been made inthe consolidated financial statements. We estimate the maximum possible loss to be the full amount of the fine ofR$179.2 million (approximately $55 at 30 September 2016) plus interest accrued thereon until final disposition ofthe proceedings.
Other than this matter, we do not currently believe there are any legal proceedings, individually or in theaggregate, that are reasonably possible to have a material impact on our financial condition, results of operations,or cash flows.
ENVIRONMENTAL
In the normal course of business, we are involved in legal proceedings under the Comprehensive EnvironmentalResponse, Compensation, and Liability Act (CERCLA: the federal Superfund law); Resource Conservation andRecovery Act (RCRA); and similar state and foreign environmental laws relating to the designation of certain sitesfor investigation or remediation. Presently, there are approximately 33 sites on which a final settlement has notbeen reached where we, along with others, have been designated a potentially responsible party by theEnvironmental Protection Agency or are otherwise engaged in investigation or remediation, including cleanupactivity at certain of our current and former manufacturing sites. We continually monitor these sites for which wehave environmental exposure.
Accruals for environmental loss contingencies are recorded when it is probable that a liability has been incurredand the amount of loss can be reasonably estimated. The consolidated balance sheets at 30 September 2016and 2015 included an accrual of $81.4 and $80.6, respectively, primarily as part of other noncurrent liabilities. Theenvironmental liabilities will be paid over a period of up to 30 years. We estimate the exposure for environmentalloss contingencies to range from $81 to a reasonably possible upper exposure of $95 as of 30 September 2016.
96

Actual costs to be incurred at identified sites in future periods may vary from the estimates, given inherentuncertainties in evaluating environmental exposures. Using reasonably possible alternative assumptions of theexposure level could result in an increase to the environmental accrual. Due to the inherent uncertainties relatedto environmental exposures, a significant increase to the reasonably possible upper exposure level could occur ifa new site is designated, the scope of remediation is increased, a different remediation alternative is identified, ora significant increase in our proportionate share occurs. We do not expect that any sum we may have to pay inconnection with environmental matters in excess of the amounts recorded or disclosed above would have amaterial adverse impact on our financial position or results of operations in any one year.
Pace
At 30 September 2016, $30.1 of the environmental accrual was related to the Pace facility.
In 2006, we sold our Amines business, which included operations at Pace, Florida, and recognized a liability forretained environmental obligations associated with remediation activities at Pace. We are required by the FloridaDepartment of Environmental Protection (FDEP) and the United States Environmental Protection Agency(USEPA) to continue our remediation efforts. We estimated that it would take 20 years to complete thegroundwater remediation, and the costs through completion were estimated to range from $42 to $52. As noamount within the range was a better estimate than another, we recognized a pretax expense in fiscal 2006 of$42 as a component of income from discontinued operations and recorded an environmental accrual of $42 incontinuing operations on the consolidated balance sheets. There has been no change to the estimated exposurerange related to the Pace facility.
We have implemented many of the remedial corrective measures at the Pace facility required under 1995Consent Orders issued by the FDEP and the USEPA. Contaminated soils have been bioremediated, and thetreated soils have been secured in a lined on-site disposal cell. Several groundwater recovery systems have beeninstalled to contain and remove contamination from groundwater. We completed an extensive assessment of thesite to determine how well existing measures are working, what additional corrective measures may be needed,and whether newer remediation technologies that were not available in the 1990s might be suitable to morequickly and effectively remove groundwater contaminants. Based on assessment results, we completed a focusedfeasibility study that has identified alternative approaches that may more effectively remove contaminants. Wecontinue to review alternative remedial approaches with the FDEP. In the first quarter of 2015, we entered into anew Consent Order with the FDEP requiring us to continue our remediation efforts at the Pace facility. The costswe are incurring under the new Consent Order are expected to be consistent with our previous estimates.
Piedmont
At 30 September 2016, $17.5 of the environmental accrual was related to the Piedmont site.
On 30 June 2008, we sold our Elkton, Maryland, and Piedmont, South Carolina, production facilities and therelated North American atmospheric emulsions and global pressure sensitive adhesives businesses. Inconnection with the sale, we recognized a liability for retained environmental obligations associated withremediation activities at the Piedmont site. This site is under active remediation for contamination caused by aninsolvent prior owner. We are required by the South Carolina Department of Health and Environmental Control toaddress both contaminated soil and groundwater. Numerous areas of soil contamination have been addressed,and contaminated groundwater is being recovered and treated. We estimate that it will take until 2019 to completesource area remediation with groundwater recovery and treatment, continuing through 2029. Thereafter, we areexpecting this site to go into a state of monitored natural attenuation through 2047. We recognized a pretaxexpense in 2008 of $24 as a component of income from discontinued operations and recorded an environmentalliability of $24 in continuing operations on the consolidated balance sheets. There have been no significantchanges to the estimated exposure.
Pasadena
At 30 September 2016, $10.4 of the environmental accrual was related to the Pasadena site.
During the fourth quarter of 2012, management committed to permanently shutting down our polyurethaneintermediates (PUI) production facility in Pasadena, Texas. In shutting down and dismantling the facility, we haveundertaken certain obligations related to soil and groundwater contaminants. We have been pumping and treatinggroundwater to control off-site contaminant migration in compliance with regulatory requirements and under the
97
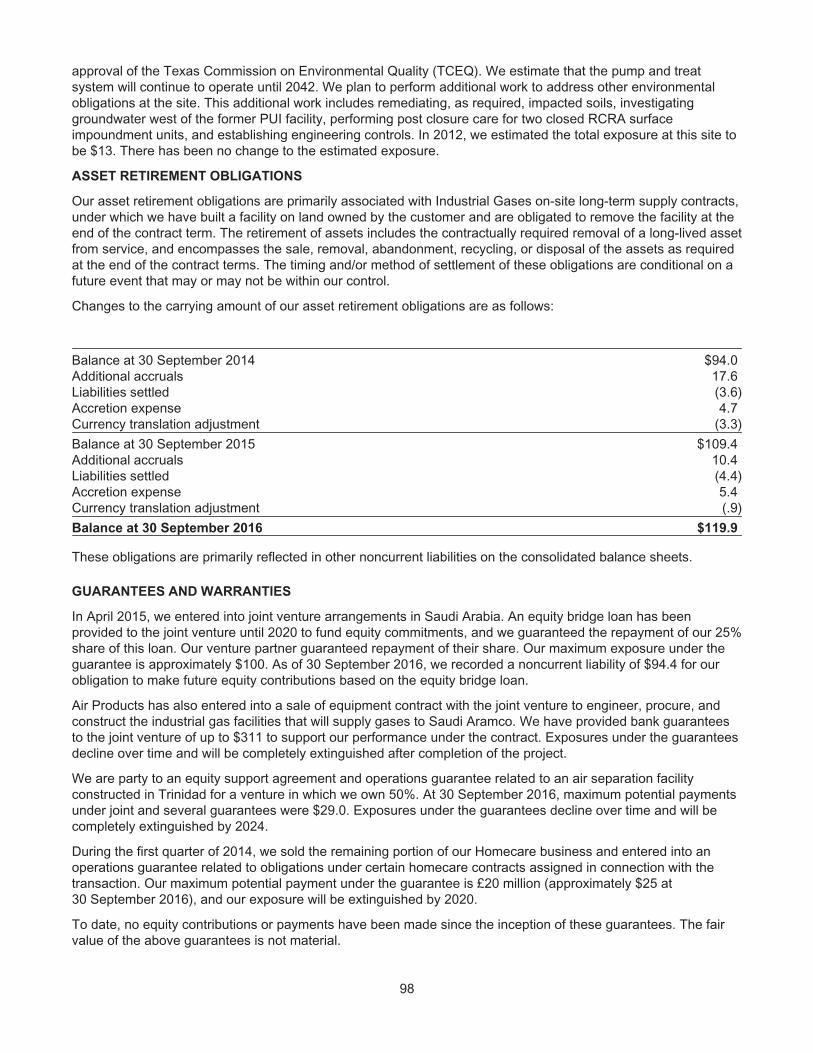
approval of the Texas Commission on Environmental Quality (TCEQ). We estimate that the pump and treatsystem will continue to operate until 2042. We plan to perform additional work to address other environmentalobligations at the site. This additional work includes remediating, as required, impacted soils, investigatinggroundwater west of the former PUI facility, performing post closure care for two closed RCRA surfaceimpoundment units, and establishing engineering controls. In 2012, we estimated the total exposure at this site tobe $13. There has been no change to the estimated exposure.
ASSET RETIREMENT OBLIGATIONS
Our asset retirement obligations are primarily associated with Industrial Gases on-site long-term supply contracts,under which we have built a facility on land owned by the customer and are obligated to remove the facility at theend of the contract term. The retirement of assets includes the contractually required removal of a long-lived assetfrom service, and encompasses the sale, removal, abandonment, recycling, or disposal of the assets as requiredat the end of the contract terms. The timing and/or method of settlement of these obligations are conditional on afuture event that may or may not be within our control.
Changes to the carrying amount of our asset retirement obligations are as follows:
Balance at 30 September 2014 $94.0Additional accruals 17.6Liabilities settled (3.6)Accretion expense 4.7Currency translation adjustment (3.3)
Balance at 30 September 2015 $109.4Additional accruals 10.4Liabilities settled (4.4)Accretion expense 5.4Currency translation adjustment (.9)
Balance at 30 September 2016 $119.9
These obligations are primarily reflected in other noncurrent liabilities on the consolidated balance sheets.
GUARANTEES AND WARRANTIES
In April 2015, we entered into joint venture arrangements in Saudi Arabia. An equity bridge loan has beenprovided to the joint venture until 2020 to fund equity commitments, and we guaranteed the repayment of our 25%share of this loan. Our venture partner guaranteed repayment of their share. Our maximum exposure under theguarantee is approximately $100. As of 30 September 2016, we recorded a noncurrent liability of $94.4 for ourobligation to make future equity contributions based on the equity bridge loan.
Air Products has also entered into a sale of equipment contract with the joint venture to engineer, procure, andconstruct the industrial gas facilities that will supply gases to Saudi Aramco. We have provided bank guaranteesto the joint venture of up to $311 to support our performance under the contract. Exposures under the guaranteesdecline over time and will be completely extinguished after completion of the project.
We are party to an equity support agreement and operations guarantee related to an air separation facilityconstructed in Trinidad for a venture in which we own 50%. At 30 September 2016, maximum potential paymentsunder joint and several guarantees were $29.0. Exposures under the guarantees decline over time and will becompletely extinguished by 2024.
During the first quarter of 2014, we sold the remaining portion of our Homecare business and entered into anoperations guarantee related to obligations under certain homecare contracts assigned in connection with thetransaction. Our maximum potential payment under the guarantee is £20 million (approximately $25 at30 September 2016), and our exposure will be extinguished by 2020.
To date, no equity contributions or payments have been made since the inception of these guarantees. The fairvalue of the above guarantees is not material.
98

We, in the normal course of business operations, have issued product warranties related to equipment sales.Also, contracts often contain standard terms and conditions which typically include a warranty and indemnificationto the buyer that the goods and services purchased do not infringe on third-party intellectual property rights. Theprovision for estimated future costs relating to warranties is not material to the consolidated financial statements.
We do not expect that any sum we may have to pay in connection with guarantees and warranties will have amaterial adverse effect on our consolidated financial condition, liquidity, or results of operations.
UNCONDITIONAL PURCHASE OBLIGATIONS
We are obligated to make future payments under unconditional purchase obligations as summarized below:
2017 $9422018 5252019 3072020 2982021 276Thereafter 2,983
Total $5,331
Approximately $4,000 of our unconditional purchase obligations relate to helium purchases, which include crudefeedstock supply to multiple helium refining plants in North America as well as refined helium purchases fromsources around the world. As a rare byproduct of natural gas production in the energy sector, these heliumsourcing agreements are medium- to long-term and contain take-or-pay provisions. The refined helium isdistributed globally and sold as a merchant gas, primarily under medium-term requirements contracts. Whilecontract terms in the energy sector are longer than those in merchant, helium is a rare gas used in applicationswith few or no substitutions because of its unique physical and chemical properties.
Approximately $330 of our long-term unconditional purchase obligations relate to feedstock supply for numerousHyCO (hydrogen, carbon monoxide, and syngas) facilities. The price of feedstock supply is principally related tothe price of natural gas. However, long-term take-or-pay sales contracts to HyCO customers are generallymatched to the term of the feedstock supply obligations and provide recovery of price increases in the feedstocksupply. Due to the matching of most long-term feedstock supply obligations to customer sales contracts, we donot believe these purchase obligations would have a material effect on our financial condition or results ofoperations.
The unconditional purchase obligations also include other product supply and purchase commitments and electricpower and natural gas supply purchase obligations, which are primarily pass-through contracts with ourcustomers.
Purchase commitments to spend approximately $350 for additional plant and equipment are included in theunconditional purchase obligations in 2017. In addition, we have purchase commitments totaling approximately$500 in 2017 and 2018 relating to our long-term sale of equipment project for Saudi Aramco’s Jazan oil refinery.
18. CAPITAL STOCK
Common Stock
Authorized common stock consists of 300 million shares with a par value of $1 per share. As of 30 September2016, 249 million shares were issued, with 217 million outstanding.
On 15 September 2011, the Board of Directors authorized the repurchase of up to $1,000 of our outstandingcommon stock. We repurchase shares pursuant to Rules 10b5-1 and 10b-18 under the Securities Exchange Actof 1934, as amended, through repurchase agreements established with several brokers. We did not purchase anyof our outstanding shares during fiscal year 2016. At 30 September 2016, $485.3 in share repurchaseauthorization remains.
99

The following table reflects the changes in common shares:
Year ended 30 September 2016 2015 2014
Number of Common Shares Outstanding
Balance, beginning of year 215,359,113 213,538,144 211,179,257Issuance of treasury shares for stock option and award plans 1,991,712 1,820,969 2,358,887
Balance, end of year 217,350,825 215,359,113 213,538,144
Preferred Stock
Authorized preferred stock consists of 25 million shares with a par value of $1 per share, of which 2.5 million weredesignated as Series A Junior Participating Preferred Stock. There were no shares issued or outstanding as of30 September 2016 and 2015.
19. SHARE-BASED COMPENSATION
We have various share-based compensation programs, which include deferred stock units, stock options, andrestricted stock. Under all programs, the terms of the awards are fixed at the grant date. We issue shares fromtreasury stock upon the payout of deferred stock units, the exercise of stock options, and the issuance ofrestricted stock awards. As of 30 September 2016, there were 4,840,837 shares available for future grant underour Long-Term Incentive Plan, which is shareholder approved.
Share-based compensation cost recognized in the consolidated income statements is summarized below:
2016 2015 2014
Before-Tax Share-Based Compensation Cost $37.6 $45.7 $44.0Income tax benefit (13.1) (16.0) (15.6)
After-Tax Share-Based Compensation Cost $24.5 $29.7 $28.4
Before-tax share-based compensation cost is primarily included in selling and administrative expense on ourconsolidated income statements. The amount of share-based compensation cost capitalized in 2016, 2015, and2014 was not material.
Total before-tax share-based compensation cost by type of program was as follows:
2016 2015 2014
Deferred stock units $29.9 $28.8 $20.2Stock options 4.2 12.6 21.6Restricted stock 3.5 4.3 2.2
Before-Tax Share-Based Compensation Cost $37.6 $45.7 $44.0
Deferred Stock Units
We have granted deferred stock units to executives, selected employees, and outside directors. These deferredstock units entitle the recipient to one share of common stock upon vesting, which is conditioned, for employeerecipients, on continued employment during the deferral period and may be conditioned on achieving certainperformance targets. We grant deferred stock unit awards with a two to five year deferral period that is subject topayout upon death, disability, or retirement. Deferred stock units issued to outside directors are paid after serviceon the Board of Directors ends at the time elected by the director (not to exceed 10 years after service ends). Wegenerally expense the grant-date fair value of these awards on a straight-line basis over the vesting period;however, expense recognition is accelerated for retirement eligible individuals who meet the requirements forvesting upon retirement.
In 2015, we granted 119,272 market-based deferred stock units. The market-based deferred stock units vest aslong as the employee continues to be employed by the Company and upon the achievement of the performancetarget. The performance target, which is approved by the Compensation Committee, is the Company’s totalshareholder return (share price appreciation and dividends paid) in relation to a defined peer group over a three-year performance period.
100

In 2016, we granted 130,167 market-based deferred stock units. The market-based deferred stock units areearned out at the end of a three-year performance period beginning 1 October 2015 and ending 30 September2018.
The fair value of market-based deferred stock units was estimated using a Monte Carlo simulation model as theseequity awards are tied to a market condition. The model utilizes multiple input variables that determine theprobability of satisfying the market condition stipulated in the grant and calculates the fair value of the awards. Wegenerally expense the grant-date fair value of these awards on a straight line basis over the vesting period. Thecalculation of the fair value of market-based deferred stock units used the following assumptions:
2016 2015
Expected volatility 20.5 % 19.6 %Risk-free interest rate 1.2 % .9 %Expected dividend yield 2.2 % 2.5 %
The estimated grant-date fair value of market-based deferred stock units was $135.49 and $194.51 per unit in2016 and 2015.
In addition, during 2016, we granted 153,792 time-based deferred stock units at a weighted average grant-datefair value of $137.12.
Deferred Stock Units Shares (000)Weighted Average
Grant-Date Fair Value
Outstanding at 30 September 2015 1,056 $102.01Granted 284 136.37Paid out (299) 77.81Forfeited/adjustments (40) 90.83
Outstanding at 30 September 2016 1,001 $119.44
Cash payments made for deferred stock units were $2.9, $9.6, and $2.1 in 2016, 2015, and 2014, respectively.As of 30 September 2016, there was $41.4 of unrecognized compensation cost related to deferred stock units.The cost is expected to be recognized over a weighted average period of 2.2 years. The total fair value ofdeferred stock units paid out during 2016, 2015, and 2014, including shares vested in prior periods, was $41.6,$35.5, and $31.8, respectively.
Stock Options
We have granted awards of options to purchase common stock to executives and selected employees. Theexercise price of stock options equals the market price of our stock on the date of the grant. Options generallyvest incrementally over three years, and remain exercisable for ten years from the date of grant. In 2016, no stockoptions were awarded.
Fair values of stock options were estimated using a Black Scholes model that used the assumptions noted in thetable below. Expected volatility and expected dividend yield are based on actual historical experience of our stockand dividends over the historical period equal to the expected life. The expected life represents the period of timethat options granted are expected to be outstanding based on an analysis of Company-specific historical exercisedata. Ranges are used when certain groups of employees exhibit different behavior, such as timing of exercise.The risk-free rate is based on the U.S. Treasury Strips with terms equal to the expected time of exercise as of thegrant date.
2015 2014
Expected volatility 30.3% 29.8%–31.1%Expected dividend yield 2.6% 2.4–2.9%Expected life (in years) 7.5 6.5–8.4Risk-free interest rate 2.2% 2.0%–2.7%
The weighted average grant-date fair value of options granted during 2015 and 2014 was $37.19 and $29.10 peroption, respectively.
101
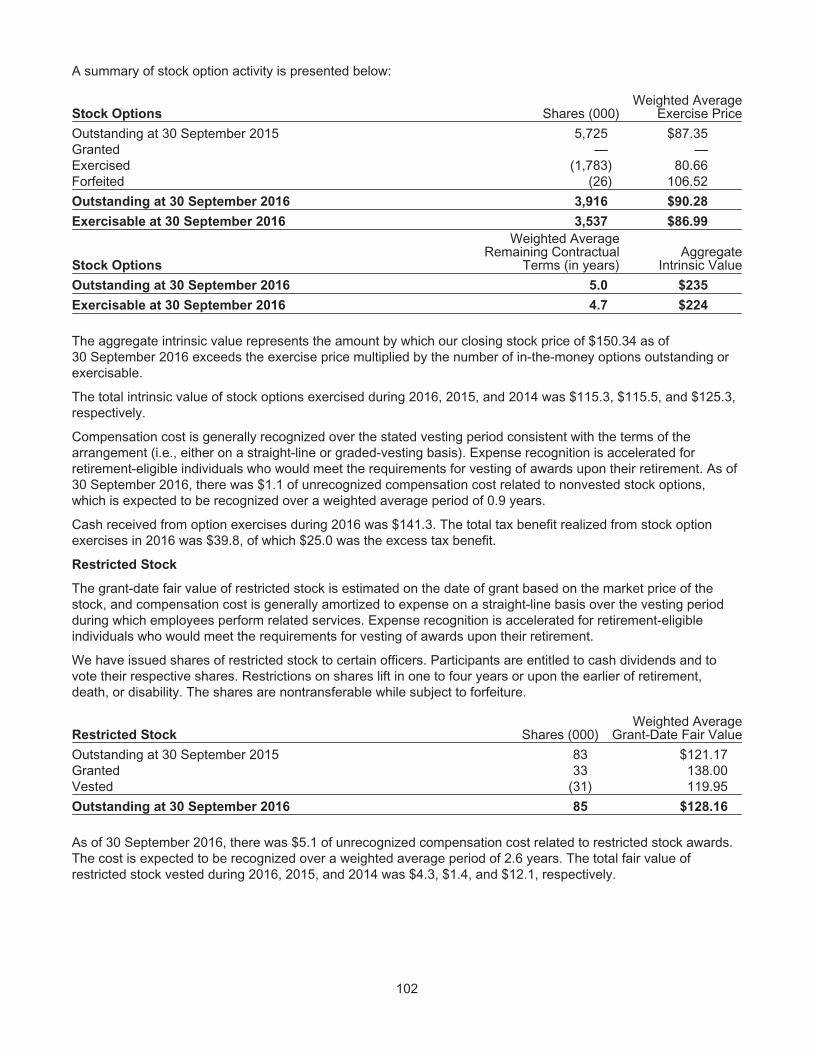
A summary of stock option activity is presented below:
Stock Options Shares (000)Weighted Average
Exercise Price
Outstanding at 30 September 2015 5,725 $87.35Granted — —Exercised (1,783) 80.66Forfeited (26) 106.52
Outstanding at 30 September 2016 3,916 $90.28
Exercisable at 30 September 2016 3,537 $86.99
Stock Options
Weighted AverageRemaining Contractual
Terms (in years)Aggregate
Intrinsic Value
Outstanding at 30 September 2016 5.0 $235
Exercisable at 30 September 2016 4.7 $224
The aggregate intrinsic value represents the amount by which our closing stock price of $150.34 as of30 September 2016 exceeds the exercise price multiplied by the number of in-the-money options outstanding orexercisable.
The total intrinsic value of stock options exercised during 2016, 2015, and 2014 was $115.3, $115.5, and $125.3,respectively.
Compensation cost is generally recognized over the stated vesting period consistent with the terms of thearrangement (i.e., either on a straight-line or graded-vesting basis). Expense recognition is accelerated forretirement-eligible individuals who would meet the requirements for vesting of awards upon their retirement. As of30 September 2016, there was $1.1 of unrecognized compensation cost related to nonvested stock options,which is expected to be recognized over a weighted average period of 0.9 years.
Cash received from option exercises during 2016 was $141.3. The total tax benefit realized from stock optionexercises in 2016 was $39.8, of which $25.0 was the excess tax benefit.
Restricted Stock
The grant-date fair value of restricted stock is estimated on the date of grant based on the market price of thestock, and compensation cost is generally amortized to expense on a straight-line basis over the vesting periodduring which employees perform related services. Expense recognition is accelerated for retirement-eligibleindividuals who would meet the requirements for vesting of awards upon their retirement.
We have issued shares of restricted stock to certain officers. Participants are entitled to cash dividends and tovote their respective shares. Restrictions on shares lift in one to four years or upon the earlier of retirement,death, or disability. The shares are nontransferable while subject to forfeiture.
Restricted Stock Shares (000)Weighted Average
Grant-Date Fair Value
Outstanding at 30 September 2015 83 $121.17Granted 33 138.00Vested (31) 119.95
Outstanding at 30 September 2016 85 $128.16
As of 30 September 2016, there was $5.1 of unrecognized compensation cost related to restricted stock awards.The cost is expected to be recognized over a weighted average period of 2.6 years. The total fair value ofrestricted stock vested during 2016, 2015, and 2014 was $4.3, $1.4, and $12.1, respectively.
102
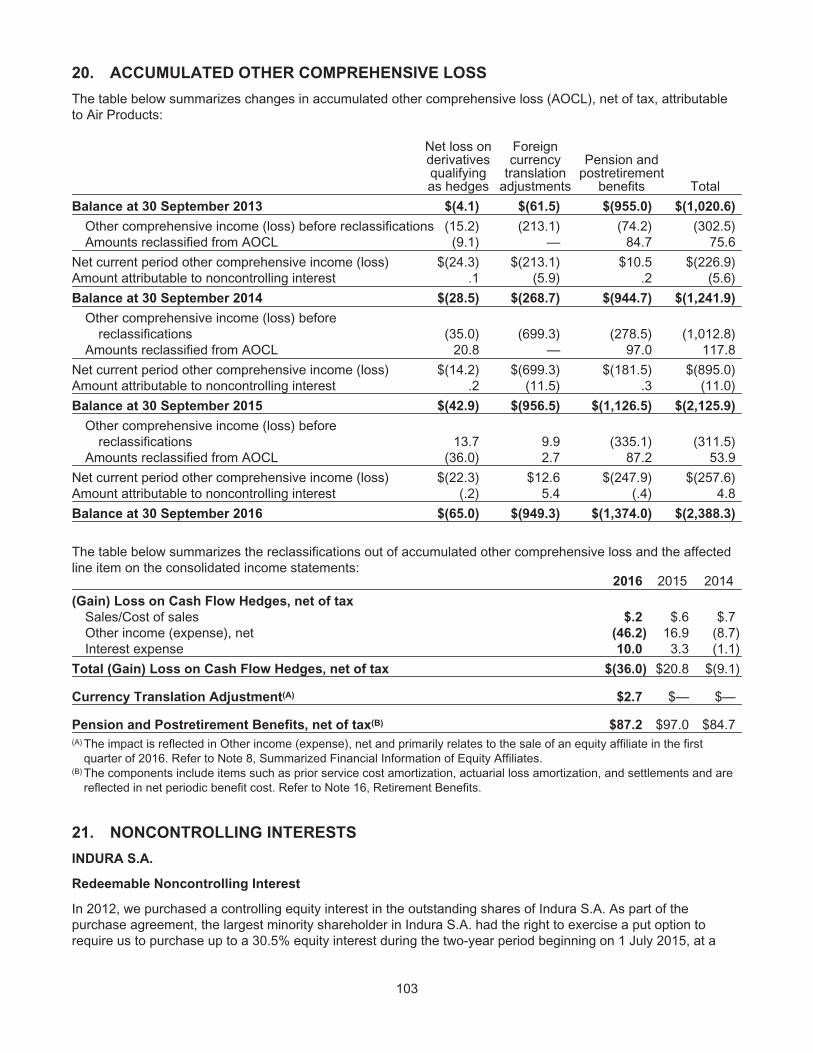
20. ACCUMULATED OTHER COMPREHENSIVE LOSS
The table below summarizes changes in accumulated other comprehensive loss (AOCL), net of tax, attributableto Air Products:
Net loss onderivativesqualifyingas hedges
Foreigncurrency
translationadjustments
Pension andpostretirement
benefits Total
Balance at 30 September 2013 $(4.1) $(61.5) $(955.0) $(1,020.6)
Other comprehensive income (loss) before reclassifications (15.2) (213.1) (74.2) (302.5)Amounts reclassified from AOCL (9.1) — 84.7 75.6
Net current period other comprehensive income (loss) $(24.3) $(213.1) $10.5 $(226.9)Amount attributable to noncontrolling interest .1 (5.9) .2 (5.6)
Balance at 30 September 2014 $(28.5) $(268.7) $(944.7) $(1,241.9)
Other comprehensive income (loss) beforereclassifications (35.0) (699.3) (278.5) (1,012.8)
Amounts reclassified from AOCL 20.8 — 97.0 117.8
Net current period other comprehensive income (loss) $(14.2) $(699.3) $(181.5) $(895.0)Amount attributable to noncontrolling interest .2 (11.5) .3 (11.0)
Balance at 30 September 2015 $(42.9) $(956.5) $(1,126.5) $(2,125.9)
Other comprehensive income (loss) beforereclassifications 13.7 9.9 (335.1) (311.5)
Amounts reclassified from AOCL (36.0) 2.7 87.2 53.9
Net current period other comprehensive income (loss) $(22.3) $12.6 $(247.9) $(257.6)Amount attributable to noncontrolling interest (.2) 5.4 (.4) 4.8
Balance at 30 September 2016 $(65.0) $(949.3) $(1,374.0) $(2,388.3)
The table below summarizes the reclassifications out of accumulated other comprehensive loss and the affectedline item on the consolidated income statements:
2016 2015 2014
(Gain) Loss on Cash Flow Hedges, net of tax
Sales/Cost of sales $.2 $.6 $.7Other income (expense), net (46.2) 16.9 (8.7)Interest expense 10.0 3.3 (1.1)
Total (Gain) Loss on Cash Flow Hedges, net of tax $(36.0) $20.8 $(9.1)
Currency Translation Adjustment(A) $2.7 $— $—
Pension and Postretirement Benefits, net of tax(B) $87.2 $97.0 $84.7(A) The impact is reflected in Other income (expense), net and primarily relates to the sale of an equity affiliate in the first
quarter of 2016. Refer to Note 8, Summarized Financial Information of Equity Affiliates.(B) The components include items such as prior service cost amortization, actuarial loss amortization, and settlements and are
reflected in net periodic benefit cost. Refer to Note 16, Retirement Benefits.
21. NONCONTROLLING INTERESTS
INDURA S.A.
Redeemable Noncontrolling Interest
In 2012, we purchased a controlling equity interest in the outstanding shares of Indura S.A. As part of thepurchase agreement, the largest minority shareholder in Indura S.A. had the right to exercise a put option torequire us to purchase up to a 30.5% equity interest during the two-year period beginning on 1 July 2015, at a
103

redemption value equal to the greater of fair market value or the acquisition date value escalated by an inflationfactor (the “floor value”). The put option was not accounted for separate from the minority interest shares thatwere subject to the put option. The redemption feature of the put option required classification of the minorityshareholder’s interest in the consolidated balance sheet outside of equity under the caption “RedeemableNoncontrolling Interest.”
In July 2015, we completed the purchase of the 30.5% equity interest in our Indura S.A. subsidiary from thelargest minority shareholder for $277.9 based on terms substantially consistent with the original purchaseagreement. The purchase was funded by the issuance of commercial paper. We currently have a 97.8%controlling equity interest in Indura S.A.
The following is a summary of the changes in redeemable noncontrolling interest for the year ended30 September 2015:
Balance at 30 September 2014 $287.2Net income 11.5Dividends (2.0)Purchase of noncontrolling interest (277.9)Currency translation adjustment (18.8)
Balance at 30 September 2015 $—
As redeemable noncontrolling interest is not part of total equity, the impacts above are excluded from ourconsolidated statements of equity.
22. EARNINGS PER SHARE
The following table sets forth the computation of basic and diluted earnings per share (EPS):
30 September 2016 2015 2014
Numerator
Income from continuing operations $1,515.3 $1,284.7 $994.6Income (Loss) from discontinued operations (884.2) (6.8) (2.9)
Net Income Attributable to Air Products $631.1 $1,277.9 $991.7
Denominator (in millions)Weighted average common shares — Basic 216.4 214.9 212.7Effect of dilutive securities
Employee stock option and other award plans 1.9 2.4 2.5
Weighted average common shares — Diluted 218.3 217.3 215.2
Basic EPS Attributable to Air Products
Income from continuing operations $7.00 $5.98 $4.68Income (Loss) from discontinued operations (4.08) (.03) (.02)
Net Income Attributable to Air Products $2.92 $5.95 $4.66
Diluted EPS Attributable to Air Products
Income from continuing operations $6.94 $5.91 $4.62Income (Loss) from discontinued operations (4.05) (.03) (.01)
Net Income Attributable to Air Products $2.89 $5.88 $4.61
Diluted EPS attributable to Air Products reflects the potential dilution that could occur if stock options or othershare-based awards were exercised or converted into common stock. The dilutive effect is computed using thetreasury stock method, which assumes all share-based awards are exercised and the hypothetical proceeds fromexercise are used by the Company to purchase common stock at the average market price during the period. Theincremental shares (difference between shares assumed to be issued versus purchased), to the extent theywould have been dilutive, are included in the denominator of the diluted EPS calculation. Outstanding
104

share-based awards of .2 million shares, .2 million shares, and .6 million shares were antidilutive and thereforeexcluded from the computation of diluted EPS for 2016, 2015, and 2014, respectively.
23. INCOME TAXES
The following table summarizes the income of U.S. and foreign operations before taxes:
2016 2015 2014
Income from Continuing Operations before Taxes
United States $897.5 $742.0 $562.2Foreign 1,086.1 846.2 651.8Income from equity affiliates 148.6 154.5 151.4
Total $2,132.2 $1,742.7 $1,365.4
The following table shows the components of the provision for income taxes:
2016 2015 2014
Current Tax Provision
Federal $237.9 $177.1 $19.3State 29.1 16.9 13.0Foreign 256.6 221.4 211.6
523.6 415.4 243.9
Deferred Tax Provision
Federal 42.2 (3.5) 98.2State 3.6 19.1 (2.7)Foreign 17.1 (12.7) 30.0
62.9 2.9 125.5
Income Tax Provision $586.5 $418.3 $369.4
A reconciliation of the differences between the United States federal statutory tax rate and the effective tax rate isas follows:
(Percent of income before taxes) 2016 2015 2014
U.S. federal statutory tax rate 35.0% 35.0% 35.0%State taxes, net of federal benefit 1.1 1.0 .5Income from equity affiliates (2.4) (3.0) (3.9)Foreign tax differentials (7.0) (6.6) (8.2)U.S. taxes on foreign earnings (2.3) (1.6) (1.7)Domestic production activities (.8) (.9) (.7)Non-deductible goodwill impairment charge — — 8.0Non-U.S. subsidiary tax election — — (3.8)Business separation costs 3.1 .2 —Other(A) .8 (.1) 1.9
Effective Tax Rate 27.5% 24.0% 27.1%(A) Other includes the impact of Chilean tax rate changes of 1.5% in 2014.
Income tax payments, net of refunds, were $440.8 in 2016, $392.9 in 2015, and $160.6 in 2014.
Foreign tax differentials represent the differences between foreign earnings subject to foreign tax rates lower thanthe U.S. federal statutory tax rate of 35.0%. Foreign earnings are subject to local country tax rates that aregenerally below the 35.0% U.S. federal statutory rate and include tax holidays and incentives. As a result, oureffective non-U.S. tax rate is typically lower than the U.S. statutory rate. If foreign pre-tax earnings increaserelative to U.S. pre-tax earnings, this rate difference could increase. The jurisdictions in which we earn pre-taxearnings subject to lower foreign taxes than the U.S. statutory rate include South Korea, Taiwan, the United
105

Kingdom, China, Canada, Spain and Belgium. As more than 80% of the undistributed earnings are in countrieswith a statutory tax rate of 24% or higher, we do not generate a disproportionate amount of taxable income incountries with very low tax rates. U.S. taxes on foreign earnings is a tax benefit primarily due to foreign tax creditson the repatriation of foreign earnings to the U.S.
In 2016, the effective tax rate was impacted by tax costs of $51.8 incurred in anticipation of the tax-free spin-off ofVersum, primarily for a dividend declared during the third quarter of 2016 to repatriate $443.8 from a subsidiary inSouth Korea to the U.S. Previously, most of these foreign earnings were considered to be indefinitely reinvested.In addition, a tax benefit was not available on a significant portion of the business separation costs. Refer to Note3, Materials Technologies Separation, for additional information.
In 2014, the effective tax rate was impacted by losses from transactions and a tax election made with respect to anon-U.S. subsidiary resulting in an income tax benefit of $51.6. This benefit was partially offset by income taxexpense of $20.6 related to the tax reform legislation enacted in Chile. The effective tax rate was also impactedby the goodwill impairment charge of $305.2 that was not deductible for tax purposes. See Note 10, Goodwill, foradditional information regarding the impairment charge.
The significant components of deferred tax assets and liabilities are as follows:
30 September 2016 2015
Gross Deferred Tax Assets
Retirement benefits and compensation accruals $537.9 $468.7Tax loss carryforwards 93.0 116.7Tax credits and other tax carryforwards 56.0 43.8Reserves and accruals 80.1 71.9Partnership and other investments 4.8 6.2Other 45.8 66.3Valuation allowance (155.2) (103.6)
Deferred Tax Assets 662.4 670.0
Gross Deferred Tax Liabilities
Plant and equipment 1,034.8 1,124.6Currency gains 46.4 65.7Unremitted earnings of foreign entities 5.4 62.7Intangible assets 134.1 135.6Other 16.1 2.1
Deferred Tax Liabilities 1,236.8 1,390.7
Net Deferred Income Tax Liability $574.4 $720.7
Deferred tax assets and liabilities are included within the consolidated financial statements as follows:
2016 2015
Deferred Tax Assets
Other noncurrent assets $192.7 $82.7Deferred Tax Liabilities
Deferred income taxes 767.1 803.4
Net Deferred Income Tax Liability $574.4 $720.7
Gross federal loss and tax credit carryforwards as of 30 September 2016 were $137.1 and $25.7, respectively.The federal loss carryforward is primarily a capital loss due to a 2014 tax election related to a non-U.S. subsidiarythat expires in 2019. The federal tax credit carryforwards expire in 2025 and 2026. Gross state loss and tax creditcarryforwards as of 30 September 2016 were $123.2 and $3.3, respectively. The state tax carryforwards haveexpiration periods between 2018 and 2034. Gross foreign loss and tax credit carryforwards as of 30 September2016 were $155.0 and $27.0, respectively. Foreign tax carryforwards of $119.5 have expiration periods between2017 and 2026; the remainder have unlimited carryforward periods.
106

The valuation allowance as of 30 September 2016 of $155.2 primarily related to the tax benefit on the federalcapital loss carryforward of $48.0, tax benefit of foreign loss carryforwards of $37.7, and capital assets of $58.0that were generated from the loss recorded on the exit from the Energy-from-Waste business in 2016. If eventswarrant the reversal of the valuation allowance, it would result in a reduction of tax expense. We believe it is morelikely than not that future earnings and reversal of deferred tax liabilities will be sufficient to utilize our deferred taxassets, net of existing valuation allowance, at 30 September 2016. The deferred tax liability associated withunremitted earnings of foreign entities decreased in part due to the dividend to repatriate cash from a foreignsubsidiary in South Korea. This amount was also impacted by ongoing activity including earnings, dividendpayments, tax credit adjustments, and currency translation impacting the undistributed earnings of our foreignsubsidiaries and corporate joint ventures which are not considered to be indefinitely reinvested outside of the U.S.
We record U.S. income taxes on the undistributed earnings of our foreign subsidiaries and corporate jointventures unless those earnings are indefinitely reinvested outside of the U.S. These cumulative undistributedearnings that are considered to be indefinitely reinvested in foreign subsidiaries and corporate joint ventures areincluded in retained earnings on the consolidated balance sheets and amounted to $6,300.9 as of 30 September2016. An estimated $1,467.8 in U.S. income and foreign withholding taxes would be due if these earnings wereremitted as dividends after payment of all deferred taxes.
A reconciliation of the beginning and ending amount of the unrecognized tax benefits is as follows:
Unrecognized Tax Benefits 2016 2015 2014
Balance at beginning of year $97.5 $108.7 $124.3Additions for tax positions of the current year 15.0 6.9 8.1Additions for tax positions of prior years 3.8 7.5 4.9Reductions for tax positions of prior years (.3) (7.9) (14.6)Settlements (5.6) (.6) —Statute of limitations expiration (3.0) (11.2) (14.0)Foreign currency translation (.5) (5.9) —
Balance at End of Year $106.9 $97.5 $108.7
At 30 September 2016 and 2015, we had $106.9 and $97.5 of unrecognized tax benefits, excluding interest andpenalties, of which $64.5 and $62.5, respectively, would impact the effective tax rate if recognized.
Interest and penalties related to unrecognized tax benefits are recorded as a component of income tax expenseand totaled $2.3 in 2016, $(1.8) in 2015, and $1.2 in 2014. Our accrued balance for interest and penalties was$9.8 and $7.5 as of 30 September 2016 and 2015, respectively.
107

We are currently under examination in a number of tax jurisdictions, some of which may be resolved in the nexttwelve months. As a result, it is reasonably possible that a change in the unrecognized tax benefits may occurduring the next twelve months. However, quantification of an estimated range cannot be made at this time.
We generally remain subject to examination in the following major tax jurisdictions for the years indicated below:
Major Tax Jurisdiction Open Tax Years
North America
United States 2011–2016Canada 2012–2016
Europe
France 2013–2016Germany 2011–2016Netherlands 2011–2016Spain 2011–2016United Kingdom 2013–2016
Asia
China 2010–2016Singapore 2010–2016South Korea 2010–2016Taiwan 2011–2016
Latin America
Chile 2013–2016
24. SUPPLEMENTAL INFORMATION
Other Receivables and Current Assets30 September 2016 2015
Derivative instruments $170.9 $72.9Other receivables 197.5 167.6Current capital lease receivables 88.2 84.2Prepaid inventory 92.8 —Other 6.2 18.8
$555.6 $343.5
Other Noncurrent Assets30 September 2016 2015
Derivative instruments $204.4 $246.0Other long-term receivables 20.6 21.4Deferred financing cost, net 29.6 20.2Prepaid tax 53.5 31.3Deferred tax assets 192.7 82.7Deposits 36.5 40.1Other 200.0 206.9
$737.3 $648.6
108
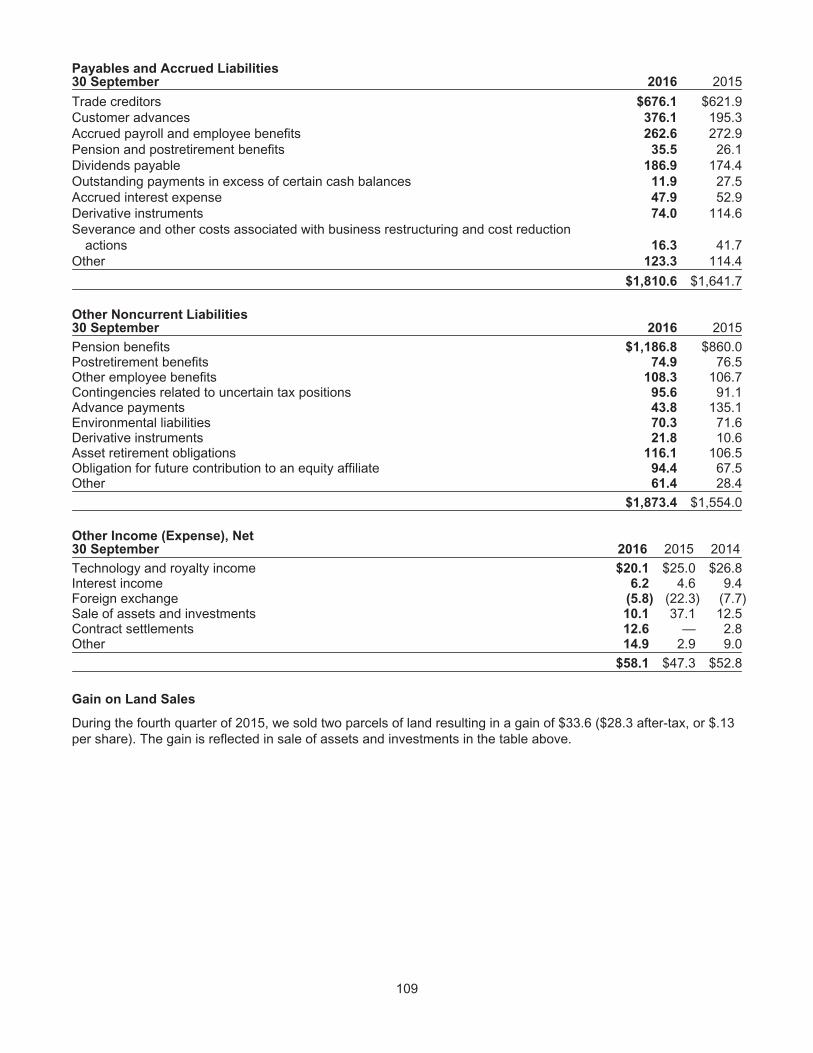
Payables and Accrued Liabilities30 September 2016 2015
Trade creditors $676.1 $621.9Customer advances 376.1 195.3Accrued payroll and employee benefits 262.6 272.9Pension and postretirement benefits 35.5 26.1Dividends payable 186.9 174.4Outstanding payments in excess of certain cash balances 11.9 27.5Accrued interest expense 47.9 52.9Derivative instruments 74.0 114.6Severance and other costs associated with business restructuring and cost reduction
actions 16.3 41.7Other 123.3 114.4
$1,810.6 $1,641.7
Other Noncurrent Liabilities30 September 2016 2015
Pension benefits $1,186.8 $860.0Postretirement benefits 74.9 76.5Other employee benefits 108.3 106.7Contingencies related to uncertain tax positions 95.6 91.1Advance payments 43.8 135.1Environmental liabilities 70.3 71.6Derivative instruments 21.8 10.6Asset retirement obligations 116.1 106.5Obligation for future contribution to an equity affiliate 94.4 67.5Other 61.4 28.4
$1,873.4 $1,554.0
Other Income (Expense), Net30 September 2016 2015 2014
Technology and royalty income $20.1 $25.0 $26.8Interest income 6.2 4.6 9.4Foreign exchange (5.8) (22.3) (7.7)Sale of assets and investments 10.1 37.1 12.5Contract settlements 12.6 — 2.8Other 14.9 2.9 9.0
$58.1 $47.3 $52.8
Gain on Land Sales
During the fourth quarter of 2015, we sold two parcels of land resulting in a gain of $33.6 ($28.3 after-tax, or $.13per share). The gain is reflected in sale of assets and investments in the table above.
109
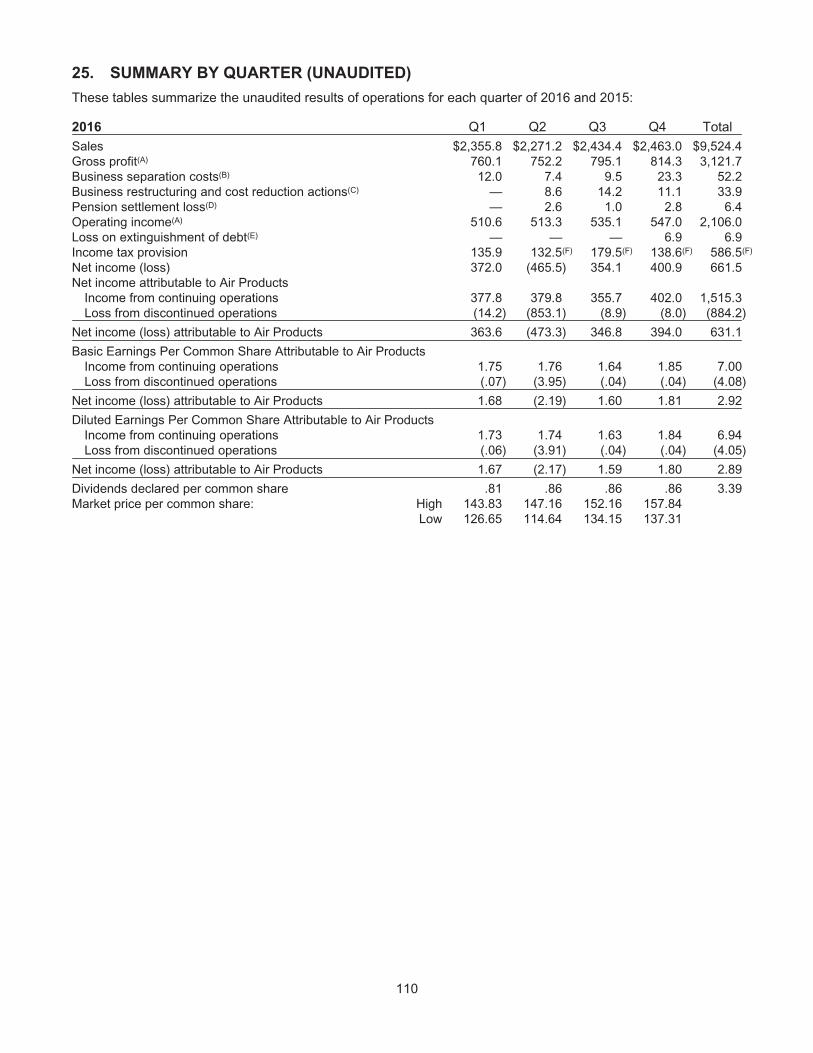
25. SUMMARY BY QUARTER (UNAUDITED)
These tables summarize the unaudited results of operations for each quarter of 2016 and 2015:
2016 Q1 Q2 Q3 Q4 Total
Sales $2,355.8 $2,271.2 $2,434.4 $2,463.0 $9,524.4Gross profit(A) 760.1 752.2 795.1 814.3 3,121.7Business separation costs(B) 12.0 7.4 9.5 23.3 52.2Business restructuring and cost reduction actions(C) — 8.6 14.2 11.1 33.9Pension settlement loss(D) — 2.6 1.0 2.8 6.4Operating income(A) 510.6 513.3 535.1 547.0 2,106.0Loss on extinguishment of debt(E) — — — 6.9 6.9Income tax provision 135.9 132.5(F) 179.5(F) 138.6(F) 586.5(F)
Net income (loss) 372.0 (465.5) 354.1 400.9 661.5Net income attributable to Air Products
Income from continuing operations 377.8 379.8 355.7 402.0 1,515.3Loss from discontinued operations (14.2) (853.1) (8.9) (8.0) (884.2)
Net income (loss) attributable to Air Products 363.6 (473.3) 346.8 394.0 631.1
Basic Earnings Per Common Share Attributable to Air ProductsIncome from continuing operations 1.75 1.76 1.64 1.85 7.00Loss from discontinued operations (.07) (3.95) (.04) (.04) (4.08)
Net income (loss) attributable to Air Products 1.68 (2.19) 1.60 1.81 2.92
Diluted Earnings Per Common Share Attributable to Air ProductsIncome from continuing operations 1.73 1.74 1.63 1.84 6.94Loss from discontinued operations (.06) (3.91) (.04) (.04) (4.05)
Net income (loss) attributable to Air Products 1.67 (2.17) 1.59 1.80 2.89
Dividends declared per common share .81 .86 .86 .86 3.39Market price per common share: High 143.83 147.16 152.16 157.84
Low 126.65 114.64 134.15 137.31
110
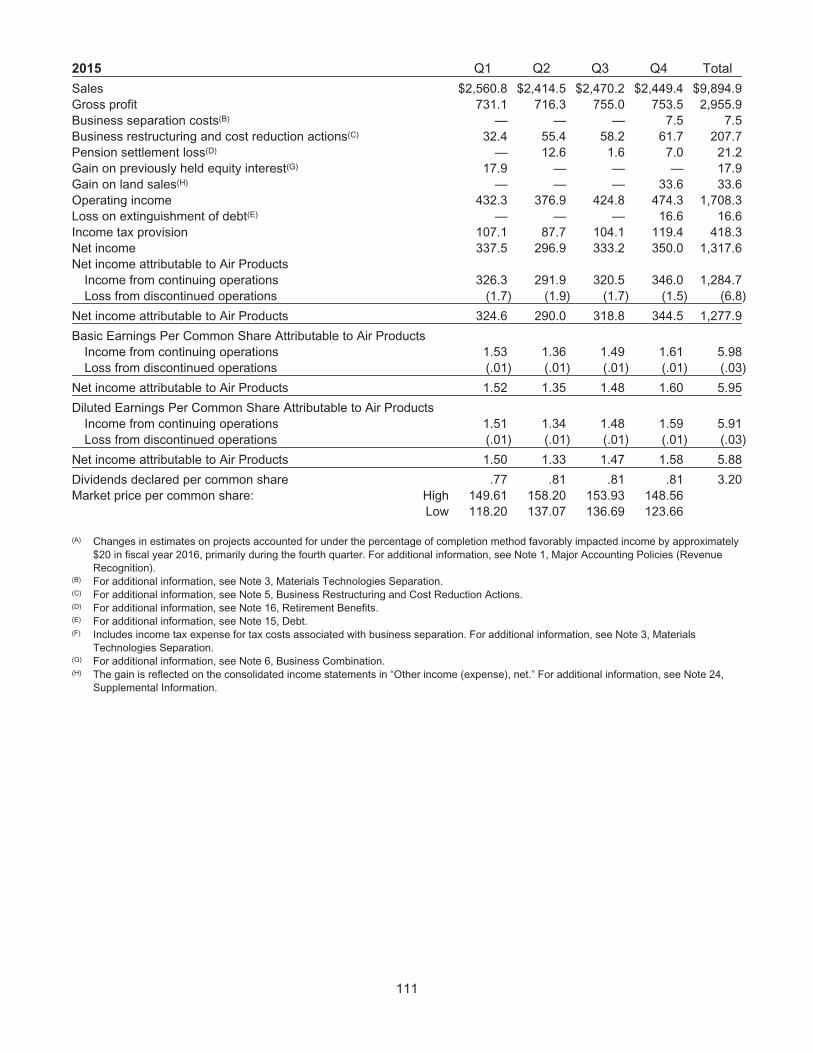
2015 Q1 Q2 Q3 Q4 Total
Sales $2,560.8 $2,414.5 $2,470.2 $2,449.4 $9,894.9Gross profit 731.1 716.3 755.0 753.5 2,955.9Business separation costs(B) — — — 7.5 7.5Business restructuring and cost reduction actions(C) 32.4 55.4 58.2 61.7 207.7Pension settlement loss(D) — 12.6 1.6 7.0 21.2Gain on previously held equity interest(G) 17.9 — — — 17.9Gain on land sales(H) — — — 33.6 33.6Operating income 432.3 376.9 424.8 474.3 1,708.3Loss on extinguishment of debt(E) — — — 16.6 16.6Income tax provision 107.1 87.7 104.1 119.4 418.3Net income 337.5 296.9 333.2 350.0 1,317.6Net income attributable to Air Products
Income from continuing operations 326.3 291.9 320.5 346.0 1,284.7Loss from discontinued operations (1.7) (1.9) (1.7) (1.5) (6.8)
Net income attributable to Air Products 324.6 290.0 318.8 344.5 1,277.9
Basic Earnings Per Common Share Attributable to Air ProductsIncome from continuing operations 1.53 1.36 1.49 1.61 5.98Loss from discontinued operations (.01) (.01) (.01) (.01) (.03)
Net income attributable to Air Products 1.52 1.35 1.48 1.60 5.95
Diluted Earnings Per Common Share Attributable to Air ProductsIncome from continuing operations 1.51 1.34 1.48 1.59 5.91Loss from discontinued operations (.01) (.01) (.01) (.01) (.03)
Net income attributable to Air Products 1.50 1.33 1.47 1.58 5.88
Dividends declared per common share .77 .81 .81 .81 3.20Market price per common share: High 149.61 158.20 153.93 148.56
Low 118.20 137.07 136.69 123.66
(A) Changes in estimates on projects accounted for under the percentage of completion method favorably impacted income by approximately$20 in fiscal year 2016, primarily during the fourth quarter. For additional information, see Note 1, Major Accounting Policies (RevenueRecognition).
(B) For additional information, see Note 3, Materials Technologies Separation.(C) For additional information, see Note 5, Business Restructuring and Cost Reduction Actions.(D) For additional information, see Note 16, Retirement Benefits.(E) For additional information, see Note 15, Debt.(F) Includes income tax expense for tax costs associated with business separation. For additional information, see Note 3, Materials
Technologies Separation.(G) For additional information, see Note 6, Business Combination.(H) The gain is reflected on the consolidated income statements in “Other income (expense), net.” For additional information, see Note 24,
Supplemental Information.
111

26. BUSINESS SEGMENT AND GEOGRAPHIC INFORMATION
Our reporting segments reflect the manner in which our chief operating decision maker reviews results andallocates resources. Except in the Corporate and other segment, each reporting segment meets the definition ofan operating segment and does not include the aggregation of multiple operating segments. Our liquefied naturalgas (LNG) and helium storage and distribution sale of equipment businesses are aggregated within the Corporateand other segment.
Our reporting segments are:
• Industrial Gases – Americas
• Industrial Gases – EMEA (Europe, Middle East, and Africa)
• Industrial Gases – Asia
• Industrial Gases – Global
• Materials Technologies
• Corporate and other
Industrial Gases – Regional
The regional Industrial Gases (Americas, EMEA, Asia) segments include the results of our regional industrial gasbusinesses, which produce and sell atmospheric gases such as oxygen, nitrogen, and argon (primarily recoveredby the cryogenic distillation of air) and process gases such as hydrogen, carbon monoxide, helium, syngas, andspecialty gases. We supply gases to customers in many industries, including those in metals, glass, chemicalprocessing, energy production and refining, food processing, metallurgical industries, medical, and generalmanufacturing. We distribute gases to our customers through a variety of supply modes including liquid orgaseous bulk supply delivered by tanker or tube trailer and, for smaller customers, packaged gases delivered incylinders and dewars or small on-sites (cryogenic or non-cryogenic generators). For large-volume customers, weconstruct an on-site plant adjacent to or near the customer’s facility or deliver product from one of our pipelines.We are the world’s largest provider of hydrogen, which is used by refiners to facilitate the conversion of heavycrude feedstock and lower the sulfur content of gasoline and diesel fuels.
Electricity is the largest cost component in the production of atmospheric gases, and natural gas is the principalraw material for hydrogen, carbon monoxide, and syngas production. We mitigate energy and natural gas pricescontractually through pricing formulas, surcharges, and cost pass-through arrangements. The regional IndustrialGases segments also include our share of the results of several joint ventures accounted for by the equitymethod. The largest of these joint ventures operate in Mexico, Italy, South Africa, India, Saudi Arabia, andThailand. Each of the regional Industrial Gases segments competes against global industrial gas companies aswell as regional competitors. Competition is based primarily on price, reliability of supply, and the development ofindustrial gas applications. We derive a competitive advantage in locations where we have pipeline networks,which enable us to provide reliable and economic supply of products to larger customers.
Industrial Gases – Global
The Industrial Gases – Global segment includes cryogenic and gas processing equipment sales for air separation.The equipment is sold worldwide to customers in a variety of industries, including chemical and petrochemicalmanufacturing, oil and gas recovery and processing, and steel and primary metals processing. The IndustrialGases – Global segment also includes centralized global costs associated with management of all the IndustrialGases segments. These costs include Industrial Gases global administrative costs, product development costs,and research and development costs. We compete with a large number of firms for all the offerings included inthe Industrial Gases – Global segment. Competition in the equipment businesses is based primarily ontechnological performance, service, technical know-how, price, and performance guarantees.
Materials Technologies
The Materials Technologies segment, which contains two divisions, Electronic Materials (EMD) and PerformanceMaterials (PMD), employs applications technology to provide solutions to a broad range of global industriesthrough chemical synthesis, analytical technology, process engineering, and surface science. EMD providesspecialty gases, specialty chemicals, services, and equipment to the electronics industry, primarily for themanufacture of silicon and compound semiconductors and thin film transistor liquid crystal (LCD) displays. PMD
112

provides performance chemical solutions for the coatings, inks, adhesives, construction and civil engineering,personal care, institutional and industrial cleaning, mining, oil refining, and polyurethanes industries. We competein the businesses included in the Materials Technologies segment on a product-by-product basis againstcompetitors ranging from niche suppliers with a single product to larger and more vertically integrated companies.Competition is principally conducted on the basis of price, quality, product performance, reliability of productsupply, technical innovation, service, and global infrastructure.
During 2016, Air Products entered into an agreement to sell certain subsidiaries and assets comprising the PMDdivision. The sale is subject to regulatory and anti-trust requirements. On 1 October 2016, Air Products completedthe separation of its EMD division through the spin-off of Versum. Refer to Note 3, Materials TechnologiesSeparation, for additional information.
Corporate and other
The Corporate and other segment includes two ongoing global businesses (our LNG sale of equipment businessand our liquid helium and liquid hydrogen transport and storage container businesses), the polyurethaneintermediates (PUI) business that was exited in early fiscal year 2014, and corporate support functions thatbenefit all the segments. Competition for the two sale of equipment businesses is based primarily on technologicalperformance, service, technical know-how, price, and performance guarantees. Corporate and other also includesincome and expense that cannot be directly associated with the business segments, including foreign exchangegains and losses and stranded costs resulting from discontinued operations. Also included are LIFO inventoryadjustments, as the business segments use FIFO, and the LIFO pool adjustments are not allocated to thebusiness segments.
In addition to assets of the global businesses included in this segment, other assets include cash, deferred taxassets, and financial instruments.
Customers
We do not have a homogeneous customer base or end market, and no single customer accounts for more than10% of our consolidated revenues.
Accounting Policies
The accounting policies of the segments are the same as those described in Note 1, Major Accounting Policies.We evaluate the performance of segments based upon reported segment operating income.
113
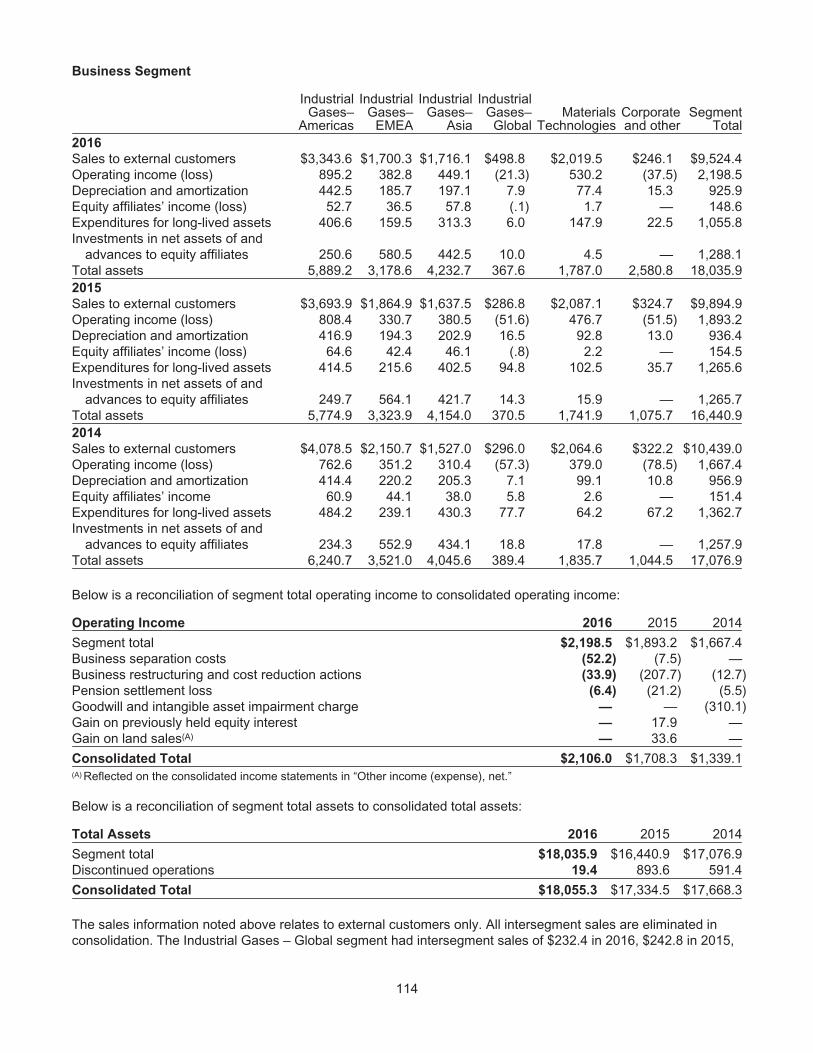
Business Segment
IndustrialGases–
Americas
IndustrialGases–
EMEA
IndustrialGases–
Asia
IndustrialGases–
GlobalMaterials
TechnologiesCorporateand other
SegmentTotal
2016
Sales to external customers $3,343.6 $1,700.3 $1,716.1 $498.8 $2,019.5 $246.1 $9,524.4Operating income (loss) 895.2 382.8 449.1 (21.3) 530.2 (37.5) 2,198.5Depreciation and amortization 442.5 185.7 197.1 7.9 77.4 15.3 925.9Equity affiliates’ income (loss) 52.7 36.5 57.8 (.1) 1.7 — 148.6Expenditures for long-lived assets 406.6 159.5 313.3 6.0 147.9 22.5 1,055.8Investments in net assets of and
advances to equity affiliates 250.6 580.5 442.5 10.0 4.5 — 1,288.1Total assets 5,889.2 3,178.6 4,232.7 367.6 1,787.0 2,580.8 18,035.92015
Sales to external customers $3,693.9 $1,864.9 $1,637.5 $286.8 $2,087.1 $324.7 $9,894.9Operating income (loss) 808.4 330.7 380.5 (51.6) 476.7 (51.5) 1,893.2Depreciation and amortization 416.9 194.3 202.9 16.5 92.8 13.0 936.4Equity affiliates’ income (loss) 64.6 42.4 46.1 (.8) 2.2 — 154.5Expenditures for long-lived assets 414.5 215.6 402.5 94.8 102.5 35.7 1,265.6Investments in net assets of and
advances to equity affiliates 249.7 564.1 421.7 14.3 15.9 — 1,265.7Total assets 5,774.9 3,323.9 4,154.0 370.5 1,741.9 1,075.7 16,440.92014
Sales to external customers $4,078.5 $2,150.7 $1,527.0 $296.0 $2,064.6 $322.2 $10,439.0Operating income (loss) 762.6 351.2 310.4 (57.3) 379.0 (78.5) 1,667.4Depreciation and amortization 414.4 220.2 205.3 7.1 99.1 10.8 956.9Equity affiliates’ income 60.9 44.1 38.0 5.8 2.6 — 151.4Expenditures for long-lived assets 484.2 239.1 430.3 77.7 64.2 67.2 1,362.7Investments in net assets of and
advances to equity affiliates 234.3 552.9 434.1 18.8 17.8 — 1,257.9Total assets 6,240.7 3,521.0 4,045.6 389.4 1,835.7 1,044.5 17,076.9
Below is a reconciliation of segment total operating income to consolidated operating income:
Operating Income 2016 2015 2014
Segment total $2,198.5 $1,893.2 $1,667.4Business separation costs (52.2) (7.5) —Business restructuring and cost reduction actions (33.9) (207.7) (12.7)Pension settlement loss (6.4) (21.2) (5.5)Goodwill and intangible asset impairment charge — — (310.1)Gain on previously held equity interest — 17.9 —Gain on land sales(A) — 33.6 —
Consolidated Total $2,106.0 $1,708.3 $1,339.1(A) Reflected on the consolidated income statements in “Other income (expense), net.”
Below is a reconciliation of segment total assets to consolidated total assets:
Total Assets 2016 2015 2014
Segment total $18,035.9 $16,440.9 $17,076.9Discontinued operations 19.4 893.6 591.4
Consolidated Total $18,055.3 $17,334.5 $17,668.3
The sales information noted above relates to external customers only. All intersegment sales are eliminated inconsolidation. The Industrial Gases – Global segment had intersegment sales of $232.4 in 2016, $242.8 in 2015,
114

and $192.4 in 2014. These sales are generally transacted at market pricing. For all other segments, intersegmentsales are not material for all periods presented. Equipment manufactured for our regional industrial gasessegments are generally transferred at cost and not reflected as an intersegment sale.
Geographic Information
Sales to External Customers 2016 2015 2014
United States $3,792.3 $4,280.1 $4,507.6Canada 225.7 247.1 311.4Europe 2,505.9 2,315.4 2,628.0Asia, excluding China 1,382.7 1,395.2 1,389.4China 1,176.2 1,129.1 981.0Latin America 441.6 528.0 621.6
Total $9,524.4 $9,894.9 $10,439.0
Long-Lived Assets(A) 2016 2015 2014
United States $3,780.2 $3,788.5 $3,754.2Canada 639.0 577.4 518.0Europe 1,306.1 1,395.0 1,656.7Asia, excluding China 1,056.5 914.2 989.9China 1,721.9 1,732.7 1,582.7Latin America 349.0 337.3 440.1
Total $8,852.7 $8,745.1 $8,941.6(A) Long-lived assets include plant and equipment, net.
Geographic information is based on country of origin. Included in United States revenues are export sales to third-party customers of $307.7 in 2016, $398.8 in 2015, and $378.7 in 2014. The Europe region operates principally inFrance, Germany, the Netherlands, Poland, Saudi Arabia, Spain, and the United Kingdom. The Asia regionoperates principally in China, Singapore, South Korea, and Taiwan. The Latin America region operates principallyin Brazil and Chile.
115

ITEM 9. CHANGES IN AND DISAGREEMENTS WITH ACCOUNTANTS ON ACCOUNTING AND
FINANCIAL DISCLOSURE
Not applicable
ITEM 9A. CONTROLS AND PROCEDURES
Under the supervision of the Chief Executive Officer and Chief Financial Officer, the Company’s managementconducted an evaluation of the effectiveness of the Company’s disclosure controls and procedures as of30 September 2016. Based on that evaluation, the Chief Executive Officer and Chief Financial Officer concludedthat, as of the end of the annual period covered by this report, the disclosure controls and procedures have beeneffective. There has been no change in the Company’s internal control over financial reporting (as that term isdefined in Rules 13a-15(f) and 15d-15(f) under the Exchange Act) as of 30 September 2016 that has materiallyaffected, or is reasonably likely to materially affect, the Company’s internal control over financial reporting.
Management’s Report on Internal Control over Financial Reporting is provided under Item 8 appearing above.The report of KPMG LLP, the Company’s independent registered public accounting firm, regarding theCompany’s internal control over financial reporting, is also provided under Item 8 appearing above.
In connection with the spin-off of Versum Materials, Inc., the Company entered into a transition servicesagreement pursuant to which it will continue to provide information technology, systems applications, businessprocesses, and associated internal controls to Versum for a period of 18 months to allow Versum the time toestablish its own infrastructure and both companies sufficient time to physically separate their informationtechnology applications and infrastructure. Management has established controls to mitigate the risk thatpersonnel of either company obtain unauthorized access to the other company’s data and will continue to monitorand evaluate the sufficiency of the controls.
ITEM 9B. OTHER INFORMATION
Not applicable
PART III
ITEM 10. DIRECTORS, EXECUTIVE OFFICERS AND CORPORATE GOVERNANCE
The information required by this item relating to the Company’s directors and nominees is incorporated herein byreference to the section captioned “The Board of Directors” in the Proxy Statement for the Annual Meeting ofShareholders to be held on 26 January 2017. The information required by this item relating to the Company’sexecutive officers is set forth in Item 1 of Part 1 of this report.
The information required by this item relating to the Company’s Audit Committee and its Audit CommitteeFinancial Expert is incorporated herein by reference to the sections captioned “Standing Committees Of TheBoard” and “Audit Committee” in the Proxy Statement for the Annual Meeting of Shareholders to be held on26 January 2017.
The information required by this item relating to the Company’s procedures regarding the consideration ofcandidates recommended by shareholders and a procedure for submission of such candidates is incorporatedherein by reference to the section captioned “Selection of Directors” in the Proxy Statement for the AnnualMeeting of Shareholders to be held on 26 January 2017.
The information required by the item relating to Section 16(a) Beneficial Ownership Reporting Compliance isincorporated herein by reference to the section captioned “Section 16(a) Beneficial Ownership ReportingCompliance” in the Proxy Statement for the Annual Meeting of Shareholders to be held on 26 January 2017.
The Company has adopted a Code of Conduct that applies to all employees, including the Chief ExecutiveOfficer, the Chief Financial Officer, and the Principal Accounting Officer. The Code of Conduct can be found atour Internet website at www.airproducts.com/codeofconduct.
116

ITEM 11. EXECUTIVE COMPENSATION
The information required by this item is incorporated herein by reference to the sections captioned “Compensationof Executive Officers” and “Compensation of Directors” in the Proxy Statement for the Annual Meeting ofShareholders to be held on 26 January 2017.
ITEM 12. SECURITY OWNERSHIP OF CERTAIN BENEFICIAL OWNERS AND MANAGEMENT AND
RELATED STOCKHOLDER MATTERS
Securities Authorized for Issuance Under Equity Compensation Plans.
Equity Compensation Plan Information
The following table provides information as of 30 September 2016 about Company stock that may be issued uponthe exercise of options, warrants, and rights granted to employees or members of the Board under the Company’sexisting equity compensation plans, including plans approved by shareholders and plans that have not beenapproved by shareholders in reliance on the NYSE’s former treasury stock exception or other applicableexception to the Exchange’s listing requirements.
Plan Category
Number of securitiesto be issued upon
exercise ofoutstanding options,warrants, and rights
Weighted-averageexercise price of
outstanding options,warrants, and rights
Number of Securitiesremaining available forfuture issuance underequity compensation
plans (excludingsecurities reflected in
column (a))
Equity compensation plansapproved by security holders 5,070,916(1) $90.28 4,840,837(2)
Equity compensation plans notapproved by security holders 71,770(3) $— —
Total 5,142,686 $90.28 4,840,837
(1) Represents Long-Term Incentive Plan outstanding stock options and deferred stock units that have been granted. Deferred stock unitsentitle the recipient to one share of Company common stock upon vesting, which is conditioned on continued employment during a deferralperiod and may also be conditioned on earn-out against certain performance targets.
(2) Represents authorized shares that were available for future grants as of 30 September 2016. These shares may be used for options,deferred stock units, restricted stock, and other stock-based awards to officers, directors, and key employees. Full value awards such asrestricted stock are limited to 20% of cumulative awards after 1 October 2001.
(3) This number represents deferred stock units issued under the Deferred Compensation Plan, which are purchased for the fair market valueof the underlying shares of stock with eligible deferred compensation.
The Deferred Compensation Plan was not approved by shareholders. It does not require shareholder approvalbecause participants forego compensation equal to the full market value of any share units credited under theplans.
Deferred Compensation Plan—The Company’s Deferred Compensation Plan is an unfunded employee retirementbenefit plan available to certain of the Company’s U.S.-based management and other highly compensatedemployees (and those of its subsidiaries) who receive awards under the Company’s Annual Incentive Plan, whichis the annual cash bonus plan for executives and key salaried employees of the Company and its subsidiaries.Because participants forego current compensation to “purchase” deferred stock units for full value under the Plan,it is not required to be approved by shareholders under the NYSE listing standards. Under the Plan, participantsmay defer a portion of base salary (elective deferrals) which cannot be contributed to the Company’s RetirementSavings Plan, a 401(k) and profit-sharing plan offered to all salaried employees (RSP), because of tax limitationsand earn matching contributions from the Company that they would have received if their elective deferrals hadbeen contributed to the RSP (matching credits). In addition, participants in the Plan may defer all or a portion oftheir bonus awards under the Annual Incentive Plan (bonus deferrals) under the
117

Deferred Compensation Plan. Finally, certain participants under the Plan who participate in the profit-sharingcomponent of the RSP rather than the Company’s salaried pension plans receive contribution credits under thePlan which are a percentage ranging from 4%-6%, based on their years of service, of their salary in excess of taxlimitations and their bonus awards under the Annual Incentive Plan (contribution credits). The dollar amount ofelective deferrals, matching credits, bonus deferrals, and contribution credits is initially credited to an unfundedaccount, which earns interest credits. Participants are periodically permitted while employed by the Company toirrevocably convert all or a portion of their interest-bearing account to deferred stock units in a Company stockaccount. Upon conversion, the Company stock account is credited with deferred stock units based on the fairmarket value of a share of Company stock on the date of crediting. Dividend equivalents corresponding to thenumber of units are credited quarterly to the interest-bearing account. Deferred stock units generally are paid aftertermination of employment in shares of Company stock.
The Deferred Compensation Plan was formerly known as the Supplementary Savings Plan. The name waschanged in 2006 when the deferred bonus program, previously administered under the Annual Incentive Plan,was merged into this Plan.
Certain information required by this item regarding the beneficial ownership of the Company’s common stock isincorporated herein by reference to the sections captioned “Persons Owning More than 5% of Air Products Stockas of September 30, 2016” and “Air Products Stock Beneficially Owned by Officers and Directors” in the ProxyStatement for the Annual Meeting of Shareholders to be held on 26 January 2017.
ITEM 13. CERTAIN RELATIONSHIPS AND RELATED TRANSACTIONS, AND DIRECTOR INDEPENDENCE
The information required by this item is incorporated herein by reference to the sections captioned “DirectorIndependence” and “Transactions with Related Persons” in the Proxy Statement for the Annual Meeting ofShareholders to be held on 26 January 2017.
ITEM 14. PRINCIPAL ACCOUNTANT FEES AND SERVICES
The information required by this item is incorporated herein by reference to the section captioned “IndependentRegistered Public Accountant” in the Proxy Statement for the Annual Meeting of Shareholders to be held on26 January 2017.
PART IV
ITEM 15. EXHIBITS AND FINANCIAL STATEMENT SCHEDULES
(a) The following documents are filed as a part of this report:
(1) The Company’s 2016 consolidated financial statements and the Report of the Independent RegisteredPublic Accounting Firm are included in Part II, Item 8.
(2) Financial Statement Schedules—the following additional information should be read in conjunction withthe consolidated financial statements in the Company’s 2016 consolidated financial statements.
Schedule II Valuation and Qualifying Accounts for the three fiscal years ended 30 September 2016 . . . . . . 121
All other schedules are omitted because the required matter or conditions are not present or because theinformation required by the Schedules is submitted as part of the consolidated financial statements andnotes thereto.
(3) Exhibits—The exhibits filed as a part of this Annual Report on Form 10-K are listed in the Index to Exhibitslocated on page 122 of this Report.
118
SIGNATURES
Pursuant to the requirements of Section 13 or 15(d) of the Securities Exchange Act of 1934, the registrant hasduly caused this Report to be signed on its behalf by the undersigned, thereunto duly authorized.
AIR PRODUCTS AND CHEMICALS, INC.(Registrant)
By: /s/ M. Scott Crocco
M. Scott CroccoExecutive Vice President and Chief Financial Officer
(Principal Financial Officer)
Date: 21 November 2016
Pursuant to the requirements of the Securities Exchange Act of 1934, this Report has been signed below by thefollowing persons on behalf of the registrant and in the capacities and on the dates indicated.
Signature and Title Date
/s/ Seifi Ghasemi
(Seifi Ghasemi)Director, Chairman, President, and
Chief Executive Officer(Principal Executive Officer)
21 November 2016
/s/ Russell A. Flugel
(Russell A. Flugel)Vice President and Corporate Controller
(Principal Accounting Officer)
21 November 2016
*
(Susan K. Carter)Director
21 November 2016
*
(Charles I. Cogut)Director
21 November 2016
*
(Chad C. Deaton)Director
21 November 2016
*
(David H. Y. Ho)Director
21 November 2016
*
(Margaret G. McGlynn)Director
21 November 2016
119

Signature and Title Date
*
(Edward L. Monser)Director
21 November 2016
*
(Matthew H. Paull)Director
21 November 2016
* Mary T. Afflerbach, Corporate Secretary and Chief Governance Officer, by signing her name hereto, does signthis document on behalf of the above noted individuals, pursuant to a power of attorney duly executed by suchindividuals, which is filed with the Securities and Exchange Commission herewith.
/s/ Mary T. Afflerbach
Mary T. AfflerbachAttorney-in-Fact
Date: 21 November 2016
120
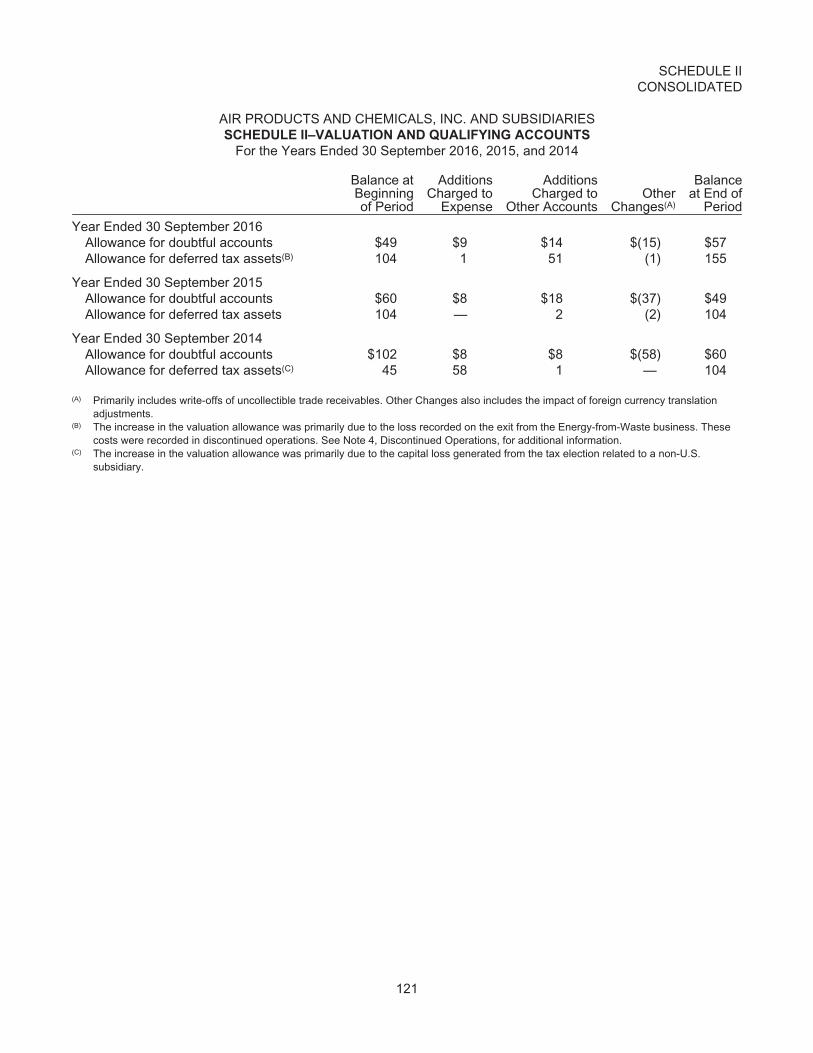
SCHEDULE IICONSOLIDATED
AIR PRODUCTS AND CHEMICALS, INC. AND SUBSIDIARIESSCHEDULE II–VALUATION AND QUALIFYING ACCOUNTS
For the Years Ended 30 September 2016, 2015, and 2014
Balance atBeginningof Period
AdditionsCharged to
Expense
AdditionsCharged to
Other AccountsOther
Changes(A)
Balanceat End of
Period
Year Ended 30 September 2016Allowance for doubtful accounts $49 $9 $14 $(15) $57Allowance for deferred tax assets(B) 104 1 51 (1) 155
Year Ended 30 September 2015Allowance for doubtful accounts $60 $8 $18 $(37) $49Allowance for deferred tax assets 104 — 2 (2) 104
Year Ended 30 September 2014Allowance for doubtful accounts $102 $8 $8 $(58) $60Allowance for deferred tax assets(C) 45 58 1 — 104
(A) Primarily includes write-offs of uncollectible trade receivables. Other Changes also includes the impact of foreign currency translationadjustments.
(B) The increase in the valuation allowance was primarily due to the loss recorded on the exit from the Energy-from-Waste business. Thesecosts were recorded in discontinued operations. See Note 4, Discontinued Operations, for additional information.
(C) The increase in the valuation allowance was primarily due to the capital loss generated from the tax election related to a non-U.S.subsidiary.
121

INDEX TO EXHIBITS
Exhibit No. Description
(2) Plan of acquisition, reorganization, arrangement, liquidation or succession.
2.1Purchase Agreement dated as of 6 May 2016, by and between Air Products and Chemicals, Inc.and Evonik Industries. (Filed as Exhibit 2.1 to the Company’s Form 8-K Report dated 6 May2016.)
2.2Separation Agreement dated as of 29 September 2016, by and between Air Products andChemicals, Inc. and Versum Materials, Inc. (Filed as Exhibit 2.1 to the Company’s Form 8-KReport dated 29 September 2016.)
2.3Tax Matters Agreement dated as of 29 September 2016, by and between Air Products andChemicals, Inc. and Versum Materials, Inc. (Filed as Exhibit 2.2 to the Company’s Form 8-KReport dated 29 September 2016
(3) Articles of Incorporation and By-Laws.
3.1 Amended and Restated By-Laws of the Company. (Filed as Exhibit 3.1 to the Company’s Form8-K Report dated 21 November 2014.)*
3.2 Restated Certificate of Incorporation of the Company. (Filed as Exhibit 3.2 to the Company’sForm 10-K Report for the fiscal year ended 30 September 1987.)*
3.3Amendment to the Restated Certificate of Incorporation of the Company dated 25 January 1996.(Filed as Exhibit 3.3 to the Company’s Form 10-K Report for the fiscal year ended 30 September1996.)*
3.4 Amendment to the Restated Certificate of Incorporation of the Company dated 28 January 2014.(Filed as Exhibit 10.2 to the Company’s Form 10-Q Report for the quarter ended 30 June 2014.)*
(4)Instruments defining the rights of security holders, including indentures. Upon request of theSecurities and Exchange Commission, the Company hereby undertakes to furnish copies of theinstruments with respect to its long-term debt.
4.1Indenture, dated as of January 18, 1985, between the Company and The Chase Manhattan Bank(National Association), as Trustee. (Filed as Exhibit 4(a) to the Company’s RegistrationStatement No. 33-36974.)*
4.2Indenture, dated as of January 10, 1995, between the Company and The Bank of New York TrustCompany, N.A. (formerly Wachovia Bank, National Association and initially First Fidelity BankCompany, National Association), as Trustee. (Filed as Exhibit 4(a) to the Company’s RegistrationStatement No. 33-57357.)*
(10) Material Contracts
10.11990 Deferred Stock Plan of the Company, as amended and restated effective 1 October 1989.(Filed as Exhibit 10.1 to the Company’s Form 10-K Report for the fiscal year ended30 September 1989.)*
10.2 Annual Incentive Plan as Amended and Restated Effective 1 October 2008. (Filed as Exhibit 10.7to the Company’s Form 10-Q Report for the quarter ended 31 March 2009.)*
122

10.3 Stock Incentive Program of the Company effective 1 October 1996. (Filed as Exhibit 10.21 to theCompany’s Form 10-K Report for the fiscal year ended 30 September 2002.)*
10.4Amended and Restated Deferred Compensation Program for Directors, effective 16 July 2015.(Filed as Exhibit 10.7 to the Company’s Form 10-K Report for the fiscal year ended30 September 2015.)*
10.5 Amended and Restated Long-Term Incentive Plan of the Company effective 1 October 2014.(Filed as Exhibit 10.1 to the Company’s Form 8-K filed on 23 September 2014.)
10.5(a)Form of Award Agreement under the Long-Term Incentive Plan of the Company, used forFY 2007 awards. (Filed as Exhibit 10.1 to the Company’s Form 10-Q Report for the quarterended 31 December 2006.)*
10.5(b)Form of Award Agreement under the Long-Term Incentive Plan of the Company, used forFY 2008 awards. (Filed as Exhibit 10.1 to the Company’s Form 10-Q Report for the quarterended 31 December 2007.)*
10.5(c)Form of Award Agreement under the Long-Term Incentive Plan of the Company, used forFY 2009 Awards. (Filed as Exhibit 10.1 to the Company’s Form 10-Q Report for the quarterended 31 December 2008.)*
10.5(d)Form of Award Agreement under the Long-Term Incentive Plan of the Company, used forFY2010 awards. (Filed as Exhibit 10.1 to the Company’s Form 10-Q Report for the quarter ended31 December 2009.)*
10.5(e)Form of Award Agreement under the Long-Term Incentive Plan of the Company, used forFY2011 awards. (Filed as Exhibit 10.1 to the Company’s Form 10-Q Report for the quarter ended31 December 2010.)*
10.5(f)Form of Award Agreement under the Long-Term Incentive Plan of the Company, used forFY2012 awards. (Filed as Exhibit 10.1 to the Company’s Form 10-Q Report for the quarter ended31 December 2011.)*
10.5(g)Form of Award Agreement under the Long-Term Incentive Plan of the Company, used forFY2013 awards. (Filed as Exhibit 10.1 to the Company’s Form 10-Q Report for the quarter ended31 December 2012.)*
10.5(h)Form of Award Agreement under the Long-Term Incentive Plan of the Company, used forFY2014 awards. (Filed as Exhibit 10.1 to the Company’s Form 10-Q Report for the quarter ended31 December 2013.)*
10.5(i)Form of Award Agreement under the Long-Term Incentive Plan of the Company, used forFY2015 awards. (Filed as Exhibit 10.1 to the Company’s Form 10-Q Report for the quarter ended31 December 2014.)*
10.5(j)Form of Award Agreement under the Long-Term Incentive Plan of the Company, used forFY2016 awards. (Filed as Exhibit 10.1 to the Company’s Form 10-Q Report for the quarter ended31 December 2015.)*
10.6Air Products and Chemicals, Inc. Retirement Savings Plan as amended and restated effective1 January 2016. (Filed as Exhibit 10.2 to the Company’s Form 10-Q Report for the quarter ended31 December 2015)*
123
10.6(a) Amendment No. 1 dated as of 30 September 2016 to the Air Products and Chemicals, Inc.Retirement Savings Plan as Amended and Restated effective 1 January 2016.
10.7Supplementary Pension Plan of Air Products and Chemicals, Inc. as Amended and RestatedEffective August 1, 2014. (Filed as Exhibit 10.10 to the Company’s Form 10-K Report for thefiscal year ended 30 September 2014.)*
10.7(a)Amendment No. 1 dated as of 30 September 2015 to the Supplementary Pension Plan of AirProducts and Chemicals, Inc. as Amended and Restated Effective 1 August 2014. (Filed asExhibit 10.10(a) to the Company’s Form 10-K Report for the fiscal year ended 30 September2015.)
10.7(b) Amendment No. 2 dated as of 30 September 2016 to the Supplementary Pension Plan of AirProducts and Chemicals, Inc. as Amended and Restated Effective 1 August 2014.
10.8 Deferred Compensation Plan as Amended and Restated effective 1 August 2014. (Filed asExhibit 10.11 to the Company’s Form 10-K Report for the fiscal year ended 30 September 2014.)*
10.8(a)Amendment No. 1 dated as of 1 January 2016 to the Deferred Compensation Plan as Amendedand Restated effective 1 August 2014. (Filed as Exhibit 10.3 to the Company’s Form 10-Q Reportfor the quarter ended 31 December 2015.)
10.8(b) Amendment No. 2 dated as of 30 September 2016 to the Deferred Compensation Plan asAmended and Restated effective 1 August 2014.
10.9 Revolving Credit Facility dated as of 30 April 2013 for $2,500,000,000. (Filed as Exhibit 10.1 tothe Company’s Form 10-Q Report for the quarter ended 30 June 2013.)*
10.9(a)Amendment No.1 dated as of 22 July 2013, to the Revolving Credit Agreement dated as of30 April 2013. (Filed as Exhibit 10.19(a) to the Company’s Form 10-K Report for the fiscal yearended 30 September 2013.)*
10.9(b)Amendment No. 2 dated as of 30 June 2014, to the Revolving Credit Agreement dated as of30 April 2013. (Filed as Exhibit 10.1 to the Company’s Form 10-Q for the quarter ended 30 June2014)*
10.9(c)Amendment No. 3 dated as of 30 April 2015, to the Revolving Credit Agreement dated as of30 April 2013. (Filed as Exhibit 10.1 to the Company’s Form 10-Q for the quarter ended 30 June2015)*
10.9(d)Amendment No. 4 dated as of 30 September 2015, to the Revolving Credit Agreement dated asof 30 April 2013. (Filed as Exhibit 10.12(d) to the Company’s Form 10-K Report for the fiscal yearended 30 September 2015.)
10.9(e) Amendment No. 5 dated 9 June 2016, to the Revolving Credit Agreement dated as of 30 April2013. (Filed as Exhibit 10.1 to the Company’s Form 10-Q for the quarter ended 30 June 2016.)
10.10Air Products and Chemicals, Inc. Executive Separation Program as amended effective as of20 May 2015. (Filed as Exhibit 10.2 to the Company’s Form 10-Q for the quarter ended 30 June2015.)*
10.11 Form of Change in Control Severance Agreement for an Executive Officer. (Filed as Exhibit 10.21to the Company’s Form 10-K Report for the fiscal year ended 30 September 2011.)*
124

10.12 Compensation Program for Directors effective 1 October 2013. (Filed as Exhibit 10.19(a) to theCompany’s Form 10-K Report for the fiscal year ended 30 September 2013)*
10.13Air Products and Chemicals, Inc. Corporate Executive Committee Retention Agreementseffective as of 10 January 2014. (Filed as Exhibit 10.1 to the Company’s Form 8-K Report dated15 January 2014.)*
10.14 Employment Agreement for an Executive Officer. (Filed as Exhibit 10.1 to the Company’s Form8-K filed on 18 June 2014)*
10.15 Retirement and Retention Agreement for an Executive Officer.
10.16 Senior Management Severance and Summary Plan Description effective as of 1 April 2016.
12 Computation of Ratios of Earnings to Fixed Charges.
14 Code of Conduct revised on 17 May 2012. (Filed as Exhibit 14 to the Company’s Form 8-KReport filed on 23 May 2012.)*
21 Subsidiaries of the registrant.
(23) Consents of Experts and Counsel.
23.1 Consent of Independent Registered Public Accounting Firm.
24 Power of Attorney.
(31) Rule 13a-14(a)/15d-14(a) Certifications.
31.1Certification by the Principal Executive Officer pursuant to Rule 13a-14(a) or Rule 15d-14(a) ofthe Securities Exchange Act of 1934, as adopted pursuant to Section 302 of the Sarbanes-OxleyAct of 2002.
31.2Certification by the Principal Financial Officer pursuant to Rule 13a-14(a) or Rule 15d-14(a) of theSecurities Exchange Act of 1934, as adopted pursuant to Section 302 of the Sarbanes-Oxley Actof 2002.
(32) Section 1350 Certifications.
32.1Certification by the Principal Executive Officer and Principal Financial Officer pursuant to18 U.S.C. Section 1350, as adopted pursuant to Section 906 of the Sarbanes-Oxley Act of2002.†
99.1 Description of Common Stock (Filed as Exhibit 99.1 to the Company’s Form 10-K Report for thefiscal year ended 30 September 2014.)*
101.INS XBRL Instance Document
101.SCH XBRL Taxonomy Extension Schema
101.CAL XBRL Taxonomy Extension Calculation Linkbase
101.LAB XBRL Taxonomy Extension Label Linkbase
125
101.PRE XBRL Taxonomy Extension Presentation Linkbase
101.DEF XBRL Taxonomy Extension Definition Linkbase
* Previously filed as indicated and incorporated herein by reference. Exhibits incorporated by reference arelocated in SEC File No. 1-4534.
† The certification attached as Exhibit 32.1 that accompanies this Annual Report on Form 10-K, is not deemedfiled with the Securities and Exchange Commission and is not to be incorporated by reference into any filingof Air Products and Chemicals, Inc. under the Securities Act of 1933, as amended, or the SecuritiesExchange Act of 1934, as amended, whether made before or after the date of this Form 10-K, irrespectiveof any general incorporation language contained in such filing.
126

Common stock informationTicker Symbol: APDExchange Listing: New York Stock Exchange
Transfer Agent and Registrar:Broadridge Corporate Issuer Solutions P.O. Box 1342Brentwood, NY 11717Phone: 844-318-0129International: 720-358-3595Fax: [email protected]
Publications for shareholdersIn addition to this Annual Report on Form 10-K for the fiscal year ended September 30, 2016, Air Products informs shareholders about Company news through:
Notice of Annual Meeting and Proxy Statement—made available to shareholders in mid-December and posted to the Company’s website at www.airproducts.com/annualmeetingmaterials.
Earnings information—shareholders and investors can obtain cop-ies of earnings releases, Annual Reports, 10-Ks and news releases by visiting www.airproducts.com/investors/overview. Shareholders and investors can also register for e-mail updates at that website.
Dividend policyDividends on Air Products’ common stock are declared by the Board of Directors and, when declared, usually will be paid during the sixth week after the close of the fiscal quarter. It is the Compa-ny’s objective to pay dividends consistent with the reinvestment of earnings necessary for long-term growth.
Direct investment programCurrent shareholders and new investors can conveniently and economically purchase shares of Air Products’ common stock and reinvest cash dividends through Broadridge Corporate Issuer Solutions. Registered shareholders can purchase shares on Broadridge Corporate Issuer Solutions, [email protected] investors can obtain information on the website or by calling: Phone: 844-318-0129 International: 720-358-3595
Annual meetingThe annual meeting of shareholders will be held on Thursday, January 26, 2017.
Annual certificationsThe most recent certifications by our Chief Executive Officer and Chief Financial Officer pursuant to Section 302 of the Sarbanes-Oxley Act of 2002 are filed as exhibits to our Form 10-K. We have also filed with the New York Stock Exchange the most recent Annual CEO Certification as required by Section 303A.12(a) of the New York Stock Exchange Listed Company Manual.
Additional informationThe forward-looking statements contained in this Report are qualified by reference to the section entitled “Forward-Looking Statements” on page 55 of the Form 10-K section.
Shareholders’ information
For more information, please contact us at:
Corporate Headquarters Air Products 7201 Hamilton Boulevard Allentown, PA 18195-1501 T 610-481-4911 F 610-481-5900
Corporate Secretary’s Office Mary Afflerbach, Vice President, Corporate Secretary, Chief Governance Officer and Interim General Counsel T 610-481-2297
Investor Relations OfficeSimon Moore, Vice President, Investor Relations and Corporate Relations T 610-481-5775
tell me moreairproducts.com
© Air Products and Chemicals, Inc., 2016 (40222) 900-16-018-GLB


