74
ISSN 0970-2776 Volume 36 Number 4 December 2019
| Date post: | 28-Jan-2023 |
| Category: |
Documents |
| Upload: | khangminh22 |
| View: | 0 times |
| Download: | 0 times |

ISSN 0970-2776
Volume 36 Number 4 December 2019
THE INDIAN SOCIETY OF OILSEEDS RESEARCH(Founded in 1983, Registration Number ISSN 0970-2776)
EXECUTIVE COUNCIL FOR 2018-2020
President : Dr. Trilochan MohapatraVice-President : Dr. A. Vishnuvardhan ReddyGeneral Secretary : Dr. M. SujathaJoint Secretary : Dr. V.S. BhatiaTreasurer : Dr. G.D. Satish KumarCouncillors : Dr. Ravi Hunje (South Zone)
Dr. Anand Kumar Panday (Central Zone)Dr. Tamina Begum (Eastern Zone)Dr. K.L. Dobariya (Western Zone)Dr. J.S. Yadav (Northern Zone)
Editorial Board
Chief Editor : Dr. V. Dinesh Kumar, IIOR, Hyderabad
Associate Editors
Dr. D.M. Hegde, Ex-Director, IIOR, HyderabadDr. Virender Sardana, PAU, LudhianaDr. S.R. Bhat, NRCPB, New Delhi
Dr. M. Srinivas, ARS, MaruteruDr. D.K. Yadava, ICAR, New DelhiDr. P. Duraimurugan, IIOR, Hyderabad
Editorial Board Members
Dr. V.S. Bhatia, IISR, IndoreDr. R.K. Mathur, IIOPR, PedavegiDr. P.K. Singh, AICRP (Linseed), KanpurDr. C.A. Rama Rao, CRIDA, HyderabadDr. K.K. Pal, DGR, JunagadhDr. V.V. Singh, DRMR, Bharatpur
Dr. Anupama Singh, IARI, New DelhiDr. B. Sontakki, NAARM, HyderabadDr. P. Lakshmamma, IIOR, HyderabadDr. Senthilvel Senapathy, IIOR, HyderabadDr. Atlagic Jovanka, IFVCNS, SerbiaDr. Snazidur Rahman, University of Plymouth, UK
MEMBERSHIP TARIFF(w.e.f. 01.06.2014)
Life Membership Annual Subscription India Abroad
Individual : Rs.3000/- + Individual : Rs. 400/- + Admn. Fee Rs.50/- US$ 100 OrdinaryAdmn. Fee Rs.50/- Institutions : Rs. 3000/- US$ 200 Institutions
Students : Rs. 300/- + Admn. Fee Rs.50/-
For subscription, please contact K The General Secretary, Indian Society of Oilseeds Research, ICAR-Indian Instituteof Oilseeds Research, Rajendranagar, Hyderabad-500 030, India
Payment can be made online by fund transfer to account No. 52032213529 with IFSC Code: SBIN 0020074. Afterpayment, the UTR No. and payment details may be sent by e-mail ([email protected]) / post to the GeneralSecretary, ISOR, ICAR-IIOR, Rajendranagar, Hyderabad-500 030. For further details please visit: http://www.isor.in.
ANNOUNCEMENT
Journal of Oilseeds Research is published quarterly by the Indian Society of Oilseeds Research
The Journal of Oilseeds Research has been rated at 5.02 byNational Academy of Agricultural Sciences (NAAS) from January 1, 2017

JOURNAL OF OILSEEDS RESEARCHPrevious Issue : Vol. 36, No. 3, pp. 126-202
Vol. 36, No. 4 Dec., 2019
CONTENTS
Review
Sesame (Sesamum indicum) in the rice fallow environment -a critical appraisal
K Ramesh, P Ratna Kumar, C Harisudan, S Bhaskar and A Vishnuvardhan Reddy
203
Research Papers
Validation of QTLs for seed weight in a backcross populationderived from an interspecific cross in soybean [Glycine max(L.) Merr.]
Giriraj Kumawat, Arti Yadav, Shivakumar Marrana, Ram Manohar Patel,Sanjay Gupta, Gyanesh Kumar Satpute, Suresh Chand and Sayed Masroor Husain
210
Yield stability and association of its component characters insoybean (Glycine max L.) genotypes
M Pallavi, G Praveen Kumar and N Sandhya Kishore
217
Trombay Bidhan Mustard-204 (TBM-204): A high yieldingyellow seed coat mustard [Brassica juncea (L.) Czern. &Coss.] variety notified for West Bengal
Amitava Dutta, Sanjay J Jambhulkar, Archana N Rai, Shankar Bhujbal, H Banerjee, R Das, S Dewanjee, S Sarkar, M Pramanik and S Mandal
220
Effect of different phosphorus management practices ongrowth, yield and economics of summer groundnut (Arachishypogaea L.)
Raghavendra Nagar, Ram A Jat, R K Mathukia, R R Choudhary and Kiran K Reddy
225
Response of castor (Ricinus communis L.) to crop geometryand potassium on growth, yield attributes and yields underirrigated condition
P M Vaghasia, R L Davariya, Daki and K L Dobariya
229
Studies on the effect of various priming treatments forquality seed production in sesame cv. VRI 1
G Sathiya Narayanan, B S R V Sai PradeepKumar and M Prakash
233
Physico-chemical and organoleptic properties of palm oil andit's comparison with other oils regarding their utility inpreparation of food products
Mamta Kumari and Ritu P Dubey 240
An application of ARIMAX model for forecasting of castorproduction in India
R Vijaya Kumari, G Ramakrishna, Venkatesh Panasa and A Sreenivas
244
Optimum plot size for oil palm (Elaeis guineensis Jacq.) fieldexperiments
Manorama Kamireddy, Chandran K P, Ravi Kumar Mathur, Kancherla Suresh andSanjib Kumar Behera
250

Short Communications
Association analysis in linseed (Linum usitatissimum L.) Vipin Kumar Singh, S A Kerkhi, Prakriti Tomar and G P Dixit
258
Influence of sowing environments on yield of sesamegenotypes under shifting weather conditions of DeccanPlateau (Telangana)
Ratnakumar Pasala and Ramesh Kulasekharan 261
Review
Sesame (Sesamum indicum) in the rice fallow environment - a critical appraisal
K RAMESH1, P RATNA KUMAR1, C HARISUDAN2, S BHASKAR3 AND A VISHNUVARDHAN REDDY1
1ICAR-Indian Institute of Oilseeds Research, Rajendranagar, Hyderabad-500 030, Telangana2TNAU-Regional Research Station, Vriddhachalam-606 001, Tamil Nadu
3ICAR-Krishi Anushandhan Bhavan-II, New Delhi-110 012
ABSTRACT
Rice fallow sesame in the states of Tamil Nadu, Andhra Pradesh, Telangana, Odisha and to a limited extent ineastern Indian states, is an opportunity for horizontal expansion of sesame area and its production in the country.The productivity of sesame remains abysmally low as compared to the world average and research efforts needs tobe focused to enhance the productivity of this crop which has a huge potential for export. Unlike rice fallow pulsescultivation, sesame cultivation needs concerted efforts to enhance its productivity in rice fallows. This reviewcritically appraises the rice fallow environments in general, determinants of sesame production in this fragileenvironment and efforts needed for the successful area expansion of sesame crop in the country.
Keywords: Edible oilseed crops, Production, Rice fallow, Sesame
The setting
Oilseed crops continue to remain as the backbone ofagricultural economy of the country since time immemorialand the largest producer of sesame in the world. Sesame isone of the most versatile crops that can be grown insemi-arid and arid regions with the unique attribute of beinga short duration crop requiring minimal inputs (Oyeogbe etal., 2015) inhabiting "hungry and thirsty" environments.Vegetable oil consumption is expected to reach almost 200billion kilograms by 2030 (Troncoso-Ponce et al., 2011).The level of productivity in India is far below the worldproductivity. The demand-supply gap in the edible oils hasnecessitated huge imports accounting for 60 per cent of thecountry's requirement (2016-17: import 14.01 million tonnes;cost ` 73,048 crore) (www.nfsm.gov.in). In the budgetspeech of 2019, Finance minister was quoted saying thatIndia imports about 15 million tonnes of edible oil spendingaround ` 77,000 crores to meet the annual requirement. Tocope up with the increasing per capita demand of edible oils,horizontal expansion of oilseeds in rice fallow is one of theoptions. Sesame is an important oilseed crop with hugeexport potential. As the majority of the area under oilseedscultivation is still rainfed (around 75%), there is significantimpact of vagaries of monsoon particularly water stressduring most parts of the life cycle of the crop, on theproductivity of sesame under rice fallow. Still there areseveral constraints and opportunities in utilising these ricefallow lands for sesame production.
The sesame crop
The sesame is one of the oldest oilseeds crops of theworld (Langham, 1985) and the genus consists of about 36species, of which the most commonly cultivated is Sesamumindicum L. (Falusi, 2006) and is one of the domesticated--------------------------------------------------------------------------- *Corresponding author's E-mail: [email protected]
crop plants of India. Although, India ranks first in bothacreage and production of sesame in the world, theproductivity is too low compared to its original potential.India exports a large quantity of sesame to other countries.Sesame seed exports during April, 2018-February, 2019stood at 2,86,760 tons in comparison to 3,08,172 t during theprevious year. In value terms, it increased to ` 3405.56crores from ` 2701.24 crores. However, we have alsoimported 70,652 metric tons during April, 2018 - February,2019. The export of sesame oil during April, 2018 toFebruary, 2019 was 9229 tons mainly to Iran, China, Taiwan,Mexico, Netherlands, Singapore, UAE and USA (IOPEPC,2019). It is cultivated in Africa, Middle East, and Asia sinceancient times for its edible oil and seeds used in traditionalfoods (Park et al., 2010). The top producer, exporter andimporter of sesame in the world are Tanzania, Ethiopia andChina respectively. India produces 13.1% (www.tridge.com)of the global output (Tanzania 15.4%, Myanmar 13.3%,China 10.6%, Nigeria 7.5% and Ethiopia 4.4%). A quantumof 350 mm of well distributed rainfall could sustain asuccessful sesame crop at an optimum temperature range of25-35°C. As a dry season crop, it experiences severe waterstress in one or the other part of its life cycle. Whereverraised as an irrigated crop excess irrigation particularly underheavy soils is a serious concern which hampers theproductivity. India produces a wide range of sesame seedvarieties and grades, each peculiar to the region where theyare grown. The following five states viz., Gujarat, MadhyaPradesh, Rajasthan, Odisha and Uttar Pradesh housemaximum acreage of sesame as a kharif (70%) season crop,although it is cultivated as a winter/summer crop to a limitedextent (30%).
Rice fallow - an opportunity for the sesame crop
Rice occupies the kharif season in Southeast Asia, but alarge chunk of this area (15 million ha) remains uncultivatedor left as fallow in the subsequent season rabi or post-rainy
J. Oilseeds Res., 36(4) : 203-209, Dec., 2019 203
RAMESH ET AL.
season, due to water scarcity (Subbarao et al., 2001). Thisland is regarded as paddy fallow. Of the total paddy fallowarea in South and Southeast Asia, about 44 million hectaresis in the country (Kumar et al., 2018), with a share of 30%area (11.65 million ha) under kharif fallow (NAAS 2013). Inaddition to this area, there is one more paddy fallow undereither paddy-paddy-fallow (summer) or Paddy-fallow(summer), where in the farmer has two paddy crops in thesystem with short-medium duration rice crops, while thelatter has only one medium duration rice coinciding the postmonsoon or northeast monsoon paddy. As per an estimate in2008, it is stated that more than 80 percent of the paddyfallow lies in the states of Assam, Bihar, Chhattisgarh,Madhya Pradesh, Odisha and West Bengal (Kumar Rao etal., 2008). Rice covering an area of ~26.8 million ha andaccounting for ~63.3% of the total rice acreage during thekharif in the Eastern India. Out of which, ~11.7 million haarea remains as rice fallow during the succeeding winterseason due to several limitations (Kumar et al., 2019).
Majority of rice grown soils in India are heavy soils andclay or clay loams. Such soils, with high water-holdingcapacity, produce higher rice yields and are suitable forsecond crop of pulses/oilseeds (Pande et al., 2012). Alluvial,red, laterite and lateritic, black, saline and alkaline, and peatyand marshy soils are the dominant soil types in which rice isgrown (Raychaudhuri et al., 1963).
Rice fallow areas are characterized by a little residualmoisture for sowing the rabi/summer crop (For eg. Ranchiand Hazaribagh in Jharkhand, Midnapore in West Bengal,Mayurbhanj in Odisha, Raichur in Karnataka,Jagdalpur/Kanker in Chhattisgarh; Mandla in MadhyaPradesh), waterlogging in selected areas resultant ofexcessive moisture in November/December (For eg. Nimpithand Gangasagar in West Bengal; Dhenkanal in Odisha; ricefallows of Assam), and to some extent socio-economicproblems like stray cattle (for eg. Eastern Uttar Pradesh,Bihar and Jharkhand), blue bulls etc. (Ali and Kumar, 2009)destroying the crop. Improving the productivity of the landby growing the second crop in rice fallow needs suitable cropmanagement technique by utilizing the residual soil moisture.Regardless of ample opportunities for rice fallow systems,research in this area has taken not off due to a number ofconstraints. Being short duration in nature, sesame is an idealcrop for cultivation in rice fallow areas (Chauhan et al.,2016). Choice of appropriate crop like sesame with shortduration variety to tide over the water scarcity is the need ofthe hour. In addition, cultivation of early to medium durationvarieties of rice (Behera et al., 2014) during the rabi seasonto enable farmers to grow sesame on residual moisture intime is a felt need.
The rice-fallow environment
Rice grows in flooded conditions during part or all thecrop period for about 6 months. In Tamil Nadu, the rice
fallow is concentrated in the Cauvery deltaic zone as a resultof single cropped medium duration rice (Season: Samba;Sowing/planting in August)) and double cropped shortduration rice [Season: kuruvai (sowing/planting duringJun-Jul) - thaladi/late samba (sowing/planting duringSep-Oct)]. The harvest of samba season rice and thaladiseason rice falls during January first fortnight to facilitatesowing of rice fallow crops around January 15.
In coastal Andhra Pradesh, covering the districts ofSrikakulam, Vijayanagaram and Visakhapatnam, the ricefallow is the result of rice with 150 days duration which isharvested during December-January. Most part of this ricecultivated area is under submergence due to floods. Floodprone rice varieties are cultivated in this region.
Annual Sesame area is about 260.62 thousand ha and iscultivated in all the 30 districts of the Odisha State. Out ofwhich summer irrigated (January-March) area is about 63.82thousand ha in the coastal delta track. Major districts underSesame are: Angul, Malkangiri, Sundargarh, Sambalpur,Dhenkanal and Bolangir (Singh and Samal, 2013). InOdisha, the rice fallow is the result of rice with 150 daysduration which is harvested during November-December.Flood prone long duration rice varieties are cultivated in thisregion. At the time of harvest of rice, the atmospherictemperature remains below 15°C and environmental stressdictates the dates of sowing of sesame crop.
In a low land rice-based cropping system due to floodingof soil for over 2-3 months, the soil chemistry, microbiology,and the ultimate nutrient releasing capacity of the soil isaltered to suit the low land rice crop. For example, soil redoxpotential, physical properties, light status, and nutrientsources for the micro flora are modified. In such a soil,Roger (1995) has opined that all kinds of N2-fixingorganisms are benefitted.
Way back in 1976, Patrick and Reddy (1976) havereported that, approximately one-fourth applied nitrogen torice remains in the soil and roots at the time of harvest. i.e.,precisely a considerable portion of applied nitrogen fertilizerto rice system (24.2 to 27.1 kg/ha) remains in the rice soil. A decade later, Buresh et al. (1989) confirmed that asignificant portion of accumulated soil NO3 may be lost fromrice fallows upon the flooding of aerobic soil for riceproduction. When the flooded rice completes the life cycle,organic and NH4-N could dominate in the soil over NO3.Upon fallowing, transmission of aerobic N occurs and NO3
starts accumulating. Flooded soils are devoid of oxygen and two distinct soil
layers viz., aerobic top layer and an underlying reduced oranaerobic layer (Reddy, 1982) are formed. Traditionally ricefallows are occupied with leguminous crops like green gramand black gram as bonus crop to rice farmers. These cropscan conserve the rice soil NO3 besides capturing theatmospheric N through biological nitrogen fixation (BNF)(George et al., 1992) although the amount of N fixed by
J. Oilseeds Res., 36(4) : 203-209, Dec., 2019 204
SESAME (SESAMUM INDICUM) IN THE RICE FALLOW ENVIRONMENT - A CRITICAL APPRAISAL
legumes depends on the interaction of microbial, plant andenvironmental determinants. Legume-Rhizobium interactionsare unique because they supply 80-90% of total nitrogenrequirement of legumes. However, in case of oilseed cropslike sesame, additional nutrients are ought to be supplied toreap the potential yields.
Ecological considerations for cropping in the rice fallow
Recent studies made by Haque et al. (2015) haveprojected an alarming situation that the dried fallow seasonafter flooded mono paddy in the temperate zones of Koreaand Japan contributed to approximately 30-60 % of theannual net global warming potential scale throughgreenhouse gas emissions. In such systems, paddy fieldswere flooded for less than 100 days during the rice croppingseason and then are aerobically managed during the fallowseason of over 200 days. Although this is applicable totemperate conditions, in Cauvery delta of Tamil Nadu, singlerice (medium to long duration rice) crop is raised during thesamba season and followed by pulses predominantly. Similarconditions prevail in the coastal Andhra Pradesh andOdisha.In both of these coastal regions, after the harvest ofrice the land remains fallow for a period of not less than 45days owing to low atmospheric temperature, which isunfavorable for sesame germination.
Determinants for sesame cultivation
Rice fallow or follow sesame? : Rice fallows are those landseither low lands kharif or rabi sown rice areas whichremained uncropped during rabi (winter)/summer season dueto various reasons. Ghosh et al. (2012) reported an area of11.7 m ha after kharif rice as fallow in the subsequent rabi.Unlike leguminous crops, there is no great deal ofinformation on raising sesame under rice fallow conditions.Hence in parts of Andhra Pradesh and Odisha, the crop israised only as rice follow crop in a rice-sesame croppingsystem. Although pulse crops are sown in the standing ricecrop just 5-7 days before harvest in the wet/moist conditionsof the soil, the seed ecology fits to the rice microclimate forfirst week and gets established well in the rice fallowecosystem. But the sesame crop is poorly adapted to ricefallow regime (Harisudan and Sapre, 2019) due to thefollowing possible reasons.
1. Ecological determinants
1.1. Effect of rice soil compaction on rice fallow sesameand tillage requirement : The extensive use of heavymachinery in rice farming brings about numerous benefitsthrough the creation of a compact soil layer particularly toarrest the water loss through percolation and this could have
a detrimental effect on the rice fallow sesame crop in general.Compaction normally increases the mechanical strength ofthe soil but excessive use may create soil managementproblem and can adversely affect plant growth (Raghavan etal., 1977). Elfadil and Salih (2017) have found that soilcompaction significantly affects sesame growth sinceexcessive compaction impedes root penetration at levelshigher than 1.6 g/cm3. A decrease in the soil porosity aftermechanical operations (Silva et al., 2008) is a commonphenomenon. In an experiment conducted at Vridhachalam,a part of Cauvery Delta area in Tamil Nadu, sowing ofsesame after harvest of rice under till condition (rice-follow)had a positive impact on germination, crop growth rate andyield in comparison to sowing under no-till condition as ricefallow sesame (Annual Report, 2018-19; Harisudan andSapre 2019). Moreover, the rice crop is under submergedconditions for over 2-3 months and changes the soil ecologyas discussed above which is not favourable for the growthand development of sesame. In an organic fertilisationexperiment, it was noticed that approximately 80% of thesesame roots were distributed in the top 10 cm (Rodrigues etal., 2016), but this is not a universal fact. A change in soilecology from flooded rice to aerated farming results in soilphysical constraints and provides a hostile soil environmentto sesame germination and establishment. Added to this, soilstructure, soil water deficit, aeration, temperature, andmechanical impedance of the seed zone play the destroyerrole. Possibilities of sesame shallow root distribution in ricefallow soils may be due to soil compaction from the puddledrice, porosity and lack of well drainage.
1.2. Atmospheric temperature : In many parts of the worldincluding India, sesame is sown during the winter followingrice harvest. As early in 1960s, Matsuoka (1958) has foundthat the germination temperature of sesame ranges from 10°Cto 55°C, the proper temperature being between 30°C and35°C and those varieties collected from tropical conditionsshow poor germination under low temperature. In Myanmar,farmers cultivate sesame in the winter in rice land aftermonsoon rice is harvested similar to the condition thatprevails in coastal Andhra Pradesh and Odisha. To utilise theresidual nutrients and utilising the moisture after rice harvest,the sesame needs to be seeded in cold, wet soil immediatelyafter rice harvest. These conditions, however, are not suitablefor germination of sesame. The seedlings which grow slowlyare susceptible to damage by seed and root-rot organisms,which lead to an uneven plant stand low in vigor and yieldpotential. This winter planting subject the seeds to cold andwet soils, with erratic germination and seedling growth(Kyuak et al., 1995) and is the major bottleneck in extendingthe sesame in rice fallows in India in Andhra Pradesh andOdisha. Crop seeds sown in cold soil are very slow togerminate and emerge and it would obviously be desirable to
J. Oilseeds Res., 36(4) : 203-209, Dec., 2019 205
RAMESH ET AL.
shorten the time from sowing to seedling emergence.Salicylic acid may provide a solution to the chilling injury,as this helps in chilling tolerance in plants (Farooq et al.,2009) and its application alleviated the chilling (Miura andTada, 2015) and freezing injury (Tasgin et al., 2003). Khanet al. (1989) has found that at 15°C, root initiation did notoccur up to 10 days after planting, and was delayed up to thefourth day at 20°C, and at 25°C, the main roots initiated onthe second day. The lateral roots did not initiate until thesixth day after planting. One year later, Kyuak (1990)postulated that less than 20°C has adverse impact on sesamegermination since only 46.86% germination was noticed at15°C temperatures. However, recently Bakhshandeh et al.(2017) have reported 14.7° C as the base temperature.
1.3. Poor moisture availability, anaerobic conditionsand/or drought : It is important that sowing of sesame seed(either broadcast or line sowing) at optimum soil moisturecontent (either excess or deficit) in rice fallow fields. Excesssoil moisture content can cause anaerobic environment forseed germination. Several studies (Mensah et al., 2006;Tantawy et al., 2007; Uçan et al., 2007; Hassanzadeh et al.,2009) have indicated that sesame is very susceptible toenvironmental stress particularly moisture be it forgermination or subsequent growth and development.Recently, Bahrami et al. (2012) have concluded thatregardless of the sesame cultivar, drought during earlyphases severely affects the germination and seedling growth.Low moisture content in the soil after rice harvest, fastreceding of water table with the advancement of retreatingmonsoon season, and risk of intermittent soil moisture stresstowards flowering and pod filling stages are some of thewater related constraints for the establishment of fallow cropof sesame. During the kharif season water table is generallyhigh but as the monsoon rains withdraw, the water tablerecedes very fast. Even if the crop gets well establishedutilizing available soil moisture, lack of rabi rainfall towardsflowering stage creates drought conditions leading to cropfailure (Kumar et al., 2018). Chun et al. (2018) hasconcluded that sesame root growth from germination to earlyseedling is determined by soil moisture and not just geneticfactors. This issue could be overcome by using appropriateseed pelleting chemicals to induce stress tolerance in sesameand /or appropriate seed drills.
2. Production constraints
2.1 Lack of improved varieties : Sesame crop varieties arehighly photo sensitive. Varieties bred for kharif may notperform under rice fallow conditions. Except sesame varietyVRI(SV) 1 released from TNAU, Coimbatore suitable forthe rice fallow season of Tamil Nadu, in most of the states,all state recommended varieties for other seasons are only
cultivated during rice fallow season also. Sesame crops arehighly sensitive to water logging conditions. Crop will witherif water logging prevails for six hours in field during itsvegetative stage. There is a lack of noticeable improvedsesame varieties available for cultivation in rice fallows.Particularly sesame varieties which can tolerate excess waterduring the initial phase of establishment are not available.Besides low temperature tolerant sesame varieties are alsonot available.
2.2 Nutrient management: As an oilseed crop, sesamedemands all essential nutrients for a profitable crop.Wherever, sesame is sown in rice fallows, the crop is seldomsupplied with nutrients, and consequently the crop suffersdue to nutrient stress. In an irrigated well managed lowlandrice fields with grain yields of 5 to 7 t/ha, fertilizer recoveryefficiencies are 30 to 60 percent, 35 percent and 15 to 65percent for N, P and K (BCI, 2002). In order to produce 1tonne of paddy (rough rice), the rice crop absorbs an averageof 20 kg N, 11 kg P2O5, 30 kg K2O, 3 kg S, 7 kg Ca, 3 kgMg, 675 g Mn, 150 g Fe, 40 g Zn, 18 g Cu, 15 g B, 2 g Moand 52 kg Si (Roy et al., 2006).Removal of straw from thefield is widespread in India and so the depletion of soil K andSi reserves which has a significant impact on the succeedingfallow crop. In the process, some or all of the nutrientscontained in straw may be lost from the rice field(Dobermann and Fairhurst, 2002). In order to produce 1tonne of yield the sesame crop absorbs an average of 51.7 kgN, 22.9 kg P2O5, 64 kg K2O, 11.7 kg S, 37.5 kg Ca, 15.8 kgMg (Roy et al., 2006a). As the fallow sesame crop iscultivated with zero nutrient inputs, the nutrient managementin rice would have an astounding impact on the succeedingsesame crop. Further, the physical condition of soil is poordue to puddled rice and consequently nutrient mobilizationis reduced. The ongoing discussion indicated that sesameneed to be supplied with balanced fertilisers in addition tothe residual nutrients obtained from the previous rice crop inthe rotation.
2.3 Weed management: A literature search for weedmanagement in rice fallow sesame could not show anysignificant work in the direction. As a rice fallow crop, thesesame crop is vulnerable to weed competition. In TamilNadu, Cauvery delta areas of Tiruchirappalli district, ricefallow sesame area has become abysmally low due to severeweed competition from Carpet weed (Trianthemaportulocastrum). Farmers are forced to postpone firstirrigation to Sesame crop in the rice fallow season to avoidthe proliferation of this weed species. The irrigation isscheduled in such a way that the weed competition periodjust crosses in four weeks after sesame sowing(Muralidharan, personal communication).
J. Oilseeds Res., 36(4) : 203-209, Dec., 2019 206
SESAME (SESAMUM INDICUM) IN THE RICE FALLOW ENVIRONMENT - A CRITICAL APPRAISAL
3. Opportunities for sesame cultivation in the rice fallowregions
Opportunities for the successful cultivation of crops inthe rice fallow sesame with minimal investment need to beexplored, particularly where a couple of supplementalirrigation is assured to realise optimum yields. The followingresearch issues needs attention.
Mapping of rice fallow areas: The information on ricefallow areas are scattered and needs to be consolidated foraccurate estimation. The available rice fallow area fromvarious agencies provide only some preliminary information.National Mission on Oilseeds and Oil Palm has also madeefforts for bringing additional area under rice fallow withpulses and oilseeds and sesame is one among the severalcrops. Recently the Government of India has made efforts tomap the rice fallow areas of the country with satellite imagefrom Mahalanobis National Crop forecast Centre, New Delhiunder national Food security Mission.
Conservation agriculture practices: Considering the needto conserve the soil moisture and nutrients, zero tillageconcept need to be studied soil wise to harness fullestpotential of rice fallow sesame.
Research gaps: High yielding varieties are too few insesame. Research on sesame specific to rice fallows, lowtemperature tolerant strains, water logging tolerant strains areneeded in addition to drought tolerant cultivars to withstandmoisture stress at later stages. Besides research informationon soil health, pest management, mechanization etc. are alsoneeded.
Research initiatives in NARS: ICAR has initiateddeveloping package of practices for rice fallowexperimentation through its Project Coordinating Unit(Sesame and Niger) located at Jabalpur through itscoordinating centre at Tamil Nadu (Regional ResearchStation, Vriddhachalam) a couple of years back.ICAR-Indian Institute of Oilseeds Research, Hyderabad hasinitiated a network project on developing best managementpractices for enhancing sesame yield under rice fallowconditions at Hyderabad in collaboration with ICAR-IndianInstitute of Rice Research, Agricultural Research Station(ANGRAU), Ragolu, Andhra Pradesh, Regional ResearchStation (TNAU), Vriddhachalam and AICRP sunflowercentre at Dhenkanal, Odisha under OUAT in the year 2020to identify optimum tillage and nutrient requirements for ricefallow sesame.
Thus, we feel that there is a great potential to increasesesame production in the country through exploitation of
rice-fallow area that is available. However, there is a need todevelop appropriate package of practice to make this areality as there are grey areas in terms of availability of righttechnologies as well as adoption of the existing technologies.This opportunity is being explored through concerted effortsthat have been initiated under NARS.
REFERENCES
Ali M and Kumar S 2009. Major Technological Advances in Pulses- Indian Scenario. In: Milestones in Food Legumes Research,Masood Ali and Shiv Kumar (Eds.), Indian Institute of PulsesResearch, Kanpur, 20 pp.
Annual Report 2018-19. AICRP (Sesame and Niger), ICAR,JNKVV, Jabalpur, Madhya Pradesh, pp. 107-108.
Bahrami H, Razmjoo J and Jafari A O 2012. Effect of droughtstress on germination and seedling growth of sesame cultivars(Sesamum indicum L.). International Journal of Agri Science,2(5): 423-428.
Bakhshandeh E, Jamali M, Afshoon E and Gholamhossieni M2017. Using hydrothermal time concept to describe sesame(Sesamum indicum L.) seed germination response totemperature and water potential. Acta Physiologiae Plantarum,39: 250.
BCI 2002. Rice fact file. Better Crops International, 16 (SpecialSupplement): 11.
Behera U K, Mishra A K, Bishoyi B S, Behera S K, Nayak R N SS and Sing S 2014. Introduction of pulse crop in rice-fallowsystem through use of conservation agriculture practices inwestern Odisha. Journal of Soil and Water Conservation,13(4): 318-323.
Buresh R J, Woodhead T, Shepherd K D, Flordelis E andCabangon R C 1989. Nitrate accumulation and loss in a mungbean/lowland rice cropping system. Soil Science Society ofAmerica Journal, 53: 477-482.
Chauhan S, V Praveen Rao, A Pratap Kumar Reddy, G Jayasreeand Narender Reddy S 2016. Response of sesame (Sesamumindicum L.) to irrigation scheduling based on climatologicalapproach and N fertigation levels. Journal of OilseedsResearch, 33(1): 38-44.
Chun H C, Margaux A, Gloaguen R M, Yu-Chien Tseng, Lee S,Ki-Yuol Jung, Choi Y D and Rowland D 2018. Morphologicaland fractal characteristics of Sesame (Sesamum indicum L.)roots from various soil moisture contents. Korean Journal ofSoil Science and Fertilizer, August, 274-288.
Dobermann A and Fairhurst T H 2002. Rice straw management.Better Crops International, 16 (Special Supplement): 7-10.
Elfadil A D and Salih H A 2017. Effect of soil compaction on shootand root development and nutrients uptake of sesame plant.European Academic Research, V(7): 3054-3064.
Falusi O A 2006. Estimation of natural cross-pollination in twospecies of the genus Sesamum. PAT 2(2): 61-65.
Farooq M, Aziz T, Wahid A, Lee D J and Siddique K H M 2009.Chilling tolerance in maize: agronomic and physiologicalapproaches. Crop Pasture Science, 60: 501-516.
George T, Ladha J K, Buresh R J and Garrity O P 1992. Managingnative and legume-fixed nitrogen in lowland rice-basedcropping systems. Plant and Soil, 141: 69-91.
J. Oilseeds Res., 36(4) : 203-209, Dec., 2019 207
RAMESH ET AL.
Ghosh P K, Kumar N, Hazra K K and Venkatesh M S. 2012.Carrying capacity of untrapped rice fallows for pulseproduction. In: Proceedings of 3rd International AgronomyCongress, November 26-30, 2012, New Delhi. Vol. 1. IndianSociety of Agronomy, New Delhi, India. pp. 61-62.
Gumma M K, Prasad S. Thenkabail, Teluguntla P, Mahesh N. Rao,Irshad A Mohammed and Anthony M. Whitbread 2016. Mapping rice fallow cropland areas for short-season grainlegumes intensification in South Asia using MODIS 250 mtime-series data, International Journal of Digital Earth, 9(10):981-1000.
Haque M M, Kim S Y, Ali M A and Kim P J 2015. Contributionof greenhouse gas emissions during cropping and fallowseasons on total global warming potential in mono-rice paddysoils. Plant and Soil, 387: 251-264.
Harisudan C and Sapre N. 2019. Evaluation of crop establishmentmethods and foliar nutrition for enhancing productivity of ricefallow/follow sesame (Sesamum indicum L.). Journal ofOilseeds Research, 36(1): 89-92.
Hassanzadeh M, Ebadi A, Panahyan-e-KiviM,Jamaati-e-SomarinSh, Saeidi M and Gholipouri A 2009. Investigation of water stress on yield and yield components ofsesame (Sesamum indicum L.) in Moghan Region. ResearchJournal of Environmental Sciences, 3(2): 239-244.
h t tp s : / / www. n f s m. g o v . in /Read yRecko n er /Oi l seed s /PresentScenario_OS2018.pdf.
IOPEPC 2019. From chairman's desk. Indian oilseeds and produceexport promotion council. http://www.iopepc.org/from-chairmans- desk.php site accessed on 02.09.2019.
Khan S R, Brigham R D, Brar G S and Taylor H M 1989. Influenceof temperature and genotype on seedling root development ofselected sesame (Sesamum indicum L.) breeding lines.Agronomy Abstracts, ASA, Madison, WI. pp.114.
Kumar N, Yadav A, Singh S and Yadav S L 2018. Growing pulsesin rice fallow: Ensuring nutritional security in India. In:Conservation Agriculture for Advancing Food Security inChanging Climate, Anup Das, KP Mohapatra, SV Ngachan,AS Panwar, DJ Rajkhowa, Ramkrushna GI and Jayanta Layek(Eds), Vol. 1, Today & Tomorrow's Printers and Publishers,New Delhi. 107-122.
Kumar R, Mishra J S, Upadhyay P K and Hans H 2019. Ricefallows in the eastern India: Problems and prospects. IndianJournal of Agricultural Sciences, 89 (4): 567-577.
Kumar Rao D K, Harris D, Kankal M and Gupta B 2008.Extending post rainy (rabi) cropping in Paddy fallows ofeastern India. In: Improving agricultural productivity inPaddy-based systems of the High Barind Tract of Bangladesh,C R Riches, D Harris, D E Johnson and B Hardy (Eds), LosBanos, Philippines: International Paddy Research Institute, pp.193-200.
Kyauk H L A 1990. The effects of temperature and pre-soaking ongermination, emergence, and early seedling growth of Sesame(Sesamum indicum L.). Master's thesis submitted to Texas TechUniversity.
Kyauk H, Hopper N W and Brigham R D 1995. Effects oftemperature and pre-soaking on germination, root length andshoot length of sesame (Sesamum indicum L.). Environmentaland Experimental Botany, 35(3): 345-351.
Langham R 1985. USA - Growing sesame in the desert Southwest.In: A. Ashiri (Ed.), Sesame and Safflower Status andPotentials, Proceeding of Expert Consultation. FAO PlantProduction and Protection. Paper No 66, p. 75
Matsuoka K 1958. Studies on the sesame varieties influence oftemperature on the germination of sesame (Sesamum indicumL.) and the relation between germination and severalcharacters. Japanese Journal of Ecology, 8(3): 106-113.
Mensah J K, Obadoni B O, Eroutor P G and Onome-Irieguna F2006. Simulated flooding and drought effects on germination,growth, and yield parameters of sesame (Sesamum indicum L.).African Journal of Biotechnology, 5(13): 1249-1253.
Miura K and Tada Y 2015. Regulation of water, salinity, and coldstress responses by salicylic acid. Front Plant Science, 5: 4.
NAAS 2013. Improving Productivity of Rice Fallows. NAAS Policybrief. No 64.
Oyeogbe A, Ogunshakin R, Vaghela S and Patel B 2015.TowardsSustainable Intensification of Sesame-based Cropping SystemsDiversification in North western India. Journal of FoodSecurity, 3 (1): 1-5.
Pande S, Sharma M and Ghosh R 2012. Role of pulses insustaining agricultural productivity in the rainfed rice-fallowlands of India in changing climatic scenario. Climate changeand food Security in India: Proceeding of National Symposiumon Food Security in Context of Changing Climate, 30 Oct.-1Nov. 2010, pp. 53-70.
Park S, Su-Norh R, Youngmin B, Hocheol K, James ES andKwan-Su K 2010. Antioxidant compounds as potentialneuroprotective agents in sesame (Sesamum indicum L.). FoodReview International, 26: 103-121.
Patrick Jr W H and Reddy K R 1976. Fate of fertilizer nitrogen ina flooded rice soil. Soil Science Society of America Journal, 40(5): 678-681.
Polat R, Saglam R, Aydemir S and Cikman A 2006. Effects ofdifferent tillage methods on soil physical properties undersecond crop sesame in the Haran plain, south-east Turkey.Asian Journal of Plant Sciences, 5: 613-618.
Raghavan G S V, Mckyes E and Chasse M 1977. Effect of wheelslip on soil compaction. Journal of Agricultural EngineeringResearch, 22(1): 79- 83.
Raychaudhuri S P, Agarwal R R, Datta Biswas N R, Gupta S P andThomas P K 1963. Soils of India. New Delhi, India: IndianCouncil of Agricultural Research.
Reddy K R 1982. Nitrogen cycling in a flooded-soil ecosystemplanted to rice (Oryza sativa L.). Plant and Soil, 67: 209-220.
Rodrigues A F, de Souza T A F, Marques L F, Souto J S, and deSilva W P 2016. Agricultural management practices: Effects onsoil properties, root growth and sesame yield. RussianAgricultural Sciences, 42(5): 321-327.
Roger PA 1995. Biological N2-fixation and its management inwetland rice cultivation. Fertilizer Research, 42: 261-276.
Roy RN, FinckA, Blair G J and Tandon HLS 2006. Nutrientmanagement guidelines for some major field crops. In: Plantnutrition for food security a guide for integrated nutrientmanagement. Food and Agriculture Organization of The UnitedNations,. pp. 235-340.
Roy R N, Finck A, Blair G J and Tandon H L S 2006a. Optimisingplant nutrition. In: Plant nutrition for food security a guide for
J. Oilseeds Res., 36(4) : 203-209, Dec., 2019 208
SESAME (SESAMUM INDICUM) IN THE RICE FALLOW ENVIRONMENT - A CRITICAL APPRAISAL
integrated nutrient management. Food and AgricultureOrganization of The United Nations. p. 55.
Silva S, Barros N, Costa L, Leite F 2008. Soil compaction andeucalyptus growth in response to forwarder traffic intensity andload. Revista Brasileira de Ciência do Solo, 32:921-932.
Singh N R and Sama T 2013. Sesamum in Odisha and Its DiseasePest Management. Odisha Review May 2013. pp.78-79.
Subbarao G V, Kumar Rao J V D K, Kumar J, Johansen C, Deb UK, Ahmed I, Krishna Rao M V, Venkataratnam L, Hebber K R,Sai M V S R and Harris D 2001. Spatial distribution andquantification of rice-fallows in South Asia - potential forlegumes. International Crops Research Institute for theSemi-Arid Tropics, Patancheru, Andhra Pradesh, India, pp.316.
Tantawy M M, Ouda S A and Khalil F A 2007. Irrigationoptimization for different sesame varieties grown under waterstress conditions. Journal of Applied Sciences Research,
3(1):7-12.Tasgin E, Atici O and Nalbantoglu B 2003. Effects of salicylic acid
and cold on freezing tolerance in winter wheat leaves. PlantGrowth Regulation, 41: 231-236.
Troncoso-Ponce M A, Kilaru A, Cao X, Durrett T P, Fan J, Jensen J K, Thrower N A, Pauly M, Wilkerson C and Ohlrogge J B 2011. Comparative deep transcriptional profiling of fourdeveloping oilseeds. Plant Journal, 68: 1014-1027.
Uçan K, Killi F, Gençoglan C and Merdun H 2007. Effect ofirrigation frequency and amount on water use efficiency andyield of sesame (Sesamum indicum L.) under field conditions.Field Crops Research, 101: 249-258.
www.tridge.com 2019. Top producing countries of sesame seedhttps://www.tridge.com/intelligences/sesame-seed site assessedon 02.09.2019.
J. Oilseeds Res., 36(4) : 203-209, Dec., 2019 209
Validation of QTLs for seed weight in a backcross population derived from aninterspecific cross in soybean [Glycine max (L.) Merr.]
GIRIRAJ KUMAWAT1, ARTI YADAV2, SHIVAKUMAR MARRANA#1, RAM MANOHAR PATEL1, SANJAYGUPTA1, GYANESH KUMAR SATPUTE1, SURESH CHAND2 AND SAYED MASROOR HUSAIN1
1Crop Improvement Section, ICAR-Indian Institute of Soybean Research, Indore- 452 001, Madhya Pradesh
(Received: October 22, 2019; Revised: December 17, 2019; Accepted: December 18, 2019)
ABSTRACT
Soybean [Glycine max (L.) Merr.] is a major oilseed crop of India. Seed weight is an important yield componenttrait which should be suitably optimized in soybean varieties to maximize productivity. To validate 100-seed weightquantitave trait loci (QTL), a backcross population of soybean was developed from a cross between wild speciesGlycine soja (Sieb. and Zucc.) and Indian soybean cultivar JS 335. The BC2 backcross population was evaluatedfor three yield component traits, namely 100-seed weight, number of seeds/plant and seed yield/plant in BC2F2,BC2F3 and BC2F4 generation. Six QTLs reported to be associated with 100-seed weight in soybean were selectedfor QTL validation. SSR markers linked with two major QTLs for 100-seed weight could be validated successfully.One QTL, on linkage group D1a between Satt580-Satt179, identified for 100-seed weight explained 19.18% ofphenotypic variance for combined data of three years. The second QTL for 100-seed weight was identified onlinkage group C2 between marker Sat_251 and Sat_238 which contributed 10.97 and 9.28% of phenotypic variancein year 2015 and 2016, respectively.
Keywords: Glycine soja, QTLs (Quantitative trait loci), Seed weight, Seed yield, Soybean
Soybean [Glycine max (L.) Merr.] is a commercially andnutritionally important crop due to its high oil and proteincontent. It also contains minerals and health beneficialnutraceuticals like isoflavones and tocopherols. Theproductivity of soybean is low in India as compared to worldaverage (Bhatia et al., 2008). To improve productivitypotential of soybean in India, location specific favourablealleles of genes for yield component traits derived fromdiverse genetic sources have to be combined in the adaptedcultivars. The yield component traits like 100-seed weight(100-SW), seed number/ plant (SNPP), number of pods/plant(NPP), seeds/pod (SPP) and seed yield/plant (SY) are themajor determinants of yield in soybean. In soybean, a largenumber of molecular markers have been developed throughgenomics research and a number of quantitative trait loci(QTLs) associated with various agronomic traits have beenmapped using linkage mapping and association mapping(Ratnaparkhe et al., 2014; Kumawat et al., 2016). Incultivated soybean G. max, many QTLs have been identifiedfor 100-SW and other yield component traits(https://soybase.org). Meta-analysis of previously reported117 QTLs of 100-SW in the cultivated soybean hadidentified 15 consensus QTLs (Sun et al., 2012). Theseconsensus QTLs could be validated and utilized in newgenetic backgrounds and environments through breeding.
It has been shown that wild species may have alleles ofgenes which positively influence agronomic traits (Tanksleyand Mc Couch, 1997). Such favourable alleles might bebeneficial if introduced into elite cultivars lacking such--------------------------------------------------------------------------- 2School of Life Sciences, Devi Ahilya Vishwavidyalaya, Indore-452 001, MadhyaPradesh; Dr. Giriraj Kumawat and Dr. Arti Yadav equally contributed to this researchwork; *Corresponding author's E-mail: [email protected]
alleles. Glycine soja (Sieb. and Zucc.), a wild species ofsoybean, has characteristics of higher number of pods,smaller seeds, high protein content compared to cultivatedsoybean Glycine max, and have resistance to yellow mosaicdisease (YMD) (Singh et al., 1974; Wenbin and Jinling,1988; Sebolt, 2000; Concibido et al., 2003). G. soja is easilycrossable with cultivated soybean (G. max), and thereforecould be exploited for identification and incorporation ofalleles for yield component traits and disease resistance.Studies on yield traits in wild soybean G. soja have identifiedsome favourable alleles and suggested that G. soja can beused as the germplasm to improve yield traits (Concibido etal., 2003; Wang et al., 2004; Li et al., 2008). In wildsoybean PI407305, a QTL for seed yield was mapped onlinkage group (LG) B2 in a backcross mapping population(Concibido et al., 2003). A study by Wang et al. (2004) hadidentified four favourable yield QTLs in five BC2
populations across two environments. Similarly, Li et al.(2008) had identified one yield QTL linked with Satt511using G. soja derived BC2F4 population. Two QTLs for NPPand one QTL for SY were mapped by Kan et al. (2012) in awild soybean derived mapping population phenotyped overtwo years. Association mapping in 113 wild soybeanaccessions also identified two SSR markers, sct_010 andsatt316, associated with the SY (Hu et al., 2014).Comparative genomic studies between gene models of G.max and G. soja had identified several unique genes amongboth the species (Joshi et al., 2013).
Nonetheless, G. soja also possess several undesirabletraits like smaller seed size, twinning growth habit, blackseed coat colour and pod shattering, therefore extensivebackcrossing is required. The backcrossing cycles andintrogression breeding time could be reduced by application
J. Oilseeds Res., 36(4) : 210-216, Dec., 2019 210
VALIDATION OF QTLs FOR SEED WEIGHT IN SOYBEAN
of molecular markers. When wild and cultivated lines arecombined for dissection of complex traits and identificationof molecular markers, the primary mapping populations arenot preferred because these mapping populations can hardlybe able to estimate individual QTL precisely due to theirgenetic background noise and poor general agronomicperformance of lines. Therefore, there is a need to studyQTLs for complex traits like yield and component traits in abackcross population that has improved agronomicperformance (Tanksley and Nelson, 1996).The objectives ofthis study were to evaluate a BC2 derived backcrosspopulation developed from wild species G. soja and a highyielding Indian soybean cultivar JS 335 for yield componenttraits and to validate selected SSR markers linked toconsensus QTLs for 100-seed weight.
MATERIALS AND METHODS
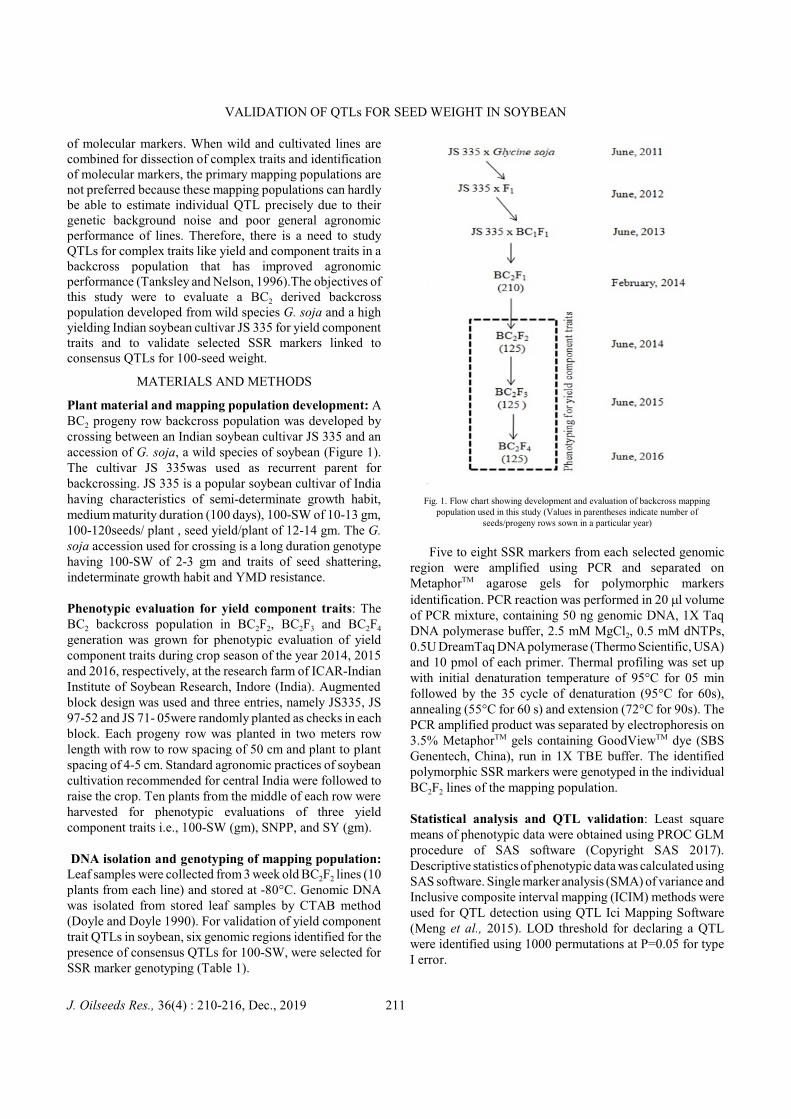
Plant material and mapping population development: ABC2 progeny row backcross population was developed bycrossing between an Indian soybean cultivar JS 335 and anaccession of G. soja, a wild species of soybean (Figure 1).The cultivar JS 335was used as recurrent parent forbackcrossing. JS 335 is a popular soybean cultivar of Indiahaving characteristics of semi-determinate growth habit,medium maturity duration (100 days), 100-SW of 10-13 gm,100-120seeds/ plant , seed yield/plant of 12-14 gm. The G.soja accession used for crossing is a long duration genotypehaving 100-SW of 2-3 gm and traits of seed shattering,indeterminate growth habit and YMD resistance.
Phenotypic evaluation for yield component traits: TheBC2 backcross population in BC2F2, BC2F3 and BC2F4
generation was grown for phenotypic evaluation of yieldcomponent traits during crop season of the year 2014, 2015and 2016, respectively, at the research farm of ICAR-IndianInstitute of Soybean Research, Indore (India). Augmentedblock design was used and three entries, namely JS335, JS97-52 and JS 71- 05were randomly planted as checks in eachblock. Each progeny row was planted in two meters rowlength with row to row spacing of 50 cm and plant to plantspacing of 4-5 cm. Standard agronomic practices of soybeancultivation recommended for central India were followed toraise the crop. Ten plants from the middle of each row wereharvested for phenotypic evaluations of three yieldcomponent traits i.e., 100-SW (gm), SNPP, and SY (gm).
DNA isolation and genotyping of mapping population:Leaf samples were collected from 3 week old BC2F2 lines (10plants from each line) and stored at -80°C. Genomic DNAwas isolated from stored leaf samples by CTAB method(Doyle and Doyle 1990). For validation of yield componenttrait QTLs in soybean, six genomic regions identified for thepresence of consensus QTLs for 100-SW, were selected forSSR marker genotyping (Table 1).
Fig. 1. Flow chart showing development and evaluation of backcross mappingpopulation used in this study (Values in parentheses indicate number of
seeds/progeny rows sown in a particular year)
Five to eight SSR markers from each selected genomicregion were amplified using PCR and separated onMetaphorTM agarose gels for polymorphic markersidentification. PCR reaction was performed in 20 ml volumeof PCR mixture, containing 50 ng genomic DNA, 1X TaqDNA polymerase buffer, 2.5 mM MgCl2, 0.5 mM dNTPs,0.5U DreamTaq DNA polymerase (Thermo Scientific, USA)and 10 pmol of each primer. Thermal profiling was set upwith initial denaturation temperature of 95°C for 05 minfollowed by the 35 cycle of denaturation (95°C for 60s),annealing (55°C for 60 s) and extension (72°C for 90s). ThePCR amplified product was separated by electrophoresis on3.5% MetaphorTM gels containing GoodViewTM dye (SBSGenentech, China), run in 1X TBE buffer. The identifiedpolymorphic SSR markers were genotyped in the individualBC2F2 lines of the mapping population.
Statistical analysis and QTL validation: Least squaremeans of phenotypic data were obtained using PROC GLMprocedure of SAS software (Copyright SAS 2017).Descriptive statistics of phenotypic data was calculated usingSAS software. Single marker analysis (SMA) of variance andInclusive composite interval mapping (ICIM) methods wereused for QTL detection using QTL Ici Mapping Software(Meng et al., 2015). LOD threshold for declaring a QTLwere identified using 1000 permutations at P=0.05 for typeI error.
J. Oilseeds Res., 36(4) : 210-216, Dec., 2019 211
GIRIRAJ KUMAWAT ET AL.
Table 1 List of consensus QTLs of 100-seed weight trait selected for QTL validation
Linkagegroup
Map positions of consensus QTLs
{Gm Consensus 4.0 (cM)}
SSRs selected for polymorphism analysis(http://www.soybase.org/search/qtllist.php)
References
B2 60-75 Satt230, Satt474, Satt066, Sct_064, Satt063 Concibido et al., 2003; Smalley et al., 2004;Guzman et al., 2007; Liu et al., 2011; Sun etal., 2012
C2 115-125 Satt251, Satt142, Satt238, Satt658, Satt079,Satt708, Satt312, Satt307
Zhang et al., 2004; Wang et al., 2004;Guzman et al., 2007; Palomeque et al., 2009;Du et al., 2009; Liu et al., 2011; Sun et al.,2012
D1a 40-55 Satt548, Satt254, Satt179, Sat_201, Satt580,Satt370, Satt106, Satt077
Orf et al., 1999; Hyten et al., 2004; Liu et al.,2011; Sun et al., 2012
I 35-50 Satt496, AB002807, Satt174, Satt239, Satt270 Concibido et al., 2003; Du et al., 2009; Liu etal., 2011; Sun et al., 2012
K 30-40 Satt055, Satt167, Satt247, Satt178, Satt555
Yuan et al., 2002; Wang et al., 2004; Kabelkaet al., 2004; Guzman et al., 2007
M 10-25 Satt201, Satt150, Satt316, CSSR305, Satt567 Orf et al., 1999; Concibido et al., 2003; Zhanget al., 2004; Sun et al., 2012
RESULTS AND DISCUSSION
For validating the yield component QTLs in BC2
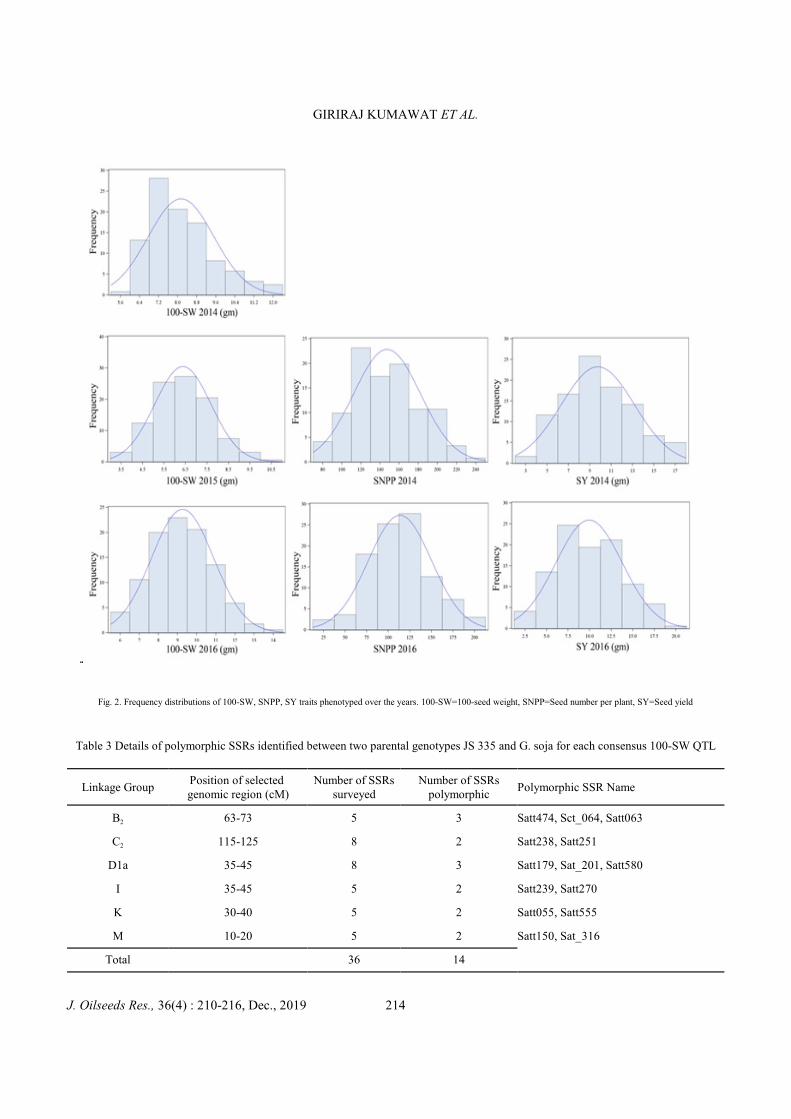
backcross population, phenotypic data were recorded forthree yield component traits i.e. 100-SW, SNPP and SY inthe year 2014, 2015 and 2016, however, SNPP and SY dataof the year 2015 was not used for analysis due to poor seedharvest. Least square means of the observed data werecalculated and frequency distribution of phenotypic data for100-SW, SNPP and SY had been fitted in a normaldistribution curve which showed quantitative nature of traits(Fig. 2). Transgressive segregation on higher side of theobserved values of all three traits indicated the presence offavourable alleles and new recombinant genotypes betweenboth the parents (Table 2). In the year 2016, transgressivesegregants were observed for 100-SW, SNPP and SY withobserved value higher than JS 335. In the year 2016, BC2F4
line S47 showed highest 100-SW of 13.9 gm followed bySS171 with 13.29 gm. BC2F4 line SS147 showed highestSNPP of 210 followed by SS190b with 196.39 SNPP. BC2F4
line SS187 showed highest SY of 20.06 gm followed bySS177 and S122 with 18.55 and 18.25 gm, respectively.Normal distribution pattern observed among recordedphenotypic data of all three yield component traits indicatedthat the backcross population was suitable for QTL mapping.
Out of a total of 36 SSR markers used for parentalpolymorphism analysis from six genomic regions selected forQTL validation, 14 SSRs were polymorphic (Table 3). These14 polymorphic SSRs were genotyped in 125 BC2F2 lines ofbackcross mapping population. Phenotyping data of 100-SW,SNPP and SY in BC2F2 and BC2F4 populations were usedfor QTL analysis, whereas for BC2F3, only phenotyping dataof 100-SW were used for QTL analysis.
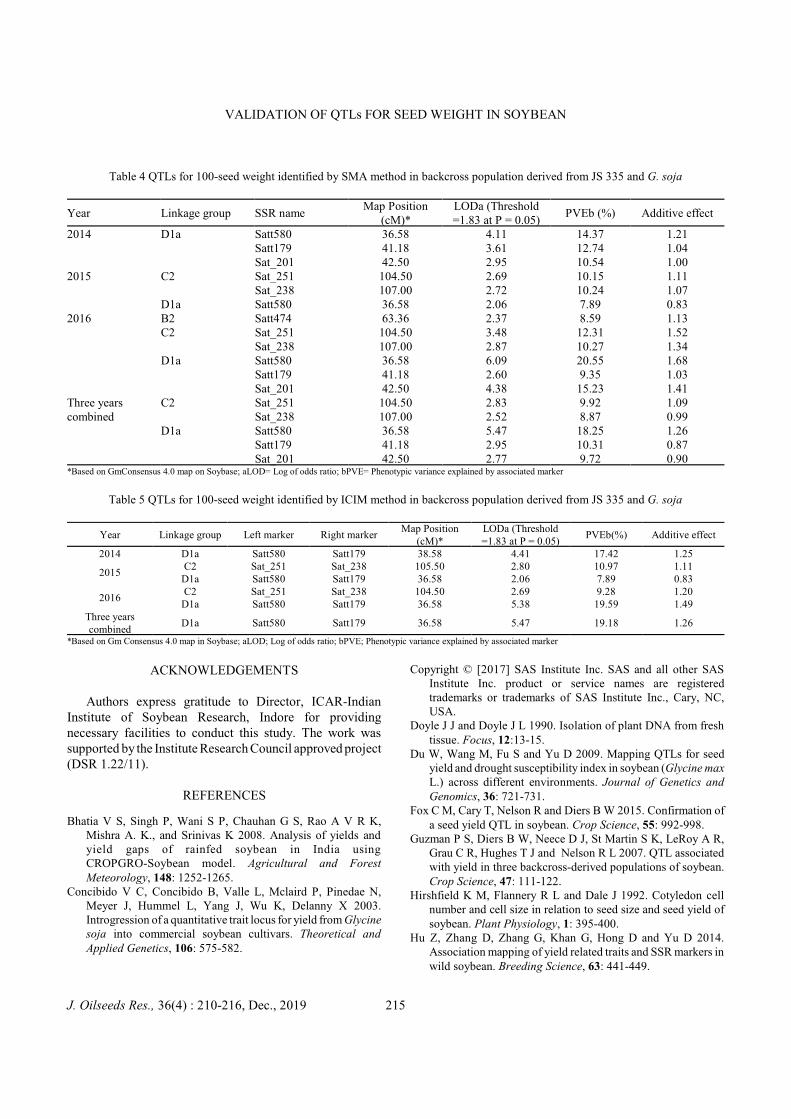
Using SMA method, three markers of a genomic regionon LG D1a were identified to be linked with 100-SW trait inthe year 2014 (Table 4). For this QTL region, highestphenotypic variance (PV) of 14.37% was explained bySatt580 at LOD score of 4.11. In the year 2015, two markersof LG C2 and one marker of D1a showed linkage with100-SW trait. Satt580 on LG D1a was again identified to belinked with 100-SW in the year 2015, albeit with lessphenotypic variance explained (PVE) and LOD of 7.89%and 2.06, respectively. Similarly, two closely linked markersSat_251 and Sat_238 on LG C2 explained 10.15% and10.24% PV at LOD score of 2.69 and 2.72, respectively. Inthe year 2016, SMA identified six SSR markers from threeLGs associated with 100-seed weight, of these; five markerswere identified to be linked in previous two years also (Table4). Out of three markers identified for 100-SW on LG D1a,the highest PV of 20.55% at LOD score 6.09 was explainedby Satt580. Sat_251 identified on LG C2 had explained12.31% PV at LOD score of 3.48. A new marker Satt474 onLG B2 was identified to be linked with 100-SW explaining8.59% of PV in this particular year.
Out of total six markers identified for three 100-SWQTLs, Satt580 showed linkage with 100-SW trait in all ofthe three years, whereas, Sat_251 showed linkage with100-SW trait in two of the three years evaluated, bothexplaining more than 10% of PV. The favourable alleles ofall the linked SSR markers identified were contributed by therecurrent parent JS 335. SMA analysis of SY trait hadidentified one SSR marker on LG B2 associated with SY forcombined data of two years. Satt474 on B2 contributed6.73% to PV for SY at LOD value of 1.89. Satt474 identifiedwith additive value of 1.61 contributed by JS 335 alleles.None of SSR markers genotyped were associated with SNPPtrait.
J. Oilseeds Res., 36(4) : 210-216, Dec., 2019 212
VALIDATION OF QTLs FOR SEED WEIGHT IN SOYBEAN
Using ICIM method, two QTLs were detected for100-SW trait (Table 5). One QTL for 100-SW was identifiedon LG D1a between SSR Satt580 and Satt179,which waspresent between 36.58 to 38.58cM position. This particular100-SW QTL was identified in all of the three yearsphenotypic evaluation data and explained up to 19.59 % ofPVE. Another QTL for 100-SW was identified on LG C2between marker Sat_251 and Sat_238 contributing 10.97%PV in the year 2015 and 9.28% in the year 2016.The SSRmarkers of both the QTLs were also identified using SMAmethod with similar level of PVE for 100-SW. Thefavourable alleles of 100-SW were contributed by recurrentparent 'JS 335' at both the QTLs. Since, the QTLs for100-SW on LG C2 and D1a were identified at the samegenomic location over the years in both the mappingmethods, markers linked with these two major and consensusQTLs for 100-SW in soybean can be utilized in molecularbreeding program confidently.
Previously, several QTLs for 100-SW and SY weremapped on to the six genomic regions which were selectedfor validation in this study (Sun et al., 2012; Concibido etal., 2003; Wang et al., 2004; Smalley et al., 2004; Guzmanet al., 2007; Liu et al., 2011; Zhang et al., 2004; Orf et al.,1999; Hyten et al., 2004). Although, these genomic regionscomprise several SSR markers, two of the SSR markersidentified in this study were specifically identified to belinked with 100-SW and SY traits in some of the previousstudies (Concibido et al., 2003; Guzman et al., 2007; Du etal., 2009; Fox et al., 2015). In our study, Satt474 on LG B2was identified to be linked with 100-SW in the year 2016 andSY for combined data of two years. Study by Concibido etal., 2003, had also identified a yield QTL associated withSatt474 at LOD score of 2.14 in a G. soja derivedpopulation. In G. max, Guzman et al., (2007) had identifieda QTL for seed yield associated with SSR marker Satt474and Fox et al., (2015) confirmed this seed yield QTL. On LG
D1a, Hyten et al., (2004) identified a 100-SW QTL linkedwith Satt179 contributing 13.9% PVE in cultivated soybeanpopulation. In soybean, 100-SW is positively correlated withseed yield. Several factors had been identified that couldaffect soybean 100-SW, i.e. cotyledon cell number, cellgrowth rate, cell volume and weight, seed size, relationshipbetween endogenous hormones and seed growth, andexogenous hormones (Sun et al., 2012; Hirshfield et al.,1992). Fine mapping and cloning of genes for 100-SW QTLsin near isogenic lines (NILs) could decipher the molecularmechanism of 100-SW variation in soybean. In India,molecular markers linked with YMD resistance and seed coatim-permeability traits were identified from G. soja (Rani etal., 2018; Ramakrishna et al., 2018). Recently, Mohekar etal. (2019) also validated SSR markers for pod shatteringtolerance in Indian landrace Kalitur. The SSR markersvalidated for 100-SW QTLs in present study will be usefulfor rapid recovery of 100-SW during introgression of YMDresistance and seed coat im-permeability traits throughmarker assisted backcross breeding in soybean.
The present study reports development of a backcrosspopulation by utilizing a wild species Glycine soja in thebackground of Indian soybean cultivar JS 335. The BC2
backcross population has been characterized for yieldcomponent traits and SSR markers linked with two majorQTLs for 100-seed weight trait have been validated. A minorQTL has also been validated for seed yield/plant. Theidentified SSR markers for 100-seed weight can be used aspreferred markers for the background selection to facilitatespeedy recovery of seed weight in early generations whileusing wild relative G. soja as a donor for biotic and abioticstress resistance. Further, the backcross populationdeveloped in this study is very useful for genetic mapping,development of near isogenic lines for fine mapping andidentification of trait specific pre-breeding lines i.e. highprotein content, disease resistance.
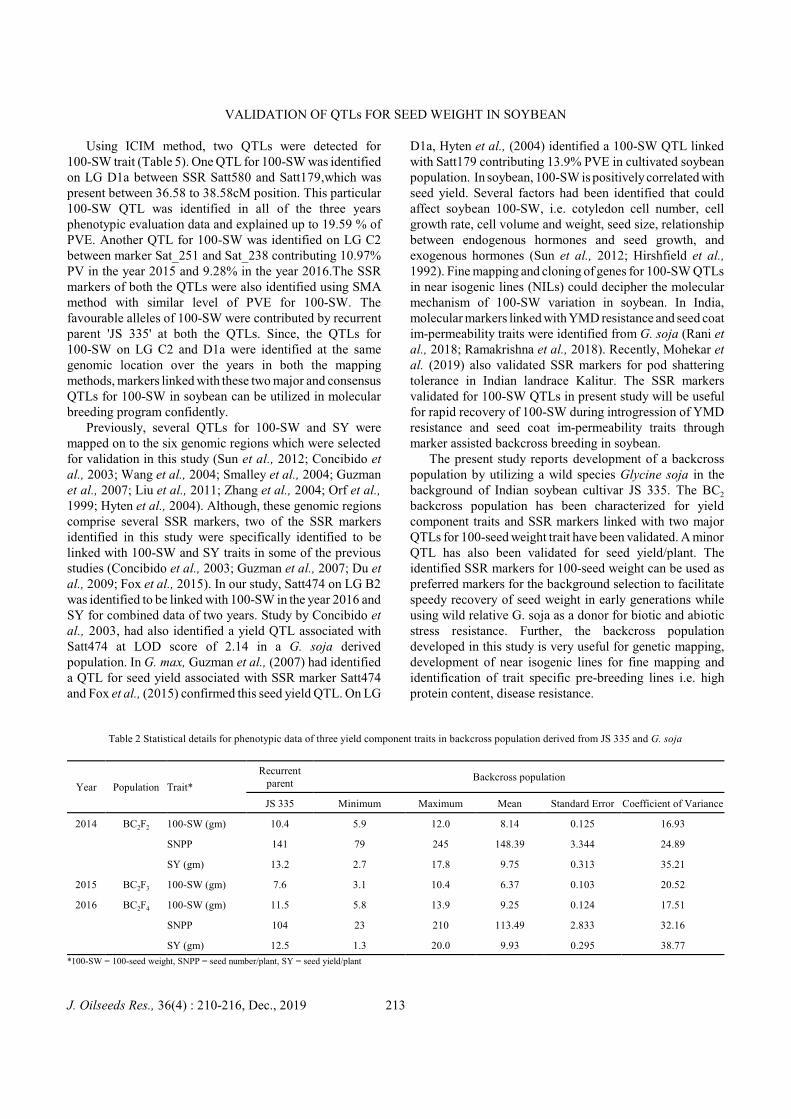
Table 2 Statistical details for phenotypic data of three yield component traits in backcross population derived from JS 335 and G. soja
Year Population Trait*
Recurrentparent
Backcross population
JS 335 Minimum Maximum Mean Standard Error Coefficient of Variance
2014 BC2F2 100-SW (gm) 10.4 5.9 12.0 8.14 0.125 16.93
SNPP 141 79 245 148.39 3.344 24.89
SY (gm) 13.2 2.7 17.8 9.75 0.313 35.21
2015 BC2F3 100-SW (gm) 7.6 3.1 10.4 6.37 0.103 20.52
2016 BC2F4 100-SW (gm) 11.5 5.8 13.9 9.25 0.124 17.51
SNPP 104 23 210 113.49 2.833 32.16
SY (gm) 12.5 1.3 20.0 9.93 0.295 38.77
*100-SW = 100-seed weight, SNPP = seed number/plant, SY = seed yield/plant
J. Oilseeds Res., 36(4) : 210-216, Dec., 2019 213
GIRIRAJ KUMAWAT ET AL.
Fig. 2. Frequency distributions of 100-SW, SNPP, SY traits phenotyped over the years. 100-SW=100-seed weight, SNPP=Seed number per plant, SY=Seed yield
Table 3 Details of polymorphic SSRs identified between two parental genotypes JS 335 and G. soja for each consensus 100-SW QTL
Linkage GroupPosition of selected genomic region (cM)
Number of SSRssurveyed
Number of SSRspolymorphic
Polymorphic SSR Name
B2 63-73 5 3 Satt474, Sct_064, Satt063
C2 115-125 8 2 Satt238, Satt251
D1a 35-45 8 3 Satt179, Sat_201, Satt580
I 35-45 5 2 Satt239, Satt270
K 30-40 5 2 Satt055, Satt555
M 10-20 5 2 Satt150, Sat_316
Total 36 14
J. Oilseeds Res., 36(4) : 210-216, Dec., 2019 214
VALIDATION OF QTLs FOR SEED WEIGHT IN SOYBEAN
Table 4 QTLs for 100-seed weight identified by SMA method in backcross population derived from JS 335 and G. soja
Year Linkage group SSR nameMap Position
(cM)*LODa (Threshold=1.83 at P = 0.05)
PVEb (%) Additive effect
2014 D1a Satt580Satt179Sat_201
36.5841.1842.50
4.113.612.95
14.3712.7410.54
1.211.041.00
2015 C2 Sat_251Sat_238
104.50107.00
2.692.72
10.1510.24
1.111.07
D1a Satt580 36.58 2.06 7.89 0.832016 B2 Satt474 63.36 2.37 8.59 1.13
C2 Sat_251Sat_238
104.50107.00
3.482.87
12.3110.27
1.521.34
D1a Satt580Satt179Sat_201
36.5841.1842.50
6.092.604.38
20.559.35
15.23
1.681.031.41
Three yearscombined
C2 Sat_251Sat_238
104.50107.00
2.832.52
9.928.87
1.090.99
D1a Satt580Satt179Sat_201
36.5841.1842.50
5.472.952.77
18.2510.319.72
1.260.870.90
*Based on GmConsensus 4.0 map on Soybase; aLOD= Log of odds ratio; bPVE= Phenotypic variance explained by associated marker
Table 5 QTLs for 100-seed weight identified by ICIM method in backcross population derived from JS 335 and G. soja
Year Linkage group Left marker Right markerMap Position
(cM)*LODa (Threshold=1.83 at P = 0.05)
PVEb(%) Additive effect
2014 D1a Satt580 Satt179 38.58 4.41 17.42 1.25
2015C2 Sat_251 Sat_238 105.50 2.80 10.97 1.11
D1a Satt580 Satt179 36.58 2.06 7.89 0.83
2016C2 Sat_251 Sat_238 104.50 2.69 9.28 1.20
D1a Satt580 Satt179 36.58 5.38 19.59 1.49Three yearscombined
D1a Satt580 Satt179 36.58 5.47 19.18 1.26
*Based on Gm Consensus 4.0 map in Soybase; aLOD; Log of odds ratio; bPVE; Phenotypic variance explained by associated marker
ACKNOWLEDGEMENTS
Authors express gratitude to Director, ICAR-IndianInstitute of Soybean Research, Indore for providingnecessary facilities to conduct this study. The work wassupported by the Institute Research Council approved project(DSR 1.22/11).
REFERENCES
Bhatia V S, Singh P, Wani S P, Chauhan G S, Rao A V R K,Mishra A. K., and Srinivas K 2008. Analysis of yields andyield gaps of rainfed soybean in India usingCROPGRO-Soybean model. Agricultural and ForestMeteorology, 148: 1252-1265.
Concibido V C, Concibido B, Valle L, Mclaird P, Pinedae N,Meyer J, Hummel L, Yang J, Wu K, Delanny X 2003.Introgression of a quantitative trait locus for yield from Glycinesoja into commercial soybean cultivars. Theoretical andApplied Genetics, 106: 575-582.
Copyright © [2017] SAS Institute Inc. SAS and all other SASInstitute Inc. product or service names are registeredtrademarks or trademarks of SAS Institute Inc., Cary, NC,USA.
Doyle J J and Doyle J L 1990. Isolation of plant DNA from freshtissue. Focus, 12:13-15.
Du W, Wang M, Fu S and Yu D 2009. Mapping QTLs for seedyield and drought susceptibility index in soybean (Glycine maxL.) across different environments. Journal of Genetics andGenomics, 36: 721-731.
Fox C M, Cary T, Nelson R and Diers B W 2015. Confirmation ofa seed yield QTL in soybean. Crop Science, 55: 992-998.
Guzman P S, Diers B W, Neece D J, St Martin S K, LeRoy A R,Grau C R, Hughes T J and Nelson R L 2007. QTL associatedwith yield in three backcross-derived populations of soybean.Crop Science, 47: 111-122.
Hirshfield K M, Flannery R L and Dale J 1992. Cotyledon cellnumber and cell size in relation to seed size and seed yield ofsoybean. Plant Physiology, 1: 395-400.
Hu Z, Zhang D, Zhang G, Khan G, Hong D and Yu D 2014.Association mapping of yield related traits and SSR markers inwild soybean. Breeding Science, 63: 441-449.
J. Oilseeds Res., 36(4) : 210-216, Dec., 2019 215
GIRIRAJ KUMAWAT ET AL.
Hyten D L, Pantalone V R, Sams C E, Saxton A M, Landau-EllisD, Stefaniak T R and Schmidt M E 2004. Seed quality QTL ina prominent soybean population. Theoretical and AppliedGenetics, 109: 552-561.
Joshi T, Valliyodan B, Jeng W H, Lee S H, Dong X and Nguyen HT 2013. Genomics differences between cultivated Soybean, G.max and its wild relative G. soja. BMC Genomics, 14(Suppl.1):S5.
Kabelka E A, Diers B W, Fehr W R, LeRoy A R, Baianu I C, YouT, Neece D J and Nelson R L 2004. Putative alleles forincreased yield from soybean plant introductions. CropScience, 44: 784-791.
Kan G Z, Tong Z F, Hu Z B, Zhang D, Zhang G Z, and Yu D Y2012. Mapping QTLs for yield related traits in wild soybean(Glycine soja Sieb. and Zucc.). Soybean Science, 31: 333-340.
Kumawat G, Gupta S, Ratnaparkhe M B, Maranna S and SatputeG K 2016. QTLomics in Soybean: a way forward fortranslational genomics and breeding. Frontiers in PlantScience, 7: 1852.
Li D, Pfeiffer W and Cornelius P L 2008. Soybean QTL for yieldand yield components associated with Glycine soja alleles.Crop Science, 48: 571-581.
Liu W, Kim M Y, Van K, LeeY H, Li H, Liu X and Lee S H 2011.QTL identification of yield-related traits and their associationwith flowering and maturity in soybean. Journal of CropScience and Biotechnology, 14: 65-70.
Meng L, Huihui L, Zhang L and Wang J 2015. QTL ICI Mapping:Integrated Software genetic Linkage Map construction andQuantitative trait locus mapping in biparental populations. TheCrop Journal, 3: 269-283.
Mohekar D P, Thakare D S, Deshmukh M P, Dodake S S andChimote V P 2019. Validation of molecular markers for podshattering tolerance in soybean [Glycine max (L.) Merrill].Journal of Oilseed Research, 36: 73-78.
Orf J H, Chase K, Jarvik T, Mansur L M, Cregan P B, Adler F R,Lark K G 1999. Genetics of soybean agronomic traits. I.Comparison of three related recombinant inbred populations.Crop Science, 39: 1642-1651.
Palomeque L, Li J L, Li W, Hedges B, Cober E and Rajcan I 2009.QTL in mega-environments: II. Agronomic trait QTLco-localized with seed yield QTL detected in a populationderived from a cross of high-yielding adapted x high-yieldingexotic soybean lines. Theoretical and Applied Genetics, 119:429-436.
Ramakrishna G, Kaur P, Nigam D, Chaduvula P K, Yadav S,Talukdar A, Singh N K and Gaikwad K 2018. Genome-wideidentification and characterization of InDels and SNPs inGlycine max and Glycine soja for contrasting seed permeability
traits. BMC Plant Biology, 18: 141.Rani A, Kumar V, Gill B S, Shukla S, Rathi P and Singh R K
2018. Mapping of duplicate dominant genes for MYMIVresistance in Glycine soja. Crop Science, 58: 1566-1574.
Ratnaparkhe M B, Ramesh S V, Kumawat G, Husain S M andGupta S 2014. Advances in soybean genomics. In: Gupta S etal. (Eds) Legumes in Omics Era, Springer Publications, NewYork, pp. 41-71.
Sebolt A M 2000. Analysis of a quantitative trait locus allele fromwild soybean that increases seed protein concentration insoybean. Crop Science, 40: 1438-1444.
Singh B B, Singh B D and Gupta S C 1974. PI171443 and Glycineformosana resistant lines for yellow mosaic of soybean.Soybean Genetics Newsletter B, 1: 17-18.
Smalley M D, Fehr W R, Cianzio S R, Han F, Sebastian S A andStreit L G 2004. Quantitative trait loci for soybean seed yieldin elite and plant introduction germplasm. Crop Science, 44:436-442.
Sun Y N, Pan J B, Shi X L, Du X Y, Wu Q, Qi Z M, Jiang H W,Xin D W, Liu C Y, Hu G H and Chen Q S 2012.Multi-environment mapping and meta-analysis of 100-seedweight in soybean. Molecular Biology Reporter, 39: 9435-943.
Tanksley S D and McCouch S R 1997. Seed banks and molecularmaps: unlocking genetic potential from the wild. Science, 277:1063-1066.
Tanksley S D and Nelson J C 1996. Advanced backcross QTLanalysis: a method for the simultaneous discovery and transferof valuable QTLs from unadapted germplasm into elitebreeding lines. Theoretical and Applied Genetics, 92: 191-203.
Wang D, Graef G L, Procopiuk A M and Dier B W 2004.Identification of putative QTL that underlie yield ininterspecific soybean backcross population. Theoretical andApplied Genetics, 108: 458-467.
Wenbin L and Jinling W 1988. Study on improving trait from theG. soja x G. max with dwarf genes. Soybean GeneticsNewsletter, 15: 31-39.
Yuan J, Njiti V N,Meksem K, Iqbal M J,Triwitayakorn K, KassemM A, Davis G T, Schmidt M E and Lightfoot D A 2002.Quantitative trait loci in two soybean recombinant inbred linepopulations segregating for yield and disease resistance. CropScience, 42: 271-277.
Zhang W, Wang Y, Luo G, Zhang J, He C, Wu X, Gai J and ChenS 2004. QTL mapping of ten agronomic traits on the soybean(Glycine max (L.) Merr.) genetic map and their association withEST markers. Theoretical and Applied Genetics, 108:1131-1139.
J. Oilseeds Res., 36(4) : 210-216, Dec., 2019 216
Yield stability and association of its component characters in soybean (Glycine max L.) genotypes
M PALLAVI*, G PRAVEEN KUMAR AND N SANDHYA KISHORE
Regional Sugarcane and Rice Research Station, PJTSAU, Rudrur, Nizamabad- 503 188, Telangana
(Received: May 14, 2019; Revised: October 19, 2019; Accepted: November 25, 2019)
ABSTRACT
The present investigation was carried out to study stability performance for seed yield and its components in 24soybean varieties using a randomized complete block design. The partitioning of (environment + genotype xenvironment) mean squares showed that environments (linear) differed significantly for yield and its componentcharacters except for 100-seed weight. Stable genotypes were identified for wider environments and specificenvironments with high per se performance (over population mean) for seed yield/ha. The investigation revealedthat the genotype AMS 243 and DSB 20 possessed desirable stability across the environments. Genotypes AMS MB5-19, NRC 2007 2-19 were suitable for favourable situations for seed yield.
Keywords: G x E interaction, Performance, Seed yield, Soybean, Stability analysis
Soybean (Glycine max L. 2n=2x=40) is an importantoilseed produced in several parts of the world with richsource of protein and phytochemicals. This crop has aminoacid composition in their protein which is on par with that ofmeat, milk products and eggs. The top producer of soybeanis the USA occupying 34% of world's soybean productionand contributing to 42% of market share. The soybean areain India has been increasing and has reached 10.84 m ha witha production of 11.48 m t and productivity of 1059 kg/haduring 2018-19.
Under changing climatic conditions the target put forthfor breeders for increasing the productivity is developmentof high yielding and stable varieties of soybean. Soybeanbreeding in India mainly focuses on developing high yieldingearly maturing varieties with pest and disease resistance,suitability for food and vegetable purpose, improved seedgermination & longevity and quality traits. In addition, thisdeveloped variety should have wider adaptability and stableperformance across locations. Genotype x Environment(GxE) interaction determines the phenotypic expressionamong genotypes. The study of GxE interaction is crucial forindicating genotypes to each locality (Hamawaki et al.,2015). Strong GxE interaction for quantitative traits like seedyield severely limits the gain in selecting superior genotypesfor cultivar development (Kang, 1990). Hence evaluatingstability of performance and adaptation range is veryimportant for cultivar development. According to Polizel etal. (2013) a new soybean cultivar should have desirablecharacteristics like plant height, high grain yield, productionstability and wide adaptation to diverse environments. JS335, is a popular variety grown for more than a decade in thecountry and it is also the only variety being grown inTelangana zone since the introduction of the crop. Presentstudy was carried out to identify the stable high yieldingsoybean genotypes for Telangana state.--------------------------------------------------------------------------- Corresponding author's E-mail: [email protected]
MATERIALS AND METHODS
The experiment was carried out in three consecutive rainyseasons of 2014-16. The material was sown on June 17,2014, on July 7, 2015 and on June 22, 2016 at Farm ofRegional Sugarcane and Rice Research Station, Rudrur,Nizamabad located at 77o88 East and 18°58 North at anelevation 404 m above mean sea level. The soil pH at the testlocation ranged between 7.5-8.0 and the experimentalmaterial involved twenty four diverse genotypes of soybeancollected from Agricultural Research Station, Adilabad,Telangana. The experiment was laid out in RCBD designwith two replications. Each genotype was grown in 4 rows of4 m length and at a spacing of 30×10 cm. The recommendeddose of fertilizer of 30:60:40 of N, P2O5 and K2O wasapplied to raise healthy crop. Entire P2O5and K2O wasapplied as basal dose while, N was applied in two splits, 1stat the time of sowing as basal and 2nd dose at 25 DAS. Theweather conditions during the sowing season is presented inTable 1. Observations were recorded on five randomlyselected plants from each plot for the traits plant height (cm),number of branches/plant, number of nodes/plant, number ofclusters/plant, number of pods/plant and 100 seed weight,while days to 50% flowering and seed yield was recorded onwhole plot basis. Varieties were analysed for stabilityparameters by following Eberhart and Russell model (1966).
RESULTS AND DISCUSSION
The analysis of variance revealed that genotypes differedsignificantly for all the characters indicating the presence ofdiversity among the genotypes under study. Similarly theenvironments in which the genotypes were grown variedsignificantly for all the characters. Variance due to GxEinteraction was also significant for all the characters exceptfor plant height indicating that most of the genotypes had
J. Oilseeds Res., 36(4) : 217-219, Dec., 2019 217
PALLAVI ET AL.
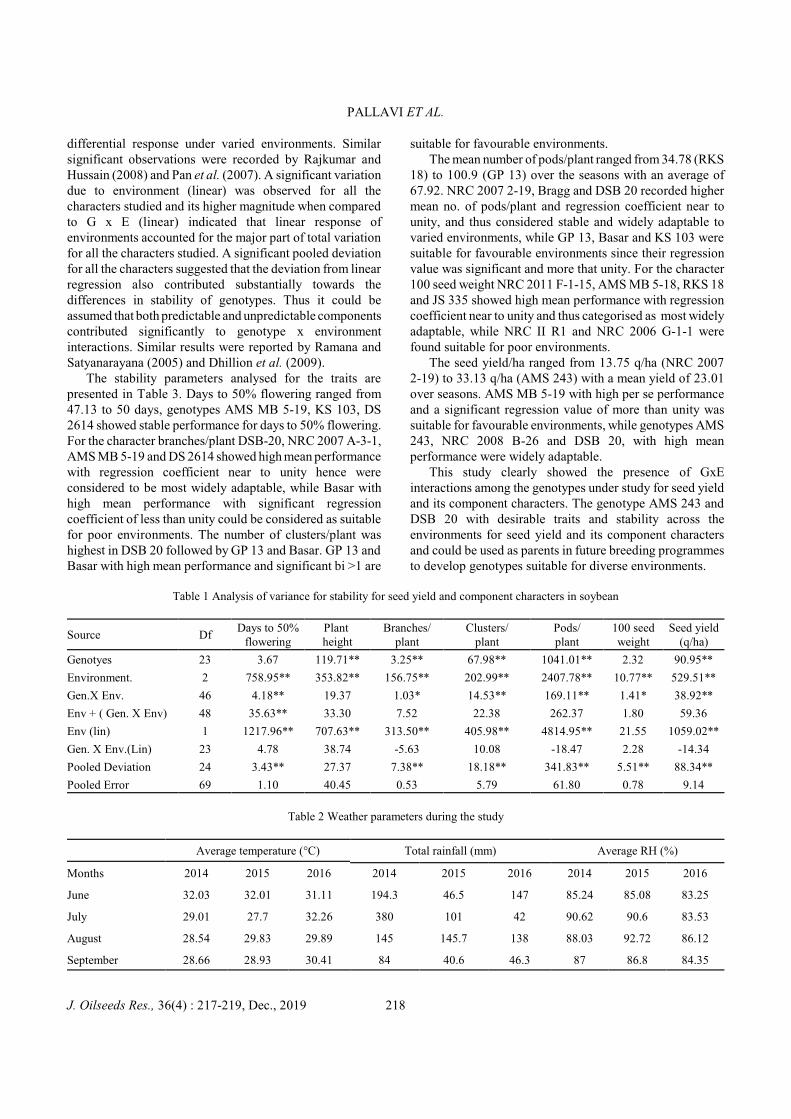
differential response under varied environments. Similarsignificant observations were recorded by Rajkumar andHussain (2008) and Pan et al. (2007). A significant variationdue to environment (linear) was observed for all thecharacters studied and its higher magnitude when comparedto G x E (linear) indicated that linear response ofenvironments accounted for the major part of total variationfor all the characters studied. A significant pooled deviationfor all the characters suggested that the deviation from linearregression also contributed substantially towards thedifferences in stability of genotypes. Thus it could beassumed that both predictable and unpredictable componentscontributed significantly to genotype x environmentinteractions. Similar results were reported by Ramana andSatyanarayana (2005) and Dhillion et al. (2009).
The stability parameters analysed for the traits arepresented in Table 3. Days to 50% flowering ranged from47.13 to 50 days, genotypes AMS MB 5-19, KS 103, DS2614 showed stable performance for days to 50% flowering.For the character branches/plant DSB-20, NRC 2007 A-3-1,AMS MB 5-19 and DS 2614 showed high mean performancewith regression coefficient near to unity hence wereconsidered to be most widely adaptable, while Basar withhigh mean performance with significant regressioncoefficient of less than unity could be considered as suitablefor poor environments. The number of clusters/plant washighest in DSB 20 followed by GP 13 and Basar. GP 13 andBasar with high mean performance and significant bi >1 are
suitable for favourable environments. The mean number of pods/plant ranged from 34.78 (RKS
18) to 100.9 (GP 13) over the seasons with an average of67.92. NRC 2007 2-19, Bragg and DSB 20 recorded highermean no. of pods/plant and regression coefficient near tounity, and thus considered stable and widely adaptable tovaried environments, while GP 13, Basar and KS 103 weresuitable for favourable environments since their regressionvalue was significant and more that unity. For the character100 seed weight NRC 2011 F-1-15, AMS MB 5-18, RKS 18and JS 335 showed high mean performance with regressioncoefficient near to unity and thus categorised as most widelyadaptable, while NRC II R1 and NRC 2006 G-1-1 werefound suitable for poor environments.
The seed yield/ha ranged from 13.75 q/ha (NRC 20072-19) to 33.13 q/ha (AMS 243) with a mean yield of 23.01over seasons. AMS MB 5-19 with high per se performanceand a significant regression value of more than unity wassuitable for favourable environments, while genotypes AMS243, NRC 2008 B-26 and DSB 20, with high meanperformance were widely adaptable.
This study clearly showed the presence of GxEinteractions among the genotypes under study for seed yieldand its component characters. The genotype AMS 243 andDSB 20 with desirable traits and stability across theenvironments for seed yield and its component charactersand could be used as parents in future breeding programmesto develop genotypes suitable for diverse environments.
Table 1 Analysis of variance for stability for seed yield and component characters in soybean
Source DfDays to 50%
floweringPlant height
Branches/plant
Clusters/plant
Pods/plant
100 seedweight
Seed yield(q/ha)
Genotyes 23 3.67 119.71** 3.25** 67.98** 1041.01** 2.32 90.95**
Environment. 2 758.95** 353.82** 156.75** 202.99** 2407.78** 10.77** 529.51**
Gen.X Env. 46 4.18** 19.37 1.03* 14.53** 169.11** 1.41* 38.92**
Env + ( Gen. X Env) 48 35.63** 33.30 7.52 22.38 262.37 1.80 59.36
Env (lin) 1 1217.96** 707.63** 313.50** 405.98** 4814.95** 21.55 1059.02**
Gen. X Env.(Lin) 23 4.78 38.74 -5.63 10.08 -18.47 2.28 -14.34
Pooled Deviation 24 3.43** 27.37 7.38** 18.18** 341.83** 5.51** 88.34**
Pooled Error 69 1.10 40.45 0.53 5.79 61.80 0.78 9.14
Table 2 Weather parameters during the study
Average temperature (°C) Total rainfall (mm) Average RH (%)
Months 2014 2015 2016 2014 2015 2016 2014 2015 2016
June 32.03 32.01 31.11 194.3 46.5 147 85.24 85.08 83.25
July 29.01 27.7 32.26 380 101 42 90.62 90.6 83.53
August 28.54 29.83 29.89 145 145.7 138 88.03 92.72 86.12
September 28.66 28.93 30.41 84 40.6 46.3 87 86.8 84.35
J. Oilseeds Res., 36(4) : 217-219, Dec., 2019 218
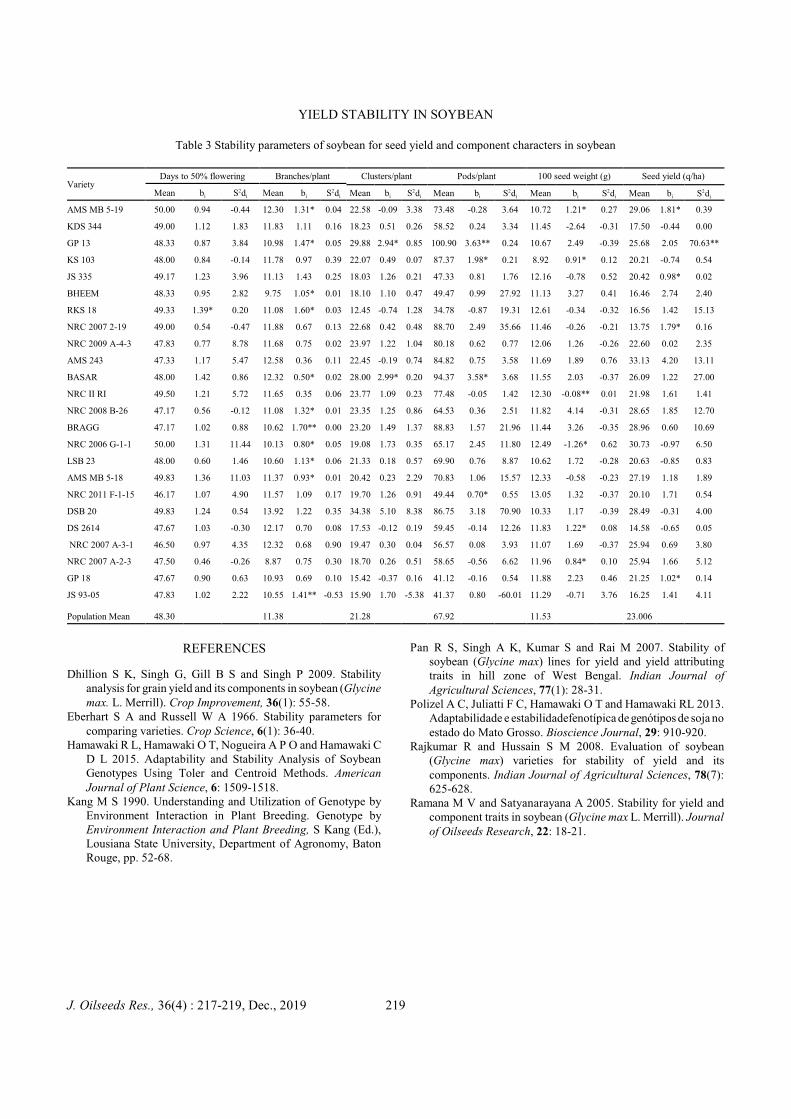
YIELD STABILITY IN SOYBEAN
Table 3 Stability parameters of soybean for seed yield and component characters in soybean
VarietyDays to 50% flowering Branches/plant Clusters/plant Pods/plant 100 seed weight (g) Seed yield (q/ha)
Mean bi S2di Mean bi S2di Mean bi S2di Mean bi S2di Mean bi S2di Mean bi S2di
AMS MB 5-19 50.00 0.94 -0.44 12.30 1.31* 0.04 22.58 -0.09 3.38 73.48 -0.28 3.64 10.72 1.21* 0.27 29.06 1.81* 0.39
KDS 344 49.00 1.12 1.83 11.83 1.11 0.16 18.23 0.51 0.26 58.52 0.24 3.34 11.45 -2.64 -0.31 17.50 -0.44 0.00
GP 13 48.33 0.87 3.84 10.98 1.47* 0.05 29.88 2.94* 0.85 100.90 3.63** 0.24 10.67 2.49 -0.39 25.68 2.05 70.63**
KS 103 48.00 0.84 -0.14 11.78 0.97 0.39 22.07 0.49 0.07 87.37 1.98* 0.21 8.92 0.91* 0.12 20.21 -0.74 0.54
JS 335 49.17 1.23 3.96 11.13 1.43 0.25 18.03 1.26 0.21 47.33 0.81 1.76 12.16 -0.78 0.52 20.42 0.98* 0.02
BHEEM 48.33 0.95 2.82 9.75 1.05* 0.01 18.10 1.10 0.47 49.47 0.99 27.92 11.13 3.27 0.41 16.46 2.74 2.40
RKS 18 49.33 1.39* 0.20 11.08 1.60* 0.03 12.45 -0.74 1.28 34.78 -0.87 19.31 12.61 -0.34 -0.32 16.56 1.42 15.13
NRC 2007 2-19 49.00 0.54 -0.47 11.88 0.67 0.13 22.68 0.42 0.48 88.70 2.49 35.66 11.46 -0.26 -0.21 13.75 1.79* 0.16
NRC 2009 A-4-3 47.83 0.77 8.78 11.68 0.75 0.02 23.97 1.22 1.04 80.18 0.62 0.77 12.06 1.26 -0.26 22.60 0.02 2.35
AMS 243 47.33 1.17 5.47 12.58 0.36 0.11 22.45 -0.19 0.74 84.82 0.75 3.58 11.69 1.89 0.76 33.13 4.20 13.11
BASAR 48.00 1.42 0.86 12.32 0.50* 0.02 28.00 2.99* 0.20 94.37 3.58* 3.68 11.55 2.03 -0.37 26.09 1.22 27.00
NRC II RI 49.50 1.21 5.72 11.65 0.35 0.06 23.77 1.09 0.23 77.48 -0.05 1.42 12.30 -0.08** 0.01 21.98 1.61 1.41
NRC 2008 B-26 47.17 0.56 -0.12 11.08 1.32* 0.01 23.35 1.25 0.86 64.53 0.36 2.51 11.82 4.14 -0.31 28.65 1.85 12.70
BRAGG 47.17 1.02 0.88 10.62 1.70** 0.00 23.20 1.49 1.37 88.83 1.57 21.96 11.44 3.26 -0.35 28.96 0.60 10.69
NRC 2006 G-1-1 50.00 1.31 11.44 10.13 0.80* 0.05 19.08 1.73 0.35 65.17 2.45 11.80 12.49 -1.26* 0.62 30.73 -0.97 6.50
LSB 23 48.00 0.60 1.46 10.60 1.13* 0.06 21.33 0.18 0.57 69.90 0.76 8.87 10.62 1.72 -0.28 20.63 -0.85 0.83
AMS MB 5-18 49.83 1.36 11.03 11.37 0.93* 0.01 20.42 0.23 2.29 70.83 1.06 15.57 12.33 -0.58 -0.23 27.19 1.18 1.89
NRC 2011 F-1-15 46.17 1.07 4.90 11.57 1.09 0.17 19.70 1.26 0.91 49.44 0.70* 0.55 13.05 1.32 -0.37 20.10 1.71 0.54
DSB 20 49.83 1.24 0.54 13.92 1.22 0.35 34.38 5.10 8.38 86.75 3.18 70.90 10.33 1.17 -0.39 28.49 -0.31 4.00
DS 2614 47.67 1.03 -0.30 12.17 0.70 0.08 17.53 -0.12 0.19 59.45 -0.14 12.26 11.83 1.22* 0.08 14.58 -0.65 0.05
NRC 2007 A-3-1 46.50 0.97 4.35 12.32 0.68 0.90 19.47 0.30 0.04 56.57 0.08 3.93 11.07 1.69 -0.37 25.94 0.69 3.80
NRC 2007 A-2-3 47.50 0.46 -0.26 8.87 0.75 0.30 18.70 0.26 0.51 58.65 -0.56 6.62 11.96 0.84* 0.10 25.94 1.66 5.12
GP 18 47.67 0.90 0.63 10.93 0.69 0.10 15.42 -0.37 0.16 41.12 -0.16 0.54 11.88 2.23 0.46 21.25 1.02* 0.14
JS 93-05 47.83 1.02 2.22 10.55 1.41** -0.53 15.90 1.70 -5.38 41.37 0.80 -60.01 11.29 -0.71 3.76 16.25 1.41 4.11
Population Mean 48.30 11.38 21.28 67.92 11.53 23.006
REFERENCES
Dhillion S K, Singh G, Gill B S and Singh P 2009. Stabilityanalysis for grain yield and its components in soybean (Glycinemax. L. Merrill). Crop Improvement, 36(1): 55-58.
Eberhart S A and Russell W A 1966. Stability parameters forcomparing varieties. Crop Science, 6(1): 36-40.
Hamawaki R L, Hamawaki O T, Nogueira A P O and Hamawaki CD L 2015. Adaptability and Stability Analysis of SoybeanGenotypes Using Toler and Centroid Methods. AmericanJournal of Plant Science, 6: 1509-1518.
Kang M S 1990. Understanding and Utilization of Genotype byEnvironment Interaction in Plant Breeding. Genotype byEnvironment Interaction and Plant Breeding, S Kang (Ed.),Lousiana State University, Department of Agronomy, BatonRouge, pp. 52-68.
Pan R S, Singh A K, Kumar S and Rai M 2007. Stability ofsoybean (Glycine max) lines for yield and yield attributingtraits in hill zone of West Bengal. Indian Journal ofAgricultural Sciences, 77(1): 28-31.
Polizel A C, Juliatti F C, Hamawaki O T and Hamawaki RL 2013.Adaptabilidade e estabilidadefenotípica de genótipos de soja noestado do Mato Grosso. Bioscience Journal, 29: 910-920.
Rajkumar R and Hussain S M 2008. Evaluation of soybean(Glycine max) varieties for stability of yield and itscomponents. Indian Journal of Agricultural Sciences, 78(7):625-628.
Ramana M V and Satyanarayana A 2005. Stability for yield andcomponent traits in soybean (Glycine max L. Merrill). Journalof Oilseeds Research, 22: 18-21.
J. Oilseeds Res., 36(4) : 217-219, Dec., 2019 219
Trombay Bidhan Mustard-204 (TBM-204): A high yielding yellow seed coatmustard [Brassica juncea (L.) Czern. & Coss.] variety notified for West Bengal
AMITAVA DUTTA*, SANJAY J JAMBHULKAR1, ARCHANA N RAI1, SHANKAR BHUJBAL1, H BANERJEE, R DAS, S DEWANJEE, S SARKAR, M PRAMANIK AND S MANDAL
Bidhan Chandra Krishi Viswavidyalaya, Mohanpur, Nadia-741 252, West Bengal
(Received: October 31, 2019; Revised: December 20, 2019; Accepted: December 23, 2019)
ABSTRACT
Trombay Bidhan Mustard-204 (TBM-204) has been notified through Central variety release committee (CVRC)for cultivation in the state of West Bengal [S.O.No. 3220 (E) 5th September, 2019]. The variety recorded asignificant increase of 23% over the national check, Kranti (1213 kg/ha) in initial varietal trial (IVT) under timelysown rainfed conditions of Zone-V during rabi 2016-17. Further, the variety demonstrated a potential average seedyield of 1336 kg/ha compared to national check Kranti (1211 kg/ha), zonal check Pusa Bold (1159 kg/ha) and localcheck B-9 (948 kg/ha) in multi-location yield trial conducted at different agroclimatic zones of West Bengal over4 years. TBM-204 is tolerant to insect pest aphids and diseases like Alternaria blight and white rust under fieldconditions. The variety, TBM-204 with yellow seed coat and high oil content (41%) is also preferred by the farmersbecause it does not lodge or shatter at maturity. The variety with higher seed yield and B:C ratio over B-9 in fielddemonstration is proposed as an alternative to B-9. Molecular marker analysis depicted distinct SSR alleles forTBM-204 compared to Kranti and Pusa Bold.
Keywords: Mustard, TBM-204, Variety, Yellow seed coat
Among the nine oilseed crops grown in India, mustard[Brassica juncea (L.) Czern. & Coss.] is an important edibleoilseed crop next to soybean and groundnut (Hegde, 2009).It is cultivated in 6.3 million hectares with a productivity of1100 kg/ha. The average seed yield of mustard in the worldis 2144 kg/ha while maximum possible seed yield of 3640kg/ha indicating a large gap of 85% over world average and213% over maximum possible yield. Low productivity inmustard is mainly due to cultivation of old varieties underrainfed conditions without following the improvedagronomic practices (Paroda, 2013; Prajapati et al., 2019).
The diverse agro ecological condition of West Bengal isfavourable for growing mustard crop. Rapeseed mustardsolely contributes 53% of the total oilseed production with aproductivity of 909 kg/ha in the state (Dutta, 2014) which isfar below the potential yield. The major constraints inproduction are late sowing due to late harvesting of kharif(aman) paddy, inadequate moisture at sowing time, particularly in rice-fallow lands, flood affected areasleading to delayed land preparation and formation of heaviersoils and major biotic stresses viz., mustard aphid, Alternariablight, white rust and club root. Although there are severalfactors for poor yield, one of the main factors is the use ofvery old varieties in large areas of the state. The variety B-9is popular in West Bengal but since it is cultivated for thelast 35 years, the productivity is often low due to highincidence of pest and diseases. Since development of highyielding varieties of Indian mustard is foremost to enhanceproductivity (Meena et al., 2014), evaluation of Trombaymustard high yielding genotypes was carried out undercollaboration of Bhabha Atomic Research Centre, Mumbaiand Bidhan Chandra Krishi Viswavidyalaya, West Bengal.
Based on the superior performance in multi-location yieldtrials during the year 2013-14, to 2016-17 in sixteenlocations, TBM-204 has been released and notified forcultivation in the state of West Bengal.
MATERIALS AND METHODS
Development and evaluation of TBM-204: TBM-204 wasdeveloped through pedigree method of breeding by crossingTM102 and TM28. The female parent TM102 is arecombinant developed through interspecific cross betweenB. juncea and B. napus characterized with waxy leaves andbold glossy seeds. The male parent TM28 is yellow and boldseeded mutant of B. juncea with long main fruiting axis and95 days to maturity. Hybridization between these two parentswas attempted at Bhabha Atomic Research Centre, Trombay,Mumbai with the objective of development of high yielding,early maturing and high oil content progenies. Selection inF2 and subsequent generations resulted in the development ofearly maturing, high yielding genotype TM 204 of yellowseed coat. Based on performance of station trial at BhabhaAtomic Research Centre, Trombay, Mumbai, it wasevaluated under coordinated trial (Zone V) and alsosimultaneously in six locations of West Bengal namelyKalyani, Shekhampur, Kakdwip, Burdwan, Raghunathpurand Jhargram during the period 2013-14 to 2016-17 indifferent agro climatic zones.
Genotyping of TBM-204 along with Pusa Bold andKranti: DNA from TBM-204 along with Pusa Bold andKranti was isolated from leaf tissue using CTAB method(Doyle and Doyle, 1990). One hundred and twenty (120)
J. Oilseeds Res., 36(4) : 220-224, Dec., 2019 220
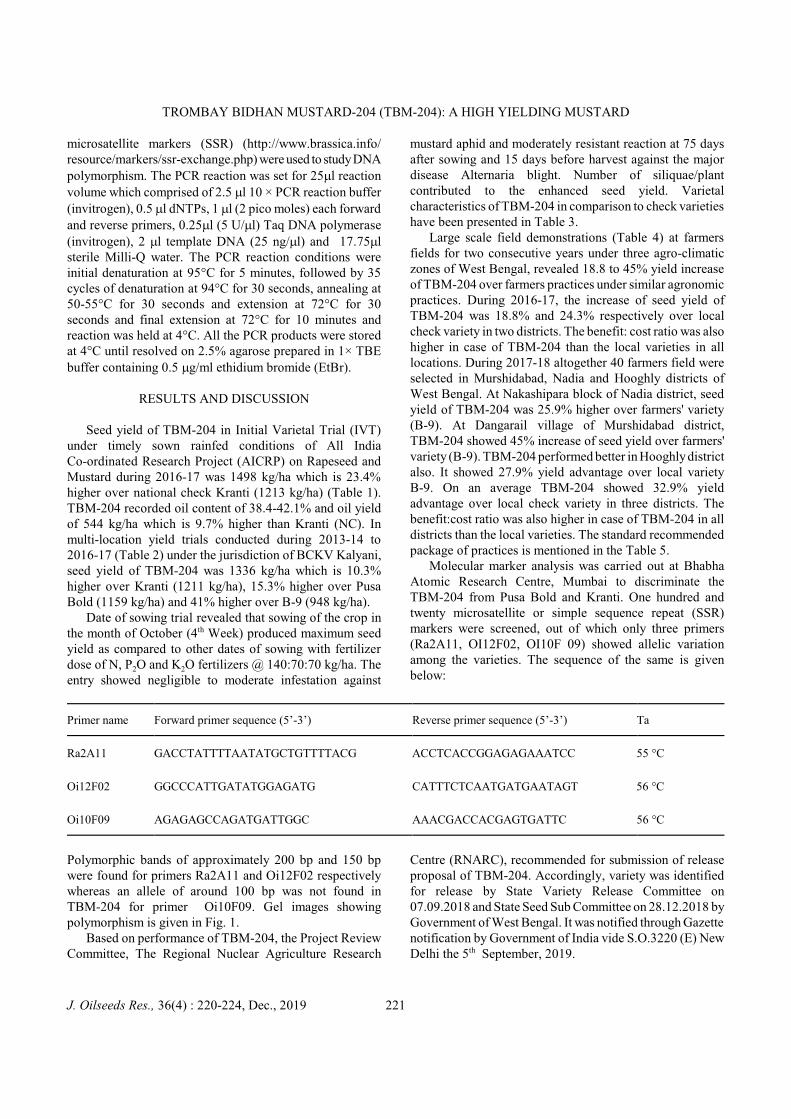
TROMBAY BIDHAN MUSTARD-204 (TBM-204): A HIGH YIELDING MUSTARD
microsatellite markers (SSR) (http://www.brassica.info/resource/markers/ssr-exchange.php) were used to study DNApolymorphism. The PCR reaction was set for 25ml reactionvolume which comprised of 2.5 ml 10 × PCR reaction buffer(invitrogen), 0.5 ml dNTPs, 1 ml (2 pico moles) each forwardand reverse primers, 0.25ml (5 U/ml) Taq DNA polymerase(invitrogen), 2 ml template DNA (25 ng/ml) and 17.75mlsterile Milli-Q water. The PCR reaction conditions wereinitial denaturation at 95°C for 5 minutes, followed by 35cycles of denaturation at 94°C for 30 seconds, annealing at50-55°C for 30 seconds and extension at 72°C for 30seconds and final extension at 72°C for 10 minutes andreaction was held at 4°C. All the PCR products were storedat 4°C until resolved on 2.5% agarose prepared in 1× TBEbuffer containing 0.5 mg/ml ethidium bromide (EtBr).
RESULTS AND DISCUSSION
Seed yield of TBM-204 in Initial Varietal Trial (IVT)under timely sown rainfed conditions of All IndiaCo-ordinated Research Project (AICRP) on Rapeseed andMustard during 2016-17 was 1498 kg/ha which is 23.4%higher over national check Kranti (1213 kg/ha) (Table 1).TBM-204 recorded oil content of 38.4-42.1% and oil yieldof 544 kg/ha which is 9.7% higher than Kranti (NC). Inmulti-location yield trials conducted during 2013-14 to2016-17 (Table 2) under the jurisdiction of BCKV Kalyani,seed yield of TBM-204 was 1336 kg/ha which is 10.3%higher over Kranti (1211 kg/ha), 15.3% higher over PusaBold (1159 kg/ha) and 41% higher over B-9 (948 kg/ha).
Date of sowing trial revealed that sowing of the crop inthe month of October (4th Week) produced maximum seedyield as compared to other dates of sowing with fertilizerdose of N, P2O and K2O fertilizers @ 140:70:70 kg/ha. Theentry showed negligible to moderate infestation against
mustard aphid and moderately resistant reaction at 75 daysafter sowing and 15 days before harvest against the majordisease Alternaria blight. Number of siliquae/plantcontributed to the enhanced seed yield. Varietalcharacteristics of TBM-204 in comparison to check varietieshave been presented in Table 3.
Large scale field demonstrations (Table 4) at farmersfields for two consecutive years under three agro-climaticzones of West Bengal, revealed 18.8 to 45% yield increaseof TBM-204 over farmers practices under similar agronomicpractices. During 2016-17, the increase of seed yield ofTBM-204 was 18.8% and 24.3% respectively over localcheck variety in two districts. The benefit: cost ratio was alsohigher in case of TBM-204 than the local varieties in alllocations. During 2017-18 altogether 40 farmers field wereselected in Murshidabad, Nadia and Hooghly districts ofWest Bengal. At Nakashipara block of Nadia district, seedyield of TBM-204 was 25.9% higher over farmers' variety(B-9). At Dangarail village of Murshidabad district,TBM-204 showed 45% increase of seed yield over farmers'variety (B-9). TBM-204 performed better in Hooghly districtalso. It showed 27.9% yield advantage over local varietyB-9. On an average TBM-204 showed 32.9% yieldadvantage over local check variety in three districts. Thebenefit:cost ratio was also higher in case of TBM-204 in alldistricts than the local varieties. The standard recommendedpackage of practices is mentioned in the Table 5.
Molecular marker analysis was carried out at BhabhaAtomic Research Centre, Mumbai to discriminate theTBM-204 from Pusa Bold and Kranti. One hundred andtwenty microsatellite or simple sequence repeat (SSR)markers were screened, out of which only three primers(Ra2A11, OI12F02, OI10F 09) showed allelic variationamong the varieties. The sequence of the same is givenbelow:
Primer name Forward primer sequence (5’-3’) Reverse primer sequence (5’-3’) Ta
Ra2A11 GACCTATTTTAATATGCTGTTTTACG ACCTCACCGGAGAGAAATCC 55 °C
Oi12F02 GGCCCATTGATATGGAGATG CATTTCTCAATGATGAATAGT 56 °C
Oi10F09 AGAGAGCCAGATGATTGGC AAACGACCACGAGTGATTC 56 °C
Polymorphic bands of approximately 200 bp and 150 bpwere found for primers Ra2A11 and Oi12F02 respectivelywhereas an allele of around 100 bp was not found inTBM-204 for primer Oi10F09. Gel images showingpolymorphism is given in Fig. 1.
Based on performance of TBM-204, the Project ReviewCommittee, The Regional Nuclear Agriculture Research
Centre (RNARC), recommended for submission of releaseproposal of TBM-204. Accordingly, variety was identifiedfor release by State Variety Release Committee on07.09.2018 and State Seed Sub Committee on 28.12.2018 byGovernment of West Bengal. It was notified through Gazettenotification by Government of India vide S.O.3220 (E) NewDelhi the 5th September, 2019.
J. Oilseeds Res., 36(4) : 220-224, Dec., 2019 221
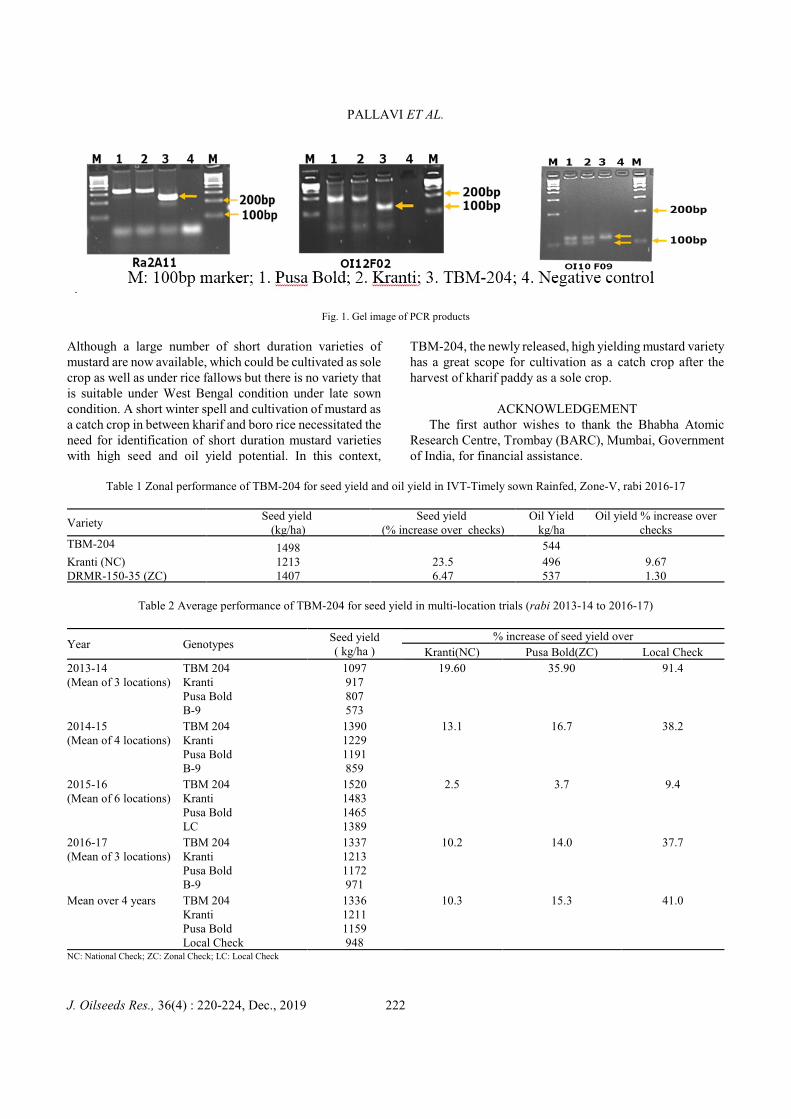
PALLAVI ET AL.
Fig. 1. Gel image of PCR products
Although a large number of short duration varieties ofmustard are now available, which could be cultivated as solecrop as well as under rice fallows but there is no variety thatis suitable under West Bengal condition under late sowncondition. A short winter spell and cultivation of mustard asa catch crop in between kharif and boro rice necessitated theneed for identification of short duration mustard varietieswith high seed and oil yield potential. In this context,
TBM-204, the newly released, high yielding mustard varietyhas a great scope for cultivation as a catch crop after theharvest of kharif paddy as a sole crop.
ACKNOWLEDGEMENTThe first author wishes to thank the Bhabha Atomic
Research Centre, Trombay (BARC), Mumbai, Governmentof India, for financial assistance.
Table 1 Zonal performance of TBM-204 for seed yield and oil yield in IVT-Timely sown Rainfed, Zone-V, rabi 2016-17
VarietySeed yield
(kg/ha)Seed yield
(% increase over checks)Oil Yield
kg/haOil yield % increase over
checksTBM-204 1498 544
Kranti (NC) 1213 23.5 496 9.67DRMR-150-35 (ZC) 1407 6.47 537 1.30
Table 2 Average performance of TBM-204 for seed yield in multi-location trials (rabi 2013-14 to 2016-17)
Year GenotypesSeed yield( kg/ha )
% increase of seed yield over
Kranti(NC) Pusa Bold(ZC) Local Check
2013-14 (Mean of 3 locations)
TBM 204 Kranti Pusa Bold B-9
1097917807573
19.60 35.90 91.4
2014-15 (Mean of 4 locations)
TBM 204 Kranti Pusa BoldB-9
139012291191859
13.1 16.7 38.2
2015-16 (Mean of 6 locations)
TBM 204 Kranti Pusa Bold LC
1520148314651389
2.5 3.7 9.4
2016-17 (Mean of 3 locations)
TBM 204 Kranti Pusa Bold B-9
133712131172971
10.2 14.0 37.7
Mean over 4 years TBM 204 Kranti Pusa BoldLocal Check
133612111159948
10.3 15.3 41.0
NC: National Check; ZC: Zonal Check; LC: Local Check
J. Oilseeds Res., 36(4) : 220-224, Dec., 2019 222
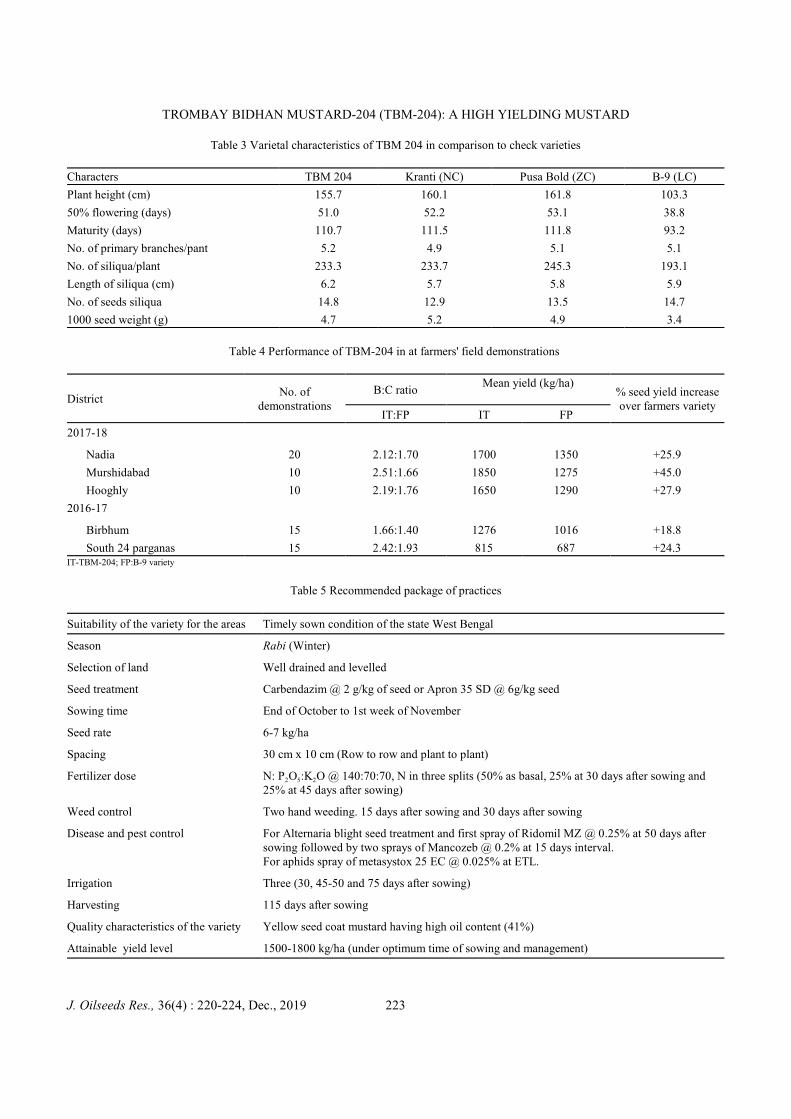
TROMBAY BIDHAN MUSTARD-204 (TBM-204): A HIGH YIELDING MUSTARD
Table 3 Varietal characteristics of TBM 204 in comparison to check varieties
Characters TBM 204 Kranti (NC) Pusa Bold (ZC) B-9 (LC)
Plant height (cm) 155.7 160.1 161.8 103.3
50% flowering (days) 51.0 52.2 53.1 38.8
Maturity (days) 110.7 111.5 111.8 93.2
No. of primary branches/pant 5.2 4.9 5.1 5.1
No. of siliqua/plant 233.3 233.7 245.3 193.1
Length of siliqua (cm) 6.2 5.7 5.8 5.9
No. of seeds siliqua 14.8 12.9 13.5 14.7
1000 seed weight (g) 4.7 5.2 4.9 3.4
Table 4 Performance of TBM-204 in at farmers' field demonstrations
DistrictNo. of
demonstrations
B:C ratioMean yield (kg/ha)
% seed yield increaseover farmers variety
IT:FP IT FP
2017-18
Nadia 20 2.12:1.70 1700 1350 +25.9
Murshidabad 10 2.51:1.66 1850 1275 +45.0
Hooghly 10 2.19:1.76 1650 1290 +27.9
2016-17
Birbhum 15 1.66:1.40 1276 1016 +18.8
South 24 parganas 15 2.42:1.93 815 687 +24.3IT-TBM-204; FP:B-9 variety
Table 5 Recommended package of practices
Suitability of the variety for the areas Timely sown condition of the state West Bengal
Season Rabi (Winter)
Selection of land Well drained and levelled
Seed treatment Carbendazim @ 2 g/kg of seed or Apron 35 SD @ 6g/kg seed
Sowing time End of October to 1st week of November
Seed rate 6-7 kg/ha
Spacing 30 cm x 10 cm (Row to row and plant to plant)
Fertilizer dose N: P2O5:K2O @ 140:70:70, N in three splits (50% as basal, 25% at 30 days after sowing and25% at 45 days after sowing)
Weed control Two hand weeding. 15 days after sowing and 30 days after sowing
Disease and pest control For Alternaria blight seed treatment and first spray of Ridomil MZ @ 0.25% at 50 days aftersowing followed by two sprays of Mancozeb @ 0.2% at 15 days interval. For aphids spray of metasystox 25 EC @ 0.025% at ETL.
Irrigation Three (30, 45-50 and 75 days after sowing)
Harvesting 115 days after sowing
Quality characteristics of the variety Yellow seed coat mustard having high oil content (41%)
Attainable yield level 1500-1800 kg/ha (under optimum time of sowing and management)
J. Oilseeds Res., 36(4) : 220-224, Dec., 2019 223

PALLAVI ET AL.
REFERENCES
Dutta A 2014. Impact of improvised production technology forrapeseed-mustard in West Bengal. Journal of Crop and Weed,10(2): 272-276.
Doyle J J and Doyle J L 1990. Isolation of plant DNA from freshtissue. Focus, 12: 13-15.
Hegde D M 2009. Frontline Demonstrations in Oilseeds:Achievements and Impact (2002-03 to 2006-07). Directorate ofOilseeds Research (ICAR), Rajendranagar, Hyderabad, India.
Meena C P, Chauhan J S, Singh M, Singh K H, Rathore S S andMeena M L 2014. Genetic parameters and correlations for seed
yield and morphological characters in Indian mustard [Brassicajuncea (L) Czern. & Coss.]. Journal of Oilseeds Research,31(2): 114-117.
Paroda R S 2013. The Indian Oilseeds Scenario: Challenges andopportunities. Journal of Oilseeds Research, 30(2): 111-126.
Prajapati K P, Patel P J, Patel J R, Patel B K, Shah S K, Jat A L,Gangwar G P and Desai A G 2019. GDM-5: Region specifichigh yielding and high oil content variety of Indian mustard(Brassica juncea L. Czern & Coss) suitable for rainfedecosystem. Journal of Oilseeds Research, 36(2): 79-84.
J. Oilseeds Res., 36(4) : 220-224, Dec., 2019 224
Effect of different phosphorus management practices on growth, yield andeconomics of summer groundnut (Arachis hypogaea L.)
RAGHAVENDRA NAGAR1, RAM A JAT2,3*, R K MATHUKIA1, R R CHOUDHARY2 AND KIRAN K REDDY2
1College of Agriculture, Junagadh Agricultural University, Junagadh-362 001, Gujarat
(Received: October 31, 2019; Revised: December 16, 2019; Accepted: December 19, 2019)
ABSTRACT
A field experiment was conducted during summer, 2018 at Junagadh Agricultural University, Junagadh, Gujarat,to study effect of improved microbial cultures on P nutrients, growth and yield of summer groundnut using improvedmicrobial cultures. The experiment was laid out in randomized block design with ten treatments, replicated thrice.The results revealed that application of 100 % RDP + FYM @ 5 t/ha was found significantly superior over rest ofthe treatments with respect to growth, yield and nutrient uptake. Treatments comprising microbial cultures viz., 100%RDP + DGRC 1 and 100% RDP + DGRC 2 produced significantly higher number of pegs/plant, number and weightof mature pods/plant, pod and haulm yield over 100% RDP. Maximum gross returns ( 1,12,251/ha) were obtainedwith the application of 100% RDP + FYM @5 t/ha compared to rest of the treatments while highest net returns(`56,058/ha) and benefit-cost ratio (2.3) was gained with 100% RDP + DGRC 1.
Keywords: DGRC, FYM, Groundnut, Phosphorus, PSB
Groundnut is third most important oilseed crop in India,however, the productivity of groundnut in India is quite low(1465 kg/ha) as compared to other countries like USA andChina. Gujarat has wide variability in groundnut productivitydepending upon cropping season, soil types and cropmanagement practices. The importance of phosphorus inmaintenance of soil fertility and improving groundnutproductivity is well recognized (Taliman et al., 2019).Phosphorus exists in soil as both organic and inorganic form.Despite abundant phosphorus amount in soils, more than80% of soluble P in soil remains unavailable for plant uptakedue to fixation and low solubility in soil (Gulati et al.,2008). Also, soluble forms of P fertilizers applied to the soilare easily precipitated (Haque and Dave, 2005). Sundara etal. (2002) reported that the recovery rate of P fertilizers byplants is only about 25%. The remaining 75% gets fixed insoil in immobile form bound to Al/Fe in acid soils andCa/Mg in alkaline soils (Prochnow et al., 2006; Yang et al.,2010).
FYM has profound effect on improving soil physical,chemical and biological properties and enhancingproductivity of crops (Rao and Shakawat, 2002). Thus, FYMplays key role in transformation, recycling and availability ofP to the crop plants. Nowadays, chemical fertilizers arefrequently being applied to the agriculture fields to meet theP requirement of crops and thus huge quantity of P gets fixedin soil just after application. Microorganisms play animportant role in improving phosphorus use efficiency byenhancing P solubility and reducing fixation in the soil.Phosphate solubilizing bacteria (PSB) can solubilize andmineralize P from insoluble inorganic and organic sourcesthrough different mechanisms (Dey and Pal, 2014; Kamala------------------------------------------------------------------------- 2ICAR-Directorate of Groundnut Research, Junagadh-362 001, Gujarat; 3ICAR- IndianInstitute of Soil and Water Conservation, Research Center, Vasad-388 306, Gujarat;*Corresponding author's E-mail: [email protected]
et al., 2019). In the soil, different bacterial species are ableto exercise beneficial effects, by different mechanisms, onplant growth and have been termed as plant growthpromoting Rhizobia (PGPR). DGRCs are the consortiamicrobial cultures containing PGPR, PSB, and Rhizobium.This study was carried out with the objectives of evaluatingthe effect of FYM and DGRCs on improving yield, profits,and phosphorus uptake in summer groundnut in light blackcalcareous soil.
MATERIALS AND METHODS
A field experiment was conducted in summer 2018 atResearch Farm, Department of Agronomy, College ofAgriculture, Junagadh Agricultural University, Junagadh(21.5° N and 70.5° E) on clayey (54% clay) slightly alkalinesoil (pH 7.8 and electrical conductivity 0.33 dS/m), low inavailable nitrogen (237.0 kg/ha) and sulphur (17.5 kg/ha),medium in available phosphorus (21.5 kg/ha) and high inavailable potassium (284.0 kg/ha). The DTPA extractablemicronutrients viz., Fe, Mn and Zn and available B were5.35, 4.80, 0.78 and 0.66 ppm, respectively.
The experiment comprised of ten treatments i.e. T1(Absolute Control), T2 (100% of recommended dose ofphosphorus i.e., 50 kg/ha P2O5), T3 (DGRC 1), T4 (DGRC2), T5 (100% RDP + DGRC 1), T6 (100% RDP + DGRC 2),T7 (50 % RDP + DGRC 1), T8 (50 % RDP + DGRC 2), T9(PSB), and T10 (100 % RDP + FYM @ 5 t/ha), and laid outin randomized block design (RBD) with three replications.DGRC 1 and DGRC 2 are the consortia cultures consistingof two species of Rhizobium and a PGPR (DGRC 1=(NRCG 4 + TAL 1000) + (Pseudomonas gessardii BHU 1);DGRC 2 = (NRCG 4 + TAL 1000) + Pseudomonas putidaS1) and PSB (Bacillus polymyxa N5). Recommended doseof nitrogen and potassium (25 kg/ha N and 50 kg/ha K2O)
J. Oilseeds Res., 36(4) : 225-228, Dec., 2019 225
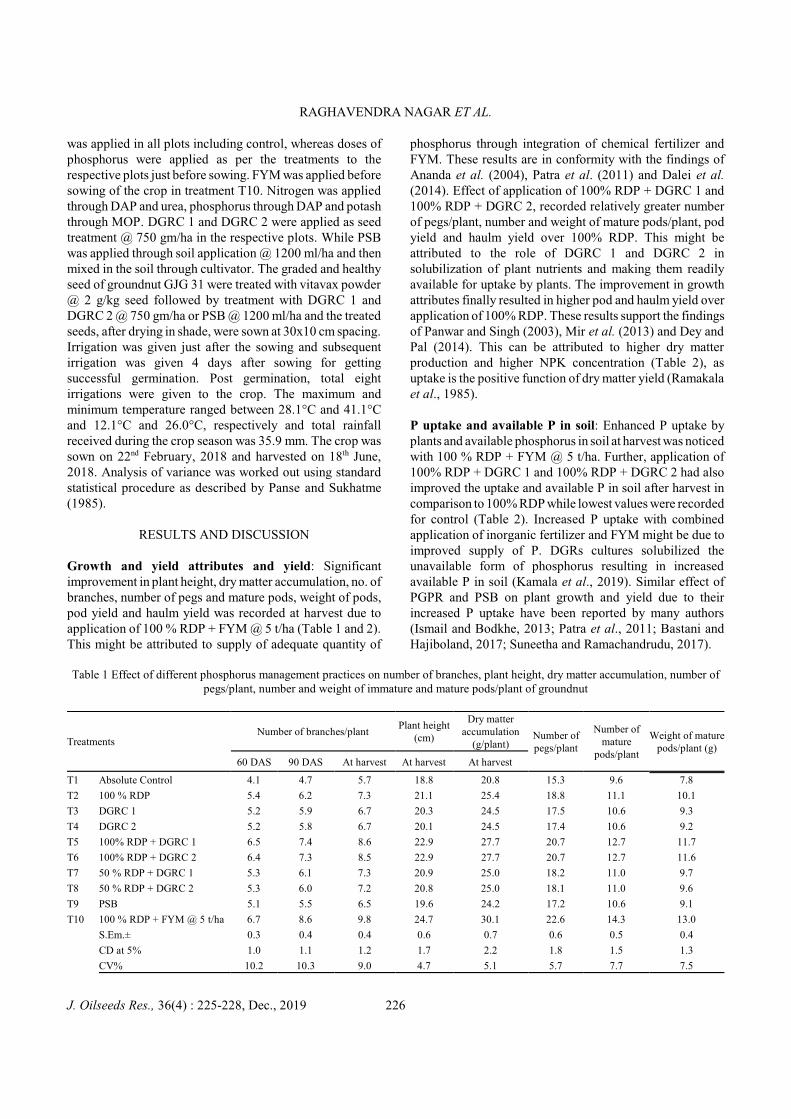
RAGHAVENDRA NAGAR ET AL.
was applied in all plots including control, whereas doses ofphosphorus were applied as per the treatments to therespective plots just before sowing. FYM was applied beforesowing of the crop in treatment T10. Nitrogen was appliedthrough DAP and urea, phosphorus through DAP and potashthrough MOP. DGRC 1 and DGRC 2 were applied as seedtreatment @ 750 gm/ha in the respective plots. While PSBwas applied through soil application @ 1200 ml/ha and thenmixed in the soil through cultivator. The graded and healthyseed of groundnut GJG 31 were treated with vitavax powder@ 2 g/kg seed followed by treatment with DGRC 1 andDGRC 2 @ 750 gm/ha or PSB @ 1200 ml/ha and the treatedseeds, after drying in shade, were sown at 30x10 cm spacing.Irrigation was given just after the sowing and subsequentirrigation was given 4 days after sowing for gettingsuccessful germination. Post germination, total eightirrigations were given to the crop. The maximum andminimum temperature ranged between 28.1°C and 41.1°Cand 12.1°C and 26.0°C, respectively and total rainfallreceived during the crop season was 35.9 mm. The crop wassown on 22nd February, 2018 and harvested on 18th June,2018. Analysis of variance was worked out using standardstatistical procedure as described by Panse and Sukhatme(1985).
RESULTS AND DISCUSSION
Growth and yield attributes and yield: Significantimprovement in plant height, dry matter accumulation, no. ofbranches, number of pegs and mature pods, weight of pods,pod yield and haulm yield was recorded at harvest due toapplication of 100 % RDP + FYM @ 5 t/ha (Table 1 and 2).This might be attributed to supply of adequate quantity of
phosphorus through integration of chemical fertilizer andFYM. These results are in conformity with the findings ofAnanda et al. (2004), Patra et al. (2011) and Dalei et al.(2014). Effect of application of 100% RDP + DGRC 1 and100% RDP + DGRC 2, recorded relatively greater numberof pegs/plant, number and weight of mature pods/plant, podyield and haulm yield over 100% RDP. This might beattributed to the role of DGRC 1 and DGRC 2 insolubilization of plant nutrients and making them readilyavailable for uptake by plants. The improvement in growthattributes finally resulted in higher pod and haulm yield overapplication of 100% RDP. These results support the findingsof Panwar and Singh (2003), Mir et al. (2013) and Dey andPal (2014). This can be attributed to higher dry matterproduction and higher NPK concentration (Table 2), asuptake is the positive function of dry matter yield (Ramakalaet al., 1985).
P uptake and available P in soil: Enhanced P uptake byplants and available phosphorus in soil at harvest was noticedwith 100 % RDP + FYM @ 5 t/ha. Further, application of100% RDP + DGRC 1 and 100% RDP + DGRC 2 had alsoimproved the uptake and available P in soil after harvest incomparison to 100% RDP while lowest values were recordedfor control (Table 2). Increased P uptake with combinedapplication of inorganic fertilizer and FYM might be due toimproved supply of P. DGRs cultures solubilized theunavailable form of phosphorus resulting in increasedavailable P in soil (Kamala et al., 2019). Similar effect ofPGPR and PSB on plant growth and yield due to theirincreased P uptake have been reported by many authors(Ismail and Bodkhe, 2013; Patra et al., 2011; Bastani andHajiboland, 2017; Suneetha and Ramachandrudu, 2017).
Table 1 Effect of different phosphorus management practices on number of branches, plant height, dry matter accumulation, number ofpegs/plant, number and weight of immature and mature pods/plant of groundnut
TreatmentsNumber of branches/plant
Plant height(cm)
Dry matteraccumulation
(g/plant)Number ofpegs/plant
Number ofmature
pods/plant
Weight of maturepods/plant (g)
60 DAS 90 DAS At harvest At harvest At harvest
T1 Absolute Control 4.1 4.7 5.7 18.8 20.8 15.3 9.6 7.8
T2 100 % RDP 5.4 6.2 7.3 21.1 25.4 18.8 11.1 10.1
T3 DGRC 1 5.2 5.9 6.7 20.3 24.5 17.5 10.6 9.3
T4 DGRC 2 5.2 5.8 6.7 20.1 24.5 17.4 10.6 9.2
T5 100% RDP + DGRC 1 6.5 7.4 8.6 22.9 27.7 20.7 12.7 11.7
T6 100% RDP + DGRC 2 6.4 7.3 8.5 22.9 27.7 20.7 12.7 11.6
T7 50 % RDP + DGRC 1 5.3 6.1 7.3 20.9 25.0 18.2 11.0 9.7
T8 50 % RDP + DGRC 2 5.3 6.0 7.2 20.8 25.0 18.1 11.0 9.6
T9 PSB 5.1 5.5 6.5 19.6 24.2 17.2 10.6 9.1
T10 100 % RDP + FYM @ 5 t/ha 6.7 8.6 9.8 24.7 30.1 22.6 14.3 13.0
S.Em.± 0.3 0.4 0.4 0.6 0.7 0.6 0.5 0.4
CD at 5% 1.0 1.1 1.2 1.7 2.2 1.8 1.5 1.3
CV% 10.2 10.3 9.0 4.7 5.1 5.7 7.7 7.5
J. Oilseeds Res., 36(4) : 225-228, Dec., 2019 226
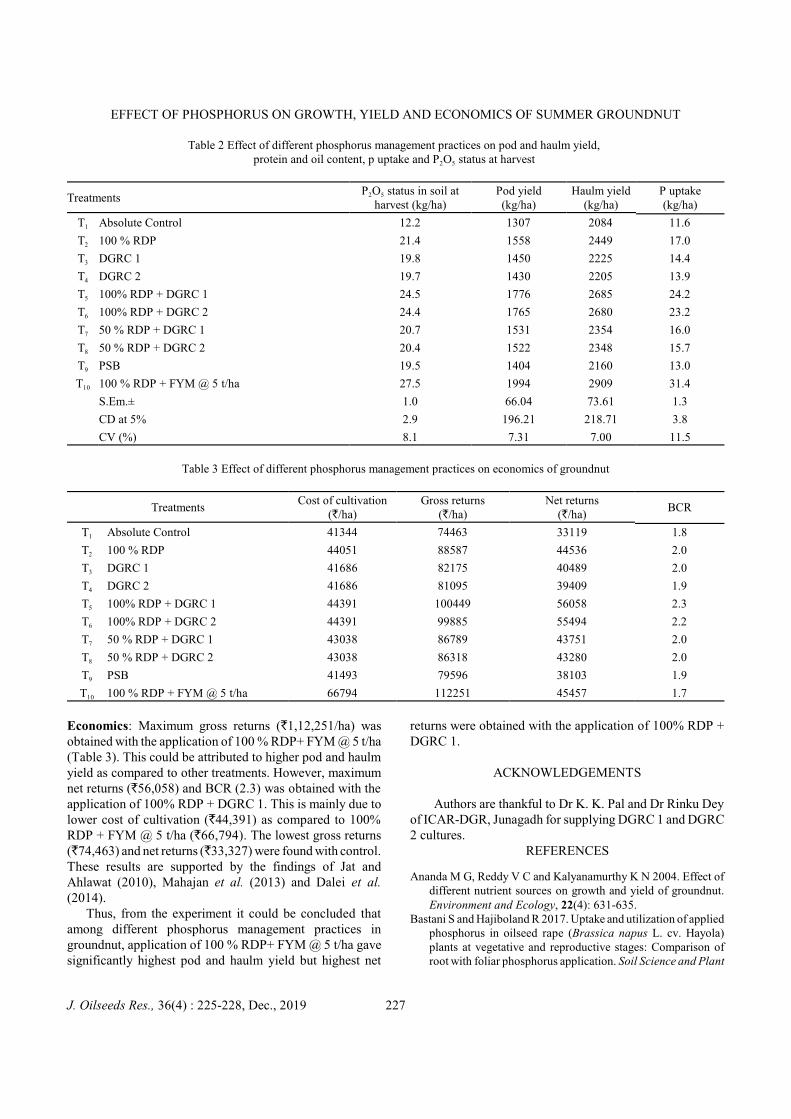
EFFECT OF PHOSPHORUS ON GROWTH, YIELD AND ECONOMICS OF SUMMER GROUNDNUT
Table 2 Effect of different phosphorus management practices on pod and haulm yield, protein and oil content, p uptake and P2O5 status at harvest
TreatmentsP2O5 status in soil at
harvest (kg/ha)Pod yield(kg/ha)
Haulm yield(kg/ha)
P uptake(kg/ha)
T1 Absolute Control 12.2 1307 2084 11.6
T2 100 % RDP 21.4 1558 2449 17.0
T3 DGRC 1 19.8 1450 2225 14.4
T4 DGRC 2 19.7 1430 2205 13.9
T5 100% RDP + DGRC 1 24.5 1776 2685 24.2
T6 100% RDP + DGRC 2 24.4 1765 2680 23.2
T7 50 % RDP + DGRC 1 20.7 1531 2354 16.0
T8 50 % RDP + DGRC 2 20.4 1522 2348 15.7
T9 PSB 19.5 1404 2160 13.0
T10 100 % RDP + FYM @ 5 t/ha 27.5 1994 2909 31.4
S.Em.± 1.0 66.04 73.61 1.3
CD at 5% 2.9 196.21 218.71 3.8
CV (%) 8.1 7.31 7.00 11.5
Table 3 Effect of different phosphorus management practices on economics of groundnut
TreatmentsCost of cultivation
(`/ha)Gross returns
(`/ha)Net returns
(`/ha)BCR
T1 Absolute Control 41344 74463 33119 1.8
T2 100 % RDP 44051 88587 44536 2.0
T3 DGRC 1 41686 82175 40489 2.0
T4 DGRC 2 41686 81095 39409 1.9
T5 100% RDP + DGRC 1 44391 100449 56058 2.3
T6 100% RDP + DGRC 2 44391 99885 55494 2.2
T7 50 % RDP + DGRC 1 43038 86789 43751 2.0
T8 50 % RDP + DGRC 2 43038 86318 43280 2.0
T9 PSB 41493 79596 38103 1.9
T10 100 % RDP + FYM @ 5 t/ha 66794 112251 45457 1.7
Economics: Maximum gross returns (`1,12,251/ha) wasobtained with the application of 100 % RDP+ FYM @ 5 t/ha(Table 3). This could be attributed to higher pod and haulmyield as compared to other treatments. However, maximumnet returns (`56,058) and BCR (2.3) was obtained with theapplication of 100% RDP + DGRC 1. This is mainly due tolower cost of cultivation (`44,391) as compared to 100%RDP + FYM @ 5 t/ha (`66,794). The lowest gross returns(`74,463) and net returns (`33,327) were found with control.These results are supported by the findings of Jat andAhlawat (2010), Mahajan et al. (2013) and Dalei et al.(2014).
Thus, from the experiment it could be concluded thatamong different phosphorus management practices ingroundnut, application of 100 % RDP+ FYM @ 5 t/ha gavesignificantly highest pod and haulm yield but highest net
returns were obtained with the application of 100% RDP +DGRC 1.
ACKNOWLEDGEMENTS
Authors are thankful to Dr K. K. Pal and Dr Rinku Deyof ICAR-DGR, Junagadh for supplying DGRC 1 and DGRC2 cultures.
REFERENCES
Ananda M G, Reddy V C and Kalyanamurthy K N 2004. Effect ofdifferent nutrient sources on growth and yield of groundnut.Environment and Ecology, 22(4): 631-635.
Bastani S and Hajiboland R 2017. Uptake and utilization of appliedphosphorus in oilseed rape (Brassica napus L. cv. Hayola)plants at vegetative and reproductive stages: Comparison ofroot with foliar phosphorus application. Soil Science and Plant
J. Oilseeds Res., 36(4) : 225-228, Dec., 2019 227
RAGHAVENDRA NAGAR ET AL.
Nutrition. DOI: 10.1080/00380768.2017.1321471.Dalei B, Panda S, Kheroar S and Deshmukh M 2014. Effect of
integrated nutrient management on growth, yield andeconomics of Niger [Guizotia abyssinica (Lf) Cass.]. Journalof Oilseeds Research, 31(1):46-48
Dey R and Pal K K 2014. Biofertilizers for enhancing groundnutproductivity. ICAR-Directorate of Groundnut Research,Ivnagar Road, PB No. 5, Junagadh, Gujarat, India, 30 pp.
Ismail S and Bodkhe A A 2013. Effect of chemical fertilizers andmicrobial inoculants on nodulation, yield, uptake of nutrientsand quality of soybean [Glycine max (L.) Merrill]. Journal ofOilseeds Research, 30(1): 27-30.
Jat R A and Ahlawat I P S 2010. Effect of organic manure andsulphur fertilization in pigeonpea (Cajanus cajan) + groundnut(Arachis hypogaea L.) intercropping system. Indian Journal ofAgronomy, 55(4): 276-281.
Kamala B S, Ali S M, Keshavareddy G, Nagaraj K, Kulkarni L Rand Ranganatha S 2019. Impact of improved productiontechnology and mechanized decortication of groundnut(Arachis hypogaea L.) on productivity and income of farmersin Ramanagara district of Karnataka. Journal of OilseedsResearch, 36(2): 105-109.
Mahajan H S, Hirve N A, Deshmukh M R 2013. Effect ofintegrated nutrient management on seed yield and economicsof sesame (Sesamum indicum L.) in assured rainfall zone ofNorth Maharashtra. Journal of Oilseeds Research, 30(2):147-9.
Mir A H, Lal S B, Salmani M, Abid M and Khan I 2013. Growth,yield and nutrient content of Blackgram as influenced by levelsof phosphorus, sulphur and phosphorus solubilizing bacteria.SAARC Journal of Agriculture, 11(1): 1-6.
Panse V G and Sukhatme P V 1985. Statistical Methods forAgricultural Workers. Indian Council of Agricultural Research,New Delhi. pp. 361.
Panwar A S and Singh N P 2003. Effect of conjunctive use ofphosphorus and bio - organics on growth and yield ofgroundnut (Arachis hypogaea L.). Indian Journal ofAgronomy, 48: 214-216.
Patra P S, Sinha A C and Mahesh S S 2011. Yield, nutrient uptakeand quality of groundnut kernels as affected by organic sourcesof nutrient. Indian Journal of Agronomy, 56 (3):237-241.
Prochnow L I, Fernando J, Quispe S, Artur E, Francisco B andBraga G 2006. Effectiveness of phosphate fertilizers ofdifferent water solubilities in relation to soil phosphorusadsorption. Scientific Agriculture (Piracicaba Braz.), 63:333-340.
Rao S S and Shektawat M S 2002. Effect of organic manure,phosphorus and gypsum on groundnut production underrainfed conditions. Indian Journal of Agronomy, 47: 234-241.
Reddy S, Seshadri S B and Reddy V C 2004. Nutrient uptake andagronomic efficiency of groundnut as influenced by differentorganic manures. Karnataka Journal of Agriculture Science,17(4): 670-675.
Suneetha V and Ramachandrudu K 2017. Influence of integrateduse of microbial inoculants and inorganic fertilizers on growthand nutrient dynamics of oil palm seedlings. Journal ofOilseeds Research, 34(4): 226-234.
Taliman N A, Dong Q, Echigo K, Raboy V and Saneoka H 2019.Effect of phosphorus fertilization on the growth,photosynthesis, nitrogen fixation, mineral accumulation, seedyield, and seed quality of a soybean low-phytate line. Plant,DOI:10.3390/plants8050119.
Yang M, Ding G, Shi L, Xu F, Meng J 2010. Detection of QTL forphosphorus efficiency at vegetative stage in Brassica napus.Plant and Soil, 339: 97-111.
J. Oilseeds Res., 36(4) : 225-228, Dec., 2019 228
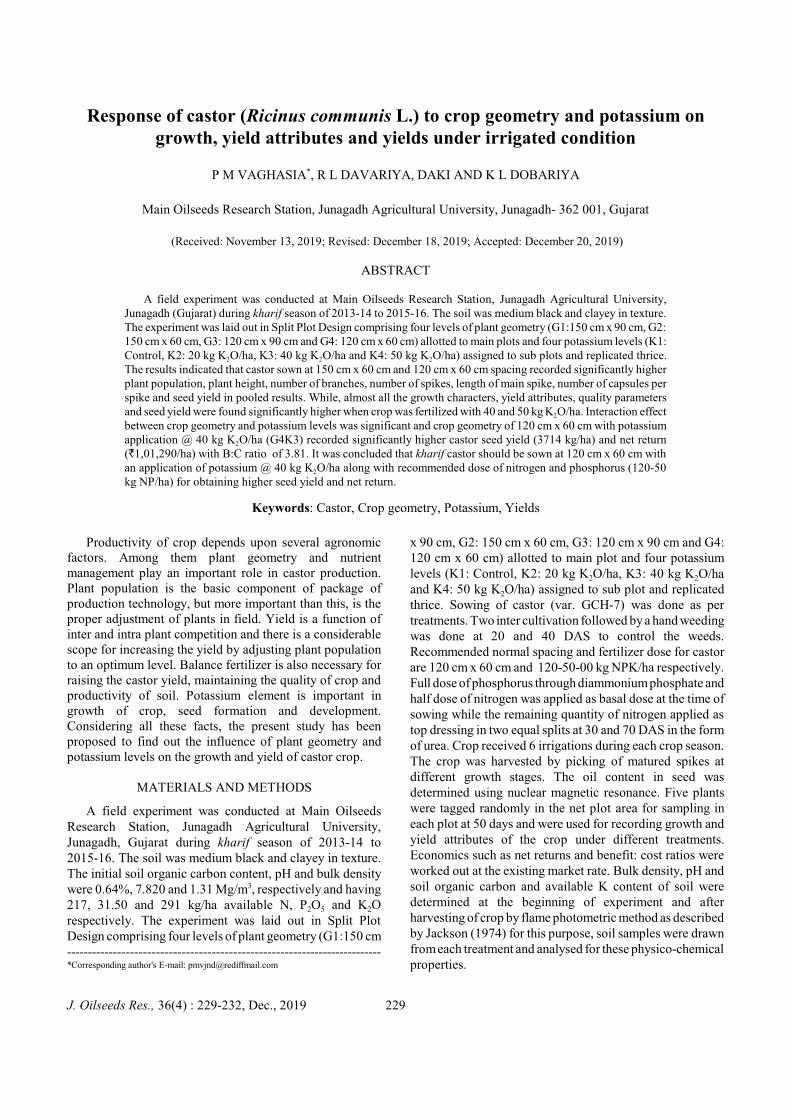
Response of castor (Ricinus communis L.) to crop geometry and potassium ongrowth, yield attributes and yields under irrigated condition
P M VAGHASIA*, R L DAVARIYA, DAKI AND K L DOBARIYA
Main Oilseeds Research Station, Junagadh Agricultural University, Junagadh- 362 001, Gujarat
(Received: November 13, 2019; Revised: December 18, 2019; Accepted: December 20, 2019)
ABSTRACT
A field experiment was conducted at Main Oilseeds Research Station, Junagadh Agricultural University,Junagadh (Gujarat) during kharif season of 2013-14 to 2015-16. The soil was medium black and clayey in texture.The experiment was laid out in Split Plot Design comprising four levels of plant geometry (G1:150 cm x 90 cm, G2:150 cm x 60 cm, G3: 120 cm x 90 cm and G4: 120 cm x 60 cm) allotted to main plots and four potassium levels (K1:Control, K2: 20 kg K2O/ha, K3: 40 kg K2O/ha and K4: 50 kg K2O/ha) assigned to sub plots and replicated thrice.The results indicated that castor sown at 150 cm x 60 cm and 120 cm x 60 cm spacing recorded significantly higherplant population, plant height, number of branches, number of spikes, length of main spike, number of capsules perspike and seed yield in pooled results. While, almost all the growth characters, yield attributes, quality parametersand seed yield were found significantly higher when crop was fertilized with 40 and 50 kg K2O/ha. Interaction effectbetween crop geometry and potassium levels was significant and crop geometry of 120 cm x 60 cm with potassiumapplication @ 40 kg K2O/ha (G4K3) recorded significantly higher castor seed yield (3714 kg/ha) and net return(`1,01,290/ha) with B:C ratio of 3.81. It was concluded that kharif castor should be sown at 120 cm x 60 cm withan application of potassium @ 40 kg K2O/ha along with recommended dose of nitrogen and phosphorus (120-50kg NP/ha) for obtaining higher seed yield and net return.
Keywords: Castor, Crop geometry, Potassium, Yields
Productivity of crop depends upon several agronomicfactors. Among them plant geometry and nutrientmanagement play an important role in castor production.Plant population is the basic component of package ofproduction technology, but more important than this, is theproper adjustment of plants in field. Yield is a function ofinter and intra plant competition and there is a considerablescope for increasing the yield by adjusting plant populationto an optimum level. Balance fertilizer is also necessary forraising the castor yield, maintaining the quality of crop andproductivity of soil. Potassium element is important ingrowth of crop, seed formation and development.Considering all these facts, the present study has beenproposed to find out the influence of plant geometry andpotassium levels on the growth and yield of castor crop.
MATERIALS AND METHODS
A field experiment was conducted at Main OilseedsResearch Station, Junagadh Agricultural University,Junagadh, Gujarat during kharif season of 2013-14 to2015-16. The soil was medium black and clayey in texture.The initial soil organic carbon content, pH and bulk densitywere 0.64%, 7.820 and 1.31 Mg/m3, respectively and having217, 31.50 and 291 kg/ha available N, P2O5 and K2Orespectively. The experiment was laid out in Split PlotDesign comprising four levels of plant geometry (G1:150 cm -------------------------------------------------------------------------- *Corresponding author's E-mail: [email protected]
x 90 cm, G2: 150 cm x 60 cm, G3: 120 cm x 90 cm and G4:120 cm x 60 cm) allotted to main plot and four potassiumlevels (K1: Control, K2: 20 kg K2O/ha, K3: 40 kg K2O/haand K4: 50 kg K2O/ha) assigned to sub plot and replicatedthrice. Sowing of castor (var. GCH-7) was done as pertreatments. Two inter cultivation followed by a hand weedingwas done at 20 and 40 DAS to control the weeds.Recommended normal spacing and fertilizer dose for castorare 120 cm x 60 cm and 120-50-00 kg NPK/ha respectively.Full dose of phosphorus through diammonium phosphate andhalf dose of nitrogen was applied as basal dose at the time ofsowing while the remaining quantity of nitrogen applied astop dressing in two equal splits at 30 and 70 DAS in the formof urea. Crop received 6 irrigations during each crop season.The crop was harvested by picking of matured spikes atdifferent growth stages. The oil content in seed wasdetermined using nuclear magnetic resonance. Five plantswere tagged randomly in the net plot area for sampling ineach plot at 50 days and were used for recording growth andyield attributes of the crop under different treatments.Economics such as net returns and benefit: cost ratios wereworked out at the existing market rate. Bulk density, pH andsoil organic carbon and available K content of soil weredetermined at the beginning of experiment and afterharvesting of crop by flame photometric method as describedby Jackson (1974) for this purpose, soil samples were drawnfrom each treatment and analysed for these physico-chemicalproperties.
J. Oilseeds Res., 36(4) : 229-232, Dec., 2019 229
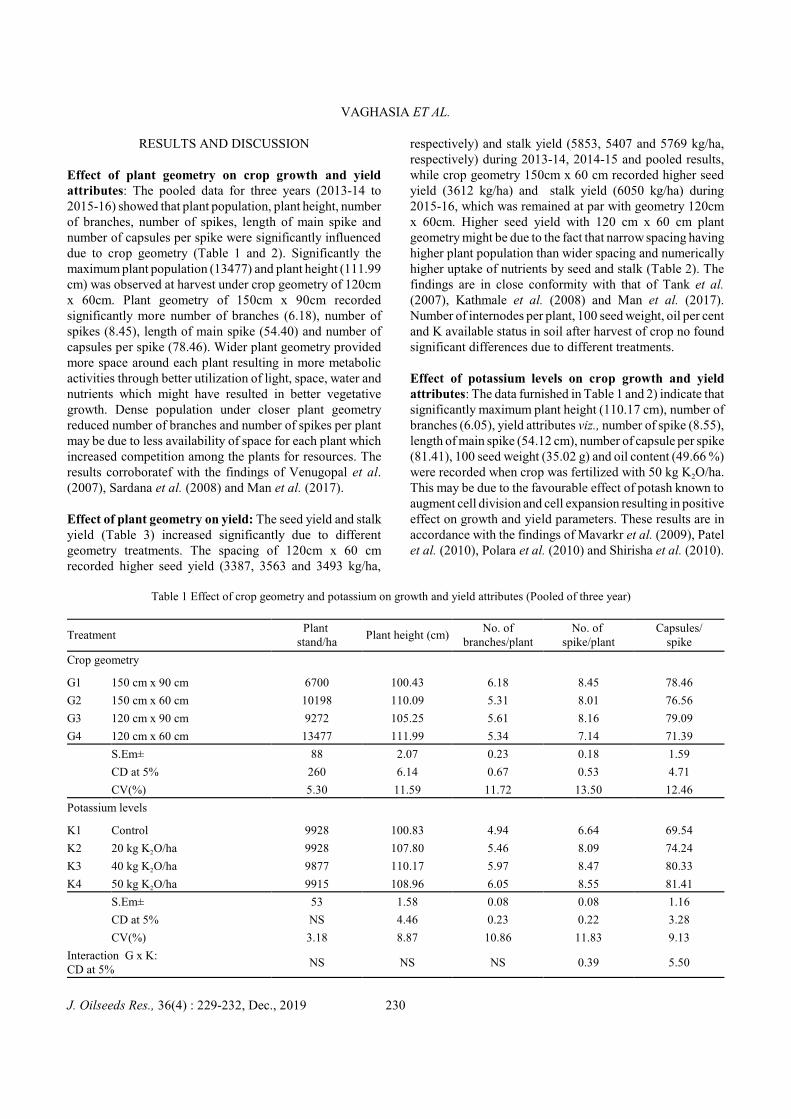
VAGHASIA ET AL.
RESULTS AND DISCUSSION
Effect of plant geometry on crop growth and yieldattributes: The pooled data for three years (2013-14 to2015-16) showed that plant population, plant height, numberof branches, number of spikes, length of main spike andnumber of capsules per spike were significantly influenceddue to crop geometry (Table 1 and 2). Significantly themaximum plant population (13477) and plant height (111.99cm) was observed at harvest under crop geometry of 120cmx 60cm. Plant geometry of 150cm x 90cm recordedsignificantly more number of branches (6.18), number ofspikes (8.45), length of main spike (54.40) and number ofcapsules per spike (78.46). Wider plant geometry providedmore space around each plant resulting in more metabolicactivities through better utilization of light, space, water andnutrients which might have resulted in better vegetativegrowth. Dense population under closer plant geometryreduced number of branches and number of spikes per plantmay be due to less availability of space for each plant whichincreased competition among the plants for resources. Theresults corroboratef with the findings of Venugopal et al.(2007), Sardana et al. (2008) and Man et al. (2017).
Effect of plant geometry on yield: The seed yield and stalkyield (Table 3) increased significantly due to differentgeometry treatments. The spacing of 120cm x 60 cmrecorded higher seed yield (3387, 3563 and 3493 kg/ha,
respectively) and stalk yield (5853, 5407 and 5769 kg/ha,respectively) during 2013-14, 2014-15 and pooled results,while crop geometry 150cm x 60 cm recorded higher seedyield (3612 kg/ha) and stalk yield (6050 kg/ha) during2015-16, which was remained at par with geometry 120cmx 60cm. Higher seed yield with 120 cm x 60 cm plantgeometry might be due to the fact that narrow spacing havinghigher plant population than wider spacing and numericallyhigher uptake of nutrients by seed and stalk (Table 2). Thefindings are in close conformity with that of Tank et al.(2007), Kathmale et al. (2008) and Man et al. (2017).Number of internodes per plant, 100 seed weight, oil per centand K available status in soil after harvest of crop no foundsignificant differences due to different treatments.
Effect of potassium levels on crop growth and yieldattributes: The data furnished in Table 1 and 2) indicate thatsignificantly maximum plant height (110.17 cm), number ofbranches (6.05), yield attributes viz., number of spike (8.55),length of main spike (54.12 cm), number of capsule per spike(81.41), 100 seed weight (35.02 g) and oil content (49.66 %)were recorded when crop was fertilized with 50 kg K2O/ha.This may be due to the favourable effect of potash known toaugment cell division and cell expansion resulting in positiveeffect on growth and yield parameters. These results are inaccordance with the findings of Mavarkr et al. (2009), Patelet al. (2010), Polara et al. (2010) and Shirisha et al. (2010).
Table 1 Effect of crop geometry and potassium on growth and yield attributes (Pooled of three year)
TreatmentPlant
stand/haPlant height (cm)
No. ofbranches/plant
No. of spike/plant
Capsules/spike
Crop geometry
G1 150 cm x 90 cm 6700 100.43 6.18 8.45 78.46
G2 150 cm x 60 cm 10198 110.09 5.31 8.01 76.56
G3 120 cm x 90 cm 9272 105.25 5.61 8.16 79.09
G4 120 cm x 60 cm 13477 111.99 5.34 7.14 71.39
S.Em± 88 2.07 0.23 0.18 1.59
CD at 5% 260 6.14 0.67 0.53 4.71
CV(%) 5.30 11.59 11.72 13.50 12.46
Potassium levels
K1 Control 9928 100.83 4.94 6.64 69.54
K2 20 kg K2O/ha 9928 107.80 5.46 8.09 74.24
K3 40 kg K2O/ha 9877 110.17 5.97 8.47 80.33
K4 50 kg K2O/ha 9915 108.96 6.05 8.55 81.41
S.Em± 53 1.58 0.08 0.08 1.16
CD at 5% NS 4.46 0.23 0.22 3.28
CV(%) 3.18 8.87 10.86 11.83 9.13
Interaction G x K:CD at 5%
NS NS NS 0.39 5.50
J. Oilseeds Res., 36(4) : 229-232, Dec., 2019 230
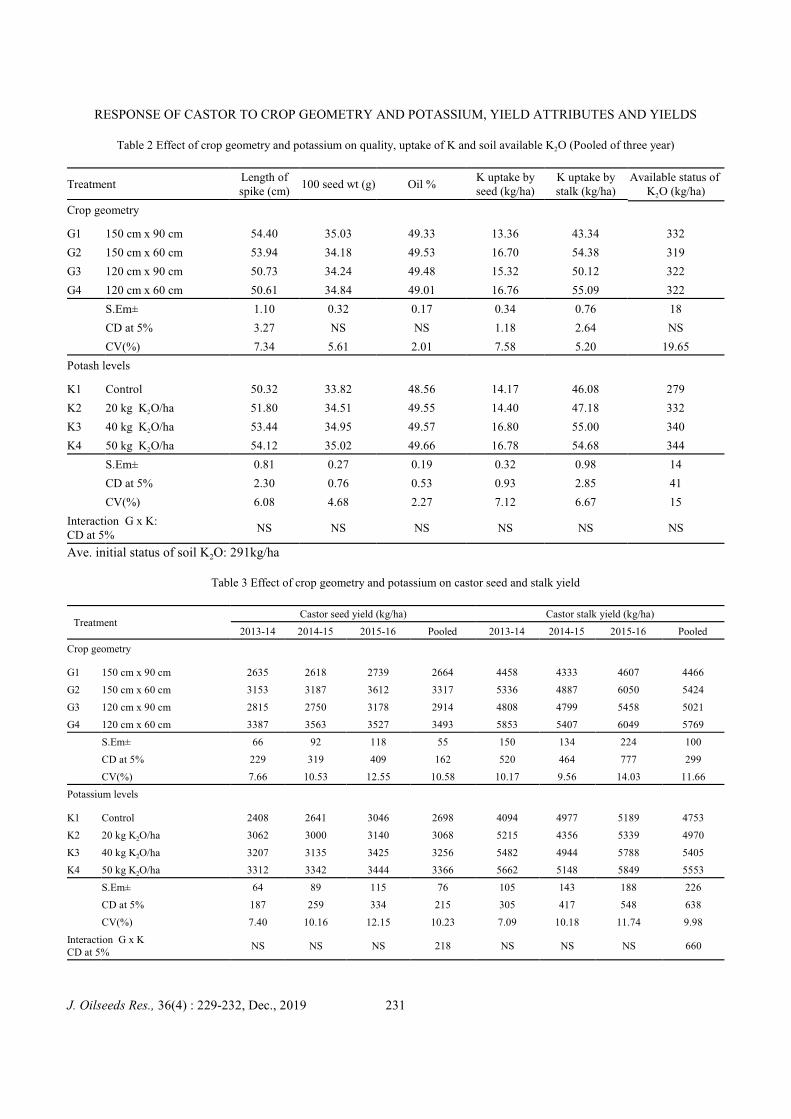
RESPONSE OF CASTOR TO CROP GEOMETRY AND POTASSIUM, YIELD ATTRIBUTES AND YIELDS
Table 2 Effect of crop geometry and potassium on quality, uptake of K and soil available K2O (Pooled of three year)
TreatmentLength ofspike (cm)
100 seed wt (g) Oil %K uptake byseed (kg/ha)
K uptake bystalk (kg/ha)
Available status of K2O (kg/ha)
Crop geometry
G1 150 cm x 90 cm 54.40 35.03 49.33 13.36 43.34 332
G2 150 cm x 60 cm 53.94 34.18 49.53 16.70 54.38 319
G3 120 cm x 90 cm 50.73 34.24 49.48 15.32 50.12 322
G4 120 cm x 60 cm 50.61 34.84 49.01 16.76 55.09 322
S.Em± 1.10 0.32 0.17 0.34 0.76 18
CD at 5% 3.27 NS NS 1.18 2.64 NS
CV(%) 7.34 5.61 2.01 7.58 5.20 19.65
Potash levels
K1 Control 50.32 33.82 48.56 14.17 46.08 279
K2 20 kg K2O/ha 51.80 34.51 49.55 14.40 47.18 332
K3 40 kg K2O/ha 53.44 34.95 49.57 16.80 55.00 340
K4 50 kg K2O/ha 54.12 35.02 49.66 16.78 54.68 344
S.Em± 0.81 0.27 0.19 0.32 0.98 14
CD at 5% 2.30 0.76 0.53 0.93 2.85 41
CV(%) 6.08 4.68 2.27 7.12 6.67 15
Interaction G x K: CD at 5%
NS NS NS NS NS NS
Ave. initial status of soil K2O: 291kg/ha
Table 3 Effect of crop geometry and potassium on castor seed and stalk yield
TreatmentCastor seed yield (kg/ha) Castor stalk yield (kg/ha)
2013-14 2014-15 2015-16 Pooled 2013-14 2014-15 2015-16 Pooled
Crop geometry
G1 150 cm x 90 cm 2635 2618 2739 2664 4458 4333 4607 4466
G2 150 cm x 60 cm 3153 3187 3612 3317 5336 4887 6050 5424
G3 120 cm x 90 cm 2815 2750 3178 2914 4808 4799 5458 5021
G4 120 cm x 60 cm 3387 3563 3527 3493 5853 5407 6049 5769
S.Em± 66 92 118 55 150 134 224 100
CD at 5% 229 319 409 162 520 464 777 299
CV(%) 7.66 10.53 12.55 10.58 10.17 9.56 14.03 11.66
Potassium levels
K1 Control 2408 2641 3046 2698 4094 4977 5189 4753
K2 20 kg K2O/ha 3062 3000 3140 3068 5215 4356 5339 4970
K3 40 kg K2O/ha 3207 3135 3425 3256 5482 4944 5788 5405
K4 50 kg K2O/ha 3312 3342 3444 3366 5662 5148 5849 5553
S.Em± 64 89 115 76 105 143 188 226
CD at 5% 187 259 334 215 305 417 548 638
CV(%) 7.40 10.16 12.15 10.23 7.09 10.18 11.74 9.98
Interaction G x KCD at 5%
NS NS NS 218 NS NS NS 660
J. Oilseeds Res., 36(4) : 229-232, Dec., 2019 231
VAGHASIA ET AL.
Significant interaction effect was observed due to cropgeometry and potassium levels. Crop geometry 150cm x60cm with potassium application @ 50 kg K2O/ha (G2K4)recorded significantly higher castor seed yield (3758 kg/ha),which remained at par with G4K3 (spacing 120 cm x 60 cmwith potash @ 40 kg K2O/ha), G4K4 (spacing 120 cm x 60cm with potash @ 50 kg K2O/ha) and G2K3 (spacing 150 cmx 60 cm with potash @ 40 kg K2O/ha). While, castor stalkyield (6245 kg/ha) was significantly higher by geometry of120 cm x 60 cm with potassium application @ 40 kg K2O/ha(G4K3).
Effect of potassium levels on yields: The data (Table 3)indicated that the seed yield and stalk yield of castor wassignificantly influenced by various levels of potassium inindividual year as well as when pooled across years.Application of 50 kg K2O/ha recorded higher seed yield(3312, 3342, 3444 and 3366 kg/ha, respectively) and stalkyield (5662, 5148, 5849 and 5553 kg/ha, respectively) duringindividual years and in pooled results as compared to control(0 kg K2O/ha), which was remained at par with applicationof 40 kg K2O/ha. This might be due to cumulative effects ofincreasing trend observed on major growth and yieldattributes. Moreover, overall improvement in vegetativegrowth at higher fertility level, which favorably influencedflowering and fruiting which ultimately, resulted in increasednumber of capsules per spike and yield of crop. The resultsare in line with the findings of Polara et al. (2010).
From the above results it could be concluded that castorsown at 120 cm x 60 cm spacing with an application ofpotassium @ 40 kg K2O/ha along with recommended dose ofnitrogen and phosphorus (120-50 kg NP/ha) gives higherseed yield.
REFERENCES
Anonymous 2018. Director's report, Annual group meeting onsunflower and castor, May 17-19, 2018, AICRP on Oilseeds,ICAR-IIOR, Rajendranagar, Hyderabad.
Jackson M L 1974. Soil Chemical Analysis, Prentice Hall of IndiaPvt. Ltd., New Delhi.
Man M K, Amin A U, Choudhary K M and Gora Annu Devi 2017.Response of castor (Ricinus communis L.) to varying weathervariables and crop geometry with levels of nitrogen under rabiseason. International Journal of Current Microbiology andApplied Sciences, 6(5): 2409-2418.
Mavarkar N S, PrabhakaraSetty T K and Sridhara S 2009.Performance of castor (Ricinus communis L.) genotypes atdifferent integrated nutrient management practices underirrigated conditions. Journal of Oilseeds Research, 26(1):41-43.
Patel R M, Patel M M and Patel GN 2010. Effect of precedingkharif crops, spacing and nitrogen levels on yield and nutrientsuptake by rabi castor. Gujarat Agricultural UniversityResearch Journal, 3(1): 15-17.
Polara K B, Sakarvadia H L, Babariya NB and Parmar KB 2010.Effect of potassium and zinc on yields and nutrients uptake bycastor. Asian Journal of Soil Science, 4(2): 304-307.
Sardana V, Singh J and Bajaj R K 2008. Investigation on sowingtime, plant density and nutrient requirements of hybrid castor(Ricinus communis L.) for the non traditional area of Punjab.Journal of Oilseeds Research, 25(1): 41-43.
SEA 2013. Solvent Extractors Association of India. Castor CropSurvey: 2012-13.
Shirisha A, Reddy A P K, Padmavathi P and Bindu G S M 2010.Evaluation of different integrated nutrient management optionson growth and yield of castor. Journal of Oilseeds Research,27(1): 36-38.
Tank D A, Delvadia D R, Gediya K M, Shukla Y M and Patel M V2007. Effect of different spacing and nitrogen levels on seedyield and quality of hybrid castor (Ricinus communis L.).Research on Crops, 8(2): 335-338.
Venugopal C, Reddy G K and Reddy G P 2007. Growth attributes,nitrogen uptake and seed yield of rainfed castor as influencedby plant geometry and nitrogen levels. Journal of ResearchANGRAU, 35(3): 78-81.
J. Oilseeds Res., 36(4) : 229-232, Dec., 2019 232
Studies on the effect of various priming treatments forquality seed production in sesame cv. VRI 1
G SATHIYA NARAYANAN, B S R V SAI PRADEEP KUMAR AND M PRAKASH
Faculty of Agriculture, Annamalai University, Annamalai Nagar-608 002, Tamil Nadu
(Received: September 16, 2019; Revised: October 22, 2019; Accepted: October 16, 2019)
ABSTRACT
Sesame (Sesamum indicum L.; Pedaliaceae) is one of the oldest oil seed crops grown widely in tropical andsubtropical areas for its edible oil, proteins, vitamins, and amino acids. Quality seeds along with other improvedpackage of practices play a vital role in improving productivity of crops under rainfed condition. Differenttechniques are used to enhance vigour of the plants and crop yield of which, seed priming is the simple and suitabletechnique to increase germination, emergence and establishment. Hence, the present investigation was carried outto study the effect of various seed priming treatments on quality seed production in sesame cv. VRI 1. The seedsof sesame were given with various priming treatments i.e., priming with GA3 @ 100 ppm, IAA @ 100 ppm, MnSO4
@ 0.5, FeSO4 @ 0.5%, KCl @ 0.5%, prosopis leaf extract @ 2%, pungam leaf extract @ 2%, arappu leaf extract@ 2%, tamarind leaf extract @ 2% and nochi leaf extract @ 2%. Seeds treated with just water acted as control. Allthe treated seeds were evaluated for the initial quality characteristics and field performance. Among the treatments,it was found that prosopis leaf extract treatment @ 2% registered higher values for initial seed qualities. In fieldevaluation also, prosopis leaf extract treatment @ 2% recorded higher growth, physiological and yield parametersin sesame cv. VRI 1.
Keywords: Sesame, Seed Priming, Seed quality
Sesame (Sesamum indicum L.) is one of the ancientoilseed crops grown in India. Seed is one of the most vitaland critical inputs for increasing agricultural production andproductivity. Even though we have achieved self-sufficiencyin food grain production, the productivity in pulses andoilseeds is very low leading to import of them to meet out theshortages (Govindaraj et al., 2016). The seeds of improvedvarieties have played a key role in agricultural transformationof India. Out of many constraints leading to low productionof this oilseed crop, seed quality is of prime importance.Sesame seeds deteriorate more rapidly after harvest, whichreduce the quality of seeds (Prakash et al., 2019). Seeds canretain their high vigor for some time and thereafter begin todeteriorate losing their germination capacity, vigor andviability. During ageing of seeds, several biochemical andphysiological changes occur that result in a progressivedecline in seeds quality and performance (Mc Donald, 1999).These low vigor seeds germinate and emerge poorly andresult in smaller plants as compared to high vigor seeds.Various techniques are available which enhance the vigor ofseeds and these technologies are termed as seedinvigoration/seed enhancement techniques (Kyrychenko,2014). Seed enhancements are the beneficial techniquesperformed on seeds to improve germination, emergence andseedling growth by altering seed vigor and or thephysiological state of the seed (Black and Peter, 2006).
Seed priming treatment is done before sowing seeds,which involves hydration of seeds to initiate metabolicevents before germination to take place, although preventingradicle emergence to occur. Priming is an approach that
involves treating seeds with different organic or inorganicchemicals and or with high or low temperatures. It entailsimbibition of seeds in different solutions for a specifiedduration under controlled conditions, then drying back themto their original moisture content, so that radicle do notemerge before sowing. This stimulates various metabolicprocesses that improve germination and emergence of severalseed species, particularly seeds of vegetables, small seededcrops and ornamental species. Seed priming is considered tobe an easy, highly effective, low cost and low risk technique.Primed seeds are more useful because of numerousadvantages such as uniformity, early and faster appearance,crop establishment, and efficient use of water, enhancingroots to grow deeper, allowing germination in dormant seedsby increasing metabolic events, to initiate growth of organsfor reproduction, early flowering and maturity (Singh et al.,2015). Seed germination is a complicated process involvingdifferent metabolic events which results in change fromstored food reserve to activation phase where radicle andplumule emerge. Due to this, different benefits such assynchronisation of radicle emergence, increase in growth rateand enhancing large number of seeds to germinate areimparted. During priming, seeds complete the initial phasesof germination and complete the imbibition process faster,and this reduces the time required for cellular activities totake place (Varier et al., 2010). In the present investigation,studies were conducted to understand the effect of variousinvigorative priming treatments on quality seed productionin sesame cv. VRI 1.
J. Oilseeds Res., 36(4) : 233-239, Dec., 2019 233
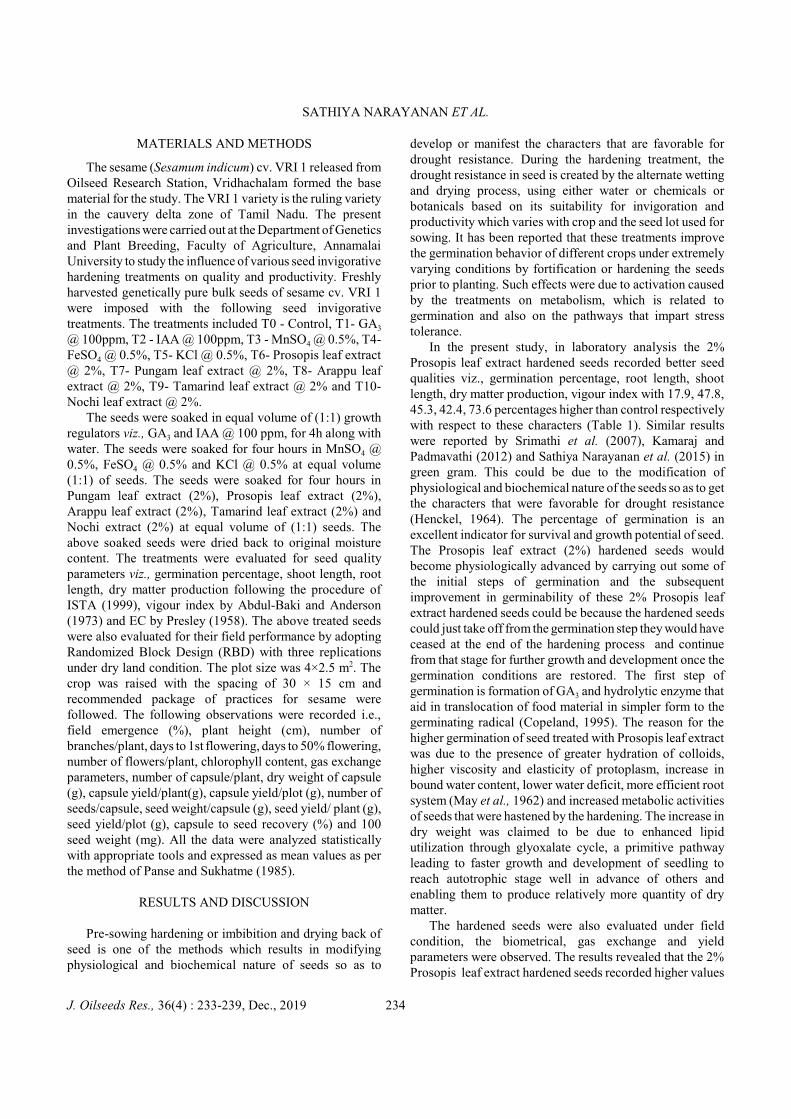
SATHIYA NARAYANAN ET AL.
MATERIALS AND METHODS
The sesame (Sesamum indicum) cv. VRI 1 released fromOilseed Research Station, Vridhachalam formed the basematerial for the study. The VRI 1 variety is the ruling varietyin the cauvery delta zone of Tamil Nadu. The presentinvestigations were carried out at the Department of Geneticsand Plant Breeding, Faculty of Agriculture, AnnamalaiUniversity to study the influence of various seed invigorativehardening treatments on quality and productivity. Freshlyharvested genetically pure bulk seeds of sesame cv. VRI 1were imposed with the following seed invigorativetreatments. The treatments included T0 - Control, T1- GA3
@ 100ppm, T2 - IAA @ 100ppm, T3 - MnSO4 @ 0.5%, T4-FeSO4 @ 0.5%, T5- KCl @ 0.5%, T6- Prosopis leaf extract@ 2%, T7- Pungam leaf extract @ 2%, T8- Arappu leafextract @ 2%, T9- Tamarind leaf extract @ 2% and T10-Nochi leaf extract @ 2%.
The seeds were soaked in equal volume of (1:1) growthregulators viz., GA3 and IAA @ 100 ppm, for 4h along withwater. The seeds were soaked for four hours in MnSO4 @0.5%, FeSO4 @ 0.5% and KCl @ 0.5% at equal volume(1:1) of seeds. The seeds were soaked for four hours inPungam leaf extract (2%), Prosopis leaf extract (2%),Arappu leaf extract (2%), Tamarind leaf extract (2%) andNochi extract (2%) at equal volume of (1:1) seeds. Theabove soaked seeds were dried back to original moisturecontent. The treatments were evaluated for seed qualityparameters viz., germination percentage, shoot length, rootlength, dry matter production following the procedure ofISTA (1999), vigour index by Abdul-Baki and Anderson(1973) and EC by Presley (1958). The above treated seedswere also evaluated for their field performance by adoptingRandomized Block Design (RBD) with three replicationsunder dry land condition. The plot size was 4×2.5 m2. Thecrop was raised with the spacing of 30 × 15 cm andrecommended package of practices for sesame werefollowed. The following observations were recorded i.e.,field emergence (%), plant height (cm), number ofbranches/plant, days to 1st flowering, days to 50% flowering,number of flowers/plant, chlorophyll content, gas exchangeparameters, number of capsule/plant, dry weight of capsule(g), capsule yield/plant(g), capsule yield/plot (g), number ofseeds/capsule, seed weight/capsule (g), seed yield/ plant (g),seed yield/plot (g), capsule to seed recovery (%) and 100seed weight (mg). All the data were analyzed statisticallywith appropriate tools and expressed as mean values as perthe method of Panse and Sukhatme (1985).
RESULTS AND DISCUSSION
Pre-sowing hardening or imbibition and drying back ofseed is one of the methods which results in modifying physiological and biochemical nature of seeds so as to
develop or manifest the characters that are favorable fordrought resistance. During the hardening treatment, thedrought resistance in seed is created by the alternate wettingand drying process, using either water or chemicals orbotanicals based on its suitability for invigoration andproductivity which varies with crop and the seed lot used forsowing. It has been reported that these treatments improvethe germination behavior of different crops under extremelyvarying conditions by fortification or hardening the seedsprior to planting. Such effects were due to activation causedby the treatments on metabolism, which is related togermination and also on the pathways that impart stresstolerance.
In the present study, in laboratory analysis the 2%Prosopis leaf extract hardened seeds recorded better seedqualities viz., germination percentage, root length, shootlength, dry matter production, vigour index with 17.9, 47.8,45.3, 42.4, 73.6 percentages higher than control respectivelywith respect to these characters (Table 1). Similar resultswere reported by Srimathi et al. (2007), Kamaraj andPadmavathi (2012) and Sathiya Narayanan et al. (2015) ingreen gram. This could be due to the modification ofphysiological and biochemical nature of the seeds so as to getthe characters that were favorable for drought resistance(Henckel, 1964). The percentage of germination is anexcellent indicator for survival and growth potential of seed.The Prosopis leaf extract (2%) hardened seeds wouldbecome physiologically advanced by carrying out some ofthe initial steps of germination and the subsequentimprovement in germinability of these 2% Prosopis leafextract hardened seeds could be because the hardened seedscould just take off from the germination step they would haveceased at the end of the hardening process and continuefrom that stage for further growth and development once thegermination conditions are restored. The first step ofgermination is formation of GA3 and hydrolytic enzyme thataid in translocation of food material in simpler form to thegerminating radical (Copeland, 1995). The reason for thehigher germination of seed treated with Prosopis leaf extractwas due to the presence of greater hydration of colloids,higher viscosity and elasticity of protoplasm, increase inbound water content, lower water deficit, more efficient rootsystem (May et al., 1962) and increased metabolic activitiesof seeds that were hastened by the hardening. The increase indry weight was claimed to be due to enhanced lipidutilization through glyoxalate cycle, a primitive pathwayleading to faster growth and development of seedling toreach autotrophic stage well in advance of others andenabling them to produce relatively more quantity of drymatter.
The hardened seeds were also evaluated under fieldcondition, the biometrical, gas exchange and yieldparameters were observed. The results revealed that the 2%Prosopis leaf extract hardened seeds recorded higher values
J. Oilseeds Res., 36(4) : 233-239, Dec., 2019 234
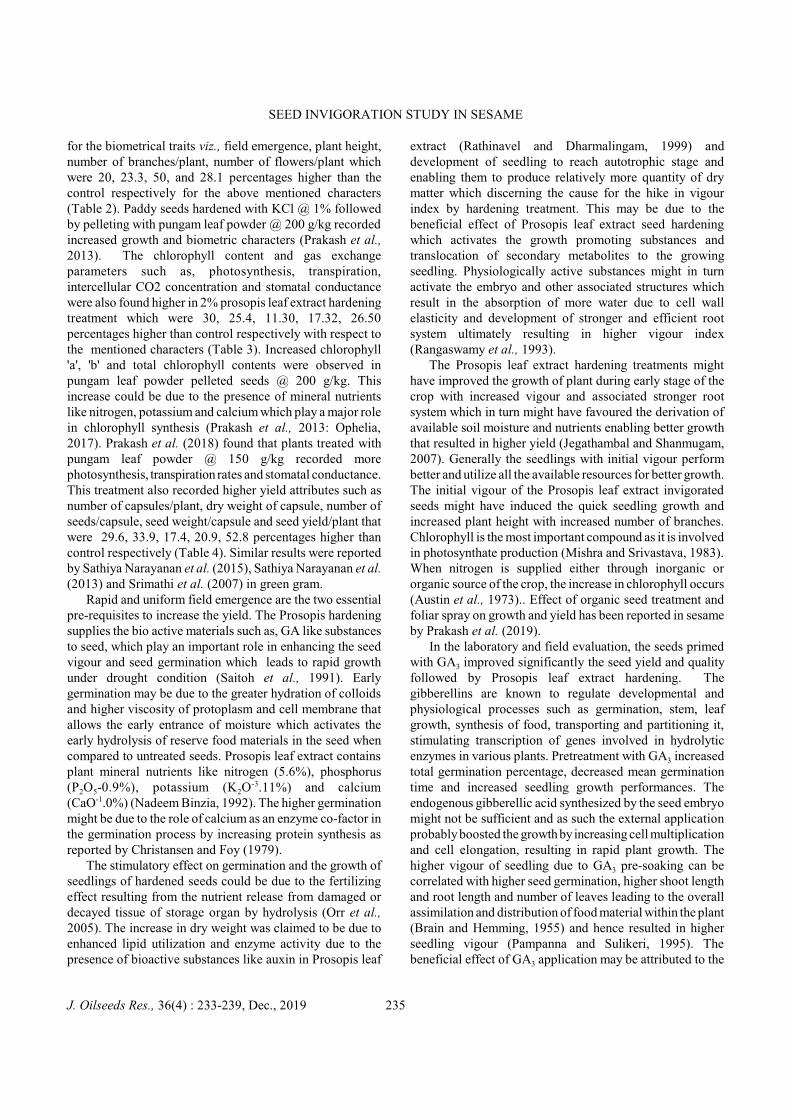
SEED INVIGORATION STUDY IN SESAME
for the biometrical traits viz., field emergence, plant height,number of branches/plant, number of flowers/plant whichwere 20, 23.3, 50, and 28.1 percentages higher than thecontrol respectively for the above mentioned characters(Table 2). Paddy seeds hardened with KCl @ 1% followedby pelleting with pungam leaf powder @ 200 g/kg recordedincreased growth and biometric characters (Prakash et al.,2013). The chlorophyll content and gas exchangeparameters such as, photosynthesis, transpiration,intercellular CO2 concentration and stomatal conductancewere also found higher in 2% prosopis leaf extract hardeningtreatment which were 30, 25.4, 11.30, 17.32, 26.50percentages higher than control respectively with respect tothe mentioned characters (Table 3). Increased chlorophyll'a', 'b' and total chlorophyll contents were observed inpungam leaf powder pelleted seeds @ 200 g/kg. Thisincrease could be due to the presence of mineral nutrientslike nitrogen, potassium and calcium which play a major rolein chlorophyll synthesis (Prakash et al., 2013: Ophelia,2017). Prakash et al. (2018) found that plants treated withpungam leaf powder @ 150 g/kg recorded morephotosynthesis, transpiration rates and stomatal conductance.This treatment also recorded higher yield attributes such asnumber of capsules/plant, dry weight of capsule, number ofseeds/capsule, seed weight/capsule and seed yield/plant thatwere 29.6, 33.9, 17.4, 20.9, 52.8 percentages higher thancontrol respectively (Table 4). Similar results were reportedby Sathiya Narayanan et al. (2015), Sathiya Narayanan et al.(2013) and Srimathi et al. (2007) in green gram.
Rapid and uniform field emergence are the two essentialpre-requisites to increase the yield. The Prosopis hardeningsupplies the bio active materials such as, GA like substancesto seed, which play an important role in enhancing the seedvigour and seed germination which leads to rapid growthunder drought condition (Saitoh et al., 1991). Earlygermination may be due to the greater hydration of colloidsand higher viscosity of protoplasm and cell membrane thatallows the early entrance of moisture which activates theearly hydrolysis of reserve food materials in the seed whencompared to untreated seeds. Prosopis leaf extract containsplant mineral nutrients like nitrogen (5.6%), phosphorus(P2O5-0.9%), potassium (K2O
-3.11%) and calcium(CaO-1.0%) (Nadeem Binzia, 1992). The higher germinationmight be due to the role of calcium as an enzyme co-factor inthe germination process by increasing protein synthesis asreported by Christansen and Foy (1979).
The stimulatory effect on germination and the growth ofseedlings of hardened seeds could be due to the fertilizingeffect resulting from the nutrient release from damaged ordecayed tissue of storage organ by hydrolysis (Orr et al.,2005). The increase in dry weight was claimed to be due toenhanced lipid utilization and enzyme activity due to thepresence of bioactive substances like auxin in Prosopis leaf
extract (Rathinavel and Dharmalingam, 1999) anddevelopment of seedling to reach autotrophic stage andenabling them to produce relatively more quantity of drymatter which discerning the cause for the hike in vigourindex by hardening treatment. This may be due to thebeneficial effect of Prosopis leaf extract seed hardeningwhich activates the growth promoting substances andtranslocation of secondary metabolites to the growingseedling. Physiologically active substances might in turnactivate the embryo and other associated structures whichresult in the absorption of more water due to cell wallelasticity and development of stronger and efficient rootsystem ultimately resulting in higher vigour index(Rangaswamy et al., 1993).
The Prosopis leaf extract hardening treatments mighthave improved the growth of plant during early stage of thecrop with increased vigour and associated stronger rootsystem which in turn might have favoured the derivation ofavailable soil moisture and nutrients enabling better growththat resulted in higher yield (Jegathambal and Shanmugam,2007). Generally the seedlings with initial vigour performbetter and utilize all the available resources for better growth. The initial vigour of the Prosopis leaf extract invigoratedseeds might have induced the quick seedling growth andincreased plant height with increased number of branches.Chlorophyll is the most important compound as it is involvedin photosynthate production (Mishra and Srivastava, 1983).When nitrogen is supplied either through inorganic ororganic source of the crop, the increase in chlorophyll occurs(Austin et al., 1973).. Effect of organic seed treatment andfoliar spray on growth and yield has been reported in sesameby Prakash et al. (2019).
In the laboratory and field evaluation, the seeds primedwith GA3 improved significantly the seed yield and qualityfollowed by Prosopis leaf extract hardening. Thegibberellins are known to regulate developmental andphysiological processes such as germination, stem, leafgrowth, synthesis of food, transporting and partitioning it,stimulating transcription of genes involved in hydrolyticenzymes in various plants. Pretreatment with GA3 increasedtotal germination percentage, decreased mean germinationtime and increased seedling growth performances. Theendogenous gibberellic acid synthesized by the seed embryomight not be sufficient and as such the external applicationprobably boosted the growth by increasing cell multiplicationand cell elongation, resulting in rapid plant growth. Thehigher vigour of seedling due to GA3 pre-soaking can becorrelated with higher seed germination, higher shoot lengthand root length and number of leaves leading to the overallassimilation and distribution of food material within the plant(Brain and Hemming, 1955) and hence resulted in higherseedling vigour (Pampanna and Sulikeri, 1995). Thebeneficial effect of GA3 application may be attributed to the
J. Oilseeds Res., 36(4) : 233-239, Dec., 2019 235
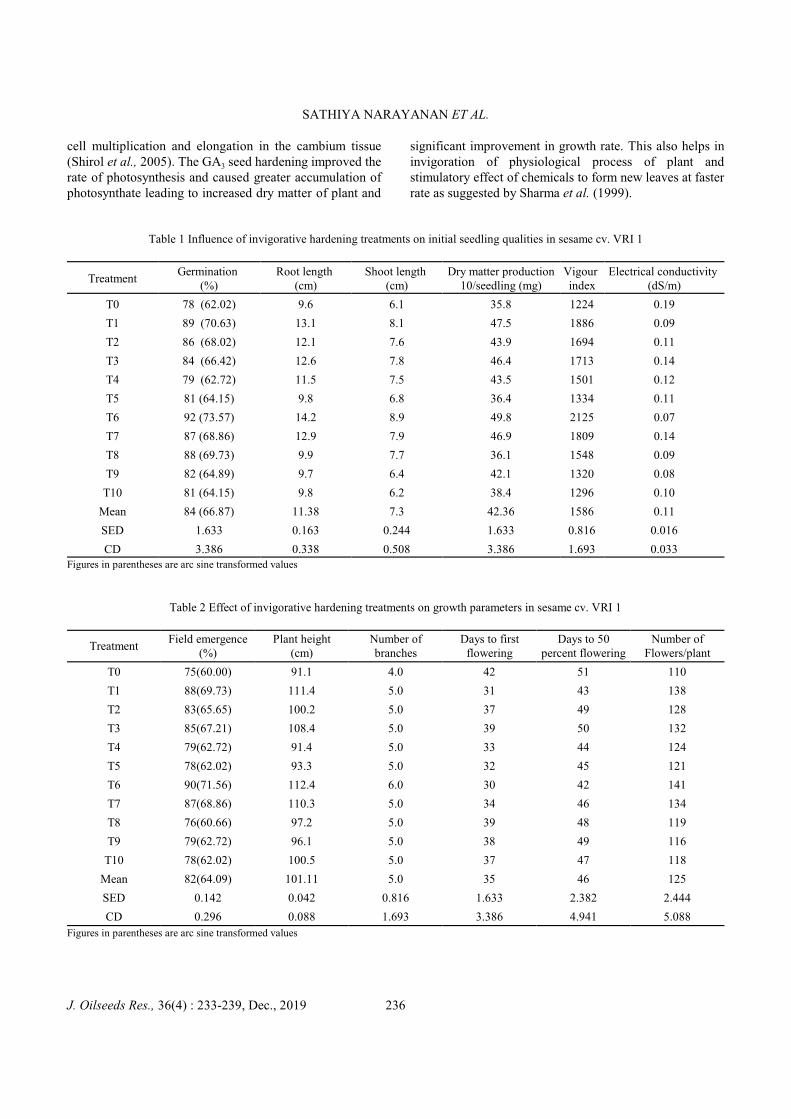
SATHIYA NARAYANAN ET AL.
cell multiplication and elongation in the cambium tissue(Shirol et al., 2005). The GA3 seed hardening improved therate of photosynthesis and caused greater accumulation ofphotosynthate leading to increased dry matter of plant and
significant improvement in growth rate. This also helps ininvigoration of physiological process of plant andstimulatory effect of chemicals to form new leaves at fasterrate as suggested by Sharma et al. (1999).
Table 1 Influence of invigorative hardening treatments on initial seedling qualities in sesame cv. VRI 1
TreatmentGermination
(%)Root length
(cm)Shoot length
(cm)Dry matter production
10/seedling (mg)Vigour index
Electrical conductivity (dS/m)
T0 78 (62.02) 9.6 6.1 35.8 1224 0.19
T1 89 (70.63) 13.1 8.1 47.5 1886 0.09
T2 86 (68.02) 12.1 7.6 43.9 1694 0.11
T3 84 (66.42) 12.6 7.8 46.4 1713 0.14
T4 79 (62.72) 11.5 7.5 43.5 1501 0.12
T5 81 (64.15) 9.8 6.8 36.4 1334 0.11
T6 92 (73.57) 14.2 8.9 49.8 2125 0.07
T7 87 (68.86) 12.9 7.9 46.9 1809 0.14
T8 88 (69.73) 9.9 7.7 36.1 1548 0.09
T9 82 (64.89) 9.7 6.4 42.1 1320 0.08
T10 81 (64.15) 9.8 6.2 38.4 1296 0.10
Mean 84 (66.87) 11.38 7.3 42.36 1586 0.11
SED 1.633 0.163 0.244 1.633 0.816 0.016
CD 3.386 0.338 0.508 3.386 1.693 0.033Figures in parentheses are arc sine transformed values
Table 2 Effect of invigorative hardening treatments on growth parameters in sesame cv. VRI 1
TreatmentField emergence
(%)Plant height
(cm)Number ofbranches
Days to firstflowering
Days to 50percent flowering
Number ofFlowers/plant
T0 75(60.00) 91.1 4.0 42 51 110
T1 88(69.73) 111.4 5.0 31 43 138
T2 83(65.65) 100.2 5.0 37 49 128
T3 85(67.21) 108.4 5.0 39 50 132
T4 79(62.72) 91.4 5.0 33 44 124
T5 78(62.02) 93.3 5.0 32 45 121
T6 90(71.56) 112.4 6.0 30 42 141
T7 87(68.86) 110.3 5.0 34 46 134
T8 76(60.66) 97.2 5.0 39 48 119
T9 79(62.72) 96.1 5.0 38 49 116
T10 78(62.02) 100.5 5.0 37 47 118
Mean 82(64.09) 101.11 5.0 35 46 125
SED 0.142 0.042 0.816 1.633 2.382 2.444
CD 0.296 0.088 1.693 3.386 4.941 5.088
Figures in parentheses are arc sine transformed values
J. Oilseeds Res., 36(4) : 233-239, Dec., 2019 236
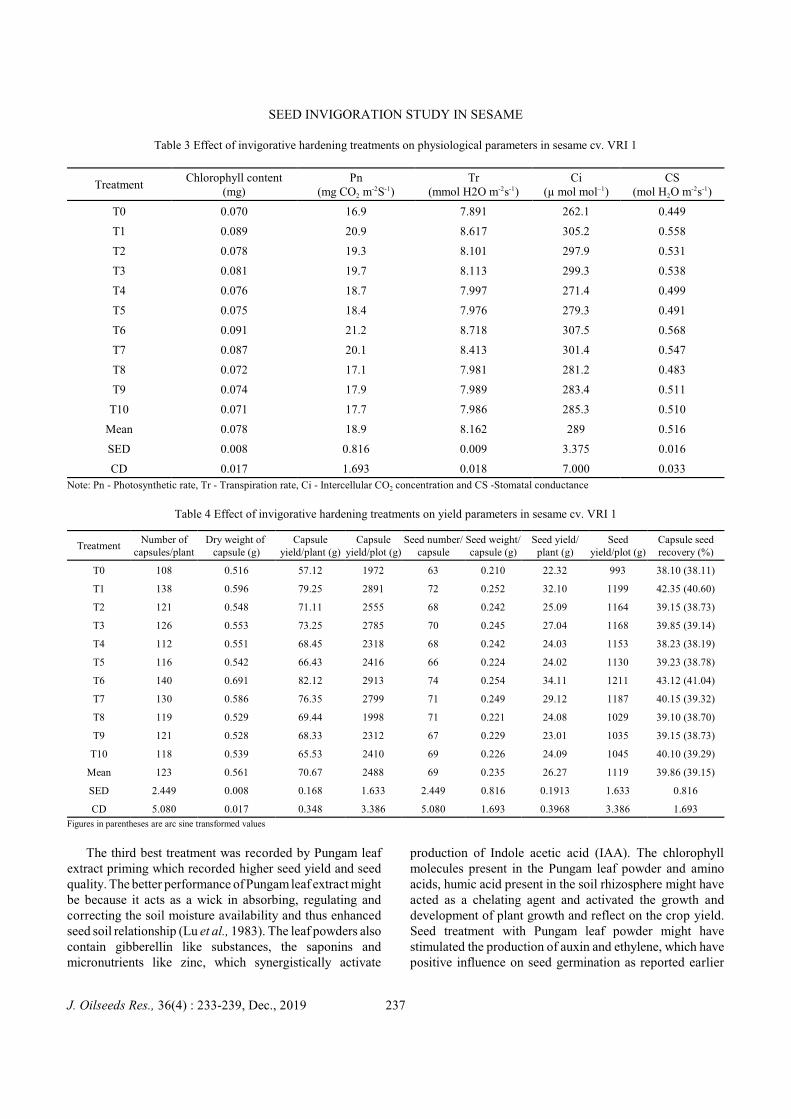
SEED INVIGORATION STUDY IN SESAME
Table 3 Effect of invigorative hardening treatments on physiological parameters in sesame cv. VRI 1
TreatmentChlorophyll content
(mg)Pn
(mg CO2 m-2S-1)
Tr(mmol H2O m-2s-1)
Ci(µ mol mol–1)
CS(mol H2O m-2s-1)
T0 0.070 16.9 7.891 262.1 0.449
T1 0.089 20.9 8.617 305.2 0.558
T2 0.078 19.3 8.101 297.9 0.531
T3 0.081 19.7 8.113 299.3 0.538
T4 0.076 18.7 7.997 271.4 0.499
T5 0.075 18.4 7.976 279.3 0.491
T6 0.091 21.2 8.718 307.5 0.568
T7 0.087 20.1 8.413 301.4 0.547
T8 0.072 17.1 7.981 281.2 0.483
T9 0.074 17.9 7.989 283.4 0.511
T10 0.071 17.7 7.986 285.3 0.510
Mean 0.078 18.9 8.162 289 0.516
SED 0.008 0.816 0.009 3.375 0.016
CD 0.017 1.693 0.018 7.000 0.033
Note: Pn - Photosynthetic rate, Tr - Transpiration rate, Ci - Intercellular CO2 concentration and CS -Stomatal conductance
Table 4 Effect of invigorative hardening treatments on yield parameters in sesame cv. VRI 1
TreatmentNumber of
capsules/plantDry weight of
capsule (g)Capsule
yield/plant (g)Capsule
yield/plot (g)Seed number/
capsuleSeed weight/capsule (g)
Seed yield/plant (g)
Seedyield/plot (g)
Capsule seedrecovery (%)
T0 108 0.516 57.12 1972 63 0.210 22.32 993 38.10 (38.11)
T1 138 0.596 79.25 2891 72 0.252 32.10 1199 42.35 (40.60)
T2 121 0.548 71.11 2555 68 0.242 25.09 1164 39.15 (38.73)
T3 126 0.553 73.25 2785 70 0.245 27.04 1168 39.85 (39.14)
T4 112 0.551 68.45 2318 68 0.242 24.03 1153 38.23 (38.19)
T5 116 0.542 66.43 2416 66 0.224 24.02 1130 39.23 (38.78)
T6 140 0.691 82.12 2913 74 0.254 34.11 1211 43.12 (41.04)
T7 130 0.586 76.35 2799 71 0.249 29.12 1187 40.15 (39.32)
T8 119 0.529 69.44 1998 71 0.221 24.08 1029 39.10 (38.70)
T9 121 0.528 68.33 2312 67 0.229 23.01 1035 39.15 (38.73)
T10 118 0.539 65.53 2410 69 0.226 24.09 1045 40.10 (39.29)
Mean 123 0.561 70.67 2488 69 0.235 26.27 1119 39.86 (39.15)
SED 2.449 0.008 0.168 1.633 2.449 0.816 0.1913 1.633 0.816
CD 5.080 0.017 0.348 3.386 5.080 1.693 0.3968 3.386 1.693
Figures in parentheses are arc sine transformed values
The third best treatment was recorded by Pungam leafextract priming which recorded higher seed yield and seedquality. The better performance of Pungam leaf extract mightbe because it acts as a wick in absorbing, regulating andcorrecting the soil moisture availability and thus enhancedseed soil relationship (Lu et al., 1983). The leaf powders alsocontain gibberellin like substances, the saponins andmicronutrients like zinc, which synergistically activate
production of Indole acetic acid (IAA). The chlorophyllmolecules present in the Pungam leaf powder and aminoacids, humic acid present in the soil rhizosphere might haveacted as a chelating agent and activated the growth anddevelopment of plant growth and reflect on the crop yield.Seed treatment with Pungam leaf powder might havestimulated the production of auxin and ethylene, which havepositive influence on seed germination as reported earlier
J. Oilseeds Res., 36(4) : 233-239, Dec., 2019 237
SATHIYA NARAYANAN ET AL.
(Clouse and Sasse, 1988). It also improves the seedlinggrowth. The probable reason for elite seedling growth mightbe due to cell elongation, cell division and enhancement inenzyme activities induced by Pungam leaf powder.
To conclude, the influence of various invigorativepriming treatments on quality seed production in sesame cv.VRI 1 revealed that 2%, Prosopis leaf extract primed seedsrecorded higher seed yield and initial seedling quality whencompared to other treatments and control.
REFERENCES
Abdul-Bak A A and Anderson J D 1973. Vigour determination insoy bean seed by multiple criteria. Crop Science, 13: 630-632.
Austin R, Longden P C and Hutchinso J 1969. Some effects ofhardening on carrot seed. Annals of Botany, 33: 883-895.
Black M H and Peter H 2006. The encyclopedia of seeds: science,technology and uses. Wallingford, UK. CAB International, pp.224.
Brain PW and Hemming HG 1955. The effects of GA on shootgrowth of pea seedling. Physiology of Plant, 8: 669- 681.
Christansen M N and Foy C D 1979. Fate and function of calciumin tissue. Communications in Soil Science and Plant Analysis,10: 427-442.
Clouse S D and Sasse J M 1998. Brassinosteroids. Essentialregulators of plant growth and development. Annual Review ofPlant Physiology and Plant Molecular Biology, 49: 427-451.
Copeland L O 1995. Principles of Seed Science and Technology,McMillan Publishing Company, New York.
Govindaraj G N, Suryaprakash S, Sivaramane N and Murali P2016. Changes in edible oil preference and present-dayconsumption status of households: A case of Tamil Nadu state,India. Journal of Oilseeds Research, 33(3): 178-184.
ISTA 1999. International Rules for Seed Testing. Seed Science andTechnology, 27: Supplement Rules, pp. 1-84.
Jagathambal R and Shanmugam K 2007. Seed quality as influencedby natural storage and accelerated a going in groundnutcultivars. Mysore Journal of Agricultural Sciences, 32(2):37-34.
Kamaraj A and Padmavathi S 2012. Effect of seed enhancementtreatment using leaf extract of physiological and morphologicalcharacteristics of green gram (Vigna radiata L.) seed ADT 3.International Journal of Current Research, 4(11): 110-114.
Kyrychenko O V 2014. The effect of specific plant exogenouslectin on the symbiotic potential of soybean- rhizobium systemand lectin activity of soybean seeds. Scientia Agriculturae, 2:1-7.
Lu S D Ming and Jiang T 1983. A preliminary report on the effectof CaCO3 Pelleting of Chinese milk vetch on its yield.Shanghai Agricultural Science and Technology, 6: 70-77.
May L H Milthrope E J and Miklthrope F L 1962. Pre-sowinghardening of plants to drought. Field Crop Abstracts, 15:93-98.
McDonald MB 1999. Seed deterioration: physiology, repair andassessment. Seed Science and Technology, 27: 177-237.
Mishra S N and Srivastava H S 1983. Role of inorganic nitrogen inthe synthesis and degradation of chlorophyll and cartenoids in
maize leaves. Biologia Plantarum, 25(1): 21-27.Nadeem Binzia 1992. Investigation of the chemical constituents of
Prosopis juliflora and circular Dichroismic studies ofCholestano Quinaxaliner. Ph.D Thesis, NEJ Research Instituteof Chemistry, University of Karachi, Pakistan.
Ophelia A 2017. Studies on the effect of seed pelleting and foliarspray treatments on seed yield and quality in black gram (Vignamungo L.) cv. CO 6. M.Sc (Ag.) Thesis, Annamalai University,Annamalainagar, Tamil Nadu.
Orr S P Jennifer A Rudgers A and Clay K 2005. Invasive plantscan inhibit native tree seedlings: testing potential allelopathicmechanisms. Plant Ecology, 181: 153-165.
Pampanna Y and Sulikeri G S 1995. Effect of growth regulators onseed germination and seedling growth of Sapota. KarnatakaJournal of Agricultural Sciences, 8(1): 6064.
Panse V G and Sukhatme P V 1985. In: Statistical methods forAgricultural workers. ICAR Publication, New Delhi, pp.327-340.
Prakash M, Ophelia A, Sathiya Narayaanan G and Anandan R2018. Effect of organic seed pelleting on seedling quality, gasexchange, growth, yield and resultant seed quality parametersof blackgram. Legume Research, DOI: 10.18805/LP-3965.
Prakash M, Sathiya Narayanan G, Anandan R and Sunil Kumar B2019. Effect of organic seed treatment and foliar spray ongrowth, yield and resultant seed quality in sesame (Sesamumindicum. L.). Journal of Oilseeds Research, 35(4): 234-298.
Prakash M, Sathiya Narayanan G Sunil Kumar B and Kamaraj A2013. Effect of seed hardening and pelleting on seed qualityand physiological of rice in aerobic condition. AgriculturalScience Digest, 33(3): 172-177.
Presley J T 1958. Relationship of protoplast permeability of cottonseed viability and predisposition of seedling disease. PlantDisease Reporter, 42(7): 582.
Rangaswamy A Purushothaman S and Devasenapaty P 1993. Seedhardening in relation to seedling quality characters of the crop.Madras Agriculture Journal, 80(9): 535-537.
Rathinavel K and Dharmalingam C 1999. Seed hardening augmentthe productivity of cotton cv. LRA 5166 (Gossypium hirsutumL.). Madras Agriculture Journal, 86(1-3): 68-72.
Saitoh K Kasiwagi S Kinosita T and Ishihara K 1991.Characteristics of dry matter production in high yielding ricecultivars. Drymatter accumulation in the panicles. JapaneseJournal Crop Sciences, 60: 255-263.
Sathiya Narayanan G Prakash M and Reka M 2015. Influence ofseed hardening cum foliar spray treatments on biometricphysiological and yield parameters in black gram under dryland condition, Agricultural Science Digest, 35(1): 1-6.
Sathiya Narayanan G Prakash M and Sunilkumar B 2013. Qualityseed production in mungbean under abiotic stress condition.Lap Lambert Academic Publishing Company, Germany, 43-34.
Shanmugavelu K G 1966. A note on the effects of gibberellic acidon the root and shoot weights of some tree species. MadrasAgriculture Journal, 54: 44-45.
Sharma M C Ughreia P P U and Jambukia T K 1999. Effect ofsome plant growth regulators, chemicals and organic waste ongermination and subsequent seedling growth of Kagzi lime(Citrus aurantifolia Swingle). International Symposium onCitriculture, (Abstracts), Nagpur, 51 pp.
J. Oilseeds Res., 36(4) : 233-239, Dec., 2019 238

SEED INVIGORATION STUDY IN SESAME
Shirol A M Hanamashetti S I and Kanamadi V C 2005. Studies onpre-sowing, method and season of grafting of sapota rootstockkhirnee. Karnataka Journal of Agricultural Sciences, 18:96-100.
Singh H Jassal R K Kang J S Sandhu S S Kang H and Grewal K2015. Seed Priming techniques in field crops- A review.Agricultural Reviews, 36(4): 251-264.
Srimathi P Kavitha S and Renugadevi J 2007. Influence of seedhardening and pelleting on seed yield and quality in green gram(Vigna radiata L.) cv. CO 6. Indian Journal of Agricultural
Research, 41(2):122-126.Varier A Vari A K and Dadlani M 2010. The subcellular basis of
seed priming. Current Science, 99 (4): 450-456.Vivek Sharma Singh M J Vijay Kumar and Anil Khokhar 2018.
Response of integrated nutrient management on growth, seedyield and economics of sesame (Sesamum indicum L.) underrainfed conditions in Sub Mountain. Punjab Journal ofOilseeds Research, 35(3): 166-170.
J. Oilseeds Res., 36(4) : 233-239, Dec., 2019 239
Physico-chemical and organoleptic properties of palm oil and it's comparison withother oils regarding their utility in preparation of food products
MAMTA KUMARI1* AND RITU P DUBEY2
Polytechnic in Home Science, JAU, Keriya Road, Amreli-365 601, Gujarat
(Received: July 7, 2019; Revised: October 4, 2019; Accepted: October 10, 2019)
ABSTRACT
Palm oil is the most widely used vegetable oil in the world. It is widely used by food and non-food manufacturersbecause of its functional benefits, versatility and availability. The consumption of palm oil is increasing as it is oneof the cheapest forms of vegetable oil. It is rich in natural chemical compounds important for health and nutrition.The present study was carried out to prepare and assess the physico-chemical qualities of food products formulatedby palm oil and other commonly used vegetable oils. Properties of palm oil with other vegetable oils (soybean oiland sunflower oil) were compared by preparing two food products namely Namak Para and Sev and they wereevaluated for sensory evaluation. The chemical properties of the oils were analysed by calculating the acid value,peroxide value, specific gravity, percentage of oil absorption and beta-carotene. The cost of developed products wasalso calculated. The results indicated that organoleptic scores of Namak Para and Sev prepared using palm oil weresignificantly higher than the products prepared in other oils. Therefore, palm oil is recommended for cookingpurposes because of its comparatively better sensory, physico-chemical and nutritional qualities.
Keywords: Acid value, Beta-carotene, Organoleptic, Palm oil, Physico-chemical properties
Palm oil is also known as palm fruit oil (Elaeisguineensis). Among the major oilseed crops, the palm treefruit accounts for the smallest percentage (5.5%) of all thecultivated land for oils and fats globally, but produces thelargest percentage (32 %) of total output (Anonymous,2016). These advantages have led palm oil to be the mostwidely consumed vegetable oil in the world (Anonymous,2016a). According to Tan and Nehdi (2012), palm oil has abalanced fatty acid composition in which the level ofsaturated and unsaturated fatty acids are almost equal with50% saturated, 40% monounsaturated and 10%polyunsaturated fatty acids. Crude palm oil also known asred palm oil (RPO) has been cold-pressed from the fruit ofthe oil palm while white palm oil is the product of processingand refining. When refined, the palm oil loses its red colour.Palm oil also contains minor constituents which includecarotenoids, tocopherols, sterols, phosphatides, triterpenicand aliphatic alcohols. Among them, the most importantcompounds are carotenoids and tocochromanols (tocopherolsand tocotrienols). The most active and important form ofcarotenoids found in palm oil is beta-carotene. Phoon et al.(2018), reported that crude palm oil contains 500-700 ppmof carotenoids and 1000-1200 ppm tocochromanols.Tocochromanols are powerful antioxidant, capable ofreducing the harmful types of oxygen molecules (freeradicals) in the body and help to protect from chronicdiseases, while delaying the body's ageing process. The fattyacid composition of palm oil offers food manufacturersgreater latitude to formulate hydrogenated fat free and transfat free products. Palm oil provides desirable oxidativestability, texture, and flavor characteristics. Because it is very
stable with respect to free radical-induced oxidation, theformation of harmful oxidized products during processingand cooking is negligible as compared with that ofpolyunsaturated oils. Products incorporating naturallytrans-free palm oil directly or as blends will have a long shelflife and other desirable properties (Ong and Goh, 2002).
Soybean oil is obtained from the raw bean by solventextraction andit is the world's leading vegetable oil in termsof both production and consumption. Soybean oil hasconsiderable nutritional properties. It has both n-6 and n-3fatty acids. It is a good source of vitamin E. Sunflower oil isthe non-volatile oil expressed from sunflower seeds.Sunflower oil is commonly used in food as frying oil.Sunflower oil is high in the essential vitamin E and low insaturated fat. A study by a group of researchers in Chinacomparing palm, soybean, peanut oils and lard showed thatpalm oil actually increased the levels of good cholesterol andreduced the levels of bad cholesterol in the blood (Koh,2006).
MATERIALS AND METHODS
Three different vegetable oils (T1: palm oil, T2: soybeanoil and T3: sunflower oil) and two food products namelyNamak Para and Sev were selected for the study. All the rawingredients were collected from the local market ofAllahabad. The recipes were prepared as follows:
1) Namak Para: All the raw ingredients viz., refined flour,baking soda, salt, ajwain an oil were mixed together and ahard dough was prepared with water. From the dough,chappatis were prepared and cut into square shapes and friedin oil till golden brown.
J. Oilseeds Res., 36(4) : 240-243, Dec., 2019 240
PHYSICO-CHEMICAL AND ORGANOLEPTIC PROPERTIES OF PALM OIL AND OTHER OILS
2) Sev: Raw ingredients such as bengal gram flour, chillipowder, ajwain, salt and oil were mixed together and a softdough was prepared. Part of dough was filled in sev makerand deep fried till golden. Sev were crushed and stored incontainer.
The organoleptic characteristics of the developedproducts were analyzed in five replications, using 9 pointHedonic Scale by five panel members randomly selectedfrom the Department of Food Nutrition and Public Health,SHUATS, Prayagraj, Uttar Pradesh, India. The cost of thedeveloped products was calculated at the prevailing prices ofraw materials purchased from the local market.
The physico-chemical parameters of selected oils wereanalyzed, in three replications, using standard procedureswhich were as follows:
3) Acid value: 50 mL of neutral alcohol was added to 10mL of oil and boiled in water bath. Then, 1mL ofphenolphthalein was added into the solution and stirred fora while and titrated while hot against the standard 0.1NNaOH solution. The end point was noted when the pink colorpersisted for about 30 seconds. The acid value wasdetermined on the basis of the following formula:
Acid value = 56.1×V×N --------------
Wwhere, 56.1 is gm equivalent of KOH; V is the volume ofstandard alkali used; N is the normality of the standard alkaliused and W is weight of oil taken (Anonymous, 1979).
4) Peroxide value: Five g (±50 mg) of the sample wasweighed into a 250 ml stoppered conical flask with stoppercock. Thirty ml of acetic acid chloroform solvent was addedto the mixture and swirled to dissolve. 0.5 ml of saturatedpotassium iodide solution was added with a Mohr pipette.After letting it stand for 1min in dark with occasionalshaking, 30 ml of water was added. The liberated iodine wastitrated with 0.1 N sodium thiosulphate solution, withvigorous shaking until yellow colour was almost gone. 0.5 mlof starch solution was added as an indicator and titrated untilblue colour disappeared.
Peroxide value= (V-V0) × N× 100 ----------------------
Wwhere V is the titre value (mL) of sodium thiosulphatesolution for sample, V0 the titre value (mL) of sodiumthiosulphate solution for blank, N the normality of sodiumthiosulphate solution and W the weight of sample in gram(Anonymous, 2000).
5) Specific Gravity: A density bottle was used which wasa slightly round bottomed type of glass vessel fitted with a
glass cork containing a fine capillary. The bottle was firstwashed with chromic acid solution then with distilled waterand finally with alcohol. Then it was dried and weighed. Thebottle was then filled with distilled water and a stopper wasfitted without any air bubble. The bottle was again weighed.Water was then poured out and washed with alcohol anddried. The bottle was then filled with sample as before andweighed again.
Specific Gravity= Density of oil sample = W3-W1
------------------------------------------ Density of water W2-W1
Where W3 is weight of bottle with oil sample; W2 is weightof bottle with water; W1 is weight of empty bottle(Anonymous, 2000a).
6) b-carotene extraction and analysis: The b-carotene wasdetermined by soaking 1 g of the sample (that is the paste orpulp of the fresh fruits) in 5 ml of methanol for 2 h at roomtemperature under dark condition in order to get a completeextraction. The b-carotene layer was separated using hexanethrough separating funnel. The volume was made up to 10 mlwith hexane and then this layer was again passed throughsodium sulphonate through a funnel in order to remove anymoisture from the layer. The absorbance of the layer wasmeasured at 436 nm using hexane as a blank. The b-carotenewas calculated using the formula:
b-carotene (?g/100g) = Absorbance(436 nm) x V x D x 100 x 100---------------------------------------------------------------------------------
W x Y
where: V = Total volume of extract; D = Dilution factor; W=Sample weight; Y=Percentage dry matter content of thesample (Ranganna, 1999).
7) Percentage of oil absorption: Oil absorption wasdetermined by using the Soxhlet method based on oilextraction by using petroleum ether as the solvent, andweighing the collected fat. The determination was conductedin duplicates. Oil absorption percentage was expressed as oilcontent (o) and average oil content (O) and quantified as
O= (Wf-We) x100-------------------
(W0-We)
where W f and W 0 are the mass (g) of the final and initialsamples, respectively; We is the mass of the empty glasscartridge (Pardun, 1969).
8) The data obtained from the experiment was statisticallyanalyzed using analysis of variance technique Two-WayClassification and Critical Difference.
J. Oilseeds Res., 36(4) : 240-243, Dec., 2019 241
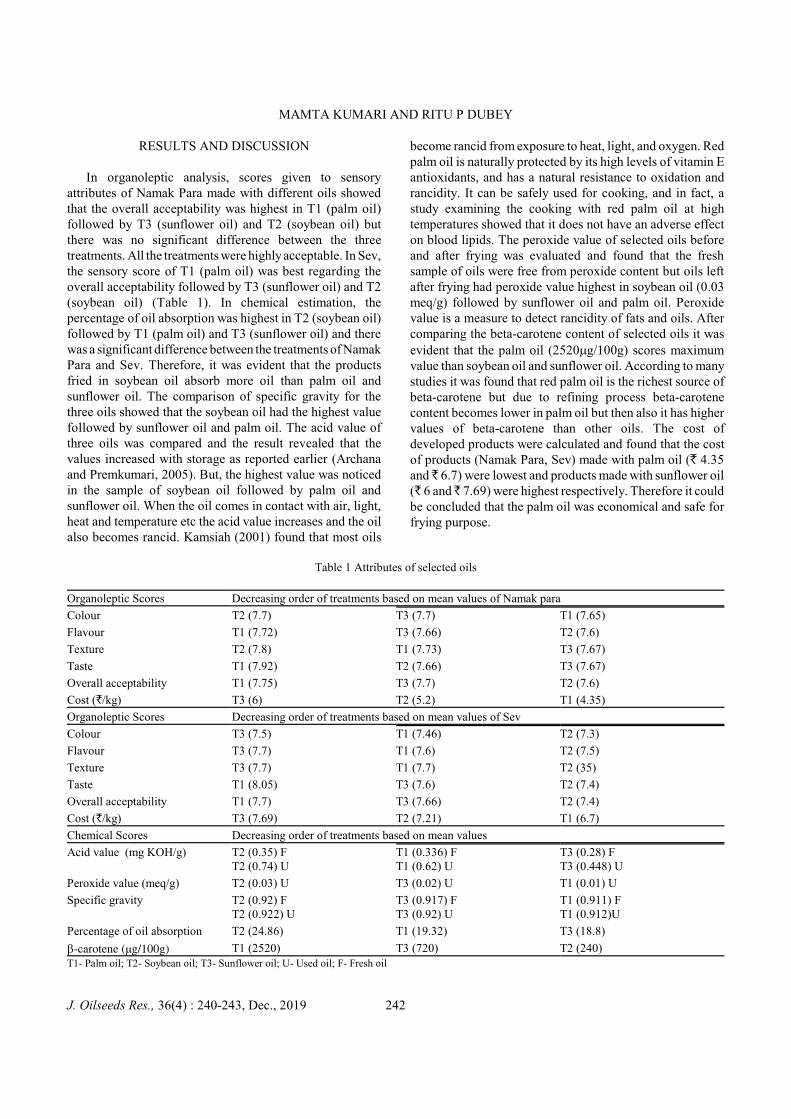
MAMTA KUMARI AND RITU P DUBEY
RESULTS AND DISCUSSION
In organoleptic analysis, scores given to sensoryattributes of Namak Para made with different oils showedthat the overall acceptability was highest in T1 (palm oil)followed by T3 (sunflower oil) and T2 (soybean oil) butthere was no significant difference between the threetreatments. All the treatments were highly acceptable. In Sev,the sensory score of T1 (palm oil) was best regarding theoverall acceptability followed by T3 (sunflower oil) and T2(soybean oil) (Table 1). In chemical estimation, thepercentage of oil absorption was highest in T2 (soybean oil)followed by T1 (palm oil) and T3 (sunflower oil) and therewas a significant difference between the treatments of NamakPara and Sev. Therefore, it was evident that the productsfried in soybean oil absorb more oil than palm oil andsunflower oil. The comparison of specific gravity for thethree oils showed that the soybean oil had the highest valuefollowed by sunflower oil and palm oil. The acid value ofthree oils was compared and the result revealed that thevalues increased with storage as reported earlier (Archanaand Premkumari, 2005). But, the highest value was noticedin the sample of soybean oil followed by palm oil andsunflower oil. When the oil comes in contact with air, light,heat and temperature etc the acid value increases and the oilalso becomes rancid. Kamsiah (2001) found that most oils
become rancid from exposure to heat, light, and oxygen. Redpalm oil is naturally protected by its high levels of vitamin Eantioxidants, and has a natural resistance to oxidation andrancidity. It can be safely used for cooking, and in fact, astudy examining the cooking with red palm oil at hightemperatures showed that it does not have an adverse effecton blood lipids. The peroxide value of selected oils beforeand after frying was evaluated and found that the freshsample of oils were free from peroxide content but oils leftafter frying had peroxide value highest in soybean oil (0.03meq/g) followed by sunflower oil and palm oil. Peroxidevalue is a measure to detect rancidity of fats and oils. Aftercomparing the beta-carotene content of selected oils it wasevident that the palm oil (2520mg/100g) scores maximumvalue than soybean oil and sunflower oil. According to manystudies it was found that red palm oil is the richest source ofbeta-carotene but due to refining process beta-carotenecontent becomes lower in palm oil but then also it has highervalues of beta-carotene than other oils. The cost ofdeveloped products were calculated and found that the costof products (Namak Para, Sev) made with palm oil (` 4.35and ̀ 6.7) were lowest and products made with sunflower oil(` 6 and ̀ 7.69) were highest respectively. Therefore it couldbe concluded that the palm oil was economical and safe forfrying purpose.
Table 1 Attributes of selected oils
Organoleptic Scores Decreasing order of treatments based on mean values of Namak para
Colour T2 (7.7) T3 (7.7) T1 (7.65)
Flavour T1 (7.72) T3 (7.66) T2 (7.6)
Texture T2 (7.8) T1 (7.73) T3 (7.67)
Taste T1 (7.92) T2 (7.66) T3 (7.67)
Overall acceptability T1 (7.75) T3 (7.7) T2 (7.6)
Cost (`/kg) T3 (6) T2 (5.2) T1 (4.35)
Organoleptic Scores Decreasing order of treatments based on mean values of Sev
Colour T3 (7.5) T1 (7.46) T2 (7.3)
Flavour T3 (7.7) T1 (7.6) T2 (7.5)
Texture T3 (7.7) T1 (7.7) T2 (35)
Taste T1 (8.05) T3 (7.6) T2 (7.4)
Overall acceptability T1 (7.7) T3 (7.66) T2 (7.4)
Cost (`/kg) T3 (7.69) T2 (7.21) T1 (6.7)
Chemical Scores Decreasing order of treatments based on mean values
Acid value (mg KOH/g) T2 (0.35) FT2 (0.74) U
T1 (0.336) FT1 (0.62) U
T3 (0.28) FT3 (0.448) U
Peroxide value (meq/g) T2 (0.03) U T3 (0.02) U T1 (0.01) U
Specific gravity T2 (0.92) FT2 (0.922) U
T3 (0.917) FT3 (0.92) U
T1 (0.911) FT1 (0.912)U
Percentage of oil absorption T2 (24.86) T1 (19.32) T3 (18.8)
b-carotene (ìg/100g) T1 (2520) T3 (720) T2 (240)T1- Palm oil; T2- Soybean oil; T3- Sunflower oil; U- Used oil; F- Fresh oil
J. Oilseeds Res., 36(4) : 240-243, Dec., 2019 242
PHYSICO-CHEMICAL AND ORGANOLEPTIC PROPERTIES OF PALM OIL AND OTHER OILS
Based on this study, it could be concluded that palm oilwas found to be the most acceptable in terms of overallacceptability in comparison with other selected oils. The costof products made with palm oil was cheaper than other oils.In addition, as the palm oil is loaded with otherphytonutrients protective to health, such as, tocotrienols,carotenoids, phytosterols etc. incorporation of palm oil inrecipes of daily diet can be recommended to risk (vulnerable)groups (preschool, adolescent, pregnant and lactatingmothers) in order to improve their health.
REFERENCES
Anonymous 1979. ISI Handbook of Food Analysis (PartXIII)-1984 Page 67/ IUPAC 2.201(1979) / I.S: 548 (Part 1)- 1964, Methods of Sampling and Test for Oils and Fats/ ISO660:1996 Determination of acid value and acidity.
Anonymous 2000. AOAC, 17th Edn, Official Method 965.33Peroxide Value in Oils and Fats / Pearsons Composition andAnalysis of Foods 9th Edn, pp.641.
Anonymous 2000a. AOAC, 17th Edn, 2000, Official method920.212 Specific gravity (Apparent) of Oils, Pycnometermethod / I.S.I. Hand book of Food analysis (PartXIII) 1984,page 72.
Anonymous 2016. Palm Oil Production. (2016) European Palm OilAl l i an ce . h t t p s : / /www.p almo i l an d fo o d . eu / en /palm-oilproduction.
Anonymous 2016a. Oilseeds 2016. World Markets and Trade.United States Department of Agriculture: ForeignAgricultural Service.
Archana U and Premkumari S 2005. Physico-chemicalcharacteristics of vegetable oil and their blends with respectto nutritional significance. Indian Journal of Nutrition andDietetics, 78-82.
Kamsiah J 2001. Changes in serum lipid profile andmalondialdehyde following consumption of fresh or heatedred palm oil. Proceedings of Food Technology and NutritionConference, International Palm Oil Congress, Kuala Lumpur,Malaysia, pp. 22-28.
Koh C S 2006. Diet, Nutrition and the prevention of chronicdiseases. http://www.who.int/dietphysicalactivity.
Ong A S H and Goh S H 2002. Palm oil: A healthful andcost-effective dietary component. Food and NutritionBulletin, pp. 11-22.
Pardun H 1969. Analyse der Fette und Fettbegleitstoffe. SpringerVerlag, Berlin, Heidelberg, New York, pp. 419-421.
Phoon K Y, Ng H S, Zakaria R, Yim H S, Mokhtar M N 2018.Enrichment of minor components from crude palm oil andpalm-pressed mesocarp fibre oil via sequentialadsorption-desorption strategy. Indian journal of CropsProduction, 113:187-195.
Ranganna S 1999. Handbook of analysis and quality control forfruit and vegetable products. Tata Mc-Graw Hill publishingcompany Ltd., New Delhi.
Tan C P and Nehdi I A 2012. The Physicochemical Properties ofPalm Oil and Its Components. Palm Oil. pp. 377-391.
J. Oilseeds Res., 36(4) : 240-243, Dec., 2019 243
An application of ARIMAX model for forecasting of castor production in India
R VIJAYA KUMARI, G RAMAKRISHNA, VENKATESH PANASA AND A SREENIVAS
College of Agriculture, Professor Jayashankar Telangana State Agricultural University, Hyderabad-500 030, Telangana
(Received: October 18, 2019; Revised: December 20, 2019; Accepted: December 23, 2019)
ABSTRACT
When an ARIMA model includes other time series as input variables, the model is referred to as an ARIMAXmodel. The autoregressive integrated moving average with exogenous variable (ARIMAX) model can take theimpact of covariates on the forecasting into account, improving the comprehensiveness and accuracy of theprediction. In this paper, ARIMAX model has been applied to forecast castor production in India which includestime series data on rainfall as input exogenous variable. ARIMAX (111) is found to be the best model for futureprojections of castor production in India. The analysis of 53 years data from 1966-67 to 2018-19 predicted thatcastor production may increase to 1547.05 thousand tonnes by the year 2020-21 and 1674.90 thousand tonnes bythe year 2021-22.
Keywords: ARIMAX model, Forecasting, Mean absolute percentage error, Partial autocorrelation functions
The ARIMAX model was originally proposed by Boxand Tiao (1975) for their study on the effect of gas inputvelocities on CO2 output concentrations. The model is mainlyapplied to stock forecasting, macroscopic prediction oftraffic accidents and disease prediction in domestic andforeign studies. At present, only a handful of studies haveapplied the ARIMAX model to short-term productionforecasting. When an ARIMA model includes other timeseries as input variables, the model is referred to as anARIMAX model (Pankratz, 1991).
Forecasting a response series using an ARIMA modelwith exogenous variables whose values correspond to theforecast periods may generate price forecasts driven by theseshocks, captured through the selected critical variable.ARIMA-X (ARIMAX) model includes exogenous covariates(input variables in the forms of external shocks resultingfrom climate, production/supply, marketing/trade policychanges etc.) along with the dependent variable (prices, inthis case) of the time series observation. In this paper,ARIMAX model has been applied to forecast castorproduction in India which uses time series data on rainfall asinput variable. Autoregressive integrated moving average(ARIMA) forecasting model is the most popular and widelyused forecasting model for uni-variate time series data.Although it is applied across various functional areas, itsapplication is very limited in agriculture, mainly due to non- availability of required data and also due to the fact thatagricultural product depends typically on monsoonal rain andother factors, which the ARIMA models failed toincorporate.
Castor is mostly grown in arid and semi-arid regions. Itis cultivated in 30 different countries on commercial scale ofwhich India, China, Brazil, Russia, Thailand, Ethiopia andPhilippines are major castor seed growing countriesaccounting for nearly 88 % of the world's production. AllIndia kharif oilseeds sown area was reported as 173.34 lakh
ha in 2019 as against 173.55 lakh ha in the correspondingperiod of last year. Castor area was reported as 7.63 lakh haduring kharif in 2019 as against 6.46 lakh ha during the sameperiod of last year. In India, major castor producing statesare Gujarat (5.77 lakh ha), Rajasthan (1.14 lakh ha), AndhraPradesh (0.30 lakh ha), Telangana (0.22 lakh ha) and Odisha(0.04 lakh ha). In India castor oil exports were 2.36 lakh MTfrom April to August 2019 which is 12.27 per cent lowerthan last year exports of 2.69 lakh MT during the sameperiod. Keeping in view the growing importance of castorcrop and export potential, it is felt to estimate the futureproduction of castor in India in the present paper.
Kumar et al. (2001) studied the effect of differentweather variables on wheat yield and found that maximumtemperature was negatively correlated with yield of late sownwheat in Tarai region. Wangdi, et al. (2010) used ARIMAmodel to forecast the number of cases of malaria in endemicareas of Bhutan and further employed the ARIMAX modelto determine the predictors (meteorological factors). Theirfindings revealed that the mean maximum temperaturelagged at one month was a strong positive predictor of anincreased malaria cases for four out of seven districts understudy. Durka and Pastorekova (2012) conducted a study totest which approach is better between ARIMA and ARIMAXin the analysis and forecast of macroeconomic time series inSlovakia. Tsingotis et al. (2012) examined how informationon weather affects the performance of short-term trafficforecasting models. Using several vector ARMAX models toevaluate effects of weather and traffic mix on thepredictability of traffic speed, they concluded that inclusionof exogenous variables in the forecasting models marginallyimproved their prediction performance, while modelinginnovations such as vector and Bayesian estimation improvesthe model significantly. Paul et al. (2013) demonstrated thatthe ARIMAX methodology is able to provide pre-harvestforecasts based on weather variables at various stages of
J. Oilseeds Res., 36(4) : 244-249, Dec., 2019 244
AN APPLICATION OF ARIMAX MODEL FOR FORECASTING OF CASTOR PRODUCTION IN INDIA
wheat crop growth, starting from CRI stage (21 days aftersowing) to dough stage (126 days after sowing). It isobserved that, as wheat crop grows towards maturity;pre-harvest forecasts get closer to actual values. Hamjah(2014) measured the climatic and hydrological effects oncash crop production in Bangladesh. Using these factors asinput variables he found that climatic effects have significantimpact on crops production. Sanjeev and Urmil (2016)studied ARIMA versus ARIMAX modeling for sugarcaneyield prediction in Haryana and found that the ARIMAXmodel performed well with lower error metrics as comparedto the ARIMA model in all time regimes.
MATERIALS AND METHODS
Data description: The time series data pertaining to theproduction and mean annual rainfall of castor crop werec o l l e c t e d f r o m t h e I M D a n d w e b s i t e :http://www.indiastat.com for the period of 53 years i.e., from1966-67 to 2018-2019.Pearson's correlation analysis: Pearson's correlationcoefficient is a type of linear correlation coefficient,reflecting the linear correlation level between two variables.The value of Pearson's correlation coefficient r is between -1and 1. If r>0, then the two variables are positively correlated.If r<0, then the two variables are negatively correlated. Thelarger absolute value of r represents the higher correlationlevel. However, if r=0, the result means that the twovariables are not linearly correlated.
Autoregressive integrated moving average (ARIMA) model:A generalization of ARMA models which incorporate a wideclass of non-stationary time-series is obtained by introducingthe differencing into the model. ARIMA econometricmodeling takes into account historical data and decomposesit into an autoregressive (AR) process where there is amemory of past events and integrated (I) process whichaccounts for stabilizing or making the data stationary,making it easier to forecast, and a moving average (MA) offorecast errors, such that the longer the historical data, themore accurate forecast will be as it learns from over time.The simplest example of a non-stationary process whichreduces to a stationary one after differencing is RandomWalk. A process { yt } is said to follow an Integrated ARMAmodel, denoted by ARIMA (p, d, q).
The ARIMA methodology is carried out in three stagesviz., identification, estimation and diagnostic checking.Parameters of the tentatively selected ARIMA model at theidentification stage are estimated at the estimation stage andadequacy of tentatively selected model is tested at thediagnostic checking stage. If the model is found to beinadequate, the three stages are repeated until satisfactoryARIMA model is selected for the time-series underconsideration.
ARIMAX model: When an ARIMA model includes othertime series as input variables, the model is sometimesreferred to as an ARIMAX model i.e., in addition to pastvalues of the response series and past errors, the responseseries is modeled using the current and past values of inputseries.An ARIMAX form of the model is presented as followsBased on the ARIMA model, ARIMAX model can take theimpact of covariates into account by adding the covariate tothe right hand of the ARIMA model equation.The equation of ARIMAX model is presented as follows:
Initially, it is required to test the stability of the responseseries. If the stationary condition is not satisfied, thenon-stationary can be removed by an initial differencing step.Calculate the statistics describing the characteristics of theresponse series, for example, ACF and PACF, to determinethe parameters p and q. Estimate the unknown parameters ofthe model and test the significance as well as the residualseries. Conduct the same procedure to the input series as theresponse series. Estimate the cross correlation coefficientbetween the response series and the input series to determinethe configuration of the ARIMAX model. Establishdiagnostic analysis to verify that the model corresponds tothe characteristics of the data.
The ARIMAX model concept requires testing ofstationarity of exogenous variable before modeling. Thetransformed variable is added to the ARIMA model in thesecond step, in which the lag length r is also estimated.Nonlinear least squares estimation procedure is employed toestimate the parameters of ARIMAX model (Bierens 1987).Fortunately, the ARIMAX model can be fitted to data byusing a software package, like SAS, MATLAB, EViews andR. In the present investigation, SAS, Version 9.3 is used fordata analysis.
Validation of the Forecasts: It is important toevaluate/validate the forecasts obtained in terms of accuracyof the predicted values. The commonly used measures forvalidation are Mean Absolute Error (MAE), Root MeanSquared Error (RMSE) and Standard Error. In this study,validation of the forecasts was done by computing MAPE(Mean Absolute Percentage Error) for the hold out data as itis a scale independent measure.
Where, At is the actual value and Ft is the forecast values ofprices.
The estimates of parameters along with correspondingstandard error and p-value of selected model were workedout. The best forecast models were selected based on Akaike
J. Oilseeds Res., 36(4) : 244-249, Dec., 2019 245
VIJAYA KUMARI ET AL.
Information Criteria (AIC) / Schwartz Bayesian Criteria(SBC). The residuals of fitted models were examined foradequacy of fitted model. The final forecasts were validatedby using lower MAPE value.
The Akaike information criterion (AIC) and Bayesianinformation criterion (BIC) values for ARIMA model arecomputed by:
Akaike's information criterion (AIC):
where is the estimatedvariance of et.
Schwarz's Bayesian Information criterion (SC, BIC, orSBC):
Usually, the model with the smallest AIC or BIC valuesare preferred. However, the two criteria differ in theirtrade-off between fit and parsimony; the BIC criterion can bepreferred because it has the property that it will almost surelyselect the true model.
ACF and PACF plots of the residuals: In themodel-building process, if an ARIMA (p, d, q) model ischosen (based on the ACFs and PACFs), some checks on themodel adequacy are required. A residual analysis is usuallybased on the fact that the residuals of an adequate modelshould be approximately white noise. Therefore, checkingthe significance of the residual autocorrelations andcomparing with approximate two standard error bounds, i.e., ±2/%n are need.
RESULTS AND DISCUSSION
Pearson correlation coefficient between price and rainfallis presented in Table 1. It clearly shows the significantlypositive correlation that exists` between price and rainfall.Castor is mostly grown as rainfed crop and its production ismainly dependent on rainfall, hence time series data onrainfall was taken as input exogenous variable.
The input series for ARIMAX needs to be stationary. Astationary series should have a constant mean, variance, andautocorrelation through time. The purpose of identificationphase is to determine the differencing required for producingstationary and also the order of non seasonal AR and MAoperators for a given series. When the observed time seriespresents trend, differencing and transformation are oftenapplied to the data to remove the trend and stabilize variancebefore an ARIMAX model can be fitted. The input time
series show upward trend with spike (Fig. 1). Then wedifferentiated one-time non-seasonal and one-time seasonal,the result being stabilized over mean (Fig. 2).
Cross correlation estimation: The most critical part offitting the ARIMAX model is to test the cross correlationbetween the response series and the input series. Figure 3shows the result of the cross correlation of data betweencastor production and annual average rainfall in India. Theresult shows that the value of two lags is significant. Thus, aselection up to lag=2 is adequate for the ARIMAX model.
Estimation and testing: Estimation stage consists of usingthe data to estimate and make inferences about parameters oftentatively identified model. The parameters are estimatedsuch that an overall measure of residuals is minimized. Thelast stage of model building is the testing or diagnosticchecking of model adequacy. This stage determines whetherresiduals are independent, homoscedastic and normallydistributed. Several diagnostic statistics and plots of theresiduals are used to examine the goodness of fit. Afteridentifying tentative model, the process is again followed bythe stage of parameter estimation and model verification.Diagnostic information may help to suggest alternativemodel(s). Now, when the series was stationary and severalmodels were selected based on their ability of reliableprediction. On examining its autocorrelation functions (ACF)and partial autocorrelation functions (PACF) andsignificance of AR and MA parameters, the ARIMAX (111)model was found suitable. Parameter estimates along withcorresponding standard errors of fitted ARIMAX (111)model are presented in Table 2. Similarly, diagnosticchecking was done through minimum of Akaike InformationCriteria (AIC), Schwarz Bayesian Criteria (SBC or BIC) and MAPE values also calculated for holdout data (5 number or10 percent of observations are holdout for MAPEcalculation) (Table 3).
Forecasting: From the above models, we further streamlinedthe model by looking at the residual, in order to knowwhether the model had white noise. If the model had whitenoise then it could be used for forecasting. The residual ofARIMAX (111) showed white noise (see Fig 5). Our nextobjective was to predict the 2 future values of time series.Table 2 shows yearly forecasted results with confidencelimits for time series. Production of castor, in India usingARIMAX (111) is found to be the best model for futureprojections. It is predicted that the castor production wouldbe increasing to 1674.90 thousand tonnes by the year2021-22 (Table 4 and Fig. 5).
The foregoing analysis of time series data on castorproduction in India from 1966-97 to 2018-19 to forecastfuture production using econometric models clearly revealed
J. Oilseeds Res., 36(4) : 244-249, Dec., 2019 246
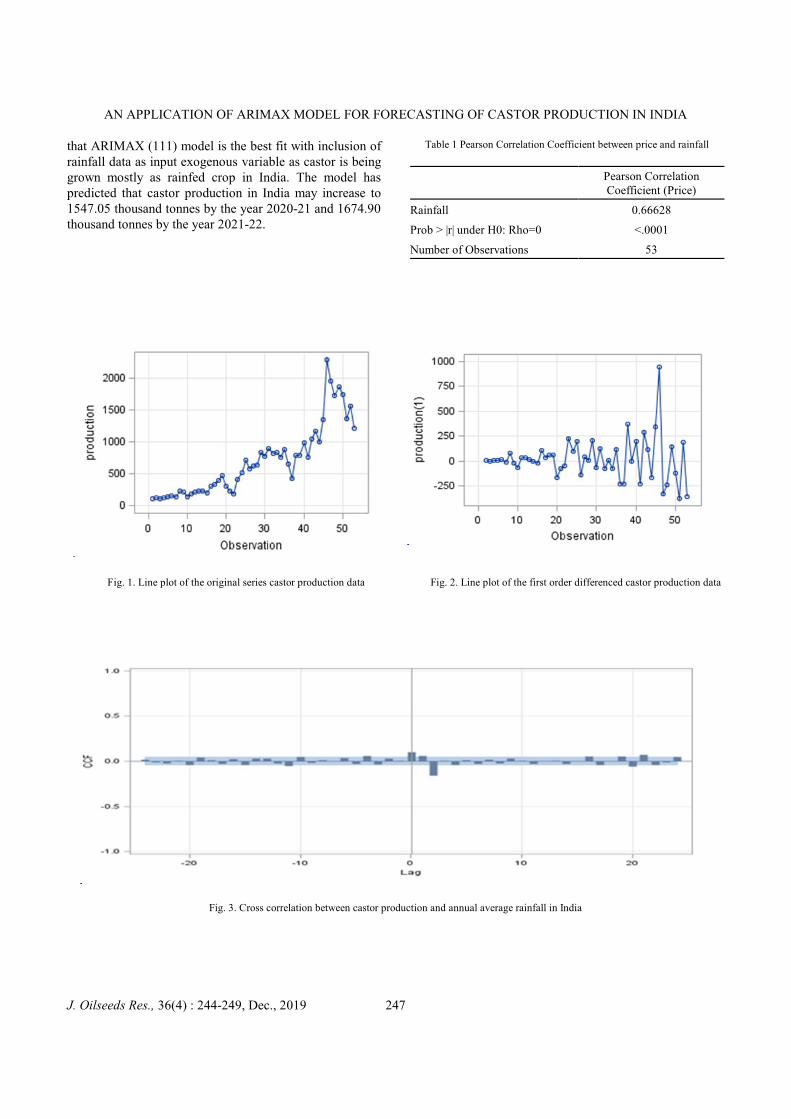
AN APPLICATION OF ARIMAX MODEL FOR FORECASTING OF CASTOR PRODUCTION IN INDIA
that ARIMAX (111) model is the best fit with inclusion ofrainfall data as input exogenous variable as castor is beinggrown mostly as rainfed crop in India. The model haspredicted that castor production in India may increase to1547.05 thousand tonnes by the year 2020-21 and 1674.90thousand tonnes by the year 2021-22.
Table 1 Pearson Correlation Coefficient between price and rainfall
Pearson CorrelationCoefficient (Price)
Rainfall 0.66628
Prob > |r| under H0: Rho=0 <.0001
Number of Observations 53
Fig. 1. Line plot of the original series castor production data Fig. 2. Line plot of the first order differenced castor production data
Fig. 3. Cross correlation between castor production and annual average rainfall in India
J. Oilseeds Res., 36(4) : 244-249, Dec., 2019 247
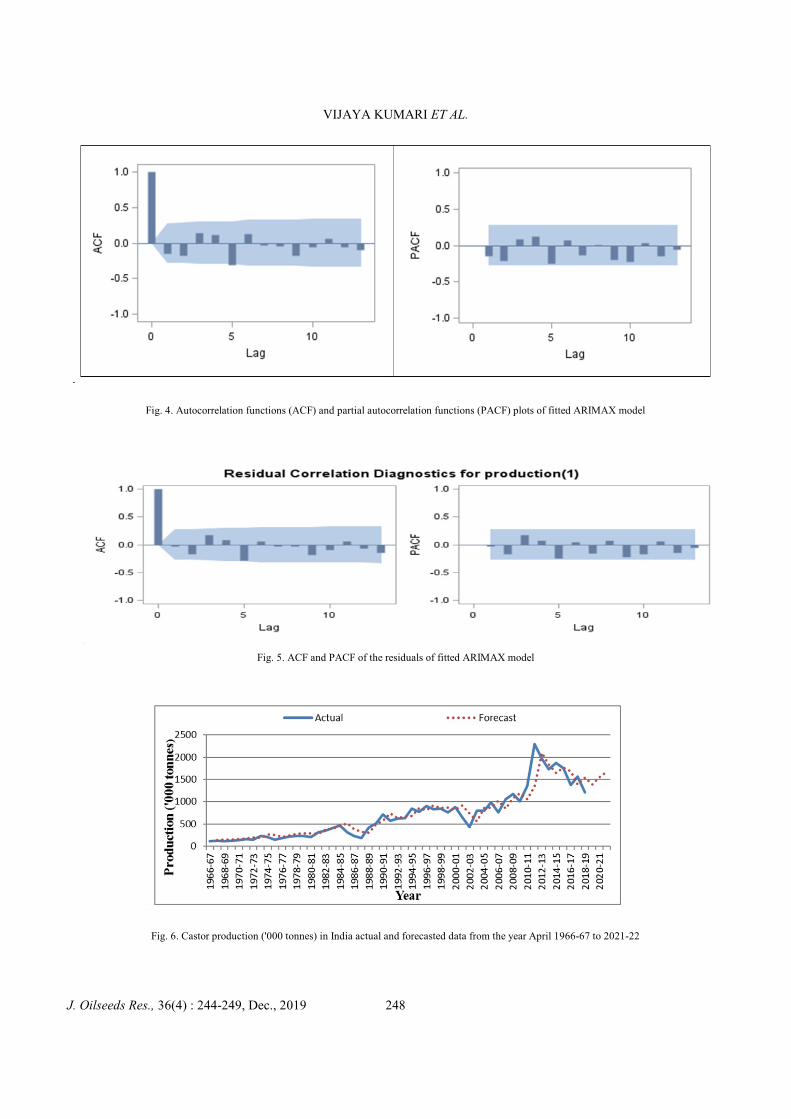
VIJAYA KUMARI ET AL.
Fig. 4. Autocorrelation functions (ACF) and partial autocorrelation functions (PACF) plots of fitted ARIMAX model
Fig. 5. ACF and PACF of the residuals of fitted ARIMAX model
Fig. 6. Castor production ('000 tonnes) in India actual and forecasted data from the year April 1966-67 to 2021-22
J. Oilseeds Res., 36(4) : 244-249, Dec., 2019 248
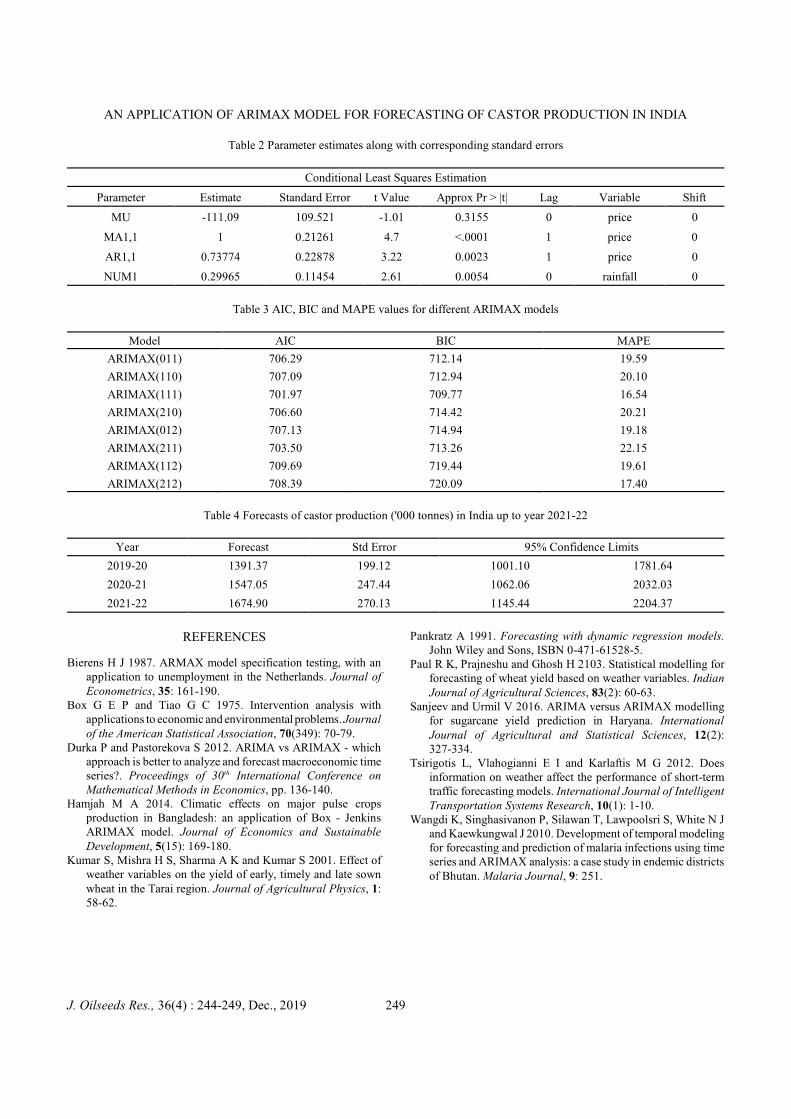
AN APPLICATION OF ARIMAX MODEL FOR FORECASTING OF CASTOR PRODUCTION IN INDIA
Table 2 Parameter estimates along with corresponding standard errors
Conditional Least Squares Estimation
Parameter Estimate Standard Error t Value Approx Pr > |t| Lag Variable Shift
MU -111.09 109.521 -1.01 0.3155 0 price 0
MA1,1 1 0.21261 4.7 <.0001 1 price 0
AR1,1 0.73774 0.22878 3.22 0.0023 1 price 0
NUM1 0.29965 0.11454 2.61 0.0054 0 rainfall 0
Table 3 AIC, BIC and MAPE values for different ARIMAX models
Model AIC BIC MAPE
ARIMAX(011) 706.29 712.14 19.59
ARIMAX(110) 707.09 712.94 20.10
ARIMAX(111) 701.97 709.77 16.54
ARIMAX(210) 706.60 714.42 20.21
ARIMAX(012) 707.13 714.94 19.18
ARIMAX(211) 703.50 713.26 22.15
ARIMAX(112) 709.69 719.44 19.61
ARIMAX(212) 708.39 720.09 17.40
Table 4 Forecasts of castor production ('000 tonnes) in India up to year 2021-22
Year Forecast Std Error 95% Confidence Limits
2019-20 1391.37 199.12 1001.10 1781.64
2020-21 1547.05 247.44 1062.06 2032.03
2021-22 1674.90 270.13 1145.44 2204.37
REFERENCES
Bierens H J 1987. ARMAX model specification testing, with anapplication to unemployment in the Netherlands. Journal ofEconometrics, 35: 161-190.
Box G E P and Tiao G C 1975. Intervention analysis withapplications to economic and environmental problems. Journalof the American Statistical Association, 70(349): 70-79.
Durka P and Pastorekova S 2012. ARIMA vs ARIMAX - whichapproach is better to analyze and forecast macroeconomic timeseries?. Proceedings of 30th International Conference onMathematical Methods in Economics, pp. 136-140.
Hamjah M A 2014. Climatic effects on major pulse cropsproduction in Bangladesh: an application of Box - JenkinsARIMAX model. Journal of Economics and SustainableDevelopment, 5(15): 169-180.
Kumar S, Mishra H S, Sharma A K and Kumar S 2001. Effect ofweather variables on the yield of early, timely and late sownwheat in the Tarai region. Journal of Agricultural Physics, 1:58-62.
Pankratz A 1991. Forecasting with dynamic regression models.John Wiley and Sons, ISBN 0-471-61528-5.
Paul R K, Prajneshu and Ghosh H 2103. Statistical modelling forforecasting of wheat yield based on weather variables. IndianJournal of Agricultural Sciences, 83(2): 60-63.
Sanjeev and Urmil V 2016. ARIMA versus ARIMAX modellingfor sugarcane yield prediction in Haryana. InternationalJournal of Agricultural and Statistical Sciences, 12(2):327-334.
Tsirigotis L, Vlahogianni E I and Karlaftis M G 2012. Doesinformation on weather affect the performance of short-termtraffic forecasting models. International Journal of IntelligentTransportation Systems Research, 10(1): 1-10.
Wangdi K, Singhasivanon P, Silawan T, Lawpoolsri S, White N Jand Kaewkungwal J 2010. Development of temporal modelingfor forecasting and prediction of malaria infections using timeseries and ARIMAX analysis: a case study in endemic districtsof Bhutan. Malaria Journal, 9: 251.
J. Oilseeds Res., 36(4) : 244-249, Dec., 2019 249
Optimum plot size for oil palm (Elaeis guineensis Jacq.) field experiments
MANORAMA KAMIREDDY1*, CHANDRAN K P2, RAVI KUMAR MATHUR1,KANCHERLA SURESH1 AND SANJIB KUMAR BEHERA3
1ICAR-Indian Institute of Oil palm Research, Pedavegi, West Godavari District-534 450, Andhra Pradesh
(Received: October 24, 2019; Revised: December: December 11, 2019; Accepted: December 13, 2019)
ABSTRACT
For standardization of water and nutrient requirements of oil palm field experimentation is essential. In orderto get accurate results from the field experimentation optimal plot size is very important. Not much work has beendone on these lines to find out the optimum size of the plot for field experimentation in oil palm. In the presentstudy, two statistical methods were employed and compared to find out the optimal plot size for conducting fieldexperiments in oil palm under Indian conditions using 6 years yield data from ICAR-Indian Institute of Oil palmResearch. Oil palm yield is measured in FFBs (fresh fruit bunches) and the FFB number and yield data of individualpalms was collected from 10 different cross combinations having three replications and 270 palms. Two statisticalprocedures were employed on these data viz., Mean Square Error (MSE) and Maximum curvature method. Fromboth these methods, 7 palms per plot were found to be the optimum size in oil palm for field experiments. As bothMSE and maximum curvature of coefficient of variation methods have given same result, if secondary data isavailable for any other tree crops, one of these two methods can be employed for finding out the optimum plot size.
Keywords: CV, Maximum curvature, Mean square error, Oil palm, Optimum plot size
Oil palm is a tall tree which grows up to 10-12 m heightwith a radial spread of up to 6 -7 m from the centre. Itseconomic life span is 30-35 years, which stresses the needfor more accurate recommendations in order to harvest betteryields. It has been proved that it is far more efficient than allother oil crops in terms of oil yield and land usage (Murphy2014). Cultivation of oil palm, by giving irrigation is aunique practice in the world and is being followed only inIndia (Kalidas et al., 2014). Besides laboratory studies, mostof the technologies need field level testing for obtaining mostappropriate and accurate recommendations with reasonableconfidence. Oil palm is cultivated in about 18 million haworldwide and a huge number of research institutes areworking on it for improving the productivity and net profit.Conducting field experiments in perennial crops like oil palmis a difficult task because of its perennial nature andrequirement of large area and other inputs. Experiments withinsufficient plot size or insufficient palm numbers may notgive accurate results and thereby the conclusions drawn may not be correct. This can lead to incorrect recommendationswhich may cause reduction in yield and/or enhancedenvironmental degradation. Hence, identification of optimalplot size for field experimentation in oil palm holds the keyfor accuracy in results.
The plot is that part of the trial to which a singletreatment is applied and on which observations are made(Saste and Sanense, 2015). Different authors used differentmethods to find out the optimal plot size in crops. Very littlework is done to find out the efficient plot size for conductingfield experiments in tree crops especially plantation crops.To determine the most efficient plot size for tree crops Peirisand Thattil (1997) proposed two methodologies using data
from experiments based on randomized complete blockdesign and reported that efficient plot size in fieldexperiments for coconut in Sri Lanka was four or six palmsin different agro-climatic regions. Bowman (2001)determined the best plot size in uniformity trials to measurestability of phenotypes or measure variation in otherindividual or population attributes and Polson (1964)compared three methods viz., comparable variance, Smith'sregression method and Hathaway's convenient plot sizemethod to determine optimum plot size in safflower andconcluded that all three methods were in fairly goodagreement. This shows that different researchersrecommended different methods for estimating optimal sizein different crops.
Generally, the plot size depends on soil heterogeneity asthe source of variation. But in case of oil palm in addition tosoil characteristics, the non-uniformity of experimentalmaterial due to segregating properties of D x P teneras isanother source of variation while deciding the optimal plotsize. Hence, estimating an optimum size of plot for oil palmfield experiments assumes greater significance. Generally, inmost of the crops, Uniformity trials are used to determine theoptimum size and shape of the plots to minimize thevariation that occurs due to different factors. But, in oil palm(and other tree crops) conducting a separate uniformity trialfor calculating optimum plot size is very difficult as it is verytime consuming and requires lot of land and other inputs. Atpresent, field trials are being conducted in oil palm withdifferent plot sizes (with 5, 6, 7, 8 and 9 palms) dependingupon the availability of land and its orientation. If we couldfind a solution for optimal size of the plot for fieldexperimentation, it will definitely serve the purpose by
J. Oilseeds Res., 36(4) : 250-257, Dec., 2019 250
OPTIMUM PLOT SIZE FOR OIL PALM FIELD EXPERIMENTS
giving accuracy in recommendations and also it may bepossible to save input cost if the size of the plot is smallerthan what usually is being used. Hence, the data available onnumber and yield of fresh fruit bunches for six years in acrop improvement trial for 10 different crosses was analyzedby grouping the data into different plot sizes.
MATERIALS AND METHODS
The experimental field is located in ICAR-IIOPR farmarea (16048'43"N latitude and 8107'53"E longitude),Pedavegi, West Godavari District of Andhra Pradesh, India.The soil of the field has been characterized as deep redloamy type. The climate of the area is humid tropical typewith annual average rainfall of 1250 mm spread over aperiod of eight to nine months, i.e. from April to November.The hottest month is June. The mean daily maximumtemperature is 34.5°C and daily minimum temperature is21.10°C with relative humidity of > 70% throughout theyear. During summer season, the day temperature mayexceed 39°C on normal days.
The cultivated oil palm is a hybrid (called tenera)between Dura (thick shelled) and Pisifera (shell-less) havinggood mesocarp content for giving better oil yield. Ten crosscombinations (Deli x Avros, Deli x Ekona, Deli x Ghana,Deli x Lame, 65d x 111, 12 x 313, 12 x 266, 18c x 2501, 9cx 1001, 1M-0069D x P) of oil palm hybrid teneras wereplanted in the year 2000 and the inflorescences wereremoved by ablation for the first three years. These plantswere planted at 9 x 9 x 9 m spacing of equilateral triangleand in each treatment only one row of plants were there.Generally oil palm trees are allowed to develop bunchesfrom fourth year onwards in order to divert maximumnutrition for vegetative growth during the initial three years.The data on number and yield of fresh fruit bunches (FFBs)was recorded from the year 2004 to 2009 for about six yearsand it was considered as uniformity trial.
The palm wise number and yield data of FFBs wascollected from each harvest in all the six years and it waspooled year wise. In general, 8-12 bunches are formed ineach palm and there were 30-40 number of harvests per yearin different years. Further, there is a peak season (June toNovember) and lean season (December to May) of sixmonths each and the yields recorded are more in peakseason. Yield levels also followed a regular trend of up anddown year after year. Harvesting of bunches was carried outusing chisels during the initial years and at later period (9thand 10th year of age) it was with the help of a curved knifefitted to a light weight aluminum pole.
The FFB yield and bunch number data collected fromthese 10 crosses was subjected to grouping to arrive the yieldunder different plot sizes. In this trial there were 9 trees ineach treatment. The data was grouped into different plotsizes of 3, 4, 5, 6, 7, 8 and 9 as per the palm numbers. The
grouping for the first 8 plot sizes was arrived in the followingmanner (Tables 1).
In each plot, data was grouped in different combinationsfor each treatment (n number of palms) and the mean of thesecombinations was used for analysis purpose. There werethree replications for each treatment and the data wasanalysed for mean square error and also for coefficient ofvariation. Year wise values of yield and number of FFBswere analysed separately and finally pooled analysis was alsocarried out for six years for the sake of comparison.
Mean squared error (MSE) method: MSE indicates thedeviation from line of best fit under regression and theminimal value indicates the efficient point. Mean squarederror values were estimated using SAS ver 9.3 statisticalpackage and the treatment with lower MSE was consideredas more efficient.
Maximum curvature of coefficient of variation method:In maximum curvature method, the CV (coefficient ofvariation) values were plotted against plot size and the pointwhere the curve gets stabilized is considered as the efficientplot size. Descriptive statistics were calculated in MS-exceland the CV was calculated using the following formula.
Coefficient of variation (CV) = (Standard deviation/Mean)*100
Among the two methods used, maximum curvaturemethod is very simple and it could be estimated withMS-excel itself. To our knowledge, this is the first report onoptimal plot size for field experiments of oil palm underirrigated conditions. Descriptive statistics of yields obtainedfrom various plot sizes were calculated to get mean,coefficient of variation, coefficient of skewness, coefficientof kurtosis, variance, and variance per unit area in MS-excel.
Yield deviation: The percent deviations in yield per unitarea (one square meter) from that of average values werecalculated with the following formula and the values werecompared.
% Deviation = (Yi-m)/m*100
RESULTS AND DISCUSSION
Yield trends: The 10 hybrids planted in the year 2000started yielding from 2004 onwards and the FFB yield datacollected palm wise (individual oil palm tree wise) in threereplications was pooled into four quarters (Jan-Mar, Apr-Jun,Jul-Sep and Oct-Dec) to see the impact of weather. Ingeneral, yields were high in third quarter of the year mainlybecause of good rainfall (South-West monsoon) received inthis season (Fig. 1). Though it is grown as irrigated crop with
J. Oilseeds Res., 36(4) : 250-257, Dec., 2019 251
VIJAYA KUMARI ET AL.
regular supply of water, high rainfall during July toSeptember favored its performance in terms of FFB yield.The FFB yields of all the hybrids were high during thirdquarter (July-September) of the year and the lowest duringfirst quarter (January-March).Yield levels of FFB alsofollowed a regular trend of high and low, year after year inall the cross combinations indicating the pattern of flowerproduction (Fig. 2). In oil palm male and female flowers areproduced on the same plant (monoecious) and number offemale flowers produced depends on many factors. A regularcycle of flower production also observed with more numberof female flowers in alternate years.
Descriptive analysis: Mean values of plots differed with plotsize and higher values were recorded in smaller plot sizes.Coefficient of skewness ranged between -0.798 to 0.659 andthe minimum value was recorded in the plot size with 7plants (0.039). Kurtosis ranged between -0.1 to 7.47. In theplot of 7 palm sizes, the value of kurtosis was minimum andthe mean and median values are almost similar showing anormal distribution (Table 2).
Mean square error: Mean square error is used to measurethe relative variability among the treatments in anexperiment. Minimum value represents less variability and somore suitability of the treatment. In the present investigation,MSE was estimated for bunch weight and bunch number forfive years along with pooled data analysis. In case of FFByield, the MSE showed a declining trend from 3 palms pertreatment up to 7 palms per plot treatment during all the fiveyears and also in pooled data analysis. The same has againshowed an increased value at 8 palms/plot treatment in 2years out of five and also in pooled data. Similarly, in case ofbunch number also the trend was similar and the pooled datashowed decreasing trend up to 7 palms/plot treatmentand then started increasing afterwards (Fig. 3a and 3b andTable 3).
Here, it can be observed that with increasing palmnumber per treatment, the MSE decreased. At 7 palms/plottreatment the MSE recorded lowest values both in FFB yieldand number showing lesser error than other levels of plotsizes both on lower as well as higher side. Barreto and Raun(1990) evaluated corn field experiments conducted inMexico and demonstrated that increasing plot size decreasedmean square errors.
Maximum curvature (Coefficient of Variation): The samesecondary data under RBD with three replications wassubjected to CV estimation with same treatments of 3 to 9palms/plot. Year wise values were estimated and they wereplotted against the treatments i.e., number ofpalms/treatment. The CV values of treatments showed asharp decline up to seven palms/plot and afterwards the rateof decline slowed down in all the years. It could be observedthat the CVs of different years became stabilized at sevenpalms/plot (Fig. 4) and afterwards there was no muchchange. This showed that seven palms/plot could be efficientsize for field experimentation.
Yield variability per square meter: The variability inyields in terms of variance/meter2was estimated in differentplot sizes and it was found that it decreased with increase inplot size in general. This showed that larger plots are capableof showing less variation in yield. However, thevariability/meter2 plateaued at 7 palms/plot and there was noappreciable decrease observed after that (Fig. 5).
Relationship between MSE and CV: In the above twomethods, it was tried to find out the most efficient plot sizefor conducting field experiments in oil palm research. Boththe methods reported the same result and so it was also triedto find out the relationship between these two values of MSEand CV by plotting them in a graph (Fig. 6).
Table 1 Methodology Adopted For Arriving Palm Oil Yield Under Different Plot Sizes (3, 4, 5, 6, 7 and 8 Palms/Plot)
Palm No. 3 palms/plot 4 palms/plot 5 palms/plot 6 palms/plot
P1 P1+P2+P3)/3 (P1+P2+P3+P4)/4 (P1+P2+P3+P4+P5)/5 (P1+P2+P3+P4+P5+P6)/6 (P1+P2+P3+P4+P5+P6+P7)/7 (P1+P2+P3+P4+P5+P6+P7+P8)/8
P2 (P4+P5+P6)/3 (P5+P6+P7+P8)/4 (P6+P7+P8+P9+P1)/5 (P2+P3+P4+P5+P6+P7)/6 (P2+P3+P4+P5+P6+P7+P8)/7 (P2+P3+P4+P5+P6+P7+P8+P9)/8
P3 (P7+P8+P9)/3 (P9+P1+P2+P3)/4 (P2+P3+P4+P5+P6)/5 (P3+P4+P5+P6+P7+P8)/6 (P3+P4+P5+P6+P7+P8+P9)/7 (P3+P4+P5+P6+P7+P8+P9+P1)/8
P4 (P2+P3+P4)/3 (P2+P3+P4+P5)/4 (P3+P4+P5+P6+P7)/5 (P4+P5+P6+P7+P8+P9)/6 (P4+P5+P6+P7+P8+P9+P1)/7 (P4+P5+P6+P7+P8+P9+P1+P2)/8
P5 (P5+P6+P7)/3 (P6+P7+P8+P9)/4 (P4+P5+P6+P7+P8)/5 (P5+P6+P7+P8+P9+P1)/6 (P5+P6+P7+P8+P9+P1+P2)/7 (P5+P6+P7+P8+P9+P1+P2+P3)/8
P6 (P8+P9+P1)/3 (P3+P4+P5+P6)/4 (P5+P6+P7+P8+P9)/5 (P6+P7+P8+P9+P1+P2)/6 (P6+P7+P8+P9+P1+P2+P3)/7 (P6+P7+P8+P9+P1+P2+P3+P4)/8
P7 (P3+P4+P5)/3 (P7+P8+P9+P1)/4 (P7+P8+P9+P1+P2)/5 (P7+P8+P9+P1+P2+P3)/6 (P7+P8+P9+P1+P2+P3+P4)/7 (P7+P8+P9+P1+P2+P3+P4+P5)/8
P8 (P6+P7+P8)/3 (P4+P5+P6+P7)/4 (P8+P9+P1+P2+P3)/5 (P8+P9+P1+P2+P3+P4)/6 (P8+P9+P1+P2+P3+P4+P5)/7 (P8+P9+P1+P2+P3+P4+P5+P6)/8
P9 (P9+P1+P2)/3 (P8+P9+P1+P2)/4 (P9+P1+P2+P3+P4)/5 (P9+P1+P2+P3+P4+P5)/6 (P9+P1+P2+P3+P4+P5+P6)/7 (P9+P1+P2+P3+P4+P5+P6+P7)/8
J. Oilseeds Res., 36(4) : 250-257, Dec., 2019 252
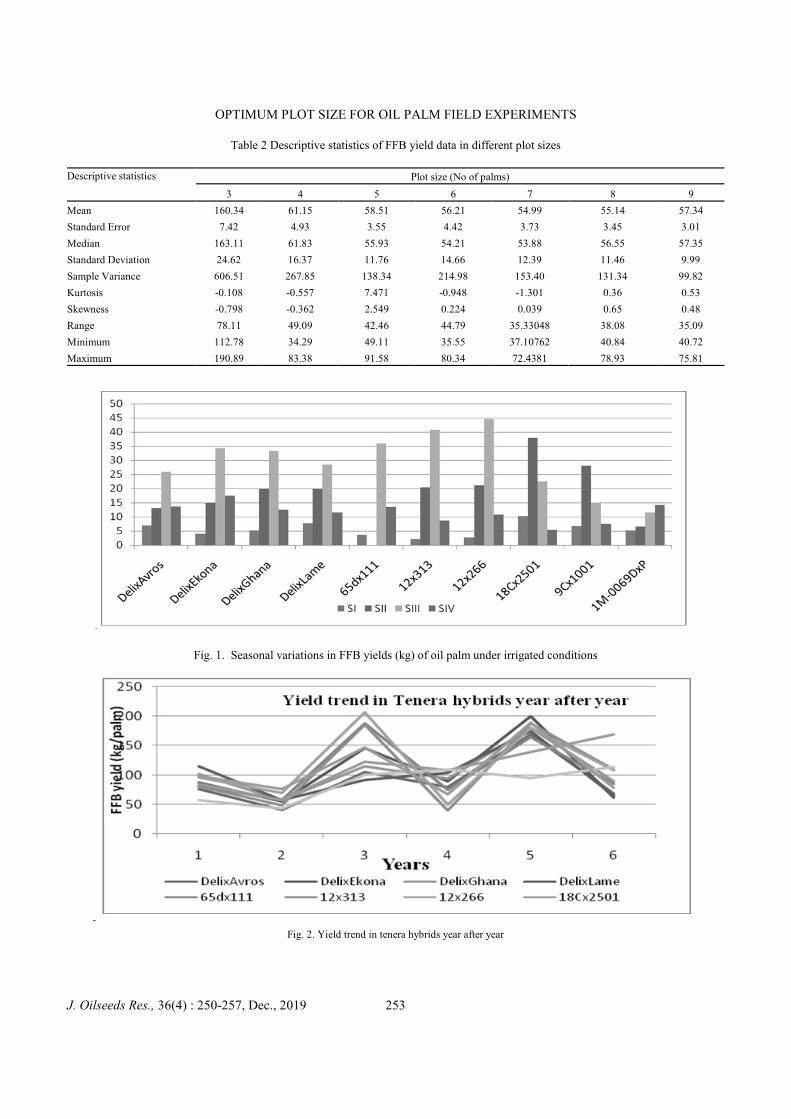
OPTIMUM PLOT SIZE FOR OIL PALM FIELD EXPERIMENTS
Table 2 Descriptive statistics of FFB yield data in different plot sizes
Descriptive statistics Plot size (No of palms)
3 4 5 6 7 8 9
Mean 160.34 61.15 58.51 56.21 54.99 55.14 57.34
Standard Error 7.42 4.93 3.55 4.42 3.73 3.45 3.01
Median 163.11 61.83 55.93 54.21 53.88 56.55 57.35
Standard Deviation 24.62 16.37 11.76 14.66 12.39 11.46 9.99
Sample Variance 606.51 267.85 138.34 214.98 153.40 131.34 99.82
Kurtosis -0.108 -0.557 7.471 -0.948 -1.301 0.36 0.53
Skewness -0.798 -0.362 2.549 0.224 0.039 0.65 0.48
Range 78.11 49.09 42.46 44.79 35.33048 38.08 35.09
Minimum 112.78 34.29 49.11 35.55 37.10762 40.84 40.72
Maximum 190.89 83.38 91.58 80.34 72.4381 78.93 75.81
Fig. 1. Seasonal variations in FFB yields (kg) of oil palm under irrigated conditions
Fig. 2. Yield trend in tenera hybrids year after year
J. Oilseeds Res., 36(4) : 250-257, Dec., 2019 253
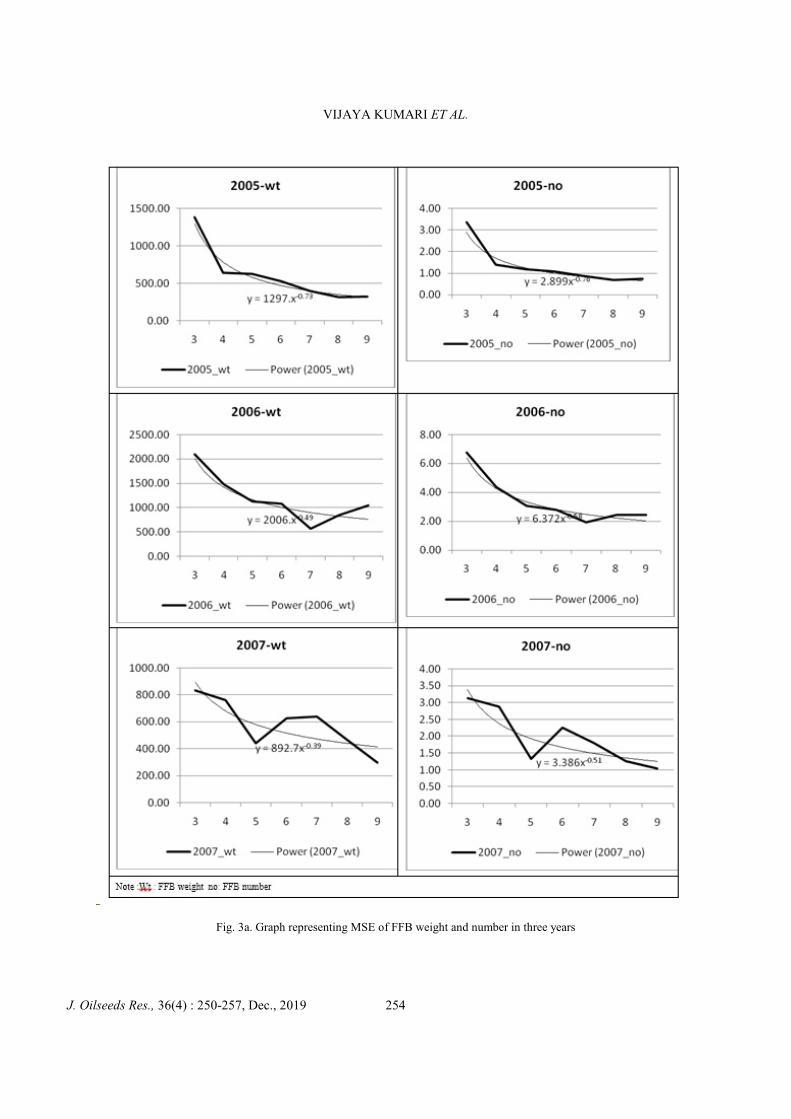
VIJAYA KUMARI ET AL.
Fig. 3a. Graph representing MSE of FFB weight and number in three years
J. Oilseeds Res., 36(4) : 250-257, Dec., 2019 254
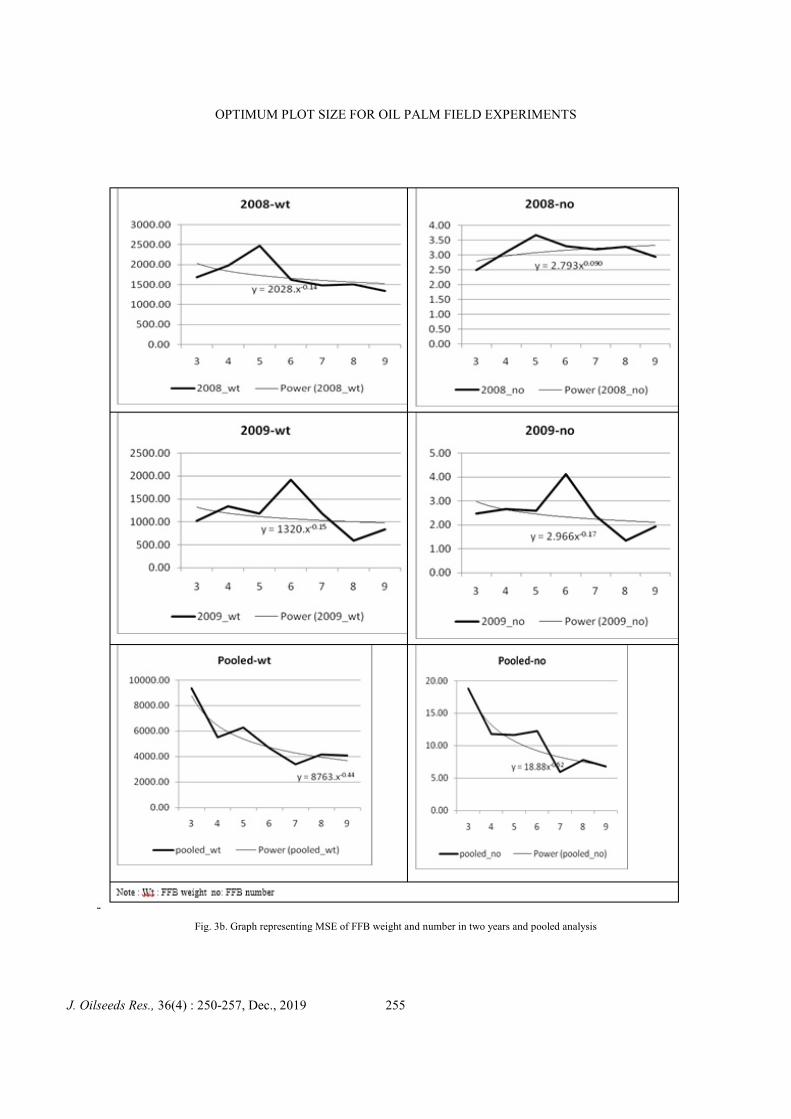
OPTIMUM PLOT SIZE FOR OIL PALM FIELD EXPERIMENTS
Fig. 3b. Graph representing MSE of FFB weight and number in two years and pooled analysis
J. Oilseeds Res., 36(4) : 250-257, Dec., 2019 255
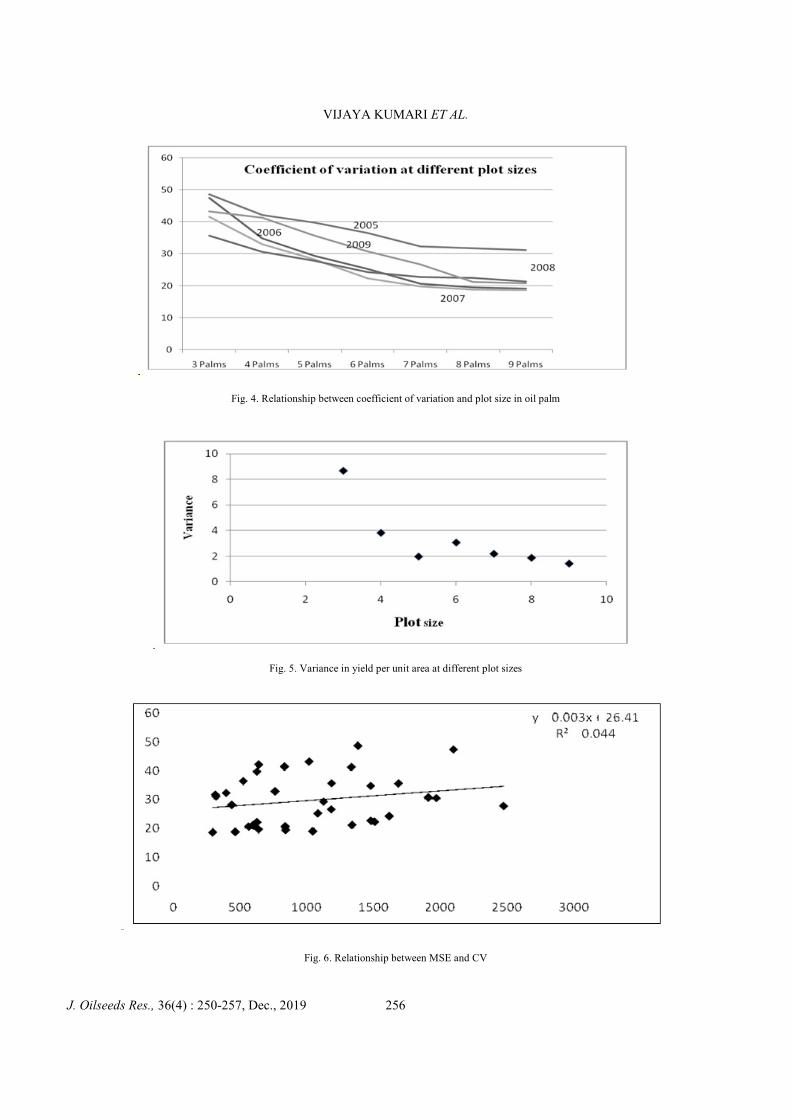
VIJAYA KUMARI ET AL.
Fig. 4. Relationship between coefficient of variation and plot size in oil palm
Fig. 5. Variance in yield per unit area at different plot sizes
Fig. 6. Relationship between MSE and CV
J. Oilseeds Res., 36(4) : 250-257, Dec., 2019 256
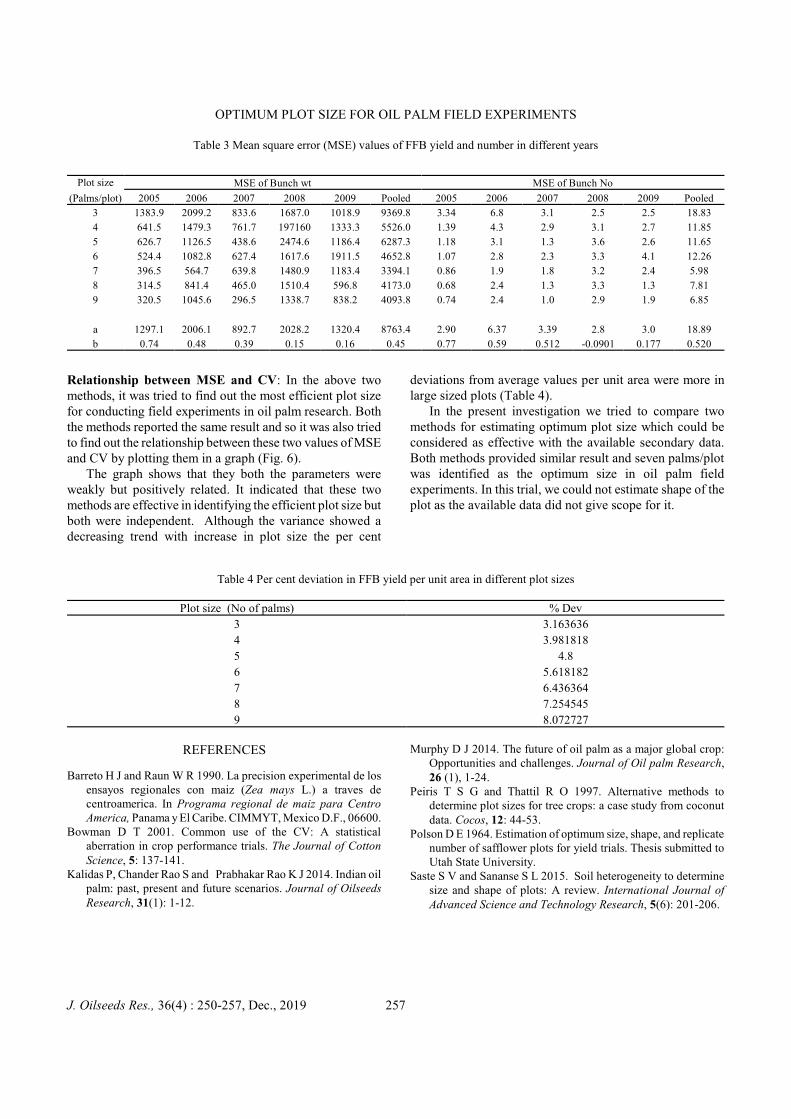
OPTIMUM PLOT SIZE FOR OIL PALM FIELD EXPERIMENTS
Table 3 Mean square error (MSE) values of FFB yield and number in different years
Plot size
(Palms/plot)
MSE of Bunch wt MSE of Bunch No
2005 2006 2007 2008 2009 Pooled 2005 2006 2007 2008 2009 Pooled
3 1383.9 2099.2 833.6 1687.0 1018.9 9369.8 3.34 6.8 3.1 2.5 2.5 18.83
4 641.5 1479.3 761.7 197160 1333.3 5526.0 1.39 4.3 2.9 3.1 2.7 11.85
5 626.7 1126.5 438.6 2474.6 1186.4 6287.3 1.18 3.1 1.3 3.6 2.6 11.65
6 524.4 1082.8 627.4 1617.6 1911.5 4652.8 1.07 2.8 2.3 3.3 4.1 12.26
7 396.5 564.7 639.8 1480.9 1183.4 3394.1 0.86 1.9 1.8 3.2 2.4 5.98
8 314.5 841.4 465.0 1510.4 596.8 4173.0 0.68 2.4 1.3 3.3 1.3 7.81
9 320.5 1045.6 296.5 1338.7 838.2 4093.8 0.74 2.4 1.0 2.9 1.9 6.85
a 1297.1 2006.1 892.7 2028.2 1320.4 8763.4 2.90 6.37 3.39 2.8 3.0 18.89
b 0.74 0.48 0.39 0.15 0.16 0.45 0.77 0.59 0.512 -0.0901 0.177 0.520
Relationship between MSE and CV: In the above twomethods, it was tried to find out the most efficient plot sizefor conducting field experiments in oil palm research. Boththe methods reported the same result and so it was also triedto find out the relationship between these two values of MSEand CV by plotting them in a graph (Fig. 6).
The graph shows that they both the parameters wereweakly but positively related. It indicated that these twomethods are effective in identifying the efficient plot size butboth were independent. Although the variance showed adecreasing trend with increase in plot size the per cent
deviations from average values per unit area were more inlarge sized plots (Table 4).
In the present investigation we tried to compare twomethods for estimating optimum plot size which could beconsidered as effective with the available secondary data.Both methods provided similar result and seven palms/plotwas identified as the optimum size in oil palm fieldexperiments. In this trial, we could not estimate shape of theplot as the available data did not give scope for it.
Table 4 Per cent deviation in FFB yield per unit area in different plot sizes
Plot size (No of palms) % Dev
3 3.163636
4 3.981818
5 4.8
6 5.618182
7 6.436364
8 7.254545
9 8.072727
REFERENCES
Barreto H J and Raun W R 1990. La precision experimental de losensayos regionales con maiz (Zea mays L.) a traves decentroamerica. In Programa regional de maiz para CentroAmerica, Panama y El Caribe. CIMMYT, Mexico D.F., 06600.
Bowman D T 2001. Common use of the CV: A statisticalaberration in crop performance trials. The Journal of CottonScience, 5: 137-141.
Kalidas P, Chander Rao S and Prabhakar Rao K J 2014. Indian oilpalm: past, present and future scenarios. Journal of OilseedsResearch, 31(1): 1-12.
Murphy D J 2014. The future of oil palm as a major global crop:Opportunities and challenges. Journal of Oil palm Research,26 (1), 1-24.
Peiris T S G and Thattil R O 1997. Alternative methods todetermine plot sizes for tree crops: a case study from coconutdata. Cocos, 12: 44-53.
Polson D E 1964. Estimation of optimum size, shape, and replicatenumber of safflower plots for yield trials. Thesis submitted toUtah State University.
Saste S V and Sananse S L 2015. Soil heterogeneity to determinesize and shape of plots: A review. International Journal ofAdvanced Science and Technology Research, 5(6): 201-206.
J. Oilseeds Res., 36(4) : 250-257, Dec., 2019 257
Association analysis in linseed (Linum usitatissimum L.)
VIPIN KUMAR SINGH, S A KERKHI, PRAKRITI TOMAR AND G P DIXIT1
Sardar Vallabhbhai Patel University of Agriculture & Technology, Meerut-250 110, Uttar Pradesh
(Received: October 25, 2019; Revised: December 12, 2019; Accepted: December 17, 2019)
ABSTRACT
The present study was taken up to work out correlation coefficient among the various yield and yield relatedtraits and to estimate direct and indirect effect of different traits on grain yield through path analysis in linseed. Fortydiverse linseed genotypes were assessed for different traits in a field experiment. Correlation as well as pathcoefficient analysis were calculated among the traits. Association analysis revealed that seed yield/plant showed thehighest and significant positive association with biological yield/plant, number of capsules/plant, harvest index,1000-seed weight and number of secondary branches/plant. Path coefficient analyses, at genotypic and phenotypiclevel, indicated the significant direct and indirect effects of the traits on yield.
Keywords: Association analysis, Indirect selection, Linseed, Path analysis
Flax or linseed (Linum usitatissimum L.) is one of theancient cultivated crops in the world including India. It is theonly agriculturally important species in the family Linaceae,which consists of 22 genera and 300 species (Hickey, 1988),and is widely spread in temperate and subtropical areas ofthe world. The species is believed to have originated in eitherthe Central Asia Centre of Origin or the Abyssinian Centreof Origin and spread throughout Asia and Europe, prior to itsintroduction into the New World (Soto-Cerda et al., 2013).Morphologically two distinct types of linseed are grown.Fibre type flax is tall with thin stem and top branched plantwhich is specially grown for fibre from the stem. Fibre flaxcultivars are grown in the cool temperate regions of China,the Russian Federation and Western Europe (Soto-Cerda etal., 2013). Oilseed type flax plants (linseed) are morebranched and shorter than the fibre type and are grown overa wider area in continental climatic regions of Canada, India,China, the United States and Argentina (Soto-Cerda et al.,2013).
Linseed is the second most important winter (rabi)oilseed crop and stands next to rapeseed- mustard in area andproduction in India. Almost every part of the linseed plant isutilized commercially either directly or after processing. It iscommercially cultivated for its seed, which is processed intooil and after extraction of oil, a high protein livestock feed isleft (Sankari, 2000; Kurt and Bozkurt, 2006). Its oil is largelyof drying type and non-edible because of high amount oflinolenic acids. Its oil content ranges from 33-45% withprotein content of 24% (Gill, 1987). Recent advances inneuro biology have established that it is the best herbalsource of Omega-3 and Omega-6 fatty acids which helps inregulating the nervous system. Singh and Marker (2006)reported that its oil is high in omega-3 fatty acid which isbelieved to be helpful in lowering cholesterol level when--------------------------------------------------------------------------- 1ICAR-Indian Institute of Pulses Research, Kanpur-208 024, Uttar Pradesh;Corresponding author's E-mail: [email protected]
included in the diet chain. Linseed cake is a superiorsupplement for the dairy cattle due to its excellentpalatability. Its meal contains 3% oil and 36% protein andserves as nutritious feed for milch cattle. It is a good sourceof calcium (170 mg/100g), phosphorus (370 mg/100g),potassium, manganese, waxes (0.012-0.450%), sterols andphospholipids (0.11-0.21%). It is also used as organicmanure. It contains about 5% N, 1.4% P2O5 and 1.8% K2O(Ahlawat, 2008). In plant breeding, it is essential to establishthe associations between yield and yield attributing traits sothat effective selection indices could be developed. Thepresent study was taken up to work out correlationcoefficient among the various characters and to estimatedirect and indirect effect of different traits on grain yieldthrough path analysis in linseed.
The material for this study comprised of forty diverselinseed accessions grown at Crop Research Center (Chirori),Sardar Vallabhbhai Patel University of Agriculture &Technology, Meerut (U.P.) during rabi season 2016-17. Theexperiment was laid out in Randomized Complete BlockDesign (RBD) with three replications. Each treatment wasgrown in 3 m long double row plot spaced 30 cm apart. Theplant to plant distance was maintained at 10 cm by thinning.All advocated agronomic practices and plant protectionmeasures were followed during the crop growth period. Theexperimental data was recorded on five plants randomlyselected and tagged from each plot, replication wise, for allthe genotypes except for observations, days to 50%flowering and days to maturity, which were recorded on theplot basis, all other observations were taken at maturity. Therecorded data was subjected to analysis of genotypic andphenotypic correlation coefficients and path coefficientanalysis as per the standard formula (Singh and Narayanan,2013).
The grain yield or economic yield, in almost all the cropsis referred to as main character of interest which results from
J. Oilseeds Res., 36(4) : 258-260, Dec., 2019 258
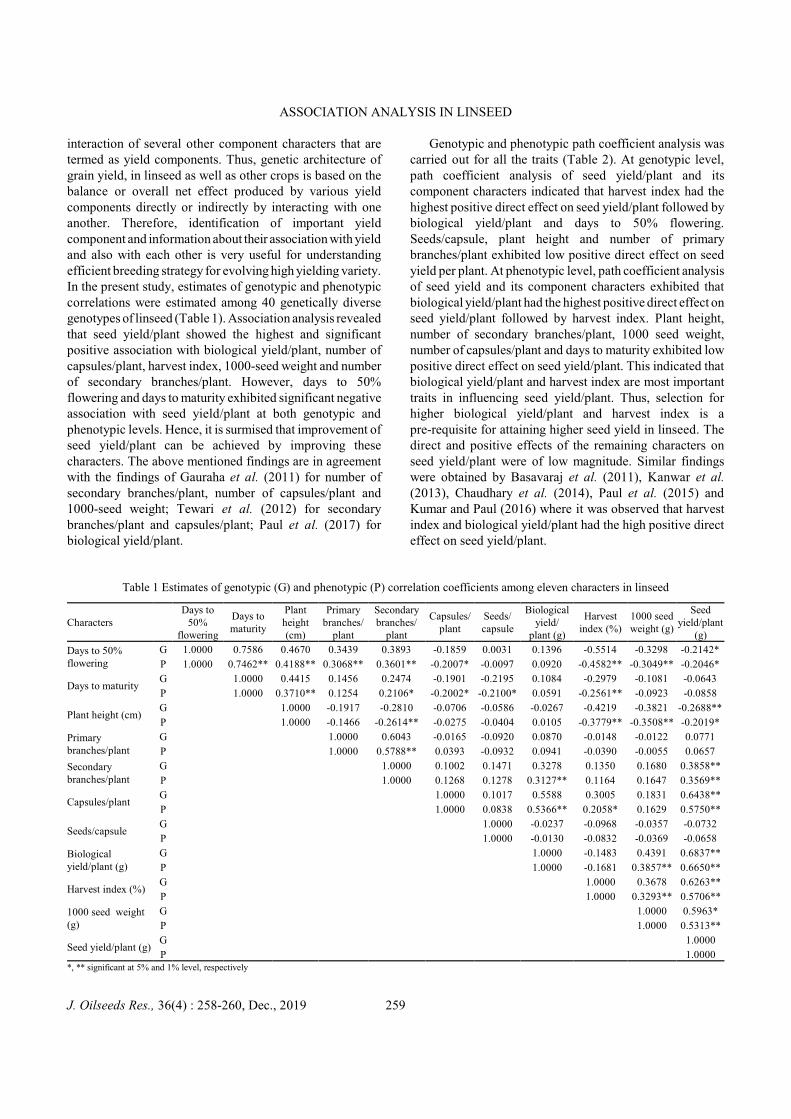
ASSOCIATION ANALYSIS IN LINSEED
interaction of several other component characters that aretermed as yield components. Thus, genetic architecture ofgrain yield, in linseed as well as other crops is based on thebalance or overall net effect produced by various yieldcomponents directly or indirectly by interacting with oneanother. Therefore, identification of important yieldcomponent and information about their association with yieldand also with each other is very useful for understandingefficient breeding strategy for evolving high yielding variety.In the present study, estimates of genotypic and phenotypiccorrelations were estimated among 40 genetically diversegenotypes of linseed (Table 1). Association analysis revealedthat seed yield/plant showed the highest and significantpositive association with biological yield/plant, number ofcapsules/plant, harvest index, 1000-seed weight and numberof secondary branches/plant. However, days to 50%flowering and days to maturity exhibited significant negativeassociation with seed yield/plant at both genotypic andphenotypic levels. Hence, it is surmised that improvement ofseed yield/plant can be achieved by improving thesecharacters. The above mentioned findings are in agreementwith the findings of Gauraha et al. (2011) for number ofsecondary branches/plant, number of capsules/plant and1000-seed weight; Tewari et al. (2012) for secondarybranches/plant and capsules/plant; Paul et al. (2017) forbiological yield/plant.
Genotypic and phenotypic path coefficient analysis wascarried out for all the traits (Table 2). At genotypic level,path coefficient analysis of seed yield/plant and itscomponent characters indicated that harvest index had thehighest positive direct effect on seed yield/plant followed bybiological yield/plant and days to 50% flowering.Seeds/capsule, plant height and number of primarybranches/plant exhibited low positive direct effect on seedyield per plant. At phenotypic level, path coefficient analysisof seed yield and its component characters exhibited thatbiological yield/plant had the highest positive direct effect onseed yield/plant followed by harvest index. Plant height,number of secondary branches/plant, 1000 seed weight,number of capsules/plant and days to maturity exhibited lowpositive direct effect on seed yield/plant. This indicated thatbiological yield/plant and harvest index are most importanttraits in influencing seed yield/plant. Thus, selection forhigher biological yield/plant and harvest index is apre-requisite for attaining higher seed yield in linseed. Thedirect and positive effects of the remaining characters onseed yield/plant were of low magnitude. Similar findingswere obtained by Basavaraj et al. (2011), Kanwar et al.(2013), Chaudhary et al. (2014), Paul et al. (2015) andKumar and Paul (2016) where it was observed that harvestindex and biological yield/plant had the high positive directeffect on seed yield/plant.
Table 1 Estimates of genotypic (G) and phenotypic (P) correlation coefficients among eleven characters in linseed
CharactersDays to
50%flowering
Days tomaturity
Plantheight(cm)
Primarybranches/
plant
Secondarybranches/
plant
Capsules/plant
Seeds/capsule
Biologicalyield/
plant (g)
Harvestindex (%)
1000 seedweight (g)
Seedyield/plant
(g)
Days to 50%flowering
G 1.0000 0.7586 0.4670 0.3439 0.3893 -0.1859 0.0031 0.1396 -0.5514 -0.3298 -0.2142*
P 1.0000 0.7462** 0.4188** 0.3068** 0.3601** -0.2007* -0.0097 0.0920 -0.4582** -0.3049** -0.2046*
Days to maturityG 1.0000 0.4415 0.1456 0.2474 -0.1901 -0.2195 0.1084 -0.2979 -0.1081 -0.0643
P 1.0000 0.3710** 0.1254 0.2106* -0.2002* -0.2100* 0.0591 -0.2561** -0.0923 -0.0858
Plant height (cm)G 1.0000 -0.1917 -0.2810 -0.0706 -0.0586 -0.0267 -0.4219 -0.3821 -0.2688**
P 1.0000 -0.1466 -0.2614** -0.0275 -0.0404 0.0105 -0.3779** -0.3508** -0.2019*
Primarybranches/plant
G 1.0000 0.6043 -0.0165 -0.0920 0.0870 -0.0148 -0.0122 0.0771
P 1.0000 0.5788** 0.0393 -0.0932 0.0941 -0.0390 -0.0055 0.0657
Secondarybranches/plant
G 1.0000 0.1002 0.1471 0.3278 0.1350 0.1680 0.3858**
P 1.0000 0.1268 0.1278 0.3127** 0.1164 0.1647 0.3569**
Capsules/plantG 1.0000 0.1017 0.5588 0.3005 0.1831 0.6438**
P 1.0000 0.0838 0.5366** 0.2058* 0.1629 0.5750**
Seeds/capsuleG 1.0000 -0.0237 -0.0968 -0.0357 -0.0732
P 1.0000 -0.0130 -0.0832 -0.0369 -0.0658
Biologicalyield/plant (g)
G 1.0000 -0.1483 0.4391 0.6837**
P 1.0000 -0.1681 0.3857** 0.6650**
Harvest index (%)G 1.0000 0.3678 0.6263**
P 1.0000 0.3293** 0.5706**
1000 seed weight(g)
G 1.0000 0.5963*
P 1.0000 0.5313**
Seed yield/plant (g)G 1.0000
P 1.0000*, ** significant at 5% and 1% level, respectively
J. Oilseeds Res., 36(4) : 258-260, Dec., 2019 259
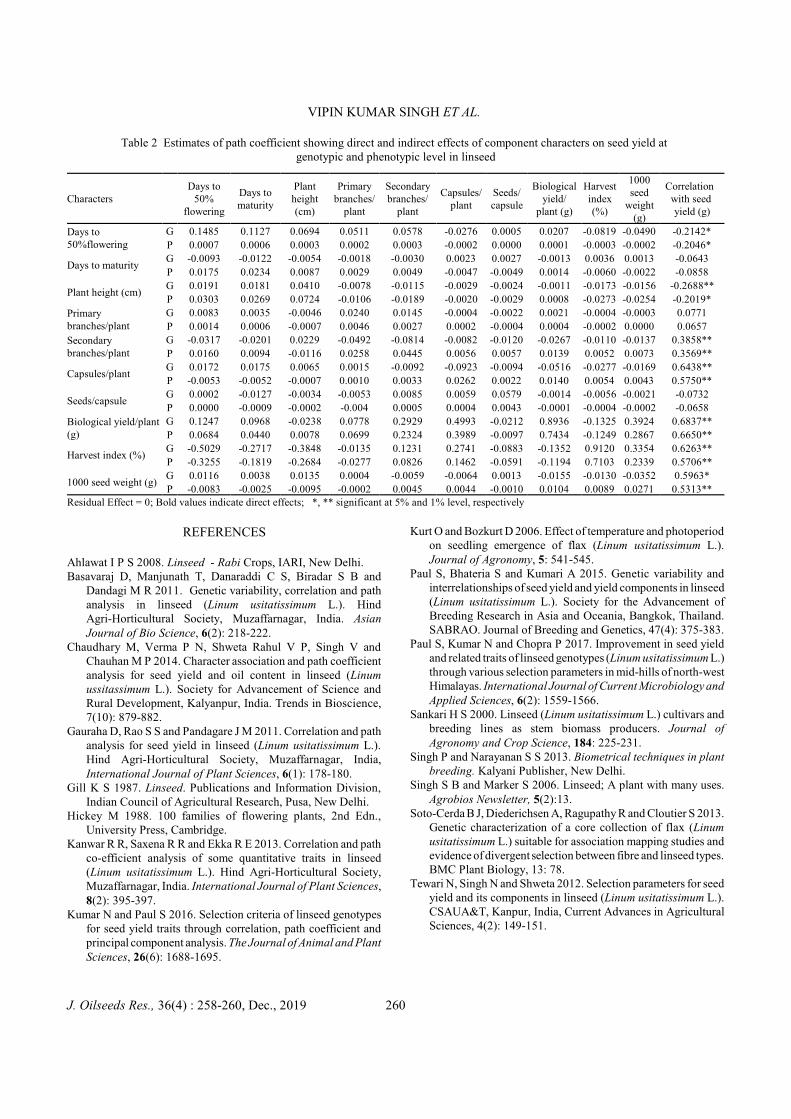
VIPIN KUMAR SINGH ET AL.
Table 2 Estimates of path coefficient showing direct and indirect effects of component characters on seed yield at genotypic and phenotypic level in linseed
CharactersDays to
50%flowering
Days tomaturity
Plantheight(cm)
Primarybranches/
plant
Secondarybranches/
plant
Capsules/plant
Seeds/capsule
Biologicalyield/
plant (g)
Harvestindex(%)
1000seed
weight(g)
Correlation with seed yield (g)
Days to50%flowering
G 0.1485 0.1127 0.0694 0.0511 0.0578 -0.0276 0.0005 0.0207 -0.0819 -0.0490 -0.2142*
P 0.0007 0.0006 0.0003 0.0002 0.0003 -0.0002 0.0000 0.0001 -0.0003 -0.0002 -0.2046*
Days to maturityG -0.0093 -0.0122 -0.0054 -0.0018 -0.0030 0.0023 0.0027 -0.0013 0.0036 0.0013 -0.0643
P 0.0175 0.0234 0.0087 0.0029 0.0049 -0.0047 -0.0049 0.0014 -0.0060 -0.0022 -0.0858
Plant height (cm)G 0.0191 0.0181 0.0410 -0.0078 -0.0115 -0.0029 -0.0024 -0.0011 -0.0173 -0.0156 -0.2688**
P 0.0303 0.0269 0.0724 -0.0106 -0.0189 -0.0020 -0.0029 0.0008 -0.0273 -0.0254 -0.2019*
Primarybranches/plant
G 0.0083 0.0035 -0.0046 0.0240 0.0145 -0.0004 -0.0022 0.0021 -0.0004 -0.0003 0.0771
P 0.0014 0.0006 -0.0007 0.0046 0.0027 0.0002 -0.0004 0.0004 -0.0002 0.0000 0.0657
Secondarybranches/plant
G -0.0317 -0.0201 0.0229 -0.0492 -0.0814 -0.0082 -0.0120 -0.0267 -0.0110 -0.0137 0.3858**
P 0.0160 0.0094 -0.0116 0.0258 0.0445 0.0056 0.0057 0.0139 0.0052 0.0073 0.3569**
Capsules/plantG 0.0172 0.0175 0.0065 0.0015 -0.0092 -0.0923 -0.0094 -0.0516 -0.0277 -0.0169 0.6438**
P -0.0053 -0.0052 -0.0007 0.0010 0.0033 0.0262 0.0022 0.0140 0.0054 0.0043 0.5750**
Seeds/capsuleG 0.0002 -0.0127 -0.0034 -0.0053 0.0085 0.0059 0.0579 -0.0014 -0.0056 -0.0021 -0.0732
P 0.0000 -0.0009 -0.0002 -0.004 0.0005 0.0004 0.0043 -0.0001 -0.0004 -0.0002 -0.0658
Biological yield/plant(g)
G 0.1247 0.0968 -0.0238 0.0778 0.2929 0.4993 -0.0212 0.8936 -0.1325 0.3924 0.6837**
P 0.0684 0.0440 0.0078 0.0699 0.2324 0.3989 -0.0097 0.7434 -0.1249 0.2867 0.6650**
Harvest index (%)G -0.5029 -0.2717 -0.3848 -0.0135 0.1231 0.2741 -0.0883 -0.1352 0.9120 0.3354 0.6263**
P -0.3255 -0.1819 -0.2684 -0.0277 0.0826 0.1462 -0.0591 -0.1194 0.7103 0.2339 0.5706**
1000 seed weight (g)G 0.0116 0.0038 0.0135 0.0004 -0.0059 -0.0064 0.0013 -0.0155 -0.0130 -0.0352 0.5963*
P -0.0083 -0.0025 -0.0095 -0.0002 0.0045 0.0044 -0.0010 0.0104 0.0089 0.0271 0.5313**Residual Effect = 0; Bold values indicate direct effects; *, ** significant at 5% and 1% level, respectively
REFERENCES
Ahlawat I P S 2008. Linseed - Rabi Crops, IARI, New Delhi.Basavaraj D, Manjunath T, Danaraddi C S, Biradar S B and
Dandagi M R 2011. Genetic variability, correlation and pathanalysis in linseed (Linum usitatissimum L.). HindAgri-Horticultural Society, Muzaffarnagar, India. AsianJournal of Bio Science, 6(2): 218-222.
Chaudhary M, Verma P N, Shweta Rahul V P, Singh V andChauhan M P 2014. Character association and path coefficientanalysis for seed yield and oil content in linseed (Linumussitassimum L.). Society for Advancement of Science andRural Development, Kalyanpur, India. Trends in Bioscience,7(10): 879-882.
Gauraha D, Rao S S and Pandagare J M 2011. Correlation and pathanalysis for seed yield in linseed (Linum usitatissimum L.).Hind Agri-Horticultural Society, Muzaffarnagar, India,International Journal of Plant Sciences, 6(1): 178-180.
Gill K S 1987. Linseed. Publications and Information Division,Indian Council of Agricultural Research, Pusa, New Delhi.
Hickey M 1988. 100 families of flowering plants, 2nd Edn., University Press, Cambridge.
Kanwar R R, Saxena R R and Ekka R E 2013. Correlation and pathco-efficient analysis of some quantitative traits in linseed(Linum usitatissimum L.). Hind Agri-Horticultural Society,Muzaffarnagar, India. International Journal of Plant Sciences,8(2): 395-397.
Kumar N and Paul S 2016. Selection criteria of linseed genotypesfor seed yield traits through correlation, path coefficient andprincipal component analysis. The Journal of Animal and PlantSciences, 26(6): 1688-1695.
Kurt O and Bozkurt D 2006. Effect of temperature and photoperiodon seedling emergence of flax (Linum usitatissimum L.).Journal of Agronomy, 5: 541-545.
Paul S, Bhateria S and Kumari A 2015. Genetic variability andinterrelationships of seed yield and yield components in linseed(Linum usitatissimum L.). Society for the Advancement ofBreeding Research in Asia and Oceania, Bangkok, Thailand.SABRAO. Journal of Breeding and Genetics, 47(4): 375-383.
Paul S, Kumar N and Chopra P 2017. Improvement in seed yieldand related traits of linseed genotypes (Linum usitatissimum L.)through various selection parameters in mid-hills of north-westHimalayas. International Journal of Current Microbiology andApplied Sciences, 6(2): 1559-1566.
Sankari H S 2000. Linseed (Linum usitatissimum L.) cultivars andbreeding lines as stem biomass producers. Journal ofAgronomy and Crop Science, 184: 225-231.
Singh P and Narayanan S S 2013. Biometrical techniques in plantbreeding. Kalyani Publisher, New Delhi.
Singh S B and Marker S 2006. Linseed; A plant with many uses.Agrobios Newsletter, 5(2):13.
Soto-Cerda B J, Diederichsen A, Ragupathy R and Cloutier S 2013.Genetic characterization of a core collection of flax (Linumusitatissimum L.) suitable for association mapping studies andevidence of divergent selection between fibre and linseed types.BMC Plant Biology, 13: 78.
Tewari N, Singh N and Shweta 2012. Selection parameters for seedyield and its components in linseed (Linum usitatissimum L.).CSAUA&T, Kanpur, India, Current Advances in AgriculturalSciences, 4(2): 149-151.
J. Oilseeds Res., 36(4) : 258-260, Dec., 2019 260
Influence of sowing environments on yield of sesame genotypes under shiftingweather conditions of Deccan Plateau (Telangana)
RATNAKUMAR PASALA* AND RAMESH KULASEKHARAN
ICAR-Indian Institute of Oilseeds Research, Rajendranagar, Hyderabad-500 030, Telangana
(Received: October 5, 2019; Revised: November 11, 2019; Accepted: November 29, 2019)
ABSTRACT
Climate change poses a challenge to sustainability of agricultural ecosystems and in turn the social and economicdevelopment, livelihoods of communities in the world and India is no exception. Sesame is an important oilseed cropthat has nutritional components such as lignans (antioxidant), sesamol along with tocopherols. This crop is grownunder varied climatic conditions in the country even though it is highly sensitive to thermal regimes. Therefore,identifying or breeding sesame varieties with adaptation to wider ecological regions with high yield potential is theneed of the hour. To identify high yielding sesame genotypes under shifting weather conditions of Deccan Plateau,an experiment was conducted with different dates of sowing. The sowing dates were designed in such a way that itconsidered the present cropping situation where it is grown after the harvest of the kharif crop. A set of popularfarmer preferred sesame varieties that are generally grown in different sesame growing regions of the country viz.,GT 10, GT 3, GT 4, RT 346, RT 351, Swetha til, YLM 66 and CUMS 17 were selected for the study. Among them,GT 10 performed better under October sowing under agro-ecological regions of Telangana while GT3, GT 4, RT346, RT 351, Swetha til, YLM 66 and CUMS 17 recorded maximum seed yield with November sowing. Among thegenotypes, CUMS 17 recorded the maximum seed yield during both October and November sowings. If a farmerhas a choice of sowing rabi crop immediately after the harvest of kharif crop, he may opt for late rabi sowing areaof Telangana with GT 10. In case there is a delay, choose other varieties to harvest maximum seed yield.
Keywords: Sesame yield, Sowing environments, Genotypes, Weather Scenario
Sustainability of agricultural systems is dictated by theclimate of any region. Successful cultivation of cropsdepends on the use of new varieties/strains with resiliencetraits. Sesame is an important oilseed crop for the DeccanPlateau (Telangana), Eastern Ghats, hot semiarid eco-regionand is a hardy and drought resistant crop. Sesame, the 'queen'of oilseeds (oil 38-54%; protein 18-25%), has highunsaturated fatty acid (Linoleic acid) and Tocopherol tomake it an nearly ideal oil (Lokesha and Prasad, 2006). Indiaproduces sesame seed varying in colour from white to red,brown and black. Brown seeds are used mainly for crushingfor oil. White variety with desirable taste, is used for makingsweets and confectionary products. Black seeds are used inJapan for seasoning. Hulled white sesame is used in Europeand other Western countries in making bakery products. Theoil has long shelf life due to the presence of lignans(antioxidant), sesamol together with tocopherols, while itsprotein is used for industrial purposes (Ashri, 1998) and itholds tremendous potential for export. In India, sesame iscultivated over an average area of >17 lakh ha with aproduction of >7 lakh tonnes. More than 85% productioncomes from West Bengal, Madhya Pradesh, Rajasthan, UttarPradesh, Gujarat and Andhra Pradesh (status paper onoilseeds, 2016). India ranks second in production of sesamein the world. Notwithstanding to this fact, the productivity isjust 413 kg/ha (http://www.commoditiescontrol.com). --------------------------------------------------------------------------- *Corresponding author's E-mail: [email protected],[email protected]
This productivity often oscillates due to severe abioticstresses.
Sesame is grown in India during kharif, rabi and summerseasons. It is grown both in kharif and rabi in parts ofMaharashtra, Madhya Pradesh, Chhattisgarh, Gujarat, Orissaand also as summer crop after late paddy or potato in Orissaand in all the seasons in parts of Southern India. The hither-to popular sesame crop of Telangana region is slowlydiminishing due to various reasons like competitive crops,price dis-advantages and a change in climate. Identificationof an efficient genotype which can be cultivated in thecurrent climatic condition of Telangana is necessary forrecommendation to the farmers and also for increasing theproduction of sesame in the state.
Telangana state falls in semi-arid zone category ofclimatic classification wherein hot and dry climate is acommon phenomenon. The areas covered by the DeccanPlateau are characterized by hot summers with relativelymild winters. The mean maximum temperature oscillatesbetween 40oC and 43oC during the month of May and themean minimum temperature is 13°C to 17°C in winter season(December and January). Telangana state action plan onclimate change document has mentioned that the minimumtemperature falls rapidly after October, and less than 10oChas also been recorded on certain days which is a majorconcern for the rabi/winter season crops particularly sesame.Relative temperature disparity (RTD) a factor of temperaturesignificantly affects the sowing environments for several
J. Oilseeds Res., 36(4) : 261-264, Dec., 2019 261
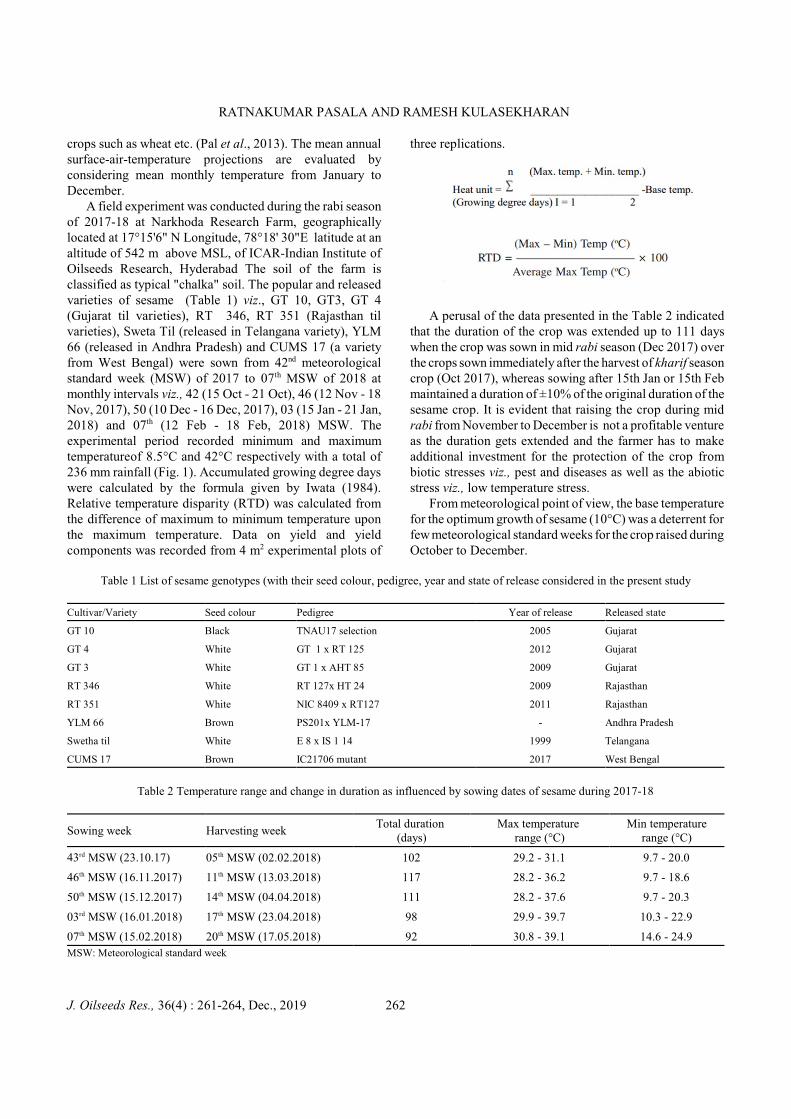
RATNAKUMAR PASALA AND RAMESH KULASEKHARAN
crops such as wheat etc. (Pal et al., 2013). The mean annualsurface-air-temperature projections are evaluated byconsidering mean monthly temperature from January toDecember.
A field experiment was conducted during the rabi seasonof 2017-18 at Narkhoda Research Farm, geographicallylocated at 17°15'6" N Longitude, 78°18' 30"E latitude at analtitude of 542 m above MSL, of ICAR-Indian Institute ofOilseeds Research, Hyderabad The soil of the farm is classified as typical "chalka" soil. The popular and releasedvarieties of sesame (Table 1) viz., GT 10, GT3, GT 4(Gujarat til varieties), RT 346, RT 351 (Rajasthan tilvarieties), Sweta Til (released in Telangana variety), YLM66 (released in Andhra Pradesh) and CUMS 17 (a varietyfrom West Bengal) were sown from 42nd meteorologicalstandard week (MSW) of 2017 to 07th MSW of 2018 atmonthly intervals viz., 42 (15 Oct - 21 Oct), 46 (12 Nov - 18Nov, 2017), 50 (10 Dec - 16 Dec, 2017), 03 (15 Jan - 21 Jan,2018) and 07th (12 Feb - 18 Feb, 2018) MSW. Theexperimental period recorded minimum and maximumtemperatureof 8.5°C and 42°C respectively with a total of236 mm rainfall (Fig. 1). Accumulated growing degree dayswere calculated by the formula given by Iwata (1984).Relative temperature disparity (RTD) was calculated fromthe difference of maximum to minimum temperature uponthe maximum temperature. Data on yield and yieldcomponents was recorded from 4 m2 experimental plots of
three replications.
A perusal of the data presented in the Table 2 indicatedthat the duration of the crop was extended up to 111 dayswhen the crop was sown in mid rabi season (Dec 2017) overthe crops sown immediately after the harvest of kharif seasoncrop (Oct 2017), whereas sowing after 15th Jan or 15th Febmaintained a duration of ±10% of the original duration of thesesame crop. It is evident that raising the crop during midrabi from November to December is not a profitable ventureas the duration gets extended and the farmer has to makeadditional investment for the protection of the crop frombiotic stresses viz., pest and diseases as well as the abioticstress viz., low temperature stress.
From meteorological point of view, the base temperaturefor the optimum growth of sesame (10°C) was a deterrent forfew meteorological standard weeks for the crop raised duringOctober to December.
Table 1 List of sesame genotypes (with their seed colour, pedigree, year and state of release considered in the present study
Cultivar/Variety Seed colour Pedigree Year of release Released state
GT 10 Black TNAU17 selection 2005 Gujarat
GT 4 White GT 1 x RT 125 2012 Gujarat
GT 3 White GT 1 x AHT 85 2009 Gujarat
RT 346 White RT 127x HT 24 2009 Rajasthan
RT 351 White NIC 8409 x RT127 2011 Rajasthan
YLM 66 Brown PS201x YLM-17 - Andhra Pradesh
Swetha til White E 8 x IS 1 14 1999 Telangana
CUMS 17 Brown IC21706 mutant 2017 West Bengal
Table 2 Temperature range and change in duration as influenced by sowing dates of sesame during 2017-18
Sowing week Harvesting week Total duration
(days)Max temperature
range (°C)Min temperature
range (°C)
43rd MSW (23.10.17) 05th MSW (02.02.2018) 102 29.2 - 31.1 9.7 - 20.0
46th MSW (16.11.2017) 11th MSW (13.03.2018) 117 28.2 - 36.2 9.7 - 18.6
50th MSW (15.12.2017) 14th MSW (04.04.2018) 111 28.2 - 37.6 9.7 - 20.3
03rd MSW (16.01.2018) 17th MSW (23.04.2018) 98 29.9 - 39.7 10.3 - 22.9
07th MSW (15.02.2018) 20th MSW (17.05.2018) 92 30.8 - 39.1 14.6 - 24.9
MSW: Meteorological standard week
J. Oilseeds Res., 36(4) : 261-264, Dec., 2019 262
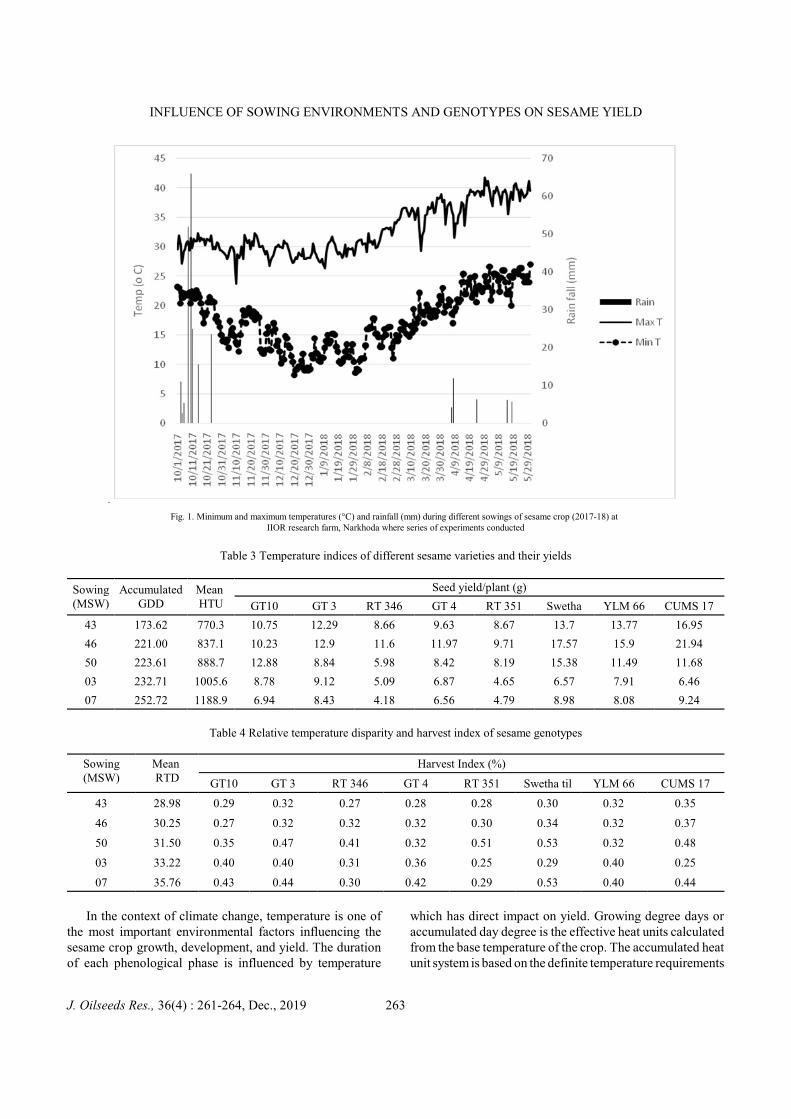
INFLUENCE OF SOWING ENVIRONMENTS AND GENOTYPES ON SESAME YIELD
Fig. 1. Minimum and maximum temperatures (°C) and rainfall (mm) during different sowings of sesame crop (2017-18) at IIOR research farm, Narkhoda where series of experiments conducted
Table 3 Temperature indices of different sesame varieties and their yields
Sowing(MSW)
AccumulatedGDD
Mean HTU
Seed yield/plant (g)
GT10 GT 3 RT 346 GT 4 RT 351 Swetha YLM 66 CUMS 17
43 173.62 770.3 10.75 12.29 8.66 9.63 8.67 13.7 13.77 16.95
46 221.00 837.1 10.23 12.9 11.6 11.97 9.71 17.57 15.9 21.94
50 223.61 888.7 12.88 8.84 5.98 8.42 8.19 15.38 11.49 11.68
03 232.71 1005.6 8.78 9.12 5.09 6.87 4.65 6.57 7.91 6.46
07 252.72 1188.9 6.94 8.43 4.18 6.56 4.79 8.98 8.08 9.24
Table 4 Relative temperature disparity and harvest index of sesame genotypes
Sowing(MSW)
Mean RTD
Harvest Index (%)
GT10 GT 3 RT 346 GT 4 RT 351 Swetha til YLM 66 CUMS 17
43 28.98 0.29 0.32 0.27 0.28 0.28 0.30 0.32 0.35
46 30.25 0.27 0.32 0.32 0.32 0.30 0.34 0.32 0.37
50 31.50 0.35 0.47 0.41 0.32 0.51 0.53 0.32 0.48
03 33.22 0.40 0.40 0.31 0.36 0.25 0.29 0.40 0.25
07 35.76 0.43 0.44 0.30 0.42 0.29 0.53 0.40 0.44
In the context of climate change, temperature is one ofthe most important environmental factors influencing thesesame crop growth, development, and yield. The durationof each phenological phase is influenced by temperature
which has direct impact on yield. Growing degree days oraccumulated day degree is the effective heat units calculatedfrom the base temperature of the crop. The accumulated heatunit system is based on the definite temperature requirements
J. Oilseeds Res., 36(4) : 261-264, Dec., 2019 263
RATNAKUMAR PASALA AND RAMESH KULASEKHARAN
the crops have to attain certain phenological stage (Rani andMargatham, 2013). For the sowings between October toDecember, accumulated GDD was increasing, thereafter adecline was noticed. These changes can be attributed todecrease in the minimum temperatures for the early sowncrops. On the other hand, declining trends in GDD could beattributed to decreases in maximum temperature. Amaximum accumulated GDD of 305.33 was found to beoptimum for GT 10 for the December sowing. A maximumaccumulated GDD of 221 was found to be optimum for GT3, RT 346, GT 4, RT 351, Swetha til, YLM 66 and CUMS17 for the November sowing.
The data (Table 3) indicate that as the sowing dateprogresses from October to February, the relativetemperature disparity for sesame increased. Air temperature,particularly the minimum temperature during winter seasonis an important weather parameter that affects sesamegrowth, development and yield. It is universally known thatwinter crops are vulnerable to high temperature duringreproductive stages and differential response of temperaturechange (rise) to various crops has been noticed underdifferent production environments. The temperaturedifferences between the minimum and maximum isconsidered important because the activity of all the enzymesis controlled by temperature variation (Pal et al.,2013) andthe water uptake is controlled by VPD (Vadez andRatnakumar 2016)
Among the genotypes, RT 351 (Table.4) registeredmaximum harvest index of 0.51 with equal allocation ofsource to seed, and stem and leaves. The national checkvariety GT 10 could allocate maximum source to seed when
the sowing was advanced to February. GT3, RT 346, RT351, Swetha til and CUMS 17 could allocate more biomassto seed when sown during December.
Identification of appropriate variety for the changedclimate scenario is crucial for obtaining higher yield insesame crop during winter season. All the tested varietiesperformed better under November sowing except GT 10which was better under October sowing.
REFERENCES
Ashri A 1998. Sesame breeding. Plant Breeding Review, 16:179-228.
Iwata F 1984. Heat unit concept of crop maturity. In: PhysiologicalAspects of Dry Land Farming, Gupta U.S. (Ed.), pp. 351-370,Oxford and IBH publishers, New Delhi.
Lokesha R and Prasad T D 2006. Transgenic sesame for nutritionalquality maintenance a dream, pp. 69, International Conferenceon Biotechnology Approaches for Elevating Mal-nutrition andHuman Health, Bengaluru.
Pal R K, Rao M M N N and Murty S 2013. Relative temperaturedisparity and wheat yield as influenced by sowingenvironments and genotypes in Tarai Region of Uttarakhand.Environment and Ecology, 31(2B): 979-983.
Rani B R and Maragatham N 2013. Effect of elevated temperatureon rice phenology and yield. Indian Journal of Science andTechnology, 6(8): 5095-5096.
Vadez V and Ratnakumar P 2016. High transpiration efficiencyincreases pod yield under intermittent drought in dry and hotatmospheric conditions but less so under wetter and coolerconditions in groundnut (Arachis hypogaea L.). Field CropsResearch, 193: 16-23.
J. Oilseeds Res., 36(4) : 261-264, Dec., 2019 264
INDIAN SOCIETY OF OILSEEDS RESEARCHInstructions to Authors for Preparation of Manuscript for Journal of Oilseeds Research
Prospective author(s) are advised to consult Issue No. 27(1) June, 2010 of the Journal of Oilseeds Research and get acquainted withthe minor details of the format and style of the Journal. Meticulous compliance with the instructions given below will help quick handling ofthe manuscript by the reviewers, editor and printers. Manuscripts are considered for publication in the Journal only from members of theISOR.
General
Full-length articles, short communications, book reviews and review articles are published in the Journal. Review articles and bookreviews are published usually by invitation. Full length articles and short communications should report results of original investigations inoilseeds, oil bearing plants and relevant fields of science. Choice of submitting the paper(s) either as full length paper or short communicationrests with the authors. The Editor(s) or Reviewer(s) will examine their suitability or otherwise only in that specific category. Each article shouldbe written in English correctly, clearly, objectively and concisely. All the statements made in the manuscript should be clear, unambiguous,and to the point. Plagiarism is a crime and therefore, no part of the previously published material can be reproduced exactly without priorpermission from the original publisher or author(s) as deemed essential and the responsibility of this solely rests on the authors. Also, authorsshall be solely responsible for the authenticity of the results published as well as the inferences drawn thereof. Telegraphic languages shouldbe avoided. The data should be reported in a coherent sequence. Use active voice. Active voice is clear, unambiguous and takes less space. Use past tense while reporting results. Do not repeat ideas in different forms of sentences. Avoid superfluous sentences such as ̀ it is interestingto note that', `it is evident from the table that' or `it may be concluded that' etc. Use % for percent, %age for percentage, / for per, @ for atthe rate of hr for hours, sec for seconds. Indicate date as 21 January 2010 (no commas anywhere). Spell out the standard abbreviations whenfirst mentioned eg. Net assimilation rate (NAR), general combining ability (GCA), genetic advance (GA), total bright leaf equivalents (TBLE),mean sum of squares (MSS).
Manuscript
Language of the Journal is English. Generally, the length of an article should not exceed 3,000 words in the case of full-length articleand 750 words in the case of short communication. However completeness of information is more important. Each half-page table or illustrationshould be taken as equivalent to 200 words. It is desirable to submit manuscript in the form of soft copy either as an e-mail attachment [email protected] (preferred because of ease in handling during review process) or in a compact disk (CD) (in MS Word document; doubleline space; Times New Roman; font size 12). In exceptional cases, where the typed manuscript is being submitted as hard copy, typing mustbe done only on one side of the paper, leaving sufficient margin, at least 4 cm on the left hand side and 3 cm on the other three sides. Fadedtypewriter ribbon should not be used. Double space typing is essential throughout the manuscript, right from the Title through References(except tables), foot note etc. Typed manuscript complete in all respects, is to be submitted to the Editor, Journal of Oilseeds Research,Directorate of Oilseeds Research, Rajendranagar, Hyderabad-500 030. Every page of the manuscript, including the title page, references, tables,etc. should be numbered. Punctuation marks help to show the meanings of words by grouping them into sentences, clauses, and phrases andin other ways. These marks should be used in proper manner if the reader of a paper is to understand exactly the intended meaning. Receiptof the manuscript (in the form of either soft or hard copy) will be acknowledged by the editorial office of the Society, giving a manuscriptnumber which should be quoted in all subsequent correspondence regarding that particular article.
Full-length Articles
Organization of the Manuscript
Before reading the instructions given below, the author(s) would better have a close look at the latest issue of the Journal.
Full-length article comprises the following sections.(a) Short title (g) Materials and Methods(b) Title (h) Results and Discussion(c) Author/Authors (i) Acknowledgments (if any)(d) Institution and Address with PIN (postal) code (j) References(e) Abstract (along with key words) (k) Tables and figures (if any)(f) Introduction
Guidelines for each section are as follows:
All these headings or matter thereof should start from left hand side of the margin, without any indent.
Short Title
A shortened title (approximately of 30 characters) set in capital letters should convey the main theme of the paper.
Title
Except for prepositions, conjunctions, pronouns and articles, the first letter of each word should be in capital letter. The title should beshort and should contain key words and phrases to indicate the contents of the paper and be attractive. Jargons and telegraphic words shouldbe avoided. In many cases, actual reading of the paper may depend on the attractiveness of the title.
i
Author/Authors
The name(s) of author(s) should be typed in capital letters a little below the title, starting from the left margin. Put an asterisk on the nameof the corresponding author. Give the Email ID of the corresponding author as a footnote.
Institution and Address
This matter will come below the name(s) of the author(s). Name of the Laboratory/Department, followed by the name of theInstitution/Organization/University where the work reported in the paper was carried out shall come below the name(s) of author(s). Completepostal address, which should include city/town, district, and state, followed by PIN (postal) code is to be furnished. In case any author has leftthe above address, this should be indicated as a footnote.
Abstract
The paragraph should start with the word Abstract (in bold font). The abstract should comprise brief and factual summary or salientpoints of the contents and the conclusions of the investigation reported in the paper and should refer to any new information therein. As theabstract is an independent entity, it should be able to convey the gist of the paper in a concise manner. It will be seen by many more peoplethan will read the paper. The abstract, as concise as possible, should not exceed 250 words in length. Everything that is important in the papermust be reflected in the abstract. It should provide to the reader very briefly the rationale, objectives or hypothesis, methods, results andconclusions of the study described in the paper. In the abstract, do not deflect the reader with promises such as 'will be discussed' or 'will beexplained'. Also do not include reference, figure or table citation. At first mention in the abstract, give complete scientific name for plants andother organisms, the full names of chemicals and the description of soil order/series. Any such names or descriptions from the abstract neednot be repeated in the text. It must be remembered that the abstracting journals place a great emphasis on the abstract in the selection of papersfor abstracting. If properly prepared, they may reproduce it verbatim.
"Key words" should, follow separately after the last sentence of the abstract. "Key words" indicate the most important materials, operations,or ideas covered in the paper. Key words are used in indexing the articles.
Introduction (To be typed as side-heading, starting from the left-hand margin, a few spaces below the key words)
This section is meant to introduce the subject of the paper. Introduction should be short, concise and indicate the objectives and scopeof the investigation. To orient readers, give a brief reference to previous concepts and research. Limit literature references to essentialinformation. When new references are available, do not use old references unless it is of historical importance or a landmark in that field.Emphasis should be given among other things on citing the literature on work done under Indian conditions. Introduction must include: (a) abrief statement of the problem, justifying the need for doing the work or the hypothesis on which the work is based, (b) the findings of othersthat will be further developed or challenged, and (c) an explanation of the approach to be followed and the objectives of the research describedin the paper. If the methods employed in the paper are new, it must be indicated in the introduction section.
Materials and methods (To be typed as side-heading, starting from the left-hand margin, a few spaces below the introduction)
This part of the text should comprise the materials used in the investigation, methods of experiment and analysis adopted. This portionshould be self-explanatory and have the requisite information needed for understanding and assessing the results reported subsequently. Enoughdetails should be provided in this section to allow a competent scientist to repeat the experiments, mentally or in fact. The geographical positionof soil site or soils used in the experiment or site of field trial should be identified clearly with the help of coordinates (latitude & longitude)and invariably proper classification according to Soil Taxonomy (USDA), must be indicated to the level of Great-group, Suborder or Order asfar as possible. Specify the period during which the experiment(s) was conducted. Send the article after completion of the experiment(s) notafter a gap of 5 years. Instead of kharif and rabi use rainy and winter season respectively. Please give invariably the botanical names for localcrop names like raya, bajra moong, cholam etc. Botanical and zoological names should confirm to the international rules. Give authorities. Go through some of our recent issues and find out the correct names. Give latest correct names from authentic source. For materials, give theappropriate technical specifications and quantities and source or method of preparation. Should a product be identified by trade name, addthe name and location of the manufacturer or a major distributor in parenthesis after the first mention of the product. For the name of plantprotection chemicals, give popular scientific names (first letter small), not trade names (When trade name is given in addition, capitalize thefirst letter of the name). Known methods of analysis should be indicated by referring to the original source, avoiding detailed description. Anynew technique developed and followed should be described in fair detail. When some specially procured or proprietary materials are used,give their pertinent chemical and physical properties. References for the methods used in the study should be cited. If the techniques are widelyfamiliar, use only their names in that case.
Results and Discussion (To be typed as a side-heading, a few spaces below the matter on "Materials and Methods")
This section should discuss the salient points of observation and critical interpretation thereof in past tense. This should not be descriptiveand mere recital of the data presented in the tables and diagrams. Unnecessary details must be avoided but at the same time significant findingsand special features should be highlighted. For systematic discussion, this section may be divided into sub-sections under side-heading and/orparagraph side heading. Relate the results to your objectives. While discussing the results, give particular attention to the problem, questionor hypothesis presented in the introduction. Explain the principles, relationships, and generalizations that can be supported by the results. Pointout any exceptions. Explain how the results relate to previous findings, support, contradict or simply add as data. Use the Discussion sectionto focus on the meaning of your findings rather than recapitulating them. Scientific speculation is encouraged but it should be reasonable andfirmly founded in observations. When results differ from previous results, possible explanations should be given. Controversial issues shouldbe discussed clearly. References to published work should be cited in the text by the name(s) of author(s) as follows: Mukherjee and Mitra (1942)have shown or It has been shown (Mukherjee and Mitra, 1942)..... If there are more than two authors, this should be indicated by et al. afterthe surname of the first author, e.g., Mukherjee et al. (1938).
ii
Always conclude the article by clearly crystallizing the summary of the results obtained along with their implications in solution of thepractical problems or contribution to the advancement of the scientific knowledge.
Acknowledgments (To be typed as given above, as a side-heading, well below the concluding portion of Conclusions)
The author(s) may place on record the help, and cooperation, or financial help received from any source, person or organization. Thisshould be very brief, and omitted, if not necessary.
References (To be typed as above, as side heading below Acknowledgement)
The list of references must include all published work referred to in the text. Type with double line spacing. Do not cite anonymousas author; instead cite the name of the institute, publisher, or editor. References should be arranged alphabetically according to the surnamesof the individual authors or first authors. Two or more references by the same author are to be cited chronologically; two or more in the sameyear by the letters a, b, c, etc. All individually authored articles precede those in which the individual is the first or joint author. Every referencecited in the article should be included in the list of References. This needs rigorous checking of each reference. Names of authors should notbe capitalized.
The reference citation should follow the order: author(s), year of publication, title of the paper, periodical (title in full, no abbreviations,italics or underlined), volume (bold or double underlining), starting and ending pages of the paper. Reference to a book includes authors(s),year, title (first letter of each word except preposition, conjunction, and pronouns in capitals and underlined), the edition (if other than first),the publisher, city of publication. If necessary, particular page numbers should be mentioned in the last. Year of publication cited in the textshould be checked with that given under References. Year, volume number and page number of each periodical cited under "References" mustbe checked with the original source. The list of references should be typed as follows:
Rao C R 1968. Advances in Statistical Methods in Biometrical Research, pp.40-45, John Wiley & Sons, New York. Kanwar J S and Raychaudhuri S P 1971. Review of Soil Research in India, pp 30-36. Indian Society of Soil Science, New Delhi.Mukherjee J N 1953. The need for delineating the basic soil and climatic regions of importance to the plant industry. Journal of the Indian
Society of Soil Science, 1 : 1-6.Khan S K, Mohanty S K and Chalam A B, 1986. Integrated management of organic manure and fertilizer nitrogen for rice. Journal of the Indian
Society of Soil Science, 34 : 505-509.Bijay-Singh and Yadvinder-Singh 1997. Green manuring and biological N fixation: North Indian perspective. In: Kanwar J S and Katyal J C (Ed.)
Plant Nutrient Needs, Supply, Efficiency and Policy Issues 2000-2025. National Academy of Agricultural Sciences, New Delhi, India,pp.29-44.
Singh S, Pahuja S S and Malik R K 1992. Herbicidal control of water hyacinth and its effect on chemical composition of water (in) Proceedingsof Annual Weed Science Conference, held during 3-4 March 1992 by the Indian Society of Weed Science, at Chaurdhary Charan SinghHaryana Agricultural University, Hisar, 127p.
AICRP on Soybean 1992. Proceedings of 23rd Annual Workshop of All-India Co-ordinated Research Project on Soybean, held during 7-9 May1992 at University of Agricultural Sciences, Bangalore, Karnataka, National Research Centre for Soybean, Indore, pp.48.
Devakumar C. 1986. Identification of nitrification retarding principles in neem (Azadirachta indica A.Juss.) seeds. Ph D Thesis, IndianAgricultural Research Institute, New Delhi.
Reference to unpublished work should normally be avoided and if unavoidable it may be mentioned only in the text.
Short Communication
Conceptually short communication is a first report on new concept, ideas and methodology which the author(s) would wish to sharewith the scientific community and that the detailed paper would follow. Short Communication is akin to an advance booking for the report onthe findings. Short communications may include short but trend-setting reports of field or laboratory observation(s), preliminary results oflong-term projects, or new techniques or those matters on which enough information to warrant its publication as a full length article has stillnot been generated but the results need to be shared immediately with the scientific community. The style is less formal as compared with the"full-length" article. In the short communications, the sections on abstract, materials and methods, results and discussion, and conclusion areomitted; but the material is put concisely in the same sequence but without formal sections. The other instructions are the same as in the caseof the full-length articles.
Tables
Tables should not form more than 20% of the text. Each table should be typed on separate sheet and should have on the top a tablenumber (in Arabic numerals viz. 1, 2, 3 etc.) and a caption or title which should be short, but sufficiently explanatory of the data included inthe table. Information in the table should never duplicate that in the text and vice versa. Symbols (asterisks, daggers, etc. or small letters, viz.,a, b, etc.) should be used to indicate footnotes to tables. Maximum size of table acceptable is what can be conveniently composed within onefull printed page of the journal. Over-sized tables will be rejected out-right. Such tables may be suitably split into two or more small tables.
The data in tables should be corrected to minimum place of decimal so as to make it more meaningful. Do not use full stop with CD,SEm±, NS (not C.D., S.E.m±, N.S.). Do not put cross-rules inside the table. Tables should be numbered consecutively and their approximatepositions indicated in the margin of the manuscript. Tables should not be inserted in the body of the text. Type each table on a separate sheet. Do not use capital letters for the tabular headings, do not underline the words and do not use a full-stop at the end of the heading. All the tablesshould be tagged with the main body of the text i.e. after references.
iii
Figures
Figures include diagrams and photographs. Laser print outs of line diagrams are acceptable while dot-matrix print outs will be rejected. Alternatively, each illustration can be drawn on white art card or tracing cloth/ paper, using proper stencil. The lines should be bold and ofuniform thickness. The numbers and letterings must be stenciled; free-hand drawing will not be accepted. Size of the illustrations as well asnumbers, and letterings should be sufficiently large to stand suitable reduction in size. Overall size of the illustrations should be such that onreduction, the size will be the width of single or double column of the printed page of the Journal. Legends, if any, should be included withinthe illustration. Each illustration should have a number followed by a caption typed/ typeset well below the illustration.
Title of the article and name(s) of the author(s) should be written sufficiently below the caption. The photographs (black and white)should have a glossy finish with sharp contrast between the light and the dark areas. Colour photographs/ figures are not normally accepted.One set of the original figures must be submitted along with the manuscript, while the second set can be photocopy. The illustrations shouldbe numbered consecutively in the order in which they are mentioned in the text. The position of each figure should be indicated in the marginof the text. The photographs should be securely enclosed with the manuscript after placing them in hard board pouches so that there may notbe any crack or fold. Photographs should preferably be 8.5 cm or 17 cm wide or double the size. The captions for all the illustrations (includingphotographs) should be typed on a separate sheet of paper and placed after the tables.
Expression of Plant Nutrients on Elemental Basis
The amounts and proportions of nutrient elements must be expressed in elemental forms e.g. for ion uptake or in other ways as neededfor theoretical purposes. In expressing doses of nitrogen, phosphatic, and potassic fertilizers also these should be in the form of N, P and K,respectively. While these should be expressed in terms of kg/ha for field experiments, for pot culture studies the unit should be in mg/kg soil.
SI Units and Symbols
SI Units (System International d 'Unities or International System of Units) should be used. The SI contains three classes of units: (i) base units,(ii) derived units, and (iii) supplementary units. To denote multiples and sub-multiples of units, standard abbreviations are to be used. Clark'sTables: Science Data Book by Orient Longman, New Delhi (1982) may be consulted.
Some of these units along with the corresponding symbols are reproduced for the sake of convenience.
Names and Symbols of SI Units
Physical Symbol for SI Unit Symbol Remarks quantity physical quantity for SI Unit
Primary Units
length l time t
metre m second s
mass m electric current I
kilogram kg ampere A
Secondary Units
plane angle radian rad Solid angle steradian sr
Unit Symbols
centimetre cm microgram mg
cubic centimetre cm3 micron mm
cubic metre m3 micronmol mmol
day d milligram mg
decisiemens dS millilitre mL
degree-Celsium °C [=(F-32)x0.556] minute min
iv
gram g nanometre nm
hectare ha newton N
hour h pascal Pa
joule J (=107 erg or 4.19 cal.) second s
kelvin K (=°C+273) square centimetre cm2
kilogram kg square kilometre km2
kilometre km tonne t
litre L watt W
megagram Mg
Some applications along with symbols
adsorption energy J/mol (=cal/molx4.19) leaf area m2/kg
cation exchangecapacity
cmol (p+)/kg (=m.e./100 g) nutrient content in plants(drymatter basis)
mg/g, mg/g or g/kg
Electrolytic conductivity dS/m (=mmhos/cm) root density or root lengthdensity
m/m3
evapotranspiration rate m3/m2/s or m/s soil bulk density Mg/m3 (=g/cm3)
heat flux W/m2 specific heat J/kg/K
gas diffusion g/m2/s or m3/m2/s or m/s specific surface area of soil m2/kg
water flow kg/m2/s (or) m3m2s (or) m/s thermal conductivity W/m/K
gas diffusivity m2/s transpiration rate mg/m2/s
hydraulic conductivityion uptake
m/s water content of soil kg/kg or m3/m3
(Per kg of dry plantmaterial)
mol/kg water tension kPa (or) MPa
While giving the SI units the first letter should not be in capital i.e cm, not Cm; kg not Kg. There should not be a full stop at the endof the abbreviation: cm, not cm. kg, not kg.; ha, not ha.
In reporting the data, dimensional units, viz., M (mass), L (length), and T (time) should be used as shown under some applications above.Some examples are: 120 kg N/ha; 5 t/ha; 4 dS/m etc.
Special Instructions
I. In a series or range of measurements, mention the unit only at the end, e.g. 2 to 6 cm2, 3, 6, and 9 cm, etc. Similarly use cm2, cm3instead of sq cm and cu m.
II. Any unfamiliar abbreviation must be identified fully (in parenthesis).
III. A sentence should not begin with an abbreviation.
IV. Numeral should be used whenever it is followed by a unit measure or its abbreviations, e.g., 1 g, 3 m, 5 h, 6 months, etc. Otherwise,words should be used for numbers one to nine and numerals for larger ones except in a series of numbers when numerals should beused for all in the series.
V. Do not abbreviate litre to` l' or tonne to `t'. Instead, spell out.
VI. Before the paper is sent, check carefully all data and text for factual, grammatical and typographical errors.
v

VII. Do not forget to attach the original signed copy of `Article Certificate' (without any alteration, overwriting or pasting) signed by allauthors.
VIII. On revision, please answer all the referees' comments point-wise, indicating the modifications made by you on a separate sheet induplicate.
IX. If you do not agree with some comments of the referee, modify the article to the extent possible. Give reasons (2 copies on a separatesheet) for your disagreement, with full justification (the article would be examined again).
X. Rupees should be given as per the new symbol approved by Govt. of India.
Details of the peer review process
Manuscripts are received mainly through e-mails and in rare cases, where the authors do not have internet access, hard copies of themanuscripts may be received and processed. Only after the peer review the manuscripts are accepted for publication. So there is no assuredpublication on submission. The major steps followed during the peer review process are provided below.
Step 1. Receipt of manuscript and acknowledgement: Once the manuscript is received, the contents will be reviewed by the editor/associateeditors to assess the scope of the article for publishing in JOR. If found within the scope of the journal, a Manuscript (MS) number is assignedand the same will be intimated to the authors. If the MS is not within the scope and mandate of JOR, then the article will be rejected and thesame is communicated to the authors.
Step 2. Assigning and sending MS to referees: Suitable referees will be selected from the panel of experts and the MS (soft copy) will be sentto them for their comments - a standard format of evaluation is provided to the referees for evaluation along with the standard format of thejournal articles and the referees will be given 4-5 week time to give their comments. If the comments are not received, reminders will be sentto the referees for expediting the reviewing process and in case there is still no response, the MS will be sent to alternate referees.
Step 3. Communication of referee comments to authors for revision: Once the referee comments and MS (with suggestions/ corrections) arereceived from the referees, depending on the suggestions, the same will be communicated to the authors with a request to attend to thecomments. Authors will be given stipulated time to respond and based on their request, additional time will be given for attending to all thechanges as suggested by referees. If the referees suggest no changes and recommend the MS for publication, then the same will becommunicated to the authors and the MS will be taken up for editing purpose for publishing. In case the referees suggest that the article cannotbe accepted for JOR, then the same will be communicated to the authors with proper rationale and logic as opined by the referees as well asby the editors.
Step 4. Sending the revised MS to referees: Once the authors send the revised version of the articles, depending on the case (like if majorrevisions were suggested by referees) the corrected MS will be sent to the referees (who had reviewed the article in the first instance) for theircomments and further suggestions regarding the acceptability of publication. If only minor revisions had been suggested by referees, then theeditors would look into the issues and decide take a call.
Step 5. Sending the MS to authors for further revision: In case referees suggest further modifications, then the same will be communicated tothe authors with a request to incorporate the suggested changes. If the referees suggest acceptance of the MS for publication, then the MS willbe accepted for publication in the journal and the same will be communicated to the authors. Rarely, at this stage also MS would be rejectedif the referees are not satisfied with the modifications and the reasoning provided by the authors.
Step 6. Second time revised articles received from authors and decision taken: In case the second time revised article satisfies all the queriesraised by referees, then the MS will be accepted and if not satisfied the article will be rejected. The accepted MS will be taken for editing processwhere emphasis will be given to the language, content flow and format of the article.
Then the journal issue will be slated for printing and also the pdf version of the journal issue will be hosted on journal webpage.
Important Instructions
• Data on field experiments have to be at least for a period of 2-3 years
• Papers on pot experiments will be considered for publication only as short communications
• Giving coefficient of variation in the case of field experiments Standard error in the case of laboratory determination is mandatory. Forrigorous statistical treatment, journals like Journal of Agricultural Science Cambridge, Experimental Agriculture and Soil Use andManagement should serve as eye openers.
vi
SPECIAL ANNOUNCEMENT
In a recently conducted Executive Committee meeting of the Indian Society of Oilseeds Research, it was decided to increase the scope of theJournal of Oilseeds Research by accommodating vibrant aspects of scientific communication. It has been felt that, the horizon of scientificreporting could be expanded by including the following types of articles in addition to the Research Articles, Shor Communications and ReviewArticles that are being published in the journal as of now.
Research accounts (not exceeding 4000 words, with cited references preferably limited to about 40-50 in number): These are the articles thatprovide an overview of the research work carried out in the author(s)' laboratory, and be based on a body of their published work. The articlesmust provide appropriate background to the area in a brief introduction so that it could place the author(s)' work in a proper perspective. Thiscould be published from persons who have pursued a research area for a substantial period dotted with publications and thus research accountwill provide an overall idea of the progress that has been witnessed in the chosen area of research. In this account, author(s) could also narratethe work of others if that had influenced the course of work in authors' lab.
Correspondence (not exceeding 600 words): This includes letters and technical comments that are of general interest to scientists, on the articlesor communications published in Journal of Oilseeds Research within the previous four issues. These letters may be reviewed and edited by theeditorial committee before publishing.
Technical notes (less than 1500 words and one or two display items): This type of communication may include technical advances such as newmethods, protocols or modifications of the existing methods that help in better output or advances in instrumentation.
News (not exceeding 750 words): This type of communication can cover important scientific events or any other news of interest to scientistsin general and vegetable oil research in particular.
Meeting reports (less than 1500 words): It can deal with highlights/technical contents of a conference/ symposium/discussion-meeting, etc.conveying to readers the significance of important advances. Reports must
Meeting reports should avoid merely listing brief accounts of topics discussed, and must convey to readers the significance of an importantadvance. It could also include the major recommendations or strategic plans worked out.
Research News (not exceeding 2000 words and 3 display items): These should provide a semi-technical account of recently published advancesor important findings that could be adopted in vegetable oil research.
Opinion (less than 1200 words): These articles may present views on issues related to science and scientific activity.
Commentary (less than 2000 words): This type of articles are expected to be expository essays on issues related directly or indirectly to researchand other stake holders involved in vegetable oil sector.
Book reviews (not exceeding 1500 words): Books that provide a clear in depth knowledge on oilseeds or oil yielding plants, production,processing, marketing, etc. may be reviewed critically and the utility of such books could be highlighted.
Historical commentary/notes (limited to about 3000 words): These articles may inform readers about interesting aspects of personalities orinstitutions of science or about watershed events in the history/development of science. Illustrations and photographs are welcome. Brief itemswill also be considered.
Education point (limited to about 2000 words): Such articles could highlight the material(s) available in oilseeds to explain different conceptsof genetics, plant breeding and modern agriculture practices.
Note that the references and all other formats of reporting shall remain same as it is for the regular articles and as given in Instructions to Authors
o0o
vii


