+ All Categories
Home > Documents > 8 Human Population Chapter Objectives

8 Human Population Chapter Objectives

Date post: 26-Jan-2023
Category:
Upload: khangminh22
View: 1 times
Download: 0 times
Share this document with a friend
16
8 Human Population Chapter Objectives This chapter will help students: Perceive the scope of human population growth Assess divergent views on population growth Evaluate how human population, affluence, and technology affect the environment Explain and apply the fundamentals of demography Outline and assess the concept of demographic transition Describe how wealth and poverty, the status of women, and family planning affect population growth Characterize the dimensions of the HIV/AIDS epidemic Link population goals to sustainable development goals Lecture Outline I. Central Case: Chinas One-Child Policy A. The Peoples Republic of China is the worlds most populous nation, home to one-fifth of the 6.9 billion people living on Earth. B. Under Mao Zedongs leadership, improved food production and distribution and better medical care have allowed Chinas population to swell, causing environmental problems, and raising the TFR to 5.8. C. The government instituted a population-control program in the 1970s. 1. The program started with education and outreach efforts encouraging people to marry later and have fewer children, and increasing the accessibility of contraceptives and abortion. 2. In 1979, the government decided to institute a system of rewards and punishments, enforcing a one-child limit per family.
Transcript

8

Human Population

Chapter Objectives This chapter will help students:

Perceive the scope of human population growth

Assess divergent views on population growth

Evaluate how human population, affluence, and technology affect the environment

Explain and apply the fundamentals of demography

Outline and assess the concept of demographic transition

Describe how wealth and poverty, the status of women, and family planning affect

population growth

Characterize the dimensions of the HIV/AIDS epidemic

Link population goals to sustainable development goals

Lecture Outline I. Central Case: China’s One-Child Policy

A. The People’s Republic of China is the world’s most populous nation, home to

one-fifth of the 6.9 billion people living on Earth.

B. Under Mao Zedong’s leadership, improved food production and distribution

and better medical care have allowed China’s population to swell, causing

environmental problems, and raising the TFR to 5.8.

C. The government instituted a population-control program in the 1970s.

1. The program started with education and outreach efforts encouraging

people to marry later and have fewer children, and increasing the

accessibility of contraceptives and abortion.

2. In 1979, the government decided to institute a system of rewards and

punishments, enforcing a one-child limit per family.

3. In 1984, the policy was relaxed, exempting rural areas and certain

minorities, thus minimizing opposition.

D. China’s growth rate is down to 0.5%; however, there have been unintended

consequences of the program, such as widespread killing of female infants and

an unbalanced sex ratio.

II. Our World at Seven Billion

A. The human population is growing rapidly.

1. Our global population grows by 80 million people each year.

2. Since 1975, the world’s population has added one billion humans every 12

years.

3. Our unprecedented growth is due to exponential growth.

4. For much of the 20th century, the growth rate of human population rose

from year to year.

B. Is population growth a problem?

1. Our ongoing burst of population growth has resulted from technological

innovations, improved sanitation, better medical care, increased

agricultural output, and other factors that have brought down death rates

and infant mortality rates.

2. In the past, population was universally regarded as a good thing.

3. Thomas Malthus and Paul and Annie Ehrlich believed differently, that

there are limits to human population growth.

4. There are many people today who deny that population growth is a

problem.

5. Under the Cornucopian view, resource depletion as a consequence of

greater numbers of people is not a problem if new resources can be found

to replace the depleted resources.

6. Environmental scientists argue that not all resources are replaceable by

others once they are depleted.

7. Even if resource substitution could enable indefinite population growth,

could we maintain the quality of life that we would desire, or would our

descendants have less space, less food, and less material wealth than the

average person does today?

C. Some national governments now fear falling populations.

1. Many governments have found it difficult to let go of the notion that

population growth increases a nation’s economic, political, and military

strength.

2. When birth rates decline, a population grows older.

D. Population is one of several factors that affect the environment.

1. The IPAT model represents how humans’ total impact (I) results from the

interaction among three factors—population (P), affluence (A), and

technology (T): I = P × A × T.

2. A sensitivity factor (S) can be added to the equation to denote how

sensitive a given environment is to human pressures: I = P × A × T × S.

3. Impact can generally be boiled down to either pollution or resource

consumption.

4. Modern-day China shows how all elements of the IPAT formula can

combine to result in tremendous environmental impact in very little time.

III. Demography

A. Earth has a carrying capacity for us.

1. The environment has a carrying capacity for our species, just as it does for

every other.

2. We have repeatedly raised this carrying capacity by developing technology

to overcome the natural limits on our population growth.

3. The most rigorous estimates of carrying capacity range from 1–2 billion

people living prosperously in a healthy environment, to 33 billion living in

extreme poverty in a degraded world of intensive cultivation without

natural areas.

B. Demography is the study of human population.

1. The application of population ecology principles to the study of statistical

change in human populations is the focus of the social science of

demography.

2. Demographers study population size, density, distribution, age structure,

and sex ratio, as well as birth and death rates, immigration and emigration.

3. Population size is the absolute number of individuals.

4. People are distributed unevenly over our planet.

a. This uneven distribution means that certain areas bear far more

environmental impact than others.

b. At the same time, areas with low population density are sensitive, and

thus vulnerable to environmental impacts.

5. Age structure diagrams show the number of people in each age class and

are especially valuable to demographers in predicting future dynamics of a

population.

a. A large concentration of individuals in young age groups portends a

great deal of reproduction.

6. The ratio of males to females, the sex ratio, can also affect population

dynamics.

a. The naturally occurring sex ratio in human populations at birth features

a slight preponderance of males.

b. A greatly distorted sex ratio can lead to problems. In China, selective

abortion of female fetuses has skewed the natural sex ratio.

C. Population change results from rates of birth, death, immigration, and

emigration.

1. In today’s world, immigration and emigration are playing an increasingly

large role because of the flow of refugees.

2. In recent decades, falling growth rates in many countries have led to an

overall decline in the global growth rate. This growth rate has declined

partially because of a steep drop in birth rates.

D. Total fertility rate influences population growth.

1. The total fertility rate (TFR) is the average number of children born per

woman during her lifetime.

2. Replacement fertility is the TFR that keeps the size of a population

stable; for humans, it is 2.1.

3. A lower infant mortality rate has reduced people’s tendency to conceive

many children in order to ensure that at least some survive.

4. Many other social factors play a role in reducing the emphasis on child

rearing.

5. The natural rate of population change is the change due to birth and

death rates alone, excluding migration.

E. Many nations have experienced the demographic transition.

1. Life expectancy is the average number of years that an individual in a

particular age group is likely to live.

2. Demographic transition is a theoretical model of economic and cultural

change that explains the trend of declining death and birth rates that occurs

when nations become industrialized.

a. The first stage, the pre-industrial stage, is characterized by conditions

in which both death rates and birth rates are high.

b. In the next stage, the transitional stage, death rates decline and birth

rates remain high.

c. The industrial stage creates employment opportunities, particularly

for women, causing the birth rate to fall.

d. In the final stage, the post-industrial stage, both birth rates and death

rates remain low and populations stabilize or decline slightly.

F. Is the demographic transition a universal process?

1. This transition has occurred in many European countries, the United

States, Canada, Japan, and several other developed nations over the past

200–300 years.

2. It is a model that may or may not apply to all developing nations as they

industrialize now and in the future.

IV. Population and Society

A. Birth control is a key approach for controlling population growth.

1. Birth control limits the number of children one bears, by reducing the

frequency of pregnancy.

2. Birth control relies on contraception, the deliberate attempt to prevent

pregnancy despite sexual intercourse.

3. Family planning is the effort to plan the number and spacing of one’s

children, so as to assure children and parents the best quality of life

possible.

4. In many societies, planning for pregnancy is hindered by religious doctrine

or cultural influences, so contraceptives are denied to people who might

otherwise use them.

B. Empowering women reduces fertility rates.

1. Fertility rates have dropped most noticeably in nations where women have

gained improved access to contraceptives and to family planning

2. Unfortunately, many women still lack the information and personal

freedom of choice to allow them to make their own decisions about when

to have children and how many to have.

3. In societies in which women are freer to make reproductive decisions,

fertility rates have fallen, and the children are better cared for, healthier,

and better educated.

C. Population policies and family-planning programs are working around the

globe.

1. India was the first country to implement population control policies. After

strident policies in the 1970s led to the downfall of the government,

India’s efforts have been more modest and far less coercive, focusing on

family planning and reproductive healthcare to better manage the

population, which seems set to overtake China and become the world’s

most populous nation by the year 2030.

2. The government of Thailand has reduced birth rates and slowed population

growth, due to its education-based approach to family planning and the

increased availability of contraceptives

3. Brazil, Mexico, Iran, Cuba, and many other developing countries have

instituted programs to reduce their population growth that entail setting

targets and providing incentives, education, contraception, and

reproductive health care.

4. In 1994, the United Nations hosted a conference in Cairo on population

and development, at which 179 nations endorsed a platform calling for all

governments to offer universal access to reproductive health care within

20 years.

5. However, worldwide funding for family planning fell by well over a third

in the decade following the Cairo conference.

D. Poverty is correlated with population growth.

1. The causality is thought to operate in both directions: poverty exacerbates

population growth, and rapid population growth worsens poverty.

2. This is unfortunate from a social standpoint, because these people will be

added to the nations that are least able to provide for them.

E. Consumption from affluence impacts the environment.

1. Affluence and consumption are spread unevenly across the world, and

wealthy societies generally consume resources from regions far beyond

their own.

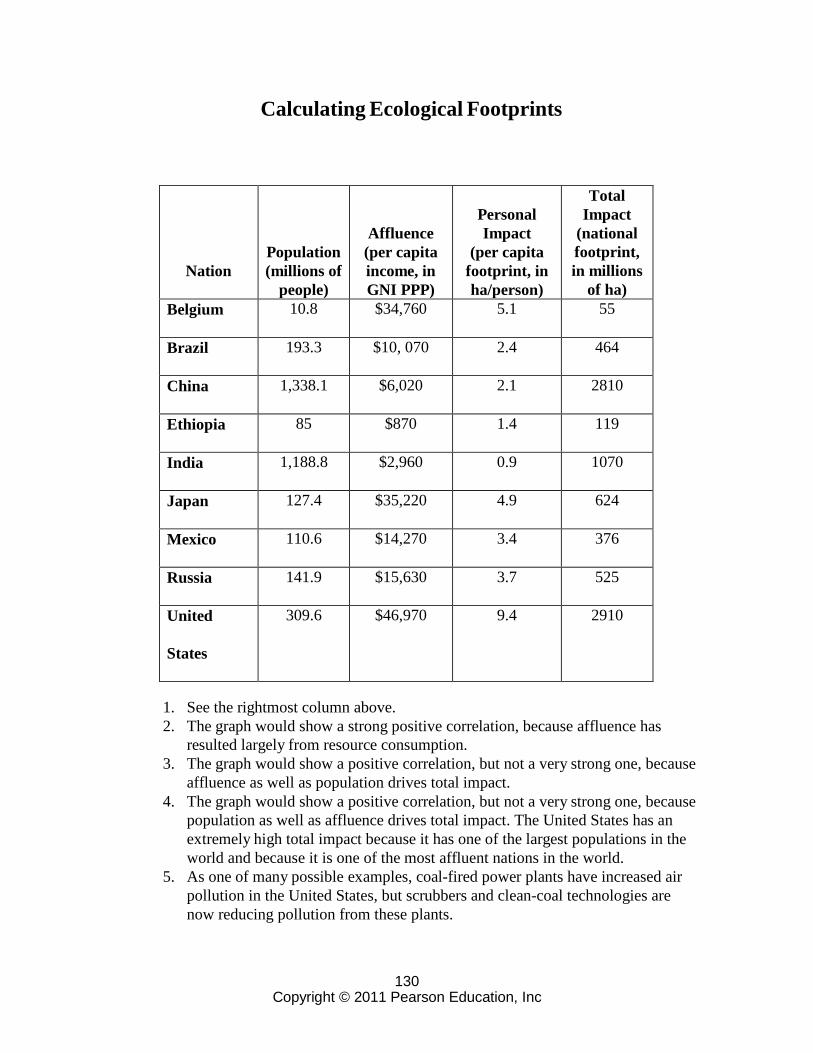
2. Individuals in affluent societies leave a larger ―ecological footprint‖ than

those in less affluent societies.

3. Because our footprint exceeds our biocapacity (amount of biologically

productive land and sea available to us) by 30% worldwide, we are

running a global ecological deficit, gradually draining our planet of its

natural capital and its long-term ability to support our civilization.

F. The wealth gap and population growth contribute to conflict.

1. The richest 20% of the world’s people uses 86% of the world’s resources.

2. As the gap between rich and poor grows wider and as the sheer numbers of

those living in poverty continue to increase, it seems reasonable to predict

increasing tensions between the ―haves‖ and ―have-nots.‖

G. HIV/AIDS is taking a major toll on African populations.

1. Of the world’s 33 million people infected with HIV/AIDS as of 2008, two-

thirds live in sub-Saharan Africa.

2. The AIDS epidemic is unleashing a variety of demographic changes.

3. Premature deaths, of both infants and young adults, are reducing the

average life expectancy in African nations.

4. HIV is well-established in the Caribbean and in Southeast Asia, and it is

spreading in eastern Europe and central Asia.

H. Demographic change has social and economic repercussions.

1. In sub-Saharan Africa, AIDS is undermining the ability of developing countries

to make the transition to modern technologies because it is taking away many of

the youngest and most productive members of society.

2. Governments of AIDS-infected countries are experiencing demographic

fatigue.

3. We may finally be turning the corner on this challenge, thanks to

government policy, international collaboration, medical research, nonprofit

aid groups, and the grassroots efforts of patients and their advocates.

I. Sustainable development and population goals go hand-in-hand.

1. If humanity’s overarching goal is to generate a high standard of living and

quality of life for all people, then developing nations must find ways to

slow their population growth.

2. However, those of us living in the developed world must also be willing to

reduce our consumption.

V. Conclusion

A. Although global populations are still growing, the rate of growth has

decreased nearly everywhere, and some countries are even seeing their

population decline.

B. There has been progress in expanding women’s rights worldwide. In addition

to the clear ethical progress of this development, it also helps to slow

population growth.

C. True sustainability demands that we stabilize our population size in time to

avoid destroying the natural systems that support our economies and societies.

Key Terms birth control

contraception

demographers

demographic transition

demography

family planning

industrial stage

IPAT model

life expectancy

Malthus, Thomas

Millenium Development Goals

natural rate of population change

post-industrial stage

pre-industrial stage

replacement fertility

total fertility rate (TFR)

transitional stage

122 Copyright © 2011 Pearson Education, Inc

Teaching Tips

1. The Population Connection is the new name for the organization that used to

be called Zero Population Growth (ZPG). Its website

(www.populationconnection.org) has a variety of fact sheets and programs,

including a campus outreach program for colleges and universities. The

organization will also present free workshops and trainings at your location and

at conferences.

2. Ask each student to adopt a country and research the status of its population,

including size, crude birth rate, crude death rate, life expectancy, infant

mortality, annual growth rate, and age structure. Current information can be

found on the ―People Facts and Figures‖ site at www.os-connect.com/pop.

To make this an interactive activity, require each student to present the

information to the class. Once presentations have been made, discuss the

similarities and differences among the countries. This can lead to a discussion

of the characteristics of ―developed countries‖ versus ―developing countries.‖

3. Death rates have dramatically declined in the United States over the past 100

years. To examine this change in greater detail, students can conduct a study on

percent survival. First, students will collect data from a local cemetery

(preferably one in which people were buried before 1900) and compare those

data to data from current newspaper obituary pages. Ask each student to record

the age at death for 20 individuals from each source. Students will then

organize the data according to 10-year age categories as shown below. There

will be two tables—one for cemetery data and the other for obituary data.

Percent survival is then calculated for each age category.

Age Group Number that Died Percent Surviving

0–10 A = (20 - A)/20 x 100

11–20 B = [20 - (A + B)] ÷ 20 x 100

21–30 C = [20 - (A + B + C)] ÷ 20 x 100

31–40 D etc.

41–50 E

51–60 F

61–70 G

71–80 H

81–90 I

91–100 J

Over 100 K = [20 - (sum of A . . . K)] ÷ 20 x

100

The resulting percent survival values can be graphed to show a survivorship

curve, with age classes on the x axis and the percent surviving values on the y

axis. In general, there are three classes of survivorship curves: Type I, Type II,

123 Copyright © 2011 Pearson Education, Inc

and Type III. A quick Internet search will find many websites explaining the

three classes (e.g., http://mathworld.wolfram.com/SurvivorshipCurve.html).

4. Use resources from the Population Reference Bureau (www.prb.org) for

classroom presentations and activities. The graphics bank contains over 100

PowerPoint slides with illustrations of population data. The graphics cover

international population and health topics (family planning, HIV/AIDS,

population trends,and so on). The website also links to the Center for Public

Information on Population Research, the Interagency Gender Working Group,

and the Population and Health InfoShare website. The link to the World

Population Data Sheet contains the latest population estimates, projections, and

other key indicators for 200 countries.

5. Initiate a discussion with these questions: ―Have you made any decisions

regarding children in your future?‖ ―Has any information you’ve learned this

term caused you to reconsider future plans for careers, family, or places that

you might choose to live?‖ By framing these questions as open-ended and

exploratory rather than accusatory, often very productive, insightful, and

engaging discussions are possible. It is essential that ground rules for a critical-

thinking classroom be set prior to discussions that contain sensitive topics.

Ground rules include: a safe space to share and reflect on what is offered by

others; disagree with a person’s viewpoint, but remain respectful of the person

who owns that viewpoint; and remain open-minded to the views of others by

being a good listener.

6. Whether your course is small or large, handing out lecture notes, assignments,

graded papers and the like take up valuable class time. Here are some tips to

minimize that time:

• Use two magazine/periodical files and an inbox. Label the file boxes ―Past

Handouts‖ and ―Graded Papers,‖ and place them on a table or counter near

the door.

• Put any handouts for the current day on the table in front of the boxes.

• Students bring assignments to the table and place them in the inbox. If any

students missed the last session, they can get the materials from the Past

Handouts box. They can check the Graded Papers box for prior assignments

you have handed back, and they can pick up today’s handouts in class.

• At the end of class, pick up the day’s handout, place it in a labeled folder,

and put it in the Past Handouts box. Pick up any new student assignments

from the inbox. Place the boxes in a cabinet or drawer until the next session.

• You need an additional Graded Papers box for each section of a course. The

Past Handouts box is the same, and you will empty the inbox at the end of

each class.

124 Copyright © 2011 Pearson Education, Inc

• If the class is larger than 50 students, you may find it easier to have several

Graded Papers boxes and several inboxes, labeled A–B, C–D, E–J

indicating students’ last names, and so on. Spread the sets of boxes out

around the perimeter of the classroom in a standard fashion so that students

know where their cohorts’ boxes are located.

• Remind students, as necessary, that they can access the boxes before class,

during a break, or after class, but that riffling through the boxes during class

time is not desirable.

Additional Resources

Websites

1. The Effect of China’s One-Child Family Policy after 25 Years, New England

Journal of Medicine (http://content.nejm.org/cgi/content/full/353/11/1171)

This link is to an article in the New England Journal of Medicine reviewing

China’s attempt to control human population.

2. Country Studies: China—Population Control Programs, Federal Research

Division, Library of Congress (http://countrystudies.us/china/34.htm)

This website is part of the Country Studies/Area Handbook Series, sponsored

by the U.S. Department of the Army between 1986 and 1998, which discusses

China’s population control policy. There are also links to more current

information.

3. Population and Economic Household Topics, U.S. Census Bureau

(www.census.gov/population/www)

This gateway provides population clocks for the United States and the world,

along with information about births, fertility, deaths, and migration in the

United States.

4. State of the World Population, United Nations Population Fund

(www.unfpa.org/swp/swpmain.htm)

This is a report by the United Nations Population Fund, the world’s largest

international source of funding for population and reproductive health

programs. Access to databases, maps, graphs, and previous years’ reports is

available.

5. UNAIDS, Joint United Nations Programme on HIV/AIDS (www.unaids.org/en)

This resource provides access to information, databases, and publications

concerning the global HIV/AIDS epidemic.

125 Copyright © 2011 Pearson Education, Inc

6. Carrying Capacity Network, (http://www.carryingcapacity.org/)

This organization provides sobering analyses of the global human population

dynamic. Topics include revisiting the demographic transition model, foreign

aid, and the future of agriculture in meeting human nutrition needs. CCN can

also be reached at: 2000 P Street NW, Suite 31, Washington, DC 20036. 800-

466-4866.

Audiovisual Materials

1. Jam Packed, 1997, video by Population Communications International and

distributed by The Video Project (http://videoproject.com)

This program looks at the human population growth problem from a young

person’s point of view.

2. Not the Numbers Game, 1997, video produced by Emily Marlow and Jenny

Richards for Television Trust for the Environment and distributed by Bullfrog

Films (www.bullfrogfilms.com)

This six-part series looks at how women are solving population and

development problems in Bosnia, Cambodia, India, Indonesia, Peru, and

Uganda.

3. Population Six Billion, 1999, video distributed by Films for the Humanities and

Sciences (www.films.com)

This program addresses life in developing nations while providing case studies

of population control initiatives in Vietnam, Uganda, and Mexico which include

family planning, HIV/AIDS testing and counseling, and sex education.

4. Paul Ehrlich and The Population Bomb, 1996, video distributed by Films for

the Humanities and Sciences (www.films.com)

Based on Ehrlich’s book The Population Bomb, this program features archival

footage from around the world, as well as interviews with Ehrlich, his

colleagues, and his critics.

Weighing the Issues: Facts to Consider

China’s Reproductive Policy

Facts to consider: Benefits of a reproductive policy such as China’s might include

a greater ability to provide food, health care, housing, and education, as well as

reduced environmental pressure. Problems might include social and legal

punishment for people who do not follow the policy; reduction in personal choice

126 Copyright © 2011 Pearson Education, Inc

about family decisions; pressure to favor one gender over another; and pressure on

industry, government finances, health care, families, and military forces because

fewer working-age people are available.. Alternative ways of dealing with the

resource demands of a quickly growing population include finding new resources to

replace depleted ones, both within the country and abroad (which may greatly

increase environmental pressure as resources become increasingly scarce); using

rewards for smaller families while refraining from punishments; and using more

efficient technologies to reduce resource-intensive processes andpollution.

Consequences of Low Fertility?

Facts to consider: A below-replacement fertility rate means that the population is

aging. Changes in the age composition of the population will alter patterns of

consumption. Most notably, an increase in the mean population age will trigger an

increasing demand for healthcare services. Working-age people will need to supply

the productivity and finances required to support the higher proportion of older,

retired people. Further observations may also be mentioned, based on a broader

student understanding of economics and social issues.

Students may discuss increased immigration to provide a labor force; a reduced

labor force, leading to wage increases and inflation, thus decreasing the purchasing

power of retirees; greater savings rates as families spend less on dependents; lower

savings rates as older people, lacking income, spend their savings; and increases in

the retirement age so as to reduce the demands on public welfare, as fewer younger

workers are putting in funds while more older workers receive entitlements and

services.

Abstaining from International Family Planning?

Facts to consider: The first of these questions requires an individual response. The

second question also requires a personal response, but students can approach it from

a consumption/tragedy of the commons perspective. In responding to the final

question, students may use some examples from the textbook, such as increased

education and the availability of contraceptives; fewer punitive measures and more

positive incentives to adhere to government policy; international monitoring groups,

to ensure that funds are used according to treaties; and measures assuring that

actions taken by those in charge of family planning do not discriminate or penalize

minority ethnic groups.

127 Copyright © 2011 Pearson Education, Inc

The Science behind the Stories:

Thinking Like a Scientist

Mapping Our Population’s Environmental Impact

Observation: Burgeoning numbers of people are making heavy demands on

Earth’s natural resources and ecosystem services.

Hypothesis: Human overuse of NPP can be quantified. Evidence can show that

we diminish resources for other species, alter habitats, communities, and

ecosystems, and that we threaten our future ability to derive ecosystem services.

Human impact can be judged by comparing human impacts in relation to the total

―potential‖ NPP.

Experiment: Haberl’s team began with a well-established model that maps how

vegetation varies with climate across the globe. The team used it to produce a

detailed world map of ―potential NPP‖—vegetation that would exist if there were

no human influence. They then gathered data for the year 2000 on crop harvests,

timber harvests, grazing pressure, and other human uses of vegetation from the

U.N. Food and Agriculture Organization’s (FAO) global databases and other

sources. They also gathered data on how people affect vegetation indirectly, such as

through fires, erosion, and soil degradation, and other changes due to land use. The

researchers calculated the proportion of NPP appropriated by people by dividing the

amounts used up in these impacts by the total ―potential‖ amount.

Results: Haberl’s group concluded that people harvest 12.5% of global NPP, and

reduce it 9.6% further through land use and 1.7% further through fires. This makes

us responsible for using up fully 23.8% of the planet’s NPP—a staggeringly large

amount for just a single species! Half of this use occurred on cropland, where

83.5% of NPP was used. In urban areas, 73.0% of NPP was consumed, while

19.4% was used on grazing land, and 6.6% in forests. A global map of NPP

consumption was produced.

Fertility Decline in Bangladesh

Observation: In Bangladesh—one of the most densely populated countries on the

planet—fertility declined dramatically from the late 1970s through the 1990s

despite high rates of poverty, illiteracy, and gender inequality.

Hypothesis: The Bangladeshi government and international aid organizations began

an aggressive campaign in the mid-1970s to provide women with access to and

information about contraceptives.

128 Copyright © 2011 Pearson Education, Inc

Experiment: Researchers measured the impact of outreach efforts on contraceptive

use and fertility rates in Matlab, an isolated rural area in Bangladesh with a high-

intensity family-planning outreach project. Matlab was compared to a similar

government-run program, which had a lower amount of training, services, and

community visits.

Results: In 1988, 10 years after the study began, Matlab Project director James

Phillips and his colleagues reviewed a decade’s worth of data collected by the

highly organized health surveillance system already in place. They found that

contraceptive use in Matlab was higher and fertility was lower than in the

comparison area. The results suggested that Bangladesh’s success was due to a

combination of widely available contraceptives and socially appropriate family

planning services, both of which were present in an intensified form in Matlab.

Question: Why was Matlab so successful in reducing fertility rates?

Hypothesis: Frequent visits from healthcare workers helped to convince women

that small families were desirable.

Study: Mary Arends-Kuenning of the University of Michigan surveyed families and

visiting health workers about the healthcare workers’ visits.

Results: Arends-Kuenning and her colleagues found no correlation between

patients’ perception of family size and the number of visits made by healthcare

workers, in either the Matlab study area or the control area with the government-run

program. It was proposed that the reason for the Matlab Project’s success was that it

helped women to realize an already-existing desire to have fewer children by

providing readily available contraceptives and education.

Answers to End-of-Chapter Questions Testing Your Comprehension

1. The human global population is approximately 6.7 billion people, with about

220,000 added daily.

2. In many cases, humans have been able to substitute one resource for another,

thereby avoiding environmental limitations at least temporarily. As to how long

this can be sustained, answers will vary.

3. Environmental scientists are generally convinced that the effects of resource

limitation cannot be avoided forever (i.e., that resources are not infinitely

substitutable). Cornucopians take the opposing view. Population growth is a

problem to the extent that it leads to crowding, resource depletion, reduced

standards of living, and environmental degradation.

4. The IPAT model says that our Impact on the environment is a function of

129 Copyright © 2011 Pearson Education, Inc

Population size, per capita Affluence, and our Technological choices.

Technology can either increase or decrease Impact—for example, choosing a

bicycle versus a sport utility vehicle for transportation, or choosing a compact

fluorescent lighting fixture versus an incandescent one.

5. Demographers study population size, density, distribution, age structure, sex

ratio, and rates of birth, death, immigration, and emigration. Each of these help

to determine our environmental impact, because they all affect P in the IPAT

model.

6. Total Fertility Rate (TFR) is the number of children the average woman in a

population will bear during her lifetime. The replacement TFR is 2.1 because

we have an approximately 50:50 sex ratio (two-parent couples) and there is

some risk of death during infancy and childhood (approximately 0.05 per child).

Europe’s TFR is significantly below the replacement rate of 2.1, and so European populations are beginning to decline in size.

7. Fertility rates fall in societies where families no longer rely heavily on children

for their economic productivity and for parental security in old age. They also

fall when society comes to the realization that the mortality rate has fallen, and

that their children are highly likely to survive to adulthood. All these trends are

taking place in nations that are industrialized and becoming more affluent.

8. During the transitional stage of the demographic transition process, death rates

have fallen but birth rates are still high. This results in a high population growth

rate. As birth rates fall to equal the low death rates, the population growth rate

falls toward zero.

9. Studies show that in many societies, women feel coerced into giving birth to

more children than they would choose to have. Moreover, poor educational

opportunities for women in many nations limit their professional opportunities

and encourage them to stay home and raise children. Family planning programs

provide information on birth control and on how to have a desirable number of

children that a family can support.

10. Poorer societies tend to place a higher economic value on their children, and

thus have more of them. The large and growing populations that result have an

increasing impact on the environment because of the increase in the P term of

the I = PAT relationship. Increased affluence tends to be accompanied by

decreased population growth rates, but the increase in the A term can also cause

an increase in the total impact on the environment due to an increase in resource

consumption.

130 Copyright © 2011 Pearson Education, Inc

Calculating Ecological Footprints

Nation

Population

(millions of

people)

Affluence

(per capita

income, in

GNI PPP)

Personal

Impact

(per capita

footprint, in

ha/person)

Total

Impact

(national

footprint,

in millions

of ha)

Belgium 10.8 $34,760 5.1 55

Brazil 193.3 $10, 070 2.4 464

China 1,338.1 $6,020 2.1 2810

Ethiopia 85 $870 1.4 119

India 1,188.8 $2,960 0.9 1070

Japan 127.4 $35,220 4.9 624

Mexico 110.6 $14,270 3.4 376

Russia 141.9 $15,630 3.7 525

United

States

309.6 $46,970 9.4 2910

1. See the rightmost column above.

2. The graph would show a strong positive correlation, because affluence has

resulted largely from resource consumption.

3. The graph would show a positive correlation, but not a very strong one, because

affluence as well as population drives total impact.

4. The graph would show a positive correlation, but not a very strong one, because

population as well as affluence drives total impact. The United States has an

extremely high total impact because it has one of the largest populations in the

world and because it is one of the most affluent nations in the world.

5. As one of many possible examples, coal-fired power plants have increased air

pollution in the United States, but scrubbers and clean-coal technologies are

now reducing pollution from these plants.


Recommended