168 Proceeding Paper for the World Environmental and Water Resources Congress, Hilton Omaha, Omaha, Nebraska. USA. EWRI & ASCE、May 21-25, 2006 A hydrologic analysis on inundation in the flooding area of the Mekong Delta, Cambodia -The combined deterministic and stochastic models for flood forecasting- K. Sothea 1 , A. Goto 2 and M. Mizutani 2 , 1 United Graduate School of Agriculture Sciences, Tokyo University of Agriculture and Technology. Utsunomiya University, Department of Agriculture Environmental Engineering, Mine-machi 350, Utsunomiya-shi, Tochigi Pref.321-8505; TEL. (81) 28- 6495504; FAX (81) 28-6495508; email: [email protected]2 Utsunomiya University, Faculty of Agriculture, Mine-machi 350, Utsunomiya shi, Tochigi Pref. 321-8505, Japan, TEL. (81) 28-6495497; FAX (81) 28-6495508; email: [email protected]; [email protected]. Abstract Since the watershed of the Mekong River is situated under the typical monsoon climate, the Mekong River presents a distinct variation in its water levels between the dry and rainy seasons, and causes heavy inundation in the Delta area along the river every year. In order to analyze the flow phenomena and inundation process for agricultural practice in the Mekong Delta, this study tried to establish three models: the combine of “3*4+1-type” model and the ARMA time series model, Tonle Sap Lake Storage Model and Delta Water Balance Model. The “3*4+1- type” Model was employed to calculate the runoff of the Lower Mekong River Basin from Chiang Saen to Kompong Cham and its sub catchments. The ARMA time series model was applied to the residuals of the Tank Model application in order to obtain 1 day to 5 days ahead flow forecasting after the present day based on the available data of the present day. The inflow to the Tonle Sap Lake was also estimated by the “3*4+1- type” Model, whereas outflow of the lake was formulated based on the relationship between storage volumes and water level of the Lake surface. The application of the ARMA to the “3*4+1-type” model was found effective to improve flood forecasting at the outlets point of each sub-catchment. The established storage model for the Tonle Sap Lake could calculate well for simulating the outflow and the seasonal water balance of the Tonle Sap area. Deltaic area was divided into four zones, and water balance of each zone was formulated by considering the zone’s inflow/outflow between rivers and flooding areas. The establishment of these three models could provide a basic framework for modeling the Mekong Delta, Cambodia.
Transcript
168
Proceeding Paper for the World Environmental and Water Resources Congress, Hilton Omaha, Omaha, Nebraska. USA.
EWRI & ASCE 、、、、May 21----25, 2006
A hydrologic analysis on inundation in the flooding area of the Mekong
Delta, Cambodia -The combined deterministic and stochastic models for flood forecasting-
K. Sothea1, A. Goto2 and M. Mizutani2,
1United Graduate School of Agriculture Sciences, Tokyo University of Agriculture and Technology. Utsunomiya University, Department of Agriculture Environmental Engineering, Mine-machi 350, Utsunomiya-shi, Tochigi Pref.321-8505; TEL. (81) 28-6495504; FAX (81) 28-6495508; email: [email protected] 2Utsunomiya University, Faculty of Agriculture, Mine-machi 350, Utsunomiya shi, Tochigi Pref. 321-8505, Japan, TEL. (81) 28-6495497; FAX (81) 28-6495508; email: [email protected]; [email protected] . Abstract
Since the watershed of the Mekong River is situated under the typical monsoon climate, the Mekong River presents a distinct variation in its water levels between the dry and rainy seasons, and causes heavy inundation in the Delta area along the river every year. In order to analyze the flow phenomena and inundation process for agricultural practice in the Mekong Delta, this study tried to establish three models: the combine of “3*4+1-type” model and the ARMA time series model, Tonle Sap Lake Storage Model and Delta Water Balance Model. The “3*4+1- type” Model was employed to calculate the runoff of the Lower Mekong River Basin from Chiang Saen to Kompong Cham and its sub catchments. The ARMA time series model was applied to the residuals of the Tank Model application in order to obtain 1 day to 5 days ahead flow forecasting after the present day based on the available data of the present day. The inflow to the Tonle Sap Lake was also estimated by the “3*4+1- type” Model, whereas outflow of the lake was formulated based on the relationship between storage volumes and water level of the Lake surface. The application of the ARMA to the “3*4+1-type” model was found effective to improve flood forecasting at the outlets point of each sub-catchment. The established storage model for the Tonle Sap Lake could calculate well for simulating the outflow and the seasonal water balance of the Tonle Sap area. Deltaic area was divided into four zones, and water balance of each zone was formulated by considering the zone’s inflow/outflow between rivers and flooding areas. The establishment of these three models could provide a basic framework for modeling the Mekong Delta, Cambodia.
169
Introduction
Flooding of Mekong River has remained a major problem for human settlements and rural infrastructures, and cause serious damage to agricultural production in the low-lying area of Mekong Delta every year. For example, at Phnom Penh, the difference between the minimum and maximum water level reaches as much as 8-10 meters. Identifying the inundation processes has been attempted for many years, and still has not been completely attained. To accomplish this goal and based on data availability, this study tried to establish three basic models that could represent the inundation process and flow phenomena of the Mekong Delta in Cambodia. These three models are: the combination model between the “3*4+1-type” model and the ARMA time series model for flood forecasting, the Storage Model for estimation of inflow and outflow of the Tonle Sap Lake and the Water Balance Model for calculation of water level in each divided zone of the low-lying area in Cambodia. These models are to be used for evaluating the impact of inflow into the low-lying area of the Mekong Delta, Cambodia. Several advanced models have been developed since the early 1960s for the Mekong River to simulate hydrological processes, such as flood control, water balance and related water resources development, by various organizations and consultants. Carbonnel et al.(1962~63) conducted a project research on sedimentology and hydrology of Tonle Sap Lake. Though it still provides useful data and information, the up-to-date topographic, hydraulic and hydrologic data are necessary for accurate calculation of water balance in the present condition. In addition to this, Kite G. (2000) applied SLURP model (Semi-Distributed Land-Use Runoff Process) with Muskingum-Cunge method to estimate runoff of the Mekong River from Yunnan (China) to the South China Sea in Vietnam, based on data obtained from internet and some public institutions (MRC’s). Tawatachi T. (2001) applied a simple tank model (4 tanks in one column) combined with autoregressive (AR) model for flood forecasting in the Pasak River of the Chao Phraya River watershed. The combination of the “3*4+1-type” and ARMA time series models was applied for the Lower Mekong Basin from Chiang Saen to Kg. Cham. The “3*4+1-type” model was used also to estimate the inflow from the Tonle Sap Lake catchments. Daily water balance of the lake and deltaic areas were formulated based on the relationship between the storage volumes and water levels of the Lake Surface and deltaic areas. Catchment Characteristic The Mekong River is one of the world’s 12 largest rivers, and rated as the 14th by volume and discharges measured at Pakse in Laos PDR. It covers the drainage area of 795,000 km2 with length 4,500 km. The river starts in Tibet at elevation of 5,000 m of China and flows through Myanmar, Thailand, Lao, Cambodia and Viet Nam before reach the South China Sea. The Lower Mekong Basin covered about 609,000 km2 in
170
0 100 200 300 400㎞
ⅠⅠⅠⅠ
ⅡⅡⅡⅡ
ⅢⅢⅢⅢ
ⅣⅣⅣⅣ
ⅤⅤⅤⅤ
●
●
●
●
● ●
ⅦⅦⅦⅦ
ⅥⅥⅥⅥ
N
S
W ECHIANGSAEN
LUANGPRABANG
VIENTIANE
MUKDAHAN
UBONPAKSE
① ③
④
⑤ ⑥
KG.CHAM
⑦
②
0 100 200 300 400㎞
ⅠⅠⅠⅠ
ⅡⅡⅡⅡ
ⅢⅢⅢⅢ
ⅣⅣⅣⅣ
ⅤⅤⅤⅤ
●
●
●
●
● ●
ⅦⅦⅦⅦ
ⅥⅥⅥⅥ
N
S
W ECHIANGSAEN
LUANGPRABANG
VIENTIANE
MUKDAHAN
UBONPAKSE
① ③
④
⑤ ⑥
KG.CHAM
⑦
②
B
A1
A2
A3
A4
z1
z2
z3
Q upper zones
Q root zones
Rainfall
ETa
B
A1
A2
A3
A4
z1
z2
z3
Q upper zones
Q root zones
Rainfall
ETa
B
A1
A2
A3
A4
z1
z2
z3
Q upper zones
Q root zones
B
A1
A2
A3
A4
z1
z2
z3
B
A1
A2
A3
A4
z1
z2
z3
Q upper zones
Q root zones
Rainfall
ETa
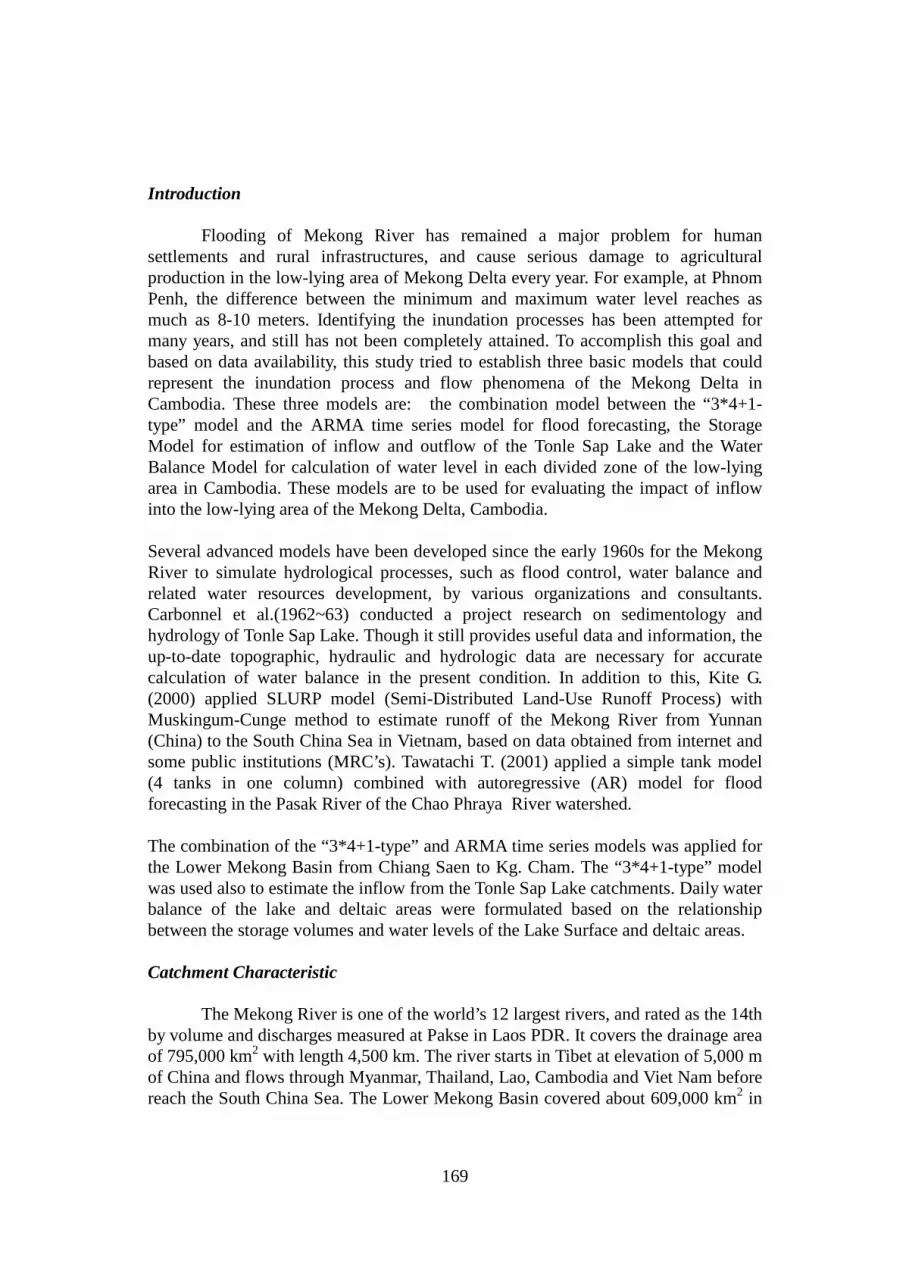
four riparian countries, Cambodia, Laos, Thailand and Vietnam (about 77% of the Mekong total catchment) from Chiang Saen (the borders of Myanmar, Thailand and Lao at altitude of 500 m) to the Sea in Vietnam. The Tonle Sap Lake is the largest freshwater lake in Southeast Asia and is important source for agricultural production and fishery in Cambodia. From May to the end of October, when the water level of the Mekong River is high, water flows through the Tonle Sap River and fills the Lake up to five times its normal size, from about 2,500 km2 to 15,000 km2 depending on the flood intensity. During the year, the lake’s water level varies from 1 meter above the mean sea level (MSL) in the dry season to 9 meters in the rainy seasons. The Mekong Delta in Cambodia comprises about 963,000 hectares. The Delta has a rather flat topographical feature and lies at a low elevation varying from 0.6 to 10 meters on average. Data were available for 39 rainfall and 12 stream gauging stations spread across the modeling catchments for the Tank Model and 14 rainfall and 2 stream gauging stations for the Tonle Sap Lake Model. The outline of study area in the Lower Mekong Basin is shown Figure 1. In 1996, Cambodia experienced serious floods due to the rapid flow of the Mekong River caused by storm rainfall in the upstream countries and in the mountainous regions. Consequently, the years of 1995, 1996 and 1997 were chosen for this analysis.
Figure 1. The outline of the study area with application of “3*4+1- type” model Description of model and its application 1. The “3*4+1- type” Tank Model. In a non-humid basin, some parts are wet and the remaining parts are dry. Sugawara M. (1974) proposed the 4*4 type Tank Model
171
0
5000
10000
15000
20000
1 51 101 151 201 251 301 351Day
Dis
char
ge, (
m3 /s
ec)
0
100
200
300
400
Rai
nfal
l, (m
m)
Qobs
Qcal
Mukdahan
0
20000
40000
60000
1 51 101 151 201 251 301 351Day
Dis
char
ge,
(m3 /s
ec)
0
100
200
300
400
Rai
nfal
l, (m
m)
Qobs
Qcal
Kg. Cham
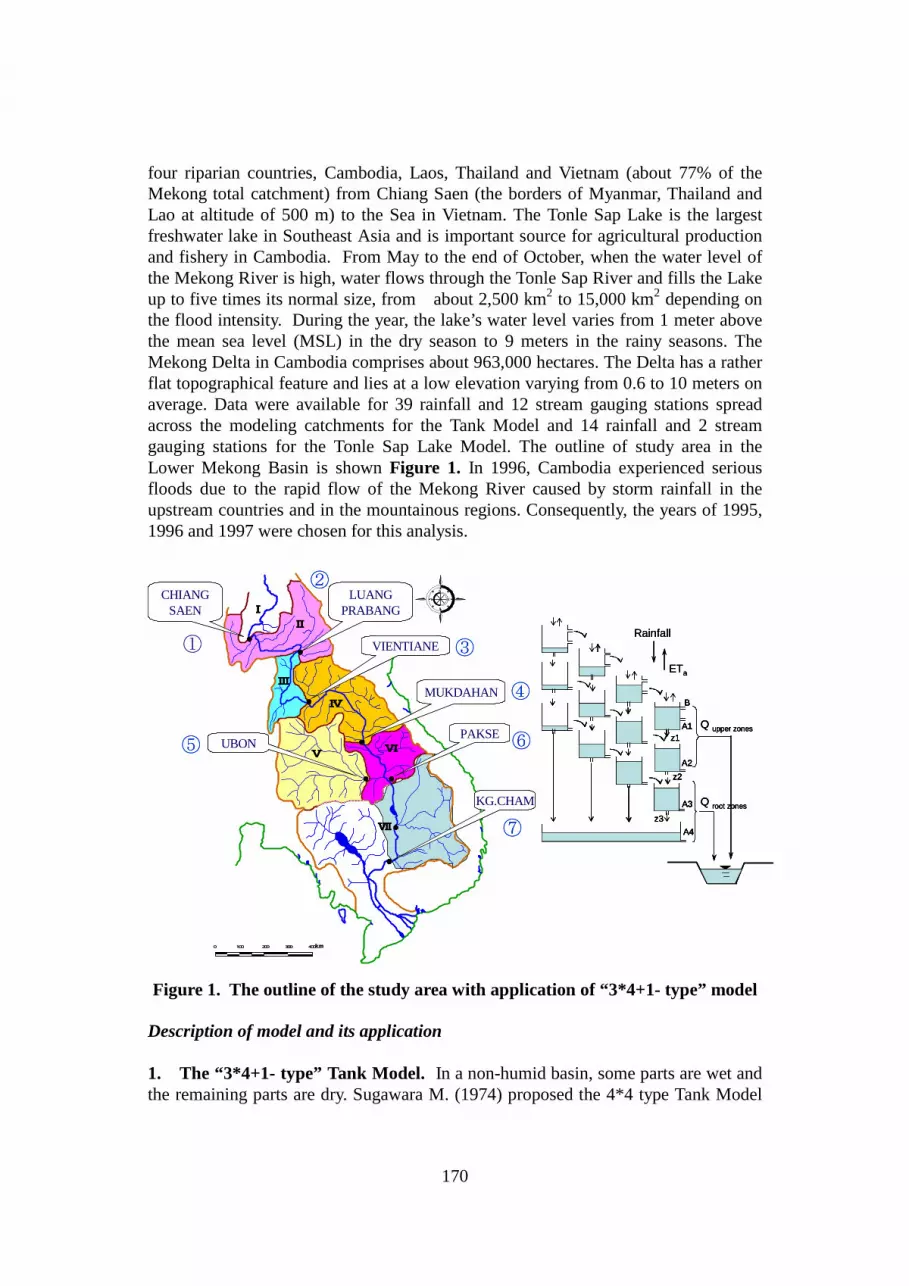
to be applied for the watershed having dry season. Tatano M. et al. (1999) applied the 4*4 type model for the Lower Mekong River Basin. It showed that the “4*4-type” Tank Model had a tendency to show too much increase in stored water in the lowest tank of the nearest column to the river. Therefore, the modification of the model structure from the “4*4” to “3*4+1- type” model was examined. The “3*4+1- type” model consists of 13 storage tanks with four columns, in which each column has three storage tanks. Each of the four columns is connected with a ground water tank as illustrated in figure 1. The coefficient for the hole sizes and hole heights are the model parameters. For simplicity in model calibration, the same set of parameter values can be adapted in every column. To separate the channel flow from the slope water moment, an open book scheme was employed, in which catchment is presented as a quadrangle with a straight channel. The “3*4+1” Model, coupled with the Kinematic wave for channel routing sub-model, was employed to calculate the runoff from the drainage area of 471,995 km2 from Chiang Sean to Kg. Cham. The whole drainage area was divided into six sub-catchments (II~VII), and one Tank Model was applied to each sub-catchment, as shown in figure1. Model calibration was done for the year 1995 through the trial-and-error approach, and the data for 1996~97 were used for model validation. Figure 2 shows the obtained hydrograph of the catchment outlet at Mukdahan and Kg. Cham.
Figure. 2 The simulated runoff hydrographs at Mukdahan and Kg. Cham
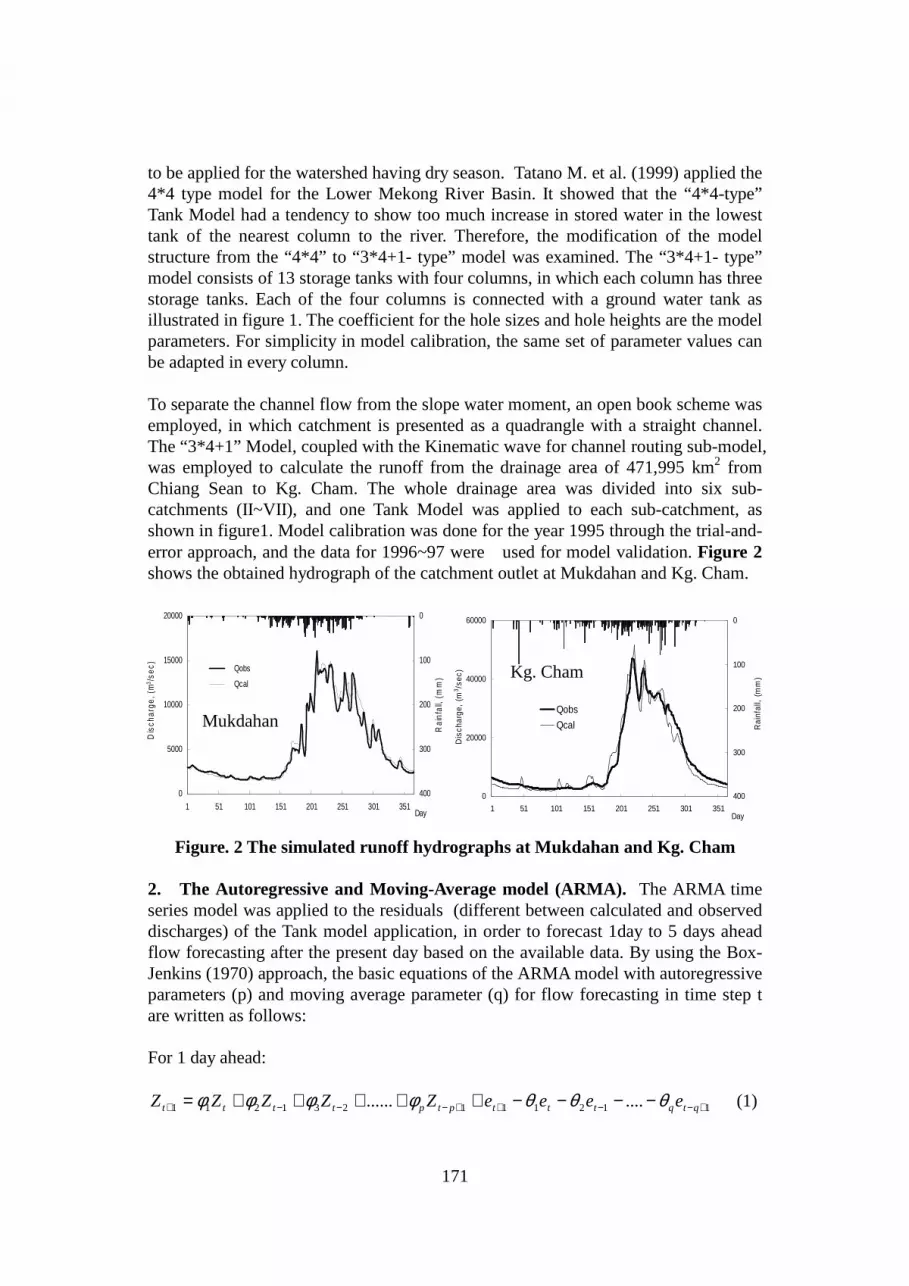
2. The Autoregressive and Moving-Average model (ARMA). The ARMA time series model was applied to the residuals (different between calculated and observed discharges) of the Tank model application, in order to forecast 1day to 5 days ahead flow forecasting after the present day based on the available data. By using the Box-Jenkins (1970) approach, the basic equations of the ARMA model with autoregressive parameters (p) and moving average parameter (q) for flow forecasting in time step t are written as follows: For 1 day ahead:
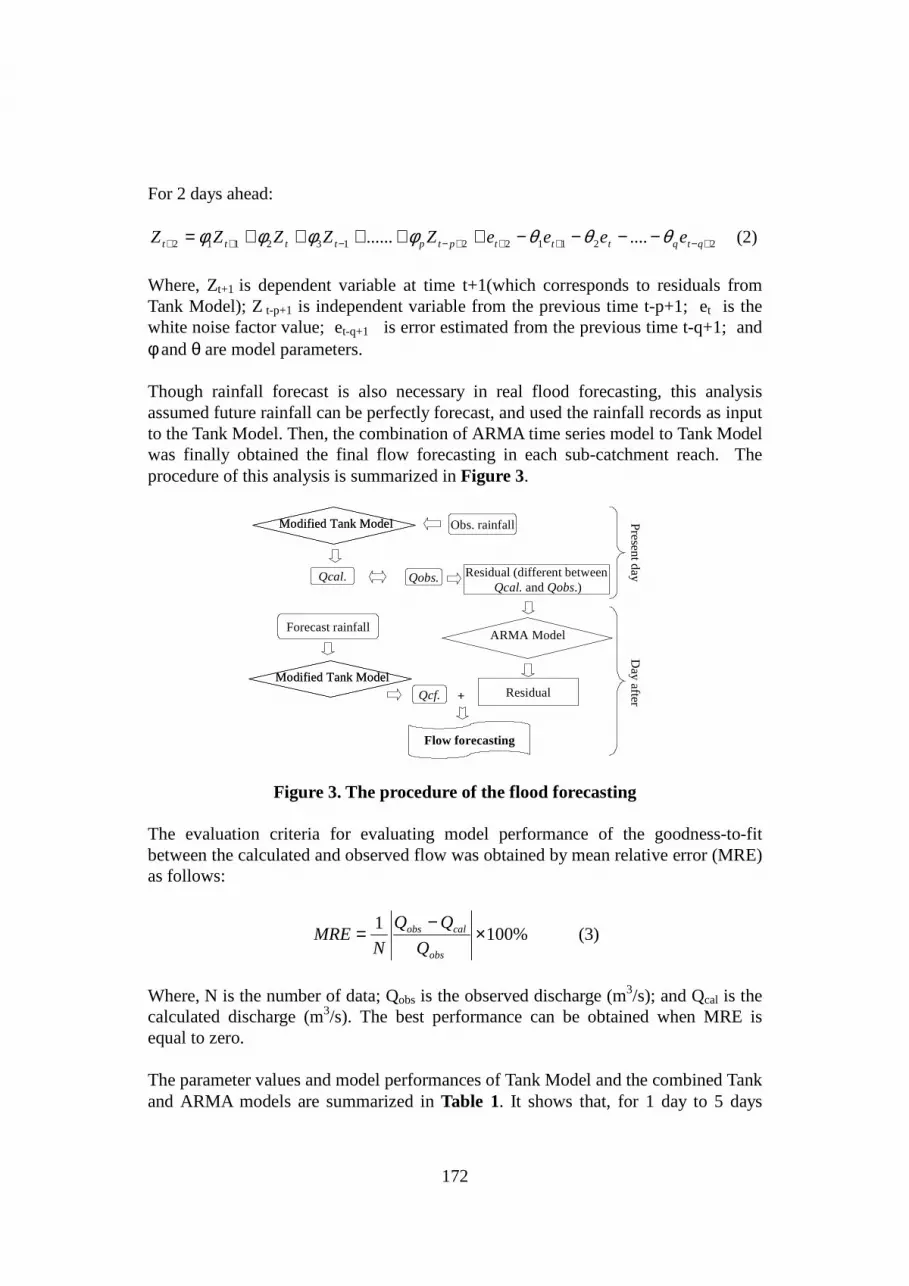
Where, Zt+1 is dependent variable at time t+1(which corresponds to residuals from Tank Model); Z t-p+1 is independent variable from the previous time t-p+1; et is the white noise factor value; et-q+1 is error estimated from the previous time t-q+1; and φ and θ are model parameters. Though rainfall forecast is also necessary in real flood forecasting, this analysis assumed future rainfall can be perfectly forecast, and used the rainfall records as input to the Tank Model. Then, the combination of ARMA time series model to Tank Model was finally obtained the final flow forecasting in each sub-catchment reach. The procedure of this analysis is summarized in Figure 3.
Figure 3. The procedure of the flood forecasting
The evaluation criteria for evaluating model performance of the goodness-to-fit between the calculated and observed flow was obtained by mean relative error (MRE) as follows:
%1001 ×
−=
obs
calobs
Q
QQ
NMRE (3)
Where, N is the number of data; Qobs is the observed discharge (m3/s); and Qcal is the calculated discharge (m3/s). The best performance can be obtained when MRE is equal to zero.
The parameter values and model performances of Tank Model and the combined Tank and ARMA models are summarized in Table 1. It shows that, for 1 day to 5 days
173
0
500
1000
1500
200 210 220 230 240 250Day
Dis
cha
rge
(m3 /s
ec)
Observed f low
0
10000
20000
30000
40000
50000
193 213 233 253 273 293Day
Dis
char
ge(m
3 /sec
)
Observed flow
3 days after
5 days after
Ubon Kg. Cham
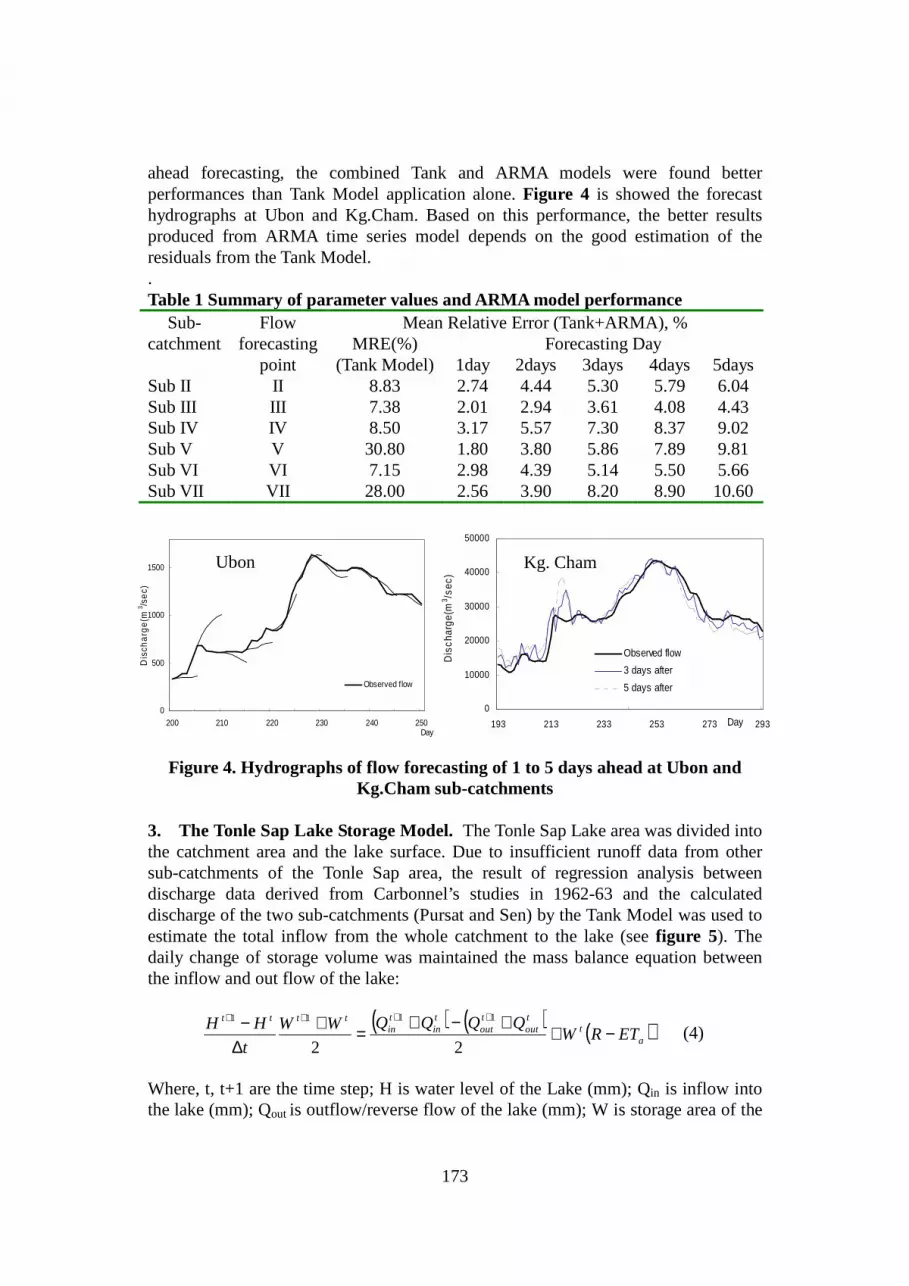
ahead forecasting, the combined Tank and ARMA models were found better performances than Tank Model application alone. Figure 4 is showed the forecast hydrographs at Ubon and Kg.Cham. Based on this performance, the better results produced from ARMA time series model depends on the good estimation of the residuals from the Tank Model. . Table 1 Summary of parameter values and ARMA model performance
Sub-catchment
Flow forecasting
point
Mean Relative Error (Tank+ARMA), % MRE(%)
(Tank Model) Forecasting Day
1day 2days 3days 4days 5days Sub II II 8.83 2.74 4.44 5.30 5.79 6.04 Sub III III 7.38 2.01 2.94 3.61 4.08 4.43 Sub IV IV 8.50 3.17 5.57 7.30 8.37 9.02 Sub V V 30.80 1.80 3.80 5.86 7.89 9.81 Sub VI VI 7.15 2.98 4.39 5.14 5.50 5.66 Sub VII VII 28.00 2.56 3.90 8.20 8.90 10.60
Figure 4. Hydrographs of flow forecasting of 1 to 5 days ahead at Ubon and
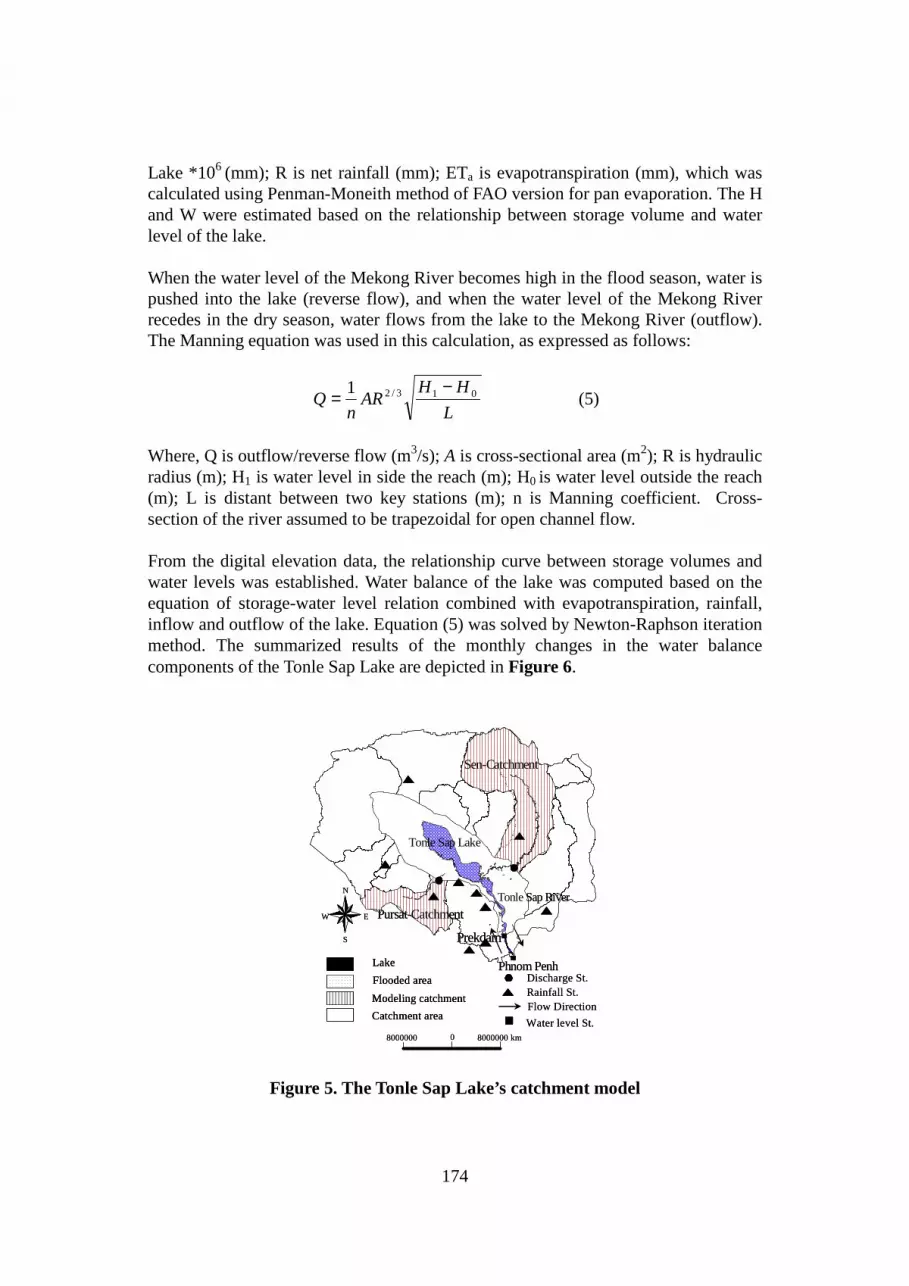
Kg.Cham sub-catchments 3. The Tonle Sap Lake Storage Model. The Tonle Sap Lake area was divided into the catchment area and the lake surface. Due to insufficient runoff data from other sub-catchments of the Tonle Sap area, the result of regression analysis between discharge data derived from Carbonnel’s studies in 1962-63 and the calculated discharge of the two sub-catchments (Pursat and Sen) by the Tank Model was used to estimate the total inflow from the whole catchment to the lake (see figure 5). The daily change of storage volume was maintained the mass balance equation between the inflow and out flow of the lake:
( ) ( ) ( )a
ttout
tout
tin
tin
tttt
ETRWQQQQWW
t
HH −++−+
=+∆− ++++
22
1111
(4)
Where, t, t+1 are the time step; H is water level of the Lake (mm); Qin is inflow into the lake (mm); Qout is outflow/reverse flow of the lake (mm); W is storage area of the
174
Sen-Catchment
Pursat-Catchment
Prekdam
Tonle Sap Lake
Phnom Penh
Tonle Sap RiverN
EW
S
Lake
Flooded area
Modeling catchment
Catchment area
Discharge St.Rainfall St.Flow Direction
Water level St.0 8000000 km8000000
Sen-Catchment
Pursat-Catchment
Prekdam
Tonle Sap Lake
Phnom Penh
Tonle Sap RiverN
EW
S
Lake
Flooded area
Modeling catchment
Catchment area
Lake
Flooded area
Modeling catchment
Catchment area
Discharge St.Rainfall St.Flow Direction
Water level St.0 8000000 km8000000
Lake *106 (mm); R is net rainfall (mm); ETa is evapotranspiration (mm), which was calculated using Penman-Moneith method of FAO version for pan evaporation. The H and W were estimated based on the relationship between storage volume and water level of the lake.
When the water level of the Mekong River becomes high in the flood season, water is pushed into the lake (reverse flow), and when the water level of the Mekong River recedes in the dry season, water flows from the lake to the Mekong River (outflow). The Manning equation was used in this calculation, as expressed as follows:
L
HHAR
nQ 013/21 −
= (5)
Where, Q is outflow/reverse flow (m3/s); A is cross-sectional area (m2); R is hydraulic radius (m); H1 is water level in side the reach (m); H0 is water level outside the reach (m); L is distant between two key stations (m); n is Manning coefficient. Cross-section of the river assumed to be trapezoidal for open channel flow.
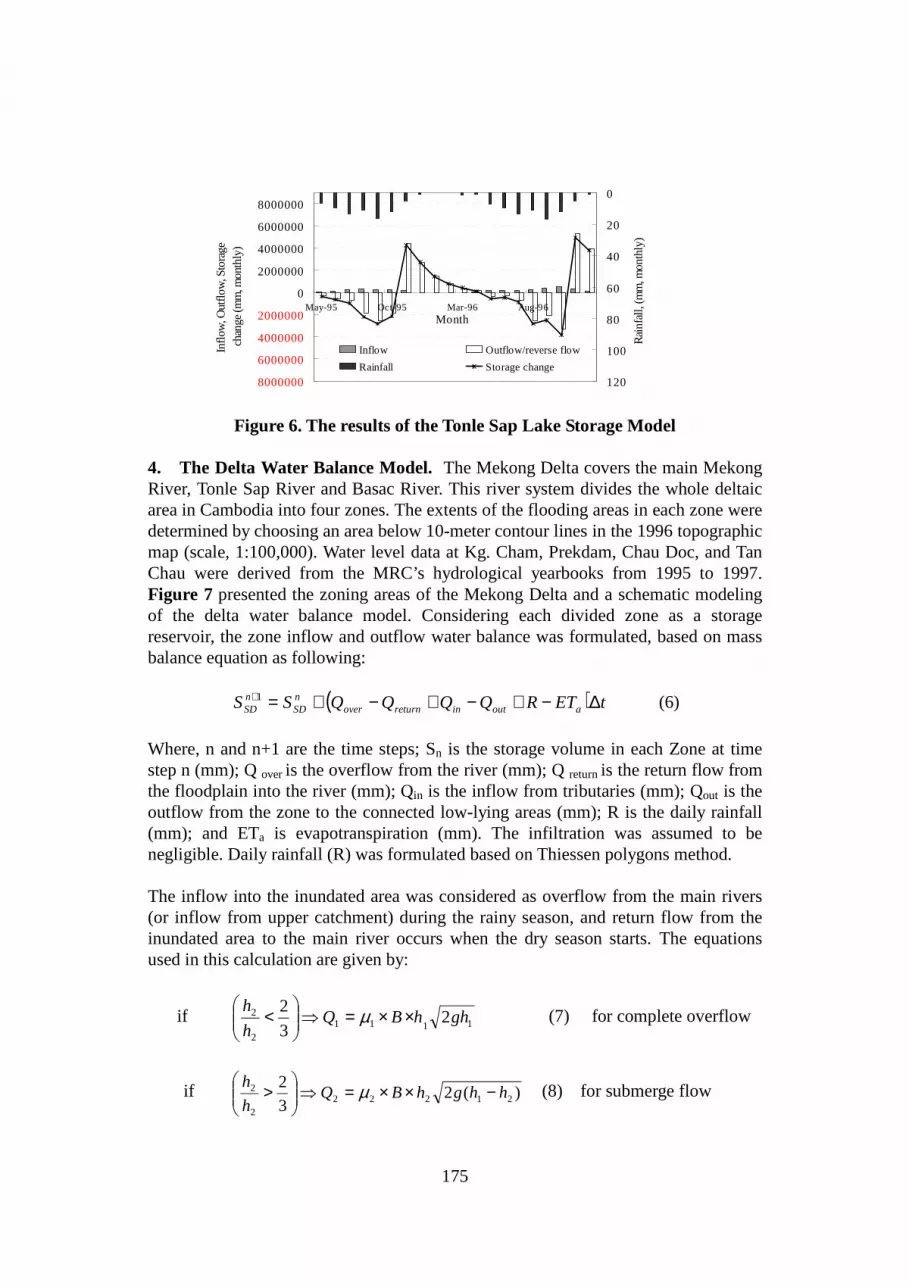
From the digital elevation data, the relationship curve between storage volumes and water levels was established. Water balance of the lake was computed based on the equation of storage-water level relation combined with evapotranspiration, rainfall, inflow and outflow of the lake. Equation (5) was solved by Newton-Raphson iteration method. The summarized results of the monthly changes in the water balance components of the Tonle Sap Lake are depicted in Figure 6.
Figure 5. The Tonle Sap Lake’s catchment model
175
8000000
6000000
4000000
2000000
0
2000000
4000000
6000000
8000000
May-95 Oct-95 Mar-96 Aug-96Month
Inflo
w, O
utflo
w, S
tora
gech
ange
(mm
, mon
thly
)
0
20
40
60
80
100
120
Rai
nfal
l, (m
m, m
onth
ly)
Inflow Outflow/reverse flow
Rainfall Storage change
Figure 6. The results of the Tonle Sap Lake Storage Model
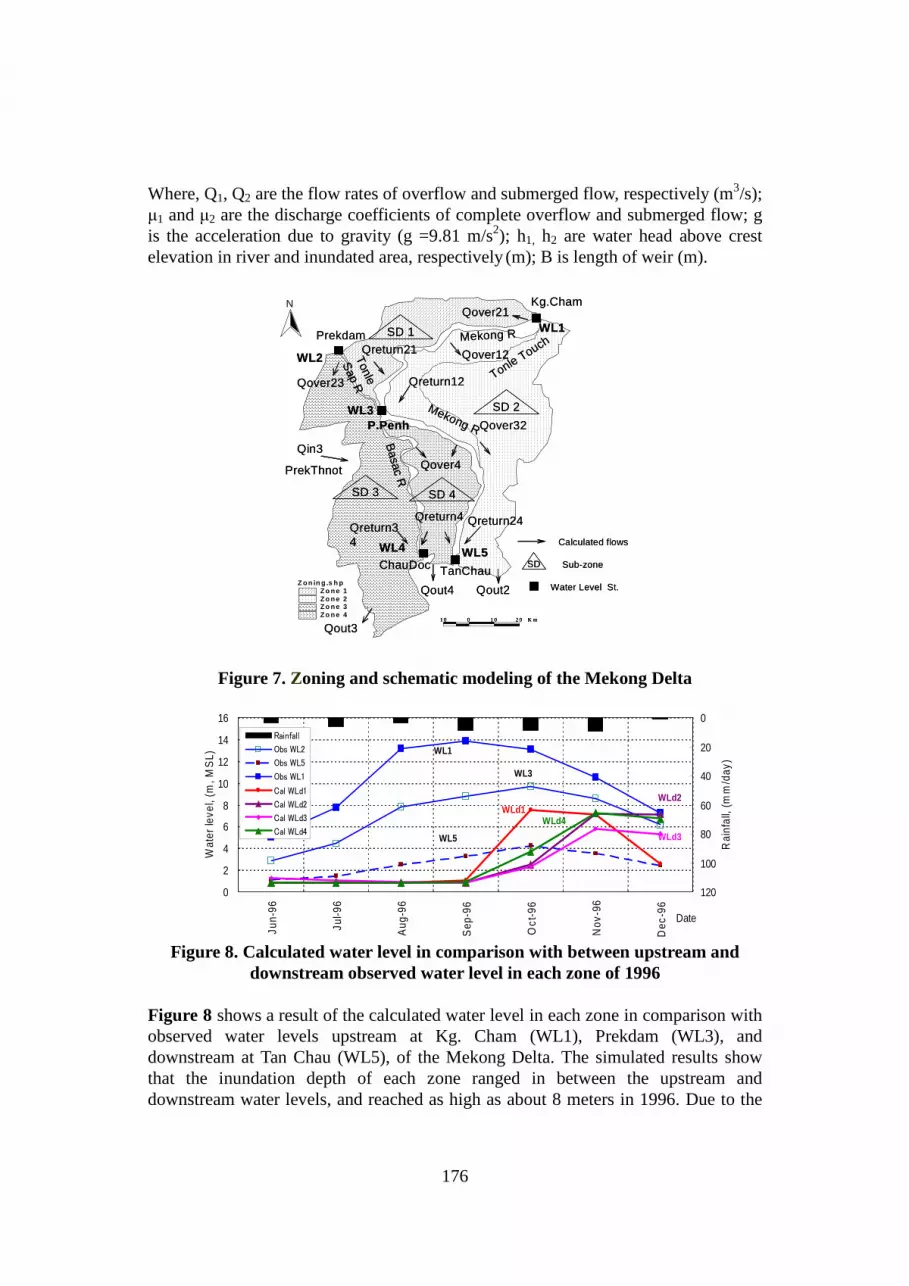
4. The Delta Water Balance Model. The Mekong Delta covers the main Mekong River, Tonle Sap River and Basac River. This river system divides the whole deltaic area in Cambodia into four zones. The extents of the flooding areas in each zone were determined by choosing an area below 10-meter contour lines in the 1996 topographic map (scale, 1:100,000). Water level data at Kg. Cham, Prekdam, Chau Doc, and Tan Chau were derived from the MRC’s hydrological yearbooks from 1995 to 1997. Figure 7 presented the zoning areas of the Mekong Delta and a schematic modeling of the delta water balance model. Considering each divided zone as a storage reservoir, the zone inflow and outflow water balance was formulated, based on mass balance equation as following:
( ) tETRQQQQSS aoutinreturnovernSD
nSD ∆−+−+−+=+1 (6)
Where, n and n+1 are the time steps; Sn is the storage volume in each Zone at time step n (mm); Q over is the overflow from the river (mm); Q return is the return flow from the floodplain into the river (mm); Qin is the inflow from tributaries (mm); Qout is the outflow from the zone to the connected low-lying areas (mm); R is the daily rainfall (mm); and ETa is evapotranspiration (mm). The infiltration was assumed to be negligible. Daily rainfall (R) was formulated based on Thiessen polygons method. The inflow into the inundated area was considered as overflow from the main rivers (or inflow from upper catchment) during the rainy season, and return flow from the inundated area to the main river occurs when the dry season starts. The equations used in this calculation are given by:
if 11112
2 23
2ghhBQ
h
h××=⇒
< µ (7) for complete overflow
if )(23
221222
2
2 hhghBQh
h −××=⇒
> µ (8) for submerge flow
176
N
Z on in g .s h pZo ne 1Zo ne 2Zo ne 3Zo ne 4
SD 1
SD 2
SD 4SD 3
Prekdam
TanChauChauDoc
Kg.Cham
WL1
WL2
WL3
WL5WL4
Qin3
Qout3
Qover23
Qover21
Qreturn21
Qreturn4Qreturn34
Qout2Qout4
Qreturn12
Qover12
Qover32
Qreturn24
Mekong R
Mekong R
Tonle
Sap R
Basac
R
P.Penh
SD
Calculated flows
Sub-zone
Water Level St.
Qover4PrekThnot
Tonle Touch
1 0 0 1 0 2 0 K m
SD 1
SD 2
SD 4SD 3
Prekdam
TanChauChauDoc
Kg.Cham
WL1
WL2
WL3
WL5WL4
Qin3
Qout3
Qover23
Qover21
Qreturn21
Qreturn4Qreturn34
Qout2Qout4
Qreturn12
Qover12
Qover32
Qreturn24
Mekong R
Mekong R
Tonle
Sap R
Basac
R
P.Penh
SD
Calculated flows
Sub-zone
Water Level St.
Qover4PrekThnot
Tonle Touch
1 0 0 1 0 2 0 K m1 0 0 1 0 2 0 K m
0
2
4
6
8
10
12
14
16
Jun-
96
Jul-9
6
Aug
-96
Sep
-96
Oct
-96
Nov
-96
Dec
-96
Date
Wat
er le
vel,
(m, M
SL)
0
20
40
60
80
100
120
Rai
nfal
l, (m
m/d
ay)
Rainfall
Obs WL2
Obs WL5
Obs WL1
Cal WLd1
Cal WLd2
Cal WLd3
Cal WLd4
WL1
WLd1
WL3
WLd3WL5
WLd4
WLd2
Where, Q1, Q2 are the flow rates of overflow and submerged flow, respectively (m3/s); µ1 and µ2 are the discharge coefficients of complete overflow and submerged flow; g is the acceleration due to gravity (g =9.81 m/s2); h1, h2 are water head above crest elevation in river and inundated area, respectively (m); B is length of weir (m).
Figure 7. Zoning and schematic modeling of the Mekong Delta
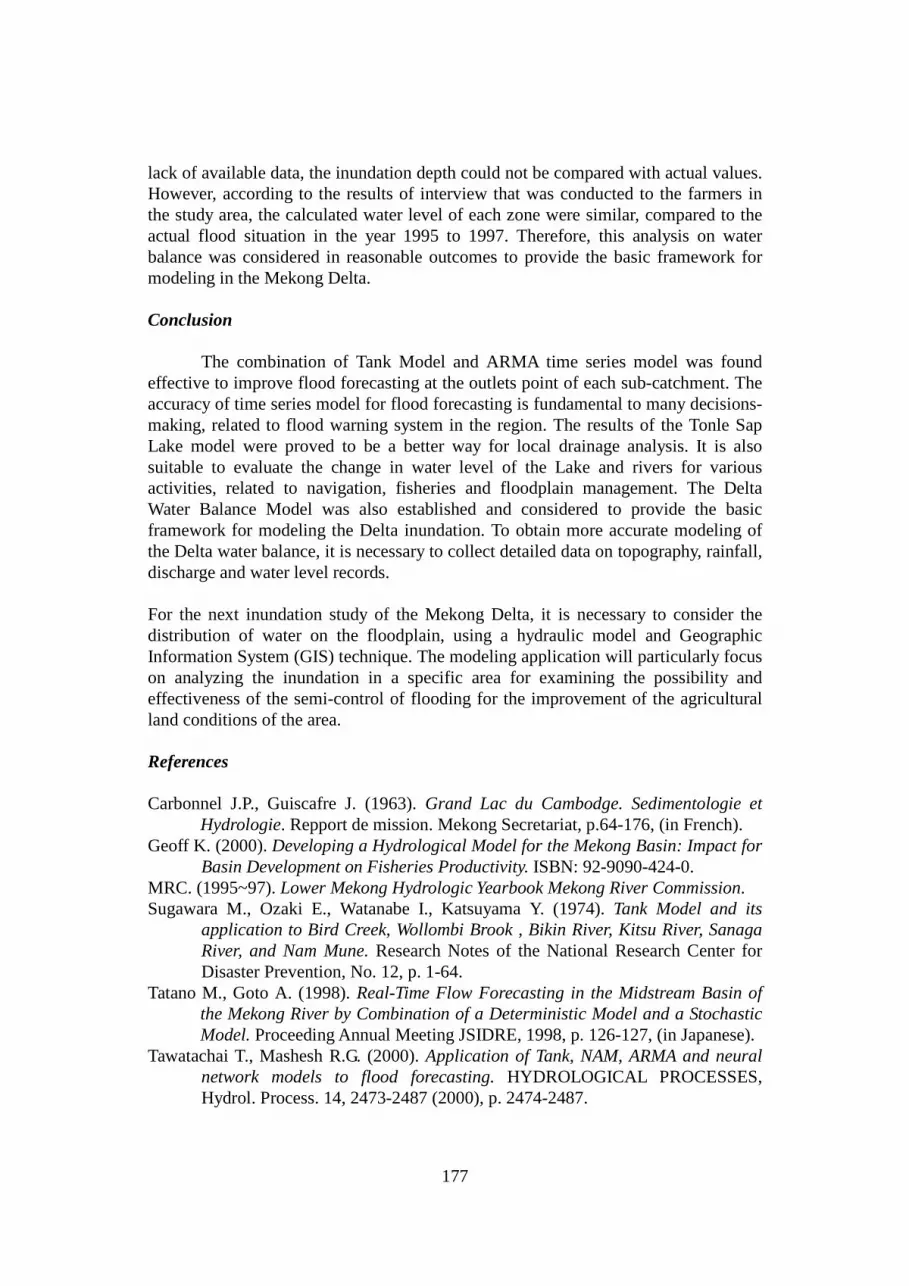
Figure 8. Calculated water level in comparison with between upstream and
downstream observed water level in each zone of 1996 Figure 8 shows a result of the calculated water level in each zone in comparison with observed water levels upstream at Kg. Cham (WL1), Prekdam (WL3), and downstream at Tan Chau (WL5), of the Mekong Delta. The simulated results show that the inundation depth of each zone ranged in between the upstream and downstream water levels, and reached as high as about 8 meters in 1996. Due to the
177
lack of available data, the inundation depth could not be compared with actual values. However, according to the results of interview that was conducted to the farmers in the study area, the calculated water level of each zone were similar, compared to the actual flood situation in the year 1995 to 1997. Therefore, this analysis on water balance was considered in reasonable outcomes to provide the basic framework for modeling in the Mekong Delta. Conclusion
The combination of Tank Model and ARMA time series model was found
effective to improve flood forecasting at the outlets point of each sub-catchment. The accuracy of time series model for flood forecasting is fundamental to many decisions-making, related to flood warning system in the region. The results of the Tonle Sap Lake model were proved to be a better way for local drainage analysis. It is also suitable to evaluate the change in water level of the Lake and rivers for various activities, related to navigation, fisheries and floodplain management. The Delta Water Balance Model was also established and considered to provide the basic framework for modeling the Delta inundation. To obtain more accurate modeling of the Delta water balance, it is necessary to collect detailed data on topography, rainfall, discharge and water level records. For the next inundation study of the Mekong Delta, it is necessary to consider the distribution of water on the floodplain, using a hydraulic model and Geographic Information System (GIS) technique. The modeling application will particularly focus on analyzing the inundation in a specific area for examining the possibility and effectiveness of the semi-control of flooding for the improvement of the agricultural land conditions of the area. References Carbonnel J.P., Guiscafre J. (1963). Grand Lac du Cambodge. Sedimentologie et
Hydrologie. Repport de mission. Mekong Secretariat, p.64-176, (in French). Geoff K. (2000). Developing a Hydrological Model for the Mekong Basin: Impact for
Basin Development on Fisheries Productivity. ISBN: 92-9090-424-0. MRC. (1995~97). Lower Mekong Hydrologic Yearbook Mekong River Commission. Sugawara M., Ozaki E., Watanabe I., Katsuyama Y. (1974). Tank Model and its
application to Bird Creek, Wollombi Brook , Bikin River, Kitsu River, Sanaga River, and Nam Mune. Research Notes of the National Research Center for Disaster Prevention, No. 12, p. 1-64.
Tatano M., Goto A. (1998). Real-Time Flow Forecasting in the Midstream Basin of the Mekong River by Combination of a Deterministic Model and a Stochastic Model. Proceeding Annual Meeting JSIDRE, 1998, p. 126-127, (in Japanese).
Tawatachai T., Mashesh R.G. (2000). Application of Tank, NAM, ARMA and neural network models to flood forecasting. HYDROLOGICAL PROCESSES, Hydrol. Process. 14, 2473-2487 (2000), p. 2474-2487.