1474 IEEE JOURNAL OF SELECTED TOPICS IN APPLIED EARTH OBSERVATIONS AND REMOTE SENSING, VOL. 5, NO. 5, OCTOBER 2012
An RFID-Based Toolbox for the Study of Under-and Outside-Water Movement of Pebbles on
Coarse-Grained BeachesGiuliano Benelli, Alessandro Pozzebon, Duccio Bertoni, and Giovanni Sarti
Abstract—In this paper the authors describe an innovativetoolbox with an RFID-based automatic identification technologyfor tracking and analyzing pebble movements along coarsebeaches. The developed system proposes utilizing several ‘SmartPebbles’, embedded with an RFID transponder. Through an adhoc waterproof device it was possible to detect the presence ofthese Smart Pebbles and calculate their exact position with aGPS device. Though RFID is a radio technology that is unsuitableunder water, it can yet be developed to operate under waterthrough certain modifications in the system. Performing severalrecovery campaigns over a long span of time, it was possible totrace the movements of the entire swarm of Smart Pebbles. Allof the information gathered through the RFID system was thenanalyzed with an ad hoc software interacting with a databasecontaining the movement data of every pebble. The softwareprovided a graphic picture of the paths followed by all the SmartPebbles and the same was utilized for calculating the distancescovered by the pebbles.
Index Terms—Radio position measurement, sea coast, seafloor, tracking, underwater object detection, underwater radiocommunication.
I. INTRODUCTION
C OASTAL erosion is an urgent environmental concern, inthat it affects vast tracts of coastline around the world,
with consequences that can be devastating in some cases.For example, the available data show that 15% of the
coastline of Europe is under serious threat of coastal erosion,and this is likely to increase year after year. In addition,bordering the affected portions of the coast are big cities,like Venice or Amsterdam, and highly urbanized regions, likeEmilia Romagna in Italy or Nord-Pas-de-Calais in France, oreven whole countries like Denmark or Estonia, with millionsof inhabitants [26], [27].Coastal erosion is a natural process that has always been ac-
tive all along the littoral territories of the world, even thoughthe factors that control this phenomenon do not remain the samethrough time.
Manuscript received December 02, 2011; revised March 06, 2012; acceptedApril 10, 2012. Date of publication May 30, 2012; date of current versionNovember 14, 2012.G. Benelli is with the Department of Information Engineering, University of
Siena, Siena 53100, Italy (e-mail: [email protected]).A. Pozzebon is with the Department of Information Engineering,
University of Siena, Siena 53100, Italy (corresponding author, e-mail:[email protected]).D. Bertoni and G. Sarti are with the Department of Earth Sciences, University
Tectonic setup, eustatic changes, and climate are the mostimportant natural processes that control the tendency of a givencoast to accrete or to erode. For instance, global sea-level rise,closely related to the factors just mentioned, is a major concernwhen dealing with erosion-related issues.However, intense beach retreat or anomalous sea-bottom
deepening is caused more by human activities rather than bynatural processes. In fact, anthropogenic intervention in naturalprocesses accelerates natural erosive activity. Widespreadinland deforestation and indiscriminate construction of damsto contain floods, land-use changes in hinterland, river bedquarrying, and construction of hard embankments and damsalong rivers are all activities that contribute to a substantialdecrease of river sediment load and consequent reduction insediments that feed the beaches [3].As the problem is of gigantic proportions, large amounts of
money are being spent all over the world for developing tech-niques to contain this problem and save the existing settlementsfrom displacement. It is important that every innovative solutionthat emerges in this regard will have to be carefully studied andtested for its effectiveness. While laboratory simulations can behelpful in these researches during analysis and project phases,the real efficacy of a solution can only be proved by on-fieldtests. This, in effect, implies that all systems employed for thisanalysis will have to work in settings totally different from thoseof the common research laboratories.Extant techniques to fight erosion contemplate the construc-
tion of underwater structures or creation of artificial beachesusing coarse-grained sediments (e.g., sand, gravel, or pebble).The former may prove successful in containing erosion, butit can trigger a far-reaching negative impact on the coastalecosystem; the latter, on the contrary, cannot prove sufficientlysturdy to withstand the violent onslaught of sea storms unlessthey are meticulously planned to guarantee a reasonable levelof protection.The realization of effective artificial beaches requires a strin-
gent analysis of the kind of material to be employed, the depthof the artificial layer, and the width of the beach. All of thesefactors influence the dynamics of the beach under the effect ofstandard water movements (waves or tides), as also of excep-tional events (storms).The knowledge of the dynamics of an artificial beach thus
forms an essential input in improving the realization of thesestructures: a fuller understanding of gravel movement, bothlongshore and cross-shore, will help in appreciating the phys-ical processes governing the beach, as also the optimization ofprotection schemes such as coarse-grained beach feeding.
BENELLI et al.: RFID-BASED TOOLBOX FOR THE STUDY OF UNDER- AND OUTSIDE-WATER MOVEMENT OF PEBBLES ON COARSE-GRAINED BEACHES 1475
II. DIFFERENT TRACING TECHNIQUES
The sediment movement on a beach is a topic that cannotbe disregarded when dealing with coastal morphodynamics,because virtually any physical process acting on a beach isconnected with sediment transport and displacement. Since theearly days, researchers of coastal areas have been addressingthis problem, but their efforts were initially directed almostexclusively towards sandy environments [22], [23], [18].In fact, the processes operating on gravel beaches are con-
sidered more complex to assess mostly due to logistical prob-lems [6]; in addition, coarse-grained beaches are less commonthan sandy ones. However, more attention is being paid to gravelbeaches during the last few years, because this kind of beach isprogressively more used for coastal protection [16].In addition, new techniques enabling more comprehensive
approaches to studying the coastal problems have sparked fur-ther interest on coarse-grained beaches. Among these, the tech-nique of tracing the movement of individual grains in a naturalenvironment has opened up new vista of research in coastal mor-phodynamics, mostly because it provides direct data about theextent and direction of coarse sediment movement.Initial attempts to study coarse sediment transport date back
to the early 1970s when textural parameters such as size, shape,and sorting were analyzed to figure out their influence on howcoarse sediments respond to physical processes like wave mo-tion and currents [9]. This approach, though interesting anduseful for sedimentology applications, did not yield remark-able results with regard to sediment movement, because thoseparameters alone cannot lead to a fuller understanding of theproblem.In fact, Jolliffe [17] tried to address this problem by first con-
ceiving of the ways to trace the particles by painting some ofthem; this technique was later successfully employed by otherauthors [20], [10]. However, the high rate of loss of the paintedparticles, especially in the long term, has proved to be a majordrawback of this methodology.Subsequently, several new techniques were tested to trace or
mark coarse particles, but none could overcome logistical prob-lems, such as high rate of recovery, cost-effectiveness, and dura-bility. These included injecting allochthonous lithologies ontothe beach [15] andmarking pebbles with radioactive substances,magnets [14], and aluminium [19].Presently, electronic tracing techniques [5] are considered to
be the most reliable in so far as recovery rates are concerned.These techniques employ a transmitter inserted within a specialmaterial such as resin and then molded to obtain a tracer sim-ilar in shape and size to a pebble. The high costs of fabricatingthe tracer and the artificial nature of the tracer are consideredto be the main shortcomings of this otherwise effective tech-nology [21].The technique followed lately involves coupling small,
passive transponders to pebbles, and then locating them bymeans of radio frequency identification (RFID) technology.This technique has the merits of the lowest operating costs andhighest rates of recovery [1], [2]. However, the limitation ofthe technique is its inability to detect the transponder-bearingpebbles underwater owing to the attenuation of the radio signalsin water.
III. RFID TECHNOLOGY
RFID technology is nowadays one of the most widely fol-lowed automatic identification techniques. The fields of its ap-plications include healthcare, automotive industry, access con-trol, and animal identification; besides these, newer fields for itsapplication are emerging day by day [28]. The term RFID actu-ally encompasses a vast number of systems with different tech-nical features and obviously different performances, but witha common feature: the identification medium, i.e., the electro-magnetic field.
A. RFID Systems
Basically, an RFID system consists of two components: theTransponder, or Tag, which is the effective identification devicepositioned on the item to be identified, and the Reader, whichgenerates the interrogating electromagnetic field that performsthe location and identification operations [25].RFID systems cover a wide portion of the electromagnetic
spectrum, from low-frequency systems operating at 125 kHz tomicrowave systems at 5.8 GHz. Each system presents differentfeatures and different performances. In the systems operating atlower frequencies, the reading ranges and bit rates are lower:however, the attenuation due to the presence of materials likemetals or water is also lower, thus making these systems suit-able for use in harsh environments. On the other hand, systemsoperating at higher frequencies provide larger reading ranges:this implies that these systems are chosen when RFID is used,for example, for location purposes.Besides the classification based on operative frequency,
another subdivision of RFID systems can be made, based onthe way the transponders are powered, among passive systems,semi-passive systems, and active systems. In passive systems,the transponder is not provided with a battery and is thenpowered by an electromagnetic field generated by the reader.In semi-passive systems, the transponder is provided witha small battery that is only used to power on-board deviceslike sensors: in this case, the tag is not able to autonomouslyinitiate the data exchange. In active systems, the transponderhas a battery which allows communication regardless of theinstructions generated by the reader.As in the case of the operative frequency, the powering
methods also influence the system performances: while passivesystems have limited reading ranges (usually not over 5 m athigher frequencies), active systems can eventually reach dis-tances up to 100 m. On the other hand, passive transponders arenotably cheaper than active ones. In addition, as they containno battery that needs to be replaced periodically, their lifetimeremains virtually infinite.Once RFID is chosen as the right technology for a specific
purpose, careful studies have to be undertaken to identify thetechnical solution that provides the best ratio of performance tocost [12], [24].
B. Underwater RFID
Under water, the RFID range is reduced by attenuation. Purewater is a low-loss dielectric, but natural water can be a par-tial conductor owing to the presence of dissolved salts or other
1476 IEEE JOURNAL OF SELECTED TOPICS IN APPLIED EARTH OBSERVATIONS AND REMOTE SENSING, VOL. 5, NO. 5, OCTOBER 2012
materials [11]. Water attenuation can be calculated with thefollowing formula:
dBm
(1)
where is the frequency of the electromagnetic field expressedin hertz and is the water conductivity expressed in S/m. Asthe conductivity of sea water is quite constant, its attenuationcan be modified only by working on the operative frequency:the lower the frequency, the lower would be the attenuation [7].To find the best solution, only high-frequency (13.56-MHz)
and low-frequency (125-kHz) systems were taken in account.Both of these systems were tested to check their efficacy in thepresence of water.The first tests were conducted using a Feig CPR.PR50
HF 13.56-MHz desktop USB Reader, which has a maximumreading range in ideal conditions around 15 cm, that wasprotected from water with a plastic layer. The performancesof this device were tested using a 60 40 40 cm paral-lelepiped-shaped plastic tube filled with water and with a TexasInstrument Smart Card fixed on the bottom: under these condi-tions, the maximum reading range decreased to 3–4 cm, whichis around 80% less. While the maximum achievable readingrange for long-range HF antennas is lower than 1 m [13], an80% decrease would reduce this value to 20 cm, which is stilllower than 30 cm, which is the minimum satisfactory readingrange according to the requirements described in Section IV.Consequently, the efforts for finding the right solution were
then directed towards low-frequency systems, operating at125 kHz. This kind of system is already being used for animalidentification, particularly in deploying implantable tags oresophageal capsules. Low frequency was chosen because theanimal bodies are composed mainly of water (for example,more than 50% of the human body is composed of water).Low-frequency systems are mainly passive ones. The tags
are manufactured in different shapes; they are very resistant toshocks and temperature variations (their operative temperaturerange can vary between 40 C, and 85 C) and they are suit-able for use in harsh environments as they contain no battery.Moreover, as their price is very low, they can be used liberallyand in large quantities. Even if some transponders are lost, themonetary loss is too small to be of any concern. On the otherhand, the reading range of an LF reader is lower than 1 m in thebest conditions. As a result, LF systems can be used only whenthe position of the item to be identified is approximately known.
IV. HARDWARE INFRASTRUCTURE
To perform a tracing operation, two items are needed: oneor more tracers and a device able to locate them. Even thoughRFID is commonly used for tracing operations, specific ad hocconfigurations were studied for both the transponders and thereader. In particular, the hardware infrastructure was composedof two kinds of devices, the so-called Smart Pebbles and thewaterproof reader.The Smart Pebbles were common marble pebbles provided
with an embedded RFID tag. They had to be positioned on thebeach, on the foreshore, and under water, recording their po-sition with a GPS total station. After a specific span of time,the waterproof reader had to be used to locate them, both on
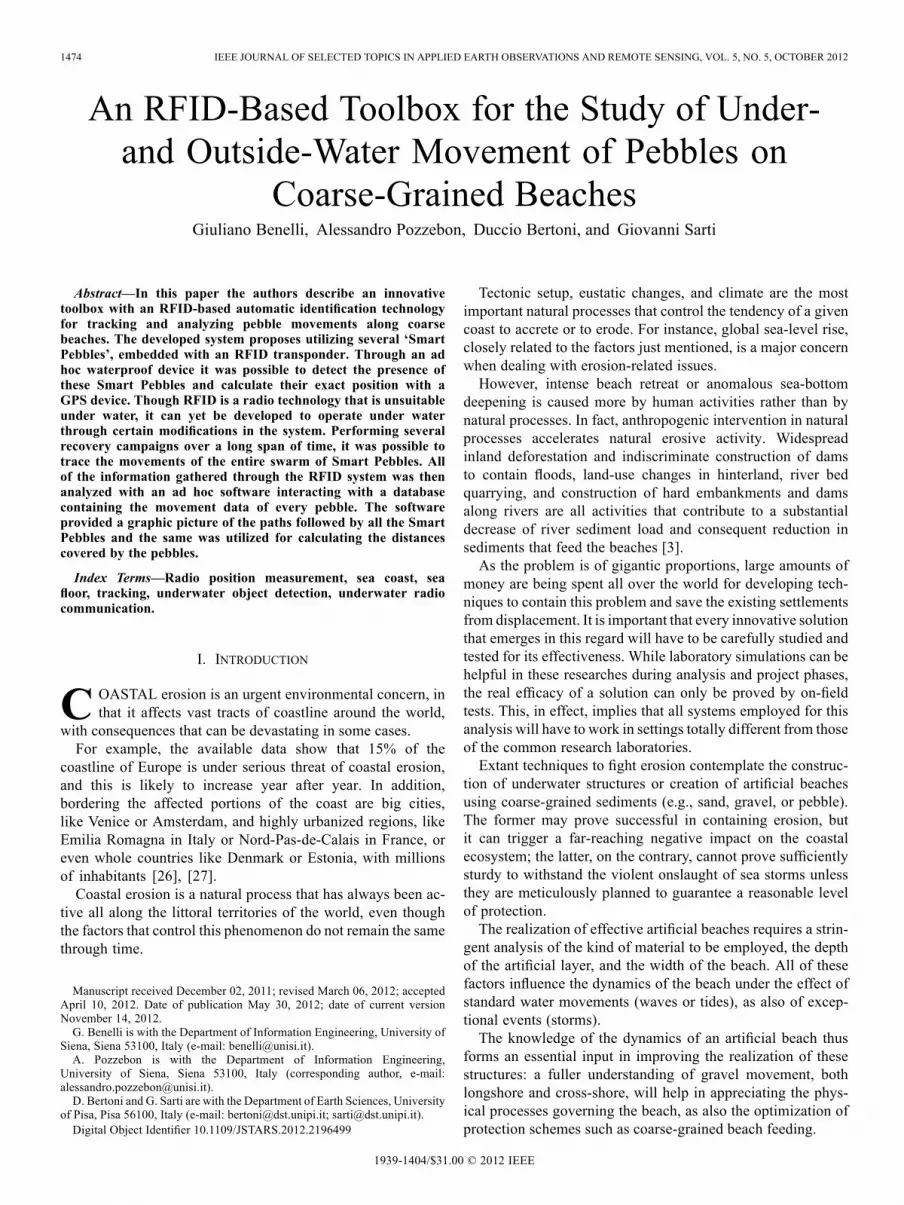
Fig. 1. Reader with its watertight box. The reader is surrounded by the insu-lating sponge, and on the right the powering and serial cables can be seen. Thesmall plastic box on the right contains the electric circuitry for a small LEDlighting up when a tag is detected.
the beach and underwater, and their position had to be recordedagain to trace their displacement.As already stated in Section III-B, the minimum acceptable
reading range for the reader was set at 30 cm: this value wasdecided by estimating the maximum sinking depth of a pebblein the pebble layer on the beach in three times the average di-ameter of a pebble. While the diameter of the pebbles used inthe experimentation varies between 65 and 127mm, the averagevalue has been approximated at 10 cm in order to include pos-sible gaps between two overlapped pebbles. It has to be under-lined that this value was only an assessment based on severalobservations of the beach structure before and after storms: nostudy currently exists giving an exact general description of thepebbles’ sinking rate because this value is strictly linked to thegeomorphological features of every single beach. The results ofthis experimentation could be therefore used also to evaluate thesinking level of the pebbles on the beach.
A. Waterproof Reader
The first part of the study concerning the hardware infrastruc-ture was focused on the choice of the right reader and its water-proofing. CORE-125 reader by CoreRFID, which is commonlyused for access control, was chosen. This had an IP67 protec-tion rating, which meant that the device could be immersed inwater up to a depth of 1 m for up to 30 min. Moreover, this pro-vided an ideal reading range of over 70 cm, which is nowadaysconsidered to be a higher achievable value.However, for an efficient tracing system, the reader should
work at depths of up to 4 or 5 m, with prolonged periods of im-mersion, and in such a situation the protection rate of the readerwas clearly insufficient. To overcome this limitation, an ad hocwaterproof case was studied. This involved inserting the readerinto a watertight plastic box filled with an insulating sponge.The box was perforated to link the reader to a battery through apowering cable and to a computer through a serial cable: bothof the cables were introduced into the case through a specificsecurity connector which provided protection against water in-filtration. The final solution is shown in Fig. 1.
BENELLI et al.: RFID-BASED TOOLBOX FOR THE STUDY OF UNDER- AND OUTSIDE-WATER MOVEMENT OF PEBBLES ON COARSE-GRAINED BEACHES 1477
To test the effectiveness of this structure, it was kept im-mersed in a bathtub for 24 h. No evidence of water was foundinside the case after this period. Then, to assess the resistanceof the case to the sea water pressure, another test was carriedout by placing the case on the sea bed at a depth of about 2 mfor 2 h. This time, it was found that water percolated inside.Therefore, as a final waterproofing, the reader was covered withsilicone, and this proved to be successful in preventing waterfrom coming into contact with the reader.
B. Smart Pebbles
Smart Pebbles are effective tracers: they are common pebblesprovided with an RFID transponder which allows their unam-biguous identification. In the first experimentation, marble peb-bles were chosen because of the composition of the test beaches:the two Marina di Pisa beaches where the system would havebeen tested are in fact two artificial beaches mainly composesby this material. While marble is especially suitable to be drilleddue to its composition, some drilling tests were made also ongranite pebbles and on limestone pebbles: both these materialscould be drilled without breaking the pebble, suggesting that thesystem could be used also with pebbles of different materials.Concerning the dimension of the Smart Pebbles, as already
anticipated, their diameter went from 65 to 127 mm: in addition,in this case, tests were made to reduce the size and the depth ofthe hole in order to extend the system to smaller pebbles of lessthan 4 cm in diameter.The realization of Smart Pebbles required identification of
the right kind of transponder to be employed and on the rightway of introducing it into the pebble. In fact, once the pebbleis set on the beach, it is subject to strong water currents owingto storms or simple waves. This implies that the shape and thematerial of the transponder will have to be so chosen as to with-stand strong currents. Moreover, while pebbles may break andthe transponder may be in contact with marine water for months,it should be waterproof.The positioning of the transponder also is important, because
if it is simply screwed on the pebble it would be subjected toabrasion along with the pebbles. If it is attached with glues orresins, the salt water may interact with them, thus dislodging thetransponder from the pebble.For deciding on the type of the transponder to be used, shape
was the first characteristic to be tested. Card transponders werediscounted because of their dimensions and glass cylinders be-cause of their fragile nature, even if tests were performed to an-alyze their possible future use. The final choice moved thereforeto circular plastic transponders, whose shape allowed them to beembedded inside the pebbles. Furthermore, their performancesin terms of reading range and ultimate strength matched withthe requirements of the system.Three different models of transponders, given here, were then
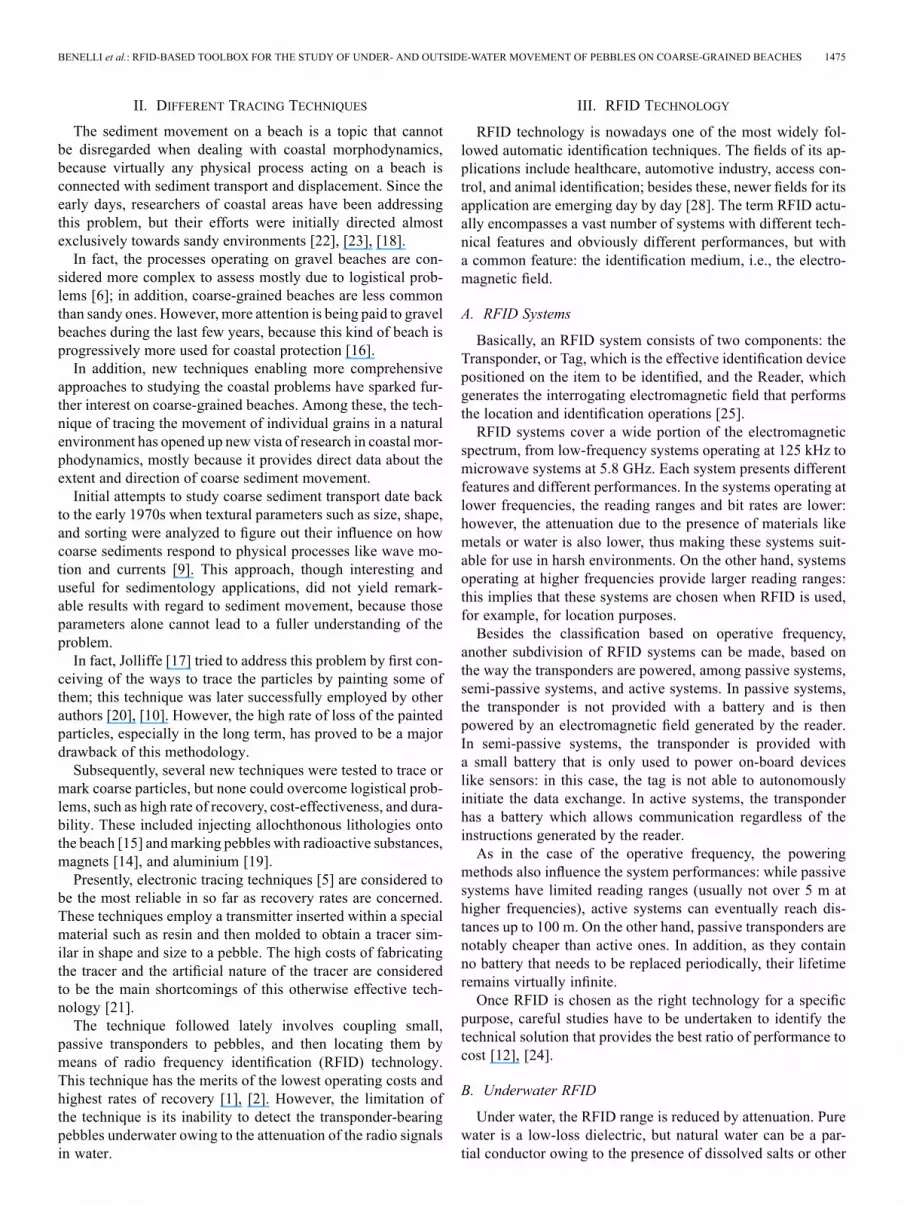
tested to choose the best among them.• Nylon transponders (called Laundry): 25 mm of diameter[Fig. 2(a)];
• ABS transponders: 30 mm of diameter [Fig. 2(b)];• PVC transponders (called Stick): 23 mm of diameter[Fig. 2(c)].
Fig. 2. Three kinds of transponders: (a) laundry, (b) ABS, (c) stick, and (d) aSmart Pebble with two ABS transponders and a Euro coin as a dimensional ref-erence model. The circular object on the pebble is the top surface of the marblecylinder extracted during the drilling operation and then used to fill the holewhere the transponder is housed.
To carry out the test, three Smart Pebbles were realized, one foreach kind of transponder. In each pebble, a 3-cm-deep hole wasdrilled with a core drill. The transponder was then glued to thebottom of the hole, and then the hole was filled with the marblecylinder extracted from it during the drilling operations. Whilethe diameter of the marble cylinder ( 30 mm) was smallerthan the diameter of the hole ( 32 mm) due to the material lostduring the drilling operation, the 1-mmgap between the cylinderand the hole surface was filled with an ad hoc sea-water-resis-tant resin (similar to the one employed in the fiberglass used forthe boat hulls). This solution guarantees a total protection fromsalt water because only marble and resin are in touch with thewater, ensuring to the Smart Pebble a virtually infinite lifetimethat is limited only by the standard surface abrasion of the peb-bles or possible pebble breaking due to collisions.The reading ranges of the three Smart Pebbles were then
tested using a simulation environment set up in laboratory tryingto recreate the natural conditions of the Marina di Pisa beach.The reading ranges were measured under six different environ-mental conditions, given here:• Measurement 1: the first measure was taken under idealconditions, with both the reader and the Smart Pebbles out-side water;
• Measurement 2: the Smart Pebbles were positioned on thebottom of a plastic tube and covered with a 30-cm layer ofsimilar pebbles;
• Measurement 3: gravel was added to simulate, to the extentpossible, the conditions of the sea bed;
• Measurement 4: water was added keeping the reader out-side water;
• Measurement 5: the reader was immersed in water;• Measurement 6: salt was added to water so as to make it asclose as possible to sea water.
The previous measurements were performed twice, using twoparallelepiped shaped plastic tubes of different dimensions, in
1478 IEEE JOURNAL OF SELECTED TOPICS IN APPLIED EARTH OBSERVATIONS AND REMOTE SENSING, VOL. 5, NO. 5, OCTOBER 2012
TABLE IREADING DISTANCES OF SMART PEBBLES
order to check possible variations in the reading range due to thepresence of air outside the tubes. The first tube was the one de-scribed in Section III-B used in the test for the HF reader, whilethe second one had 45 45 90 cm dimensions. These dif-ferent tubes were used in order to vary the surface and the heightof the water column: varying the shape of the test environment,and the number of magnetic field lines traveling through watervaried. A significant variation of the reading ranges in the twocases would have meant an influence by the field lines travelingthrough air outside the tubes. In any event, the results of thetwo tests were identical and are shown in Table I: this provesthat a change in the volume of water, and then in the amountof field lines traveling through air, does not modify the readingrange. This result is in agreement with the consideration that,in loop antennas, the inductive coupling between the antenna ofthe reader and the antenna of the tag is generated by the fieldlines crossing the surfaces of the two antennas. As these sur-faces are totally submerged in water, external field lines (thosepotentially traveling through air outside the tubes) are noninflu-ential on the reading ranges.From these results, it emerged that ABS was the right
transponder, because it had the largest reading range. More-over, it was evident that the decrease in the range, from the best(63 cm) to the worst conditions (51 cm), was around 20%, withthe final value of the reading range being widely beyond thelower limit value of 30 cm.
V. ANALYSIS SOFTWARE
Along with the hardware infrastructure, analysis softwarewas developed to collect and evaluate all of the data about thepositions and movements of the Smart Pebbles.The software was developed using Java as the programming
language and it performed the following operations.• It managed the database where all of the collected data wasstored.
• It managed the connection with the reader allowing auto-matic insertion of data into the database.
• It provided a graphical interface to manually interact withthe database and to visualize the positions and movementsof the pebbles on a satellite image.
First, a simple MySQL database was implemented to collectall of the information related to the retrieval of each pebble:the ID of the identified pebble, its retrieval date, its exact posi-tion recorded with the help of GPS total station, and its weight.This information can be easily enlarged, if required, to includeadditional data like pebble roundness and pebble’s chemicalcomposition.
The analysis software managed the feeding of all this datainto the DB, while the ID of the pebble and its retrieval date wererecorded automatically at the the moment of retrieval: however,data in respect of the weight and position of the pebble had tobe added manually.The software menu included three different functions: Scan-
ning, Tables, and Mapping.The Scanning function allowed two different options: the
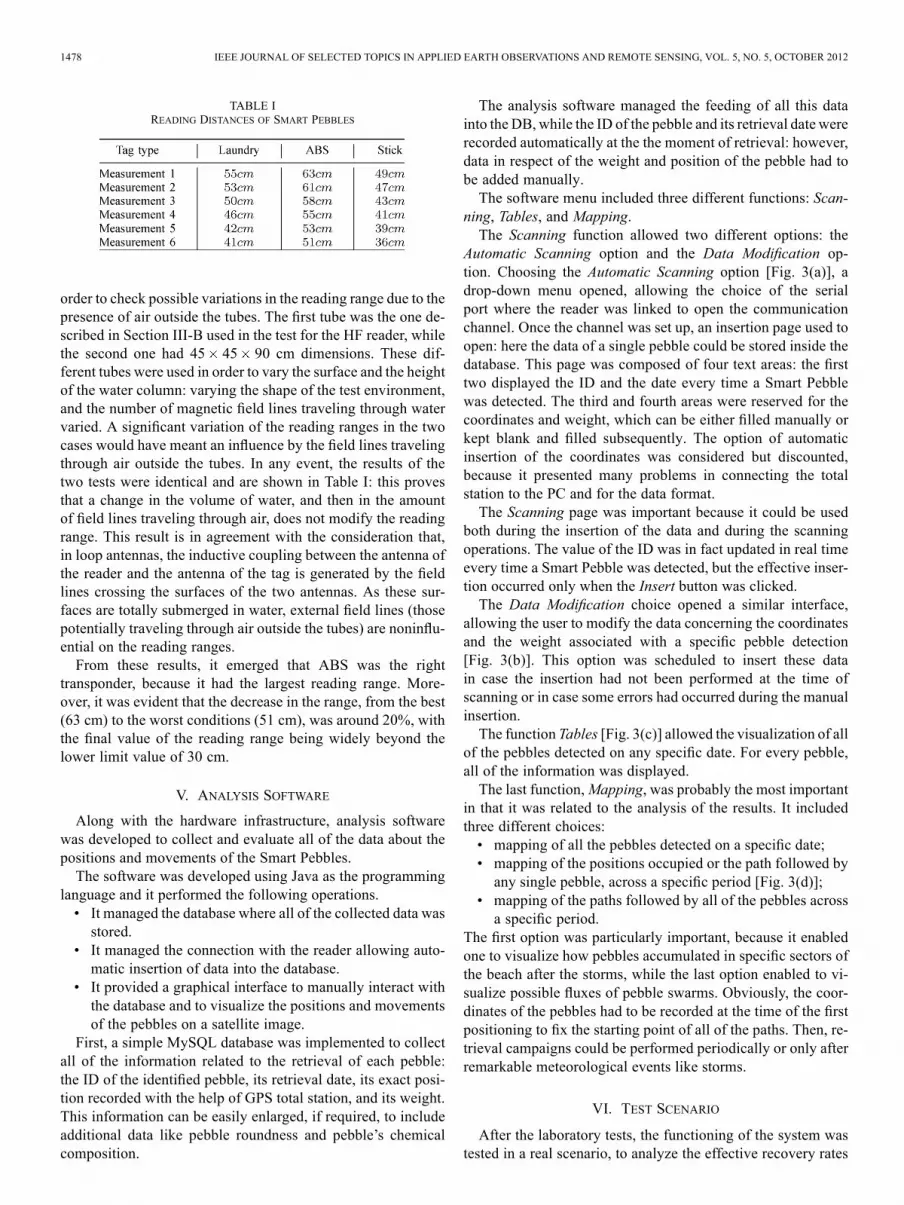
Automatic Scanning option and the Data Modification op-tion. Choosing the Automatic Scanning option [Fig. 3(a)], adrop-down menu opened, allowing the choice of the serialport where the reader was linked to open the communicationchannel. Once the channel was set up, an insertion page used toopen: here the data of a single pebble could be stored inside thedatabase. This page was composed of four text areas: the firsttwo displayed the ID and the date every time a Smart Pebblewas detected. The third and fourth areas were reserved for thecoordinates and weight, which can be either filled manually orkept blank and filled subsequently. The option of automaticinsertion of the coordinates was considered but discounted,because it presented many problems in connecting the totalstation to the PC and for the data format.The Scanning page was important because it could be used
both during the insertion of the data and during the scanningoperations. The value of the ID was in fact updated in real timeevery time a Smart Pebble was detected, but the effective inser-tion occurred only when the Insert button was clicked.The Data Modification choice opened a similar interface,
allowing the user to modify the data concerning the coordinatesand the weight associated with a specific pebble detection[Fig. 3(b)]. This option was scheduled to insert these datain case the insertion had not been performed at the time ofscanning or in case some errors had occurred during the manualinsertion.The function Tables [Fig. 3(c)] allowed the visualization of all
of the pebbles detected on any specific date. For every pebble,all of the information was displayed.The last function,Mapping, was probably the most important
in that it was related to the analysis of the results. It includedthree different choices:• mapping of all the pebbles detected on a specific date;• mapping of the positions occupied or the path followed byany single pebble, across a specific period [Fig. 3(d)];
• mapping of the paths followed by all of the pebbles acrossa specific period.
The first option was particularly important, because it enabledone to visualize how pebbles accumulated in specific sectors ofthe beach after the storms, while the last option enabled to vi-sualize possible fluxes of pebble swarms. Obviously, the coor-dinates of the pebbles had to be recorded at the time of the firstpositioning to fix the starting point of all of the paths. Then, re-trieval campaigns could be performed periodically or only afterremarkable meteorological events like storms.
VI. TEST SCENARIO
After the laboratory tests, the functioning of the system wastested in a real scenario, to analyze the effective recovery rates
BENELLI et al.: RFID-BASED TOOLBOX FOR THE STUDY OF UNDER- AND OUTSIDE-WATER MOVEMENT OF PEBBLES ON COARSE-GRAINED BEACHES 1479
Fig. 3. Analysis software: (a) scanning interface, (b) data modification inter-face, (c) retrieval table, and (d) single pebble mapping.
of the Smart Pebbles and the actual relevance of the collected in-formation. After identifying the devices to be employed and the
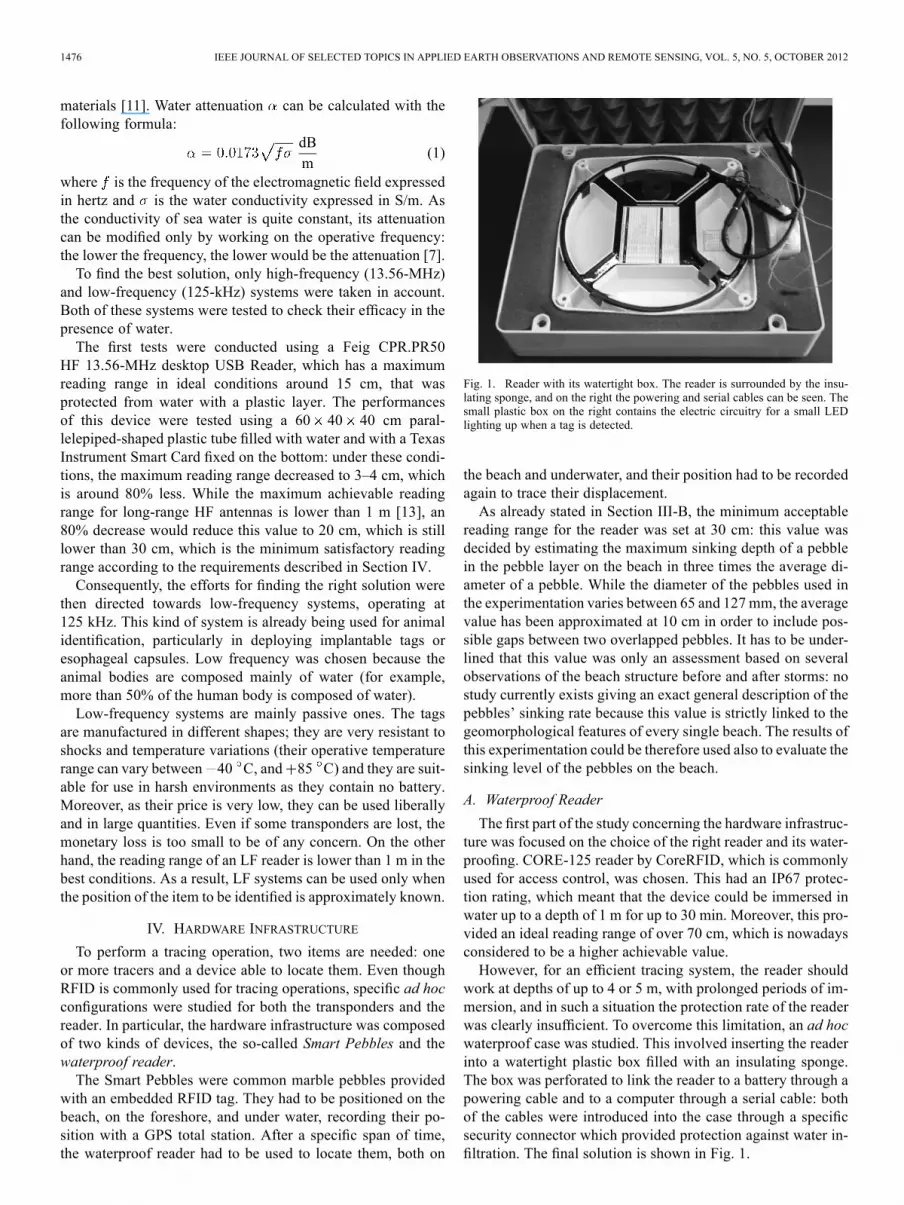
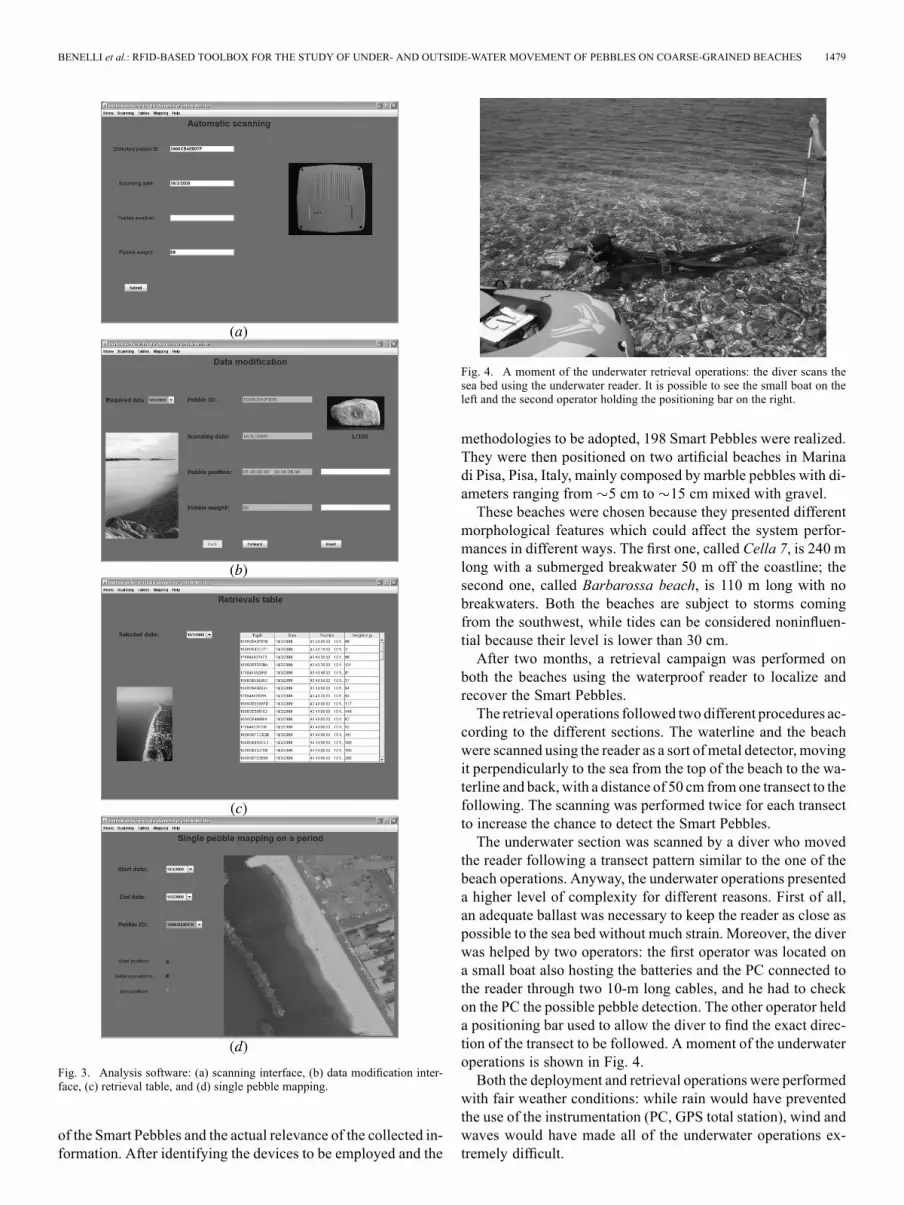
Fig. 4. A moment of the underwater retrieval operations: the diver scans thesea bed using the underwater reader. It is possible to see the small boat on theleft and the second operator holding the positioning bar on the right.
methodologies to be adopted, 198 Smart Pebbles were realized.They were then positioned on two artificial beaches in Marinadi Pisa, Pisa, Italy, mainly composed by marble pebbles with di-ameters ranging from 5 cm to 15 cm mixed with gravel.These beaches were chosen because they presented different
morphological features which could affect the system perfor-mances in different ways. The first one, called Cella 7, is 240 mlong with a submerged breakwater 50 m off the coastline; thesecond one, called Barbarossa beach, is 110 m long with nobreakwaters. Both the beaches are subject to storms comingfrom the southwest, while tides can be considered noninfluen-tial because their level is lower than 30 cm.After two months, a retrieval campaign was performed on
both the beaches using the waterproof reader to localize andrecover the Smart Pebbles.The retrieval operations followed two different procedures ac-
cording to the different sections. The waterline and the beachwere scanned using the reader as a sort ofmetal detector, movingit perpendicularly to the sea from the top of the beach to the wa-terline and back,with a distance of 50 cm fromone transect to thefollowing. The scanning was performed twice for each transectto increase the chance to detect the Smart Pebbles.The underwater section was scanned by a diver who moved
the reader following a transect pattern similar to the one of thebeach operations. Anyway, the underwater operations presenteda higher level of complexity for different reasons. First of all,an adequate ballast was necessary to keep the reader as close aspossible to the sea bed without much strain. Moreover, the diverwas helped by two operators: the first operator was located ona small boat also hosting the batteries and the PC connected tothe reader through two 10-m long cables, and he had to checkon the PC the possible pebble detection. The other operator helda positioning bar used to allow the diver to find the exact direc-tion of the transect to be followed. A moment of the underwateroperations is shown in Fig. 4.Both the deployment and retrieval operations were performed
with fair weather conditions: while rain would have preventedthe use of the instrumentation (PC, GPS total station), wind andwaves would have made all of the underwater operations ex-tremely difficult.
1480 IEEE JOURNAL OF SELECTED TOPICS IN APPLIED EARTH OBSERVATIONS AND REMOTE SENSING, VOL. 5, NO. 5, OCTOBER 2012
TABLE IIRESULTS OF THE RETRIEVAL CAMPAIGN ON CELLA 7
A. Cella 7
In Cella 7, 96 Smart Pebbles were positioned on March 16th,2009, along 32 cross-shore transects of the beach, with the dis-tance between two consecutive transects being constant (around7 m). Along each transect, three Smart Pebbles were positioned:one in the sea, 2 m away from the waterline and around 60 cmunder water, one on the waterline, and one on the beach, 2 maway from thewaterline. Theweight and position of each pebblewas recorded.The minimum acceptable recovery rate to develop a model of
the beach dynamics was estimated in 50% for each of the threedeployment sections (Sea, waterline, and beach): while highervalues were desirable, what was more important was a uniformdistribution of the retrieved pebbles. A 20% retrieval rate evenfor only one of the deployment sections would have meant afailure even with a 100% retrieval rate for the other two sectionsbecause the pattern of the pebble swarm movements would stillhave been uncomplete.Anyway, these requirements were shaped on the specific test
site: a general value concerning the minimum acceptable re-trieval rate is very difficult to be formulated because several keyfactors must be taken in consideration. The distance in time fromthe deployment day and the retrieval day obviously affects theretrieval rate value: the more time is spent, the lower is expectedto be the retrieval rate. The number of storms occurred duringthe test period is also a key factor: even a short span of timecan be critical when a high number of storms occurs. The struc-ture of the beach is also significant: the presence of protectionstructures reduces the reworking of the beach, thus possibly in-creasing the retrieval rate.The recovery operation was carried from May 19th, 2009,
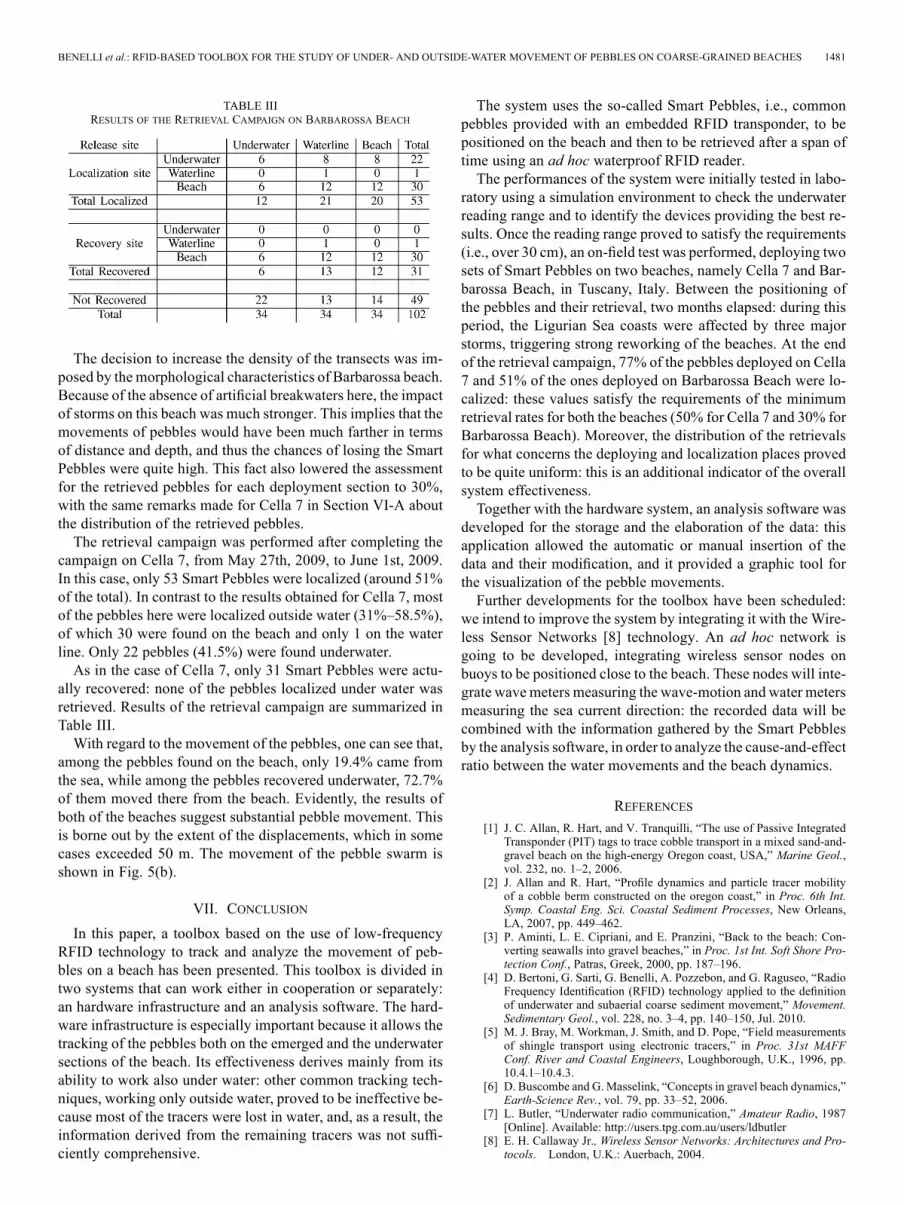
to May 26th, 2009 and it took five days to understand the bestapproach for retrieval operations. At the end of the recoverycampaign, 74 pebbles (77% of the total) were localized. Forty-four of them (59.5%) were found underwater, 18 (24.3%)on the beach and 12 (16.2%) on the waterline. Among thelocalized pebbles, 24 were from the ones positioned on thebeach, 25 from the ones on the waterline, and 25 from theones underwater. The pebbles recorded substantial movements,with many of them moving from the beach to the sea and theother way round; in particular 30% of the underwater pebblesmoved outside water, while 63.6% of the outside water pebblesmoved into the sea. An overview of the retrieval campaign canbe seen in Table II.
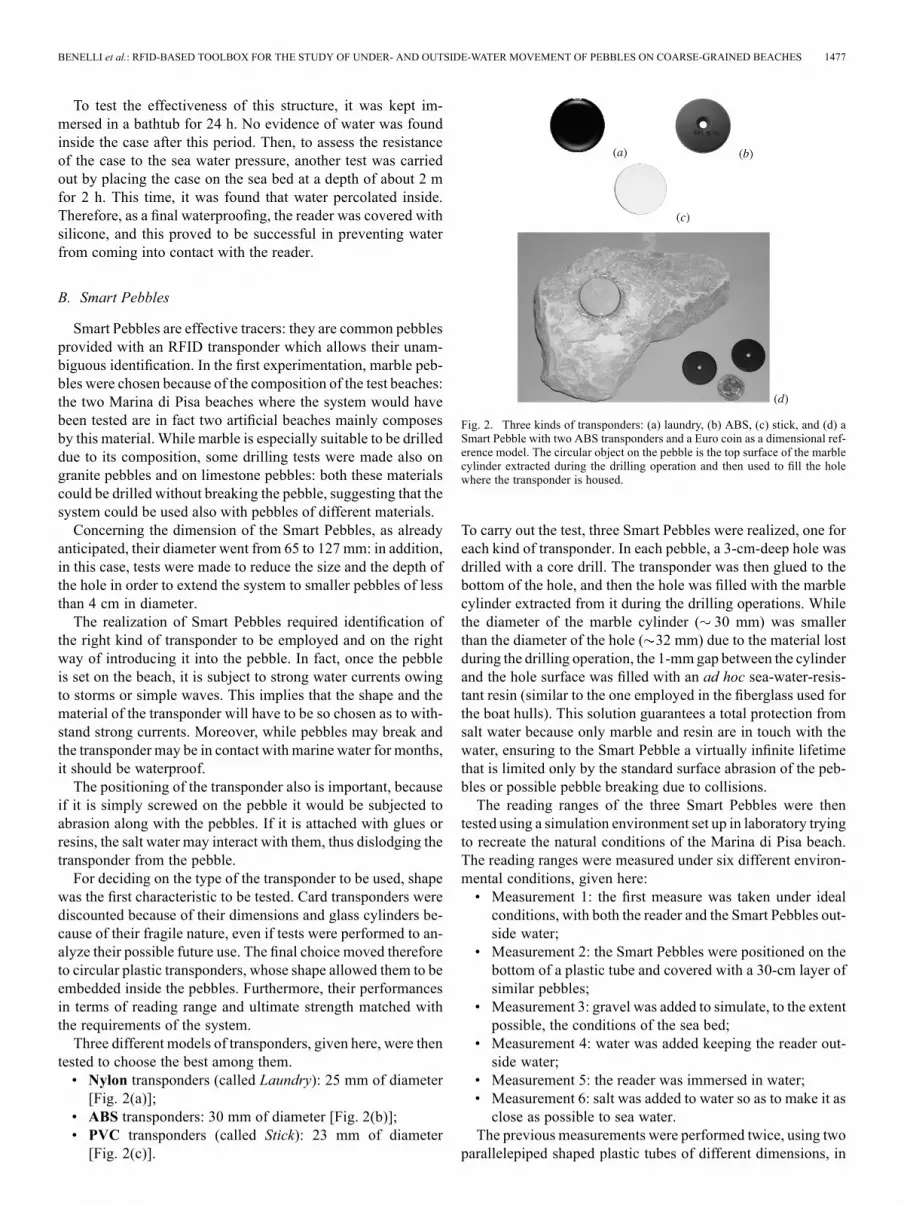
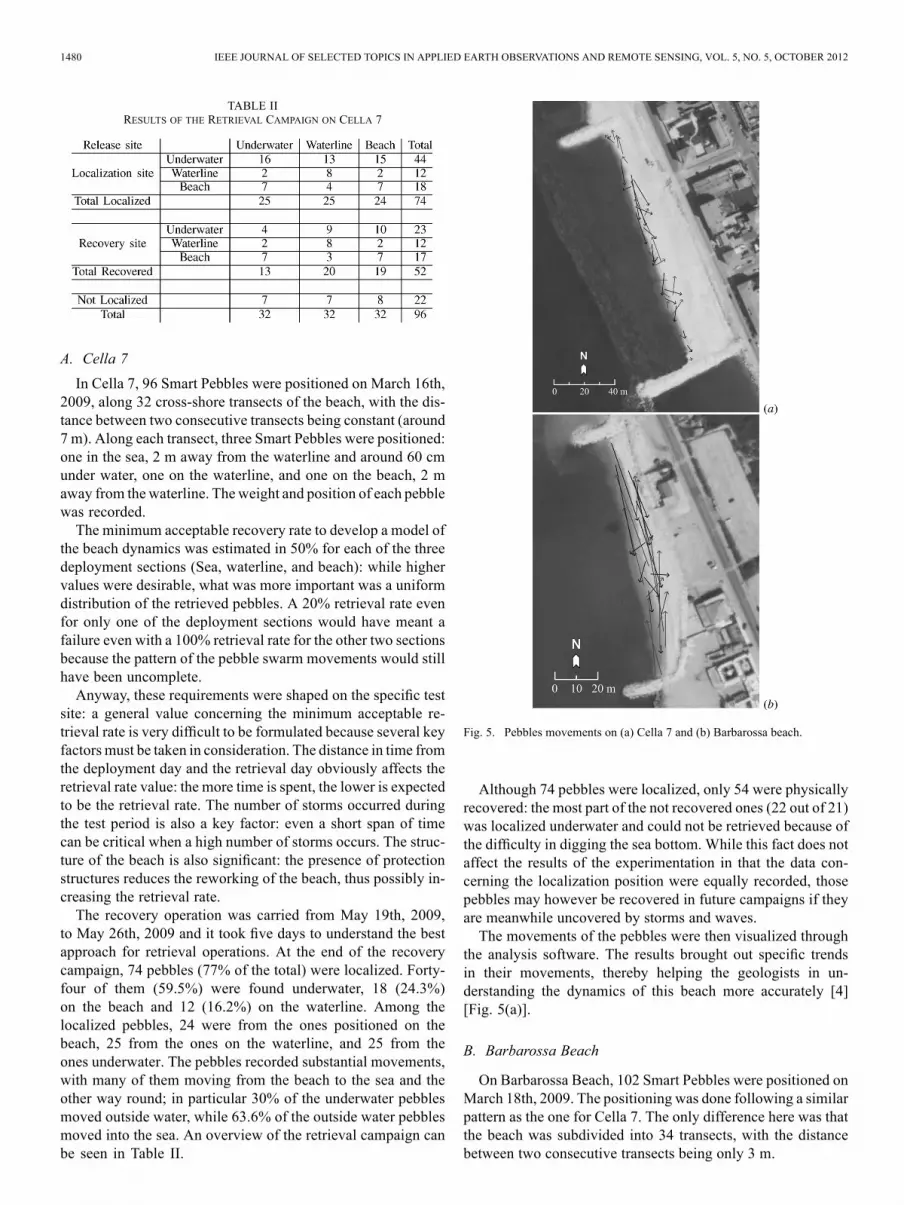
Fig. 5. Pebbles movements on (a) Cella 7 and (b) Barbarossa beach.
Although 74 pebbles were localized, only 54 were physicallyrecovered: the most part of the not recovered ones (22 out of 21)was localized underwater and could not be retrieved because ofthe difficulty in digging the sea bottom. While this fact does notaffect the results of the experimentation in that the data con-cerning the localization position were equally recorded, thosepebbles may however be recovered in future campaigns if theyare meanwhile uncovered by storms and waves.The movements of the pebbles were then visualized through
the analysis software. The results brought out specific trendsin their movements, thereby helping the geologists in un-derstanding the dynamics of this beach more accurately [4][Fig. 5(a)].
B. Barbarossa Beach
On Barbarossa Beach, 102 Smart Pebbles were positioned onMarch 18th, 2009. The positioning was done following a similarpattern as the one for Cella 7. The only difference here was thatthe beach was subdivided into 34 transects, with the distancebetween two consecutive transects being only 3 m.
BENELLI et al.: RFID-BASED TOOLBOX FOR THE STUDY OF UNDER- AND OUTSIDE-WATER MOVEMENT OF PEBBLES ON COARSE-GRAINED BEACHES 1481
TABLE IIIRESULTS OF THE RETRIEVAL CAMPAIGN ON BARBAROSSA BEACH
The decision to increase the density of the transects was im-posed by themorphological characteristics of Barbarossa beach.Because of the absence of artificial breakwaters here, the impactof storms on this beach was much stronger. This implies that themovements of pebbles would have been much farther in termsof distance and depth, and thus the chances of losing the SmartPebbles were quite high. This fact also lowered the assessmentfor the retrieved pebbles for each deployment section to 30%,with the same remarks made for Cella 7 in Section VI-A aboutthe distribution of the retrieved pebbles.The retrieval campaign was performed after completing the
campaign on Cella 7, from May 27th, 2009, to June 1st, 2009.In this case, only 53 Smart Pebbles were localized (around 51%of the total). In contrast to the results obtained for Cella 7, mostof the pebbles here were localized outside water (31%–58.5%),of which 30 were found on the beach and only 1 on the waterline. Only 22 pebbles (41.5%) were found underwater.As in the case of Cella 7, only 31 Smart Pebbles were actu-
ally recovered: none of the pebbles localized under water wasretrieved. Results of the retrieval campaign are summarized inTable III.With regard to the movement of the pebbles, one can see that,
among the pebbles found on the beach, only 19.4% came fromthe sea, while among the pebbles recovered underwater, 72.7%of them moved there from the beach. Evidently, the results ofboth of the beaches suggest substantial pebble movement. Thisis borne out by the extent of the displacements, which in somecases exceeded 50 m. The movement of the pebble swarm isshown in Fig. 5(b).
VII. CONCLUSION
In this paper, a toolbox based on the use of low-frequencyRFID technology to track and analyze the movement of peb-bles on a beach has been presented. This toolbox is divided intwo systems that can work either in cooperation or separately:an hardware infrastructure and an analysis software. The hard-ware infrastructure is especially important because it allows thetracking of the pebbles both on the emerged and the underwatersections of the beach. Its effectiveness derives mainly from itsability to work also under water: other common tracking tech-niques, working only outside water, proved to be ineffective be-cause most of the tracers were lost in water, and, as a result, theinformation derived from the remaining tracers was not suffi-ciently comprehensive.
The system uses the so-called Smart Pebbles, i.e., commonpebbles provided with an embedded RFID transponder, to bepositioned on the beach and then to be retrieved after a span oftime using an ad hoc waterproof RFID reader.The performances of the system were initially tested in labo-
ratory using a simulation environment to check the underwaterreading range and to identify the devices providing the best re-sults. Once the reading range proved to satisfy the requirements(i.e., over 30 cm), an on-field test was performed, deploying twosets of Smart Pebbles on two beaches, namely Cella 7 and Bar-barossa Beach, in Tuscany, Italy. Between the positioning ofthe pebbles and their retrieval, two months elapsed: during thisperiod, the Ligurian Sea coasts were affected by three majorstorms, triggering strong reworking of the beaches. At the endof the retrieval campaign, 77% of the pebbles deployed on Cella7 and 51% of the ones deployed on Barbarossa Beach were lo-calized: these values satisfy the requirements of the minimumretrieval rates for both the beaches (50% for Cella 7 and 30% forBarbarossa Beach). Moreover, the distribution of the retrievalsfor what concerns the deploying and localization places provedto be quite uniform: this is an additional indicator of the overallsystem effectiveness.Together with the hardware system, an analysis software was
developed for the storage and the elaboration of the data: thisapplication allowed the automatic or manual insertion of thedata and their modification, and it provided a graphic tool forthe visualization of the pebble movements.Further developments for the toolbox have been scheduled:
we intend to improve the system by integrating it with the Wire-less Sensor Networks [8] technology. An ad hoc network isgoing to be developed, integrating wireless sensor nodes onbuoys to be positioned close to the beach. These nodes will inte-grate wavemeters measuring the wave-motion and water metersmeasuring the sea current direction: the recorded data will becombined with the information gathered by the Smart Pebblesby the analysis software, in order to analyze the cause-and-effectratio between the water movements and the beach dynamics.
REFERENCES
[1] J. C. Allan, R. Hart, and V. Tranquilli, “The use of Passive IntegratedTransponder (PIT) tags to trace cobble transport in a mixed sand-and-gravel beach on the high-energy Oregon coast, USA,” Marine Geol.,vol. 232, no. 1–2, 2006.
[2] J. Allan and R. Hart, “Profile dynamics and particle tracer mobilityof a cobble berm constructed on the oregon coast,” in Proc. 6th Int.Symp. Coastal Eng. Sci. Coastal Sediment Processes, New Orleans,LA, 2007, pp. 449–462.
[3] P. Aminti, L. E. Cipriani, and E. Pranzini, “Back to the beach: Con-verting seawalls into gravel beaches,” in Proc. 1st Int. Soft Shore Pro-tection Conf., Patras, Greek, 2000, pp. 187–196.
[4] D. Bertoni, G. Sarti, G. Benelli, A. Pozzebon, and G. Raguseo, “RadioFrequency Identification (RFID) technology applied to the definitionof underwater and subaerial coarse sediment movement,” Movement.Sedimentary Geol., vol. 228, no. 3–4, pp. 140–150, Jul. 2010.
[5] M. J. Bray, M. Workman, J. Smith, and D. Pope, “Field measurementsof shingle transport using electronic tracers,” in Proc. 31st MAFFConf. River and Coastal Engineers, Loughborough, U.K., 1996, pp.10.4.1–10.4.3.
[6] D. Buscombe and G.Masselink, “Concepts in gravel beach dynamics,”Earth-Science Rev., vol. 79, pp. 33–52, 2006.
[7] L. Butler, “Underwater radio communication,” Amateur Radio, 1987[Online]. Available: http://users.tpg.com.au/users/ldbutler
[8] E. H. Callaway Jr., Wireless Sensor Networks: Architectures and Pro-tocols. London, U.K.: Auerbach, 2004.
1482 IEEE JOURNAL OF SELECTED TOPICS IN APPLIED EARTH OBSERVATIONS AND REMOTE SENSING, VOL. 5, NO. 5, OCTOBER 2012
[9] A. P. Carr, A. Gleason, and A. King, “Significance of pebble size andshape in sorting by waves,” Sedimentary Geol., vol. 4, no. 1–2, pp.89–101, 1970.
[10] P. Ciavola and E. Castiglione, “Sediment dynamics of mixed sand andgravel beaches at short time-scales,” J. Coastal Res. SI, vol. 56, pp.1751–1756, 2009.
[11] P. Corke, M. Dunbabin, K. Kotay, D. Rus, and I. Vasilescu, “Data col-lection, storage, and retrieval with an underwater sensor network,” inProc. 3rd Int. Conf. Embedded Networked Sensor Syst., San Diego, CA,2005, pp. 154–165.
[12] K. Finkenzeller, RFID Handbook: Fundamentals and Applications inContactless Smart Cards and Identification. Chichester, U.K.:Wiley,2003.
[13] A. Goulbourne, “HF Antenna Design Notes, Technical ApplicationReport,” Texas Instruments, Radio Frequency Identification Systems,2003, Tech. Rep. 11-08-26-003.
[14] M. A. Hassan, A. P. Schick, and J. B. Laronne, “The recovery offlood-dispersed coarse sediment particles, a three-dimensional mag-netic tracing method,” Catena Supplement, vol. 5, pp. 153–162, 1984.
[15] M. Hattori and T. Suzuki, “Field experiment on beach gravel move-ment,” in Proc. 16th Conf. Coastal Eng., Hamburg, Germany, 1978,pp. 1688–1704.
[16] D. Horn and L. Li, “Measurement and modelling of gravel beachgroundwater response to wave run-up: Effects on beach profilechanges,” J. Coastal Res., vol. 22, pp. 1241–1249, 2006.
[17] I. P. Jolliffe, “An experiment designed to compare the relative ratesof movement of different sizes of beach pebbles,” Proc. Geologists’Assoc., vol. 75, no. 1, pp. 67–86, 1964.
[18] I. N. McCave, “Grainsize trends and transport along beaches: Examplefrom eastern England,”Marine Geol., vol. 28, no. 1–2, pp. M43–M51,1978.
[19] R. J. Nicholls and N. B.Webber, “Aluminum pebble tracer experimentson Hurst Castle Spit,” in Proc. Coastal Sediments, New Orleans, LA,1987, pp. 1563–1577.
[20] P. D. Osborne, “Transport of gravel and cobble on a mixed-sedimentinner bank shoreline of a large inlet, Grays Harbor, Washington,” Ma-rine Geol., vol. 224, pp. 145–156, 2005.
[21] D. A. Sear, M. W. E. Lee, R. J. Oakey, P. A. Carling, and P. A. Collins,“Coarse sediment tracing technology in littoral and fluvial environ-ments: A review,” in Tracers in Geomorphology, I. D. L. Foster, Ed.Chichester, U.K.: Wiley, 2000.
[22] T. H. Van Andel and D. M. Poole, “Sources of recent sediments inthe northern Gulf of Mexico,” J. Sedimentary Res., vol. 30, no. 1, pp.91–122, 1960.
[23] W. E. Yasso, “Formulation and use of fluorescent tracer coatings insediment transport studies,” Sedimentol., vol. 6, no. 4, pp. 287–301,1966.
[24] “Development and implementation of RFID technology,” In-Tech Pub-lishers, Wien, Austria, 2009.
[25] “Intermec RFID SystemManual,” Intermec Technologies Corp., 2005.[26] “Living with Coastal Erosion in Europe: Sediment and Space for Sus-
tainability. PART I – Major Findings and Policy Recommendations ofthe EUROSION Project,” Eurosion project, Directorate General Envi-ronment, European Commission, 2004.
[27] “Living with Coastal Erosion in Europe: Sediment and Space for Sus-tainability. PART II – Maps and Statistics,” Eurosion project, Direc-torate General Environment, European Commission, 2004.
[28] “Realizing the Promise of RFID: Insights from Early Adopters and theFuture Potential,” EAI Technologies, 2005.
Giuliano Benelli received the degree in physics from the University of Flo-rence, Florence, Italy, in 1973.In 1975, he joined the Electrical Department, University of Florence, Flo-
rence, Italy, first with a Researcher Fellowship ahd from 1981 to 1987 as aResearcher. From 1987 to 1990, he was an Associate Professor with the En-gineering Department, University of Florence, where he taught telecommuni-cations systems. From 1990 to 1993, he was a Full Professor with the ElectricalDepartment, University of Pavia, Pavia, Italy, where he taught electrical com-munications. He is currently a Full Professor with the Engineering Faculty, Uni-versity of Siena, Siena, Italy, where he teaches electrical communications andtelecommunication networks. Since 1994, he has been the head of the ComputerCentre, University of Siena. From 1995 to 2005, he was the head of the Depart-ment of Information Engineering, University of Siena; from 2005 to 2008, hewas the Dean of the Engineering Faculty, University of Siena.
Alessandro Pozzebon received the M.S. degree in information engineeringfrom the University of Siena, Siena, Italy, in 2006, where he is currently workingtoward the Ph.D. degree in information engineering.At the University of Siena, he has been involved with RFID technology ap-
plied to cultural heritage. His research interests include applications in differentfields (healthcare, cultural, heritage, and environment), with wireless sensorsnetworks and RFID and NFC technologies.
Duccio Bertoni was born in Viareggio, Italy, in 1976. He received the M.S.degree in earth sciences from the University of Pisa, Pisa, Italy, in 2005, wherehe is currently working toward the Ph.D. degree.His doctoral work focuses on nearshore processes of three artificial coarse-
grained beaches. His research interests include coastal morphodynamics, coastaldune environment, and sedimentology.
Giovanni Sarti received the M.S. degree (with honors) in earth sciences andthe Ph.D. degree from the University of Pisa, Pisa, Italy, in 1990 and 1994,respectively.Since 1998, he has been a Researcher with the Department of Earth Sciences,
University of Pisa, Pisa, Italy, where he also teaches sedimentology.His research interests include application of the concepts of facies analysis
and sequence stratigraphy to the Late Pleistocene-Holocene deposits, geoarche-ology, and coast dynamics.