Global Journal of Computer Science and Technology: C Software & Data Engineering Volume 14 Issue 7 Version 1.0 Year 2014 Type: Double Blind Peer Reviewed International Research Journal Publisher: Global Journals Inc. (USA) Online ISSN: 0975-4172 & Print ISSN: 0975-4350
An under-Sampled Approach for Handling Skewed Data Distribution using Cluster Disjuncts By Syed Ziaur Rahman, Dr. G Samuel Vara Prasad Raju & Dr. Ali MirzaMahmood
Andhra University, India
Abstract- In Data mining and Knowledge Discovery hidden and valuable knowledge from the data sources is discovered. The traditional algorithms used for knowledge discovery are bottle necked due to wide range of data sources availability. Class imbalance is a one of the problem arises due to data source which provide unequal class i.e. examples of one class in a training data set vastly outnumber examples of the other class(es). Researchers have rigorously studied several techniques to alleviate the problem of class imbalance, including resampling algorithms, and feature selection approaches to this problem. In this paper, we present a new hybrid frame work dubbed as Majority Under-sampling based on Cluster Disjunct (MAJOR_CD) for learning from skewed training data. This algorithm provides a simpler and faster alternative by using cluster disjunct concept. We conduct experiments using twelve UCI data sets from various application domains using five algorithms for comparison on six evaluation metrics. The empirical study suggests that MAJOR_CD have been believed to be effective in addressing the class imbalance problem.
Keywords : classification, class imbalance, cluster disjunct, under sampling, MAJOR_CD.
Strictly as per the compliance and regulations of:
An under-Sampled Approach for Handling Skewed Data Distribution using Cluster
Disjuncts Syed Ziaur Rahman α, Dr. G Samuel Vara Prasad Raju σ & Dr. Ali Mirza Mahmood ρ
Abstract- In Data mining and Knowledge Discovery hidden and valuable knowledge from the data sources is discovered. The traditional algorithms used for knowledge discovery are bottle necked due to wide range of data sources availability. Class imbalance is a one of the problem arises due to data source which provide unequal class i.e. examples of one class in a training data set vastly outnumber examples of the other class(es). Researchers have rigorously studied several techniques to alleviate the problem of class imbalance, including resampling algorithms, and feature selection approaches to this problem. In this paper, we present a new hybrid frame work dubbed as Majority Under-sampling based on Cluster Disjunct (MAJOR_CD) for learning from skewed training data. This algorithm provides a simpler and faster alternative by using cluster disjunct concept. We conduct experiments using twelve UCI data sets from various application domains using five algorithms for comparison on six evaluation metrics. The empirical study suggests that MAJOR_CD have been believed to be effective in addressing the class imbalance problem. Keywords: classification, class imbalance, cluster disjunct, under sampling, MAJOR_CD.
I. Introduction
dataset is class imbalanced if the classification categories are not approximately equally represented. The level of imbalance (ratio of size
of the majority class to minority class) can be as huge as 1:99 [1]. It is noteworthy that class imbalance is emerging as an important issue in designing classifiers [2], [3], [4]. Furthermore, the class with the lowest number of instances is usually the class of interest from the point of view of the learning task [5]. This problem is of great interest because it turns up in many real-world classification problems, such as remote-sensing [6], pollution detection [7], risk management [8], fraud detection [9], and especially medical diagnosis [10]–[13].
There exist techniques to develop better performing classifiers with imbalanced datasets, which are generally called Class Imbalance Learning (CIL)
methods. These methods can be broadly divided into two categories, namely, external methods and internal methods. External methods involve preprocessing of training datasets in order to make them balanced, while internal methods deal with modifications of the learning algorithms in order to reduce their sensitiveness to class imbalance [14]. The main advantage of external methods as previously pointed out, is that they are independent of the underlying classifier.
Whenever a class in a classification task is under represented (i.e., has a lower prior probability) compared to other classes, we consider the data as imbalanced [15], [16]. The main problem in imbalanced data is that the majority classes that are represented by large numbers of patterns rule the classifier decision boundaries at the expense of the minority classes that are represented by small numbers of patterns. This leads to high and low accuracies in classifying the majority and minority classes, respectively, which do not necessarily reflect the true difficulty in classifying these classes. Most common solutions to this problem balance the number of patterns in the minority or majority classes.
Resampling techniques can be categorized into three groups. Under-sampling methods, which create a subset of the original data-set by eliminating instances (usually majority class instances); oversampling methods, which create a superset of the original data-set by replicating some instances or creating new instances from existing ones; and finally, hybrids methods that combine both sampling methods. Among these categories, there exist several different proposals; from this point, we only center our attention in those that have been used in under sampling. Either way, balancing the data has been found to alleviate the problem of imbalanced data and enhance accuracy [15], [16], [17]. Data balancing is performed by, e.g., oversampling patterns of minority classes either randomly or from areas close to the decision boundaries. Interestingly, random oversampling is found comparable to more sophisticated oversampling methods [17]. Alternatively, under-sampling is performed on majority classes either randomly or from areas far away from the decision boundaries. We note that random under-sampling may remove significant patterns and random oversampling may lead to over-
Author σ: Professor in CS & SE department of Andhra University, Vishakhapatnam, Andhra Pradesh India.Author ρ: Associate Professor in DMS SVH College of Engineering, Machlipatnam, Andhra Pradesh India.
Authorα: Research Scholar, Department of CS & SE, Andhra University, Vishakhapatnam, Andhra Pradesh India. email: [email protected]
fitting, so random sampling should be performed with care. We also note that, usually, selective under sampling of majority classes is more accurate than oversampling of minority class. In this paper, we are laying more stress to propose an external class imbalance learning method for solving the class imbalance problem by performing selective under sampling of majority class.
This paper is organized as follows. Section II presets the problem of cluster disjuncts. Section III briefly reviews the data balancing problems and its measures and in Section IV, we discuss the proposed method of MAJOR_CD (Majority Under-sampling based on Cluster Disjunct) for class imbalance learning. Section V presents the imbalanced datasets used to validate the proposed method, while In Section VI, we present the experimental setting and In Section VII discuss, in detail, the classification results obtained by the proposed method and compare them with the results obtained by different existing methods and finally, in Section VIII we conclude the paper.
II. Problem of Cluster Disjunct
In Class Imbalance learning, the numbers of instances in the majority class are outnumbered to the number of instances in the minority class. Furthermore, the minority concept may additionally contain a sub concept with limited instances, amounting to diverging degrees of classification difficulty [18-19]. This, in fact, is the result of another form of imbalance, a within-class imbalance, which concerns itself with the distribution of representative data for sub concepts within a class [20-22].
The existence of within-class imbalances is closely intertwined with the problem of small disjuncts, which has been shown to greatly depreciate classification performance [20-23]. Briefly, the problem of small disjuncts can be understood as follows: A classifier will attempt to learn a concept by creating multiple disjunct rules that describe the main concept [18-19], [23]. In the case of homogeneous concepts, the classifier will generally create large disjuncts, i.e., rules that cover a large portion (cluster) of examples pertaining to the main concept. However, in the case of heterogeneous concepts, small disjuncts, i.e., rules that cover a small cluster of examples pertaining to the main concept, arise as a direct result of underrepresented sub concepts [18-19], [23]. Moreover, since classifiers attempt to learn both majority and minority a concept, the problem of small disjuncts is not only restricted to the minority concept. On the contrary, small disjuncts of the majority class can arise from noisy misclassified minority class examples or underrepresented subconcepts. However, because of the vast representation of majority class data, this occurrence is infrequent. A more common scenario is that noise may
influence disjuncts in the minority class. In this case, the validity of the clusters corresponding to the small disjuncts becomes an important issue, i.e., whether these examples represent an actual subconcept or are merely attributed to noise. To solve the above problem of cluster disjuncts we propose the method cluster disjunct minority oversampling technique for class imbalance learning.
III. Literature Review
In this section, we first review the major research about clustering in class imbalance learning and explain why we choose under-sampling as our technique in this paper.
The different imbalance data learning approaches are as follows:
An under-Sampled Approach for Handling Skewed Data Distribution using Cluster Disjuncts
MetCost Cost-sensitive meta-learning sampling
methods FEATURE SELECTION METHODS
Warpper PREE (Prediction Risk based feature
selection for Easy Ensemble) ALGORITHMS MODIFICATION
Proposal for new splitting criteria DKM Adjusting the distribution reference in the tree Offset Entropy
Siti Khadijah Mohamad et al. [24] have conducted a review to look into how the data mining was tackled by previous scholars and the latest trends on data mining in educational research. Hongzhou Sha et al. [25] have proposed a method named EPLogCleaner that can filter out plenty of irrelevant items based on the common prefix of their URLs.
M.S.B. PhridviRaj et al. [26] have proposed an algorithm for finding frequent patterns from data streams by performs only one time scan of the database initially and uses the information to find frequent patterns using frequent pattern generation tree. Chumphol Bunkhumpornpat et al. [27] have a new over-sampling technique called DBSMOTE is proposed. DBSMOTE technique relies on a density-based notion of clusters and is designed to oversample an arbitrarily shaped cluster discovered by DBSCAN. DBSMOTE generates synthetic instances along a shortest path from each positive instance to a pseudo centroid of a minority-class cluster. Matías Di Martino et al. [28] have presented a new classifier developed specially for imbalanced problems, where maximum F-measure instead of maximum accuracy guide the classifier design.
V. Garcia et al. [29] have investigated the influence of both the imbalance ratio and the classifier on the performance of several resampling strategies to deal with imbalanced data sets. The study focuses on evaluating how learning is affected when different resampling algorithms transform the originally imbalanced data into artificially balanced class distributions. Table 2 presents recent algorithmic advances in class imbalance learning available in the literature. Obviously, there are many other algorithms which are not included in this table. A profound comparison of the above algorithms and many others can be gathered from the references list.
María Dolores Pérez-Godoy et al. [30] have proposed CO2RBFN, a evolutionary cooperative–competitive model for the design of radial-basis function networks which uses both radial-basis function and the evolutionary cooperative-competitive technique on imbalanced domains. CO2RBFN follows the
evolutionary cooperative–competitive strategy, where each individual of the population represents an RBF (Gaussian function will be considered as RBF) and the entire population is responsible for the definite solution. This paradigm provides a framework where an individual of the population represents only a part of the solution, competing to survive (since it will be eliminated if its performance is poor) but at the same time cooperating in order to build the whole RBFN, which adequately represents the knowledge about the problem and achieves good generalization for new patterns.
Table 2 : Recent advances in Class Imbalance Learning
DCEID Combining ensemble learning [27] with cost-sensitive learning. --------------------------------------------------------------------------- RUSBoost A new hybrid sampling/boosting [29]
Algorithm.
CO2RBFN A evolutionary cooperative–competitive [30] model for the design of radial-basis function networks which uses both radial-basis function and the evolutionary cooperative-competitive technique.
Improved Adapt the 2-tuples based genetic tuning [33] FRBCSs approach to classification problems showing the good synergy between this method and some FRBCSs.
BSVMs A model assessment of the interplay [37] between various classification decisions using probability, corresponding decision costs, and quadratic program of optimal margin classifier.
Der-Chiang Li et al. [31] have suggested a
strategy which over-samples the minority class and under-samples the majority one to balance the datasets. For the majority class, they build up the Gaussian type fuzzy membership function and a-cut to reduce the data size; for the minority class, they used the mega-trend diffusion membership function to generate virtual samples for the class. Furthermore, after balancing the data size of classes, they extended the data attribute dimension into a higher dimension space using classification related information to enhance the classification accuracy.
Enhong Che et al. [32] have described a unique approach to improve text categorization under class imbalance by exploiting the semantic context in text documents. Specifically, they generate new samples of rare classes (categories with relatively small amount of training data) by using global semantic information of
classes represented by probabilistic topic models. In this way, the numbers of samples in different categories can become more balanced and the performance of text categorization can be improved using this transformed data set. Indeed, this method is different from traditional re-sampling methods, which try to balance the number of documents in different classes by re-sampling the documents in rare classes. Such re-sampling methods can cause overfitting. Another benefit of this approach is the effective handling of noisy samples. Since all the new samples are generated by topic models, the impact of noisy samples is dramatically reduced.
Alberto Fernández et al. [33] have proposed an improved version of fuzzy rule based classification systems (FRBCSs) in the framework of imbalanced data-sets by means of a tuning step. Specifically, they adapt the 2-tuples based genetic tuning approach to classification problems showing the good synergy between this method and some FRBCSs. The proposed algorithm uses two learning methods in order to generate the RB for the FRBCS. The first one is the method proposed in [34], that they have named the Chi et al.’s rule generation. The second approach is defined by Ishibuchi and Yamamoto in [35] and it consists of a Fuzzy Hybrid Genetic Based Machine Learning (FH-GBML) algorithm.
J. Burez et al. [36] have investigated how they can better handle class imbalance in churn prediction. Using more appropriate evaluation metrics (AUC, lift), they investigated the increase in performance of sampling (both random and advanced under-sampling) and two specific modeling techniques (gradient boosting and weighted random forests) compared to some standard modeling techniques. They have advised weighted random forests, as a cost-sensitive learner, performs significantly better compared to random forests.
Che-Chang Hsu et al. [37] have proposed a method with a model assessment of the interplay between various classification decisions using probability, corresponding decis ion costs, and quadratic program of optimal margin classifier called: Bayesian Support Vector Machines (BSVMs) learning strategy. The purpose of their learning method is to lead an attractive pragmatic expansion scheme of the Bayesian approach to assess how well it is aligned with the class imbalance problem. In the framework, they did modify in the objects and conditions of primal problem to reproduce an appropriate learning rule for an observation sample. In [38] Alberto Fernández et al. have proposed to work with fuzzy rule based classification systems using a preprocessing step in order to deal with the class imbalance. Their aim is to analyze the behavior of fuzzy rule based classification systems in the framework of imbalanced data-sets by means of the application of an adaptive inference system with parametric conjunction operators. Jordan
M. Malof et al. [39] have empirically investigates how class imbalance in the available set of training cases can impact the performance of the resulting classifier as well as properties of the selected set. In this K-Nearest Neighbor (k-NN) classifier is used which is a well-known classifier and has been used in numerous case-based classification studies of imbalance datasets.
The bottom line is that when studying problems with imbalanced data, using the classifiers produced by standard machine learning algorithms without adjusting the output threshold may well be a critical mistake. This skewness towards minority class (positive) generally causes the generation of a high number of false-negative predictions, which lower the model’s performance on the positive class compared with the performance on the negative (majority) class.
IV. Methodology
In this section, we follow a design decomposition approach to systematically analyze the different imbalanced domains. We first briefly introduce the framework design for our proposed algorithm.
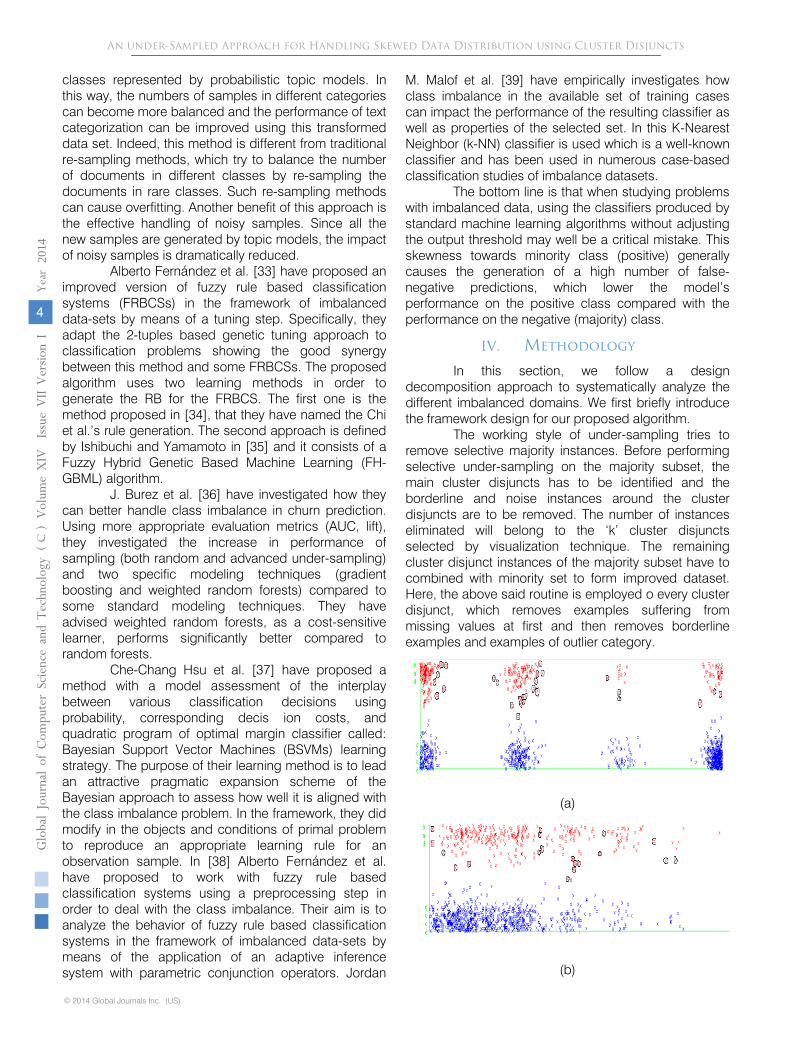
The working style of under-sampling tries to remove selective majority instances. Before performing selective under-sampling on the majority subset, the main cluster disjuncts has to be identified and the borderline and noise instances around the cluster disjuncts are to be removed. The number of instances eliminated will belong to the ‘k’ cluster disjuncts selected by visualization technique. The remaining cluster disjunct instances of the majority subset have to combined with minority set to form improved dataset. Here, the above said routine is employed o every cluster disjunct, which removes examples suffering from missing values at first and then removes borderline examples and examples of outlier category.
An under-Sampled Approach for Handling Skewed Data Distribution using Cluster Disjuncts
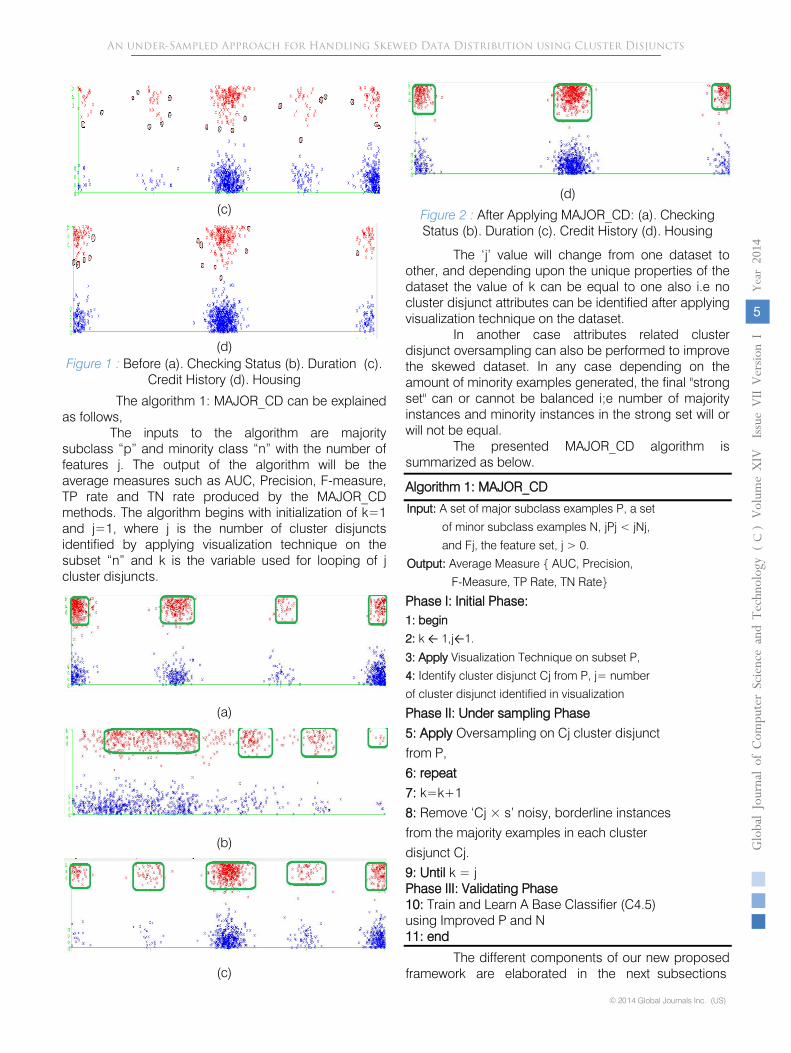
Figure 1 :
Before (a). Checking Status (b). Duration
(c). Credit History (d). Housing
The algorithm 1: MAJOR_CD can be explained as follows,
The inputs to the algorithm are majority subclass “p” and minority class “n” with the number of features j. The output of the algorithm will be the average measures such as AUC, Precision, F-measure, TP rate and TN rate produced by the MAJOR_CD methods.
The
algorithm begins with initialization of k=1 and j=1, where j is the number of cluster disjuncts identified by applying visualization technique on the subset “n” and k is the variable used for looping of j cluster disjuncts.
(a)
(b)
(c)
Figure 2 : After Applying MAJOR_CD: (a). Checking Status (b). Duration (c). Credit History (d). Housing
The ‘j’ value will change from one dataset to other, and depending upon the unique properties of the dataset the value of k can be equal to one also i.e no
cluster disjunct attributes can be identified after applying visualization technique on the dataset.
In another case attributes related cluster disjunct oversampling can also be performed to improve the skewed dataset. In any case depending on the amount of minority examples generated, the final "strong set" can or cannot be balanced i;e number of majority instances and minority instances in the strong set will or will not be equal.
The presented MAJOR_CD algorithm is summarized as below.
Algorithm 1: MAJOR_CD
Input:
A set of major subclass examples P, a set
of minor subclass examples N, jPj < jNj,
and Fj, the feature set, j > 0.
Output:
Average Measure { AUC, Precision,
F-Measure, TP Rate, TN Rate}
Phase I: Initial Phase:
1: begin
2:
k ←
1,j←1.
3:
Apply
Visualization Technique on subset P,
4:
Identify cluster disjunct Cj from P, j= number
of cluster disjunct identified in visualization
Phase II: Under sampling Phase
5: Apply Oversampling on Cj cluster disjunct
from P,
6: repeat
7: k=k+1
8: Remove ‘Cj × s’ noisy, borderline instances
from the majority examples in each cluster
disjunct Cj.
9: Until k = j
Phase III: Validating Phase
10: Train and Learn A Base Classifier (C4.5)
using Improved P and N
11: end
The different components of our new proposed framework are elaborated in the
An under-Sampled Approach for Handling Skewed Data Distribution using Cluster Disjuncts
c)(
(d)
(d)
The datasets is partitioned into majority and
minority subsets. As we are concentrating over
sampling, we will take minority data subset for
further visualization analysis to identify cluster disjuncts.
b)
Improve cluster disjunct by removing noisy
and borderline instances
Minority subset can be further analyzed to find
the noisy or borderline instances so that we can
eliminate those. For finding the weak instances
one of the ways is that find most influencing
attributes or features and then remove ranges of
the noisy or weak attributes relating to that
feature.
How to choose the noisy instances relating to
that cluster disjunct from the dataset set? We can
find a range where the number of samples are less
can give you a simple hint that those instances
coming in that range or very rare or noise. We will
intelligently detect and remove those instances
which are in narrow ranges of that particular
cluster disjunct. This process can be applied on all
the cluster disjuncts identified for each dataset.
c)
Forming the strong dataset
The minority subset and majority subset is
combined to form a strong and balance dataset,
which is used for learning of a base algorithm. In
this case we have used C4.5 or Naïve Bayes as the
base algorithm.
V.
Evaluation
Metrics
To assess the classification results we count the
number of true positive (TP), true negative (TN),
false positive (FP) (actually negative, but classified as positive) and false negative (FN) (actually
positive, but classified as negative) examples. It is
now well known that error rate is not an
appropriate evaluation criterion when there is
class imbalance or unequal costs. In this paper, we
use AUC, Precision, F-measure, TP Rate and TN
Rate as performance evaluation measures. Let us define a few well known and widely used
measures:
The Area under Curve (AUC) measure is
computed by equation (1),
(1)
The Precision measure is computed by
equation(2),
(2)
The F-measure Value is computed by
equation(3),
(3)
(5)
VI.
Experimental Framework
In this study MAJOR_CD are applied to twelve
binary data sets from the UCI repository [40] with
different imbalance ratio (IR). Table 3 summarizes
the data selected in this study and shows, for each
data set, the number of examples (#Ex.), number
of attributes (#Atts.), class name of each class
(minority and majority) and IR. In order to
estimate different measure (AUC, precision, Fmeasure,
TP rate and TN rate) we use a tenfold
cross validation approach, that is ten partitions for
training and test sets, 90% for training and 10%
for testing, where the ten test partitions form the whole set. For each data set we consider the average results of the ten partitions.
Table 3 :
Summary of benchmark imbalanced datasets
To
validate the proposed MAJOR_CD algorithm, we compared it with the traditional Support Vector Machines (SVM), C4.5, Functional Trees (FT), SMOTE (Synthetic Minority Oversampling TEchnique) and CART algorithm.
VII.
Results
For all experiments, we use existing prototype’s present in Weka [41]. We compare the following domain adaptation methods:
We compared proposed method MAJOR_CD with the SVM, C4.5 [42], FT, SMOTE [43] and CART state-of -the-art learning algorithms. In all the
datasets using proposed MAJOR_CD learning algorithm. Second, we compare the classification performance of our proposed MAJOR_CD algorithm with the traditional and class imbalance learning methods based on all datasets.
Following, we analyze the performance of the method considering the entire original algorithms, without pre-processing, data sets for SVM, C4.5, FT and CART. we
also analyze a pre-processing method SMOTE for performance evaluation of MAJOR_CD. The complete table of results for all the algorithms used in this study is shown in Table 4 to 9, where the reader can observe the full test results, of performance of each
approach with their associated standard deviation. We
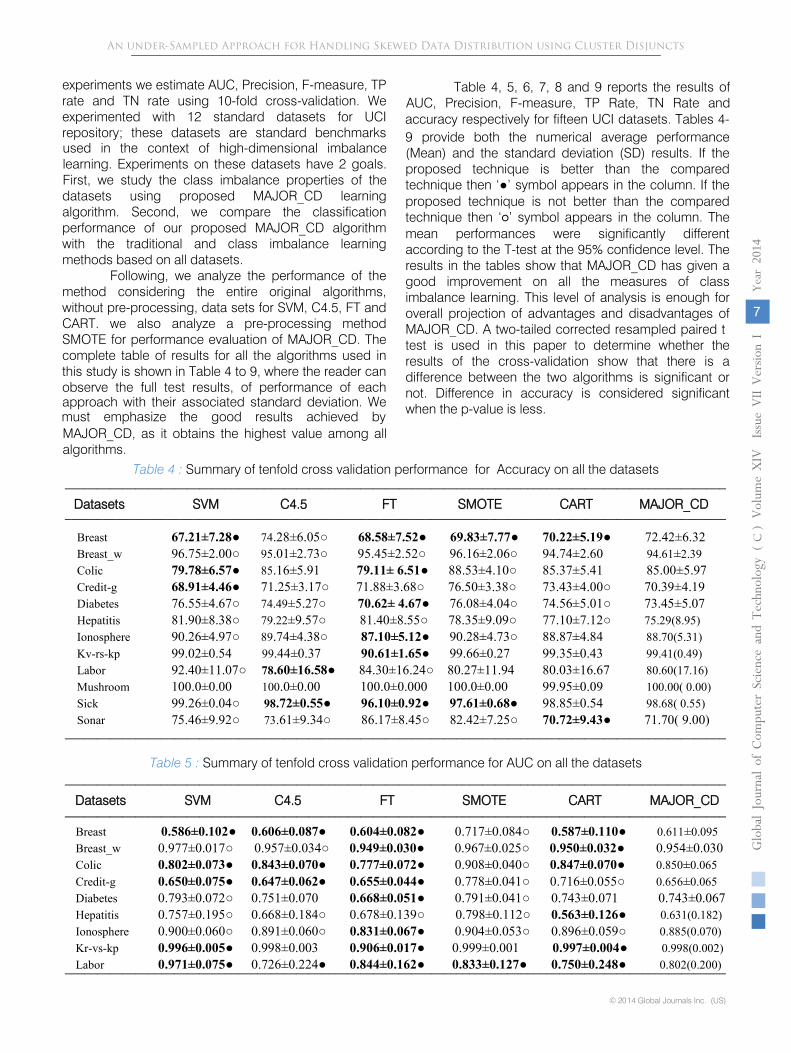
Table 4, 5, 6, 7, 8 and 9 reports the results of AUC, Precision, F-measure, TP Rate, TN Rate and
9 provide both the numerical average performance (Mean) and the standard deviation (SD) results. If the proposed technique is better than the compared technique then ‘●’ symbol appears in the column. If the proposed technique is not better than the compared technique then ‘○’ symbol appears in the column. The mean performances were significantly different according to the T-test at the 95% confidence level. The results in the tables show that MAJOR_CD has given a good improvement on all the measures of class imbalance learning. This level of analysis is enough for overall projection of advantages and disadvantages of MAJOR_CD. A two-tailed corrected resampled paired ttest is used in this paper to determine whether the results of the cross-validation show that there is a difference between the two algorithms is significant or not. Difference in accuracy is considered significant when the p-value is less.
Table 4 :
Summary of tenfold cross validation performance for
Accuracy on all the datasets
Datasets SVM
C4.5
FT SMOTE CART MAJOR_CD
Table 5 :
Summary of tenfold cross validation performance for AUC on all the datasets
used in the context of high-dimensional imbalance learning. Experiments on these datasets have 2 goals. First, we study the class imbalance properties of the
accuracy respectively for fifteen UCI datasets. Tables 4-
must emphasize the good results achieved by MAJOR_CD, as it obtains the highest value among all algorithms.
experiments we estimate AUC, Precision, F-measure, TP rate and TN rate using 10-fold cross-validation. We experimented with 12 standard datasets for UCI repository; these datasets are standard benchmarks
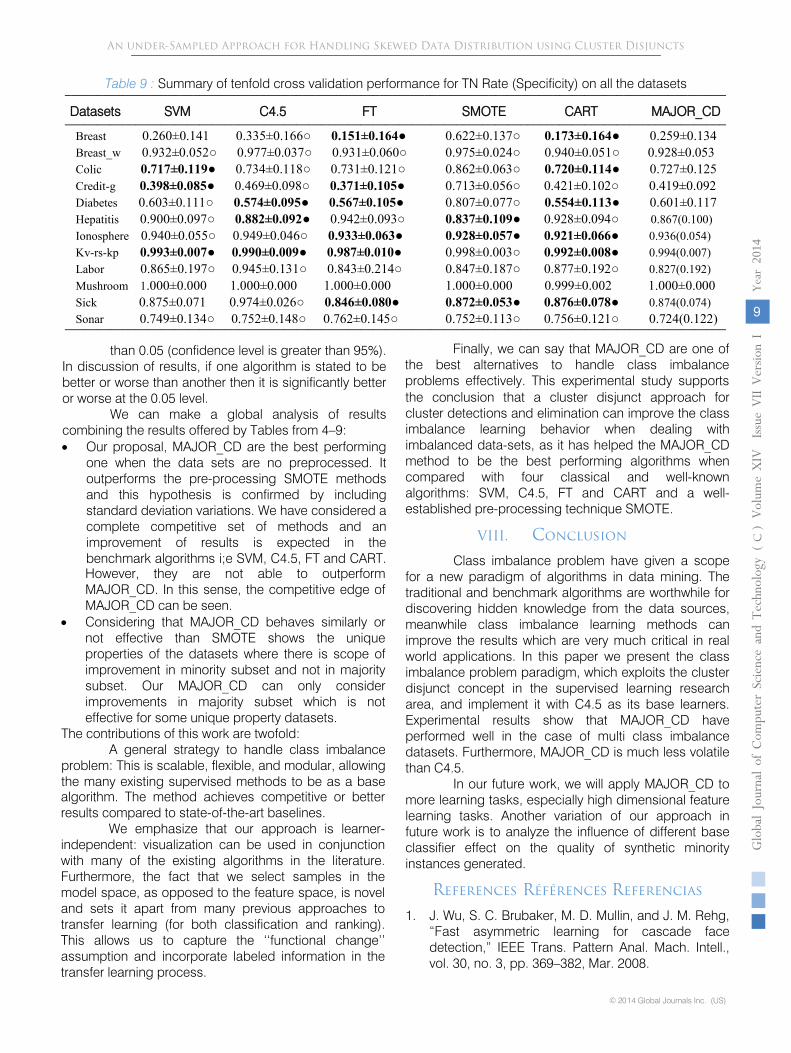
Summary of tenfold cross validation performance for TN Rate (Specificity) on all the datasets
Datasets SVM C4.5 FT SMOTE CART
MAJOR_CD
than
0.05 (confidence level is greater than 95%). In discussion of results, if one algorithm is stated to be better or worse than another then it is significantly better or worse at the 0.05 level.
We can make a global analysis of results combining the results
offered by Tables from 4–9:
•
Our proposal, MAJOR_CD are the best performing one when the data sets are no preprocessed. It outperforms the pre-processing SMOTE methods and this hypothesis is confirmed by including standard deviation variations. We have considered a complete competitive set of methods and an improvement of results is expected in the benchmark algorithms i;e SVM, C4.5, FT and CART. However, they are not able to outperform MAJOR_CD. In this sense, the competitive edge of MAJOR_CD can be seen.
•
Considering that MAJOR_CD behaves similarly or not effective than SMOTE shows the unique properties of the datasets where there is scope of improvement in minority subset and not in majority subset. Our MAJOR_CD can only consider improvements in majority subset which is not effective for some unique property datasets.
The contributions of this work are twofold:
A general strategy to handle class imbalance problem: This is scalable, flexible, and modular, allowing the many existing supervised methods to be as a base
Globa
l Jo
urna
l of C
ompu
ter Sc
ienc
e an
d Te
chno
logy
V
olum
e XIV
Issu
e VII
Versio
n I
9
(DDDD DDDD
)Year
2014
c
An under-Sampled Approach for Handling Skewed Data Distribution using Cluster Disjuncts
algorithm. The method achieves competitive or better results compared to state-of-the-art baselines.
We emphasize that our approach is learner-independent: visualization can be used in conjunction with many of the existing algorithms in the literature. Furthermore, the fact that we select samples in the model space, as opposed to the feature space, is novel and sets it apart from many previous approaches to transfer learning (for both classification and ranking). This allows us to capture the ‘‘functional change’’ assumption and incorporate labeled information in the transfer learning process.
Finally, we can say that MAJOR_CD are one of the best alternatives to handle class imbalance problems effectively. This experimental study supports the conclusion that a cluster disjunct approach for cluster detections and elimination can improve the class imbalance learning behavior when dealing with imbalanced data-sets, as it has helped the MAJOR_CD method to be the best performing algorithms when compared with four classical and well-known algorithms: SVM, C4.5, FT and CART and a well-established pre-processing technique SMOTE.
VIII. Conclusion
Class imbalance problem have given a scope for a new paradigm of algorithms in data mining. The traditional and benchmark algorithms are worthwhile for discovering hidden knowledge from the data sources, meanwhile class imbalance learning methods can improve the results which are very much critical in real world applications. In this paper we present the class imbalance problem paradigm, which exploits the cluster disjunct concept in the supervised learning research area, and implement it with C4.5 as its base learners. Experimental results show that MAJOR_CD have performed well in the case of multi class imbalance datasets. Furthermore, MAJOR_CD is much less volatile than C4.5.
In our future work, we will apply MAJOR_CD to more learning tasks, especially high dimensional feature learning tasks. Another variation of our approach in future work is to analyze the influence of different base classifier effect on the quality of synthetic minority instances generated.
References Références Referencias
1. J. Wu, S. C. Brubaker, M. D. Mullin, and J. M. Rehg, “Fast asymmetric learning for cascade face detection,” IEEE Trans. Pattern Anal. Mach. Intell., vol. 30, no. 3, pp. 369–382, Mar. 2008.
G. M.Weiss, “Mining with rarity: A unifying framework,” ACM SIGKDD Explor. Newslett., vol. 6, no. 1, pp. 7–19, Jun. 2004.
5.
N. V. Chawla, N. Japkowicz, and A. Kolcz, Eds., Special Issue Learning Imbalanced Datasets, SIGKDD Explor. Newsl., vol. 6, no. 1, 2004.
6.
W.-Z. Lu and D.Wang, “Ground-level ozone prediction by support vector machine approach with a cost-sensitive classification scheme,” Sci. Total. Enviro., vol. 395, no. 2-3, pp. 109–116, 2008.
7.
Y.-M. Huang, C.-M. Hung, and H. C. Jiau, “Evaluation of neural networks and data mining methods on a credit assessment task for class imbalance problem,” Nonlinear Anal. R. World Appl., vol. 7, no. 4, pp. 720–747, 2006.
8.
D. Cieslak, N. Chawla, and A. Striegel, “Combating imbalance in network intrusion datasets,” in IEEE Int. Conf. Granular Comput., 2006, pp. 732–737.
9.
M. A. Mazurowski, P. A. Habas, J. M. Zurada, J. Y. Lo, J. A. Baker, and G. D. Tourassi, “Training
neural network classifiers for medical decision making: The effects of imbalanced datasets on classification performance,” Neural Netw., vol. 21, no. 2–3, pp. 427–436, 2008.
10.
A. Freitas, A. Costa-Pereira, and P. Brazdil, “Cost-sensitive decision trees applied to medical data,” in Data Warehousing Knowl. Discov. (Lecture Notes Series in Computer Science), I. Song, J. Eder, and T. Nguyen, Eds.,
11.
K.Kilic¸,O¨ zgeUncu and I. B. Tu¨rksen, “Comparison of different strategies of utilizing fuzzy clustering in structure identification,” Inf. Sci., vol. 177, no. 23, pp. 5153–5162, 2007.
12.
M. E. Celebi, H. A. Kingravi, B. Uddin, H. Iyatomi, Y. A. Aslandogan, W. V. Stoecker, and R. H. Moss, “A methodological approach to the classification of dermoscopy images,” Comput.Med. Imag. Grap., vol. 31, no. 6, pp. 362–373, 2007.
13.
X. Peng and I. King, “Robust BMPM training based on second-order cone programming and its application in medical diagnosis,” Neural Netw., vol. 21, no. 2–3, pp. 450–457, 2008.Berlin/Heidelberg, Germany: Springer, 2007, vol. 4654, pp. 303–312.
14.
Rukshan Batuwita and Vasile Palade (2010) FSVM-CIL: Fuzzy Support Vector Machines for Class Imbalance Learning, IEEE TRANSACTIONS ON FUZZY SYSTEMS, VOL. 18, NO. 3, JUNE 2010, pp no:558-571.
15.
N. Japkowicz
and S. Stephen, “The Class Imbalance Problem: A Systematic Study,” Intelligent Data Analysis, vol. 6, pp. 429-450, 2002.
16.
M. Kubat and S. Matwin, “Addressing the Curse of Imbalanced Training Sets: One-Sided Selection,” Proc. 14th Int’l Conf. Machine Learning, pp. 179-186, 1997.
17.
G.E.A.P.A. Batista, R.C. Prati, and M.C. Monard, “A Study of the Behavior of Several Methods for
An under-Sampled Approach for Handling Skewed Data Distribution using Cluster Disjuncts
2. N. V. Chawla, N. Japkowicz, and A. Kotcz, Eds., Proc. ICML Workshop Learn. Imbalanced Data Sets, 2003.
3. N. Japkowicz, Ed., Proc. AAAI Workshop Learn. Imbalanced Data Sets, 2000.\
Balancing Machine Learning Training Data,” SIGKDD Explorations, vol. 6, pp. 20-29, 2004.1.
18. J.R. Quinlan, “Induction of Decision Trees,” Machine Learning, vol. 1, no. 1, pp. 81-106, 1986.
19. T. Jo and N. Japkowicz, “Class Imbalances versus Small Disjuncts,” ACM SIGKDD Explorations Newsletter, vol. 6, no. 1, pp. 40-49, 2004.
20. N. Japkowicz, “Class Imbalances: Are We Focusing on the Right Issue?” Proc. Int’l Conf. Machine Learning, Workshop Learning from Imbalanced Data Sets II, 2003.
21. R.C. Prati, G.E.A.P.A. Batista, and M.C. Monard, “Class Imbalances versus Class Overlapping: An Analysis of a Learning
22. System Behavior,” Proc. Mexican Int’l Conf. Artificial Intelligence, pp. 312-321, 2004.
23. G.M. Weiss, “Mining with Rarity: A Unifying Framework,” ACM SIGKDD Explorations Newsletter, vol. 6, no. 1, pp. 7-19, 2004.
24. Siti Khadijah Mohamada, Zaidatun Tasir. “Educational data mining: A review”, Procedia - Social and Behavioral Sciences 97 ( 2013 ) 320 – 324.
25. Hongzhou Sha, Tingwen Liu, Peng Qin, Yong Sun, Qingyun Liu.” EPLogCleaner: Improving Data Quality of Enterprise Proxy Logs for Efficient Web Usage Mining” Procedia Computer Science 17 ( 2013 ) 812 – 818.
26. M.S.B. PhridviRaj, C.V. GuruRao.” Data mining – past, present and future – a typical survey on data Streams”, Procedia Technology 12 ( 2014 ) 255 – 263.
28. Matías Di Martino, Alicia Fernández, Pablo Iturralde, Federico Lecumberry.” Novel classifier scheme for imbalanced problems”, Pattern Recognition Letters 34 (2013) 1146–1151.
29. V. Garcia, J.S. Sanchez , R.A. Mollineda,” On the effectiveness of preprocessing methods when dealing with different levels of class imbalance”, Knowledge-Based Systems 25 (2012) 13–21.
30. María Dolores Pérez-Godoy, Alberto Fernández, Antonio Jesús Rivera, María José del Jesus,” Analysis of an evolutionary RBFN design algorithm, CO2RBFN, for imbalanced data sets”, Pattern Recognition Letters 31 (2010) 2375–2388.
32.
Enhong Che, Yanggang Lin, Hui Xiong, Qiming Luo, Haiping Ma,” Exploiting probabilistic topic models to improve text categorization under class imbalance”,
42.
J. R. Quinlan, C4.5: Programs for Machine Learning, 1st ed. San Mateo, CA: Morgan Kaufmann Publishers, 1993.
43.
N. Chawla, K. Bowyer, and P. Kegelmeyer, “SMOTE: Synthetic minority over-sampling technique,” J. Artif. Intell. Res., vol.
An under-Sampled Approach for Handling Skewed Data Distribution using Cluster Disjuncts
31. Der-Chiang Li, Chiao-WenLiu, SusanC.Hu,” A learning method for the class imbalance problem with medical data sets”, Computers in Biology and Medicine 40 (2010) 509–518.
Information Processing and Management 47 (2011) 202–214.
33. Alberto Fernández, María José del Jesus, Francisco Herrera,” On the 2-tuples based genetic tuning performance for fuzzy rule based classification systems in imbalanced data-sets”, Information Sciences 180 (2010) 1268–1291.
34. Z. Chi, H. Yan, T. Pham, Fuzzy Algorithms with Applications to Image Processing and Pattern Recognition, World Scientific, 1996.
35. H. Ishibuchi, T. Yamamoto, T. Nakashima, Hybridization of fuzzy GBML approaches for pattern classification problems, IEEE Transactions on System, Man and Cybernetics B 35 (2) (2005) 359–365.
36. J. Burez, D. Van den Poel,” Handling class imbalance in customer churn prediction”, Expert Systems with Applications 36 (2009) 4626–4636.
37. Che-Chang Hsu, Kuo-Shong Wang, Shih-Hsing Chang,” Bayesian decision theory for support vector machines: Imbalance measurement and feature optimization”, Expert Systems with Applications 38 (2011) 4698–4704.
38. Alberto Fernández, María José del Jesus, Francisco Herrera,” On the influence of an adaptive inference system in fuzzy rule based classification systems for imbalanced data-sets”, Expert Systems with Applications 36 (2009) 9805–9812.
39. Jordan M. Malof, Maciej A. Mazurowski, Georgia D. Tourassi,” The effect of class imbalance on case selection for case-based classifiers: An empirical study in the context of medical decision support”, Neural Networks 25 (2012) 141–145.
40. A. Asuncion D. Newman. (2007). UCI Repository of Machine Learning Database (School of Information and Computer Science), Irvine, CA: Univ. of California [Online]. Available: http://www.ics. uci.edu/∼mlearn/MLRepository.html.
41. Witten, I.H. and Frank, E. (2005) Data Mining: Practical machine learning tools and techniques. 2nd edition Morgan Kaufmann, San Francisco.