APPRAISAL REPORT MARKET VALUE APPRAISAL OF HOHOKAM 10 BUSINESS CENTER AT 4425, 4445, 4535, AND 4555 EAST ELWOOD STREET, PHOENIX, ARIZONA PREPARED FOR ARIZONA DEPARTMENT OF TRANSPORTATION 1801 WEST JEFFERSON STREET, SUITE 120, MD 102M, PHOENIX, ARIZONA, 85007 ATTN: MR. TIMOTHY F. O'CONNELL, JR. RIGHT OF WAY PROJECT MANAGEMENT SECTION, REVIEW APPRAISER PARCEL: L-C-047 PROLOGIS OWNER: ADOT EFFECTIVE DATE: DECEMBER 19, 2017 MFVS FILE NO. 17365 PREPARED BY WENDELL L. MONTANDON, MAI AND R. JOHN MCDONALD, MAI OF MONTANDON FARLEY VALUATION SERVICES 1440 EAST MISSOURI AVENUE, SUITE C-100 PHOENIX, ARIZONA 85014
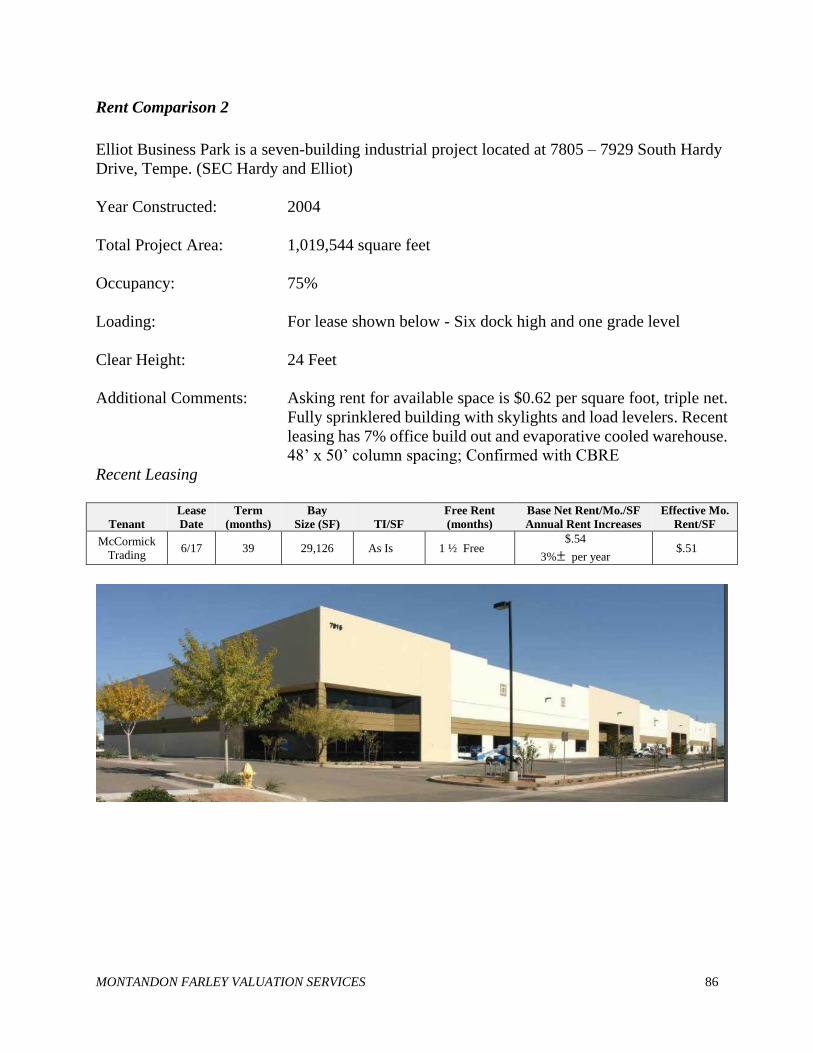
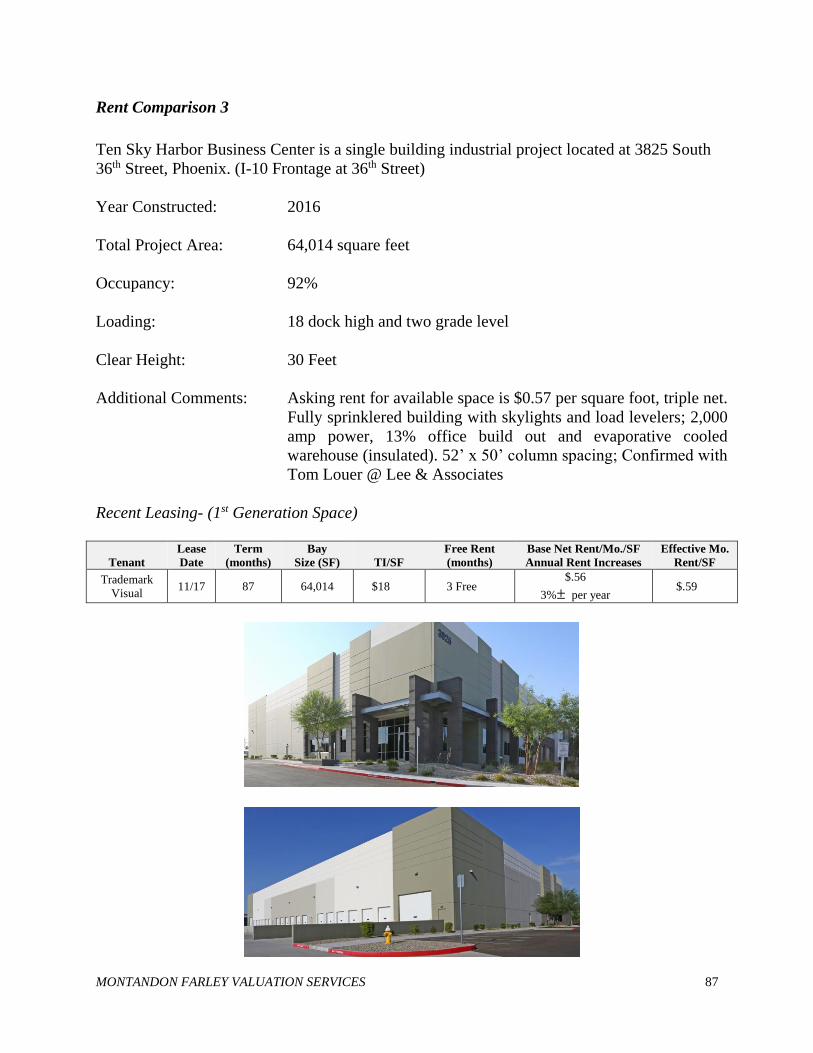
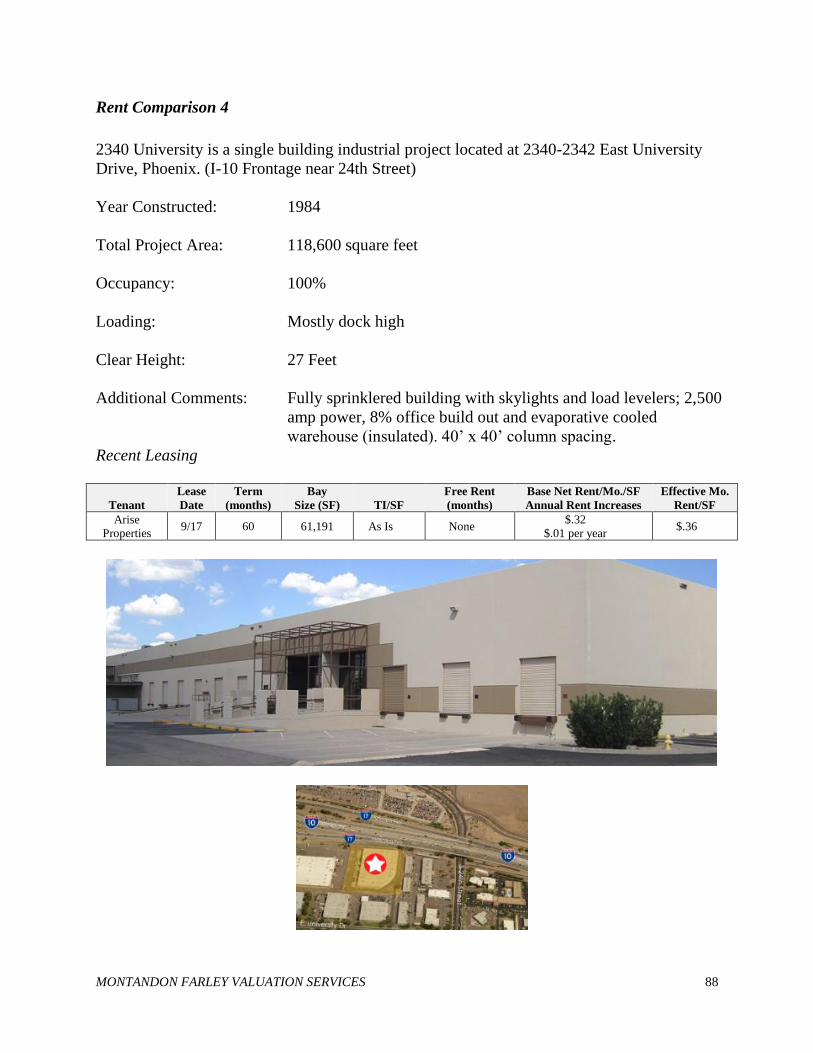
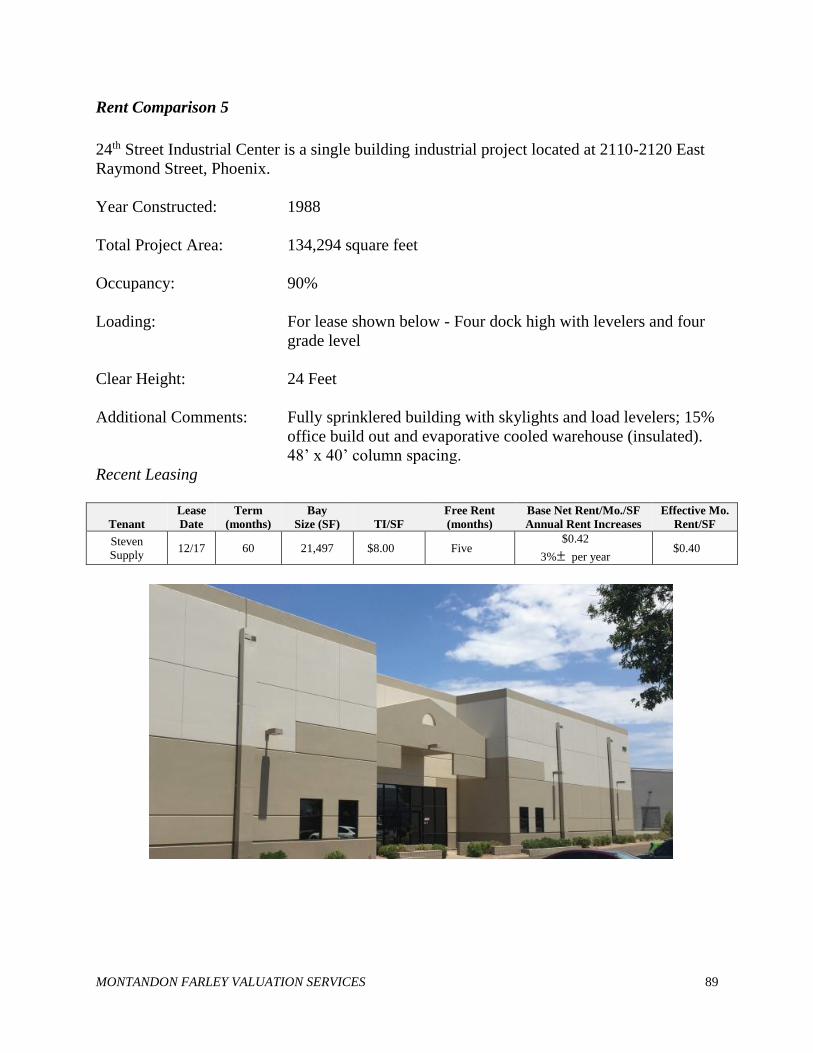
Transcript
APPRAISAL REPORT
MARKET VALUE APPRAISAL
OF HOHOKAM 10 BUSINESS CENTER
AT 4425, 4445, 4535, AND 4555 EAST
ELWOOD STREET,
PHOENIX, ARIZONA
PREPARED FOR
ARIZONA DEPARTMENT OF TRANSPORTATION
1801 WEST JEFFERSON STREET, SUITE 120, MD 102M,
PHOENIX, ARIZONA, 85007
ATTN: MR. TIMOTHY F. O'CONNELL, JR.
RIGHT OF WAY PROJECT MANAGEMENT SECTION, REVIEW APPRAISER
PARCEL: L-C-047 PROLOGIS
OWNER: ADOT
EFFECTIVE DATE: DECEMBER 19, 2017
MFVS FILE NO. 17365
PREPARED BY
WENDELL L. MONTANDON, MAI
AND
R. JOHN MCDONALD, MAI
OF
MONTANDON FARLEY VALUATION SERVICES
1440 EAST MISSOURI AVENUE, SUITE C-100
PHOENIX, ARIZONA 85014
WENDELL L. MONTANDON, MAI 1440 EAST MISSOURI AVENUE DENNIS L. FARLEY JR., MAI R. JOHN McDONALD, MAI SUITE C-100 SARA CABIRAC
PETER MENGHINI PHOENIX, ARIZONA 85014 LISA ANDREWS
Arizona Department of Transportation June 12, 2018 Page Two After considering all of the facts available to us, subject to the extraordinary assumptions detailed below as well as the underlying assumptions and limiting conditions contained herein, it is our opinion that the leased fee estate in the subject property had a market value, as of December 19, 2017, of
$20,030,000 An auditing breakdown of our value conclusion is set forth below. Land $8,810,000 Improvements $11,220,000 Extraordinary Assumptions: The subject is known within the real estate community to be an excess parcel owned by ADOT that is planned for disposition. The “as is” market value concluded herein is predicated on the extraordinary assumption that once an offer to purchase the subject is made the subject will then be advertised for thirty days seeking an additional offer. If there is an additional offer the subject will be sold in one transaction to one buyer at a public auction that is appropriately advertised. The sale will be on an “as is, where is” basis wherein the successful bidder will be required to demolish and reconfigure the southern 50 to 60 feet of three of the subject’s buildings within twelve months of purchase in compliance with municipal and industry standards and in accordance with plans, specifications and costs provided to the appraisers and summarized herein. Our value assumes leases are valid as described herein. Our value also assumes ADOT will provide temporary construction easements necessary to complete the demolition and reconstruction (see Stipulations Upon Ownership Transfer section of this report herein). The successful bidder most close escrow within two months and does not have a due diligence period during escrow. The seller (ADOT) does not pay brokerage fees. The use of these assumptions may affect assignment results. Sincerely, Wendell L. Montandon, MAI Certified General Real Estate Appraiser Certificate Number 30159, State of Arizona
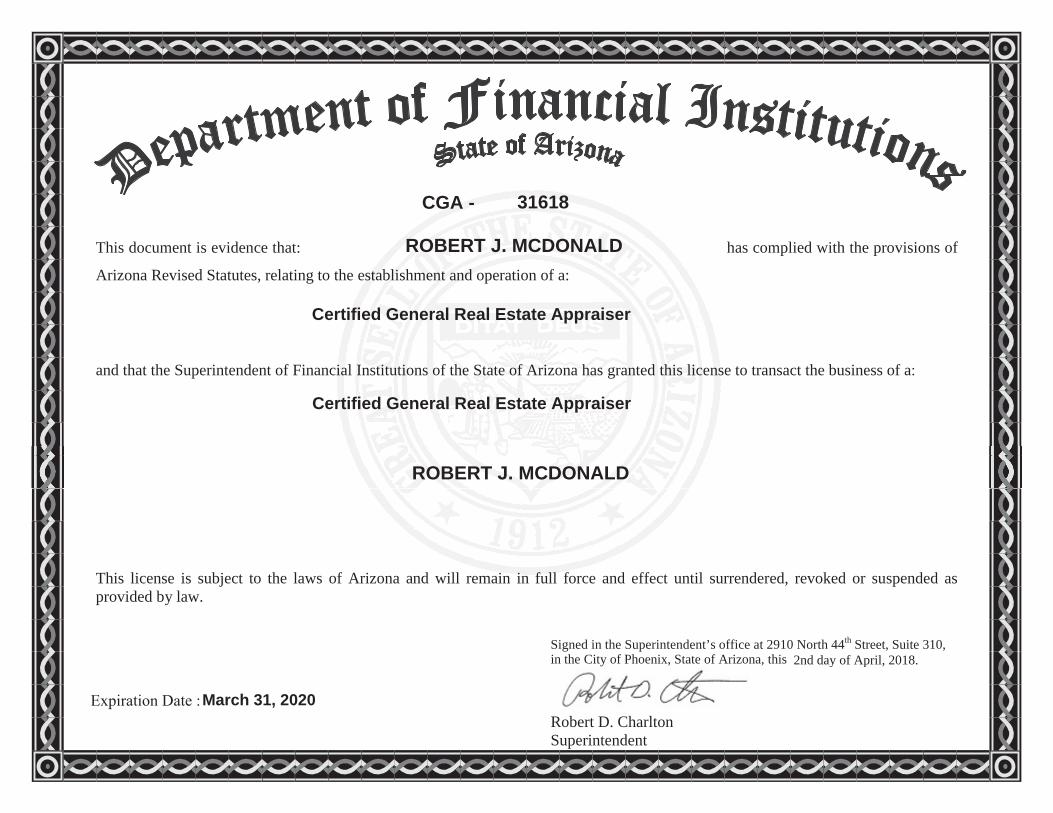
R. John McDonald, MAI Certified General Real Estate Appraiser Certificate Number 31618, State of Arizona
EXECUTIVE SUMMARY
Address: 4425, 4445, 4535, and 4555 East Elwood Street, Phoenix,
Arizona
Assessor’s Parcel No.: 124-55-646
Date of Report: June 12, 2018
Effective Date: December 19, 2017
Interest Valued: The leased fee estate
Land Area: Frontage on Elwood Street - 2,400 feet
Frontage on Interstate 10 Freeway - 1,090 feet
Total Net Area – 926,979 square feet, or 21.28 acres
Zoning: A-1, Light Industrial and CP/CPG, Commerce
Park/General Commerce Park, by the city of Phoenix
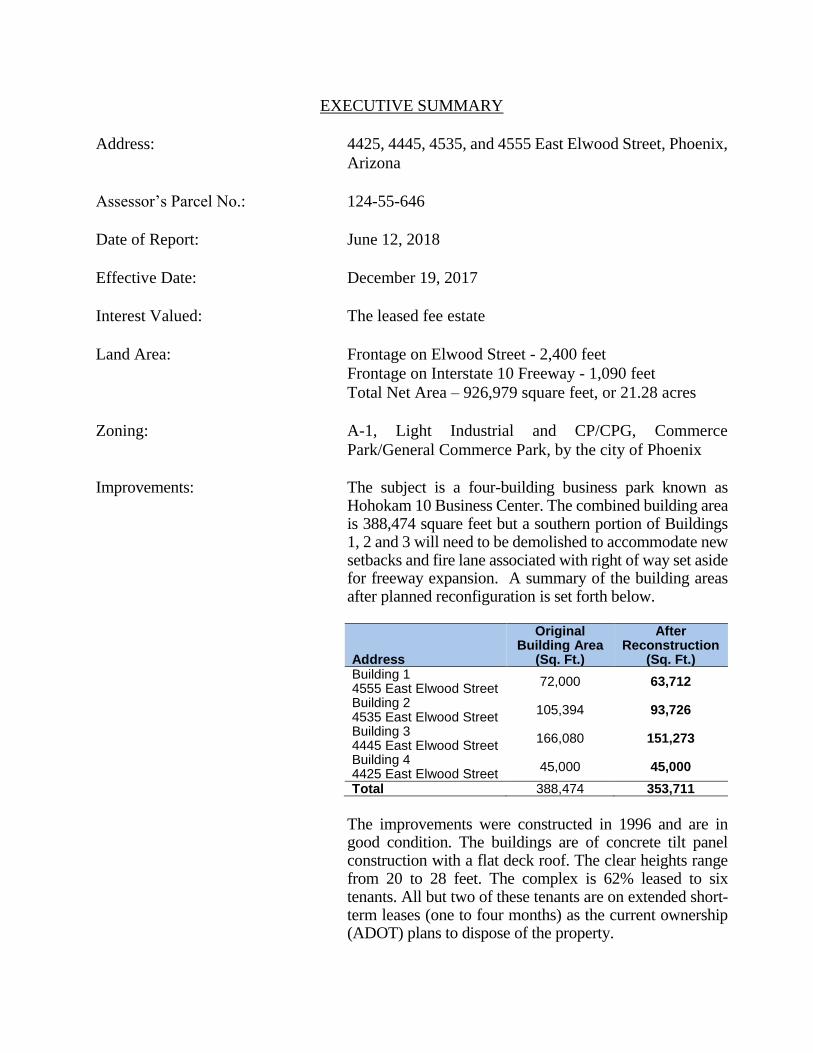
Improvements: The subject is a four-building business park known as
Hohokam 10 Business Center. The combined building area is 388,474 square feet but a southern portion of Buildings 1, 2 and 3 will need to be demolished to accommodate new setbacks and fire lane associated with right of way set aside for freeway expansion. A summary of the building areas after planned reconfiguration is set forth below.
Address
Original Building Area
(Sq. Ft.)
After Reconstruction
(Sq. Ft.) Building 1 4555 East Elwood Street
72,000 63,712
Building 2 4535 East Elwood Street
105,394 93,726
Building 3 4445 East Elwood Street
166,080 151,273
Building 4 4425 East Elwood Street
45,000 45,000
Total 388,474 353,711
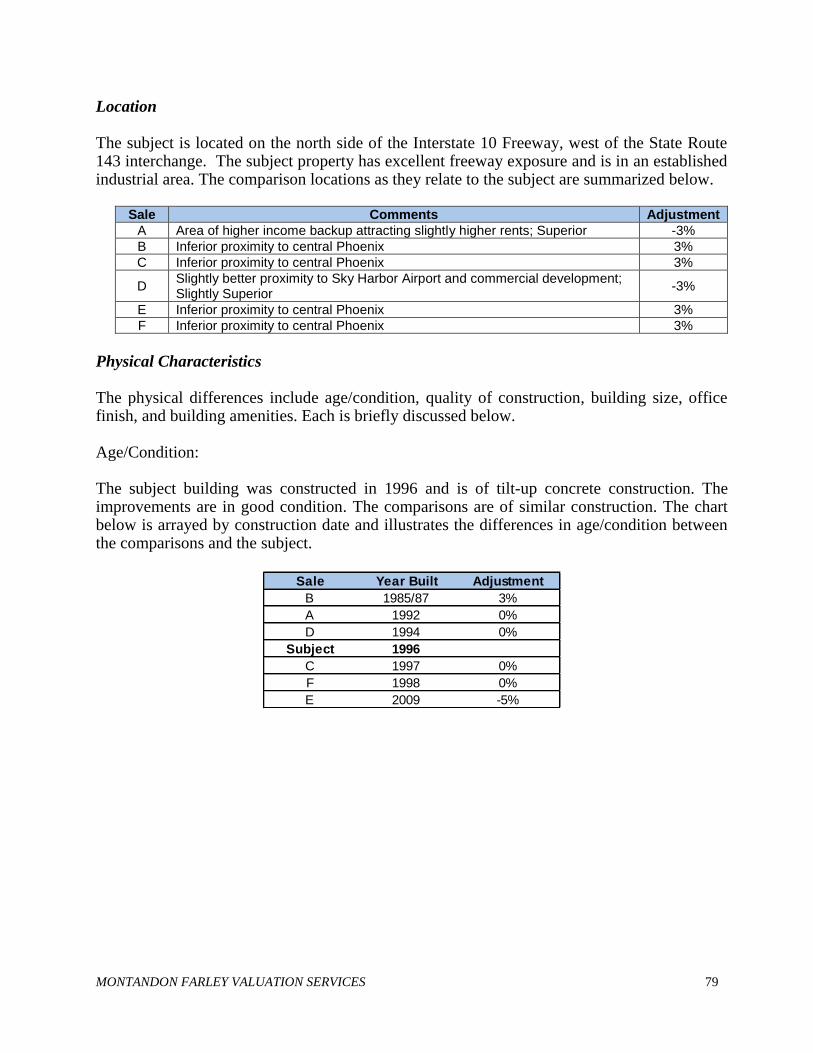
The improvements were constructed in 1996 and are in
good condition. The buildings are of concrete tilt panel construction with a flat deck roof. The clear heights range from 20 to 28 feet. The complex is 62% leased to six tenants. All but two of these tenants are on extended short-term leases (one to four months) as the current ownership (ADOT) plans to dispose of the property.
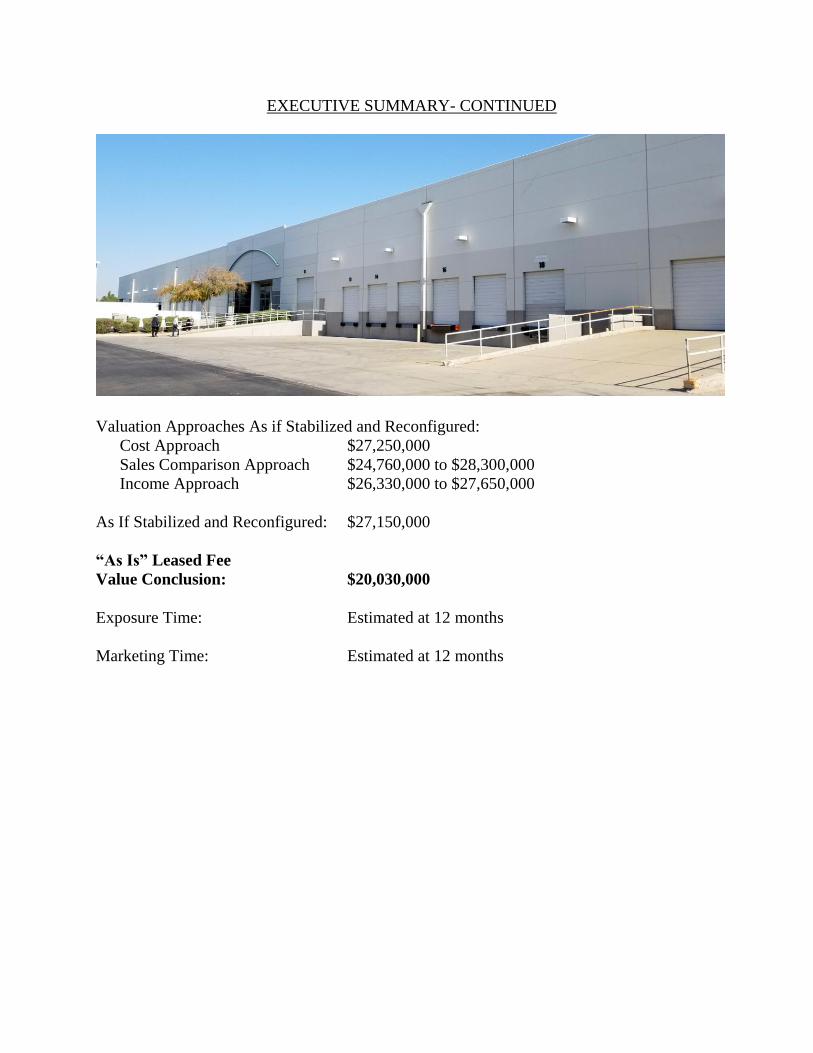
EXECUTIVE SUMMARY- CONTINUED
Valuation Approaches As if Stabilized and Reconfigured:
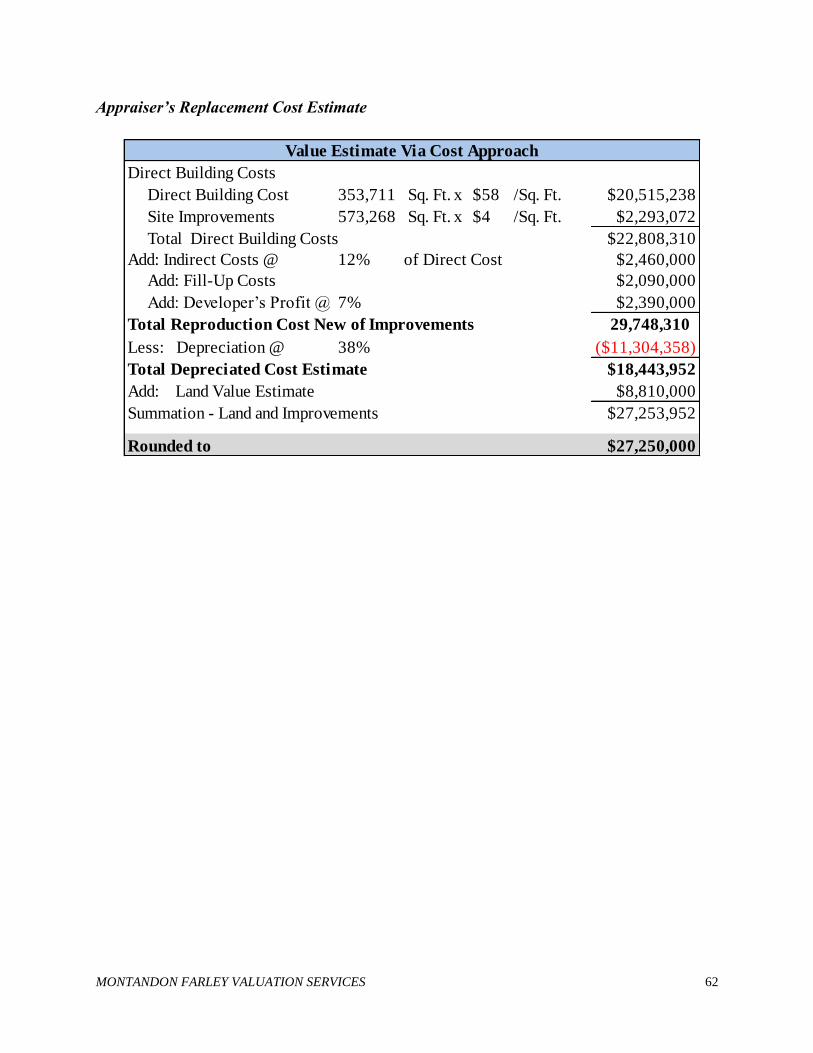
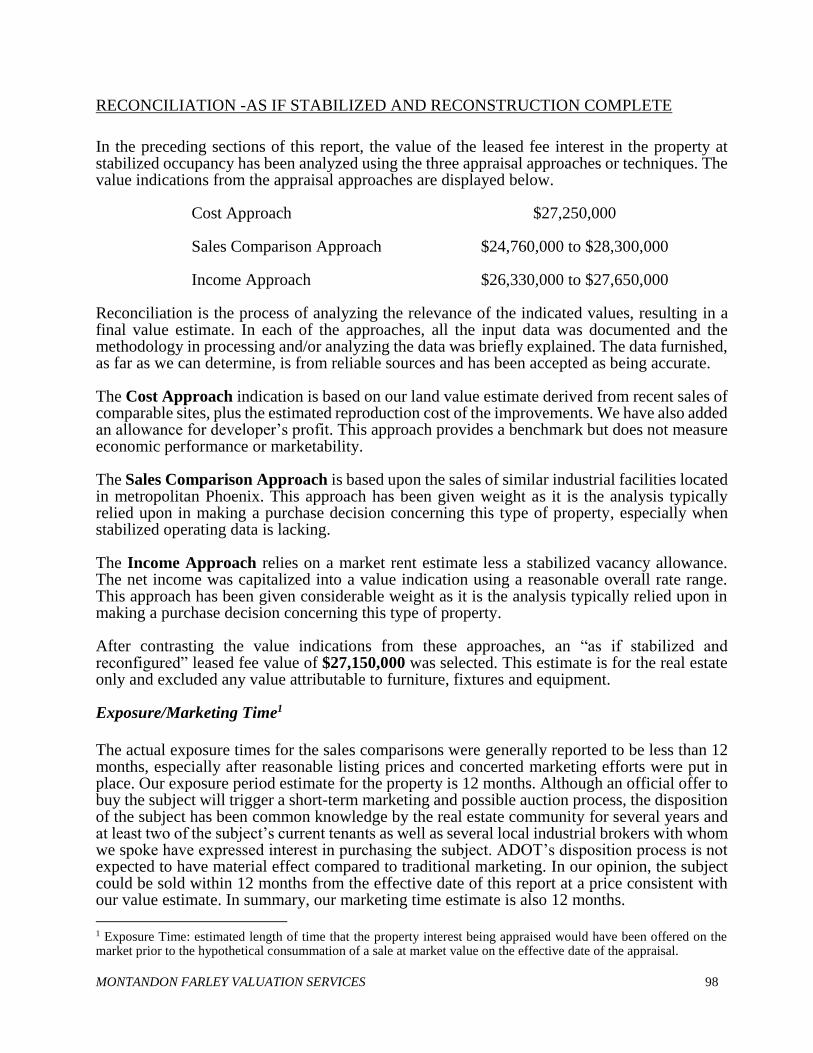
Cost Approach $27,250,000
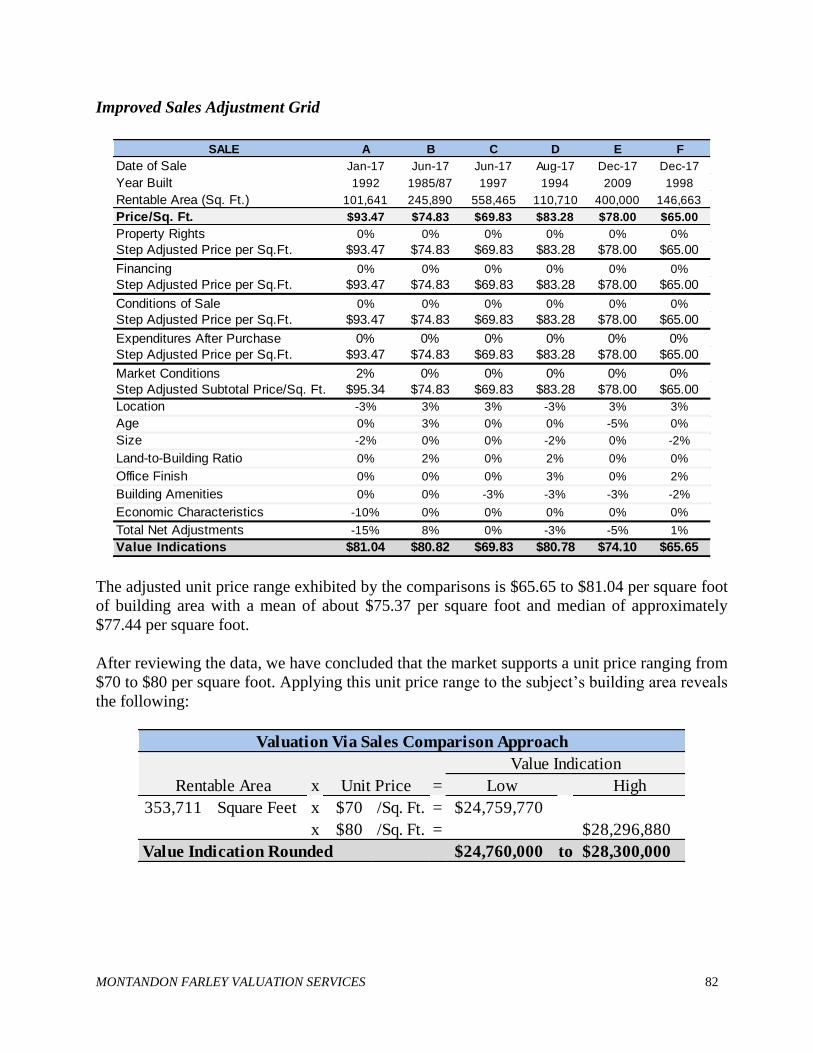
Sales Comparison Approach $24,760,000 to $28,300,000
Income Approach $26,330,000 to $27,650,000
As If Stabilized and Reconfigured: $27,150,000
“As Is” Leased Fee
Value Conclusion: $20,030,000
Exposure Time: Estimated at 12 months
Marketing Time: Estimated at 12 months
TABLE OF CONTENTS
PREFACE
LETTER OF TRANSMITTAL
EXECUTIVE SUMMARY
TABLE OF CONTENTS
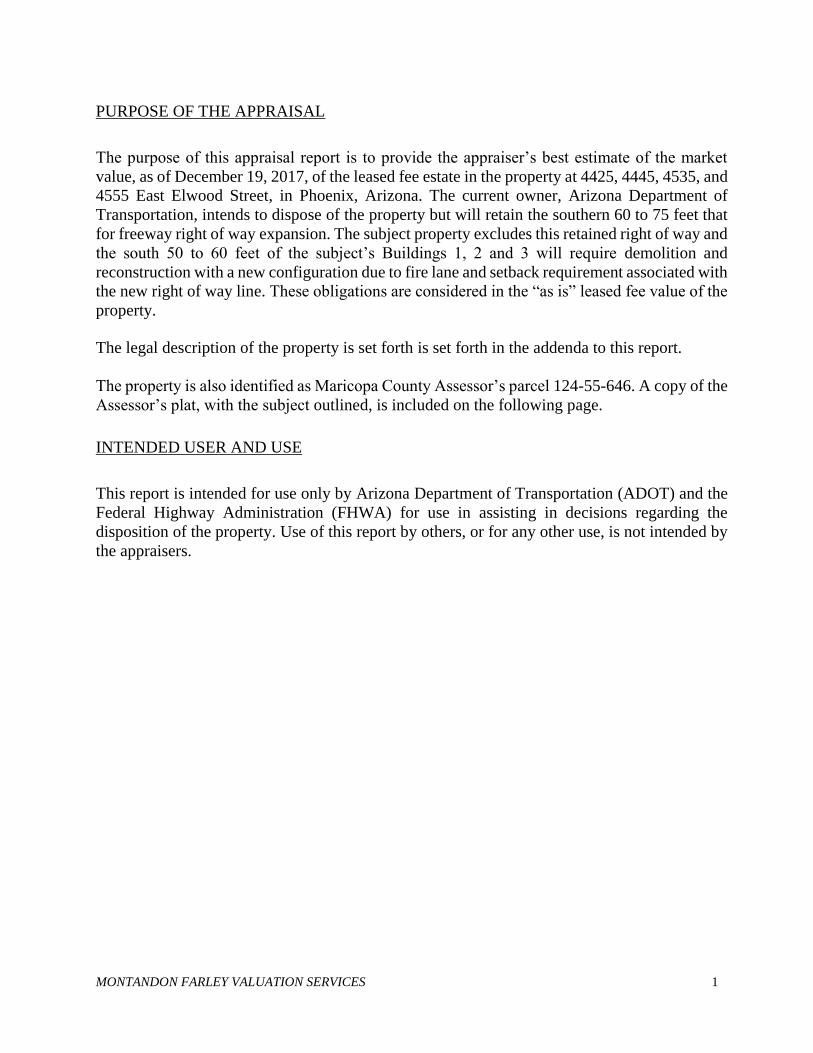
PURPOSE OF THE APPRAISAL ................................................................................................... 1
INTENDED USER AND USE ......................................................................................................... 1
The purpose of this appraisal report is to provide the appraiser’s best estimate of the market
value, as of December 19, 2017, of the leased fee estate in the property at 4425, 4445, 4535, and
4555 East Elwood Street, in Phoenix, Arizona. The current owner, Arizona Department of
Transportation, intends to dispose of the property but will retain the southern 60 to 75 feet that
for freeway right of way expansion. The subject property excludes this retained right of way and
the south 50 to 60 feet of the subject’s Buildings 1, 2 and 3 will require demolition and
reconstruction with a new configuration due to fire lane and setback requirement associated with
the new right of way line. These obligations are considered in the “as is” leased fee value of the
property.
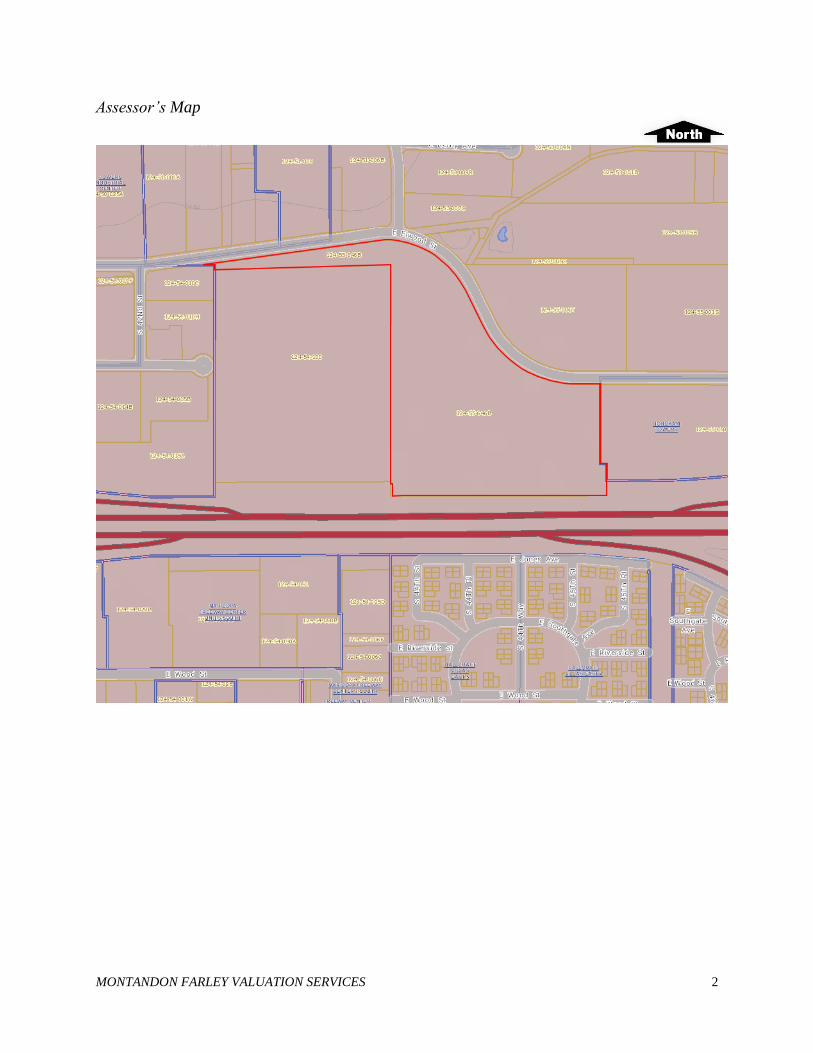
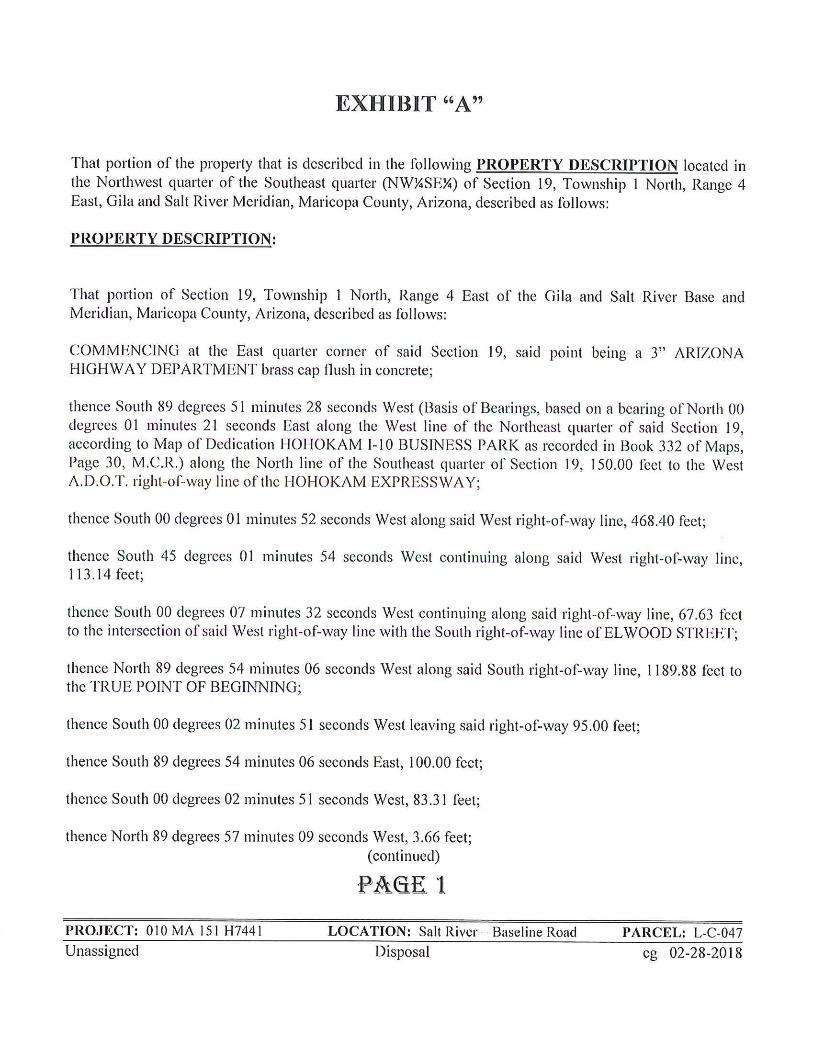
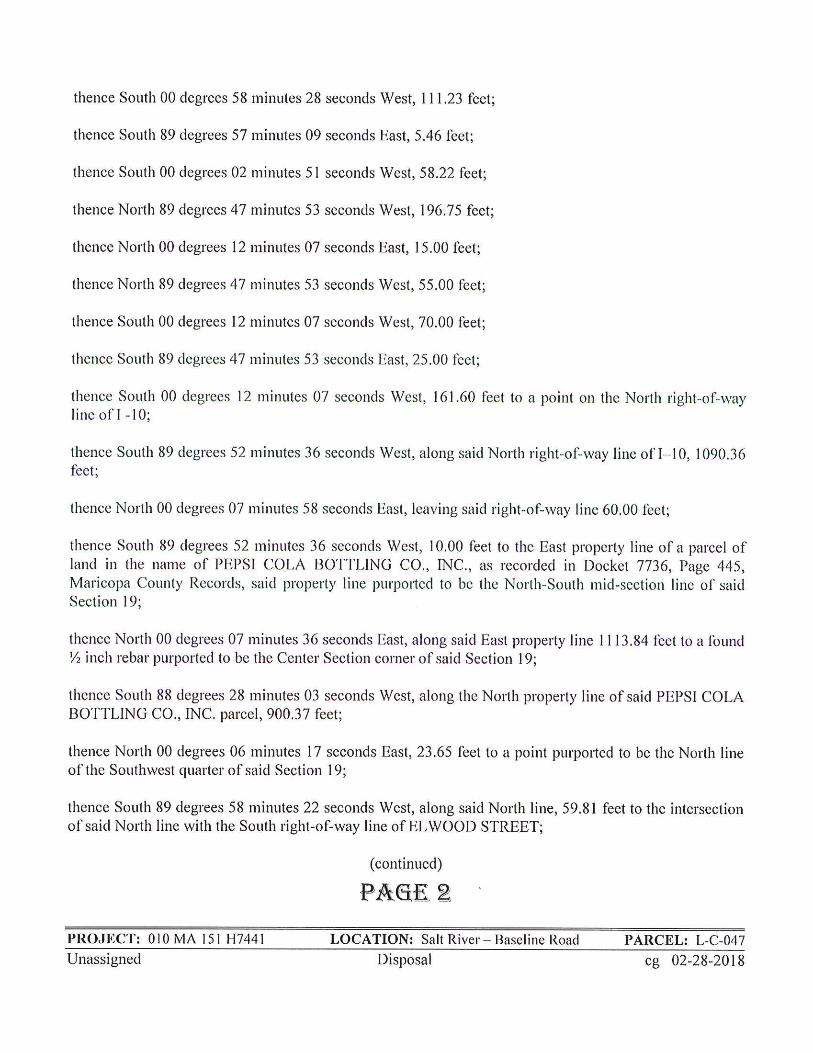
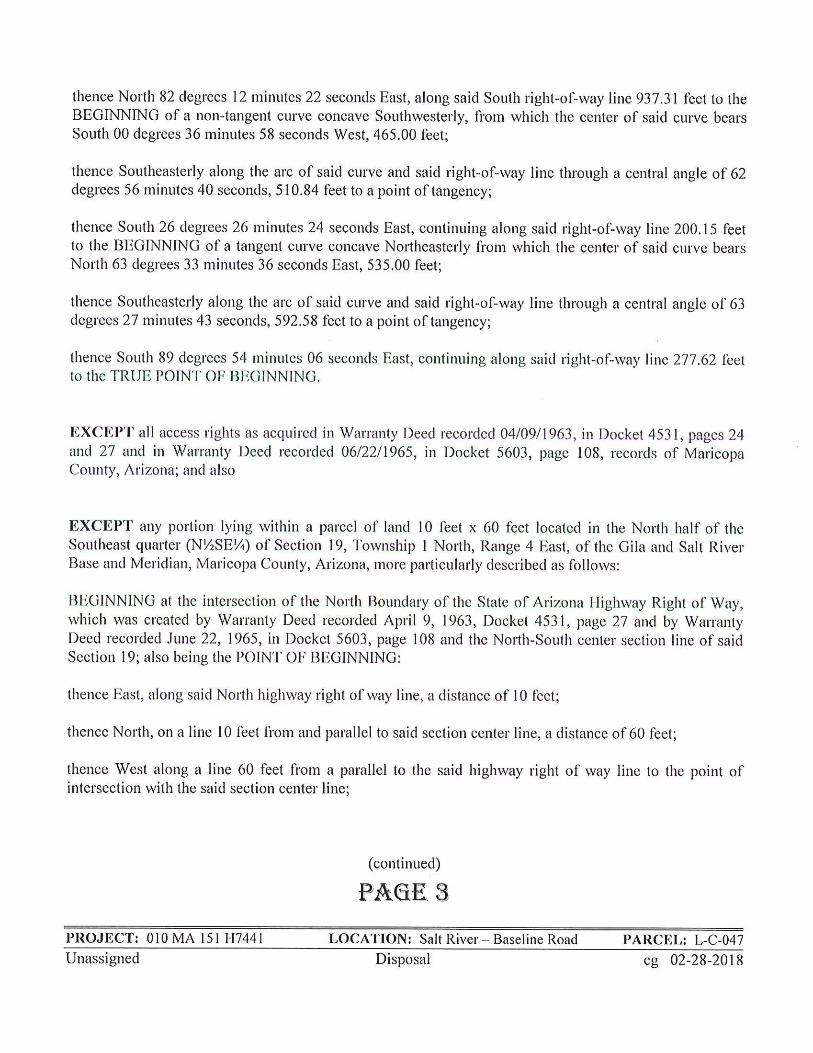
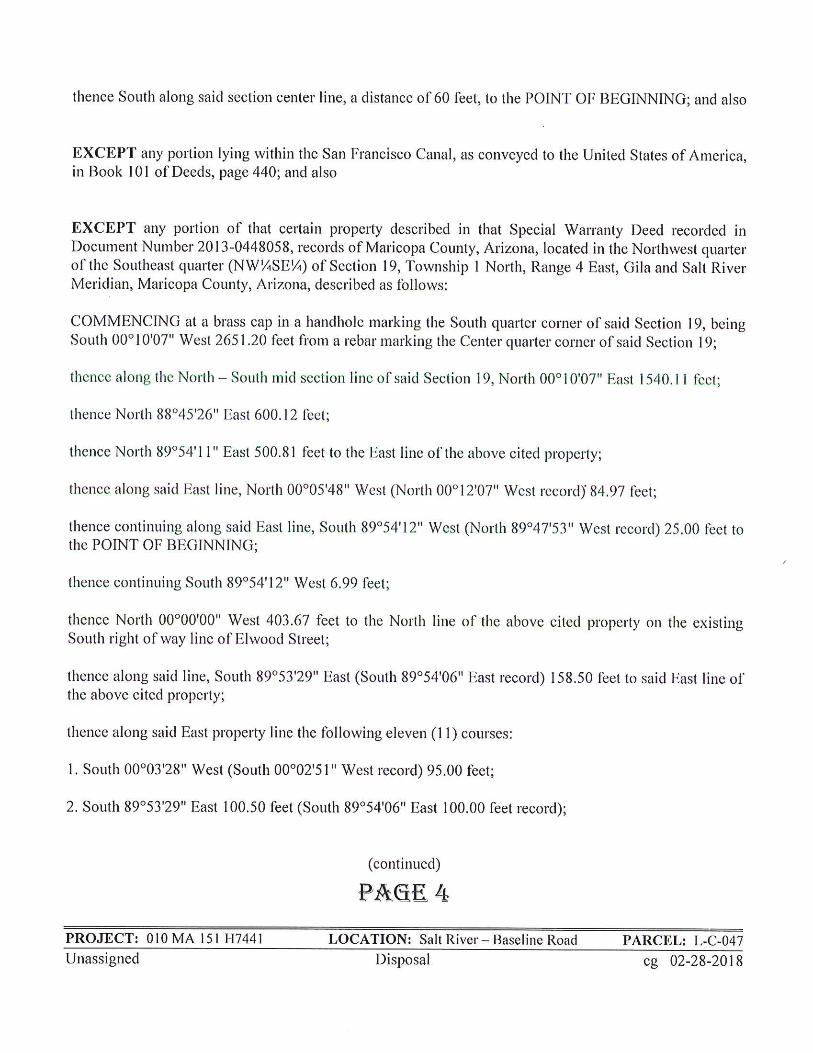
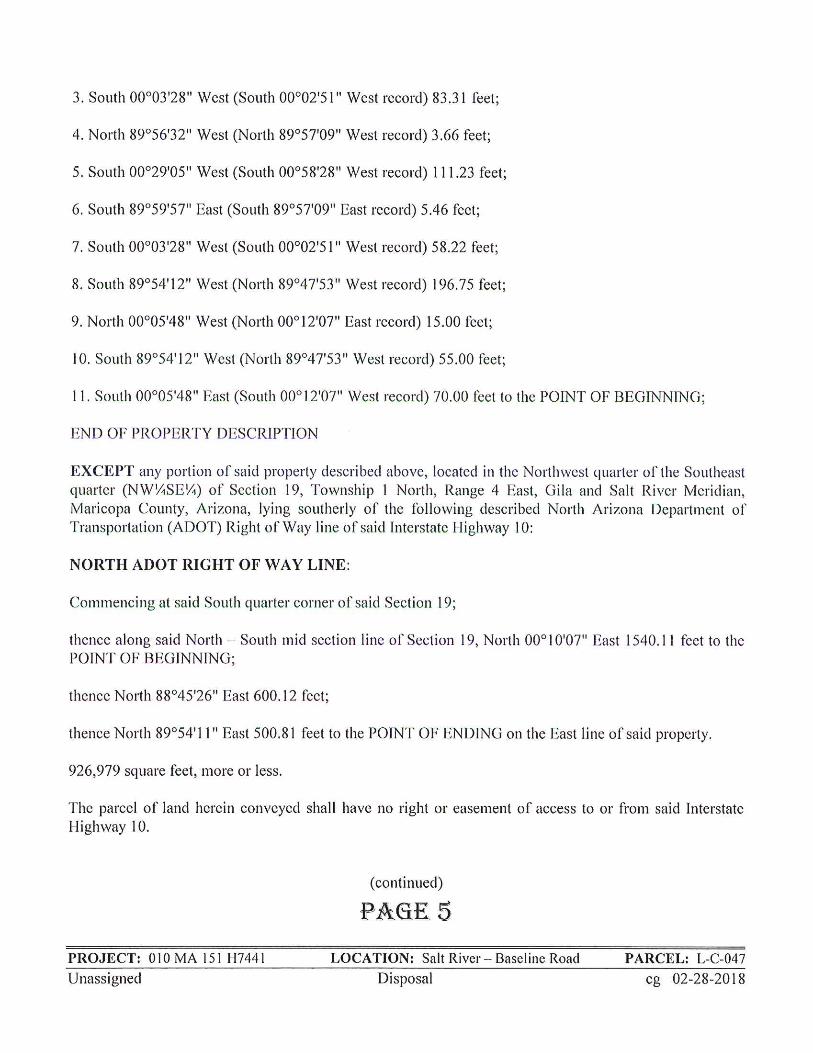
The legal description of the property is set forth is set forth in the addenda to this report.
The property is also identified as Maricopa County Assessor’s parcel 124-55-646. A copy of the
Assessor’s plat, with the subject outlined, is included on the following page.
INTENDED USER AND USE
This report is intended for use only by Arizona Department of Transportation (ADOT) and the
Federal Highway Administration (FHWA) for use in assisting in decisions regarding the
disposition of the property. Use of this report by others, or for any other use, is not intended by
the appraisers.
MONTANDON FARLEY VALUATION SERVICES 2
Assessor’s Map
MONTANDON FARLEY VALUATION SERVICES 3
DEFINITIONS
Market Value, pursuant to Arizona Revised Statute 28-7091, is as follows: “…Market Value’ means the most probable price estimated in terms of cash in
United States dollars or comparable market financial arrangements that the property
would bring if exposed for sale in the open market, with reasonable time allowed in
which to find a purchaser, buying with knowledge of all of the uses and purposes to
which it was adapted and for which it was capable.”.1 Market value “As Is” is defined as: The estimate of the market value of real property in its current physical condition,
use, and zoning as of the appraisal date. (Proposed Interagency Appraisal and Evaluation Guidelines, OCC-4810-33-P 20%)2
Fee simple estate is defined as: Absolute ownership unencumbered by any other interest or estate, subject only to
the limitations imposed by the governmental powers of taxation, eminent domain, police power, and escheat.3
Leased fee estate is defined as: A freehold (ownership interest) where the possessory interest has been granted to
another party by creation of a contractual landlord-tenant relationship (i.e., a lease).4
Hypothetical Condition is defined as:
A condition, directly related to a specific assignment, which is contrary to what is known
by the appraiser to exist on the effective date of the assignment results, but is used for
the purpose of analysis.5
Extraordinary Assumption is defined as:
An assumption, directly related to a specific assignment, as of the effective date of the
assignment results, which, if found to be false, could alter the appraiser’s opinions or
conclusions.6
1 Page 21 – R/W Appraisal Standards and Specifications 2 The Dictionary of Real Estate Appraisal, Fifth Edition, Appraisal Institute, (Chicago, Illinois: 2010) 3 The Dictionary of Real Estate Appraisal, Fifth Edition, Appraisal Institute, (Chicago, Illinois: 2010), p. 78. 4 The Dictionary of Real Estate Appraisal, Fifth Edition, Appraisal Institute, (Chicago, Illinois: 2010) 5 USPAP 2012/13; Definitions, p. U-3 6 USPAP 2012/13; Definitions, p. U-3
MONTANDON FARLEY VALUATION SERVICES 4
SCOPE OF WORK
The scope of the appraisal required investigating sufficient data, relative to the subject, to derive
an opinion of value. The depth of the analysis was intended to be appropriate in relation to the
significance of the appraisal problem. We made a physical visit to the property on December
19, 2017 and have also gathered information on the neighborhood to determine its physical
features and recent development patterns. A search of public records was completed to ascertain
the current and historical assessment and ownership data regarding the property. The data
sources used to gather information for this report include, but are not limited to, the following:
• Planning and Zoning Department of Phoenix
• Maricopa County Assessor’s, Treasurer’s and Recorder’s websites
• CoStar Comps database
• Internal database
We have researched recent sales of land and improved industrial properties in the subject market
area. The most pertinent sales discovered have been analyzed in the Cost and Sales Comparison
Approaches. We have also gathered rental information on similar space in the market area for
use in the Income Approach. The indications from these three approaches have been reconciled
to a final value.
The subject’s current physical and legal condition, its background and history were researched
with all due diligence expected of professional real estate appraisers in the course of performing
appraisal services. The appraisers have attempted to analyze the property as seen through the
eyes of the hypothetical “most probable” buyer. The market area was examined to determine
existing and proposed inventory, demand and the marketability of properties comparable to the
subject.
This Appraisal Report is intended to comply with the reporting requirements set forth under
Standards Rule 2-2(a) of the Uniform Standards of Professional Appraisal Practice for an
Appraisal Report and the Federal Highway Administration (FHWA) Uniform Act, 49 CFR Part
24. The depth of discussion contained in this report is specific to the needs of the client and for
the intended use stated within this report.
MONTANDON FARLEY VALUATION SERVICES 5
METROPOLITAN PHOENIX
The valuation of any form of real estate requires the consideration of the underlying economics
and the demographic profile of the surrounding community. Potential demand for real estate is
a product of the growth and stability of its environs. The following summary discussion of the
demographic, economic, governmental and environmental forces acting on the Phoenix area is
deemed an integral part of this analysis.
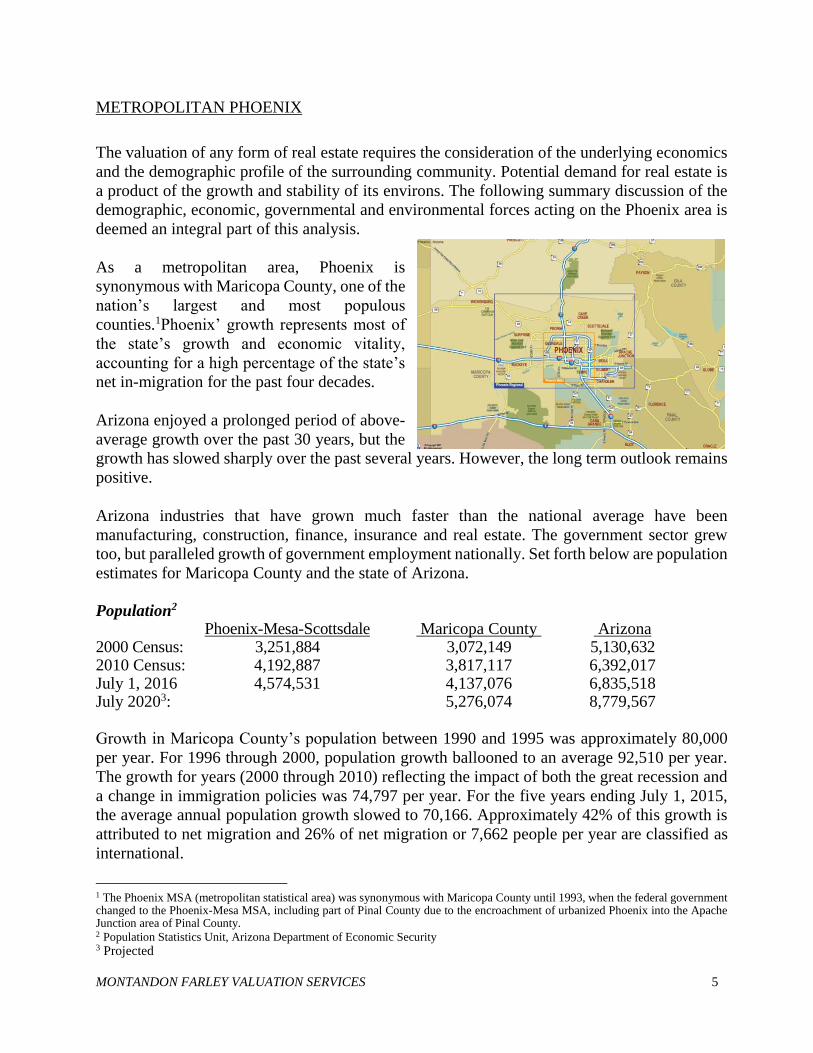
As a metropolitan area, Phoenix is
synonymous with Maricopa County, one of the
nation’s largest and most populous
counties.1Phoenix’ growth represents most of
the state’s growth and economic vitality,
accounting for a high percentage of the state’s
net in-migration for the past four decades.
Arizona enjoyed a prolonged period of above-
average growth over the past 30 years, but the
growth has slowed sharply over the past several years. However, the long term outlook remains
positive.
Arizona industries that have grown much faster than the national average have been
manufacturing, construction, finance, insurance and real estate. The government sector grew
too, but paralleled growth of government employment nationally. Set forth below are population
estimates for Maricopa County and the state of Arizona.
Population2 Phoenix-Mesa-Scottsdale Maricopa County Arizona 2000 Census: 3,251,884 3,072,149 5,130,632 2010 Census: 4,192,887 3,817,117 6,392,017 July 1, 2016 4,574,531 4,137,076 6,835,518 July 20203: 5,276,074 8,779,567 Growth in Maricopa County’s population between 1990 and 1995 was approximately 80,000
per year. For 1996 through 2000, population growth ballooned to an average 92,510 per year.
The growth for years (2000 through 2010) reflecting the impact of both the great recession and
a change in immigration policies was 74,797 per year. For the five years ending July 1, 2015,
the average annual population growth slowed to 70,166. Approximately 42% of this growth is
attributed to net migration and 26% of net migration or 7,662 people per year are classified as
international.
1 The Phoenix MSA (metropolitan statistical area) was synonymous with Maricopa County until 1993, when the federal government changed to the Phoenix-Mesa MSA, including part of Pinal County due to the encroachment of urbanized Phoenix into the Apache Junction area of Pinal County. 2 Population Statistics Unit, Arizona Department of Economic Security 3 Projected
MONTANDON FARLEY VALUATION SERVICES 6
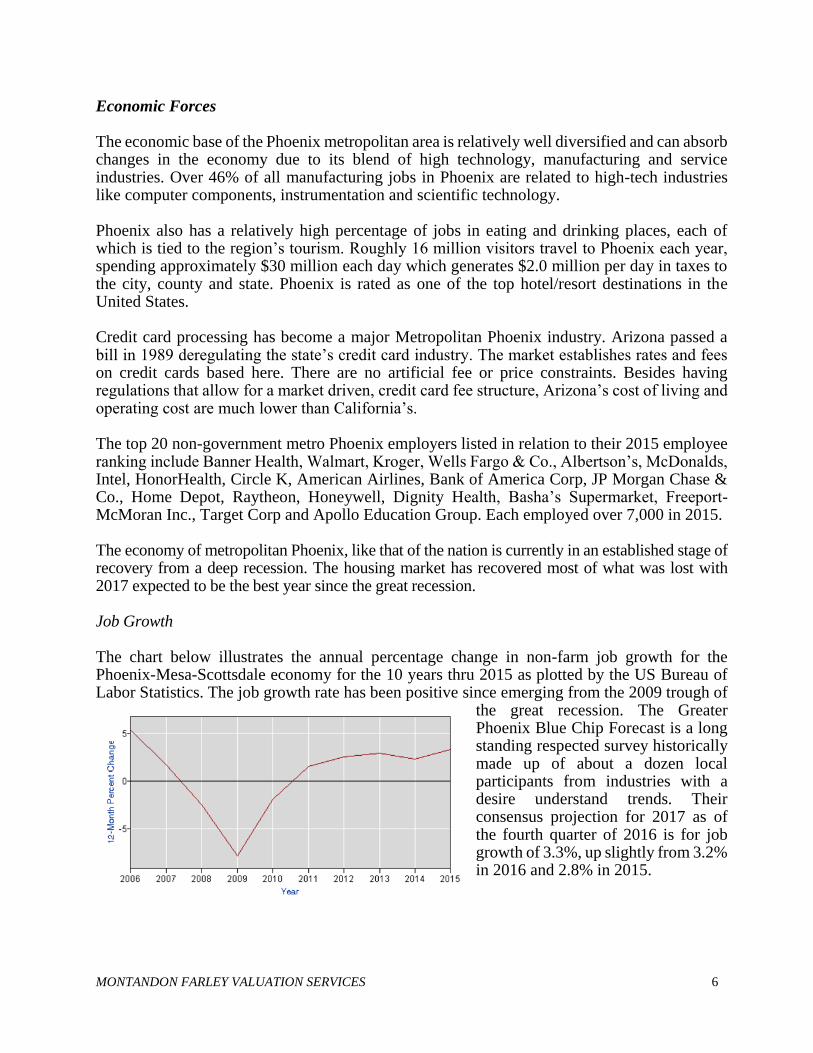
Economic Forces The economic base of the Phoenix metropolitan area is relatively well diversified and can absorb changes in the economy due to its blend of high technology, manufacturing and service industries. Over 46% of all manufacturing jobs in Phoenix are related to high-tech industries like computer components, instrumentation and scientific technology. Phoenix also has a relatively high percentage of jobs in eating and drinking places, each of which is tied to the region’s tourism. Roughly 16 million visitors travel to Phoenix each year, spending approximately $30 million each day which generates $2.0 million per day in taxes to the city, county and state. Phoenix is rated as one of the top hotel/resort destinations in the United States. Credit card processing has become a major Metropolitan Phoenix industry. Arizona passed a bill in 1989 deregulating the state’s credit card industry. The market establishes rates and fees on credit cards based here. There are no artificial fee or price constraints. Besides having regulations that allow for a market driven, credit card fee structure, Arizona’s cost of living and operating cost are much lower than California’s. The top 20 non-government metro Phoenix employers listed in relation to their 2015 employee ranking include Banner Health, Walmart, Kroger, Wells Fargo & Co., Albertson’s, McDonalds, Intel, HonorHealth, Circle K, American Airlines, Bank of America Corp, JP Morgan Chase & Co., Home Depot, Raytheon, Honeywell, Dignity Health, Basha’s Supermarket, Freeport-McMoran Inc., Target Corp and Apollo Education Group. Each employed over 7,000 in 2015. The economy of metropolitan Phoenix, like that of the nation is currently in an established stage of recovery from a deep recession. The housing market has recovered most of what was lost with 2017 expected to be the best year since the great recession. Job Growth The chart below illustrates the annual percentage change in non-farm job growth for the Phoenix-Mesa-Scottsdale economy for the 10 years thru 2015 as plotted by the US Bureau of Labor Statistics. The job growth rate has been positive since emerging from the 2009 trough of
the great recession. The Greater Phoenix Blue Chip Forecast is a long standing respected survey historically made up of about a dozen local participants from industries with a desire understand trends. Their consensus projection for 2017 as of the fourth quarter of 2016 is for job growth of 3.3%, up slightly from 3.2% in 2016 and 2.8% in 2015.
MONTANDON FARLEY VALUATION SERVICES 7
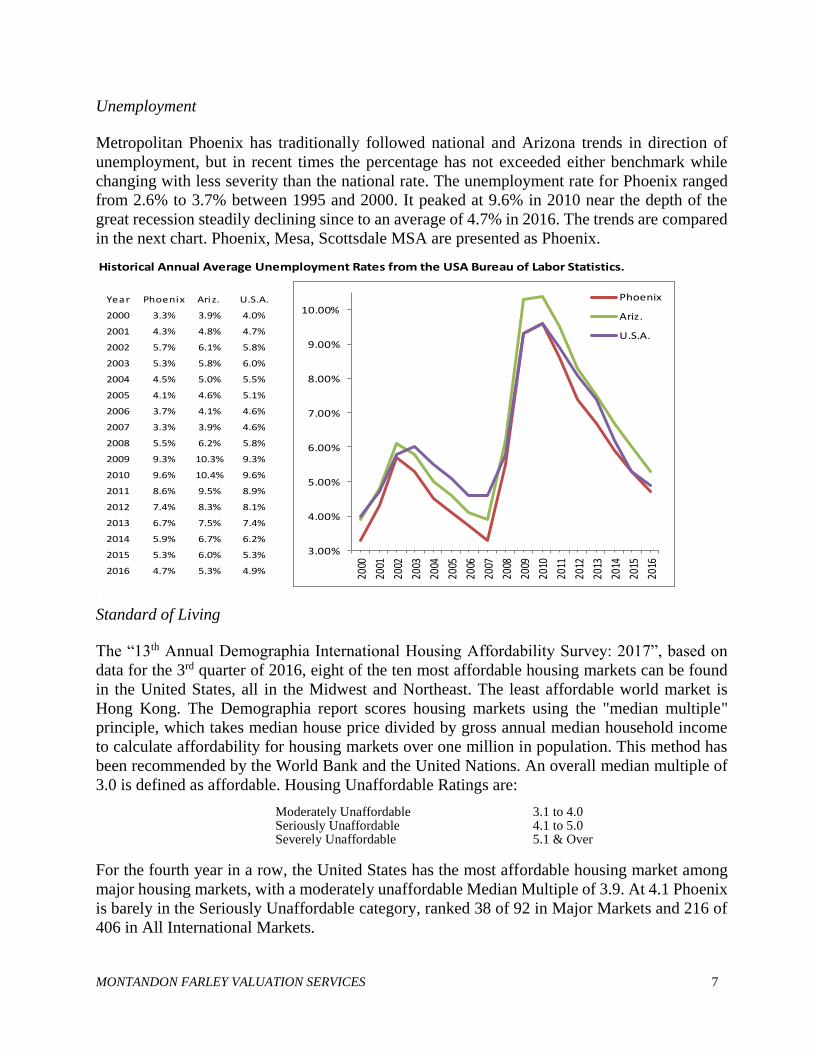
Unemployment Metropolitan Phoenix has traditionally followed national and Arizona trends in direction of
unemployment, but in recent times the percentage has not exceeded either benchmark while
changing with less severity than the national rate. The unemployment rate for Phoenix ranged
from 2.6% to 3.7% between 1995 and 2000. It peaked at 9.6% in 2010 near the depth of the
great recession steadily declining since to an average of 4.7% in 2016. The trends are compared
in the next chart. Phoenix, Mesa, Scottsdale MSA are presented as Phoenix.
Historical Annual Average Unemployment Rates from the USA Bureau of Labor Statistics.
Year Phoenix Ariz. U.S.A.
2000 3.3% 3.9% 4.0%
2001 4.3% 4.8% 4.7%
2002 5.7% 6.1% 5.8%
2003 5.3% 5.8% 6.0%
2004 4.5% 5.0% 5.5%
2005 4.1% 4.6% 5.1%
2006 3.7% 4.1% 4.6%
2007 3.3% 3.9% 4.6%
2008 5.5% 6.2% 5.8%
2009 9.3% 10.3% 9.3%
2010 9.6% 10.4% 9.6%
2011 8.6% 9.5% 8.9%
2012 7.4% 8.3% 8.1%
2013 6.7% 7.5% 7.4%
2014 5.9% 6.7% 6.2%
2015 5.3% 6.0% 5.3%
2016 4.7% 5.3% 4.9%
3.00%
4.00%
5.00%
6.00%
7.00%
8.00%
9.00%
10.00%
2000
2001
2002
2003
2004
2005
2006
2007
2008
2009
2010
2011
2012
2013
2014
2015
2016
Phoenix
Ariz.
U.S.A.
Standard of Living The “13th Annual Demographia International Housing Affordability Survey: 2017”, based on
data for the 3rd quarter of 2016, eight of the ten most affordable housing markets can be found
in the United States, all in the Midwest and Northeast. The least affordable world market is
Hong Kong. The Demographia report scores housing markets using the "median multiple"
principle, which takes median house price divided by gross annual median household income
to calculate affordability for housing markets over one million in population. This method has
been recommended by the World Bank and the United Nations. An overall median multiple of
3.0 is defined as affordable. Housing Unaffordable Ratings are:
Moderately Unaffordable 3.1 to 4.0 Seriously Unaffordable 4.1 to 5.0 Severely Unaffordable 5.1 & Over
For the fourth year in a row, the United States has the most affordable housing market among
major housing markets, with a moderately unaffordable Median Multiple of 3.9. At 4.1 Phoenix
is barely in the Seriously Unaffordable category, ranked 38 of 92 in Major Markets and 216 of
406 in All International Markets.
MONTANDON FARLEY VALUATION SERVICES 8
Governmental Forces The city of Phoenix government is a city council form, with a mayor and a city manager. This
form is the most common among the larger communities in the metropolitan area. Most of the
major issues facing Metropolitan Phoenix city governments relate to problems caused by rapid
growth, such as: air and ground water pollution, freeway construction, annexations and urban
sprawl, preserving residential neighborhoods, ensuring an adequate water supply, flood control
and mass transit alternatives. Transportation
The Regional Transportation Authority was created in 1985. In October of 1985 voters approved
a half-cent sales tax increase to fund right-of-way acquisition and freeway thru 2005. Public-
transit was implemented in 2000 expanding bus and light rail service. In 2004 voters extended
the half cent county sales tax. In November of 2014, voters renewed the tax through 2025 by
approval of Proposition 400. In August 2015 voters approved Proposition 104, increasing the
state sales tax by 0.3 percent. The increase will pay for tripling of light rail miles, expanded bus
service, street re-pavement and transit infrastructure improvements.
Natural Resources National forests and some of the country’s largest county and city parks/preserves provide an
abundance of outdoor activities. Most of Phoenix’ growth, as well as its tourist industry, is
attributable to its climate, scenery and recreational opportunities. The area’s mild winter climate,
proximity to several major southwest cities, and the availability of water and developable land
has enabled the Phoenix area to become one of the fastest growing metropolitan areas in the
country.
The Phoenix area is characterized by a dry climate with a wide range between minimum and
maximum temperatures. June and July are the hottest months with an average maximum
temperature of 106.4F. December is the coldest month with an average minimum temperature
of 42.8F. February and March provide the most ideal temperatures and are the peak tourist
months. The average annual minimum temperature is 63.1F while the average maximum
temperature is 86.9F. Annual precipitation averages 8.4 inches.
Water is a precious commodity in the desert, but Phoenix has sufficient supplies to support its
continued growth. As more agriculture is eliminated, the net demand for water decreases even
with the burgeoning growth in population. One acre of typical residential growth requires about
one-third of the water of one acre of agricultural land.
Conclusion The Phoenix economy is relatively diverse, relying primarily on service, trade, manufacturing
and government sectors as major employers. The near-term outlook for the individual real estate
sectors and the economy as a whole is for slow steady growth.
MONTANDON FARLEY VALUATION SERVICES 9
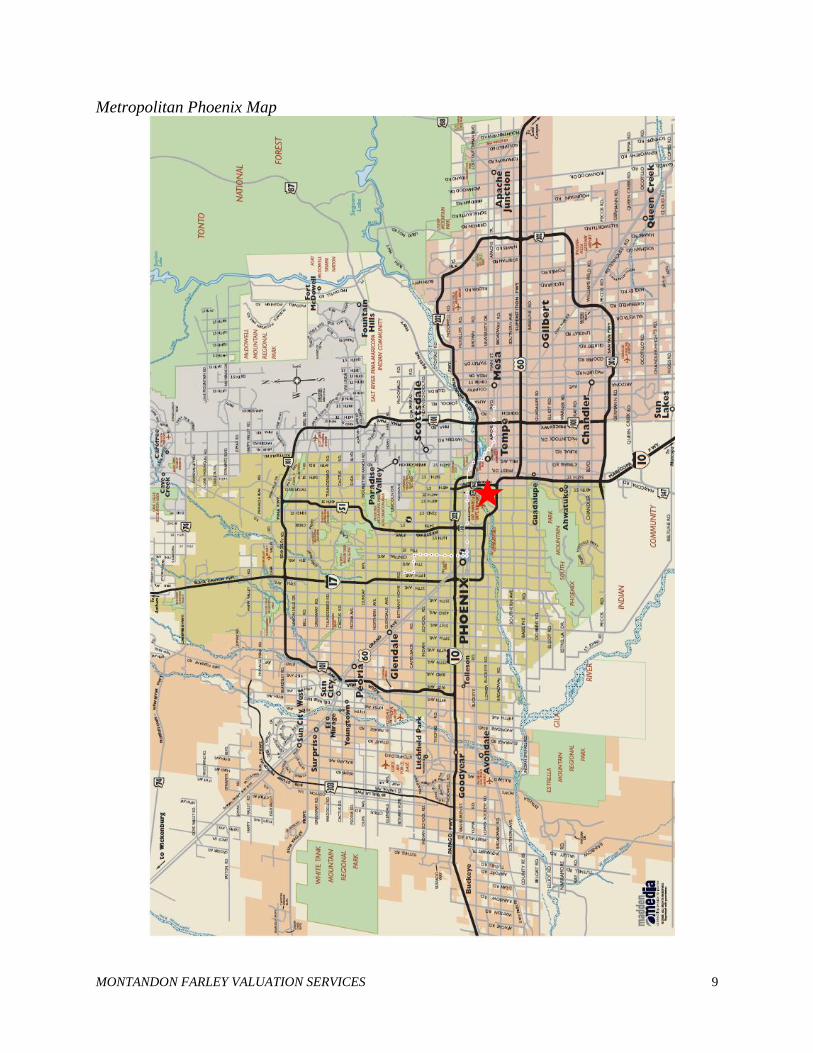
Metropolitan Phoenix Map
MONTANDON FARLEY VALUATION SERVICES 10
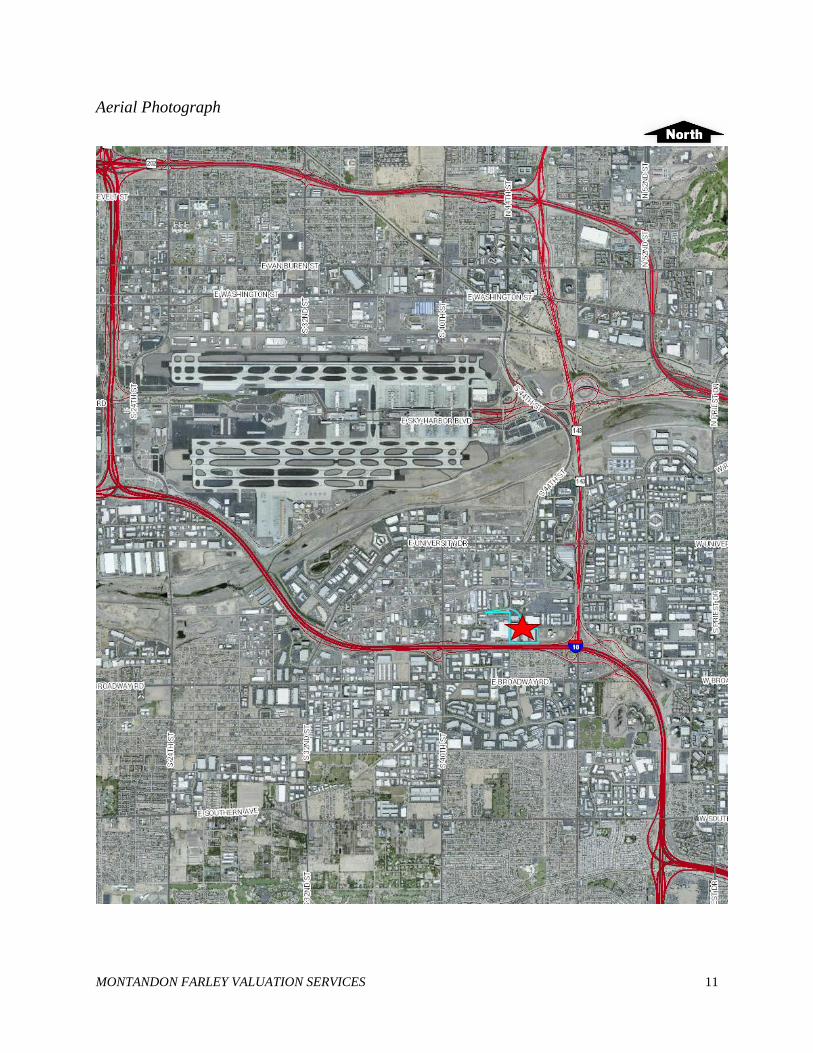
NEIGHBORHOOD
The subject property is located in an established industrial corridor south of Sky Harbor
International Airport and approximately six miles southeast of downtown Phoenix. The market
area boundaries are generally identified as the Salt River channel to the north, Southern Avenue
to the south, 24th Street to the west and Interstate 10 to the east. This market area is split by the
Maricopa Freeway (Interstate 10). The area south of the freeway includes numerous industrial
park subdivisions that have been developed over the past 30 years, including the Cotton Center.
There are also several industrial parks to the north of the freeway, including Southbank, which
encompasses nearly 280 acres along 32nd Street and University Drive. The area north of the
Maricopa Freeway also includes a large, older section both east and west of 40th Street that
lacks the uniformity of the nearby business parks, but is popular with local businesses primarily
in the transportation, equipment and construction industries. A copy of an aerial photograph of
the subject area is included on the following page.
The subject market area is split by the Maricopa Freeway (Interstate 10). This limited access
freeway bends south about one-half mile east of 48th and extends south through Tempe, Phoenix
and Chandler to Tucson, Arizona. It extends west across the southern portion of Phoenix and
then west across Arizona and California to Los Angeles. There are freeway interchanges at 32nd,
40th and 48th Streets, and Broadway Road.
A major influence on the neighborhood is Sky Harbor International Airport, located between
the Union Pacific/Southern Pacific rail lines and the Salt River bed to the east of 24th Street and
west of the Hohokam Expressway (48th Street). Primary access to the airport is provided by the
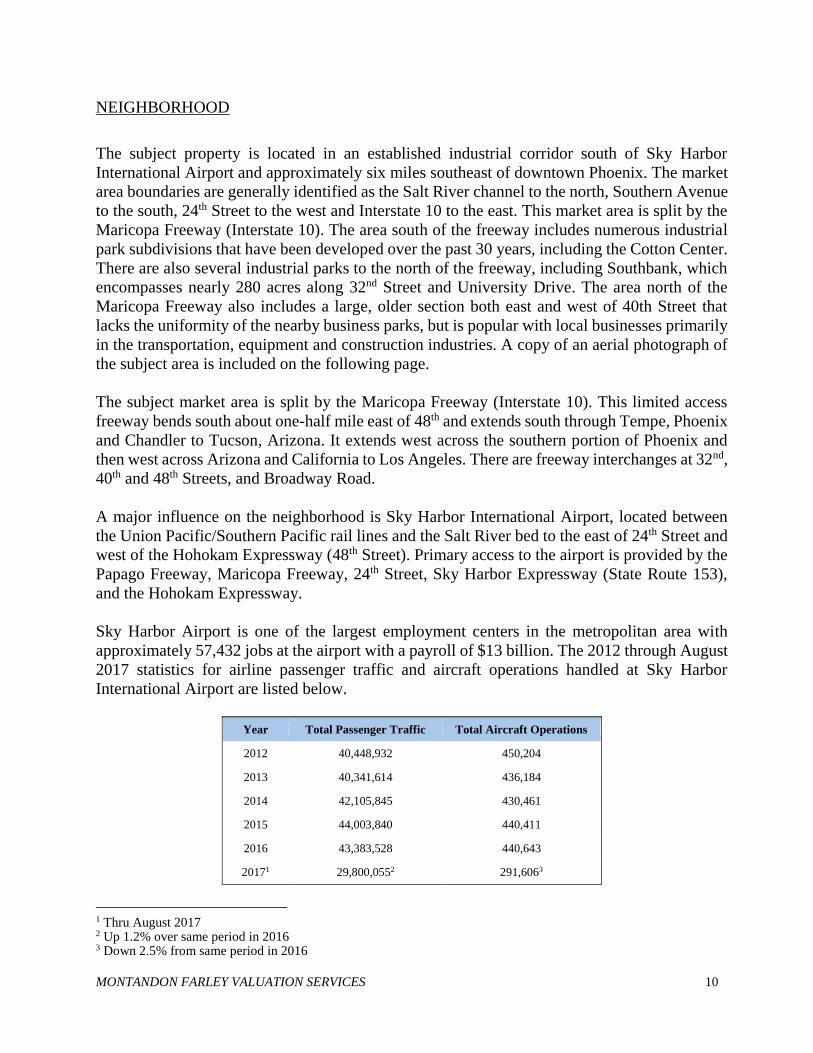
Sky Harbor Airport is one of the largest employment centers in the metropolitan area with
approximately 57,432 jobs at the airport with a payroll of $13 billion. The 2012 through August
2017 statistics for airline passenger traffic and aircraft operations handled at Sky Harbor
International Airport are listed below.
Year Total Passenger Traffic Total Aircraft Operations
2012 40,448,932 450,204
2013 40,341,614 436,184
2014 42,105,845 430,461
2015 44,003,840 440,411
2016 43,383,528 440,643
20171 29,800,0552 291,6063
1 Thru August 2017 2 Up 1.2% over same period in 2016 3 Down 2.5% from same period in 2016
MONTANDON FARLEY VALUATION SERVICES 11
Aerial Photograph
MONTANDON FARLEY VALUATION SERVICES 12
The major development to the north of the Interstate 10 freeway in this market area is Southbank.
This 280-acre business park is situated between Interstate 10 (Maricopa Freeway) on the south
and the Salt River on the north, east and west of University Drive. Southbank was developed in
the mid 1980’s by Denro Limited of Phoenix and was planned for over one million square feet
of industrial, office and retail development. The business park is now approximately 85 percent
developed. The majority of the development is in the subdivision's north section, including a
variety of hotels and flex industrial buildings. The hotels include a 163-room Radisson Hotel, a
114 room Holiday Inn Express, a 101 room Extended Stay America motel, and a 93 room Hilton
Garden Inn. Some of the industrial projects include Hewson Southbank, a five-building,
110,318-square-foot office and light industrial complex; the 160,000-square-foot Arizona
Design Center; the Corporate Center at Southbank, a 224,408-square-foot office building; the
100,000-square-foot former Century Bank office building; and a 122,608-square-foot, multi-
tenant, back-office building. In addition, Colonial Development has constructed a 179,910
square foot project. This is the first speculative project built in Southbank in the past ten years.
The Colonial Center at Southbank includes five buildings ranging in size from 31,383 to 45,557
square feet which were completed in 2007.
The dominant recent development to the south of the freeway is Cotton Center. This developing
business park contains approximately 281 gross acres and is bounded on the east by 48th Street,
on the west by 40th Street, on the north by Broadway Road and on the south by Roeser Road.
This property was formerly an experimental cotton farm that was owned and operated by the
University of Arizona – hence the Cotton Center project name. The property was sold via a
sealed-bid auction in September 1997 for $40,000,000, or about $3.28 per square foot without
infrastructure or offsite improvements. Marketing of Cotton Center as sites for a variety of
business park uses began in mid-1998 and a variety of national and regional developers such as
Opus West, The Koll Company, Douglas Allred Company and Carlson Real Estate Company have
built projects within the Cotton Center. The project is sold out and nearly all the lots have been
developed.
MONTANDON FARLEY VALUATION SERVICES 13
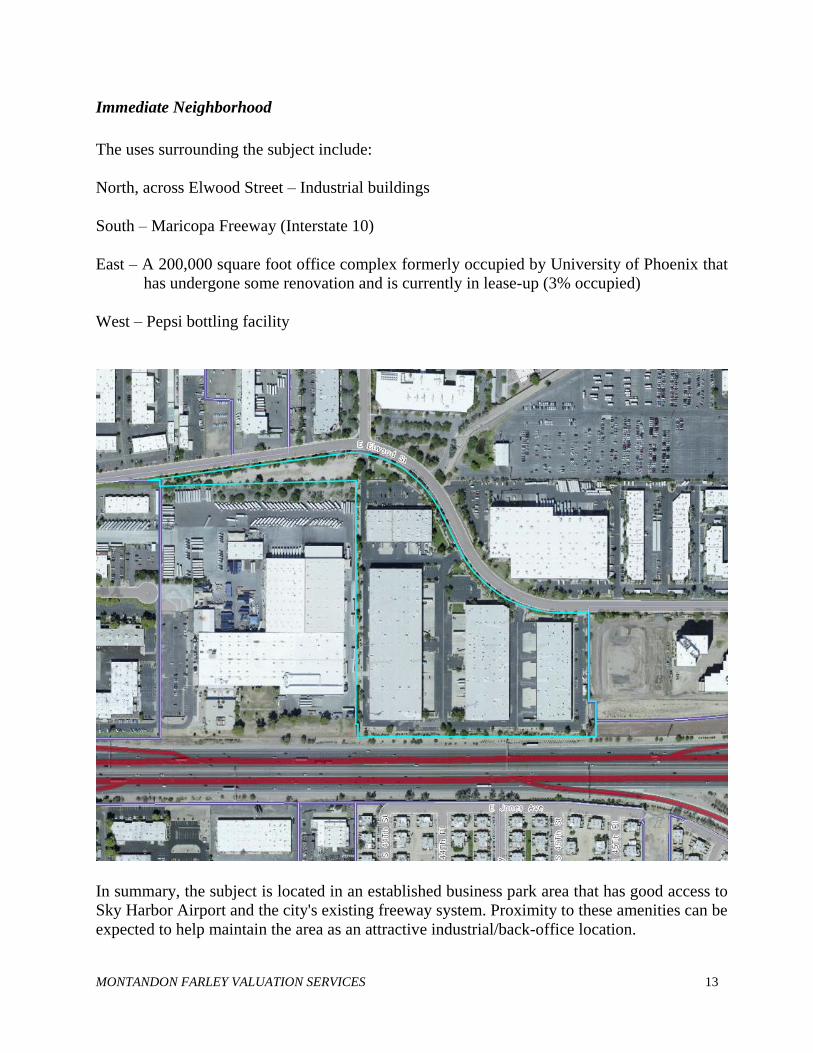
Immediate Neighborhood
The uses surrounding the subject include:
North, across Elwood Street – Industrial buildings
South – Maricopa Freeway (Interstate 10)
East – A 200,000 square foot office complex formerly occupied by University of Phoenix that
has undergone some renovation and is currently in lease-up (3% occupied)
West – Pepsi bottling facility
In summary, the subject is located in an established business park area that has good access to
Sky Harbor Airport and the city's existing freeway system. Proximity to these amenities can be
expected to help maintain the area as an attractive industrial/back-office location.
MONTANDON FARLEY VALUATION SERVICES 14
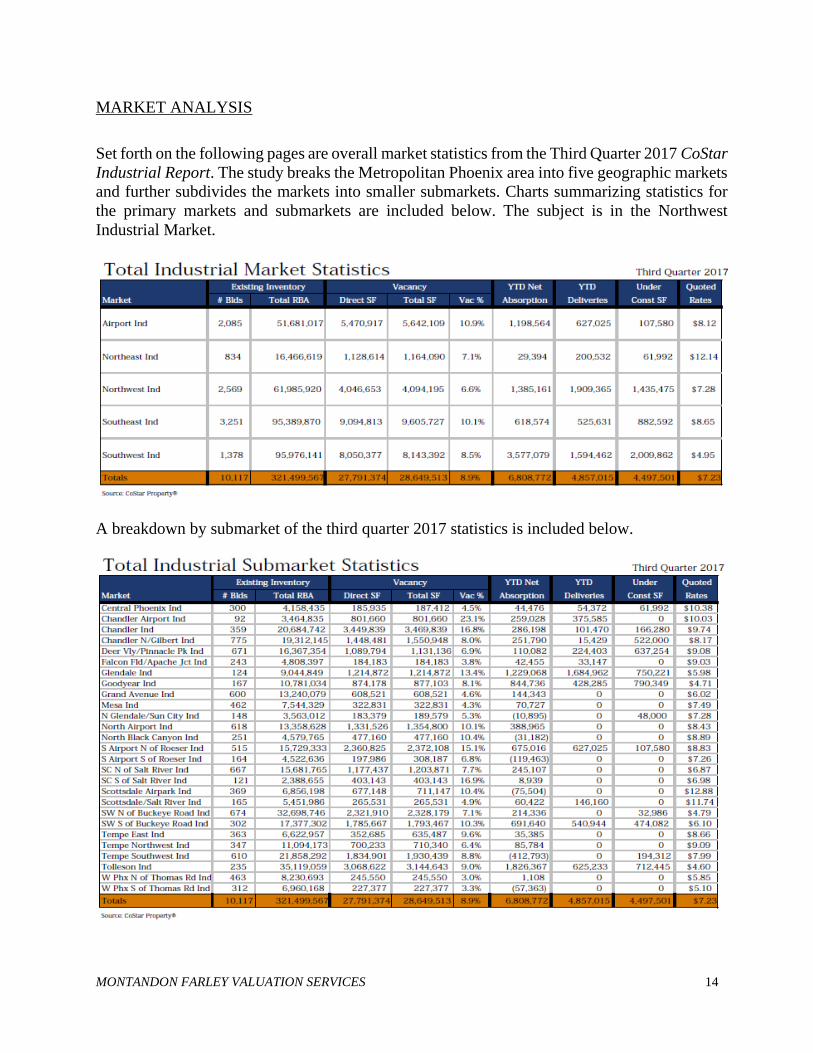
MARKET ANALYSIS
Set forth on the following pages are overall market statistics from the Third Quarter 2017 CoStar
Industrial Report. The study breaks the Metropolitan Phoenix area into five geographic markets
and further subdivides the markets into smaller submarkets. Charts summarizing statistics for
the primary markets and submarkets are included below. The subject is in the Northwest
Industrial Market.
A breakdown by submarket of the third quarter 2017 statistics is included below.
MONTANDON FARLEY VALUATION SERVICES 15
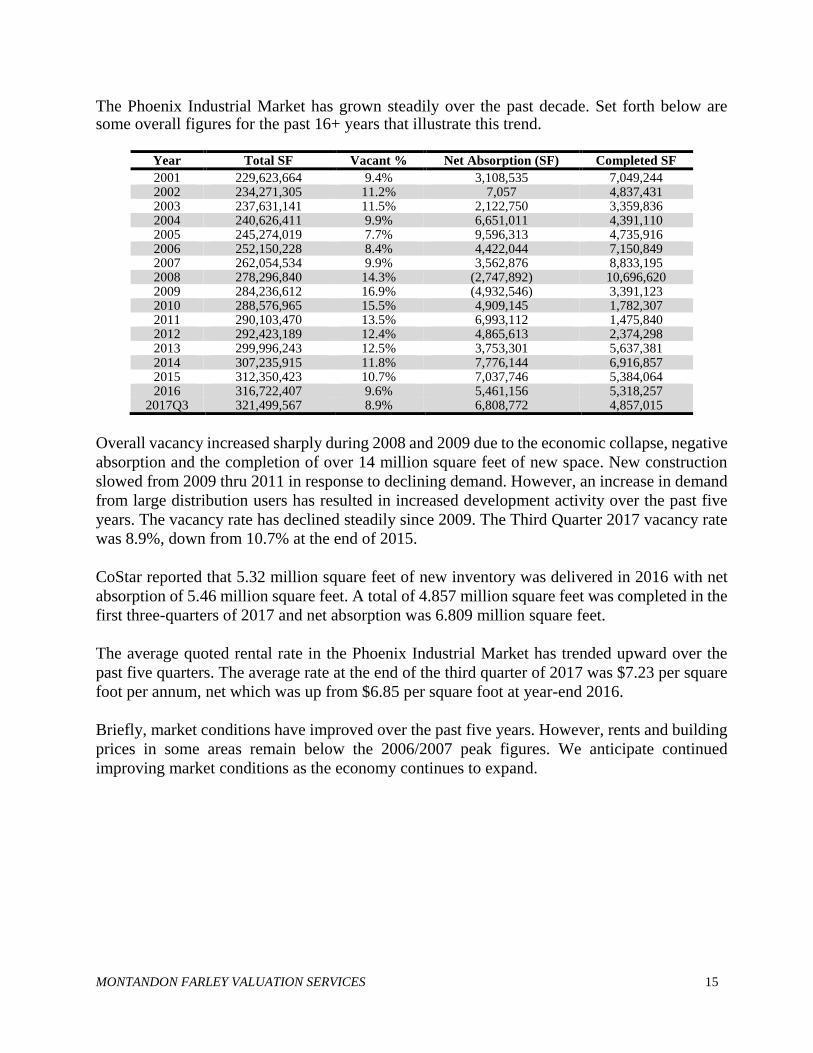
The Phoenix Industrial Market has grown steadily over the past decade. Set forth below are some overall figures for the past 16+ years that illustrate this trend.
Year Total SF Vacant % Net Absorption (SF) Completed SF
Overall vacancy increased sharply during 2008 and 2009 due to the economic collapse, negative
absorption and the completion of over 14 million square feet of new space. New construction
slowed from 2009 thru 2011 in response to declining demand. However, an increase in demand
from large distribution users has resulted in increased development activity over the past five
years. The vacancy rate has declined steadily since 2009. The Third Quarter 2017 vacancy rate
was 8.9%, down from 10.7% at the end of 2015.
CoStar reported that 5.32 million square feet of new inventory was delivered in 2016 with net
absorption of 5.46 million square feet. A total of 4.857 million square feet was completed in the
first three-quarters of 2017 and net absorption was 6.809 million square feet.
The average quoted rental rate in the Phoenix Industrial Market has trended upward over the
past five quarters. The average rate at the end of the third quarter of 2017 was $7.23 per square
foot per annum, net which was up from $6.85 per square foot at year-end 2016.
Briefly, market conditions have improved over the past five years. However, rents and building
prices in some areas remain below the 2006/2007 peak figures. We anticipate continued
improving market conditions as the economy continues to expand.
MONTANDON FARLEY VALUATION SERVICES 16
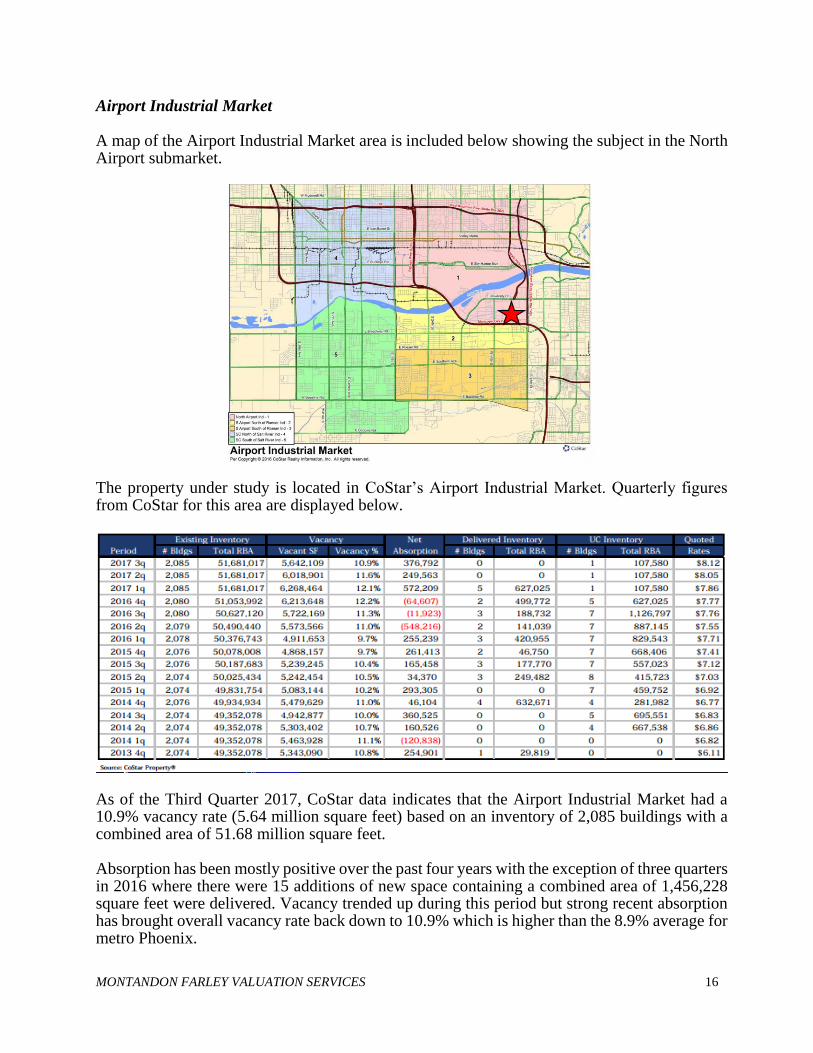
Airport Industrial Market A map of the Airport Industrial Market area is included below showing the subject in the North Airport submarket.
The property under study is located in CoStar’s Airport Industrial Market. Quarterly figures from CoStar for this area are displayed below.
As of the Third Quarter 2017, CoStar data indicates that the Airport Industrial Market had a 10.9% vacancy rate (5.64 million square feet) based on an inventory of 2,085 buildings with a combined area of 51.68 million square feet. Absorption has been mostly positive over the past four years with the exception of three quarters in 2016 where there were 15 additions of new space containing a combined area of 1,456,228 square feet were delivered. Vacancy trended up during this period but strong recent absorption has brought overall vacancy rate back down to 10.9% which is higher than the 8.9% average for metro Phoenix.
MONTANDON FARLEY VALUATION SERVICES 17
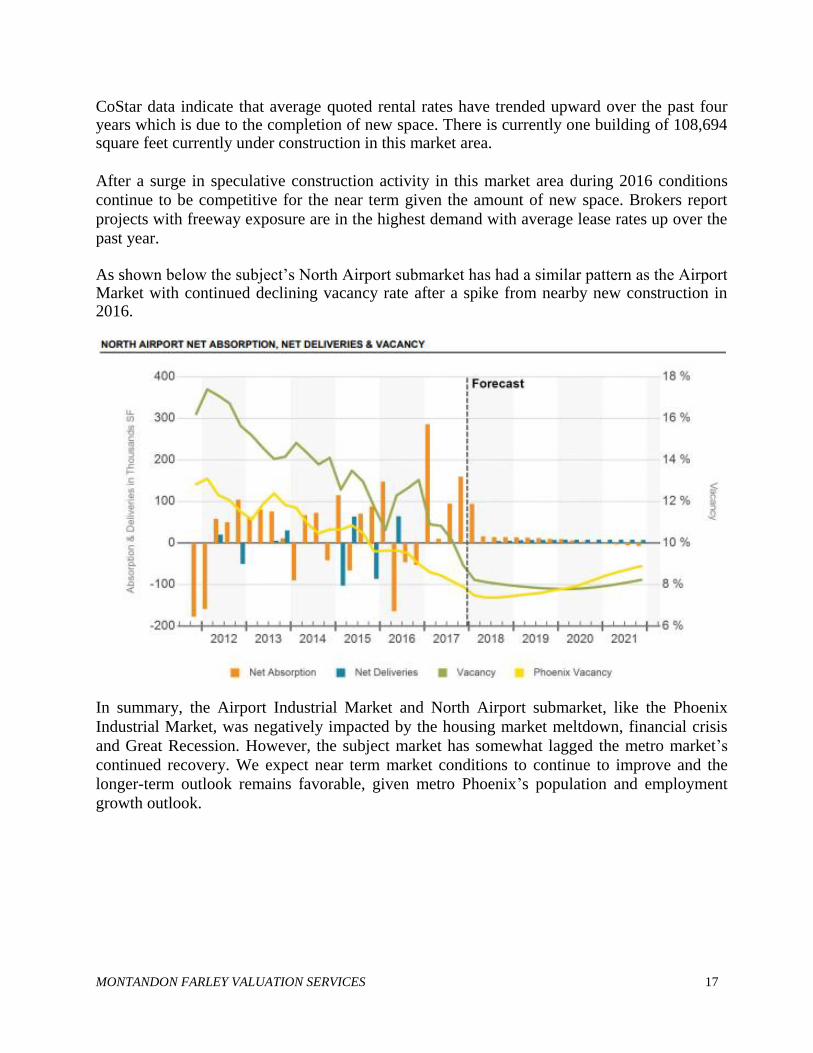
CoStar data indicate that average quoted rental rates have trended upward over the past four years which is due to the completion of new space. There is currently one building of 108,694 square feet currently under construction in this market area.
After a surge in speculative construction activity in this market area during 2016 conditions
continue to be competitive for the near term given the amount of new space. Brokers report
projects with freeway exposure are in the highest demand with average lease rates up over the
past year. As shown below the subject’s North Airport submarket has had a similar pattern as the Airport Market with continued declining vacancy rate after a spike from nearby new construction in 2016.
In summary, the Airport Industrial Market and North Airport submarket, like the Phoenix
Industrial Market, was negatively impacted by the housing market meltdown, financial crisis
and Great Recession. However, the subject market has somewhat lagged the metro market’s
continued recovery. We expect near term market conditions to continue to improve and the
longer-term outlook remains favorable, given metro Phoenix’s population and employment
growth outlook.
MONTANDON FARLEY VALUATION SERVICES 18
PROPERTY DATA
Property History:
The owner of record is
Arizona Department of Transportation (ADOT)
Due to proposed expansion of Interstate 10, ADOT acquired the property via condemnation in
January 2011 along with an office building adjacent east (since demolished) that is not part of
the subject. Market conditions have improved since the acquisition. ADOT intends to dispose
of the property but will retain the southern 60 to 75 feet for freeway expansion. The subject
property excludes this southern 60 to 75 feet that will utilized for freeway right of way. The new
right of way at the subject eliminates previously existing driveway/fire lane. In order to
accommodate fire lane and set back requirements the south 50 to 60 feet of the subject’s
Buildings 1, 2 and 3 will need to be demolished and reconstructed with a new configuration
(less building area) that complies with legal and practical requirements. We are unaware of any
recent attempts to market the property or of any unsolicited offers to purchase. However, ADOT
intends to dispose of the property and reportedly has had interest from prospective buyers.
Accordingly, ADOT expects more than one formal offer triggering a public auction for the
subject in the near future.
Site Data:
Area: The site has 2,400 feet of frontage on Elwood Street, 1,090 of frontage on Interstate 10 Freeway and contains 926,979 square feet, or 21.28 acres.
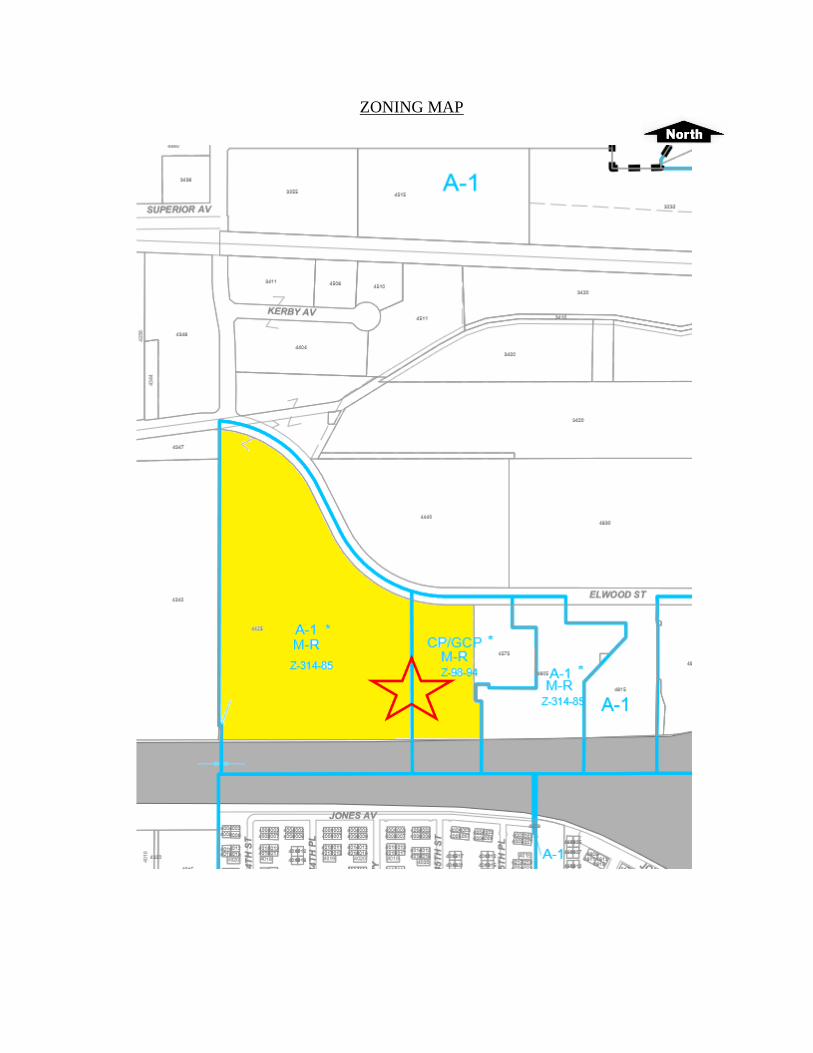
Zoning:
The eastern portion of the property is zoned CP/GCP, Commerce Park/General Commerce Park,
and the western portion is zoned, A-1, Light Industrial, by the City of Phoenix. The CP/GCP,
Commerce Park/General Commerce Park district is designed for commerce, service and
employment activities to serve the needs of the community presenting a desirable appearance
toward public streets and not offensive to nearby commercial or residential uses. The General
Commerce Park Option allows a broad range of manufacturing, warehousing, distribution and
support retail sales/services. Permitted uses include offices of all types, research labs,
medical/dental labs, pharmacy, restaurants, churches, motels, hotels, and public buildings. The
A-1, Light Industrial zoning district is designed to serve the needs of the community for
industrial activity not offensive to nearby commercial and residential uses. Permitted uses in the
A-1 district include manufacturing, storage yards and all non-residential uses permitted in the
RE-24, R-3, R-4, R-5, C-1, C-2 and C-3 districts. The existing industrial project is to the best of
our knowledge a legal, conforming use. A zoning map is included in the addendum.
MONTANDON FARLEY VALUATION SERVICES 19
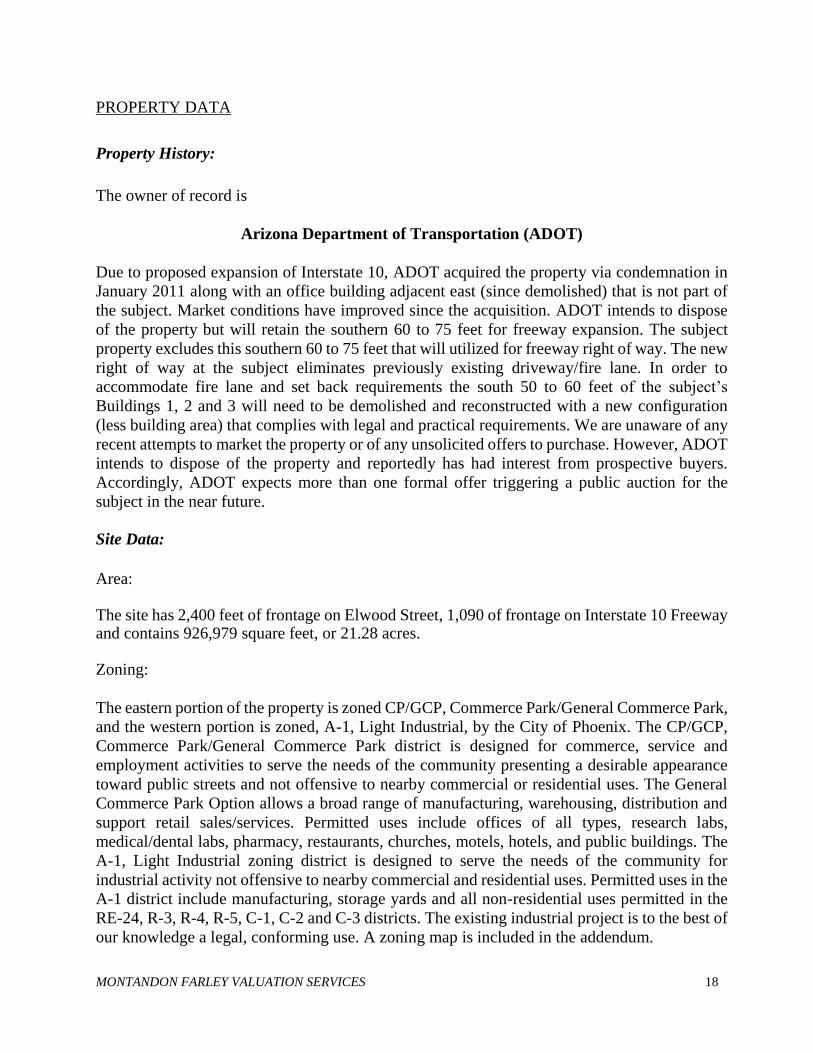
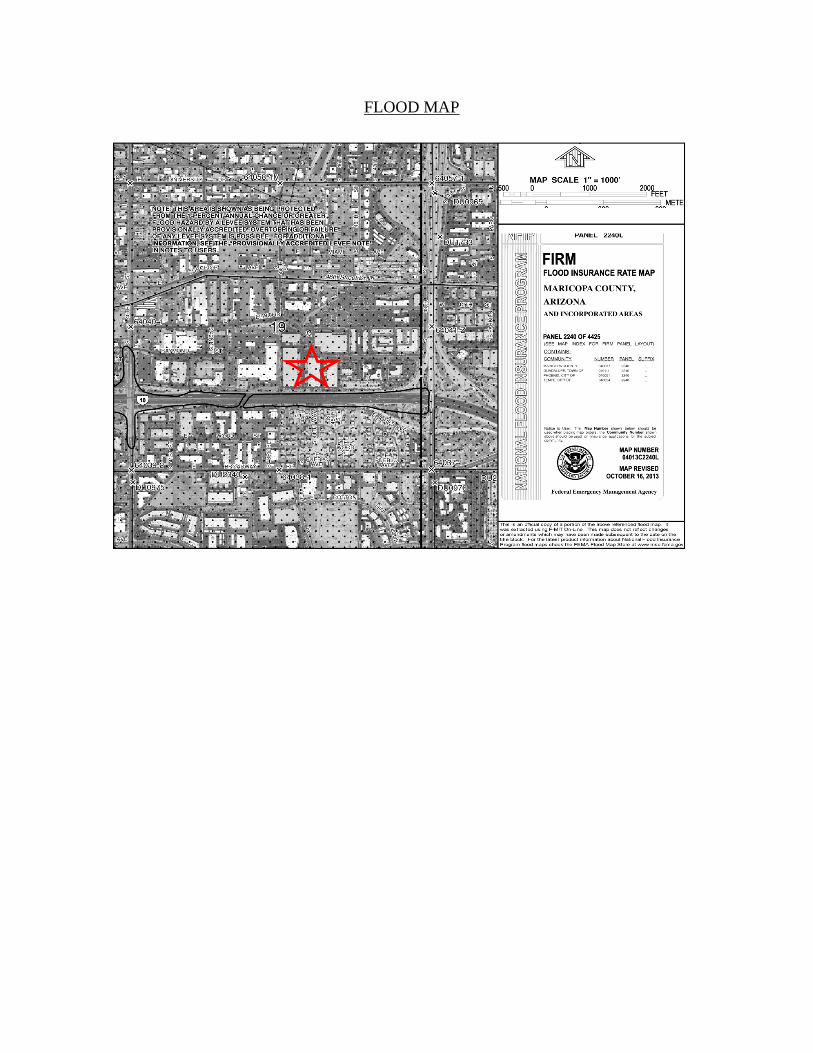
Easements/Hazards: The site has all public utilities available and is not in a special flood hazard area. Upon conveyance of the subject to a new ownership ADOT will retain a 48-foot-wide visibility easement along the entire southernly property line in order to protect additional easements at the southeast and southwest corners of the site reserve for billboard use. We are unaware of any other adverse easements, soil problems or environmental hazards. Included in the addenda is a flood map showing the subject relative to surrounding uses.
MONTANDON FARLEY VALUATION SERVICES 20
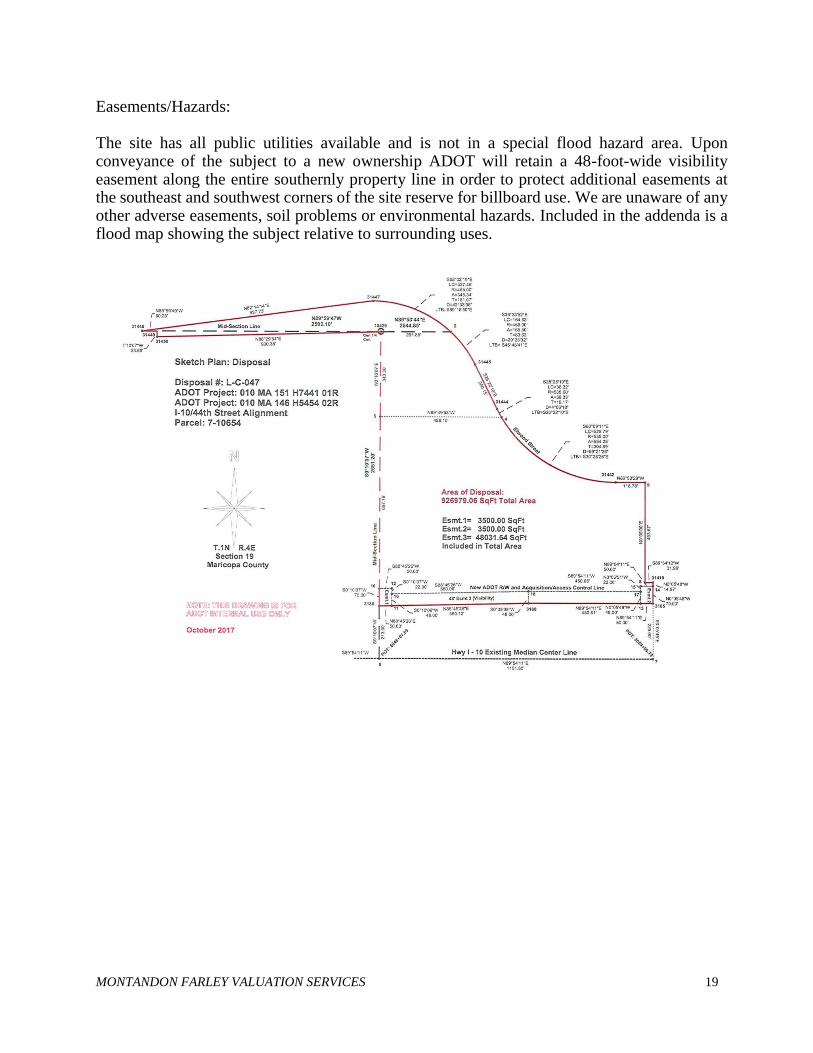
Stipulations Upon Ownership Transfer (Mandatory Cure): Per a Right of Way Disposal Report and discussion with ADOT officials the subject is required
to be sold to the new ownership without title to the southern 60 to 75 ± feet that was formerly
part of the property before freeway expansion. Set back requirements and the need for traffic
circulation around the buildings dictate that the new right of way line effectively severs the
southern 49± to 59± feet of subject Buildings 1, 2 and 3. The new owner will be responsible for
demolition and reconfiguration of these buildings within approximately 12 months of the date
of sale. The buyer will also be responsible for proper water drainage of the site. ADOT agrees
to provide a Temporary Construction Easement (TCE) for the purpose of constructing the
required water drainage and demolition of the southernly portion of the buildings as depicted on
the plans prepared by Irwin G. Pasternack AIA and Associates PC.
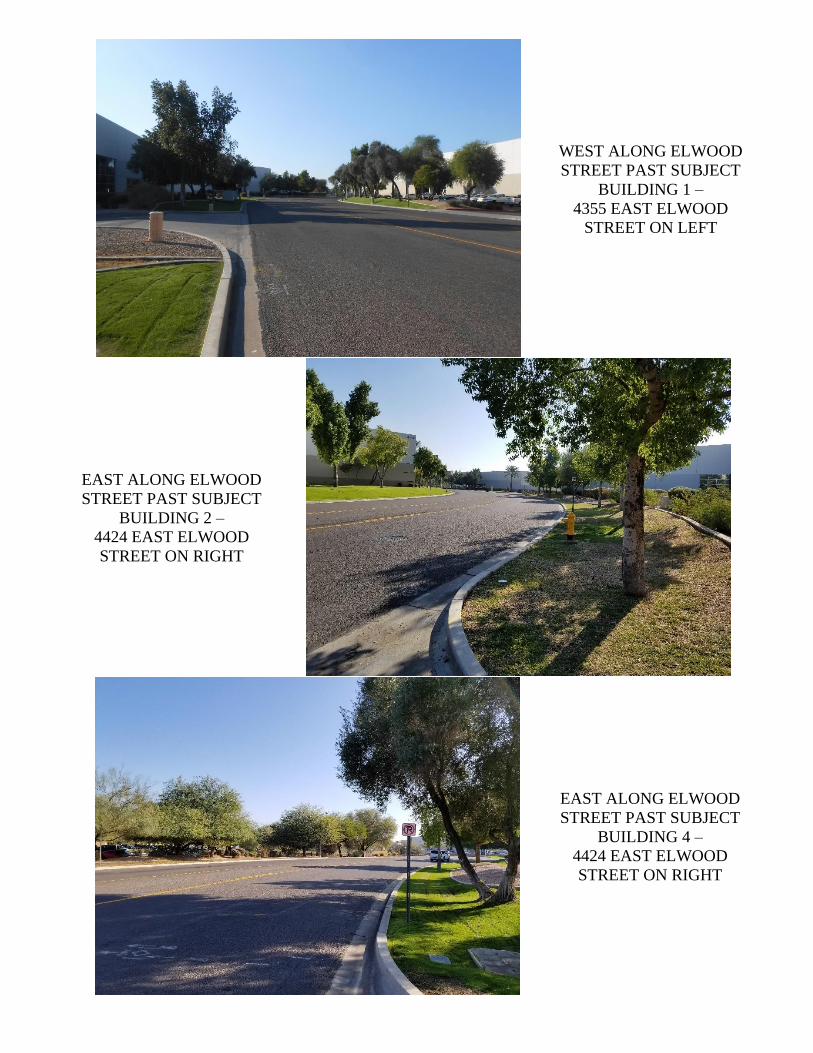
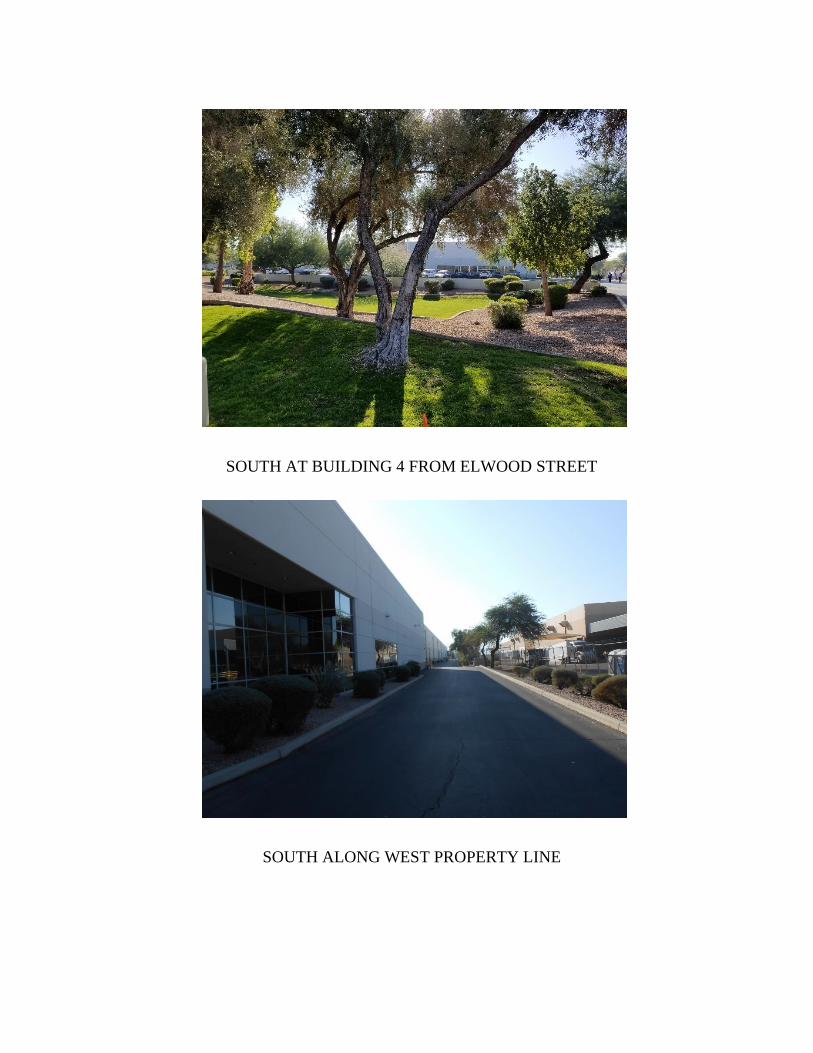
Access: The subject is located at the southeast corner of Elwood and 44th Street. Elwood Street is an asphalt-paved local street that runs between 40th Street and 48th Place. Forty-Fourth Street is a local street that runs north/south between Elwood Street and University Drive. Both streets are asphalt paved for two wide lanes of traffic and have vertical curbs, gutters, and streetlights. There are four access driveways to the subject property along the Elwood Street frontage.
MONTANDON FARLEY VALUATION SERVICES 21
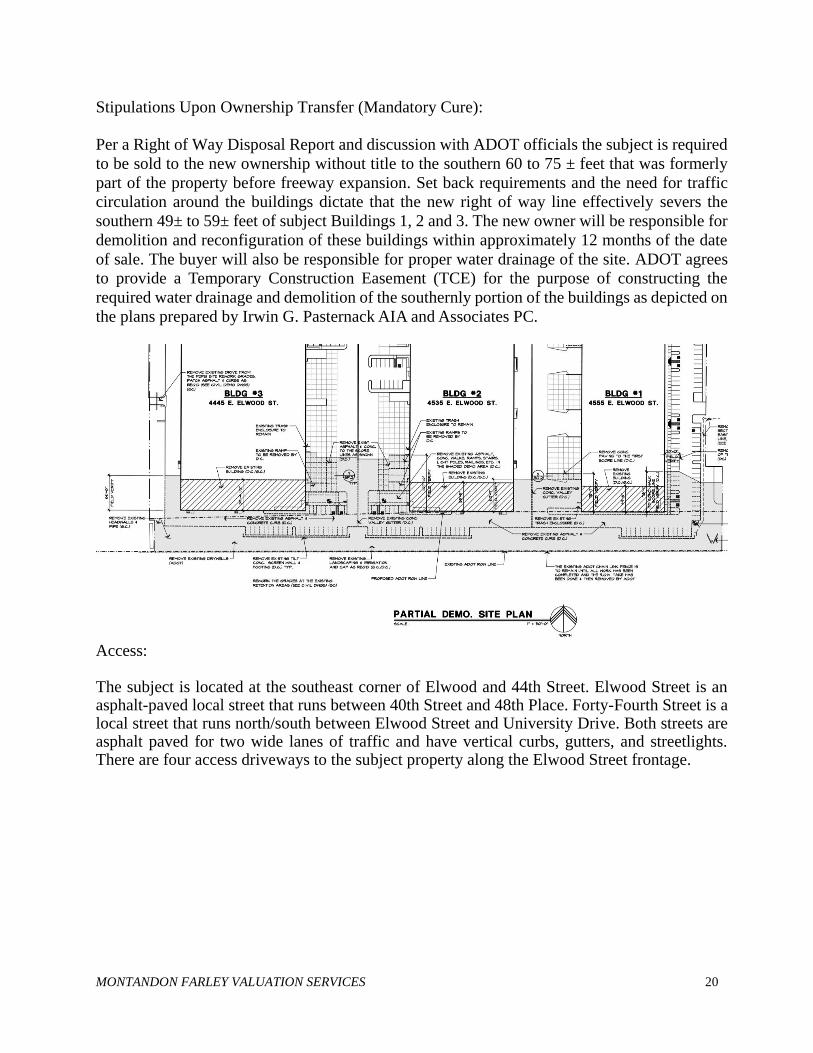
Improvement Description:
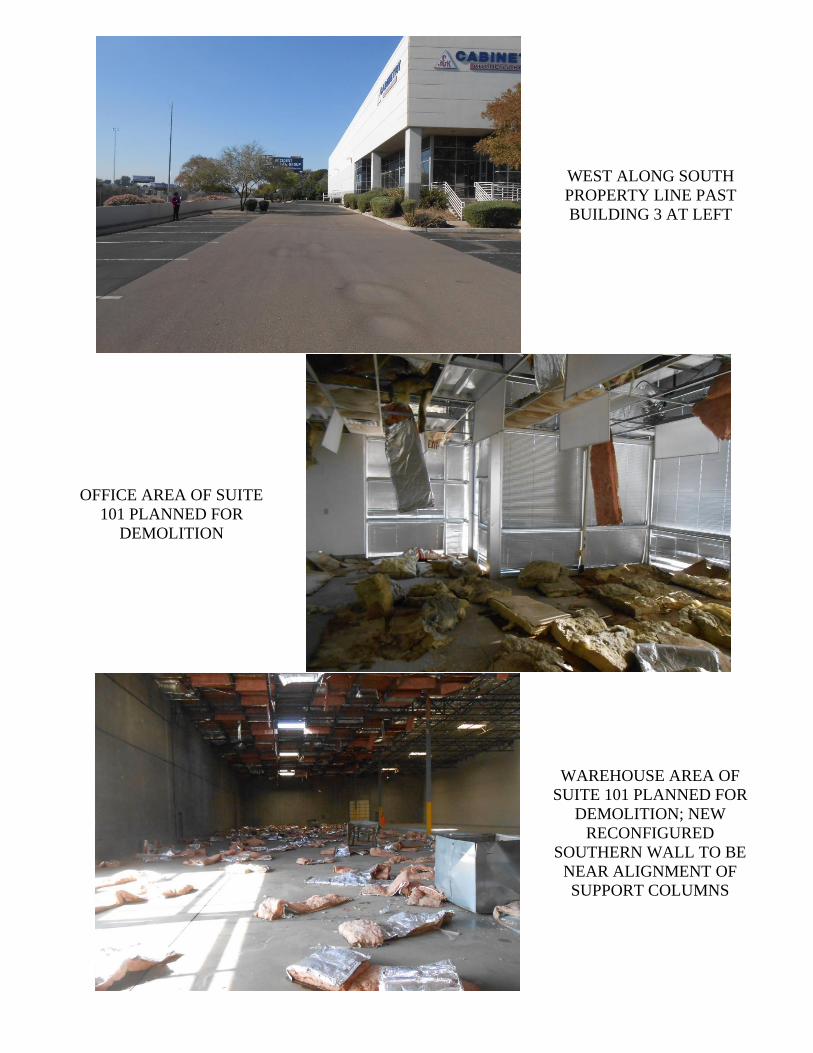
The following description is taken from a personal visit to the property on December 19, 2017, and a review of a partial set of building plans prepared by Irwin G. Pasternak AIA and dated March 1994 and December 1995. We have also viewed a set of plans prepared by Irwin G. Pasternak AIA (Job 213040) and dated July 15, 2015 and last revised October 7, 2016. for the reconstruction of the south end of Buildings 1, 2 and 3. A site plan is included on the following pages. Photographs of the improvements are in the addenda.
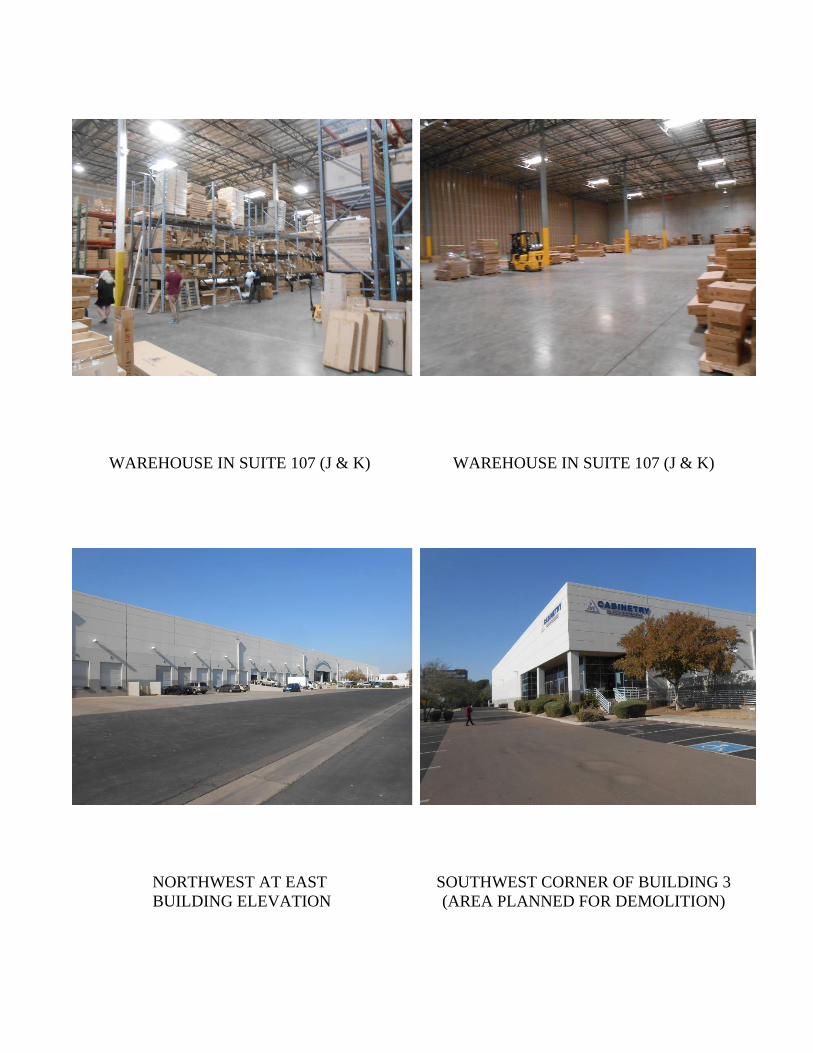
The subject of this report is improved with four multi-tenant industrial buildings. The shell buildings and site improvements for the project were completed in 1996. The project name is Hohokam 10 Business Center. Planned Building Reconfiguration: Due to ADOT’s retention of additional right of way upon a near term sale of the property
(previously discussed) a portion of existing Buildings #1, #2 and #3 will need to be removed to
accommodate a fire lane and required setbacks along the south side of the buildings. Water
retention and parking along the south side of the buildings will also need to be modified.
Specifically, the subject includes obligations to demolish and reconstruct approximately 50 to
60 feet of the southern portion of Buildings 1, 2 and 3. Construction and engineering details of
the reconfigurations are included within architectural plans prepared by Irwin G. Pasternack
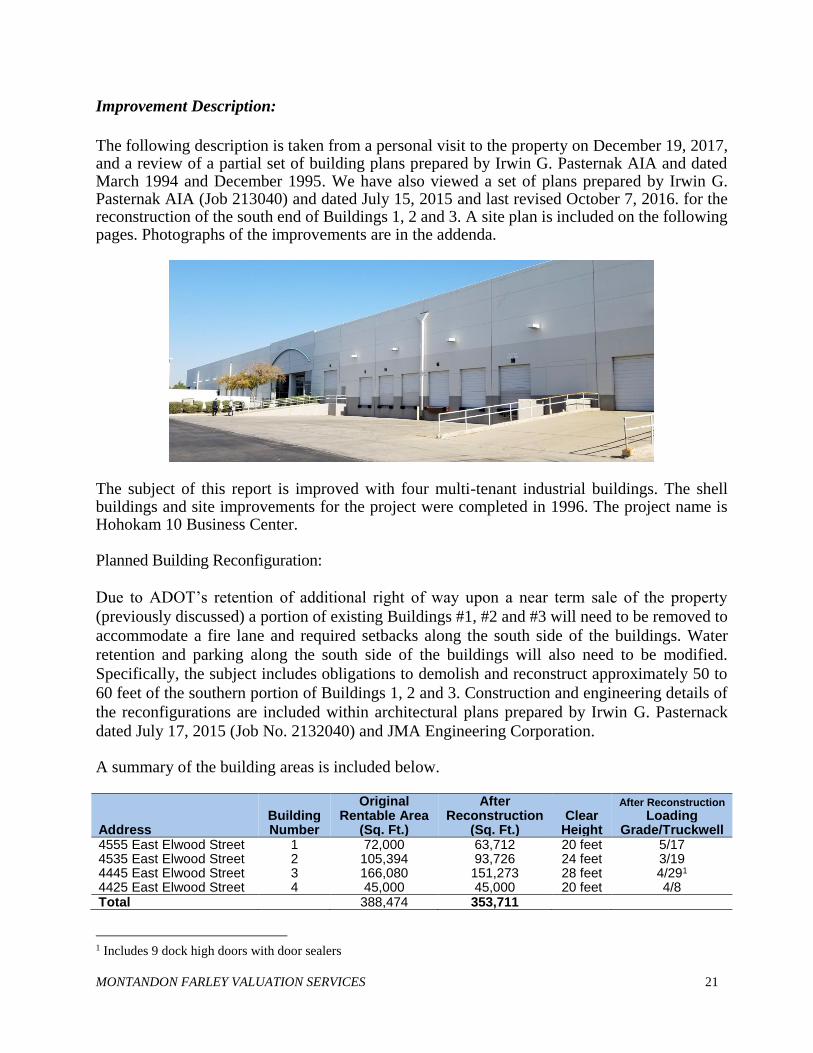
dated July 17, 2015 (Job No. 2132040) and JMA Engineering Corporation. A summary of the building areas is included below.
Address Building Number
Original Rentable Area
(Sq. Ft.)
After Reconstruction
(Sq. Ft.) Clear
Height
After Reconstruction
Loading Grade/Truckwell
4555 East Elwood Street 1 72,000 63,712 20 feet 5/17 4535 East Elwood Street 2 105,394 93,726 24 feet 3/19 4445 East Elwood Street 3 166,080 151,273 28 feet 4/291 4425 East Elwood Street 4 45,000 45,000 20 feet 4/8 Total 388,474 353,711
1 Includes 9 dock high doors with door sealers
MONTANDON FARLEY VALUATION SERVICES 22
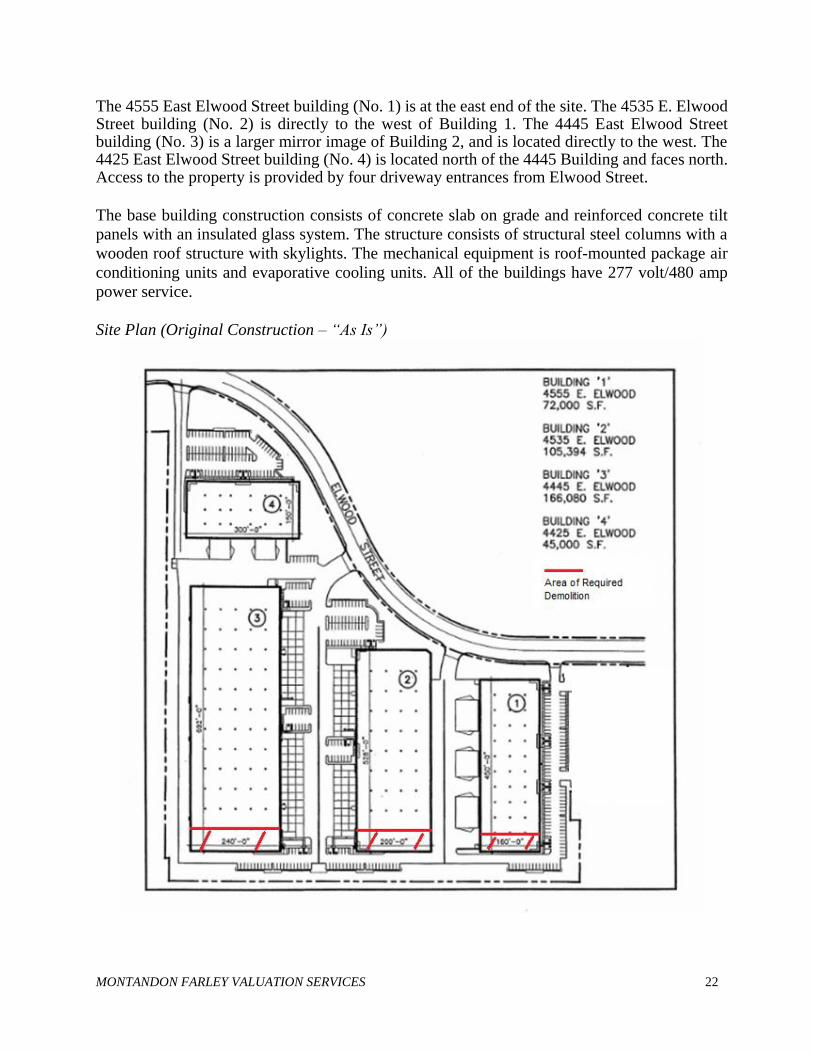
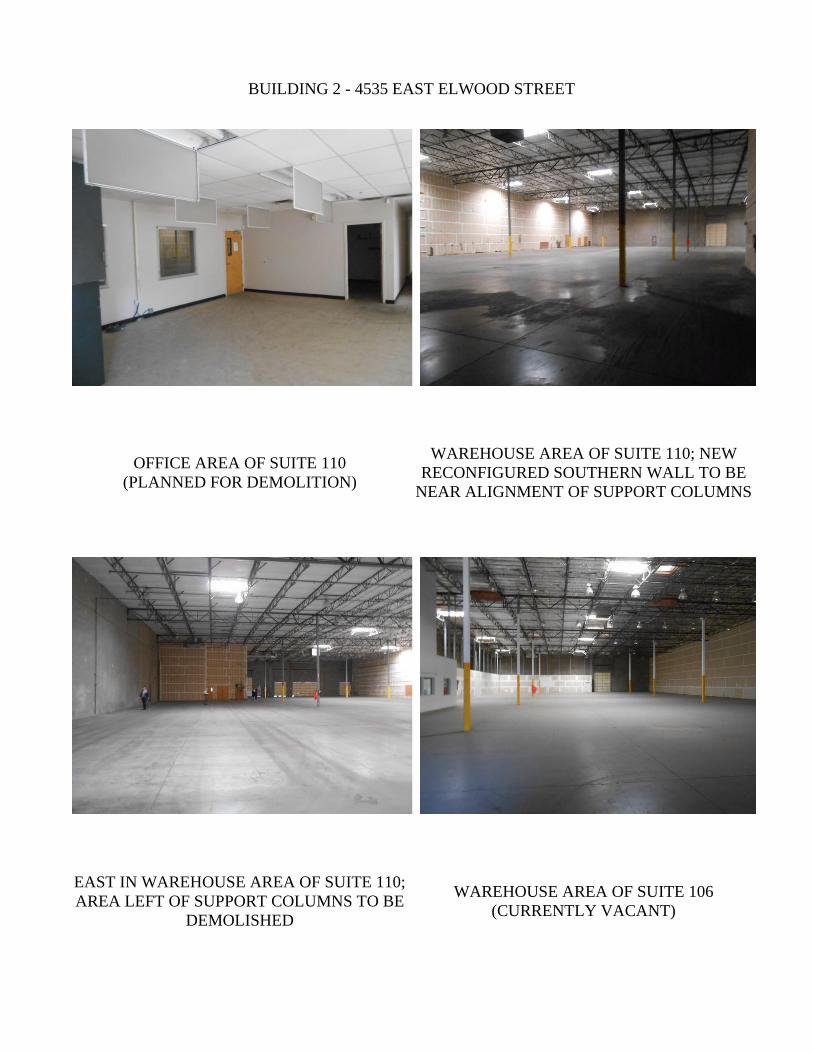
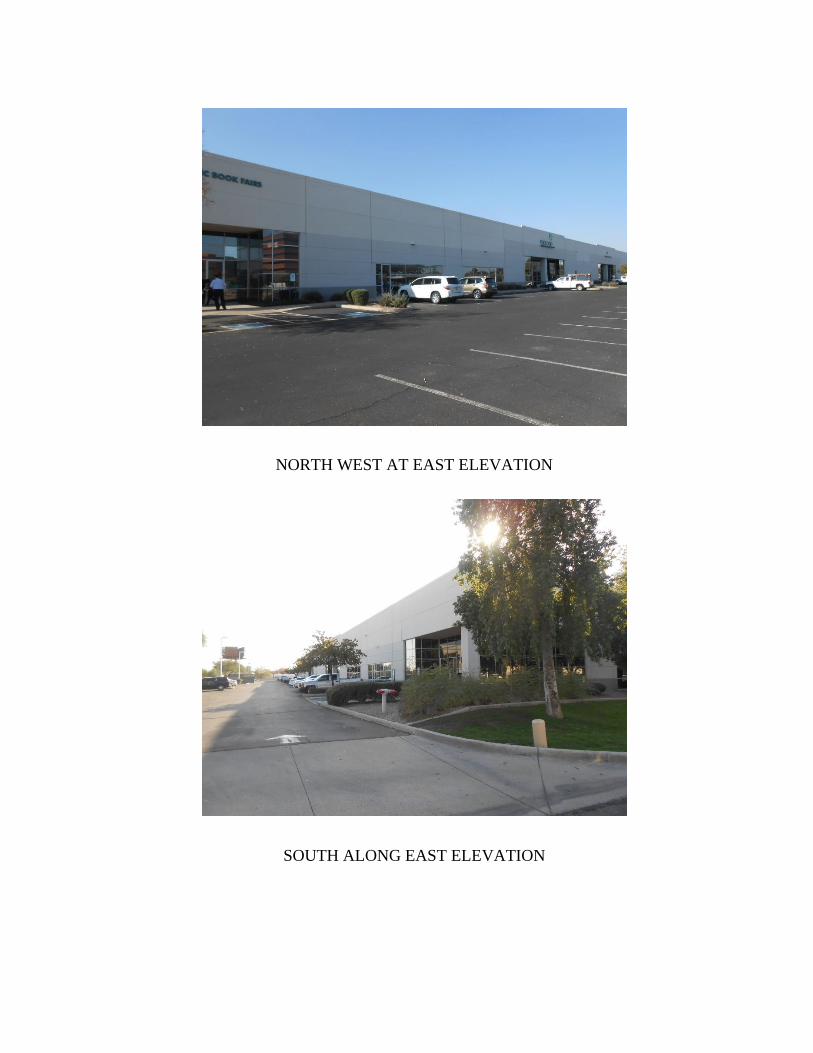
The 4555 East Elwood Street building (No. 1) is at the east end of the site. The 4535 E. Elwood Street building (No. 2) is directly to the west of Building 1. The 4445 East Elwood Street building (No. 3) is a larger mirror image of Building 2, and is located directly to the west. The 4425 East Elwood Street building (No. 4) is located north of the 4445 Building and faces north. Access to the property is provided by four driveway entrances from Elwood Street.
The base building construction consists of concrete slab on grade and reinforced concrete tilt
panels with an insulated glass system. The structure consists of structural steel columns with a
wooden roof structure with skylights. The mechanical equipment is roof-mounted package air
conditioning units and evaporative cooling units. All of the buildings have 277 volt/480 amp
power service.
Site Plan (Original Construction – “As Is”)
MONTANDON FARLEY VALUATION SERVICES 23
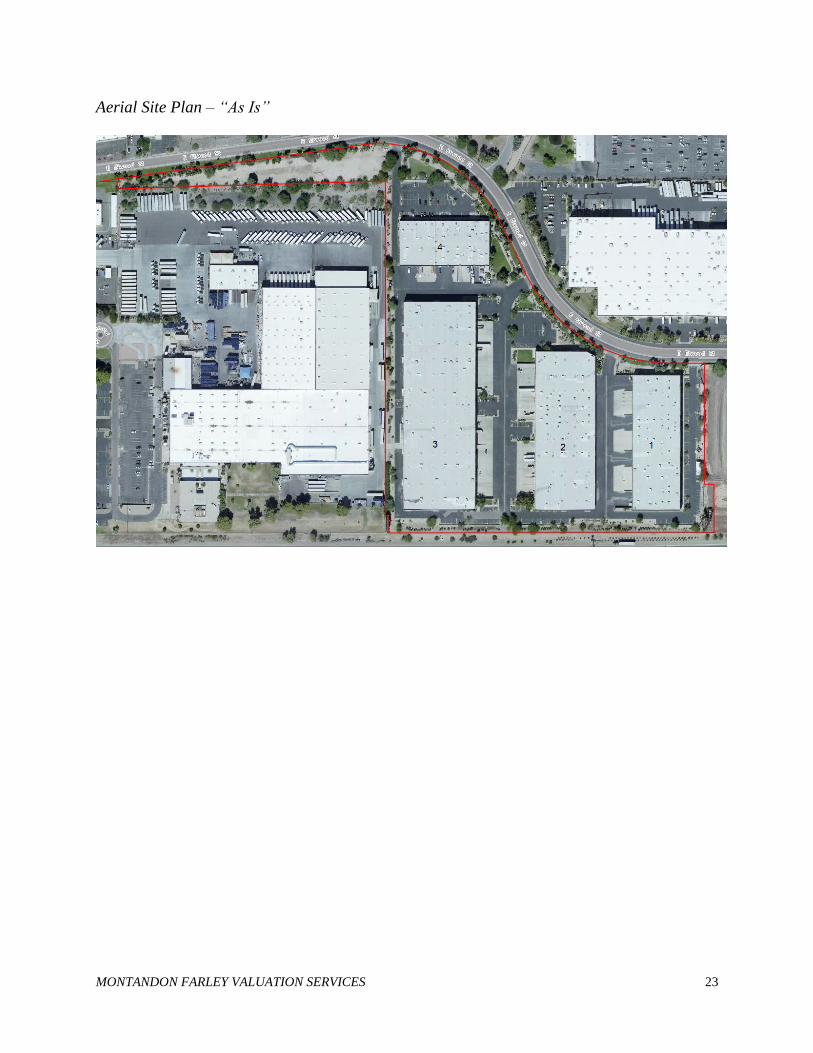
Aerial Site Plan – “As Is”
MONTANDON FARLEY VALUATION SERVICES 24
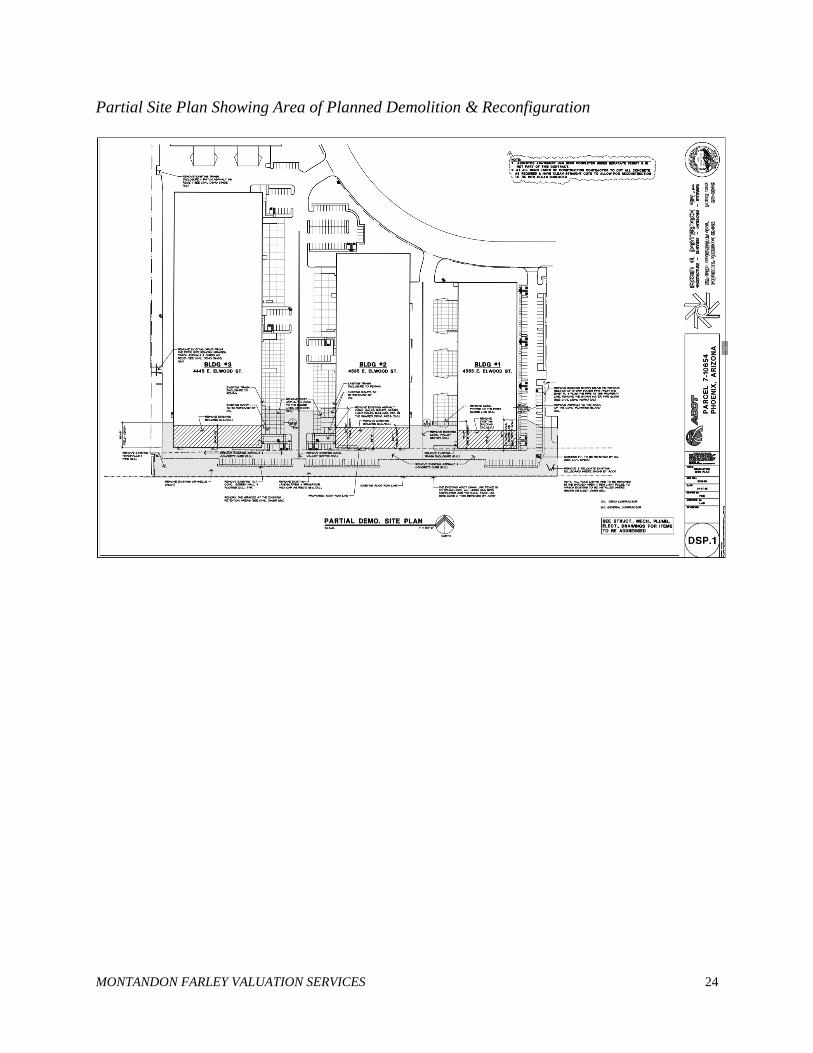
Partial Site Plan Showing Area of Planned Demolition & Reconfiguration
MONTANDON FARLEY VALUATION SERVICES 25
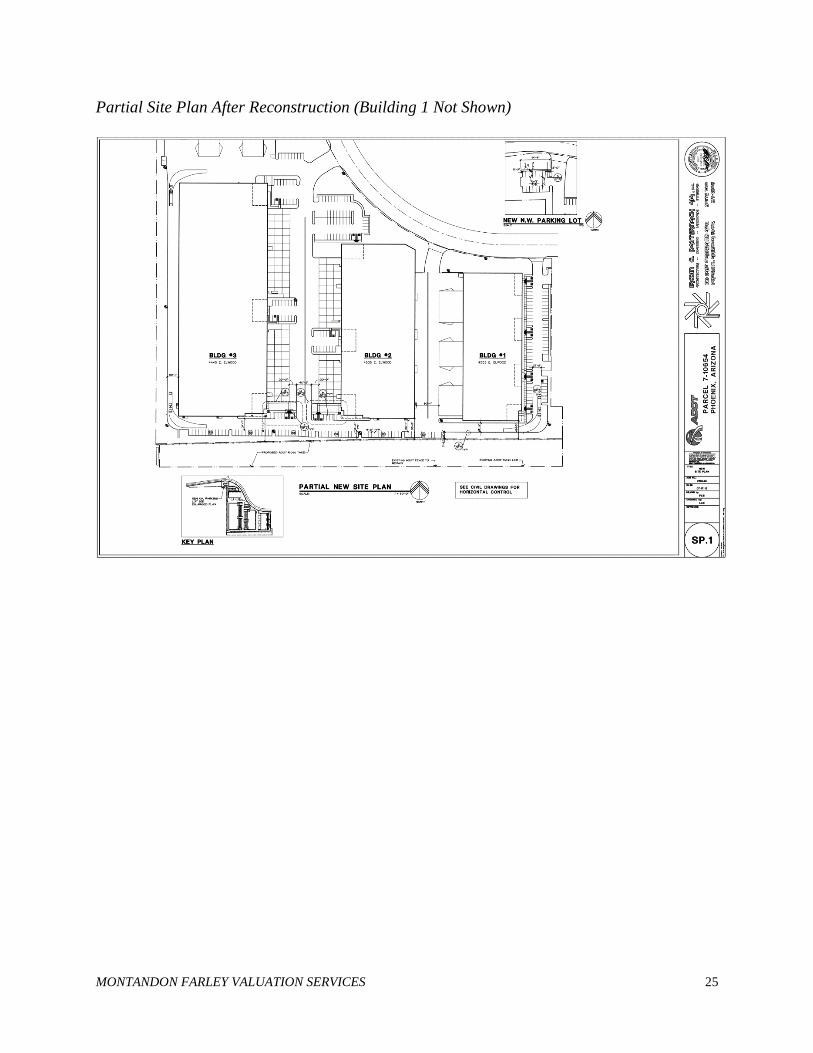
Partial Site Plan After Reconstruction (Building 1 Not Shown)
MONTANDON FARLEY VALUATION SERVICES 26
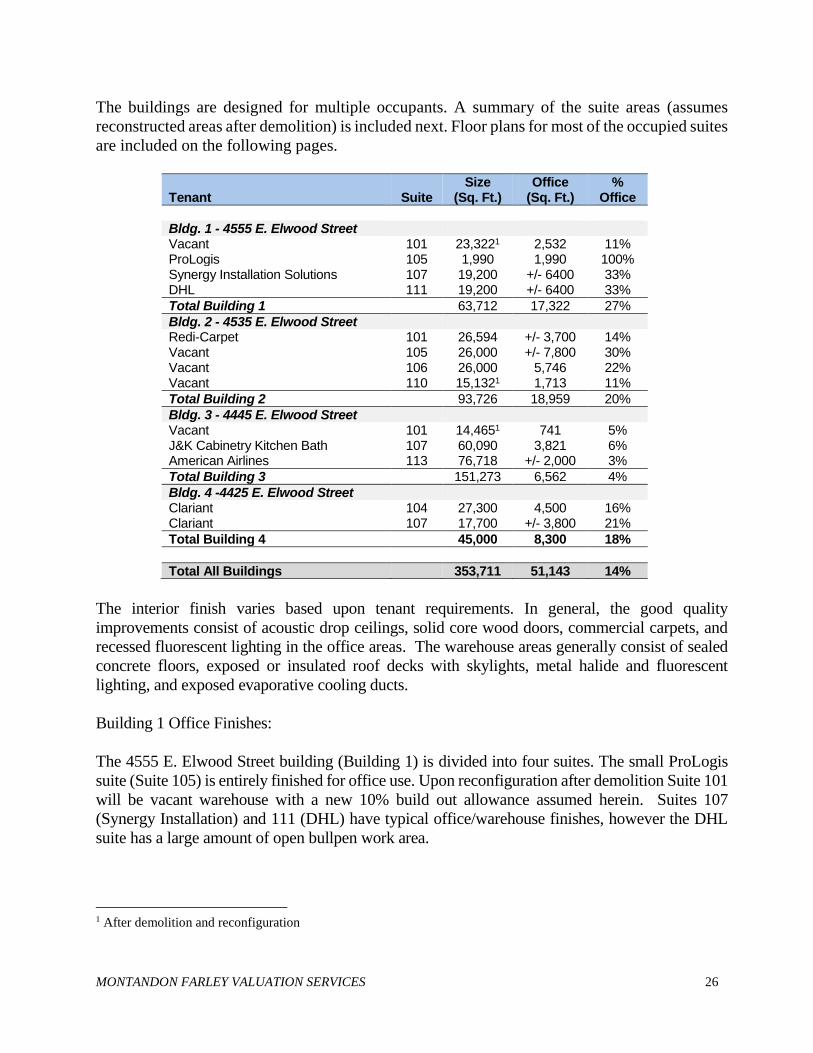
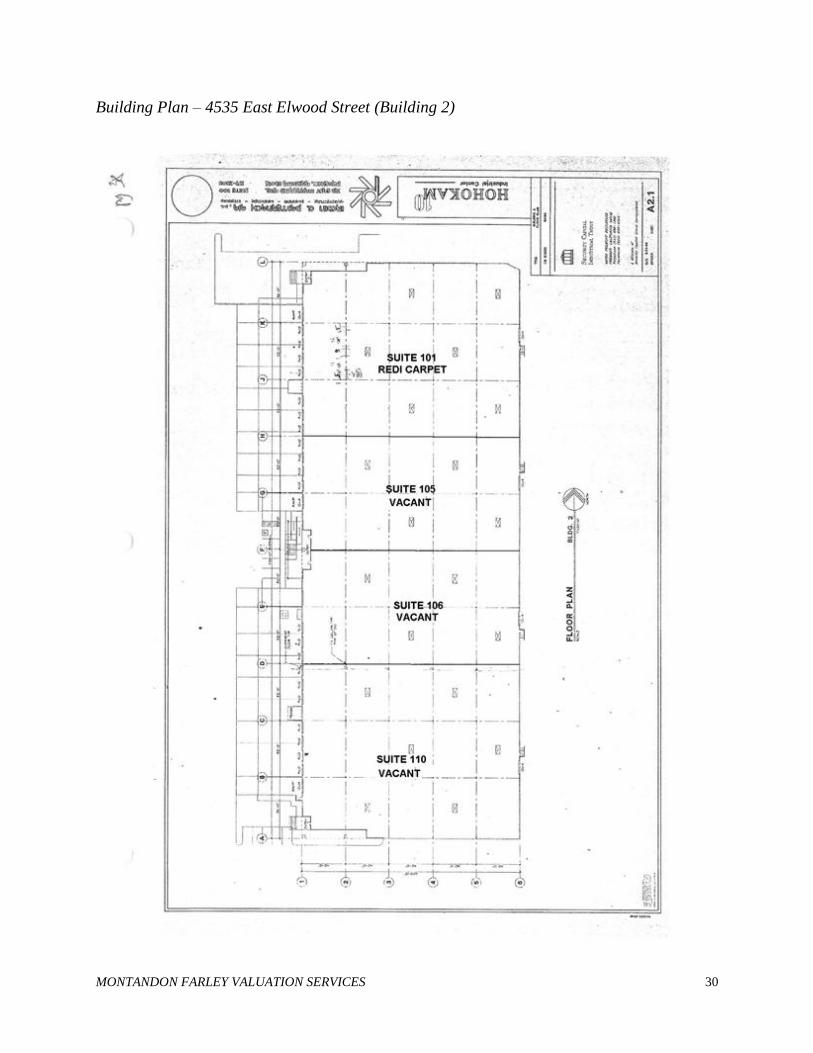
The buildings are designed for multiple occupants. A summary of the suite areas (assumes
reconstructed areas after demolition) is included next. Floor plans for most of the occupied suites
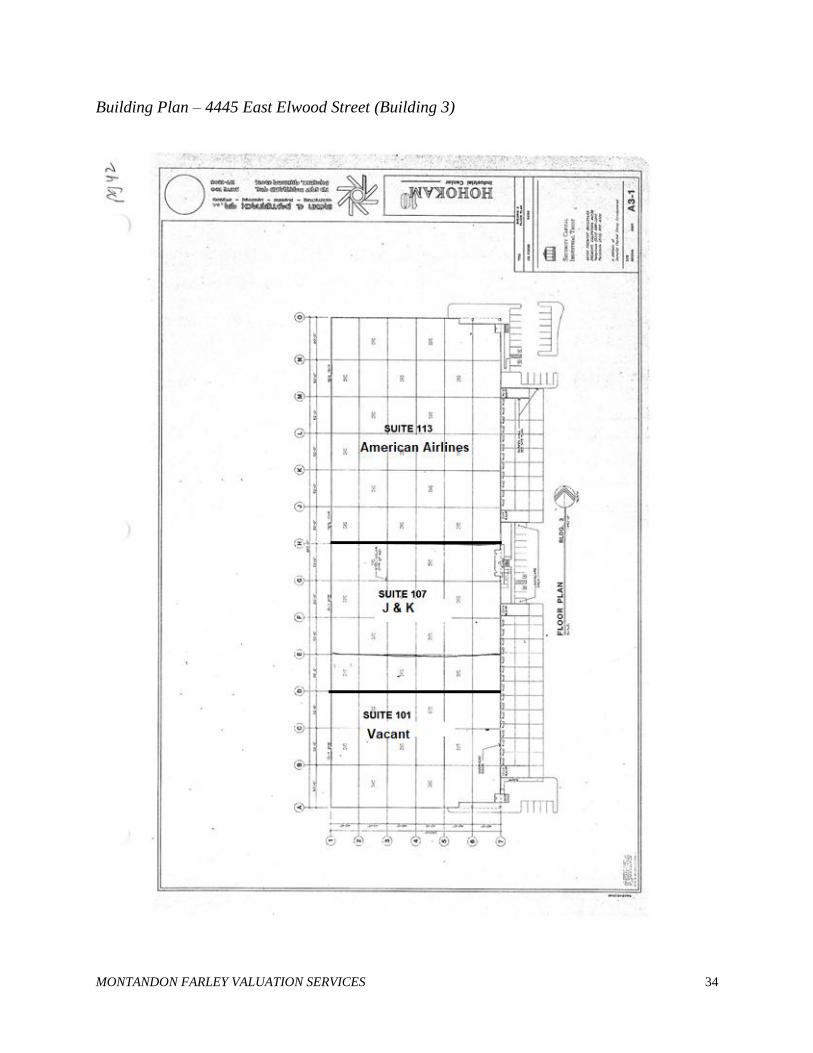
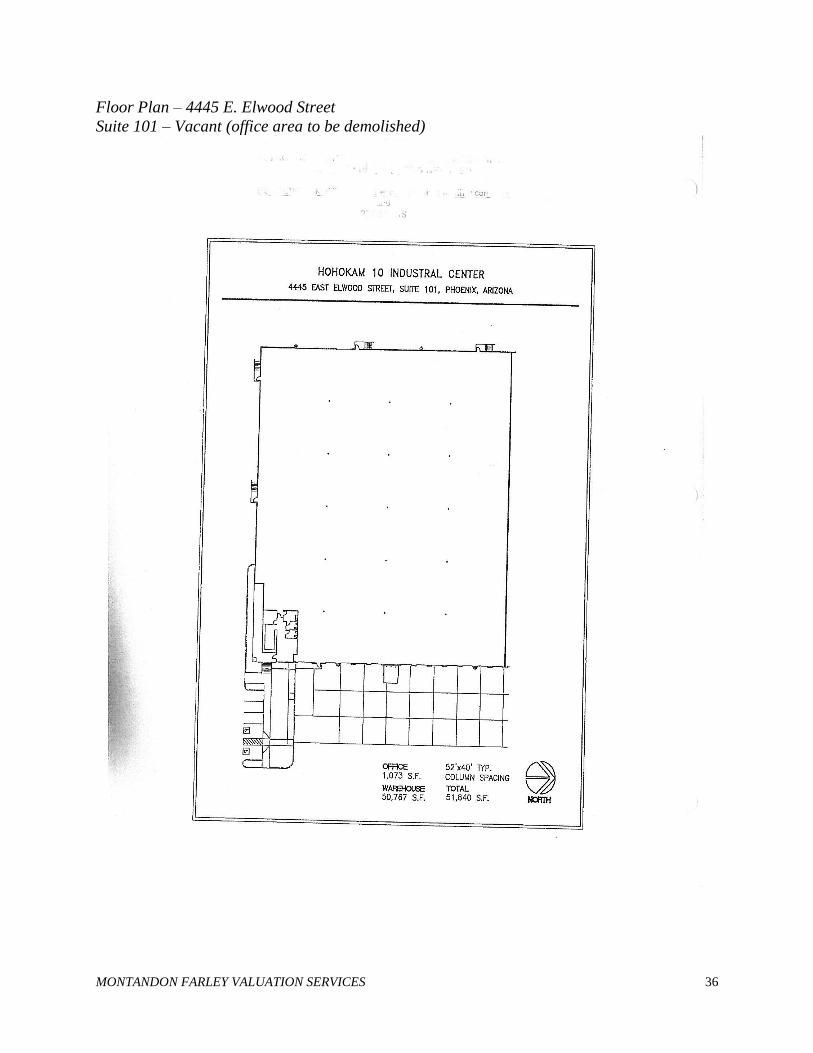
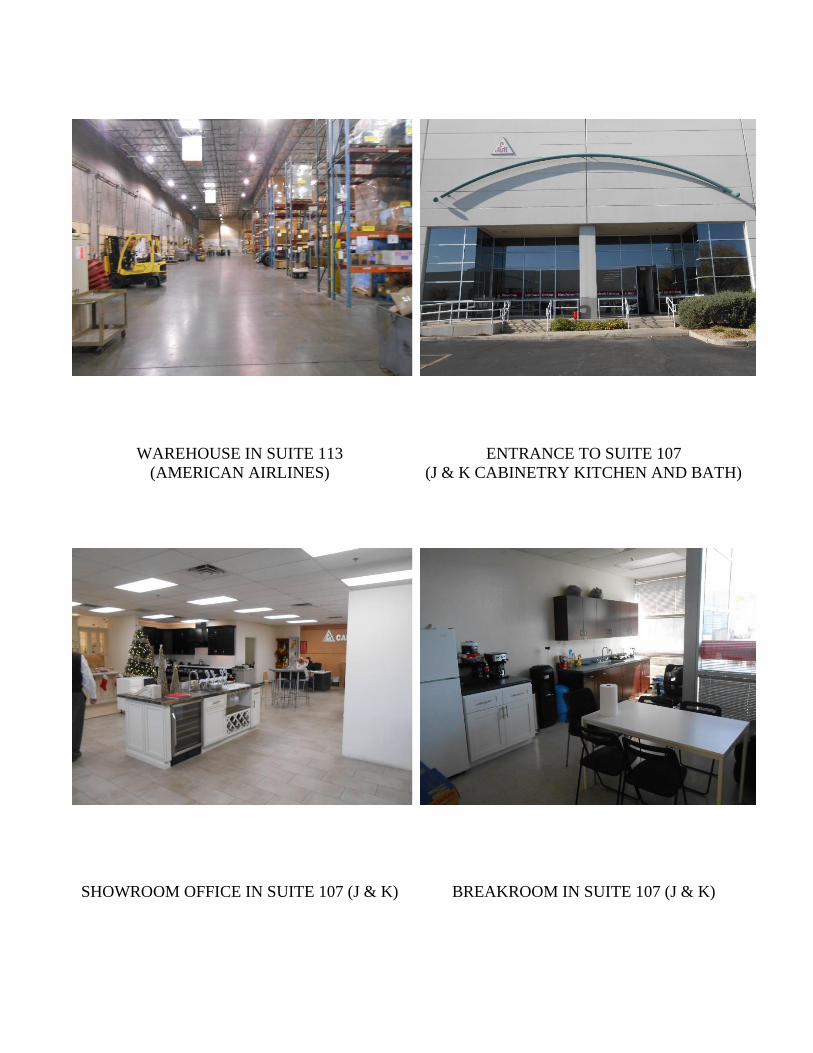
Bldg. 3 - 4445 E. Elwood Street Vacant 101 14,4651 741 5% J&K Cabinetry Kitchen Bath 107 60,090 3,821 6% American Airlines 113 76,718 +/- 2,000 3%
Total Building 3 151,273 6,562 4%
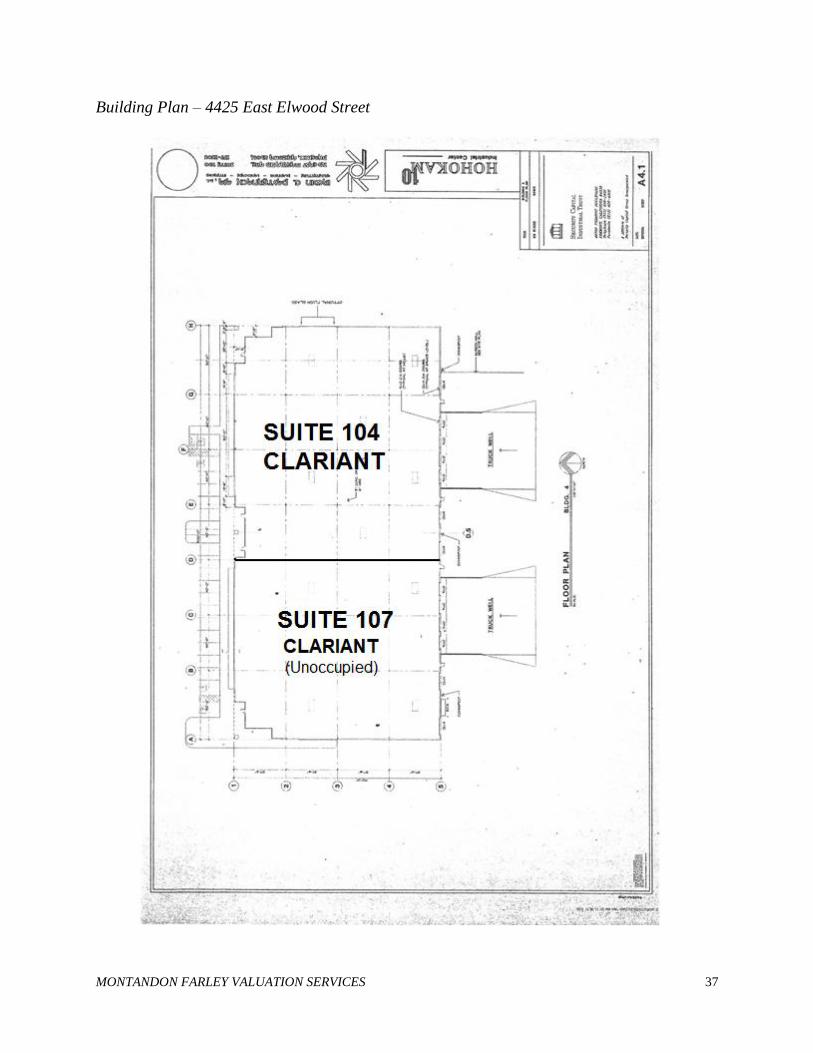
Bldg. 4 -4425 E. Elwood Street Clariant 104 27,300 4,500 16% Clariant 107 17,700 +/- 3,800 21%
Total Building 4 45,000 8,300 18%
Total All Buildings 353,711 51,143 14%
The interior finish varies based upon tenant requirements. In general, the good quality
improvements consist of acoustic drop ceilings, solid core wood doors, commercial carpets, and
recessed fluorescent lighting in the office areas. The warehouse areas generally consist of sealed
concrete floors, exposed or insulated roof decks with skylights, metal halide and fluorescent
lighting, and exposed evaporative cooling ducts.
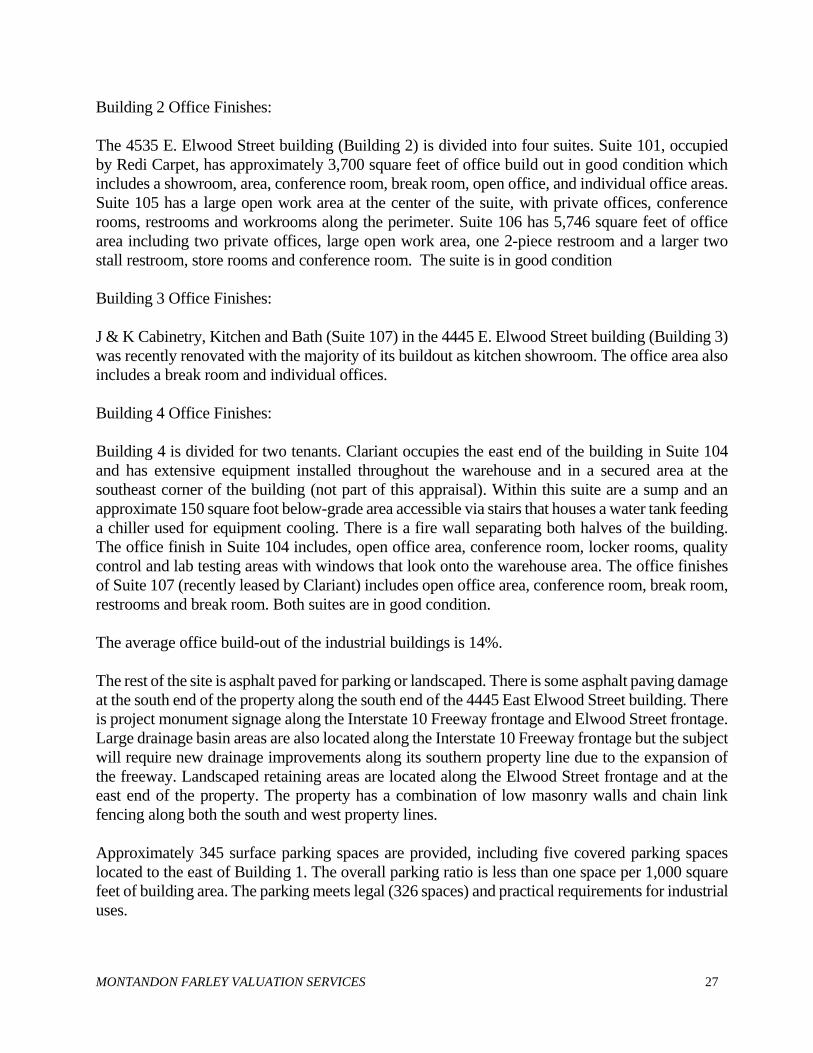
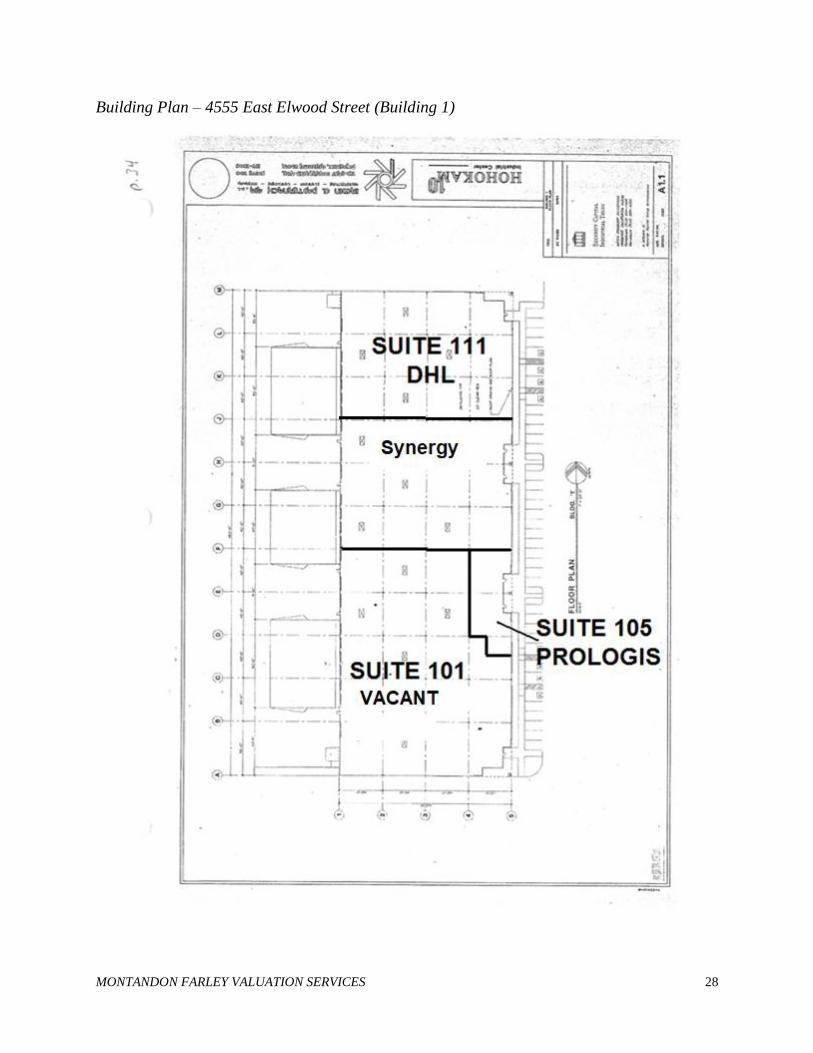
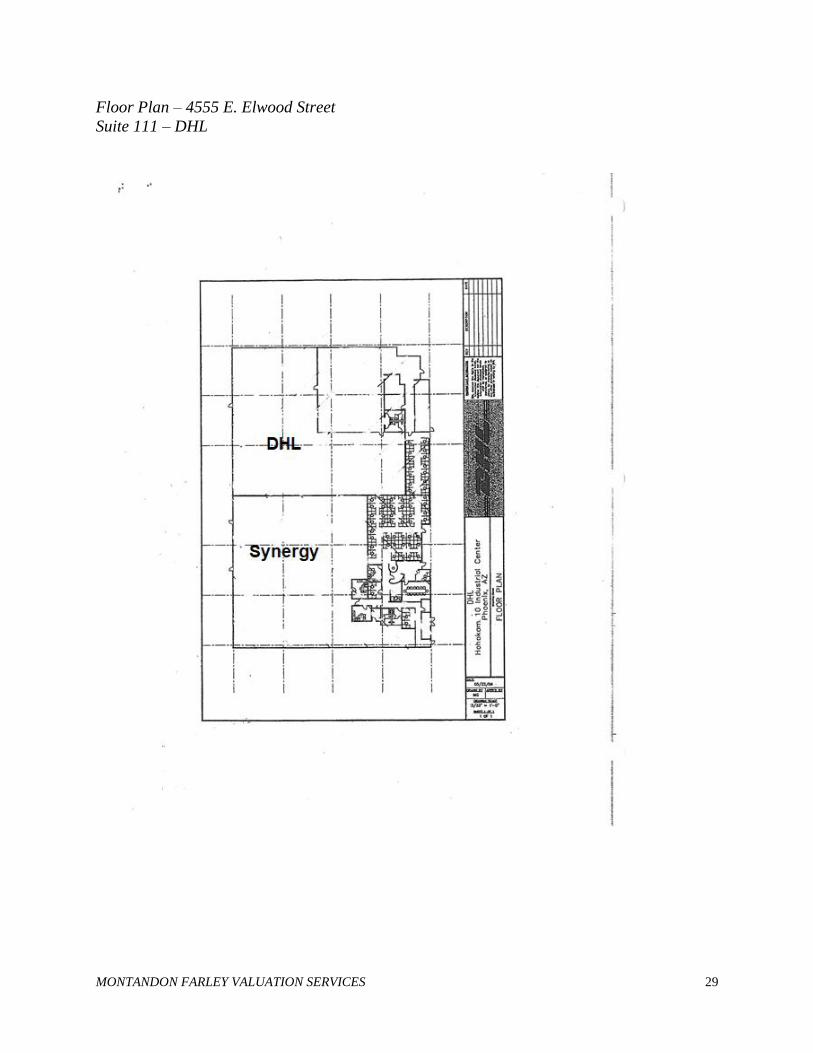
Building 1 Office Finishes:
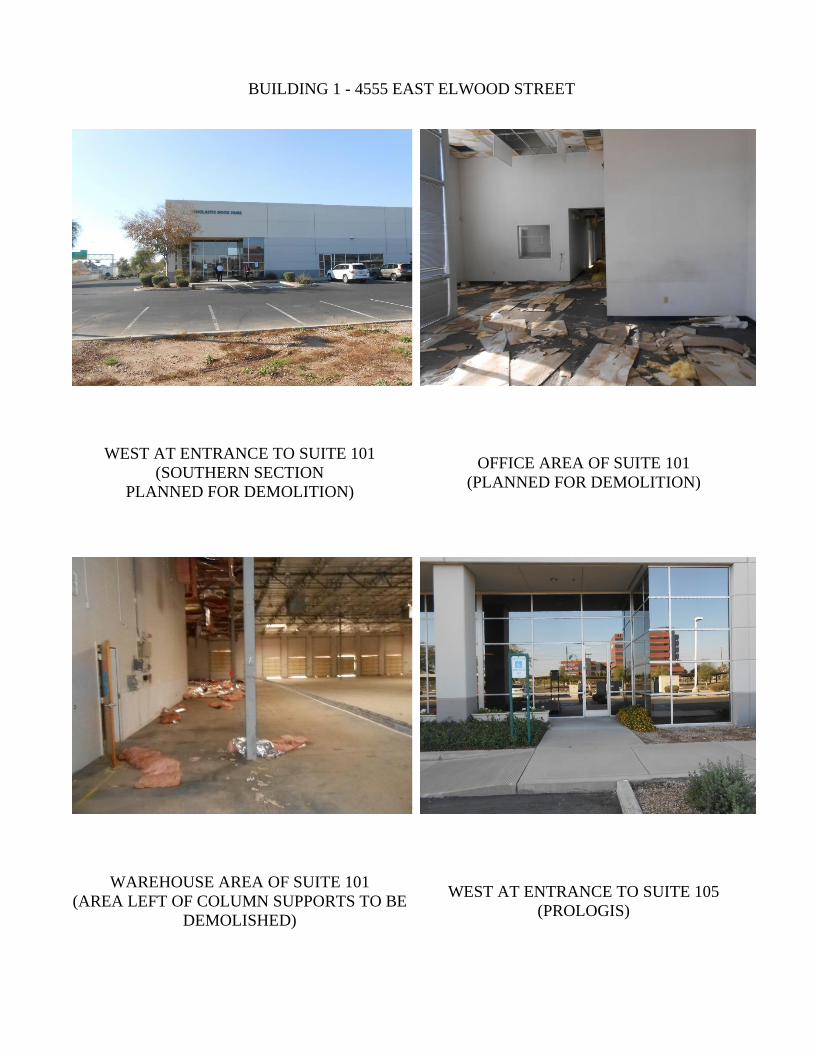
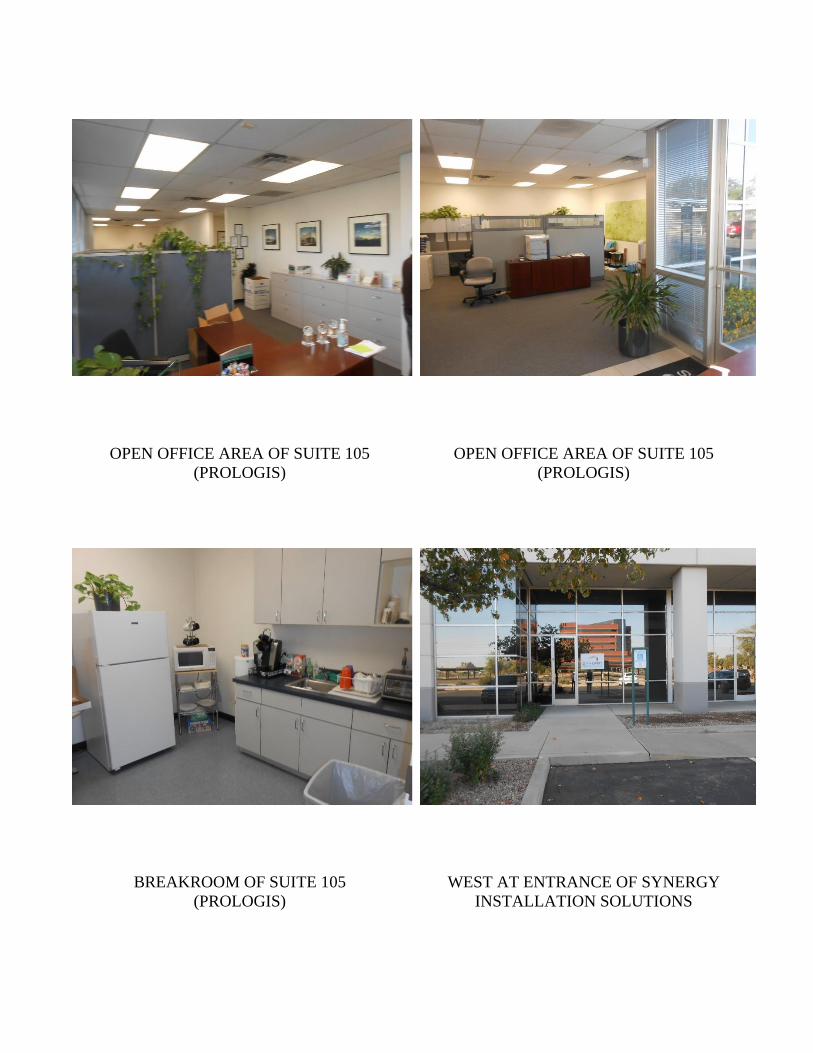
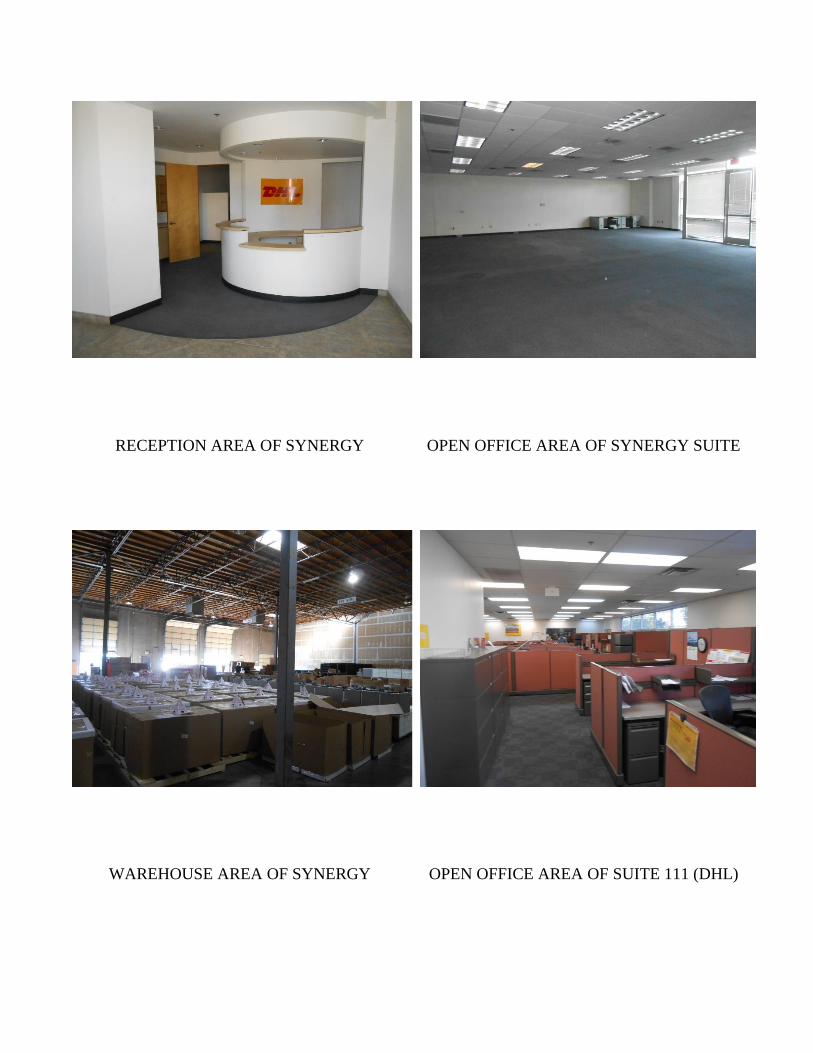
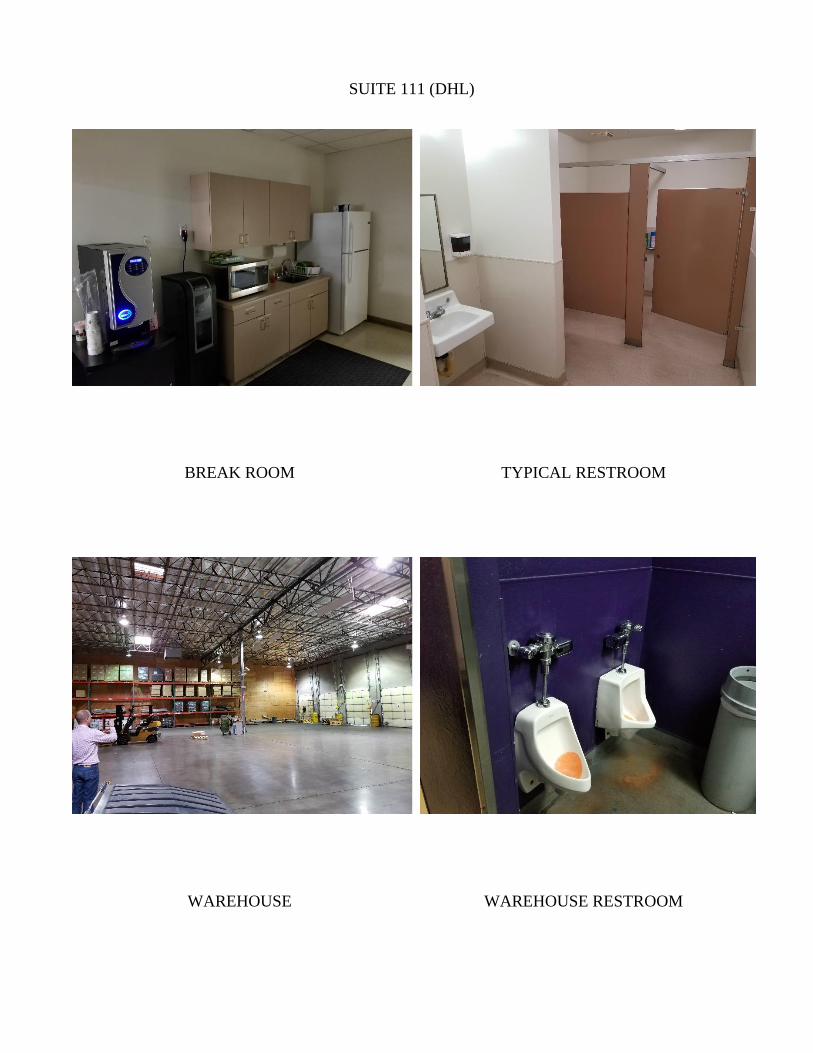
The 4555 E. Elwood Street building (Building 1) is divided into four suites. The small ProLogis
suite (Suite 105) is entirely finished for office use. Upon reconfiguration after demolition Suite 101
will be vacant warehouse with a new 10% build out allowance assumed herein. Suites 107
(Synergy Installation) and 111 (DHL) have typical office/warehouse finishes, however the DHL
suite has a large amount of open bullpen work area.
1 After demolition and reconfiguration
MONTANDON FARLEY VALUATION SERVICES 27
Building 2 Office Finishes:
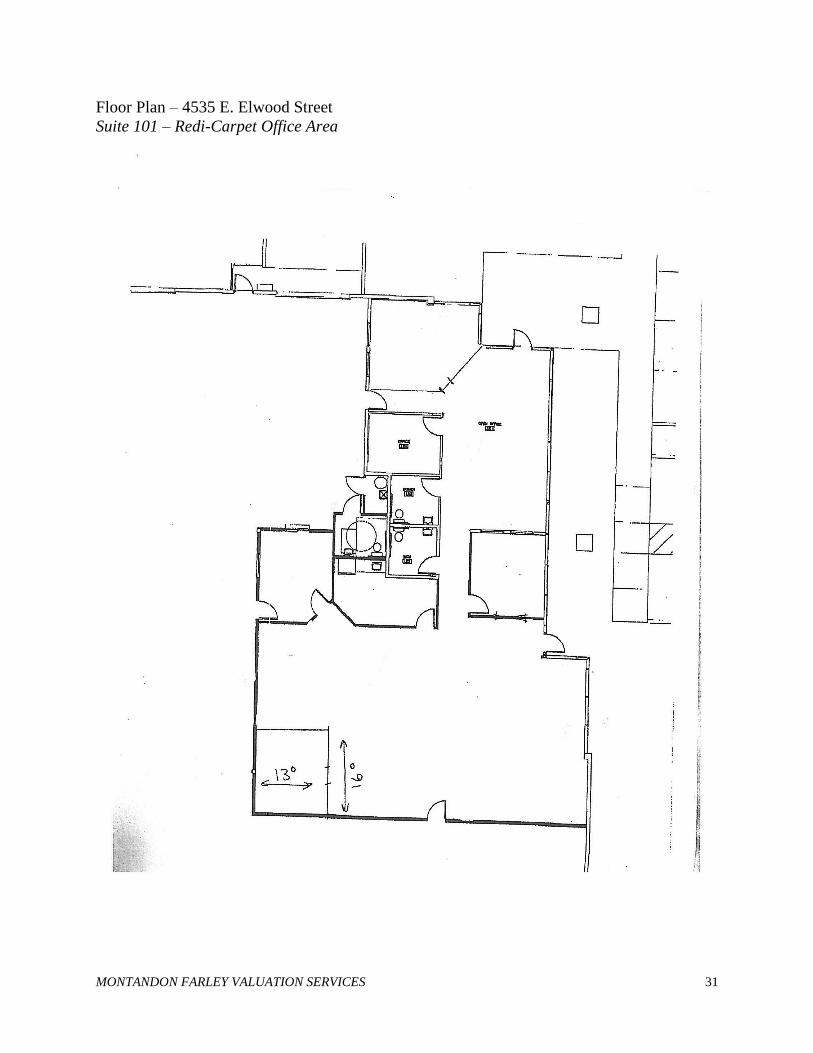
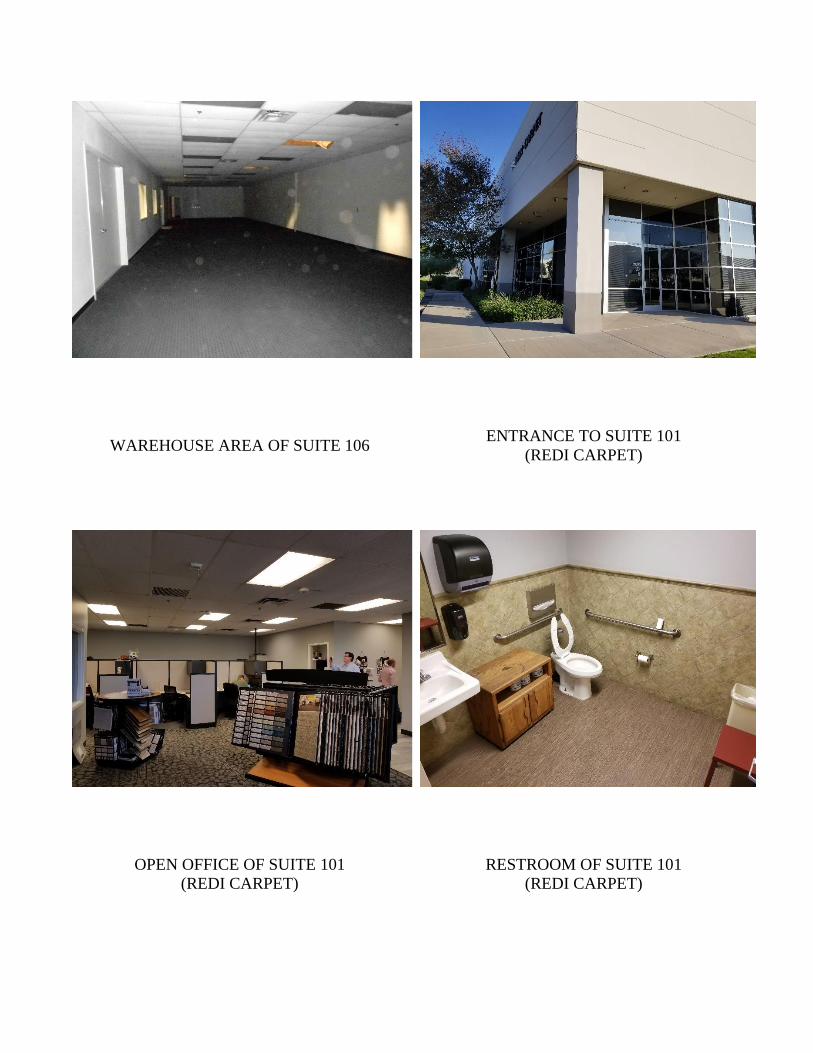
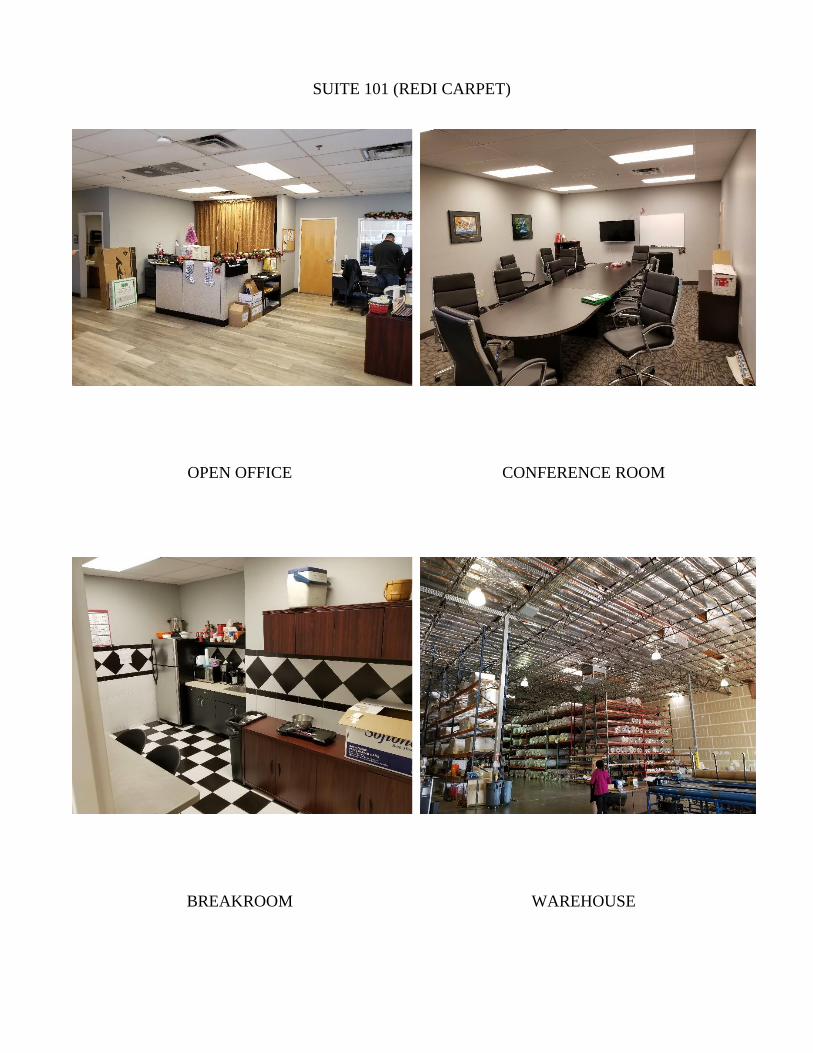
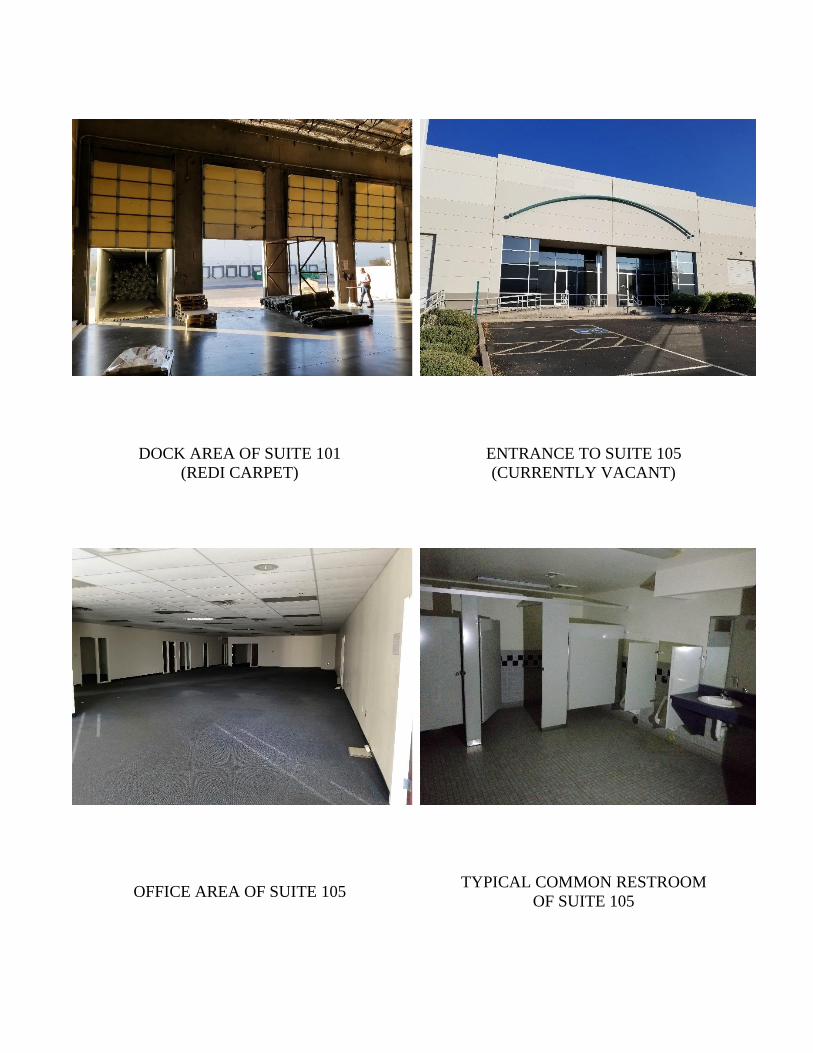
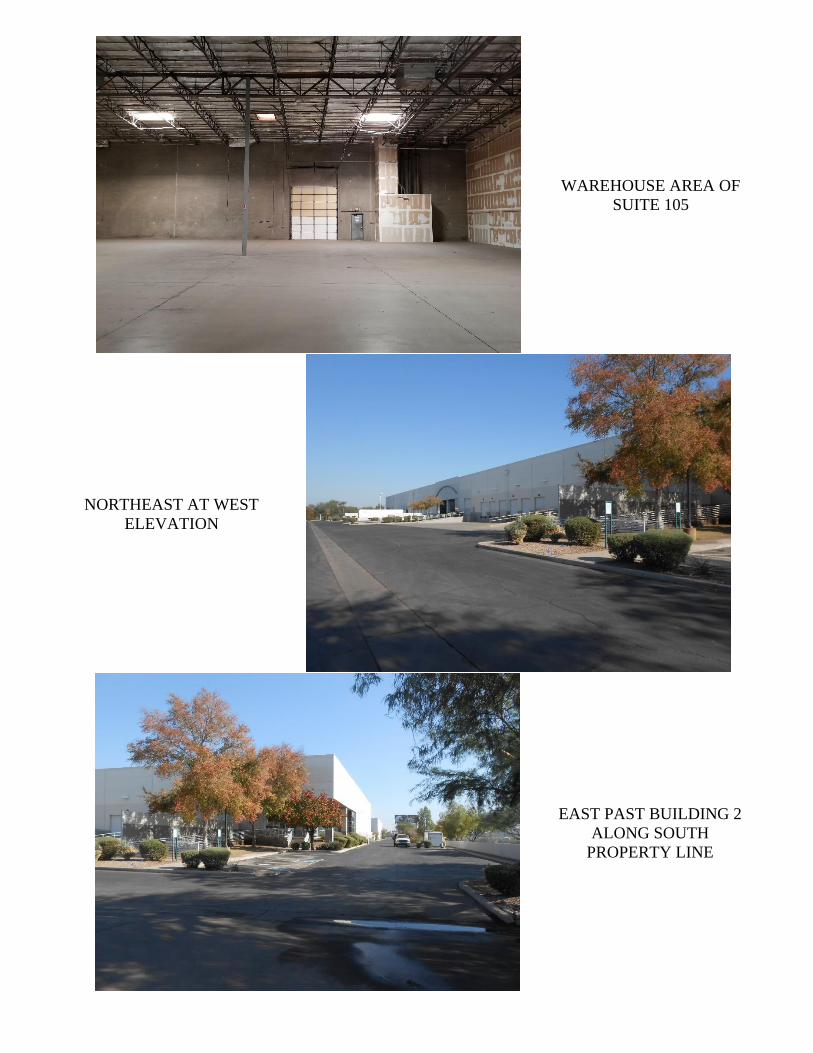
The 4535 E. Elwood Street building (Building 2) is divided into four suites. Suite 101, occupied
by Redi Carpet, has approximately 3,700 square feet of office build out in good condition which
includes a showroom, area, conference room, break room, open office, and individual office areas.
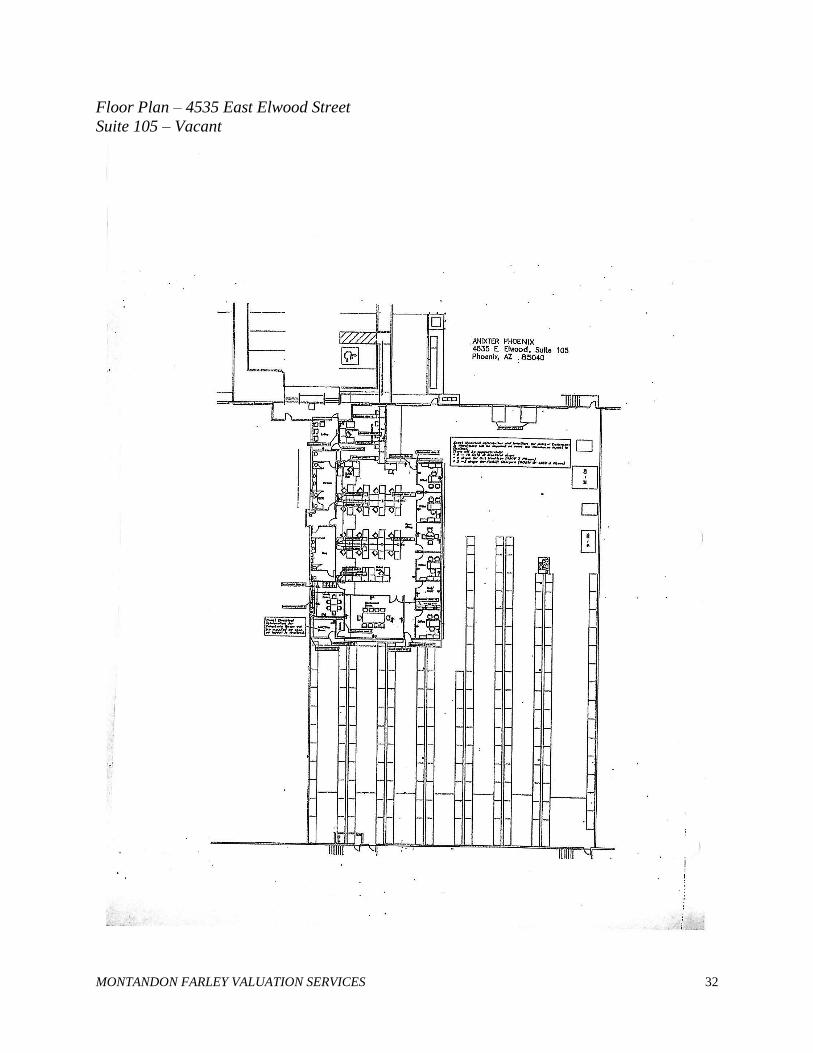
Suite 105 has a large open work area at the center of the suite, with private offices, conference
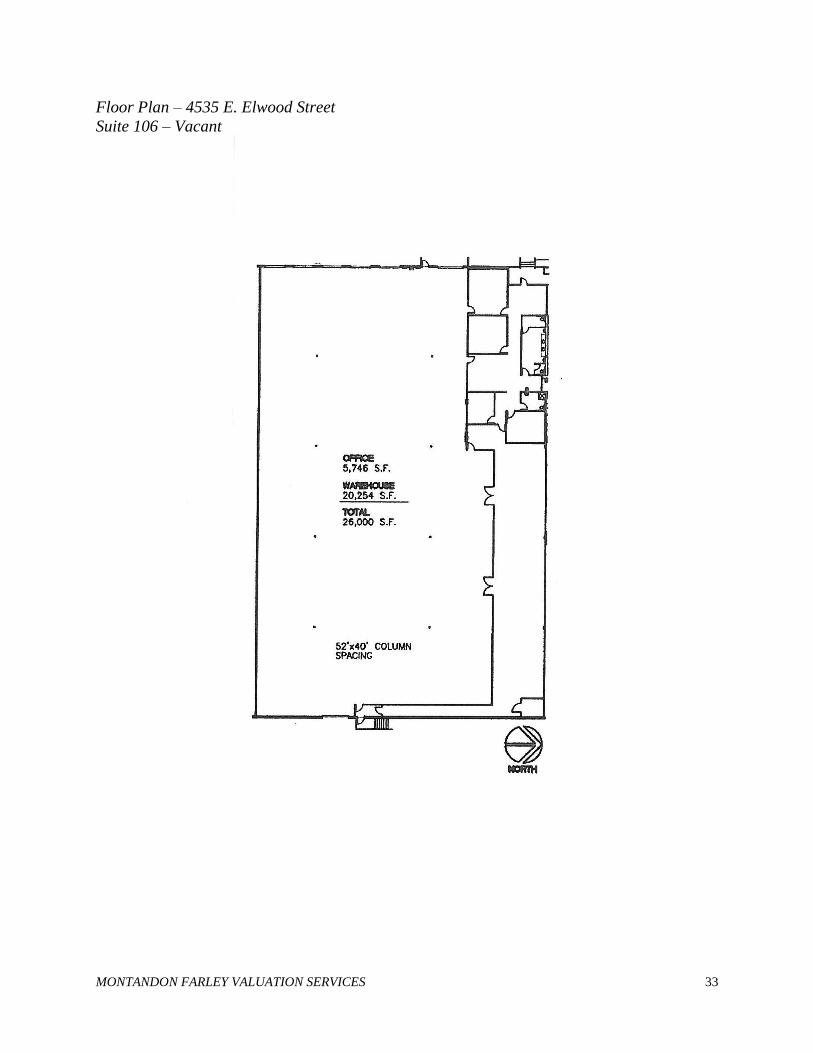
rooms, restrooms and workrooms along the perimeter. Suite 106 has 5,746 square feet of office
area including two private offices, large open work area, one 2-piece restroom and a larger two
stall restroom, store rooms and conference room. The suite is in good condition
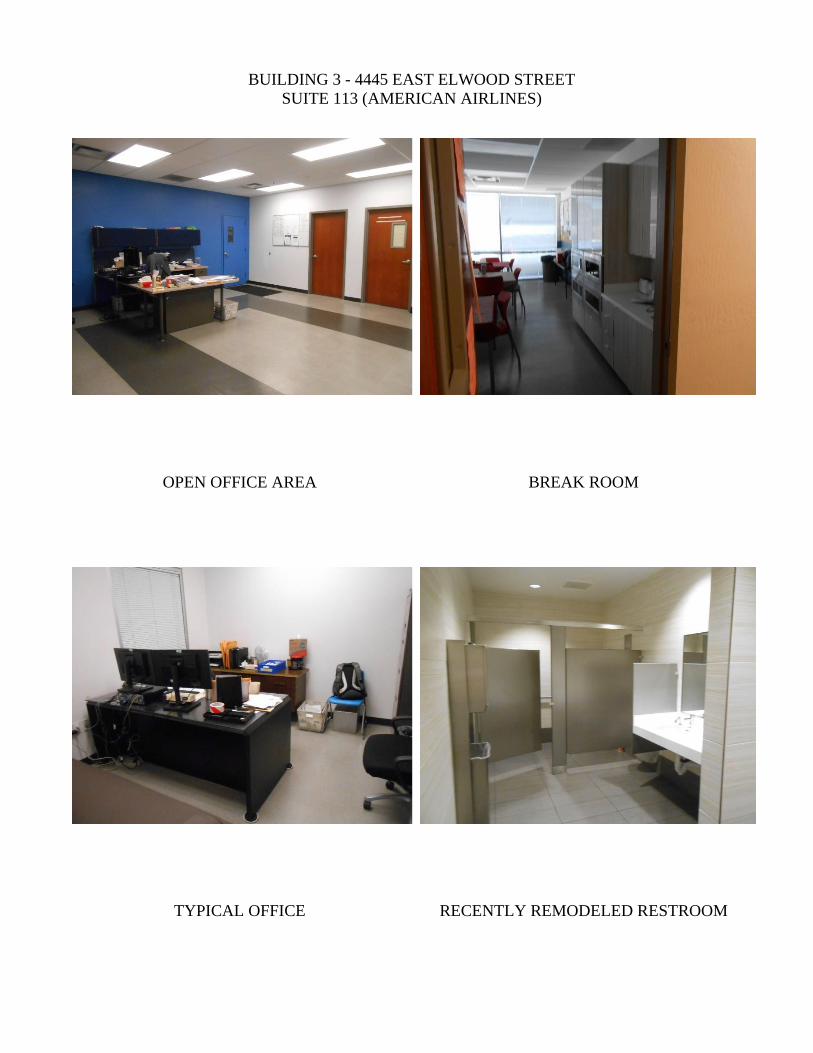
Building 3 Office Finishes:
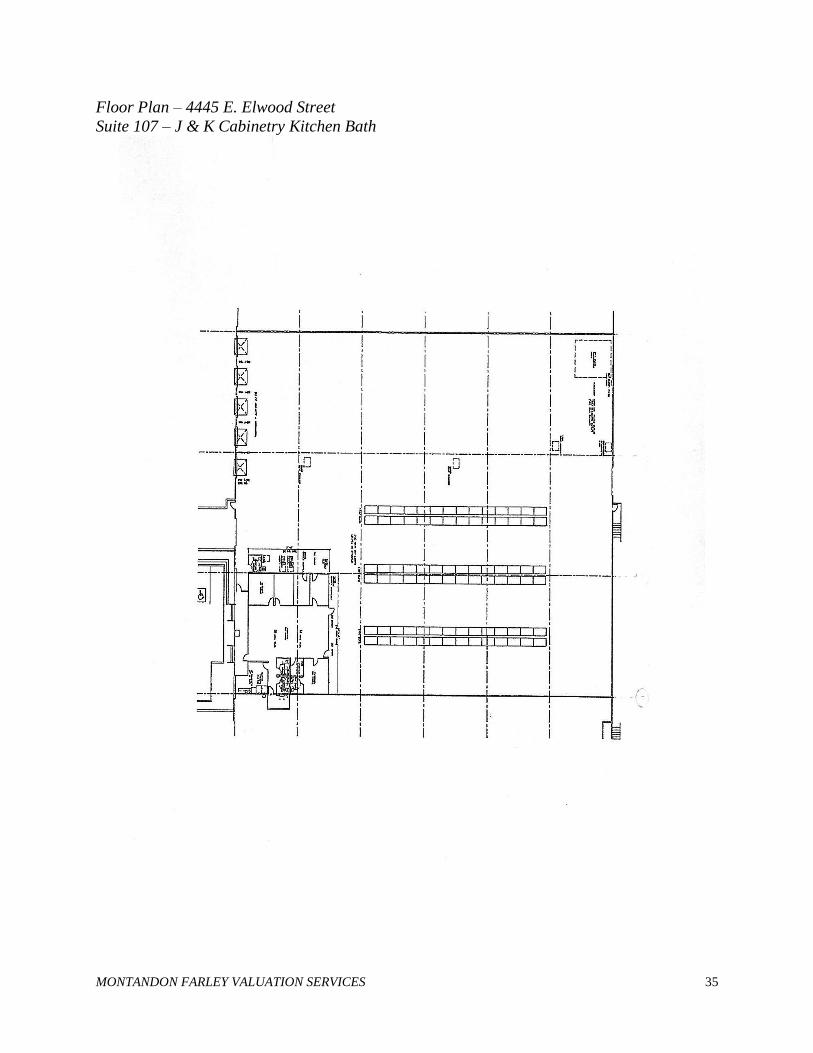
J & K Cabinetry, Kitchen and Bath (Suite 107) in the 4445 E. Elwood Street building (Building 3)
was recently renovated with the majority of its buildout as kitchen showroom. The office area also
includes a break room and individual offices.
Building 4 Office Finishes:
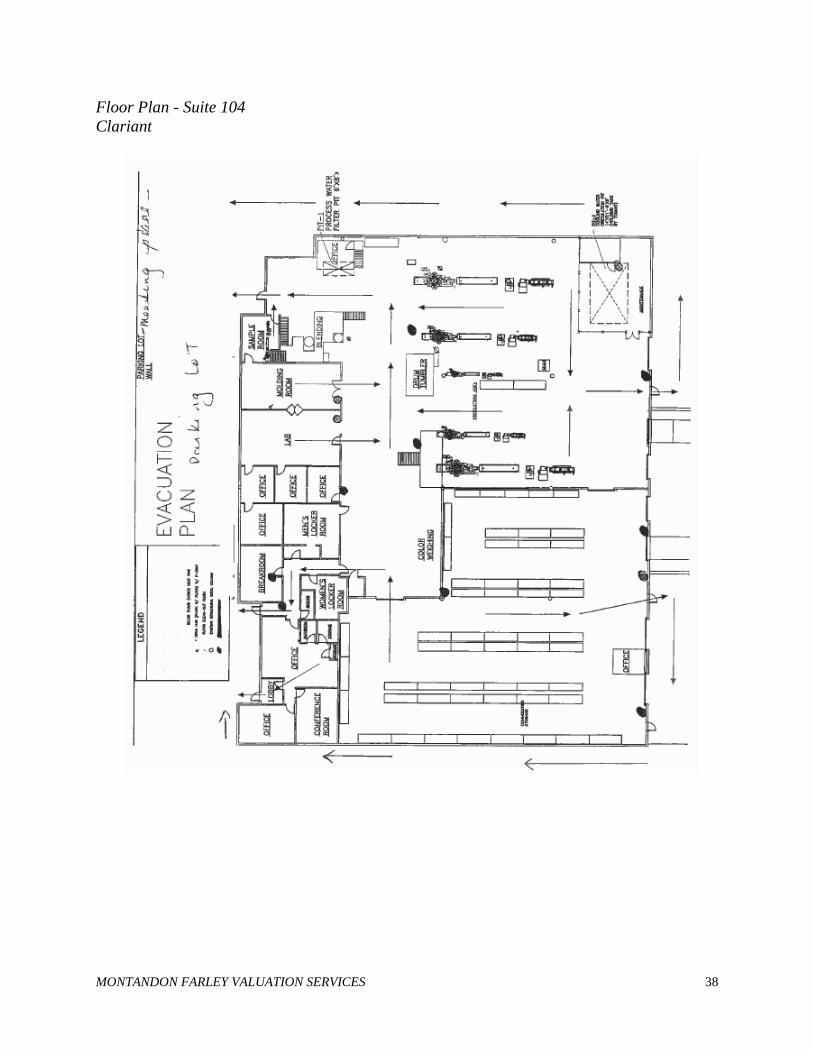
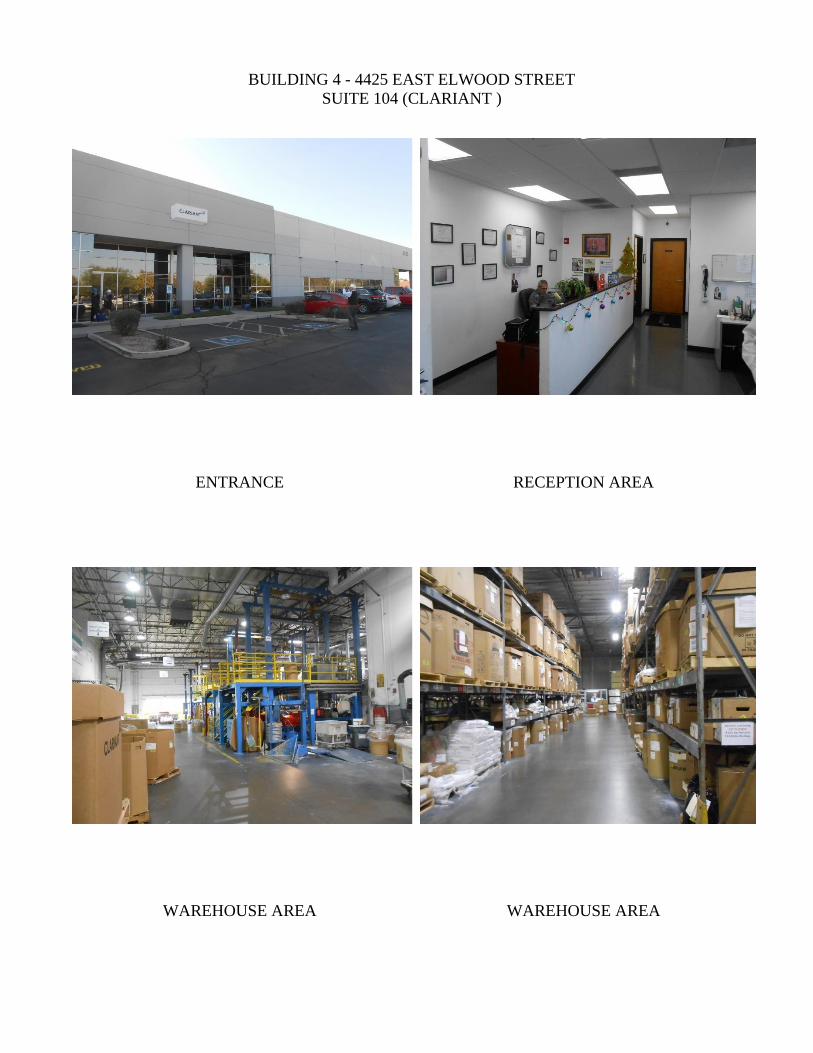
Building 4 is divided for two tenants. Clariant occupies the east end of the building in Suite 104
and has extensive equipment installed throughout the warehouse and in a secured area at the
southeast corner of the building (not part of this appraisal). Within this suite are a sump and an
approximate 150 square foot below-grade area accessible via stairs that houses a water tank feeding
a chiller used for equipment cooling. There is a fire wall separating both halves of the building.
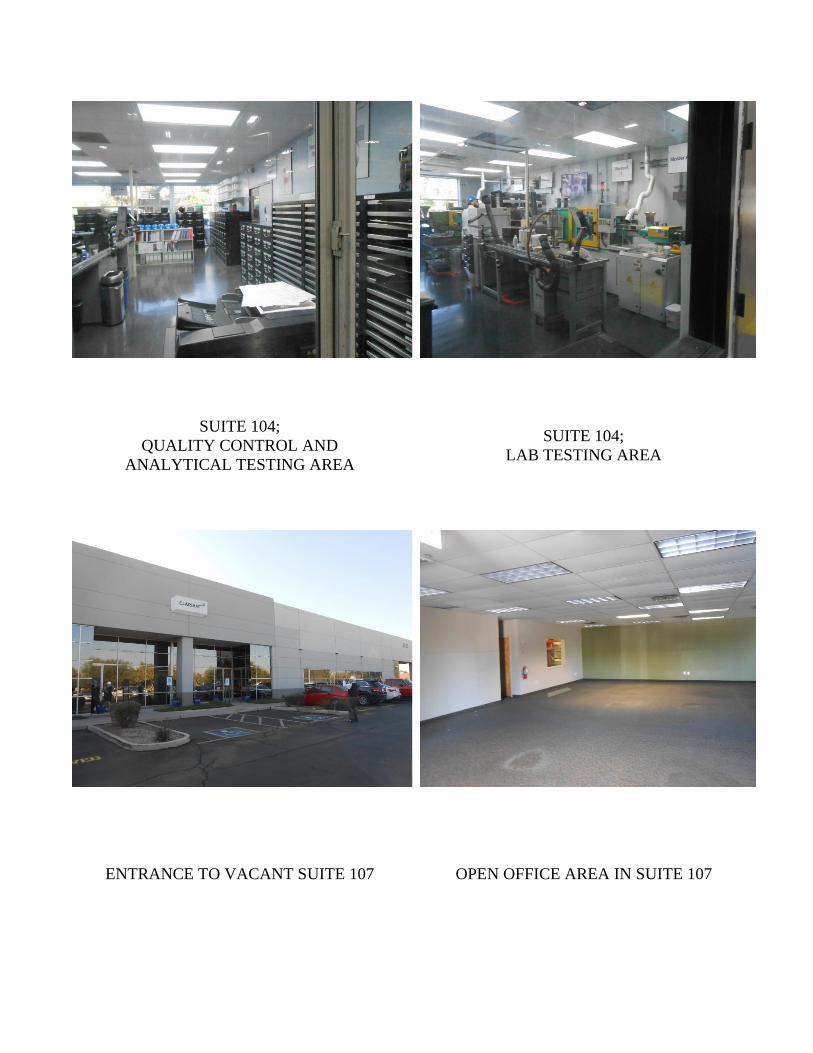
The office finish in Suite 104 includes, open office area, conference room, locker rooms, quality
control and lab testing areas with windows that look onto the warehouse area. The office finishes
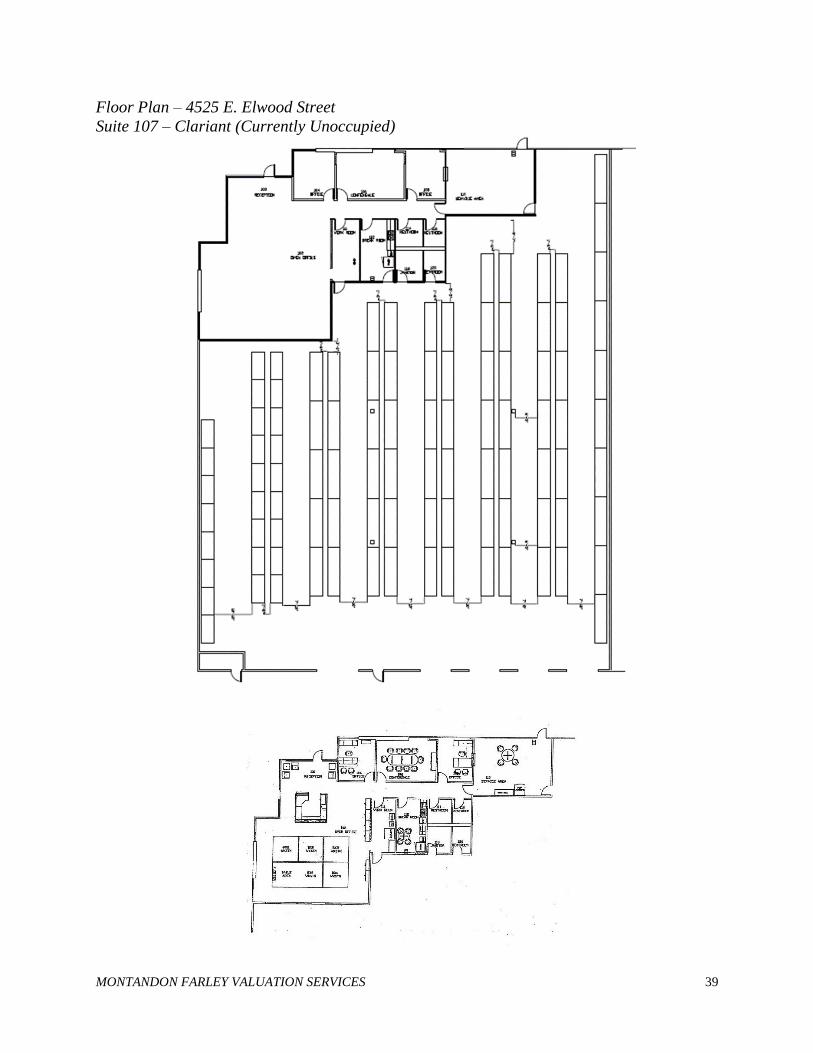
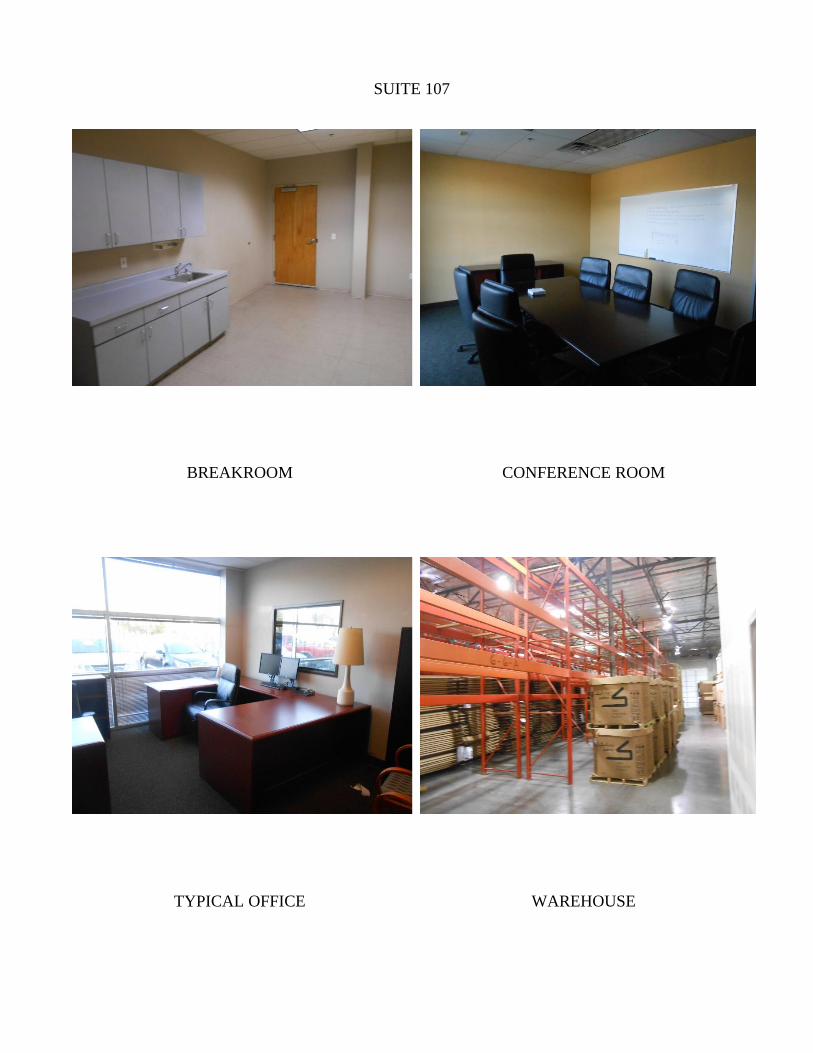
of Suite 107 (recently leased by Clariant) includes open office area, conference room, break room,
restrooms and break room. Both suites are in good condition.
The average office build-out of the industrial buildings is 14%.
The rest of the site is asphalt paved for parking or landscaped. There is some asphalt paving damage
at the south end of the property along the south end of the 4445 East Elwood Street building. There
is project monument signage along the Interstate 10 Freeway frontage and Elwood Street frontage.
Large drainage basin areas are also located along the Interstate 10 Freeway frontage but the subject
will require new drainage improvements along its southern property line due to the expansion of
the freeway. Landscaped retaining areas are located along the Elwood Street frontage and at the
east end of the property. The property has a combination of low masonry walls and chain link
fencing along both the south and west property lines.
Approximately 345 surface parking spaces are provided, including five covered parking spaces
located to the east of Building 1. The overall parking ratio is less than one space per 1,000 square
feet of building area. The parking meets legal (326 spaces) and practical requirements for industrial
uses.
MONTANDON FARLEY VALUATION SERVICES 28
Building Plan – 4555 East Elwood Street (Building 1)
MONTANDON FARLEY VALUATION SERVICES 29
Floor Plan – 4555 E. Elwood Street
Suite 111 – DHL
MONTANDON FARLEY VALUATION SERVICES 30
Building Plan – 4535 East Elwood Street (Building 2)
MONTANDON FARLEY VALUATION SERVICES 31
Floor Plan – 4535 E. Elwood Street
Suite 101 – Redi-Carpet Office Area
MONTANDON FARLEY VALUATION SERVICES 32
Floor Plan – 4535 East Elwood Street
Suite 105 – Vacant
MONTANDON FARLEY VALUATION SERVICES 33
Floor Plan – 4535 E. Elwood Street
Suite 106 – Vacant
MONTANDON FARLEY VALUATION SERVICES 34
Building Plan – 4445 East Elwood Street (Building 3)
MONTANDON FARLEY VALUATION SERVICES 35
Floor Plan – 4445 E. Elwood Street
Suite 107 – J & K Cabinetry Kitchen Bath
MONTANDON FARLEY VALUATION SERVICES 36
Floor Plan – 4445 E. Elwood Street
Suite 101 – Vacant (office area to be demolished)
MONTANDON FARLEY VALUATION SERVICES 37
Building Plan – 4425 East Elwood Street
MONTANDON FARLEY VALUATION SERVICES 38
Floor Plan - Suite 104
Clariant
MONTANDON FARLEY VALUATION SERVICES 39
Floor Plan – 4525 E. Elwood Street
Suite 107 – Clariant (Currently Unoccupied)
MONTANDON FARLEY VALUATION SERVICES 40
A brief description of the building construction materials is included below. Foundation: Continuous, reinforced concrete footings Floors: Concrete slab over A.B.C. fill Floor Coverings: Commercial carpet, ceramic tile, vinyl composition tile and exposed
concrete Exterior Walls: Concrete tilt panels with aluminum storefront window and entry
systems; 20 to 28-foot building clear heights Interior Walls: Gypsum board on metal studs with taped, textured and painted finish Roof: Built-up cover over plywood deck; skylights in warehouse area Lighting: Suspended and recessed fluorescent; hi-bay lighting in warehouse
areas Ceilings: Combination of lay-in acoustical panels in a suspended metal grid
system or exposed roof structure in the warehouse areas Doors: Tempered plate glass in aluminum frame main entry doors; hollow
Windows: Glass within aluminum window systems Heating/Cooling: Roof mounted package air conditioning units in office areas; roof
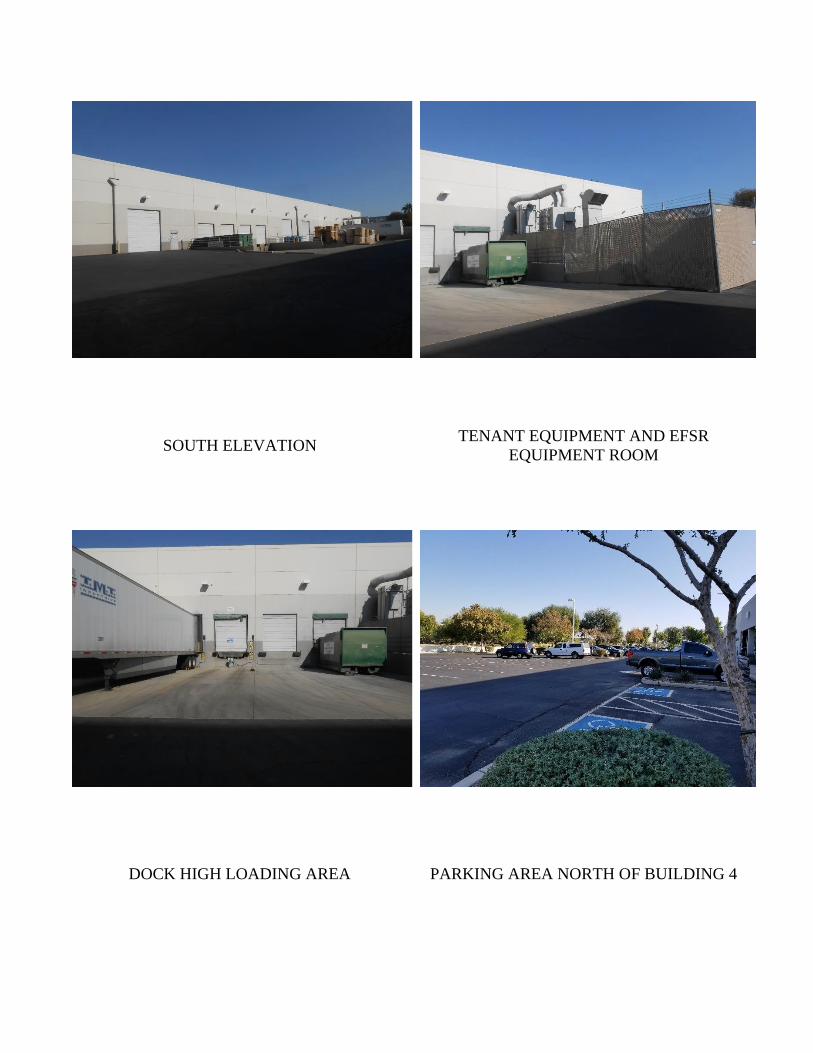
mounted evaporative cooling units in warehouse areas Fire Sprinklers: EFSR fire suppression system in Buildings 1-4; EFSR tank and
pump located at southeast end of Building 4 Miscellaneous: Loading docks with sealers located at north half of 4445 E. Elwood
Street building, load levelers are located at docks throughout the project
Personal Property: Our value herein does not include furniture, fixtures and equipment
associated with current tenancy. This includes kitchen buildouts in the showroom of the J & K space (Building 3 Suite 107), and machinery, conduit and safety railing associated with operations in the Clarion space (Suite 104 of Building 4).
MONTANDON FARLEY VALUATION SERVICES 41
Except for roofing in the areas of planned demolition, which were adversely affected by asbestos
abatement in the past causing leaks, the roofs are reported to be in good condition. During our site
visit we noted water dripping from the northeast corner of the warehouse ceiling in Suite 106 of
Building 2 and noted some cracking in asphalt pavement in several along the southern driveways
and parking. The planned reconfiguration will eliminate the roof leaks at the southern end of
Buildings 1, 2 and 3 as well as provide new driveways along the southern portion of the buildings.
We have concluded that the cost to correct minor maintenance/repair issues that remain after
reconfiguration could be covered in the normal annual operating budget for the property. In
summary, the improvements are in good condition with no significant deferred maintenance
expected upon completion of reconstruction of the southern portion of buildings planned for
reconfiguration.
Based on the information available to us, it is our opinion the improvements are a legal
conforming use of the site.
We have estimated the average effective age of the improvements at 17 years and their remaining
economic life at 28 years. The layout of the project is efficient, allows tenant flexibility, and there
is sufficient onsite parking.
Environmental Assessment
We have not had the benefit of a Phase 1 environmental report and are unqualified to conduct
this type of study. Our inspection of the property did not reveal any obvious potential hazards.
We have assumed for the purposes of this report that the property is free of any environmental
hazards that may exceed EPA standards or could have an adverse impact on the value of the real
estate.
Americans with Disabilities Act
The landmark Americans with Disabilities Act (ADA) enacted on July 26, 1990, provides
comprehensive civil rights protection to individuals with disabilities in the areas of employment,
public accommodations, state and local government services and telecommunications. The
ADA generally became effective on January 26, 1992 and affects public accommodations such
parks, private schools and day care centers. Private clubs and religious organizations are exempt.
There are three basic areas to the act including: employment, public accommodations and
transportation.
The subject was constructed after the enactment of ADA; therefore, the building must comply
with the Americans with Disabilities Act of January 1990. We have assumed for the purposes
of this report that the project is in compliance with ADA standards. If an independent study
indicates that there are major violations of the act that could affect the value of the property, we
reserve the right to amend our final conclusion.
MONTANDON FARLEY VALUATION SERVICES 42
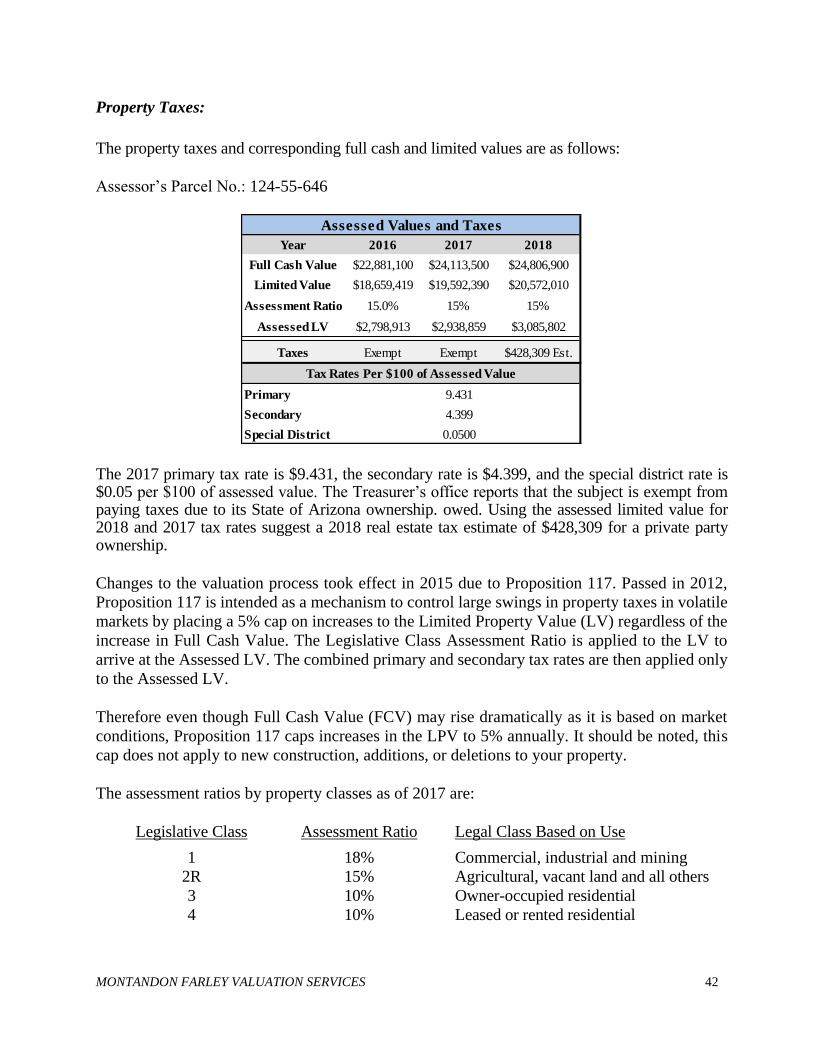
Property Taxes:
The property taxes and corresponding full cash and limited values are as follows:
Assessor’s Parcel No.: 124-55-646
The 2017 primary tax rate is $9.431, the secondary rate is $4.399, and the special district rate is $0.05 per $100 of assessed value. The Treasurer’s office reports that the subject is exempt from paying taxes due to its State of Arizona ownership. owed. Using the assessed limited value for 2018 and 2017 tax rates suggest a 2018 real estate tax estimate of $428,309 for a private party ownership.
Changes to the valuation process took effect in 2015 due to Proposition 117. Passed in 2012,
Proposition 117 is intended as a mechanism to control large swings in property taxes in volatile
markets by placing a 5% cap on increases to the Limited Property Value (LV) regardless of the
increase in Full Cash Value. The Legislative Class Assessment Ratio is applied to the LV to
arrive at the Assessed LV. The combined primary and secondary tax rates are then applied only
to the Assessed LV.
Therefore even though Full Cash Value (FCV) may rise dramatically as it is based on market
conditions, Proposition 117 caps increases in the LPV to 5% annually. It should be noted, this
cap does not apply to new construction, additions, or deletions to your property.
The assessment ratios by property classes as of 2017 are:
Legislative Class Assessment Ratio Legal Class Based on Use
1 18% Commercial, industrial and mining
2R 15% Agricultural, vacant land and all others
3 10% Owner-occupied residential
4 10% Leased or rented residential
Year 2016 2017 2018
Full Cash Value $22,881,100 $24,113,500 $24,806,900
Limited Value $18,659,419 $19,592,390 $20,572,010
Assessment Ratio 15.0% 15% 15%
Assessed LV $2,798,913 $2,938,859 $3,085,802
Taxes Exempt Exempt $428,309 Est.
Primary 9.431
Secondary 4.399
Special District 0.0500
Assessed Values and Taxes
Tax Rates Per $100 of Assessed Value
MONTANDON FARLEY VALUATION SERVICES 43
HIGHEST AND BEST USE
In the most recent edition of The Appraisal of Real Estate, the Appraisal Institute, defines
highest and best use as:
The reasonably probable and legal use of vacant land or an improved property,
which is physically possible, appropriately supported, financially feasible, and
that results in the highest value.
To estimate highest and best use, four elements are considered:
1. Legally Permissible - Of the possible uses, which uses are permitted by
zoning and deed restrictions?
2. Physically Possible - What uses are physically possible?
3. Financially Feasible - Which possible and permissible uses will produce a
net return to the owner of the site?
4. Maximally Productive - Among the feasible uses, which use will produce
the highest net return or the highest present value?
The highest and best use must be legal and probable, not speculative or conjectural. A demand
for the use must exist and it must yield the highest net return to the land for the longest period.
The highest and best use of the land as if vacant and available for use may be different from the
highest and best use of the improved property. This may be true when the improvement is not
an appropriate use, but it makes a contribution to the total property value in excess of the value
of the site. Therefore, to arrive at an estimate of highest and best use, the subject was analyzed
1) as though the site were vacant and available for development, and 2) as presently improved.
MONTANDON FARLEY VALUATION SERVICES 44
As If Vacant
Legally Permissible
The sites’ legally permissible uses are governed by the city of Phoenix A-1 and CP/GCP zoning classifications. This classification allows a mixture of industrial uses, including commerce, service and employment activities. The General Commerce Park Option allows a broad range of manufacturing, warehousing, distribution and support retail sales/services. We are unaware of any unusual easements or restrictions that could impact the value of the property. Physically Possible
The subject site has frontage on Elwood Street and abuts the Maricopa Freeway (Interstate 10). It contains 926,979 square feet, or 21.28 acres. All public utilities are available to the site, it is accessible from arterial streets and is developable from a terrain standpoint. Virtually any urban improvement is physically possible on the site, limited only by size. Financially Feasible/ Maximally Productive
The property is located in an established industrial corridor that is bisected by Interstate 10 and is just south of Sky Harbor Airport. The subject’s zoning, proximity to major transportation routes and location in an established industrial area indicate that industrial development is the most likely use of the property. Rents have are generally below the levels necessary to economically support new speculative office development although some build-to-suite office use may be possible. The industrial sector in the subject area is stable with positive absorption and declining vacancy. Rents have approached the levels necessary to economically support some new speculative development. However, larger projects typically require some anchor tenant commitment. In light of the preceding, it is our opinion that the highest and best use of the property as if vacant is for industrial development upon securing a large tenant commitment.
As Improved
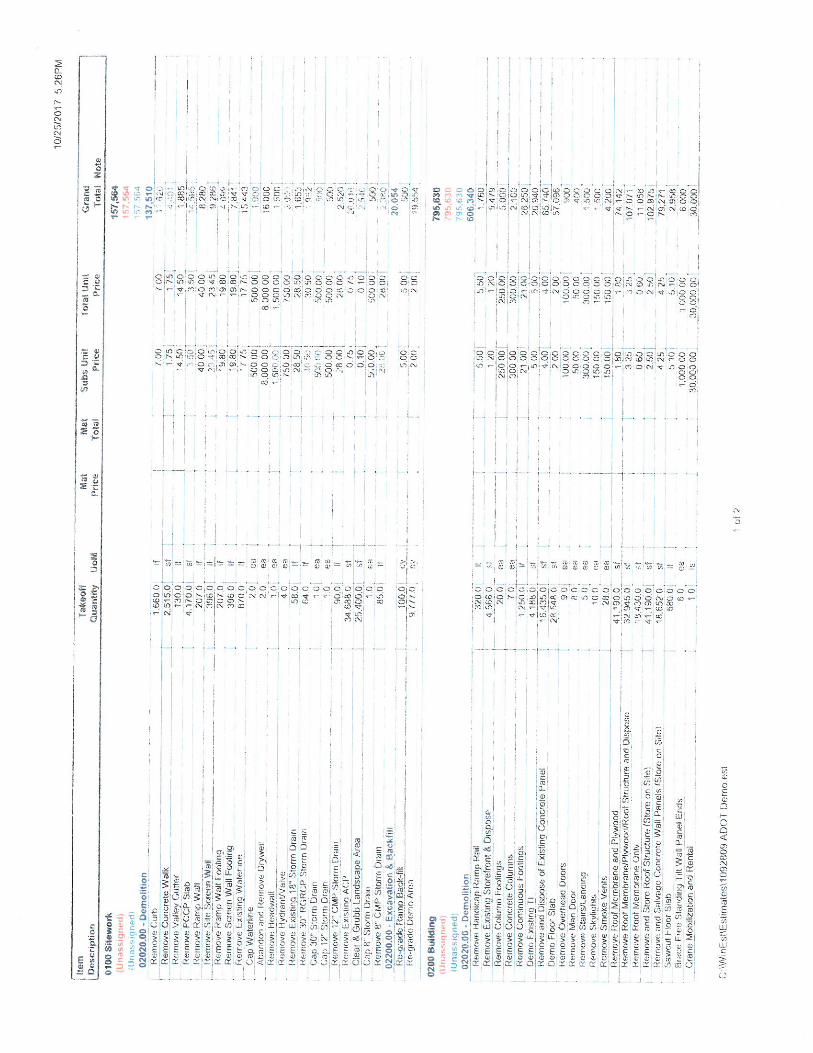
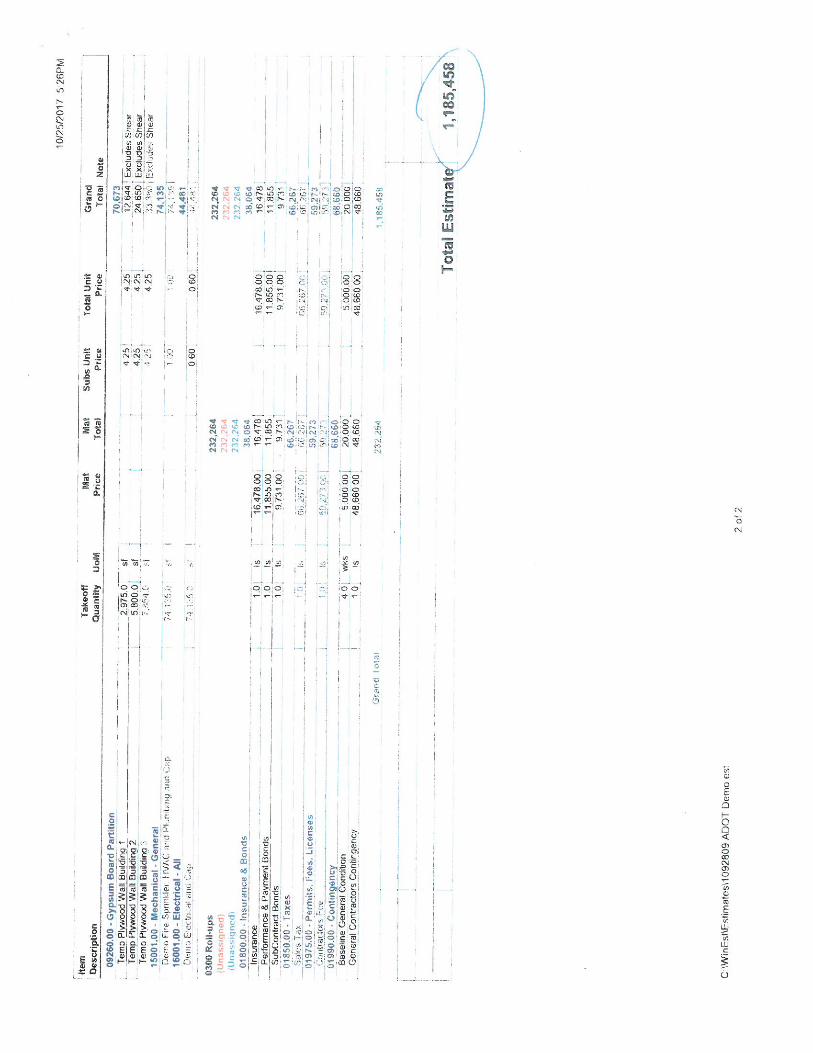
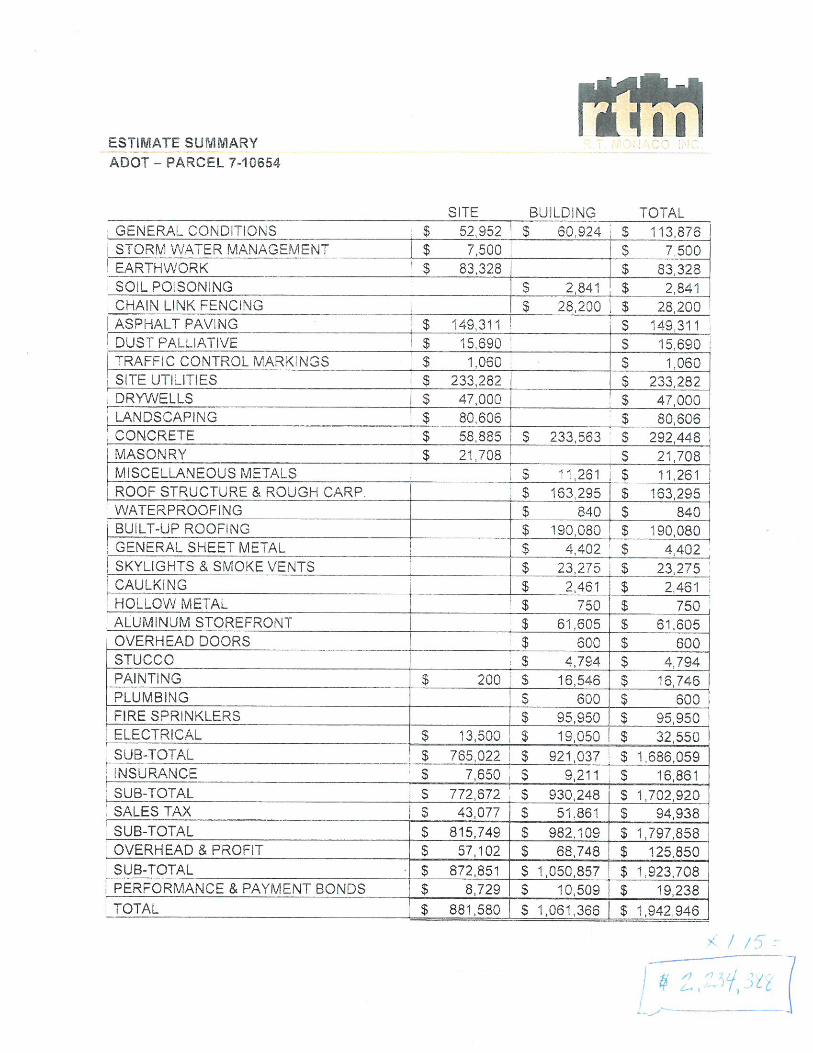
The site is currently improved with a five-building industrial complex which contains a total building area of 388,474 square feet. However, fire lane and setback requirements due to new right of way lines for freeway expansion obligate the subject to demolish approximately 50 to 60 feet the southern portion of Buildings 1, 2 and 3. After reconstruction of exposed area the building area and reconfiguration of parking, drainage and driveway along the south property line at a cost estimated herein of $3,200,000 the subject will have a rentable total building area of 353,711 square feet. The value of the property with the project in place greatly exceeds the cost to cure and value of the land only. In our opinion, the existing industrial development is the highest and best use of the property “as improved”.
MONTANDON FARLEY VALUATION SERVICES 45
VALUE AS IF RECONSTRUCTED TO ACCOMMODATE RIGHT
OF WAY & AT STABILIZED OCCUPANCY
Appraisal Process Methodology:
In order to arrive at an “as is” value for the subject we have first valued the subject under the
hypothetical condition that areas affected by the acquisition have had reconstruction completed
as of the effective date of this report and that the subject has been filled up to stabilized
occupancy projected herein. Later in this report costs to reconfigure the buildings and construct
new fire lanes, parking and driveway to accommodate setback related to the new right of way
for freeway expansion are deducted from our value as if complete value along with deductions
for fill-up costs to achieve stabilized occupancy. These deductions which included a profit
allowance provide the basis of our “as is” value conclusion later in this report.
The following section of this report assumes the subject has had all demolition and
reconstruction work complete to accommodate right of way for freeway expansion.
MONTANDON FARLEY VALUATION SERVICES 46
VALUATION APPROACHES
The estimation of a real property’s market value involves a systematic process in which the
problem is defined; the work necessary to solve the problem is planned; and the data required is
acquired, classified, analyzed and interpreted into an estimate of value. In this process, three
basic approaches, when applicable, are used by the appraisers: the Cost, Sales Comparison and
Income Approaches. The value estimates, as indicated by the direct approaches, are then
reconciled into a final estimate, of the property’s value based on the appropriateness of each
approach, the accuracy of the data and the quantity and the quality of the evidence. When one or
more of these approaches is not applicable in the appraisal process, justification is presented.
COST APPROACH
The Cost Approach is based on the premise that the value of a property can be derived by adding
the estimated value of the land to the current cost of constructing a reproduction or replacement
for the improvements and then subtracting the amount of depreciation (i.e., deterioration and
obsolescence) in the structures from all causes.
LAND SALES COMPARISON APPROACH
Set forth on the following pages are the land comparables that have been considered in
estimating the “as is” market value of the site on a direct comparison basis. A summary and map
of the comparables follow the detailed data.
MONTANDON FARLEY VALUATION SERVICES 47
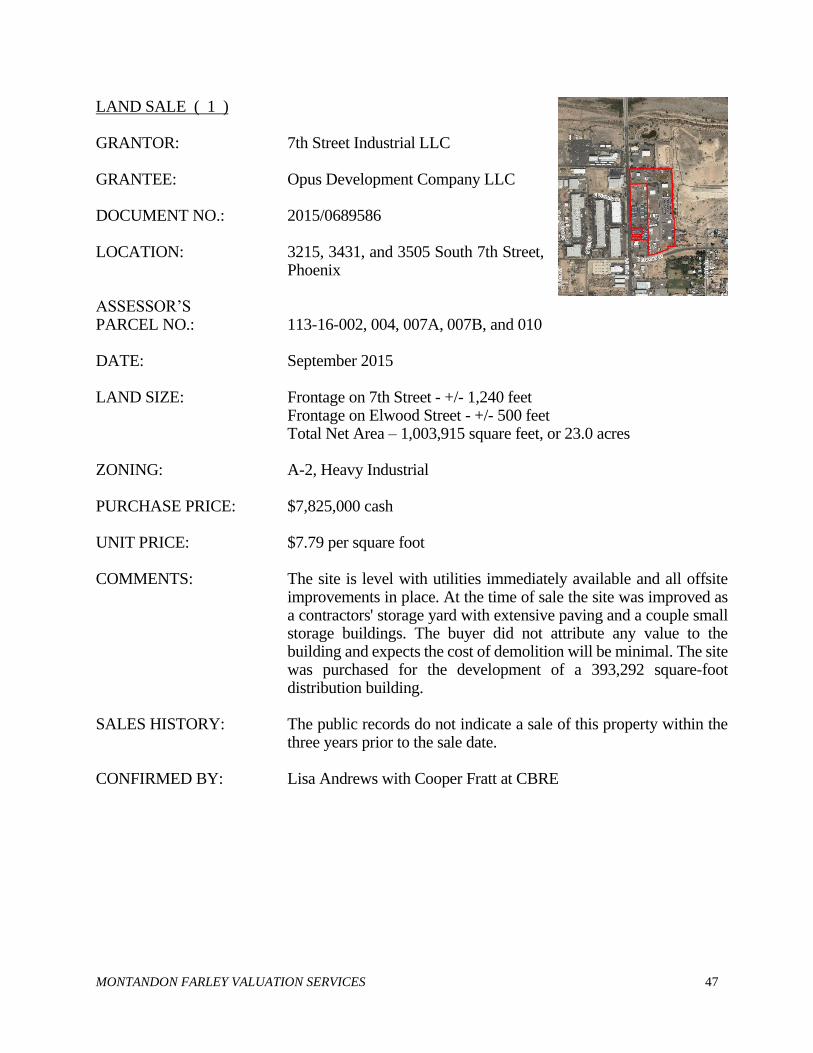
LAND SALE ( 1 ) GRANTOR: 7th Street Industrial LLC GRANTEE: Opus Development Company LLC DOCUMENT NO.: 2015/0689586 LOCATION: 3215, 3431, and 3505 South 7th Street,
Phoenix ASSESSOR’S PARCEL NO.: 113-16-002, 004, 007A, 007B, and 010 DATE: September 2015 LAND SIZE: Frontage on 7th Street - +/- 1,240 feet Frontage on Elwood Street - +/- 500 feet Total Net Area – 1,003,915 square feet, or 23.0 acres ZONING: A-2, Heavy Industrial PURCHASE PRICE: $7,825,000 cash UNIT PRICE: $7.79 per square foot COMMENTS: The site is level with utilities immediately available and all offsite
improvements in place. At the time of sale the site was improved as a contractors' storage yard with extensive paving and a couple small storage buildings. The buyer did not attribute any value to the building and expects the cost of demolition will be minimal. The site was purchased for the development of a 393,292 square-foot distribution building.
SALES HISTORY: The public records do not indicate a sale of this property within the
three years prior to the sale date. CONFIRMED BY: Lisa Andrews with Cooper Fratt at CBRE
MONTANDON FARLEY VALUATION SERVICES 48
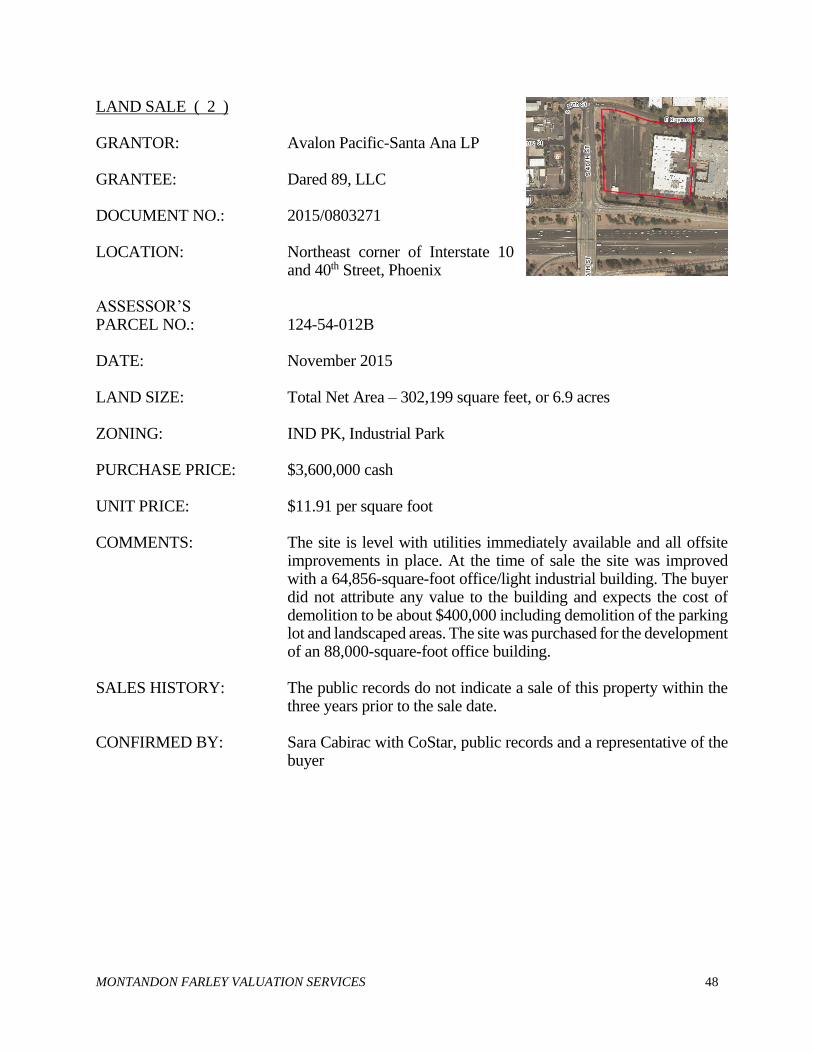
LAND SALE ( 2 ) GRANTOR: Avalon Pacific-Santa Ana LP GRANTEE: Dared 89, LLC DOCUMENT NO.: 2015/0803271 LOCATION: Northeast corner of Interstate 10
and 40th Street, Phoenix ASSESSOR’S PARCEL NO.: 124-54-012B DATE: November 2015 LAND SIZE: Total Net Area – 302,199 square feet, or 6.9 acres ZONING: IND PK, Industrial Park PURCHASE PRICE: $3,600,000 cash UNIT PRICE: $11.91 per square foot COMMENTS: The site is level with utilities immediately available and all offsite
improvements in place. At the time of sale the site was improved with a 64,856-square-foot office/light industrial building. The buyer did not attribute any value to the building and expects the cost of demolition to be about $400,000 including demolition of the parking lot and landscaped areas. The site was purchased for the development of an 88,000-square-foot office building.
SALES HISTORY: The public records do not indicate a sale of this property within the
three years prior to the sale date. CONFIRMED BY: Sara Cabirac with CoStar, public records and a representative of the
buyer
MONTANDON FARLEY VALUATION SERVICES 49
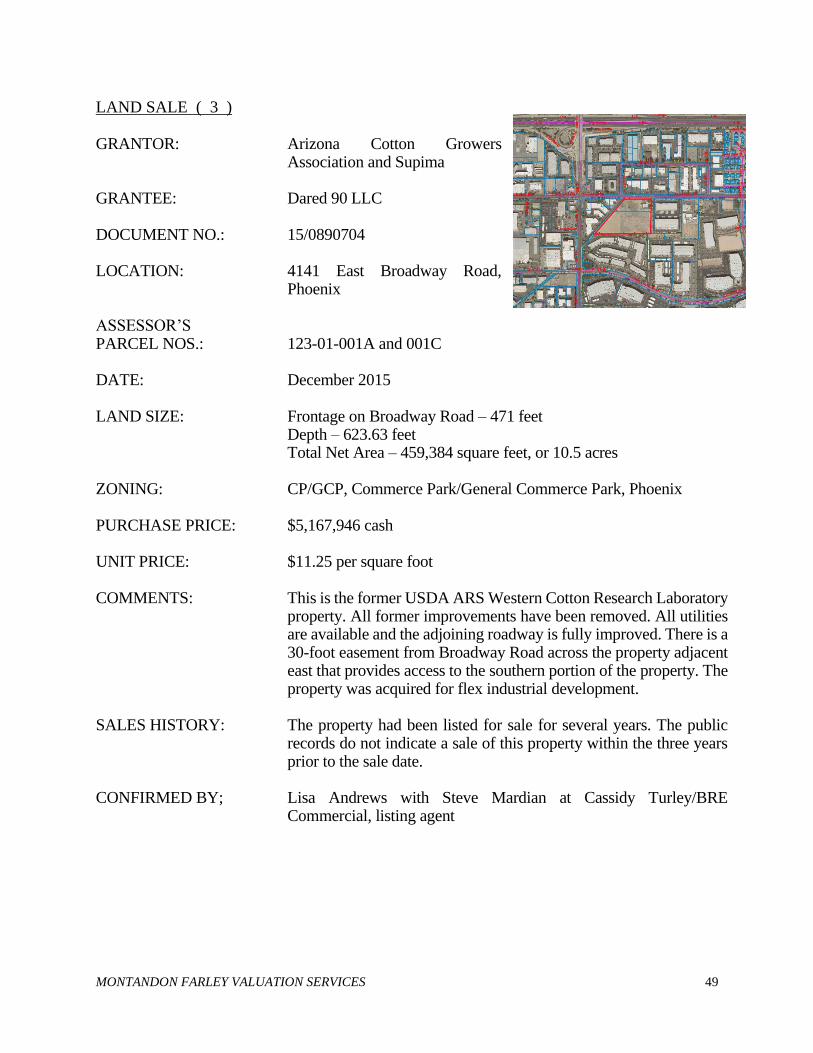
LAND SALE ( 3 ) GRANTOR: Arizona Cotton Growers
Association and Supima GRANTEE: Dared 90 LLC DOCUMENT NO.: 15/0890704 LOCATION: 4141 East Broadway Road,
Phoenix ASSESSOR’S PARCEL NOS.: 123-01-001A and 001C DATE: December 2015 LAND SIZE: Frontage on Broadway Road – 471 feet Depth – 623.63 feet Total Net Area – 459,384 square feet, or 10.5 acres ZONING: CP/GCP, Commerce Park/General Commerce Park, Phoenix PURCHASE PRICE: $5,167,946 cash UNIT PRICE: $11.25 per square foot COMMENTS: This is the former USDA ARS Western Cotton Research Laboratory
property. All former improvements have been removed. All utilities are available and the adjoining roadway is fully improved. There is a 30-foot easement from Broadway Road across the property adjacent east that provides access to the southern portion of the property. The property was acquired for flex industrial development.
SALES HISTORY: The property had been listed for sale for several years. The public
records do not indicate a sale of this property within the three years prior to the sale date.
CONFIRMED BY; Lisa Andrews with Steve Mardian at Cassidy Turley/BRE
Commercial, listing agent
MONTANDON FARLEY VALUATION SERVICES 50
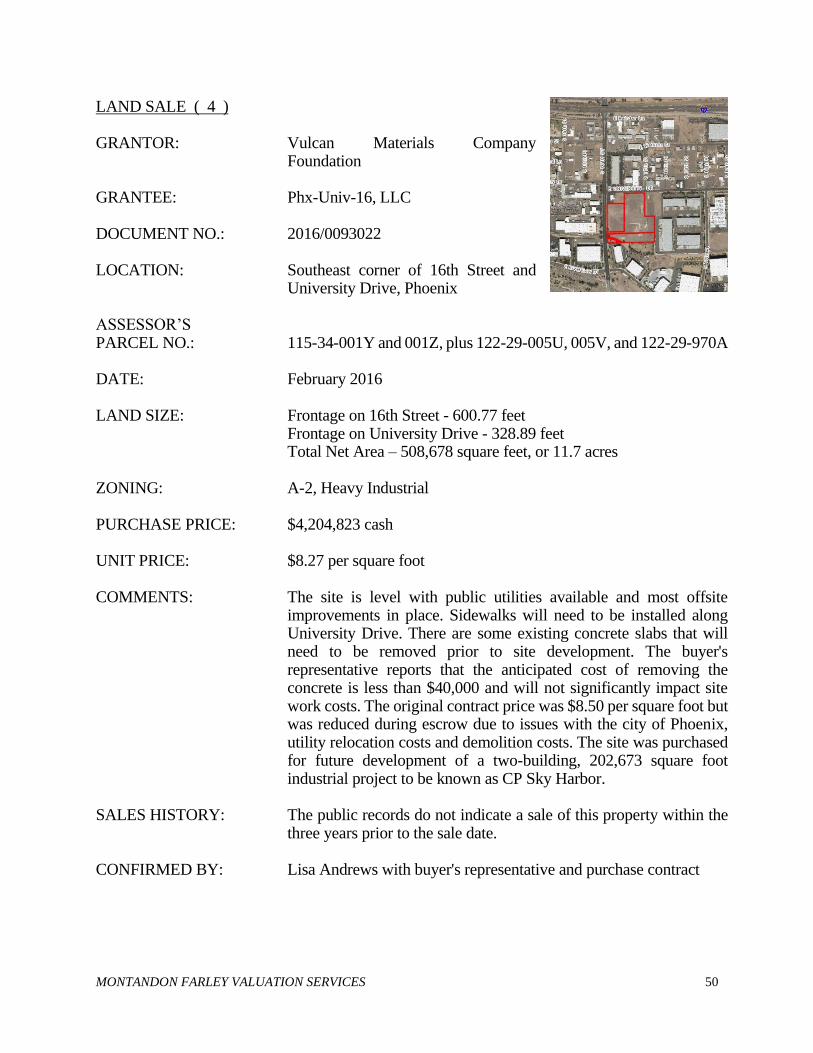
LAND SALE ( 4 ) GRANTOR: Vulcan Materials Company
Foundation GRANTEE: Phx-Univ-16, LLC DOCUMENT NO.: 2016/0093022 LOCATION: Southeast corner of 16th Street and
University Drive, Phoenix ASSESSOR’S PARCEL NO.: 115-34-001Y and 001Z, plus 122-29-005U, 005V, and 122-29-970A DATE: February 2016 LAND SIZE: Frontage on 16th Street - 600.77 feet Frontage on University Drive - 328.89 feet Total Net Area – 508,678 square feet, or 11.7 acres ZONING: A-2, Heavy Industrial PURCHASE PRICE: $4,204,823 cash UNIT PRICE: $8.27 per square foot COMMENTS: The site is level with public utilities available and most offsite
improvements in place. Sidewalks will need to be installed along University Drive. There are some existing concrete slabs that will need to be removed prior to site development. The buyer's representative reports that the anticipated cost of removing the concrete is less than $40,000 and will not significantly impact site work costs. The original contract price was $8.50 per square foot but was reduced during escrow due to issues with the city of Phoenix, utility relocation costs and demolition costs. The site was purchased for future development of a two-building, 202,673 square foot industrial project to be known as CP Sky Harbor.
SALES HISTORY: The public records do not indicate a sale of this property within the
three years prior to the sale date. CONFIRMED BY: Lisa Andrews with buyer's representative and purchase contract
MONTANDON FARLEY VALUATION SERVICES 51
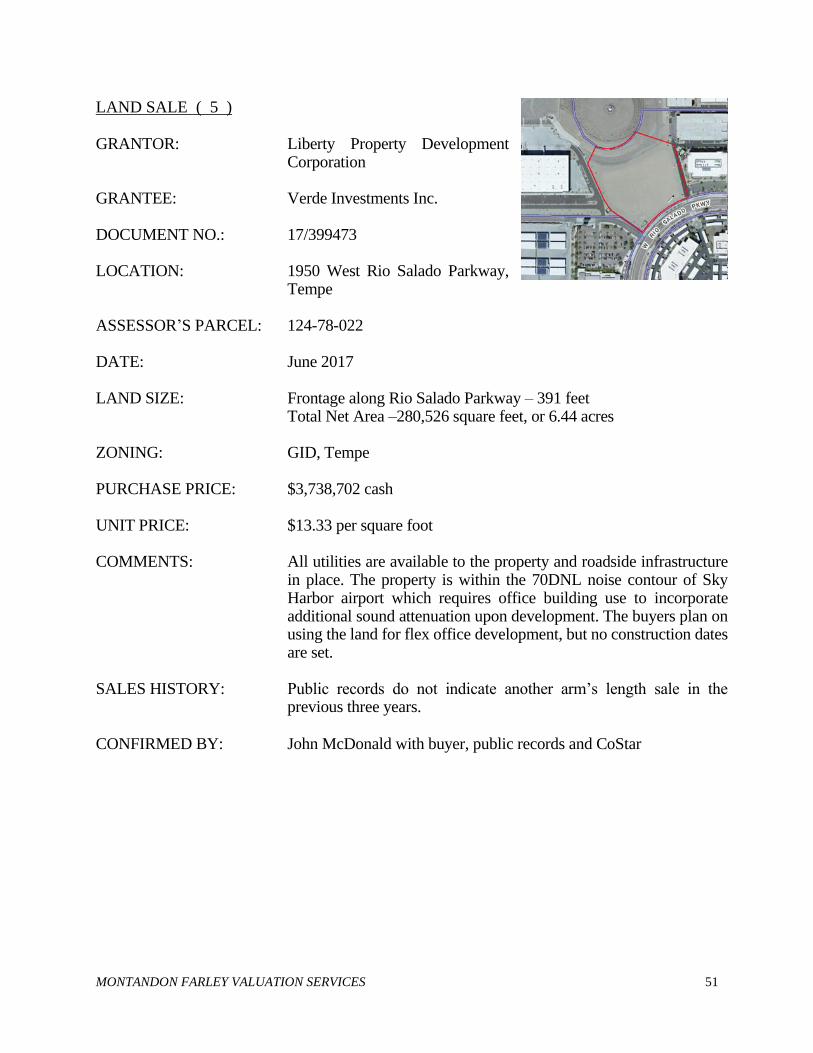
LAND SALE ( 5 ) GRANTOR: Liberty Property Development
Corporation GRANTEE: Verde Investments Inc. DOCUMENT NO.: 17/399473 LOCATION: 1950 West Rio Salado Parkway,
Tempe ASSESSOR’S PARCEL: 124-78-022 DATE: June 2017 LAND SIZE: Frontage along Rio Salado Parkway – 391 feet Total Net Area –280,526 square feet, or 6.44 acres ZONING: GID, Tempe PURCHASE PRICE: $3,738,702 cash UNIT PRICE: $13.33 per square foot COMMENTS: All utilities are available to the property and roadside infrastructure
in place. The property is within the 70DNL noise contour of Sky Harbor airport which requires office building use to incorporate additional sound attenuation upon development. The buyers plan on using the land for flex office development, but no construction dates are set.
SALES HISTORY: Public records do not indicate another arm’s length sale in the
previous three years. CONFIRMED BY: John McDonald with buyer, public records and CoStar
MONTANDON FARLEY VALUATION SERVICES 52
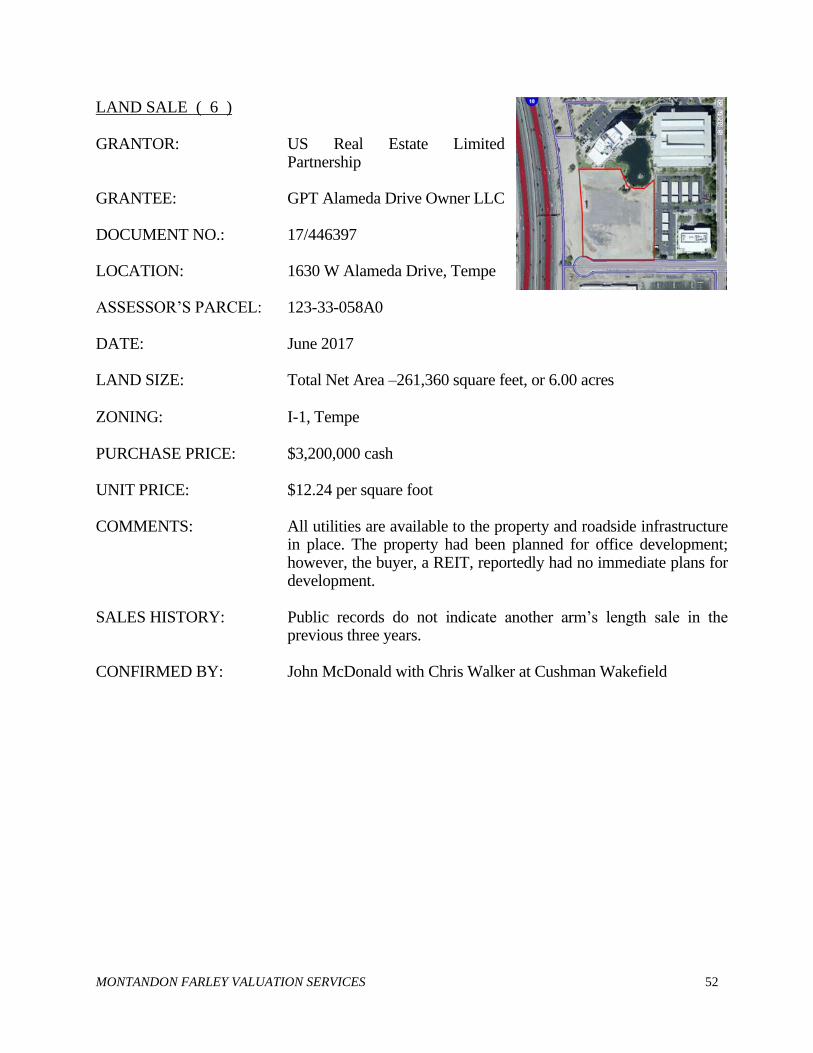
LAND SALE ( 6 ) GRANTOR: US Real Estate Limited
Partnership GRANTEE: GPT Alameda Drive Owner LLC DOCUMENT NO.: 17/446397 LOCATION: 1630 W Alameda Drive, Tempe ASSESSOR’S PARCEL: 123-33-058A0 DATE: June 2017 LAND SIZE: Total Net Area –261,360 square feet, or 6.00 acres ZONING: I-1, Tempe PURCHASE PRICE: $3,200,000 cash UNIT PRICE: $12.24 per square foot COMMENTS: All utilities are available to the property and roadside infrastructure
in place. The property had been planned for office development; however, the buyer, a REIT, reportedly had no immediate plans for development.
SALES HISTORY: Public records do not indicate another arm’s length sale in the
previous three years. CONFIRMED BY: John McDonald with Chris Walker at Cushman Wakefield
MONTANDON FARLEY VALUATION SERVICES 53
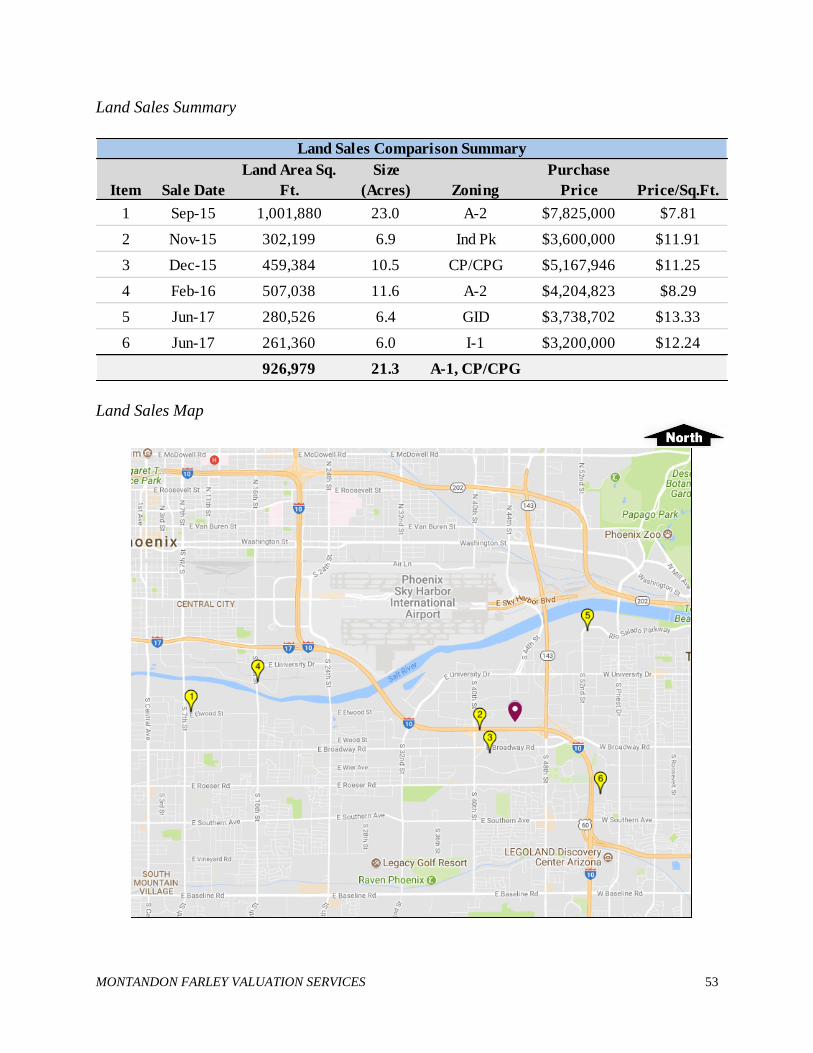
Land Sales Summary
Item Sale Date
Land Area Sq.
Ft.
Size
(Acres) Zoning
Purchase
Price Price/Sq.Ft.
1 Sep-15 1,001,880 23.0 A-2 $7,825,000 $7.81
2 Nov-15 302,199 6.9 Ind Pk $3,600,000 $11.91
3 Dec-15 459,384 10.5 CP/CPG $5,167,946 $11.25
4 Feb-16 507,038 11.6 A-2 $4,204,823 $8.29
5 Jun-17 280,526 6.4 GID $3,738,702 $13.33
6 Jun-17 261,360 6.0 I-1 $3,200,000 $12.24
926,979 21.3 A-1, CP/CPG
Land Sales Comparison Summary
Land Sales Map
MONTANDON FARLEY VALUATION SERVICES 54
Adjustment Analysis
The unit of comparison used in this approach is the price-per-square-foot-of-land-area. The sales have been compared to the subject property with respect to the following items. 1) Property Rights Conveyed 2) Financing (Cash Equivalency) 3) Conditions of Sale 4) Expenditures made immediately after purchase 5) Market Conditions (Time) 6) Location 7) Physical Characteristics 8) Economic Characteristics 9) Use (Zoning) A grid illustrating the adjustments to the individual sales follows the discussion. Property Rights Conveyed
The interest being valued in this section of the report is that of the fee simple estate. None of the sales involve ground leases; therefore, no adjustments are necessary. Financing
The sales were cash transactions and do not require adjustment for comparison purposes. Conditions of Sale
Adjustments for conditions of sale are made when the buyer or seller had atypical motivations. In our opinion, no adjustments to the sales are deemed necessary. Expenditures Made Immediately After Purchase Sale 2 was improved with an existing office/light industrial building that the buyer planned to demolish at a projected cost of about $400,000 or a rounded 10% of its value. We have adjusted the comparison upward for this factor. No other adjustments are necessary. Market Conditions
The sales comparisons have occurred over the past two and one-quarter years. Our discussions with industrial brokers familiar with the subject area report that property values have been increased since late 2015 but have remained relatively stable over the past nine months. We have adjusted Sales 1 through 4 upward for improved market conditions since their late 2015 and early 2016 sale dates.
MONTANDON FARLEY VALUATION SERVICES 55
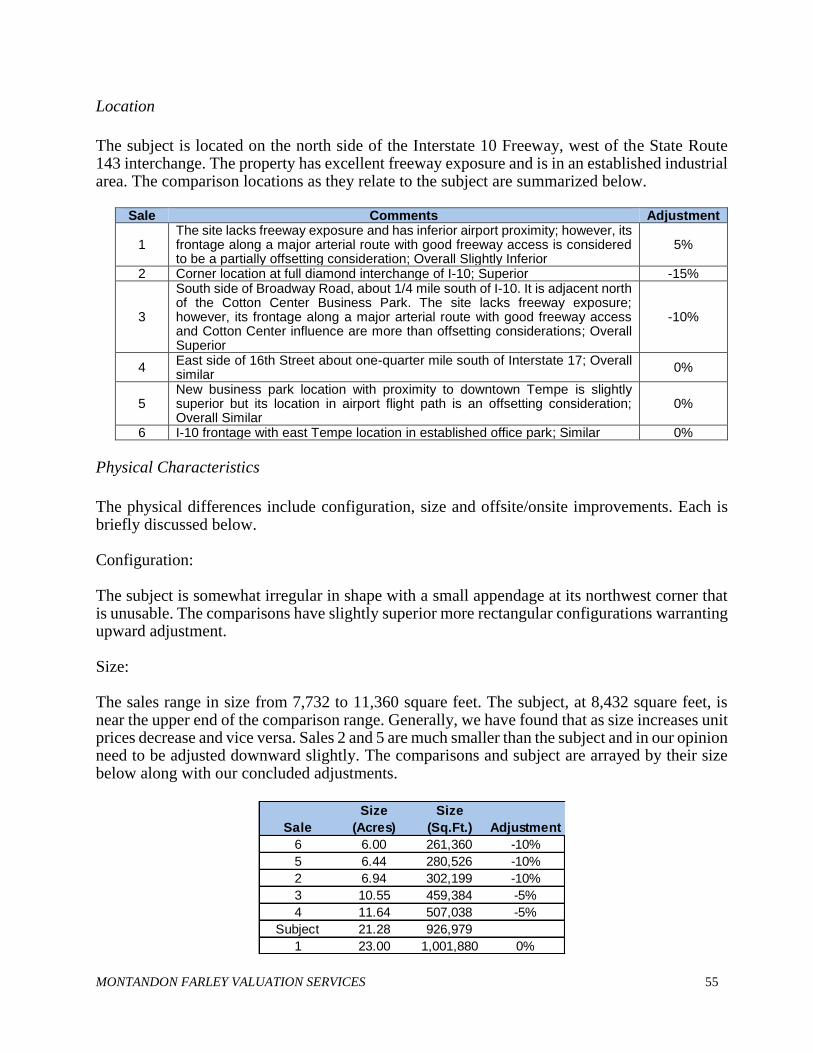
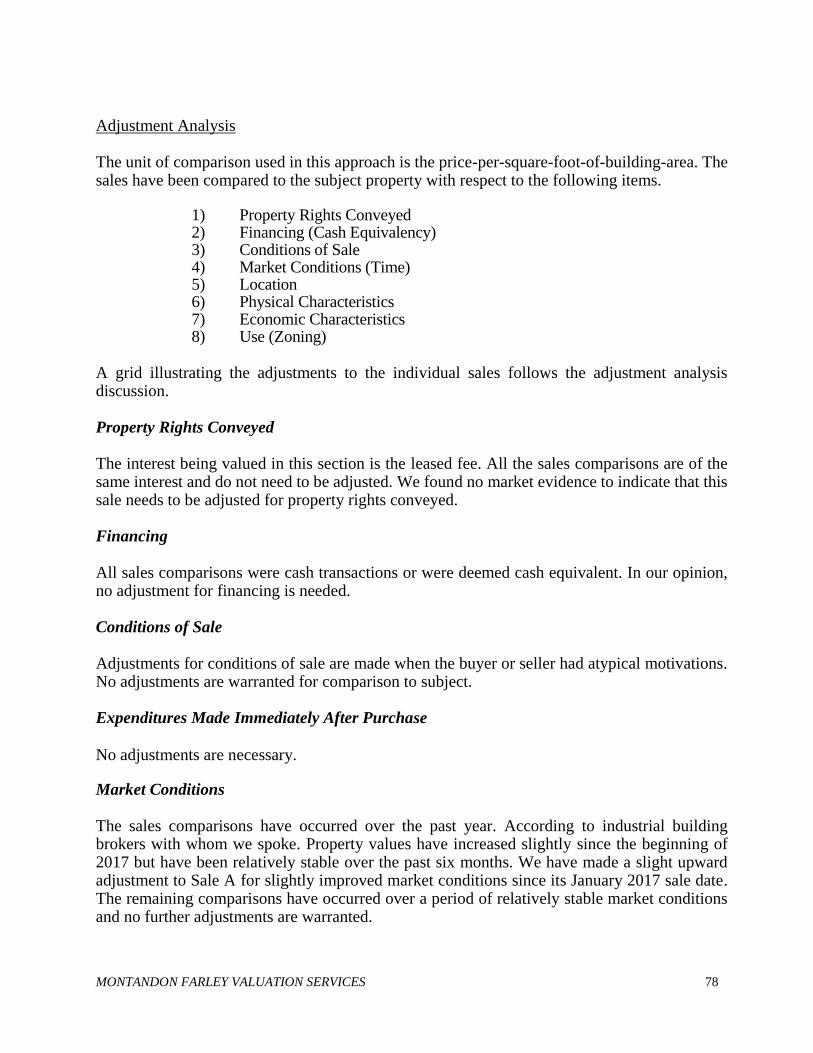
Location
The subject is located on the north side of the Interstate 10 Freeway, west of the State Route 143 interchange. The property has excellent freeway exposure and is in an established industrial area. The comparison locations as they relate to the subject are summarized below.
Sale Comments Adjustment
1 The site lacks freeway exposure and has inferior airport proximity; however, its frontage along a major arterial route with good freeway access is considered to be a partially offsetting consideration; Overall Slightly Inferior
5%
2 Corner location at full diamond interchange of I-10; Superior -15%
3
South side of Broadway Road, about 1/4 mile south of I-10. It is adjacent north of the Cotton Center Business Park. The site lacks freeway exposure; however, its frontage along a major arterial route with good freeway access and Cotton Center influence are more than offsetting considerations; Overall Superior
-10%
4 East side of 16th Street about one-quarter mile south of Interstate 17; Overall similar
0%
5 New business park location with proximity to downtown Tempe is slightly superior but its location in airport flight path is an offsetting consideration; Overall Similar
0%
6 I-10 frontage with east Tempe location in established office park; Similar 0%
Physical Characteristics
The physical differences include configuration, size and offsite/onsite improvements. Each is briefly discussed below. Configuration: The subject is somewhat irregular in shape with a small appendage at its northwest corner that is unusable. The comparisons have slightly superior more rectangular configurations warranting upward adjustment. Size: The sales range in size from 7,732 to 11,360 square feet. The subject, at 8,432 square feet, is near the upper end of the comparison range. Generally, we have found that as size increases unit prices decrease and vice versa. Sales 2 and 5 are much smaller than the subject and in our opinion need to be adjusted downward slightly. The comparisons and subject are arrayed by their size below along with our concluded adjustments.
Sale
Size
(Acres)
Size
(Sq.Ft.) Adjustment
6 6.00 261,360 -10%
5 6.44 280,526 -10%
2 6.94 302,199 -10%
3 10.55 459,384 -5%
4 11.64 507,038 -5%
Subject 21.28 926,979
1 23.00 1,001,880 0%
MONTANDON FARLEY VALUATION SERVICES 56
Offsite/Onsite improvements:
The subject has all utilities to the site and all roadside infrastructure in place. Except for Sale 4
all the comparisons are similar with utilities and roadside infrastructure in place. Sale 4 will
require the installation of concrete sidewalks along its University Drive frontage (335± feet). In
addition, there are some existing concrete slabs on the site that must be removed although the
buyer representative reported that the cost of removal was less than $40,000 and didn’t
significantly impact the site development costs. Upward adjustments for the on and offsite costs
associated with Sales 4 warrant upward adjustment.
Economic Characteristics
No adjustments are deemed necessary for economic characteristics.
Use (Zoning)
No adjustments are deemed necessary for use potential.
MONTANDON FARLEY VALUATION SERVICES 57
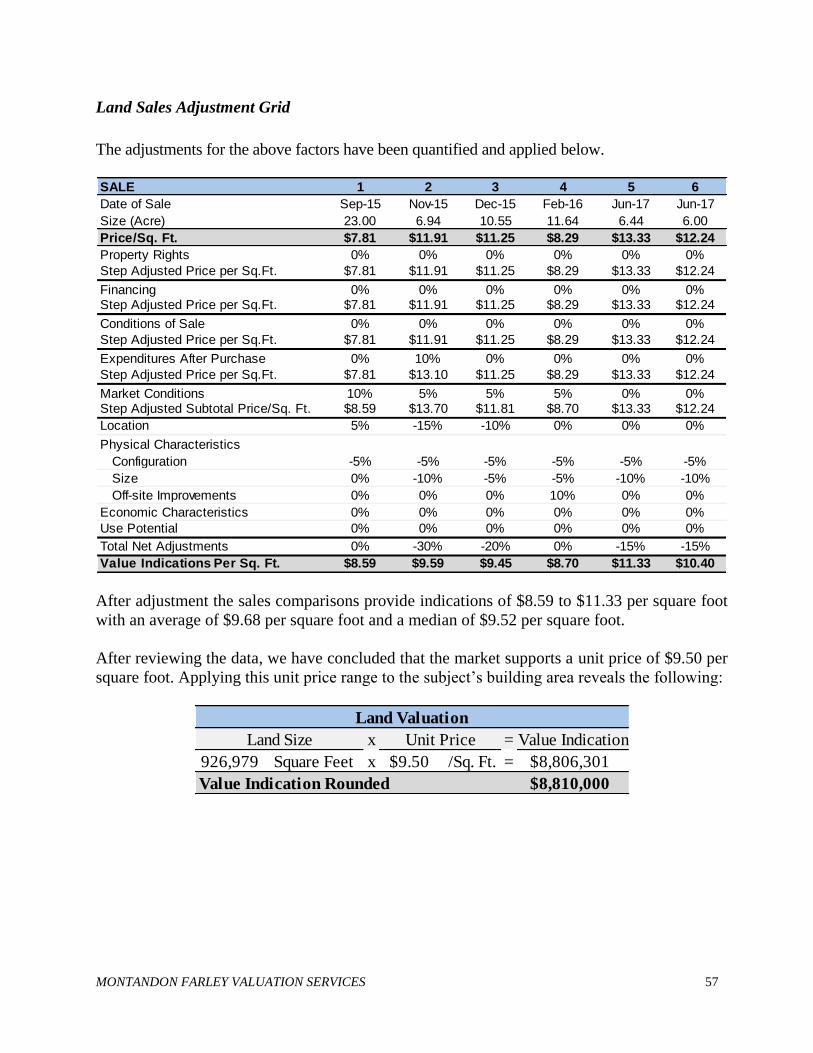
Land Sales Adjustment Grid
The adjustments for the above factors have been quantified and applied below.
SALE 1 2 3 4 5 6
Date of Sale Sep-15 Nov-15 Dec-15 Feb-16 Jun-17 Jun-17
Size (Acre) 23.00 6.94 10.55 11.64 6.44 6.00
Price/Sq. Ft. $7.81 $11.91 $11.25 $8.29 $13.33 $12.24
Value Indications Per Sq. Ft. $8.59 $9.59 $9.45 $8.70 $11.33 $10.40 After adjustment the sales comparisons provide indications of $8.59 to $11.33 per square foot
with an average of $9.68 per square foot and a median of $9.52 per square foot.
After reviewing the data, we have concluded that the market supports a unit price of $9.50 per
square foot. Applying this unit price range to the subject’s building area reveals the following:
x = Value Indication
926,979 Square Feet x $9.50 /Sq. Ft. = $8,806,301
Value Indication Rounded $8,810,000
Unit Price
Land Valuation
Land Size
MONTANDON FARLEY VALUATION SERVICES 58
Replacement Cost of the Improvements Replacement cost1 is defined as: The estimated cost to construct, at current prices as of the effective appraisal date, a
substitute for the building being appraised, using modern materials and current standards, design, and layout.
Direct Costs In order to estimate the reasonableness of the developer’s costs budget and to estimate the cost new of the proposed subject improvements, we have considered the Marshall Valuation Service cost manual, published by Marshall & Swift, which is an authoritative construction cost publication commonly used by cost estimators and real estate appraisers. Cost estimates within this publication are averages of final costs, including architect fees, contractor’s overhead and profit, (sales tax, permit fees, insurance during construction, interest on interim construction financing, etc.) The estimated cost of the building, using this source, is discussed next. In order estimate a direct cost estimate we have considered several recent cost comparisons. Two specific comparisons are discussed on the following page. Comparison No. 1: In early 2016 we reviewed the construction budget for a two-building 203,000-square-foot industrial project planned for an 11.6-acre site along the Interstate 10 corridor. The buildings will be of concrete tilt panel construction, have about 7% office build out and feature an interior clear height of 28 to 32 feet. There will be 61 dock high loading doors and 8 grade level doors. The interior was expected to include a modest amount of office area with the remaining space being evaporative cooled warehouse area. The direct cost of the improvements is budgeted at approximately $53.00 per square foot, including an average tenant improvement allowance of $10.89 per square foot. The buildings had a lesser amount of office build out than the subject warranting a slight upward adjustment. A higher direct cost is indicated for the subject. Comparison No. 2: We reviewed the construction budget for a two-building 215,000-square-foot industrial project that was constructed in late 2016 on a 14.5-acre site along the Interstate 10 corridor. The buildings are of concrete tilt panel construction and feature an interior clear height of 32 feet. They have 54 dock high loading doors and 8 grade level doors. The interior was expected to include a modest amount of office area with the remaining space being evaporative cooled warehouse area. The direct cost of the improvements was budgeted at approximately $58.50 per square foot, including a tenant improvement allowance of $12.50 per square foot.
1 The Dictionary of Real Estate Appraisal, Fifth Edition, Appraisal Institute, (Chicago, Illinois: 2010), p. 168.
MONTANDON FARLEY VALUATION SERVICES 59
The buildings had a slightly lesser percentage of office build out than the subject warranting a
slight upward adjustment. However, this comparison’s greater clear height is an offsetting
consideration.
We have also considered the Marshall Valuation Service cost manual, which is an authoritative
construction cost publication. Cost estimates within this publication are averages of final costs,
including architect fees, contractor’s overhead and profit, (sales tax, permit fees, insurance
during construction, interest on interim construction financing, etc.).
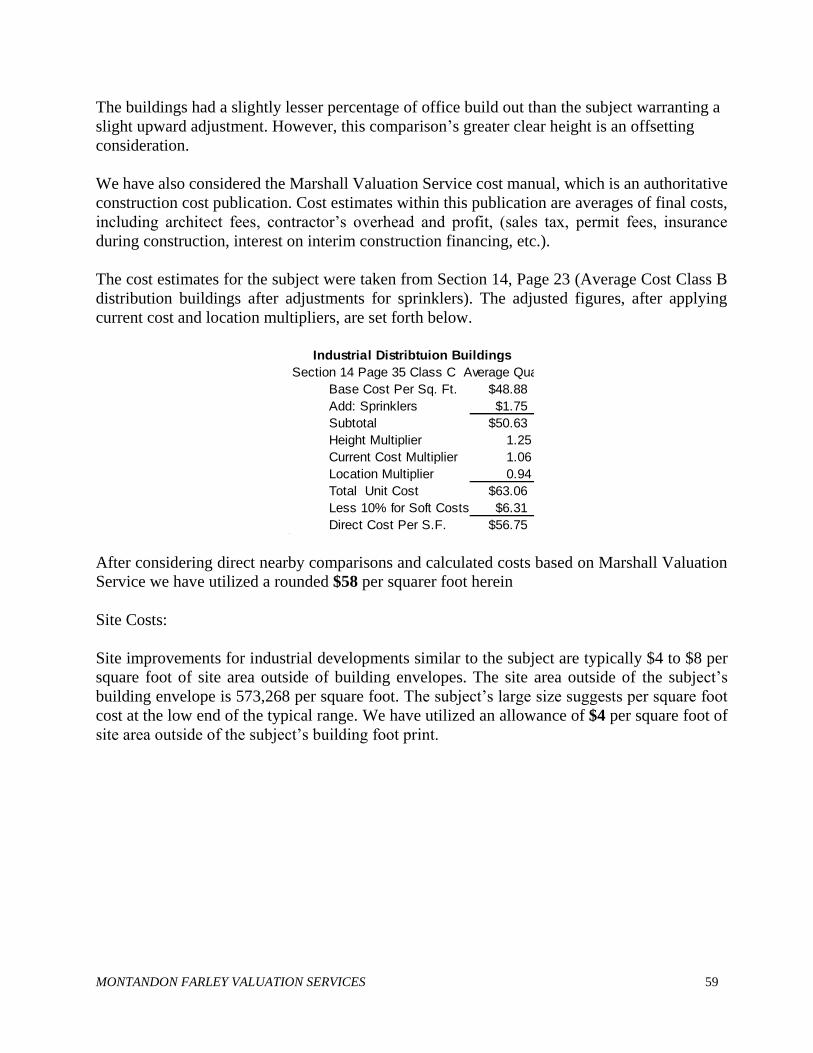
The cost estimates for the subject were taken from Section 14, Page 23 (Average Cost Class B
distribution buildings after adjustments for sprinklers). The adjusted figures, after applying
current cost and location multipliers, are set forth below.
Section 14 Page 35 Class C Average Quality
Base Cost Per Sq. Ft. $48.88
Add: Sprinklers $1.75
Subtotal $50.63
Height Multiplier 1.25
Current Cost Multiplier 1.06
Location Multiplier 0.94
Total Unit Cost $63.06
Less 10% for Soft Costs $6.31
Direct Cost Per S.F. $56.75
Industrial Distribtuion Buildings
After considering direct nearby comparisons and calculated costs based on Marshall Valuation
Service we have utilized a rounded $58 per squarer foot herein
Site Costs:
Site improvements for industrial developments similar to the subject are typically $4 to $8 per
square foot of site area outside of building envelopes. The site area outside of the subject’s
building envelope is 573,268 per square foot. The subject’s large size suggests per square foot
cost at the low end of the typical range. We have utilized an allowance of $4 per square foot of
site area outside of the subject’s building foot print.
MONTANDON FARLEY VALUATION SERVICES 60
Indirect Costs
Indirect costs or soft costs, include professional fees, construction financing costs, architectural
and engineering fees; legal and accounting expenses; taxes and insurance during the
construction period; leasing costs, fill-up costs and the developer’s operational overhead and
profit. These costs, exclusive of leasing fees, fill-up costs and developer’s operational overhead
and profit, will typically range from 12% to 20% of direct costs. Considering the subject’s
relatively large size we have projected indirect costs at 12% of our direct cost estimate or a
rounded $2,460,000.
In addition to the indirect costs, the developer will incur leasing fees and holding costs during
fill-up. We have assumed stabilized occupancy at 90% and that the subject would be 25%
preleased upon construction completion.
Square Feet
Total Building Area 353,711
Stabilized Occupancy at 90% 318,340
Occupancy - Preleasing- 25% 88,428
Needed to Achieve 90% Occupancy 229,912
Lease Status
We have estimated fill-up costs as follows:
Leasing Fees
318,340 Sq. Ft. x $0.49 Sq. Ft.(1)/Mo. x 60 Months x 5% $467,960
Rent Loss
229,912 Sq. Ft. x $0.47 Sq. Ft./Mo. x 18 Months / 2 $972,529
Free Rent 318,340 Sq. Ft. x $0.47 Sq. Ft./Mo. x 2 Months $299,240
Expense Reimbursement Loss
229,912 Sq. Ft. x $0.17 Sq. Ft.(2)/Mo. x 18 Months / 2 $347,978
Total $2,087,706
Rounded Total $2,090,000
(1) Average market rent for the suites over the lease term
Fill-Up Costs
(2) Remiburseable expenses (from income approach) less management fee
Profit/Developers Fee
In order for the Cost Approach to provide a reliable indication of value, we add a developer’s
profit allowance. Essentially, entrepreneurial incentive is the difference between value and cost;
an amount the developer expects to receive in addition to costs. We have estimated this profit at
7% of the development costs including land, or a rounded $2,390,000.
MONTANDON FARLEY VALUATION SERVICES 61
Depreciation
All types of accrued depreciation affecting the subject improvements were considered. Accrued
depreciation is the difference between the replacement cost new, as of the effective date of the
appraisal, and the present contributory value of the improvements. In measuring accrued
depreciation, the loss in value experienced by the subject structures in their present conditions
are identified and measured and then compared with the value of the structures if they were new.
Physical depreciation, or deterioration, may be curable or incurable. The improvements are in good condition with no significant deferred maintenance. Marshall Valuation Service suggests a life expectancy range for a industrial building similar to the subject of 45 years. The subject improvements are 22 years old but we have estimated the effective age of the improvements at 17 years with a remaining economic life of 28 years. Using a straight line depreciation method results in a physical depreciation of 38%. Functional obsolescence is loss in value caused by a superadequacy, inadequacy, unattractive style, poor or inefficient layout or design. The subject improvements are well designed for industrial use. No deductions for functional obsolescence are necessary. Economic obsolescence is loss in value caused by changes external to the property, such as changes in demand, changes in general property uses in the subject’s area, and changes in zoning, financing, and regulations. Market rents are near levels that will support new industrial development like the subject assuming a small profit allowance on speculative development or modest developer’s fee for owner user product. No deduction for economic obsolescence is warranted. The total estimated depreciation for the subject is 38%
MONTANDON FARLEY VALUATION SERVICES 62
Appraiser’s Replacement Cost Estimate
Direct Building Costs
Direct Building Cost 353,711 Sq. Ft. x $58 /Sq. Ft. $20,515,238
Site Improvements 573,268 Sq. Ft. x $4 /Sq. Ft. $2,293,072
Total Direct Building Costs $22,808,310
12% of Direct Cost $2,460,000
$2,090,000
Add: Developer’s Profit @ 7% $2,390,000
Total Reproduction Cost New of Improvements 29,748,310
Less: Depreciation @ ($11,304,358)
Total Depreciated Cost Estimate $18,443,952
Add: Land Value Estimate $8,810,000
Summation - Land and Improvements $27,253,952
Rounded to $27,250,000
Add: Fill-Up Costs
Value Estimate Via Cost Approach
38%
Add: Indirect Costs @
MONTANDON FARLEY VALUATION SERVICES 63
SALES COMPARISON APPROACH
The Sales Comparison Approach utilizes a set of procedures by which an appraiser derives an
indication of value by comparing the property being appraised to similar properties that have
been sold recently. This is done by applying appropriate units of comparison and making
adjustments to the sale prices of the comparables, based upon various possible elements of
comparison.
Dollar or percentage adjustments are then made to the sale price of each comparable property,
after consideration of the real property interest involved. Adjustments are made to the sale prices
of the comparables because the values of the comparables are known, while the value of the
subject property is unknown. Through this comparative procedure, the appraiser estimates one
or more kinds of value as of a specific date.
The following comparables were considered most applicable for direct comparison to the
subject. Photographs of each of these comparisons are also included. A summary of the
comparisons and a sales map follow the detailed write-ups.
MONTANDON FARLEY VALUATION SERVICES 64
INDUSTRIAL BUILDING SALE ( A ) GRANTOR: LBA Realty Fund III-
Company IV-A, LLC GRANTEE: IPT Tempe BC LLC DOCUMENT NO.: 2017/0010416 LOCATION: 685 West La Vieve Lane,
Tempe ASSESSOR’S PARCELS: 301-60-073, 074, 075 and 076 SALE DATE: January 2017 LAND AREA: Total Net Area – 272,110 square feet, or 6.25 acres IMPROVEMENTS: The property is improved with a 101,641-square-foot single-tenant
industrial building that was completed in 1992. The improvements are of concrete tilt panel and window wall construction with a flat deck roof. Approximately 10,924 square feet (11%) is finished for office use. The rest of the area is warehouse space with a clear height of about 24 feet and column spacing of 50’ x 60’. The property includes 2,000 amps of electrical service. There are six grade level overhead doors, fourteen dock high doors and four truck well doors. Approximately 119 parking spaces are provided which equates to a ratio of 1.2 spaces per 1,000 square feet of building area. There are secured yard areas on the east and west ends of the building.
LAND-TO- BUILDING RATIO: 2.7:1 ZONING: GID, General Industrial District, Tempe ASKING PRICE: $9,500,000 cash UNIT PRICE: $93.47 per square foot Overall Rate 6.0%
MONTANDON FARLEY VALUATION SERVICES 65
INDUSTRIAL BUILDING SALE ( A ) - (Continued) COMMENTS: The building is leased to Kovach Building Enclosures. Kovach is a
locally based private company that was founded in 1969 and is now one of the nation’s largest integrated designers, manufacturers and installers of high quality panel and glazing systems for commercial building enclosures. Kovach signed a new ten-year lease in September 2016 at a starting rental rate of $.47 per square foot per month, net. The overall rate is estimated to be 6.0%. We have not deducted a vacancy factor or reserves due to the length of the remaining lease term and credit strength of the tenant.
SALES HISTORY: Public records do not indicate any sales of this property within the
three years prior to the sale date. CONFIRMED BY: Lisa Andrews and John McDonald with Andy Markham at CBRE
(listing agent)
MONTANDON FARLEY VALUATION SERVICES 66
INDUSTRIAL BUILDING SALE ( B ) GRANTOR: OMP PCCP 53 Avenue LLC GRANTEE: ColFin 2017-6 Industrial Owner
LLC DOCUMENT NO.: 17/0449598 LOCATION: Freeport Center 1002 South 56th Avenue and 420 South 53rd Avenue,
Phoenix ASSESSOR’S PARCELS: 104-19-011, 012, 013 & 104-20-036, 037, 038 and 039 DATE: June 2017 LAND SIZE: Total Net Area –514,008 square feet, or 11.80 acres IMPROVEMENTS: The sale involves two noncontiguous industrial buildings within the
Freeport Center that are improved with a combined 245,890-square-feet. The distribution buildings were completed in 1985 and 1987 and are of tilt-concrete construction with flat built-up roof. Approximately 7% of the space is finished for office use. The rest is warehouse space with a clear height of 24' - 27' feet. The warehouse is evaporative cooled with 48' x 50' column spacing. The buildings are served by 1,600 amp power and have skylights. There are 42 dock high doors with levelators and two drive-in grade level doors. Approximately 180 parking spaces are provided. The parking ratio is equivalent to 0.7 spaces per 1,000 square feet of building area.
LAND-TO- BUILDING RATIO: 2.1:1 ZONING: A-1, Phoenix PURCHASE PRICE: $18,400,000 cash UNIT PRICE: $74.83 per square foot OAR - 6.3%
MONTANDON FARLEY VALUATION SERVICES 67
INDUSTRIAL BUILDING SALE ( B ) – (Continued)
COMMENTS: At sale, occupancy was 91% with lease rates at an average $0.42 per
square foot per month, triple net. The tenancy had a mix of local and national credit. The combined property sold at an approximate 6.3% capitalization rate using a 10% vacancy factor.
SALES HISTORY: Public records do not indicate another arm’s length sale in the
previous three years. CONFIRMED BY: John McDonald with Tom Louer at Lee & Associates
MONTANDON FARLEY VALUATION SERVICES 68
INDUSTRIAL BUILDING SALE ( C )
GRANTOR: DCT AZ 2004 RN PORTFOLIO
U LLC GRANTEE: COLFIN 2017-7 Industrial Owner
LLC DOCUMENT NO.: 17/0495555 NAME/LOCATION: DCT 3 101 North 103rd Avenue and 101
North 104th Avenue, Tolleson ASSESSOR’S PARCELS: 101-03-004H DATE: June 2017 LAND SIZE: Total Net Area –1,325,966 square feet, or 30.44 acres IMPROVEMENTS: The property is improved with a 558,465-square-foot two-building
multi-tenant industrial project that was completed in 1997. The improvements are of tilt-up concrete construction with flat built-up roof. Approximately 10% of the space is finished for office use. The rest is warehouse space with a clear height of 30 feet. The warehouse is evaporative cooled and has 60’ x 48’ column spacing. The building is sprinklered, served by 1,000 to 2,000 amp power and has skylights. There are 40 dock high loading doors and eight grade level doors. The parking ratio is equivalent to 0.7 spaces per 1,000 square feet of building area.
LAND-TO- BUILDING RATIO: 2.4:1 ZONING: I-1, Tolleson PURCHASE PRICE: $39,000,000 cash UNIT PRICE: $69.83 per square foot OAR - 5.7%
MONTANDON FARLEY VALUATION SERVICES 69
INDUSTRIAL BUILDING SALE ( C ) – (Continued)
COMMENTS: The properties were 100% leased at the time of sale with leases
reportedly in the mid-$0.30’s per square foot per month. Some contract rents were considered slightly below market. The property sold at a cap rate of about 5.7% with reserve allowance and on 5% vacancy allowance.
SALES HISTORY: Public records do not indicate another arm’s length sale in the
previous three years. CONFIRMED BY: John McDonald with Bo Mills at JLL and public records
MONTANDON FARLEY VALUATION SERVICES 70
INDUSTRIAL BUILDING SALE ( D ) GRANTOR: Madison 225 LLC GRANTEE: CRPF IV Madison LLC DOCUMENT NO.: 17/626306 NAME/LOCATION: 225 South 51st Street, Phoenix ASSESSOR’S PARCELS: 124-11-020B, 124-11-020C DATE: August 2017 LAND SIZE: Total Net Area –205,167 square feet, or 4.71 acres IMPROVEMENTS: The property is improved with a 110,710-square-foot industrial
building that was completed in 1994. The improvements are of tilt-up concrete construction with flat built up roofs. Only 1% of the space is finished for office use. The warehouse space has a 30’ x 95’ column spacing, a clear height of 30 feet and is evaporative cooled. The building is sprinklered, served by 3,000 amp power and has skylights. There are 22 dock high doors and three drive-in doors. The warehouse ceiling is insulated and has skylights.
LAND-TO- BUILDING RATIO: 1.9:1 ZONING: A-2, Phoenix PURCHASE PRICE: $8,000,000 cash plus $1,220,000 in fill-up costs for an adjusted
purchase price of $9,220,000 (see comments) UNIT PRICE: $83.28 per square foot
MONTANDON FARLEY VALUATION SERVICES 71
INDUSTRIAL BUILDING SALE ( D ) – (Continued)
COMMENTS: The property was vacant at the time of sale and had been vacant since
2013. The improvements were reportedly in good condition at the time of sale and the buyer purchased the property as an investment. The property is best suited for single occupancy and we have estimated that it will take about 12 months to find a tenant and reach a stabilized occupancy. The estimated holding costs to reach stabilized occupancy are summarized below.
Leasing Fees
110,710 x $0.44 [1] x 60 months x 6% = $175,365
Rent Loss
110,710 x $0.42 x 12 months = $557,978
Tenant Improvments
110,710 x $2.00 $221,420
Expense Reimbursements
110,710 x $0.16 x 12 months = $212,563
Rounded Total $1,170,000
Profit/Contingency $180,000
Rounded Total Fill Up Costs $1,350,000
[1] Over 5 yr. term We have adjusted the total upward 20% for entrepreneurial profit
resulting in a rounded amount of $1,220,000.
MONTANDON FARLEY VALUATION SERVICES 72
INDUSTRIAL COMPLEX SALE ( D ) – (Continued) SALES HISTORY: Public records do not indicate another arm’s length sale in the
previous three years. CONFIRMED BY: John McDonald with Tom Louer at Lee & Associates
MONTANDON FARLEY VALUATION SERVICES 73
INDUSTRIAL BUILDING SALE ( E ) GRANTOR: 7200 W Buckeye Road Industrial
Investors LLC GRANTEE: Cohen-Arizona One LLC DOCUMENT NO.: 17/900167 NAME/LOCATION: 7200 West Buckeye Road,
Phoenix ASSESSOR’S PARCELS: 104-15-021, 0 DATE: December 2017 LAND SIZE: Total Net Area –1,086,726 square feet, or 24.95 acres IMPROVEMENTS: The property is improved with a 400,000-square-foot industrial
complex that was completed in 2009. The improvements are of tilt-up concrete construction with flat built-up roof. Approximately 10% of the space is finished for office use. The rest is warehouse space with a clear height of 32 feet. The warehouse is evaporative cooled, sprinklered and has 60’ x 52’ column spacing. The building is served by 3,000 amp power and has skylights. There are 72 dock high loading doors and four drive-in doors. The parking ratio is equivalent to 0.6 spaces per 1,000 square feet of building area.
LAND-TO- BUILDING RATIO: 2.7:1 ZONING: I-1, Phoenix PURCHASE PRICE: $31,200,000 cash UNIT PRICE: $78.00 per square foot OAR - 5.0%
MONTANDON FARLEY VALUATION SERVICES 74
INDUSTRIAL BUILDING SALE ( E ) – (Continued)
COMMENTS: The building is 100% occupied by two tenants but most of the space
is leased to Home Depot on a net lease with five years remaining on its lease. The rent was considered to be below market and reportedly sold at a 5% cap rate based on contract rent. The property was marketed for about three months and had a one and one-half month escrow.
SALES HISTORY: Public records do not indicate another arm’s length sale in the
previous three years. CONFIRMED BY: John McDonald with Don MacWilliam at Colliers International;.
MONTANDON FARLEY VALUATION SERVICES 75
INDUSTRIAL BUILDING SALE ( F ) GRANTOR: Clarion Partners GRANTEE: Bixby Land Company DOCUMENT NO.: 17/20170931151 NAME/LOCATION: West 10 Business Center 4703 West Brill Street, Phoenix ASSESSOR’S PARCELS: 103-31-012 DATE: December 2017 LAND SIZE: Total Net Area –382,021 square feet, or 8.77 acres IMPROVEMENTS: The property is improved with a 146,663-square-foot industrial
building that was completed in 1998. The improvements are of tilt-up concrete construction with flat built-up roof. Approximately 5% of the space is finished for office use. The rest is warehouse space with a clear height of 28 feet. The warehouse is evaporative cooled, sprinklered and has 52’ x 45’ column spacing. The building is served by 2,500 amp power and has skylights. There are 31 dock high loading doors and four drive-in doors. The parking ratio is equivalent to 1.0 spaces per 1,000 square feet of building area.
LAND-TO- BUILDING RATIO: 2.6:1 ZONING: A-1, Phoenix PURCHASE PRICE: $9,533,095 cash UNIT PRICE: $65.00 per square foot 5.8%
MONTANDON FARLEY VALUATION SERVICES 76
INDUSTRIAL BUILDING SALE ( F ) – (Continued)
COMMENTS: The property was 100% leased by four tenants with three to four
years remaining on leases. Leases averaged about $0.34 per square foot. Allowing for reserves and utilizing a 5% vacancy factor a 5.8% capitalization rate is indicated. The contract rents were considered slightly below market.
SALES HISTORY: Public records do not indicate another arm’s length sale in the
previous three years. CONFIRMED BY: John McDonald with Will Strong at Cushman & Wakefield
MONTANDON FARLEY VALUATION SERVICES 77
Improved Comparison Summary
Item Property Name
Sale
Date
Year
Built
Building
Size S.F.
Purchase
Price Price/SF
A Kovach Building Jan-17 1992 101,641 $9,500,000 $93.47
B Freeport Center Jun-17 1985/87 245,890 $18,400,000 $74.83
C DCT 3 Jun-17 1997 558,465 $39,000,000 $69.83
D 225 51st Aug-17 1994 110,710 $9,220,000 $83.28
E 7200 Buckeye Dec-17 2009 400,000 $31,200,000 $78.00
FWest 10 Business
CenterDec-17 1998 146,663 $9,533,095 $65.00
SubjectHohokam 10
Business Center1996 353,711
Sales Comparison Summary
Improved Comparison Map
MONTANDON FARLEY VALUATION SERVICES 78
Adjustment Analysis The unit of comparison used in this approach is the price-per-square-foot-of-building-area. The sales have been compared to the subject property with respect to the following items.
1) Property Rights Conveyed 2) Financing (Cash Equivalency) 3) Conditions of Sale 4) Market Conditions (Time) 5) Location 6) Physical Characteristics 7) Economic Characteristics 8) Use (Zoning)
A grid illustrating the adjustments to the individual sales follows the adjustment analysis discussion. Property Rights Conveyed The interest being valued in this section is the leased fee. All the sales comparisons are of the same interest and do not need to be adjusted. We found no market evidence to indicate that this sale needs to be adjusted for property rights conveyed. Financing All sales comparisons were cash transactions or were deemed cash equivalent. In our opinion, no adjustment for financing is needed. Conditions of Sale Adjustments for conditions of sale are made when the buyer or seller had atypical motivations. No adjustments are warranted for comparison to subject. Expenditures Made Immediately After Purchase No adjustments are necessary.
Market Conditions The sales comparisons have occurred over the past year. According to industrial building brokers with whom we spoke. Property values have increased slightly since the beginning of 2017 but have been relatively stable over the past six months. We have made a slight upward adjustment to Sale A for slightly improved market conditions since its January 2017 sale date. The remaining comparisons have occurred over a period of relatively stable market conditions and no further adjustments are warranted.
MONTANDON FARLEY VALUATION SERVICES 79
Location The subject is located on the north side of the Interstate 10 Freeway, west of the State Route 143 interchange. The subject property has excellent freeway exposure and is in an established industrial area. The comparison locations as they relate to the subject are summarized below.
Sale Comments Adjustment
A Area of higher income backup attracting slightly higher rents; Superior -3%
B Inferior proximity to central Phoenix 3%
C Inferior proximity to central Phoenix 3%
D Slightly better proximity to Sky Harbor Airport and commercial development; Slightly Superior
-3%
E Inferior proximity to central Phoenix 3%
F Inferior proximity to central Phoenix 3%
Physical Characteristics The physical differences include age/condition, quality of construction, building size, office finish, and building amenities. Each is briefly discussed below. Age/Condition: The subject building was constructed in 1996 and is of tilt-up concrete construction. The improvements are in good condition. The comparisons are of similar construction. The chart below is arrayed by construction date and illustrates the differences in age/condition between the comparisons and the subject.
Sale Year Built Adjustment
B 1985/87 3%
A 1992 0%
D 1994 0%
Subject 1996
C 1997 0%
F 1998 0%
E 2009 -5%
MONTANDON FARLEY VALUATION SERVICES 80
Building Size: The sales range in size from 101,641 to 558,465 square feet. The subject, at 353,711 square feet, is within comparison range. Typically, construction costs per square foot trend downward as size increases and vice versa, all other things being equal. The subject is considered to be a large project and generally similar size to Sales B, C and E. Sales A D and F are much smaller warranting a slight downward adjustment.
A 101,641 -2% 0%
D 110,710 -2% 0%
F 146,663 -2% 0%
B 245,890 0% 0%
Subject 353,711
E 400,000 0% 0%
C 558,465 0% 0%
Sale
Size of Comparison to the
Subject (S.F.)
Adjustment
Per Sq. Ft.
Adjustment
Per Unit
Land-to-Building Ratio: A summary of the land-to-building ratios for the subject and comparisons is included below. The comparisons and subject are arrayed by their land-to-building ratios. The subject’s land-to-building ratio is effectively slightly less than shown due to its small unusable land appendage at its northwest corner. Its effective land-to-building ratio is considered to be about 2.4:1. The subject is considered to have an effective land-to-building ratio similar to all the comparisons except for Sales B and D which are much smaller warranting a slight upward adjustment.
Adjustment
D 1.9 2%
B 2.1 2%
C 2.4 0%
Subject 2.6
F 2.6 0%
A 2.7 0%
E 2.7 0%
Sale
Land-To-
Building Ratio
MONTANDON FARLEY VALUATION SERVICES 81
Office Finish: Approximately 14% of the subject building area is finished for office use and the rest is warehouse area that is evaporative cooled. The office areas of the comparisons range from 1% to 10%. Industrial property with distribution users generally do not reflect meaningful value changes for modest differences in office percentage. However large differences warrant some adjustment. The comparisons are arrayed below by percentage office build out. Sales D and F have an unusually low office percentage build out warranting slight upward adjustment.
Adjustment
D 1% 3%
F 5% 2%
B 7% 0%
C 10% 0%
E 10% 0%
A 11% 0%
Subject 14%
Sale % Office
Building Amenities: The subject and the comparisons all have similar building amenities with a mix of dock high and drive-in loading doors, skylights, sprinklers and evaporative cooled warehouse with insulation. However, the comparisons vary in clear height. The market generally places a premium on warehouse space with greater clear heights. The comparisons are arrayed below by clear height along with our concluded adjustments summarized below.
Clear Appraiser
Height Adjustment
B 24' 48' x 50' 0%
A 24' - 27' 60' x 50' 0%
Subject 20' - 28' 52' x 40'
F 28' 52' x 45' -2%
C 30' 60' x 48' -3%
D 30' 30' x 95' -3%
E 32' 60' x 52' -3%
Item Column Width
Economic Characteristics
Sale A is a single tenant building with a long-term lease to a good credit tenant. The long-term occupancy (100%) to a credit tenant warrants a downward adjustment No other adjustments are deemed necessary for economic characteristics.
Use (Zoning)
No adjustments are deemed necessary for use.
MONTANDON FARLEY VALUATION SERVICES 82
Improved Sales Adjustment Grid
SALE A B C D E F
Date of Sale Jan-17 Jun-17 Jun-17 Aug-17 Dec-17 Dec-17
Year Built 1992 1985/87 1997 1994 2009 1998
Rentable Area (Sq. Ft.) 101,641 245,890 558,465 110,710 400,000 146,663
Price/Sq. Ft. $93.47 $74.83 $69.83 $83.28 $78.00 $65.00
Value Indications $81.04 $80.82 $69.83 $80.78 $74.10 $65.65
The adjusted unit price range exhibited by the comparisons is $65.65 to $81.04 per square foot
of building area with a mean of about $75.37 per square foot and median of approximately
$77.44 per square foot.
After reviewing the data, we have concluded that the market supports a unit price ranging from
$70 to $80 per square foot. Applying this unit price range to the subject’s building area reveals
the following:
x = Low High
353,711 Square Feet x $70 /Sq. Ft. = $24,759,770
x $80 /Sq. Ft. = $28,296,880
Value Indication Rounded $24,760,000 to $28,300,000
Rentable Area Unit Price
Valuation Via Sales Comparison Approach
Value Indication
MONTANDON FARLEY VALUATION SERVICES 83
INCOME APPROACH
This approach is a set of procedures in which an appraiser derives a value indication for income-producing property by converting anticipated benefits into property value. This conversion is accomplished either by 1) capitalizing a single year’s income expectancy or an annual average of several years’ income expectancies at a market-derived capitalization rate or a capitalization rate that reflects a specified income pattern return on investment, and change in the value of the investments; or 2) discounting the annual cash flows for the holding period and the reversion at a specified yield rate.
The subject is 70% occupied by six tenants. However, four tenants are on a month-to-month extended occupancy agreements with ADOT as landlord. All tenants are responsible for their own electricity and interior maintenance. The Redi-Carpet and J & K Cabinetry tenants have leases that state that they are triple net. However, the subject landlord (ADOT), as a state agency, does not pay for taxes and is self-insured. As a result, no real estate taxes are currently passed through to the tenants. Insurance and common area maintenance (CAM) have been charged as fixed amounts although the leases allow for adjustments. These are essentially interim net or modified gross rents, intentionally at below market rents to maintain occupancy awaiting ADOT disposition. Upon a sale a new owner could renegotiate all short-term leases. Redi-Capet and J&K Cabinetry would remain with six and one-half to seven years remaining on their lease terms but greater capture of reimbursable expenses, especially real estate taxes, could be imposed depending on interpretation of leases. We have interpreted these two leases as triple net with the tenant reimbursing for insurance, real estate taxes (currently not collected), common area maintenance and management fee. The month-to-month and long-term leases are summarized below.
Monthly
Rent
Current
Monthly
Per Sq. Ft. Rent Escalations/Comments
Building 1
Vacant 101 23,322[1] NA
ProLogis 105 1,990 Month to Month $0.77 $1,532.30 No escalations; modified gross rent
DHL 111 19,200 Month to Month $0.47 $9,024.00 2%/yr increases
Either party can terminate with 90 day notice
Building 2
Redi-Carpet 101 26,594 10 yrs from 7/14 $0.45 $11,967.30 2%/yr increases; triple net
Vacant 105 26,000 NA
Vacant 106 26,000 NA
Vacant 110 15,132[1] NA
Building 3
Vacant 101 14,465[1] NA
J & K Cabinetry 107 60,090 7 yrs from 12/17 $0.47 $28,242.30 2%/yr increases; triple net (tenant since 7/14)
American Airlines 113 76,718 Month to Month $0.28 $21,481.00 None since 8/11; modified gross rent
Building 4
Clariant 104-107 45,000 10 yrs from 1/17 $0.47 $21,150 2%/yr increases every 2 years
Total 353,711 70% occupied
Contract Rent Summary
[1] After demolition and reconstruction
SuiteTenant Sq. Ft. Term
MONTANDON FARLEY VALUATION SERVICES 84
Market Rent Estimate:
In order to estimate a market rent for the subject we have attempted to gather rental information
on comparable facilities. The comparisons were leased on a net basis, with the tenant responsible
for a pro rata share of operating expenses. We have estimated a net market rent for subject
consistent with the market activity. A summary and map showing the location of the
comparisons follows the detailed information. Photographs of the comparisons are included in
the addenda.
MONTANDON FARLEY VALUATION SERVICES 85
Rent Comparison 1
Phoenix Star Commerce Park is a four-building industrial project located at the southwest
corner of Interstate 10 and 7th Avenue, Phoenix.
Year Constructed: 2002
Total Project Area: 224,505 square feet
Occupancy: 92%
Loading: Mostly dock high and some grade level
Clear Height: 24 Feet
Additional Comments: Asking rent for available space is $0.57 per square foot, triple net.
Fully sprinklered building with skylights. Recent leasing has 5%
to 10% office build out and evaporative cooled warehouse.
Confirmed with Tom Louer @ Lee & Associates
Recent Leasing
Tenant
Lease
Date
Term
(months)
Bay
Size (SF) TI/SF
Free Rent
(months)
Base Net Rent/Mo./SF
Annual Rent Increases
Effective Mo.
Rent/SF
Sigma Foods 3/17 60 21,278 As Is None $.535
3%± per year $.57
Carpeturn 10/17 63 21,840 $5.36 3 Free $.56
3%± per year $.57
MONTANDON FARLEY VALUATION SERVICES 86
Rent Comparison 2
Elliot Business Park is a seven-building industrial project located at 7805 – 7929 South Hardy
Drive, Tempe. (SEC Hardy and Elliot)
Year Constructed: 2004
Total Project Area: 1,019,544 square feet
Occupancy: 75%
Loading: For lease shown below - Six dock high and one grade level
Clear Height: 24 Feet
Additional Comments: Asking rent for available space is $0.62 per square foot, triple net.
Fully sprinklered building with skylights and load levelers. Recent
leasing has 7% office build out and evaporative cooled warehouse.
48’ x 50’ column spacing; Confirmed with CBRE
Recent Leasing
Tenant
Lease
Date
Term
(months)
Bay
Size (SF) TI/SF
Free Rent
(months)
Base Net Rent/Mo./SF
Annual Rent Increases
Effective Mo.
Rent/SF
McCormick
Trading 6/17 39 29,126 As Is 1 ½ Free
$.54
3%± per year $.51
MONTANDON FARLEY VALUATION SERVICES 87
Rent Comparison 3
Ten Sky Harbor Business Center is a single building industrial project located at 3825 South
36th Street, Phoenix. (I-10 Frontage at 36th Street)
Year Constructed: 2016
Total Project Area: 64,014 square feet
Occupancy: 92%
Loading: 18 dock high and two grade level
Clear Height: 30 Feet
Additional Comments: Asking rent for available space is $0.57 per square foot, triple net.
Fully sprinklered building with skylights and load levelers; 2,000
amp power, 13% office build out and evaporative cooled
warehouse (insulated). 52’ x 50’ column spacing; Confirmed with
Tom Louer @ Lee & Associates
Recent Leasing- (1st Generation Space)
Tenant
Lease
Date
Term
(months)
Bay
Size (SF) TI/SF
Free Rent
(months)
Base Net Rent/Mo./SF
Annual Rent Increases
Effective Mo.
Rent/SF
Trademark
Visual 11/17 87 64,014 $18 3 Free
$.56
3%± per year $.59
MONTANDON FARLEY VALUATION SERVICES 88
Rent Comparison 4
2340 University is a single building industrial project located at 2340-2342 East University
Drive, Phoenix. (I-10 Frontage near 24th Street)
Year Constructed: 1984
Total Project Area: 118,600 square feet
Occupancy: 100%
Loading: Mostly dock high
Clear Height: 27 Feet
Additional Comments: Fully sprinklered building with skylights and load levelers; 2,500
amp power, 8% office build out and evaporative cooled
warehouse (insulated). 40’ x 40’ column spacing.
Recent Leasing
Tenant
Lease
Date
Term
(months)
Bay
Size (SF) TI/SF
Free Rent
(months)
Base Net Rent/Mo./SF
Annual Rent Increases
Effective Mo.
Rent/SF
Arise
Properties 9/17 60 61,191 As Is None
$.32
$.01 per year $.36
MONTANDON FARLEY VALUATION SERVICES 89
Rent Comparison 5
24th Street Industrial Center is a single building industrial project located at 2110-2120 East
Raymond Street, Phoenix.
Year Constructed: 1988
Total Project Area: 134,294 square feet
Occupancy: 90%
Loading: For lease shown below - Four dock high with levelers and four
grade level
Clear Height: 24 Feet
Additional Comments: Fully sprinklered building with skylights and load levelers; 15%
office build out and evaporative cooled warehouse (insulated).
48’ x 40’ column spacing.
Recent Leasing
Tenant
Lease
Date
Term
(months)
Bay
Size (SF) TI/SF
Free Rent
(months)
Base Net Rent/Mo./SF
Annual Rent Increases
Effective Mo.
Rent/SF
Steven
Supply 12/17 60 21,497 $8.00 Five
$0.42
3%± per year $0.40
MONTANDON FARLEY VALUATION SERVICES 90
Rent Comparison Map
No.
Lease
Date Term Size % Office Yr. Built Base Rent
1A 3/17 60 21,278 10% 2002 $0.535
1B 10/17 63 21,840 10% 2002 $0.56
2 6/17 39 29,126 7% 2004 $0.54
3 11/17 87 64,014 13% 2016 $0.56
4 9/17 60 61,191 8% 1984 $0.36
5 12/17 60 21,497 15% 1988 $0.42
Subject 14% 1996 .
Rent Comparison Summary
MONTANDON FARLEY VALUATION SERVICES 91
Market Rent Discussion
The comparisons detailed on the previous pages have been used to estimate a market rent for the subject. The comparisons range in size from 21,278 to 64,014 square feet and indicate base contract rates in a range from $0.36 to $0.56 per square foot per month on a net basis. The comparisons have similar distribution user tenancy with slight differences in lease terms, location, age, office build out, size and building amenities. The relationship of each comparison to the subject is discussed below. An adjustment grid follows this discussion. Conditions of Lease: The comparisons have lease terms that include a range of no free rent to five months free and no tenant improvement allowance to $18.00 per square foot (first generation space). We have assumed a typical $2.00 per square foot tenant improvement allowance and two months of free rent herein as part of the typical lease term package that supports our base rent market rent conclusion for the subject. The tenant improvements and free rent terms for each comparison along with our conclude adjustment is shown below.
Item TI's Free Rent Adjustment
1A None None 3%
1B $5.36 3 Mo. -2%
2 None 1.5 Mo. 2%
3 $18 3 Mo. -5%
4 None None 3%
5 $8.00 Five -3%
Subject $2.00 2 Mo.
Location: Comparison Items 3 and 4 have similar locations as the subject while Items 1 and 2 are considered to have superior locations. Comparison 1s located at freeway diamond interchange an Item 3is in an area of higher income backup. Age Condition: The subject building was constructed in 1996 and is of tilt-up concrete construction. The improvements are in good condition. The chart below is arrayed by construction date and illustrates the differences in age/condition between the comparisons and the subject.
Item Yr. Blt. Adjustment
4 1984 5%
5 1988 5%
Subject 1996
1A 2002 -3%
1B 2002 -3%
2 2004 -3%
3 2016 -7%
MONTANDON FARLEY VALUATION SERVICES 92
Interior Finish (Air-Conditioned Office):
The percentage of office areas of the comparisons range from 7 % to 15% which brackets the
subject’s office percentage 14%. Industrial property with distribution users generally do not
reflect meaningful rental rate changes for modest differences in office percentage. No
adjustments are warranted.
Suite Size
The suite sizes at the comparisons are typical of those at the subject and no adjustments are
warranted.
Building Amenities/Clear Height:
The subject and the comparisons all have similar building amenities with a mix of dock high
and drive-in loading doors, skylights, sprinklers and evaporative cooled warehouse with
insulation. However, the comparisons vary in clear height. The market generally places a
premium on warehouse space with greater clear heights. The comparisons are arrayed below by
clear height along with our concluded adjustments summarized below
Item Clear Heght Adjustment
1A 24' 0%
1B 24' 0%
2 24' 0%
5 24' 0%
Subject 20' - 28'
4 27' -2%
3 30' -5%
An adjustment grid is included on the following page.
Step Adjusted Rent/Sq. Ft. $0.55 $0.55 $0.55 $0.53 $0.37 $0.41
Market Conditions 0% 0% 0% 0% 0% 0%
Step Adjusted Rent/Sq. Ft. $0.55 $0.55 $0.55 $0.53 $0.37 $0.41
Location -5% -5% -5% 0% 0% 0%
Physical Characteristics
Age/Condition -3% -3% -3% -7% 5% 5%
Interior Finish/AC 0% 0% 0% 0% 0% 0%
Suite Size 0% 0% 0% 0% 0% 0%
Bldg. Amenities/Clear Height 0% 0% 0% -5% -2% 0%
Net Adjustments -8% -8% -8% -12% 3% 5%
Indicated Rent/Sq. Ft. $0.51 $0.50 $0.51 $0.47 $0.38 $0.43 The comparisons, after adjustments, support a market rent for the subject between $0.38 and $0.51 per square foot per month, net. The average and median of the comparison data is $0.47 per square foot. We have projected an average base year market rent for the subject of $0.47 per square foot per month, net or $5.64 per square foot per annum. The market rent assumes two months of free rent and a five-year term with 3% annual increases. Gross Potential Rent: The two tenants at the subject on long term leases (Redi-Carpet and J & K Cabinetry) are at or slightly below our concluded market rent. The gross potential rent at the subject is calculated as follows.
Available For Lease 267,027 $0.47 $125,502.69 $1,506,032.28
Total 353,711 $1,988,547.48
Rent
S.F./Mo
Monthly
Rent Annual Rent
Potential Rent Revenue
MONTANDON FARLEY VALUATION SERVICES 94
Vacancy The overall vacancy rate for industrial buildings in the Airport Industrial submarket was reported to be 10.9% at the end of the third quarter 2017. Absorption has been positive throughout 2017 with no new inventory added since the first quarter and vacancy is projected by CoStar to decline to near 8% during 2018. Leasing agents reports good demand for well-located industrial space in the Airport market area
as evidenced by leasing activity at newer projects in the subject vicinity.
Based on the preceding information, correlated with the site’s positive location/access
characteristics, we have projected a stabilized vacancy and collection loss allowance for the
subject of 10%. Operating Expenses The subject is assumed to be leased on a net basis with the tenants paying the utility, interior maintenance and janitorial expenses directly and reimbursing the property tax, insurance, management and common area maintenance expenses. In the absence of historical operating expenses, we have relied on operating expense data from comparable industrial properties over the past two years. These projects are summarized in the table below. The identity of the projects is intentionally masked to preserve confidentiality requirements.
Reimbursable Expenses Real Estate Taxes: The subject is currently exempt from taxes due to its State-owned status. However, in the property taxes section of this report, we have projected the 2018 real estate taxes at $428,309 utilizing the Assessor’s 2018 limited value and 2017 tax rates. We have concluded at a rounded $428,000 which equates to $1.21 per square foot. Insurance: The comparisons indicate insurance premiums in a range from $0.05 to $0.30 per square foot with most between $0.05 and $0.16 per square foot. We have projected the insurance expense at $0.10 per square foot or a rounded $35,800.
MONTANDON FARLEY VALUATION SERVICES 95
Management: The expense comparisons indicate management fees in a range of 2.5% to 5.7% of EGI. Considering the subject’s large size, we have projected the subject expense at 2.5% of EGI or a rounded $63,000. Common Area Maintenance:
This category includes the following: repairs and maintenance to the exterior of the building, parking lot sweeping/maintenance, landscaping, miscellaneous contract services, etc. The comparisons suggest a CAM expense in a range of $0.33 to $1.40 per square foot. It should be noted that the CAM expense for Item 1 is skewed low as the tenant pays most of the expenses directly. We have projected the subject expense at $0.70 per square foot or a rounded $250,000. Reimbursable Expenses The previously discussed reimbursable expenses total $776,800 Non- Reimbursable Expense Reserves This expense typically accounts for the replacement of short-lived items, including mechanical equipment, roof cover, asphalt paving and other extraordinary expenses, that may not be passed on to the tenants, especially between occupancies when tenant turnovers occur. We have projected reserves at $0.15 per square foot or a rounded $53,100. Revenue and Expense Summary Set forth next is our revenue and expense analysis for the project assuming stabilized occupancy.
Potential Rent Revenue $1,988,547
Add: Potential Reimbursements $776,800
Total Potential Revenue $2,765,347
Less: Vacancy & Collection Loss @ 10% (276,535)
Effective Gross Revenue $2,488,812
Less: Operating Expenses
Real Estate Taxes $428,000
Insurance $35,800
Management $63,000
Common Area Maintenace $250,000
Reserves $53,100
Total Expenses (829,900)
Net Operating Income $1,658,912
Revenue and Expense Summary
MONTANDON FARLEY VALUATION SERVICES 96
Revenue and Expense Summary and Direct Capitalization
Capitalization is a process by which projected net income is converted into a single value
estimate. Reliance has been placed upon data obtained from the sales of properties similar to the
subject. Capitalization rates can also be derived via the band of investment and debt coverage
ratio methods. However, these academic methods involve a somewhat subjective choice of an
equity dividend rate, and assume that financing is readily available for investment properties.
The investment climate in the Phoenix metropolitan area is such that a market derived overall
rate is the most commonly used indication.
A summary of the overall rates extracted from the sales comparisons is included below.
Item Name Date Year Built % Leased At Sale Stabilized Stabilized OAR
A Kovach Building 1/17 1992 100% 100% 6.0%
B Freeport Center 6/17 1985/87 91% 90% 6.3%
C DCT 3 6/17 1997 100% 95% 5.7%
E 7200 Buckeye 12/17 2009 100% 95% 5.0%
F West 10 Business Center 12/17 1998 100% 95% 5.8%
Subject Hohokam 10 Business Center 1996 90%
The sales comparisons indicate overall rates in a range from 5.0% to 6.3%. At the low end of
the range is an indication from a project 100% leased primarily to Home Depot, a high quality
national credit tenant. Based on the subject’s historical occupancy and nearby competition, the
subject is assumed to be leased to a mix of local and regional tenants of good credit. Substantial
upward adjustment is warranted for Item A’s tenancy of superior credit quality. The remaining
comparisons suggest a capitalization rate of 5.7% to 6.3%. With the exception of Item B at the
high end of the range, the comparisons were 100% occupied but were analyzed with a 5%
vacancy factor warranting slight upward adjustment to their 5.7% to 6.0% indications for their
occupancies at time of sale that were greater than stabilized pro forma.
The third quarter 2017 PwC Real Estate Investor Survey reveals overall rates for the National
Warehouse Market range from 4.0% to 6.9% with an average of 5.22%. The 3rd Quarter 2017
average is down 5 basis points from the previous quarter and virtually unchanged from the same
year ago quarter. This survey provides good secondary support for the overall rate range
extracted from comparable sales. These rates pertain to institutional grade properties typically
including national credit tenancy. We have placed greater weight on the local sales summarized
above.
MONTANDON FARLEY VALUATION SERVICES 97
After reviewing the comparison data, we have concluded at an overall rate range of 6.0% to 6.3% for the subject. Applying this overall rate range to the projected net operating income of $1,658,912 indicates the following value indication range:
Net Income =
Low High
= $26,331,944
= $27,648,541
$26,330,000 to $27,650,000
$1,658,912 6.3%
6.0%
Value Range
Overall Rate Value Indication
Value Indication Via Direct Capitalization
MONTANDON FARLEY VALUATION SERVICES 98
RECONCILIATION -AS IF STABILIZED AND RECONSTRUCTION COMPLETE
In the preceding sections of this report, the value of the leased fee interest in the property at stabilized occupancy has been analyzed using the three appraisal approaches or techniques. The value indications from the appraisal approaches are displayed below. Cost Approach $27,250,000 Sales Comparison Approach $24,760,000 to $28,300,000 Income Approach $26,330,000 to $27,650,000 Reconciliation is the process of analyzing the relevance of the indicated values, resulting in a final value estimate. In each of the approaches, all the input data was documented and the methodology in processing and/or analyzing the data was briefly explained. The data furnished, as far as we can determine, is from reliable sources and has been accepted as being accurate. The Cost Approach indication is based on our land value estimate derived from recent sales of comparable sites, plus the estimated reproduction cost of the improvements. We have also added an allowance for developer’s profit. This approach provides a benchmark but does not measure economic performance or marketability. The Sales Comparison Approach is based upon the sales of similar industrial facilities located in metropolitan Phoenix. This approach has been given weight as it is the analysis typically relied upon in making a purchase decision concerning this type of property, especially when stabilized operating data is lacking. The Income Approach relies on a market rent estimate less a stabilized vacancy allowance. The net income was capitalized into a value indication using a reasonable overall rate range. This approach has been given considerable weight as it is the analysis typically relied upon in making a purchase decision concerning this type of property. After contrasting the value indications from these approaches, an “as if stabilized and reconfigured” leased fee value of $27,150,000 was selected. This estimate is for the real estate only and excluded any value attributable to furniture, fixtures and equipment. Exposure/Marketing Time1
The actual exposure times for the sales comparisons were generally reported to be less than 12 months, especially after reasonable listing prices and concerted marketing efforts were put in place. Our exposure period estimate for the property is 12 months. Although an official offer to buy the subject will trigger a short-term marketing and possible auction process, the disposition of the subject has been common knowledge by the real estate community for several years and at least two of the subject’s current tenants as well as several local industrial brokers with whom we spoke have expressed interest in purchasing the subject. ADOT’s disposition process is not expected to have material effect compared to traditional marketing. In our opinion, the subject could be sold within 12 months from the effective date of this report at a price consistent with our value estimate. In summary, our marketing time estimate is also 12 months.
1 Exposure Time: estimated length of time that the property interest being appraised would have been offered on the market prior to the hypothetical consummation of a sale at market value on the effective date of the appraisal.
MONTANDON FARLEY VALUATION SERVICES 99
AS IS VALUE
The south 50 to 60 feet of subject Buildings 1, 2 and 3 is affected by required fire lanes and
setbacks resulting from the new right of way line at the subject. The subject is currently 63%
occupied but most tenants are on month-to-month leases or have clauses allowing for lease
termination within three months. Only two leases have longer duration leases. As a result, the
subject only has 64,116 square feet or 18%1 of its space under long term lease contract. ADOT
ownership has been awaiting disposition of the property and has been reluctant to allow long
term market rent leases during the interim period before sale of the property and construction
related to reconfiguration of buildings.
In order to conclude to an “as is” value as of the effective date of this report the cost of
demolition of the affected buildings, the resulting reconstruction costs of the new configuration
and fill-up costs to stabilized occupancy must be deducted from our previous concluded
hypothetical value of the subject as if stabilized and with reconfigured buildings in place.
Demolition and Reconstruction Costs
We have viewed architect’s and engineering plans2 detailing demolition of the southern portion
of the buildings, and reconstruction of the buildings along with required site work for new fire
lanes and parking.
The costs associated with this work were provided by construction bids from Graycor
Construction Company and R.T. Monaco, Inc. Copies of the bids are included in the addendum.
We note that R.T. Monaco’s bid is a requested 15% mark up from their 2016 figures. The bid
for demolition costs is considered current. Per agreement with ADOT we have utilized the bids
provided herein as market costs. Use of additional current competitive bids may impact this
estimate.
Demoltion
Site Work $157,564
Building $795,630
Bonds/Fees/Tax/Contingencies $232,264
Total $1,185,458
Reconstruction
Site and Building $2,234,388
Total Demolition and Reconstruction $3,419,846
Rounded Total $3,420,000
Provided Cost Estimates
1 After reconfiguration 2 Prepared by Irwin G. Pasternack dated July 17, 2015 (Job No. 2132040) and JMA Engineering Corporation
MONTANDON FARLEY VALUATION SERVICES 100
Fill-Up Costs
Within this report we estimate stabilized occupancy at 90%. The subject has 86,684 square feet
on long term leases with the remaining space either vacant or on short term leases (one to four
months) with mostly below market rental rates. This results in 231,656 square feet that needs to
be leased at market lease terms concluded herein.
Square Feet
Total Building Area 353,711
Stabilized Occupancy at 90% 318,340
Occupancy - Long Term Leases - 24% 86,684
Needed to Achieve 90% Occupancy 231,656
Lease Status
Based on our conversations with industrial brokers active in the subject area, including Tom
Louer of Lee & Associates that has represented the subject property in the past, we conclude it
is unlikely that meaningful leasing activity will occur during the twelve-month demolition and
reconstruction period. However, we have estimated that stabilized occupancy could be achieved
within 12 months of completion of building reconfiguration. Leasing during this period after
reconstruction suggests an average six months of vacancy (12 months/ 2). Accordingly, we
calculate the total effective fill-up period to represent 18 months of rent loss (12 months during
demolition/reconstruction and six months fill-up).
A summary of the projected holding cost to reach stabilized occupancy based on market rents
and expenses included herein is included next. Some rent loss is offset by interim month-to
month leases at below market rates which are likely to continue throughout the reconstruction
period. According to the subject’s current rent roll1 the tenancy on interim short-term leases
equates to 162,108 square feet with monthly rental revenue equating to $63,312. These tenants
also reimburse fixed CAM and insurance expense totaling $4,587 per month. The total of rent
and reimbursements total approximately $.0.47 per square foot of area occupied by short term
tenancy. After reconstruction this space is treated as part of the vacant space calculated above.
Tenants will either vacate or sign new market based leased contracts. We note that the
reconstruction area is buffered by vacant suites which we have projected to remain vacant until
reconstruction is finished.
1 Based on leases provided
MONTANDON FARLEY VALUATION SERVICES 101
Leasing Fees
231,656 Sq. Ft. x $0.49 Sq. Ft.(1)/Mo. x 60 Months x 5% $340,534
Rent Loss
231,656 Sq. Ft. x $0.47 Sq. Ft./Mo. x 18 Months $1,959,810
Free Rent 231,656 Sq. Ft. x $0.47 Sq. Ft./Mo. x 2 Months $217,757
Expense Reimbursement Loss
231,656 Sq. Ft. x $0.17 Sq. Ft.(2)/Mo. x 18 Months $701,234
Tenant Improvement Allowance
231,656 Sq. Ft. x $2.00 Sq. Ft. $463,312
Total Before Profit $3,682,646
Less: Revenue from Existing Interim Tenancy on Short Term Contracts
162,108 Sq. Ft. x $0.47 Sq. Ft./Mo. x 12 Months ($914,289)
Total $2,768,357
Rounded Total $2,770,000
(1) Average market rent for the suites over the lease term
Fill-Up Costs
(2) Remiburseable expenses (from income approach) less management fee
The projected demolition and reconstruction costs previously discussed is added to our projected
fill-up costs below. A new owner of the subject will be required to reconfigure the subject
buildings within twelve months and we have included a profit & contingency allowance equal
to approximately 15% of all costs.
Demolition & Reconstruction Costs $3,420,000
Fill-Up Costs $2,770,000
Subtotal $6,190,000
Profit (Rounded) $930,000
Total $7,120,000
Fill-Up and Reconstruction Costs
As Is Value Calculation:
Subtracting these costs from our as if stabilized value results in the following leased fee “as is”
value.
As If Stabilized and Reconfigured Value $27,150,000
Less: Demo, Reconstruction and Fill-up $7,120,000
"As Is" Leased FeeValue $20,030,000
"As Is" Value
MONTANDON FARLEY VALUATION SERVICES 102
VALUATION CONCLUSION
After considering all of the facts available to us, subject to the underlying assumptions and
limiting conditions contained herein, it is our opinion that the leased fee estate in the subject
property had an “as is” market value, as of December 19, 2017, of
$20,030,000
Extraordinary Assumption: The subject is known within the real estate community to be an excess parcel owned by ADOT that is planned for disposition. The “as is” market value concluded herein is predicated on the extraordinary assumption that once an offer to purchase the subject is made the subject will then be advertised for thirty days seeking an additional offer. If there is an additional offer the subject will be sold in one transaction to one buyer at a public auction that is appropriately advertised. The sale will be on an “as is, where is” basis wherein the successful bidder will be required to demolish and reconfigure the southern 50 to 60 feet of three of the subject’s buildings within twelve months of purchase in compliance with municipal and industry standards and in accordance with plans, specifications and costs provided to the appraisers and summarized herein. Our value assumes leases are valid as described herein. Our value also assumes ADOT will provide temporary construction easements necessary to complete the demolition and reconstruction (see Stipulations Upon Ownership Transfer section of this report herein). The successful bidder most close escrow within two months and does not have a due diligence period during escrow. The seller (ADOT) does not pay brokerage fees. The use of these assumptions may affect assignment results.
MONTANDON FARLEY VALUATION SERVICES 103
CERTIFICATION
We certify that, to the best of our knowledge and belief:
• The statements of fact contained in this report are true and correct. • The reported analyses, opinions, and conclusions are limited only by the reported
assumptions and limiting conditions, and are our personal, impartial, and unbiased professional analyses, opinions, and conclusions.
• We have no present or prospective interest in the property that is the subject of this report, and no personal interest with respect to the parties involved.
• We have no bias with respect to the property that is the subject of this report or to the parties involved with this assignment.
• Our engagement in this assignment was not contingent upon developing or reporting predetermined results.
• Our compensation for completing this assignment is not contingent upon the development or reporting of a predetermined value or direction in value that favors the cause of the client, the amount of the value opinion, the attainment of a stipulated result, or the occurrence of a subsequent event directly related to the intended use of this appraisal.
• The reported analyses, opinions, and conclusions were developed, and this report has been prepared, in conformity with the requirements of the Code of Professional Ethics & Standards of Professional Appraisal Practice of the Appraisal Institute, which include the Uniform Standards of Professional Appraisal Practice.
• The use of this report is subject to the requirements of the Appraisal Institute relating to review by its duly authorized representatives.
• Wendell L. Montandon, MAI and R. John McDonald, MAI have made a personal inspection of the property that is the subject of this report.
• No one provided significant professional assistance to the persons signing this report. • We have performed no services, as an appraiser or in any capacity, regarding the property
that is the subject of this report within the three-year period immediately preceding acceptance of this assignment.
• As of the date of this report, Wendell L. Montandon, MAI and R. John McDonald, MAI, have completed the continuing education program for Designated Members of the Appraisal Institute.
__________________________________ Date: June 12, 2018 Wendell L. Montandon, MAI Certified General Real Estate Appraiser Certificate Number 30159, State of Arizona __________________________________ R. John McDonald, MAI Certified General Real Estate Appraiser Certificate Number 31618, State of Arizona
RIGHT OF WAY SECTION
MONTANDON FARLEY VALUATION SERVICES 104
CERTIFICATE OF APPRAISERS
Project Number: H744101R
Parcel Number: L-C-047 Prologis
We hereby certify:
That we personally inspected, the property herein appraised, and that we have afforded the
property owner the opportunity to accompany us at the time of inspection. We also made a
personal field inspection of each comparable sale relied upon in making said appraisal. The
subject and the comparable sales relied upon in making the appraisal were represented by the
photographs contained in the appraisal.
That we have given consideration to the value of the property, the damages and benefits to the
remainder, if any; and accept no liability for matters of title or survey. That, to the best of our
knowledge and belief, the statements contained in said appraisal are true and the opinions, as
expressed therein, are based upon correct information; subject to the limiting conditions therein
set forth.
That no hidden or unapparent conditions of the property, subsoil, or structures were found or
assumed to exist which would render the subject property more or less valuable; and we assume
no responsibility for such conditions, or for engineering which might be required to discover
such factors. That, unless otherwise stated in this report, the existence of hazardous material,
which may or may not be present in the property, was not observed by us or acknowledged by
the owner. The appraiser, however, is not qualified to detect such substances, the presence of
which may affect the value of the property. No responsibility is assumed for any such
conditions, or for any expertise or engineering knowledge required to discover them.
That our analysis, opinions, and conclusions were developed, and this report has been prepared
in conformity with the Uniform Standards of Professional Appraisal Practice.
That this appraisal has further been made in conformity with the appropriate State and Federal
laws, regulations, and policies and procedures applicable to appraisal of right-of-way for such
purposes; and that, to the best of our knowledge, no portion of the value assigned to such
property consists of items which are non-compensable under the established laws of said State.
That we understand this appraisal may be used in connection with the acquisition of right-of-
way for a highway to be constructed by the State of Arizona with the assistance of Federal aid
highway funds or other Federal funds.
That neither our employment nor our compensation for making the appraisal and report are in
any way contingent upon the values reported herein.
MONTANDON FARLEY VALUATION SERVICES 105
That we have no direct or indirect present or contemplated future personal interest in the
property that is the subject of this report, or any benefit from the acquisition of the property
appraised herein.
That we have not revealed the findings and result of such appraisal to anyone other than the
proper officials of the Arizona Department of Transportation or officials of the Federal Highway
Administration, and we will not do so unless so authorized by proper State officials, or until we
are required to do so by due process of law, or until we are released from this obligation by
having publicly testified as to such findings.
That our opinion of the leased fee estate in the subject property had an “as is” market value, as
of December 19, 2017 of $19,980,000, based on our independent appraisal and the exercise of
our professional judgment.
Date: June 12, 2018
Signature:
Arizona Certified General Real Estate Appraiser #30159
Signature:
Arizona Certified General Real Estate Appraiser #31618
MONTANDON FARLEY VALUATION SERVICES 106
UNDERLYING ASSUMPTIONS AND LIMITING CONDITIONS
1. That title to the property is good and merchantable. 2. That no liability is assumed on account of inaccuracy or errors in any information furnished
by others whom this appraiser contacted at the site or elsewhere and which has been used in making this appraisal.
3. That no responsibility is assumed for legal matters affecting the property, such as title
defects, liens, overlapping boundaries, etc. 4. That no survey has been made of the property for purposes of this report. 5. That no right is given to publish this report or any part thereof without the written consent
of the writer. 6. That the valuation estimates contained herein apply as of the date of this appraisal only. 7. That we do not authorize the out-of-context quoting from or partial reprinting of this
appraisal report. Further, neither all nor any part of this appraisal report shall be disseminated to the general public by the use of media for public communication without the prior written consent of the appraiser signing this appraisal report, particularly as to valuation conclusions, the identity of the appraiser or firm with which he is connected, or any reference to the Appraisal Institute, or the MAI designation.
8. That the distribution of value between land and building applies only under the present
program of utilization and does not apply under any other premise. 9. That there are no hidden or unapparent conditions of the property, subsoil, potential flooding
hazards, hydrology, chemical contamination or structures, which would render it more or less valuable.
10. The appraiser has noted in the appraisal report any adverse conditions (such as needed
repairs, depreciation, the presence of hazardous wastes, toxic substances, etc.) observed during the inspection of the subject or that he or she became aware of during the normal research involved in performing the appraisal. Unless otherwise stated in the appraisal report, the appraiser has no knowledge of any hidden or unapparent conditions of the property or adverse environmental conditions (including the presence of hazardous wastes, toxic substances, etc.) that would make the property more or less valuable, and has assumed that there are no such conditions and makes no guarantees or warranties, express or implied, regarding the condition of the property. The appraiser will not be responsible for any such conditions that do exist or for any engineering or testing that might be required to discover whether such conditions exist. Because the appraiser is not an expert in the field of environmental hazards, the appraisal report must not be considered as an environmental assessment of the property.
ZONING MAP
FLOOD MAP
WEST ALONG ELWOOD
STREET PAST SUBJECT
BUILDING 1 –
4355 EAST ELWOOD
STREET ON LEFT
EAST ALONG ELWOOD
STREET PAST SUBJECT
BUILDING 2 –
4424 EAST ELWOOD
STREET ON RIGHT
EAST ALONG ELWOOD
STREET PAST SUBJECT
BUILDING 4 –
4424 EAST ELWOOD
STREET ON RIGHT
SOUTH AT BUILDING 4 FROM ELWOOD STREET
SOUTH ALONG WEST PROPERTY LINE
BUILDING 4 - 4425 EAST ELWOOD STREET
SUITE 104 (CLARIANT )
ENTRANCE RECEPTION AREA
WAREHOUSE AREA WAREHOUSE AREA
SUITE 104;
QUALITY CONTROL AND
ANALYTICAL TESTING AREA
SUITE 104;
LAB TESTING AREA
ENTRANCE TO VACANT SUITE 107 OPEN OFFICE AREA IN SUITE 107
SUITE 107
BREAKROOM CONFERENCE ROOM
TYPICAL OFFICE WAREHOUSE
SOUTH ELEVATION TENANT EQUIPMENT AND EFSR
EQUIPMENT ROOM
DOCK HIGH LOADING AREA PARKING AREA NORTH OF BUILDING 4
BUILDING 3 - 4445 EAST ELWOOD STREET
SUITE 113 (AMERICAN AIRLINES)
OPEN OFFICE AREA BREAK ROOM
TYPICAL OFFICE RECENTLY REMODELED RESTROOM
WAREHOUSE IN SUITE 113
(AMERICAN AIRLINES)
ENTRANCE TO SUITE 107
(J & K CABINETRY KITCHEN AND BATH)
SHOWROOM OFFICE IN SUITE 107 (J & K) BREAKROOM IN SUITE 107 (J & K)
WAREHOUSE IN SUITE 107 (J & K) WAREHOUSE IN SUITE 107 (J & K)
NORTHWEST AT EAST
BUILDING ELEVATION
SOUTHWEST CORNER OF BUILDING 3
(AREA PLANNED FOR DEMOLITION)
WEST ALONG SOUTH
PROPERTY LINE PAST
BUILDING 3 AT LEFT
OFFICE AREA OF SUITE
101 PLANNED FOR
DEMOLITION
WAREHOUSE AREA OF
SUITE 101 PLANNED FOR
DEMOLITION; NEW
RECONFIGURED
SOUTHERN WALL TO BE
NEAR ALIGNMENT OF
SUPPORT COLUMNS
BUILDING 2 - 4535 EAST ELWOOD STREET
OFFICE AREA OF SUITE 110
(PLANNED FOR DEMOLITION)
WAREHOUSE AREA OF SUITE 110; NEW
RECONFIGURED SOUTHERN WALL TO BE
NEAR ALIGNMENT OF SUPPORT COLUMNS
EAST IN WAREHOUSE AREA OF SUITE 110;
AREA LEFT OF SUPPORT COLUMNS TO BE
DEMOLISHED
WAREHOUSE AREA OF SUITE 106
(CURRENTLY VACANT)
WAREHOUSE AREA OF SUITE 106 ENTRANCE TO SUITE 101
(REDI CARPET)
OPEN OFFICE OF SUITE 101
(REDI CARPET)
RESTROOM OF SUITE 101
(REDI CARPET)
SUITE 101 (REDI CARPET)
OPEN OFFICE CONFERENCE ROOM
BREAKROOM WAREHOUSE
DOCK AREA OF SUITE 101
(REDI CARPET)
ENTRANCE TO SUITE 105
(CURRENTLY VACANT)
OFFICE AREA OF SUITE 105 TYPICAL COMMON RESTROOM
OF SUITE 105
WAREHOUSE AREA OF
SUITE 105
NORTHEAST AT WEST
ELEVATION
EAST PAST BUILDING 2
ALONG SOUTH
PROPERTY LINE
BUILDING 1 - 4555 EAST ELWOOD STREET
WEST AT ENTRANCE TO SUITE 101
(SOUTHERN SECTION
PLANNED FOR DEMOLITION)
OFFICE AREA OF SUITE 101
(PLANNED FOR DEMOLITION)
WAREHOUSE AREA OF SUITE 101
(AREA LEFT OF COLUMN SUPPORTS TO BE
DEMOLISHED)
WEST AT ENTRANCE TO SUITE 105
(PROLOGIS)
OPEN OFFICE AREA OF SUITE 105
(PROLOGIS)
OPEN OFFICE AREA OF SUITE 105
(PROLOGIS)
BREAKROOM OF SUITE 105
(PROLOGIS)
WEST AT ENTRANCE OF SYNERGY
INSTALLATION SOLUTIONS
RECEPTION AREA OF SYNERGY OPEN OFFICE AREA OF SYNERGY SUITE
WAREHOUSE AREA OF SYNERGY OPEN OFFICE AREA OF SUITE 111 (DHL)
SUITE 111 (DHL)
BREAK ROOM TYPICAL RESTROOM
WAREHOUSE WAREHOUSE RESTROOM
NORTH WEST AT EAST ELEVATION
SOUTH ALONG EAST ELEVATION
davey
Typewritten Text
davey
Typewritten Text
davey
Typewritten Text
Legal Description
davey
Typewritten Text
davey
Typewritten Text
ARIZONA DEPARTMENT OF TRANSPORTATION
RIGHT OF WAY GROUP
RIGHT OF WAY DISPOSAL REPORT
The undersigned has examined the title to the property described in SCHEDULE A–1 herein, and the fee owner is: The State of Arizona, by and through its Department of Transportation Address: 205 South 17th Avenue, Mail Drop 612E, Phoenix, Arizona 85007 By virtue of that certain: FINAL ORDER OF CONDEMNATION in Civil Case No. CV2010-029393, Superior Court of the State of Arizona in and for Maricopa County, STATE OF ARIZONA ex rel. JOHN HALIKOWSKI, Director, Department of Transportation, Plaintiff, vs. PROLOGIS (fka: Security Capital Industrial Trust), a Maryland Real Estate Investment Trust; and MARICOPA COUNTY, Defendants, dated January 28, 2011, recorded February 2, 2011 in Document No. 20110096470. Upon compliance with REQUIREMENTS herein, satisfactory title will vest in the proposed purchaser.
LEGAL DESCRIPTION
SEE SCHEDULE A–1 ATTACHED REMARKS: The Schedule B Items are shown herein for the benefit of Right of Way appraiser. Date of Search: October 12, 2017 Examiner: Shirley Seeley Reviewer: N/A
Update to: Examiner: Reviewer: Update to: Examiner: Reviewer: Update to: Examiner: Reviewer: Update to: Examiner: Reviewer:
County: Maricopa County Tax Arb: 124-55-646B Disposal: N/A Tracs No.: 010 MA 151 H7441 01R Highway: Phoenix-Casa Grande Excess Land: L-C-047 Fed. No.: Unassigned Section: Salt River-Base Line Rd Parcel No.: 7-10654
- 2 -
SCHEDULE A–1 LEGAL DESCRIPTION
That portion of the Southeast Quarter and the Southwest Quarter of Section 19, Township I North, Range 4 East, Gila Salt River Base and Meridian, Maricopa County, Arizona, as depicted on Exhibit “A” attached, Sheets P-19, P-20, and P-63 & P-64 of ADOT Drawing D-7-T-986, the Right of Way Plans of PHOENIX-CASA GRANDE HIGHWAY, Salt River-Base Line Rd Section, Project H7441 01R. NOTE: The legal description of the area to be sold will be produced by the ADOT Right of Way Delineation Unit.
END OF SCHEDULE A–1
- 3 -
REQUIREMENTS
1. Purchase Agreement and 1st Addendum to Purchase Agreement to be executed by purchaser.
2. Special Warranty Deed to contain the following disclosure:
“This conveyance is subject to 1st Addendum to Purchase Agreement containing Terms, Conditions and Stipulations of this transaction which apply to the Grantee herein, their successor’s and/or assigns and is on file at the Arizona Department of Transportation’s Engineering Building located at 205 S. 17th Ave. Phoenix, AZ. 85007. Reservation for 2 50’X70’ bill board areas at each south corner of property, a 48’ visibility easement over the south boundary of the property between each bill board easement and meandering easements for utilities and access.
3. Request Appraisal as if already cut off and demolished.
4. Request Rent Roll and/or copies of lease from Leasing
Agent. 5. Inform interested parties that plans and permits are
currently in place with the City of Phoenix. Burn CDs of plans to distribute to potential purchaser’s performing due diligence.
6. Verify if any tenants are eligible for relocation benefits.
7. Upon confirmation of successful purchaser, additional
requirements may be necessary which, among other things may include “Furnish documentation to establish who is authorized to properly execute all documents to consummate this transaction”.
8. TCE to be provided by Chris Childers
9. Require Bond be deposited with Escrow; include
instruction in closing instructions. Amount to be determined. Work to be performed within 12 months of close.
10. Record Deed from the STATE of ARIZONA, by and
through its Department of Transportation to the proposed buyer(s).
NOTE: Repurchase rights do not apply due to property being acquired by FOC and Stipulation of Judgement makes no provision for said rights.
END OF REQUIREMENTS
- 4 -
SCHEDULE B
1. A lien of the current year’s taxes. 2. The liabilities and obligations imposed upon the premises by inclusion within the boundaries of
the Salt River Project Agricultural Improvement and Power District. 3. Easement for canal and right of way to carry water in canal, together with all the privileges and
appurtenances, dated 08/14/1914, recorded 08/14/1914, in Book 16 of Miscellaneous, page 166.
4. Easement for canal, with incident thereto, dated 12/30/1911, recorded 03/09/1918, in Book 95
of Deeds, page 634.
5. Restriction for access control to I -10 Phoenix Casa Grande Highway, as set forth in Warranty Deed recorded 04/09/1963 in Docket 4531, page 24 and in Warranty Deed recorded 04/09/1963 in Docket 4531, page 27 and in Warranty Deed recorded 06/27/1965 in Docket 5603, page 108.
6. Easement for line of poles with wires, with rights incident thereto, dated 06/29/1971, recorded
07/06/1971, in Docket 8801, page 453. 7. Easement for a reasonable route of access over an undefined location, dated 07/24/1972,
recorded 09/27/1972, in Docket 9722, page 200. 8. Easement for sewer and water mains, with rights incident thereto, dated 12/26/1972, recorded
01/19/1973, in Docket 9952, pages 750 and 751; thereafter Resolution abandoning a portion thereof dated 10/26/1994, recorded 11/29/94, in Document No. 94-839656.
9. Easement for sewer and water mains, with rights incident thereto, dated 01/20/1976, recorded
02/13/1976, in Docket 11543, page 162; thereafter Resolution abandoning a portion thereof dated 10/26/1994, recorded 11/29/94, in Document No. 94-839656.
10. Easement for a reasonable route of access over an undefined location, dated 03/15/1979,
recorded 03/20/1979, in Docket 13513, page 667.
11. Easement for underground power, with rights incident thereto, dated 05/17/1979, recorded 05/25/1979, in Docket 13658, page 1327.
12. Abandonment of Public Right of way and rights incident thereto, dated 10/10/1984, recorded
10/18/1984, in Document No. 84-454963. 13. Declaration of Conditions, Covenants and Restrictions, recorded in Document No. 84-480253. 14. Terms, conditions and easements contained in that certain Temporary Easement Agreement,
dated 11/02/1984, recorded 11/05/1984, in Document No. 84-480256.
- 5 -
15. Easement for public street and utility purposes, with rights incident thereto, dated 02/13/1985,
recorded 05/13/1985, in Document No. 85-216639. 16. Easement for street purposes as disclosed in Ordinance No. S15661, dated 05/01/1985,
recorded 05/13/1985, in Document No. 85-216622. 17. Easement for water and sewer line purposes as disclosed in Ordinance No. S16261, dated
02/05/1986, recorded 02/21/1986, in Document No. 86-085455. 18. Easement for water and sewer line purposes, with rights incident thereto, dated 10/01/1985,
recorded 02/21/1986, in Document No. 86-085465. 19. Easement for water line, with rights incident thereto, dated 06/02/1986, recorded 03/17/1987, in
Document No. 87-159438.
20. Easement for wastewater line purposes, with rights incident thereto, dated 06/02/1986, recorded 05/22/1987, in Document No. 87-325166.
21. Easement for underground power, with rights incident thereto, dated 03/11/1996, recorded
03/19/1996, in Document No. 96-180801. Recorded easement is not disclosed herein.
22. Easement for water line purposes, with rights incident thereto as disclosed by Oridinance, dated 09/20/1995, recorded 06/20/1996, in Document No. 96-434431.
23. Resolution No. 18801, abandoning water line easements and sewer line easements, dated
10/09/1996, recorded 10/17/1996, in Document No. 96-738165.
24. Easement for underground power, with rights incident thereto, dated 10/22/1994, recorded 11/18/1996, in Document No. 96-812340, thereafter the Salt River Project Agricultural Improvement and Power District quit claimed all right, title and interest in Document No. 98-100402.
25. Easement for underground power, with rights incident thereto, dated 01/28/1998, recorded
02/10/1998, in Document No. 98-100401.
26. Conservation Easement, dated 10/22/2002, recorded 10/22/2002, in Document No. 2002-1062150.
27. Easement for underground electrical facilities and all appurtenances and rights incident thereto,
dated 09/27/2010, recorded 10/01/2010, in Document No. 2010-857811.
END OF SCHEDULE B
QUALIFICATIONS
WENDELL L. MONTANDON, MAI
Real Estate Appraiser, Market Research Analyst, and Consultant
Professional Experience Over forty continuous years as full-time real estate appraiser
and consultant, initially mentored by Frank Kelly MAI, charter president of the Arizona Chapter of the American Institute of Real Estate Appraisers; acquired the appraisal firm of Kelly & Kelly from the Estate of Frank Kelly in July of 1972, merging it with that of Walter Winius, Jr., MAI in December 1973, to form the appraisal and planning firm of Winius Montandon, Inc
In July of 1997, analysts having a combined 70+ years of
experience together at Winius Montandon, Inc. formed the
advisory and appraisal firm now known as Montandon Farley
Valuation Services.
Education BS degree in construction from Arizona State University in
1963 followed by a variety of real estate analyst courses mostly
sponsored by the American Institute of Real Estate Appraisers
prior to obtaining the MAI designation in 1974; subsequently
attended seminars and courses sponsored by real estate
affiliates including week-long sessions in Investment Analysis
and Statistical Analysis; currently certified under the Appraisal
Institute’s continuing education program
Professional Affiliations MAI membership designation from the Appraisal Institute (a
merger of the American Institute of Real Estate Appraisers and the Society of Real Estate Appraisers); served the American Institute of Real Estate Appraisers as follows:
National Appraisal Review Committee, 1975-77
National Elective Examinations Committee, 1978-85;
Vice Chairman, 1983; Chairman, 1984-85;
National Board of Examiners - Examinations, 1984-85
National Division of Professional Certification and
Recognition Committee, 1983
Regional Panel of Professional Standards Committee,
1990-1992
President of Arizona Chapter 41, AIREA, 1980
Qualifications of Wendell L. Montandon, MAI
Page 2
Professional Affiliations
(Continued…) Chapter Membership Committee, 1984
National Research and Information Committee, 1992-93
National General Examinations Committee. 1992-94
Assistant Regional Member, Review and Counseling
Committee, 1992-93
Certifications Certified General Real Estate Appraiser
Certificate Number 30159, State of Arizona
Community Service Past President, Phoenix Sundown Rotary
Current Member at Rotary Club “100” Phoenix Past member Phoenix Rehabilitation Appeals Board, Social
Venture Partners, Valley Partnership and Commercial Mortgage Bankers Association; occasional guest speaker appearances regarding trends in the real estate industry
Specialties: General practitioner with experience analyzing, valuing and
reviewing appraisals of varying interests in all types of real
estate except for non-sand and gravel mining estates; for the
purpose of estimating retrospective, current and prospective
market value, insurable value, values required by assessors,
distressed value, liquidation value, investment value etc.
Intended Uses and Users: Security for a loan, eminent domain compensation, renewal
rents, purchase option prices, partnership splits, litigation support, tax appeals, insurance compensation, etc.; some of the intended users include lenders, investors, estate planners, public agencies and private parties with condemnation needs, attorneys, accountants, divorcing parties, general and limited partners, planners, title companies, tax authorities, individuals and trustees performing due diligence, appraisal management companies, appraisal review companies etc
Geographic Area
of Expertise Specializes in Arizona assignments, but has evaluated
properties in more than 20 states, including California, Nevada,
Texas, and Utah
Qualification As Maricopa County Superior Court US District Court Expert Witness Yavapai County Superior Court US Tax Court Yuma County Superior Court Federal Bankruptcy Court Pima County Superior Court
Qualifications of Wendell L. Montandon, MAI Page 3
Representative Clients
Alliance Bank
Bank of America
Bank of Boston
Bankers Trust Company, New York, NY
California Bank & Trust
Chemical Bank, New York, NY
Citibank (Arizona)
Comerica Bank-California
Enterprise Bank & Trust
First Citizens Bank
First Financial Bank
Firstar Metropolitan Bank
Great Western Bank, Colorado Springs, CO
Guaranty Bank
INTRUST Bank
JP Morgan Chase Bank
LaSalle National Bank
Meridian Bank
National Bank of Arizona
Nevada State Bank
Northern Trust Bank
Rio Salado Bank
U.S. Bank, RETECHS
Wells Fargo Bank, RETECHS
Zions National Bank
Atlantic Asset Management
Crossland Mortgage
Crossin Dannis, Inc.
Financial Resource Management Trust Company
Harris Trust Bank of Arizona
Investors Mortgage Loan Service
J.E. Roberts
L.J. Melody
LaSalle Commercial Appraisal Management Minnesota Mutual Life Insurance Company Principle Mutual Life Insurance Group Property Reserve, Inc. Real Estate Underwriting Services Situs, a Ranieri Partners Company Standard Insurance Company, Portland, OR State Mutual Life Assurance Company of America United of Omaha Life Insurance Company
Representative Clients - (Continued…) Arizona Public Service Company Carl’s Jr. Restaurants Chevron Combined Health Resources Empire Machinery Fidelity National Title Insurance Company Firestone Tire & Rubber Company General Electric Company Goodyear Tire & Rubber Company Grossman Company Properties Honeywell, Inc. IBM Corporation Jaren Corporation Kentucky Fried Chicken Kroger Lucent MCO Properties/Horizon Corporation Marriott Corporation McShane Corporation McDonald’s Corporation Mobil Oil Corporation NAI Horizon P M Realty Advisors Irwin Pasternack, Architect Perini Corporation Retirement Corporation of America Safeco Title Insurance Company Samaritan Health Services Schuck & Sons Construction Company Southwest Forest Industries Standard Oil Company of California Shell Oil Company Texaco, Inc. Trammell Crow Company Transwestern Pipeline Wal-Mart Stores Del E. Webb Corporation Westinghouse Electric Corporation
City of Avondale City of Glendale City of Peoria City of Phoenix City of Mesa City of Scottsdale City of Tempe City of Tolleson Maricopa County Maricopa County Flood Control District Maricopa County Department of Transportation Arizona State University Cartwright School District Osborn School District Peoria School District Phoenix Elementary School District Phoenix Union High School District #210 Wickenburg School District Arizona State Retirement System Arizona Department of Transportation Arizona Parklands Foundation Arizona Department of Administration Colorado River Indian Community Department of the Army, Los Angeles District, Corps of Engineers Federal Bureau of Investigation Federal Deposit Insurance Corp. Federal Home Loan Bank Board Federal Savings & Loan Insurance Corp. Fort Defiance Indian Hospital General Services Administration Internal Revenue Service Resolution Trust Corporation USDA, Forest Service US Postal Service
Dep
art
men
t of
Fin
an
cia
l In
stit
uti
on
s
Rea
l E
state
Ap
pra
isal
X
Cert
ifie
d G
enera
l R
eal
Est
ate
Ap
pra
iser
CE
RT
IFIC
AT
E N
UM
BE
R
EX
PIR
AT
ION
DA
TE
WE
ND
EL
LL
.M
ON
TA
ND
ON
30159
16thdayofAugust,2016.
Au
gu
st31,2018
QUALIFICATIONS
R. John McDonald, MAI
Real Estate Valuation Specialist and Consultant
Professional Experience Over 28 continuous years as a full-time real estate appraiser and
consultant, initially with Winius Montandon, Inc., from 1990 to 1997 and then with Montandon Farley Valuation Services (previously Montandon Farley Re-Ad Group) from 1997 to present
Education Bachelor of Science degree in Business with emphasis in
Finance and Real Estate from Arizona State University in 1987 followed by a variety of real estate analyst courses mostly sponsored by the Appraisal Institute prior to obtaining the MAI; Subsequently attended seminars and courses as part of continuing education sponsored by real estate affiliates; currently certified under the Appraisal Institute’s continuing education program
Professional Affiliations MAI membership designation from the Appraisal Institute Member, Arizona Chapter, Appraisal Institute Education Committee Member, Arizona Chapter, Appraisal
Institute, 2003 Directory Committee Member, Arizona Chapter Appraisal
Institute 2000-2001 Certifications Certified General Real Estate Appraiser Certificate Number 31618, State of Arizona Community Service Board of Directors, Director, Charter Board, Villa Montessori
(Non-profit school with 700+ students; $6.6 million budget), Phoenix – 2001 to Present (President of Charter Advisory Board 2005-2007)
Chairman, Campus Development, Villa Montessori – 2000 to Present
Specialties: General practitioner with vast experience analyzing, valuing and
reviewing appraisals of varying interests in all types of real estate; for the purpose of estimating retrospective, current and prospective market value, insurable value, values required by assessors, distressed value, liquidation value, investment value etc. Property types valued include high-rise and mid-rise office complexes, medical office, surgery centers, apartments (including those encumbered by various affordable house programs), shopping centers, restaurants, mini-storage facilities, industrial warehouses, distribution buildings, manufacturing buildings, mobile home parks, movie theaters, auto dealerships, condominium buildings, land subdivisions, speculative acreage, ground leases and various special purpose properties.
Qualifications of R. John McDonald, MAI Page 2 Intended Uses and Users: Experience includes preparing appraisals for use in security for
a loan, small business administration financing, renewal rents, purchase option prices, partnership splits, litigation support, condemnation, tax appeals, insurance compensation, etc.; some of the intended users include lenders, investors, estate planners, public agencies, attorneys, accountants, divorcing parties, general and limited partners, planners, title companies, tax authorities, individuals and trustees performing due diligence, appraisal management companies, appraisal review companies etc.; clients include financial institutions, government agencies, investment managers, pension funds, corporations, insurance companies, attorneys and developers
Expert Witness Appeared as Expert Witness: Superior Court of Arizona Geographic Area of Expertise Specializes in the Metropolitan Phoenix, Prescott/Prescott
Valley, Tucson and Greater Flagstaff areas of Arizona, but has evaluated properties throughout the state
Signed in the Superintendent’s office at 2910 North 44th Street, Suite 310,in the City of Phoenix, State of Arizona, this
Robert D. Charlton Superintendent
This document is evidence that: has complied with the provisions of
Arizona Revised Statutes, relating to the establishment and operation of a:
and that the Superintendent of Financial Institutions of the State of Arizona has granted this license to transact the business of a
This license is subject to the laws of Arizona and will remain in full force and effect until surrendered, revoked or suspended as provided by law.