Architecture of normal faults in the rift zone of central north Iceland
Tatiana Tentlera,*, Stefano Mazzolib
aDepartment of Earth Sciences, University of Uppsala, SwedenbDipartimento di Scienze della Terra, Universita di Napoli ‘Federico II’, Italy
Received 10 March 2004; received in revised form 3 April 2005; accepted 5 May 2005
Available online 8 August 2005
Abstract
This work examines the architecture and propagation of normal faults that accommodate extension in the rift zone of central north Iceland.
It is based on a structural study of portions of three grabens, their normal faults and dilational fractures in basaltic lavas of the Fremri-Namur
and Dyngjufjol volcanic systems. We analyzed the shape, throw and dilation along faults in order to infer their possible evolution. The shape
of throw profiles departs from elliptical varying along each fault with throw being lower at the fault and segment tips. Propagation of fault
segments is accommodated by dilational fractures nucleating at their respective tips. Segments link by lateral propagation of one or both tips
or by the development of intervening linking segments. Two orders of fault segmentation indicate that the present throw accumulated by
many increments as the fault scarps changed their geometries. Faults have large dilational components weakly correlated with fault throw and
length.
q 2005 Elsevier Ltd. All rights reserved.
Keywords: Normal fault; Throw; Dilation; Fault segmentation; Fault propagation
1. Introduction
Regions of active extension are commonly associated
with normal faulting and dilational fracturing in the upper
crust. The orientation of a fault zone depends mainly on the
bulk regional stress field and local stress perturbations
across the plate boundaries as shown by fault slip analyses
(Bergerat et al., 1990; Angelier et al., 1997) and monitored
by GPS measurements (Foulger et al., 1992; Sigmundsson
et al., 1995), while the location of individual fractures is also
controlled by the mechanical characteristics of the faulted
material (Pollard et al., 1982; Cowie, 1998). Normal faults
typically consist of offset linked segments with displace-
ment along them being controlled by a number of factors.
Among them are those characterizing the local fault surface:
its shape, aspect ratio, and the frictional properties along it
(Maerten et al., 1999; Mazzoli and Di Bucci, 2003),
variations in lithology and mechanical rock properties
(Cartwright et al., 1995; Wilkins and Gross, 2002), fault
location (Dawers et al., 1993; Ackermann et al., 2001) and
0191-8141/$ - see front matter q 2005 Elsevier Ltd. All rights reserved.
doi:10.1016/j.jsg.2005.05.018
* Corresponding author. Tel.: C46 18 4712569; fax: C46 18 4712591.
E-mail address: [email protected] (T. Tentler).
configuration of stress field (Acocella et al., 2000;
Gudmundsson, 2000). Analytical modeling (Walsh and
Watterson, 1987; Walsh et al., 2002) and 3-D boundary
element modeling (Willemse, 1997; Maerten et al., 1999)
suggest that normal faults grow episodically with displace-
ment accumulating through stages. As fault segments
propagate towards each other, areas around their overlaps
serve as sites of local fracturing where segment linkage is
governed by the stress state at their tips (Cartwright et al.,
1995; Cowie, 1998).
This study examines the architecture of brittle exten-
sional fractures in a rift zone of Iceland. Analysis of the
shape of fault scarps and distribution of throw are important
for better understanding of the mechanics of fault growth,
the evolution of the fault population, and the general
systematics of brittle failure. Here we analyze the shape,
throw and width of grabens within a spreading zone of
Iceland in order to infer the evolution of fault propagation.
Iceland represents a rare example of an emergent portion
of a divergent plate boundary where structures that are
usually submarine can be observed conveniently on land.
The good exposure of faulted blocks in Iceland, the
relatively simple succession of mostly basaltic lavas and
hyaloclastites, and a highly homogeneous extension offer
the opportunity to study fault growth in comparatively
Journal of Structural Geology 27 (2005) 1721–1739
www.elsevier.com/locate/jsg
T. Tentler, S. Mazzoli / Journal of Structural Geology 27 (2005) 1721–17391722
simple form. The processes common at oceanic ridges are
complicated in Iceland by a mantle plume (Saunders et al.,
1997), influencing the configuration of the plate boundary
and increasing the volumes of eruptive products. The crustal
thickness is still a matter of debate in Iceland (Palmason,
1980; Florenz and Gunnarsson, 1991) and is likely to be 20–
35 km (Smallwood et al., 1999). A part of deformation in
Iceland is distributed within the rift zone with its en echelon
volcanic systems (Fig. 1a) consisting of volcanoes,
magmatic fissures, normal faults and dilational fractures.
Magmatic fissure is defined here as a linear eruptive source,
served by deep-rooted dike-like feeders. The term dilational
fracture is used when the displacement is primarily by
movement normal to failure surface, but normal fault when
it is parallel to failure surface. Most volcanic systems in
Iceland are 40–80 km long and 10–15 km wide, and
emanate from a central volcano (Saemundsson, 1978;
Einarsson, 1991).
2. Field method
The work is based on detailed field studies of two
neighboring volcanic systems: Fremri-Namur and Dyngjuf-
jol (Fig. 1a), situated within the Northern Volcanic Zone of
Iceland and characterized by similar lithologies. The
dimensions and orientations of faults of Sveinar, Sveinagja
and Veggir graben (Fig. 1b) and the dilational fractures in
these areas were measured in the field. The measurements
here were made only along a part of each graben. However,
all the data came from either the only areas available for
structural analyses or from the most significant part of each
graben. The lengths, throws and openings of the faults
(Fig. 2a) were measured at intervals of 100 m along their
lengths using a tape and a clinometer. We define the fracture
length as the linear distance between the tips of a continuous
surface rupture, and the fault opening as the maximum
horizontal opening between the footwall and hanging wall
of the fault measured normal to fault strike. Fault throw is
measured as the maximum vertical displacement between
the top of the footwall and the hanging wall, immediately
beyond their tilted margins (Fig. 2a). This method avoids
the complication of possible tilting along the edge of the
hanging wall. The throw measured directly at the edge of
the graben would result in its underestimation. Tilting of the
hanging wall block of faults in Icelandic active rift zone is
common and attributed to variations in subsidence, friction
along the fault plane (Gudmundsson and Backstrom, 1991;
Angelier et al., 1997) or monocline development due to
upward fault propagation (Grant and Kattenhorn, 2004).
Cumulative throw for stepped fault scarps is determined as
the sum of the throws of all elements of the scarp. Throw
gradient is defined here as the variation in throw per unit
length of the fault.
The fault scarps of the Sveinar graben are covered by soil
or grass locally, so the throw could only be constrained there
with an accuracy of G3 m, but along the lengths of most
faults throw was measured with an accuracy of G1 m.
Faults of the Sveinar graben have significant dilational
components. However, soil and grass obscured fault gaps at
many locations, hence not allowing a reliable measurement
of fault opening. The throw of faults along the Sveinagja
graben could be determined (G1 m) at all sites. However,
there are some irregularities in opening along these faults
that can be partly attributed to sand covering them locally.
The interpretation involved in measuring portions of these
faults with complex subsidence patterns may also contribute
to an inaccuracy of G2 m in the estimation of the opening.
The faults of the Veggir graben are well exposed, allowing
measurement of the fault throw and opening to an accuracy
of G1 m along most of their length. Locally, sand and
tillite fill the fault openings along the western graben
fault, resulting in errors in measured fault opening
estimated at G3 m.
3. Geological setting
3.1. Fremri-Namur volcanic system
This volcanic system is located within the active rift zone
of northeastern Iceland (Fig. 1a). The swarm of northerly-
trending magmatic fissures is 160 km long and up to 17 km
wide, and characterized by rhyolitic extrusions, large lava
fields and basaltic flows (Fig. 1b). The central volcano
domain (number 1 in Fig. 1b) is characterized by a high-
temperature geothermal field. Voluminous fissure eruptions
at Fremri-Namur have resulted in fields of recent lavas
largely filling the innermost graben of the rift system.
Subparallel magmatic fissures emanate from the center of
the system and extend to the NNE and SSW. The three
major magmatic fissures are: (i) Kraeduborgir which is
10 km long and is 2500–3000 years old; (ii) Raudholar-1,
which is 6 km long and originated in the early Holocene;
and (iii) Rauduborgir–Randarholar, which is 70 km long
and is 6000–8000 years old. All these are expressed at the
surface as crater rows.
Our detailed studies were carried out along the Sveinar
graben, which lies along the central zone of the NNE-
trending Rauduborgir–Randarholar crater row (Fig. 1b).
The absence of glacial erosion or glacial infilling indicate
that Sveinar faults post-dated the deglaciation (Thorar-
insson, 1959). A large part of the Sveinar graben probably
formed during the eruption of the Sveinar lava, 6000–8000
years ago (Gudmundsson and Backstrom, 1991). The
graben was probably initiated by gradual prolongation of
segments along strike as magmatic fissures opened up step-
wise. The graben continued its formation in following
rifting episodes, particularly propagating and deepening
during the 1875 eruption. According to Thorarinsson
(1959), the 1875 eruption began north of the Raudubor-
gir–Randarholar fissure and propagated SSW until it met the
Fig. 1. Geological map of Fremri-Namur and Dyngjufjol volcanic systems (a), adapted after Saemundsson (1977) and Johannesson and Saemundsson (1998).
Encircled numbers: 1—Fremri-Namur volcanic center; 2—Ketildyngja lava shield; 3—Kerlingardyngja lava shield; 4—Askja volcanic center; 5—Herdubreid
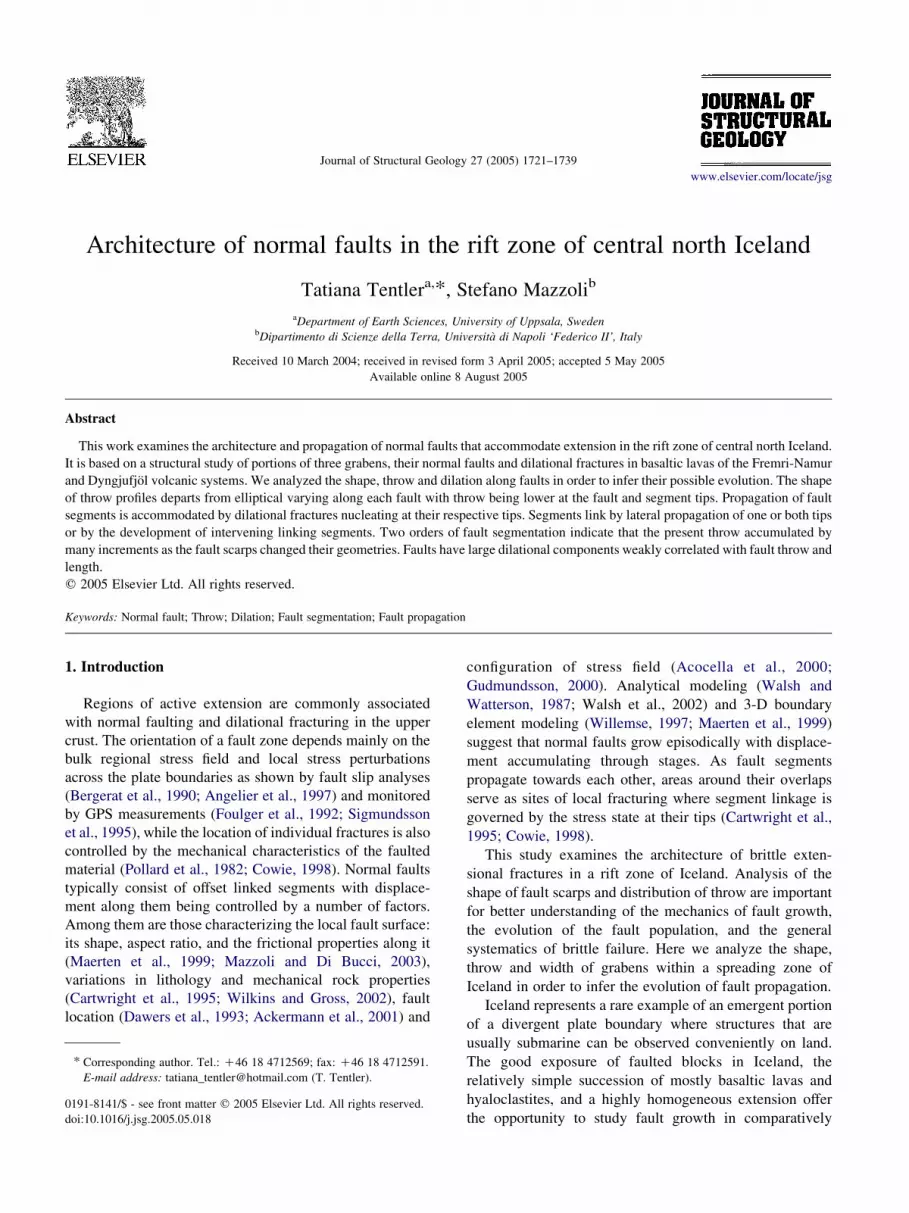
volcanic center; 6—Herdubreiddarfjoll; 7—Burfell; 8—Dettifoss waterfall; 9—Hafrafell. The inset map (b) shows the location of the studied volcanic systems:
A—Fremri-Namur; B—Dyngjufjol.
T. Tentler, S. Mazzoli / Journal of Structural Geology 27 (2005) 1721–1739 1723
T. Tentler, S. Mazzoli / Journal of Structural Geology 27 (2005) 1721–17391724
already existing graben; it then changed direction and
followed the graben southward. Structural features found by
Gudmundsson and Backstrom (1991) indicate that the
course of the lava was locally directed by the existing
portions of the graben and that displacement on graben
faults continued after the eruption.
3.2. Dyngjufjol volcanic system
This swarm of near-parallel magmatic fissures,
200 km long and up to 20 km wide, is located next to
the volcanic system of Fremri-Namur (Fig. 1a). From its
central volcano, Askja (number 4 in Fig. 1b), the
system extends to the NNE to the northern coast of
Iceland, and to the SSW at least as far as the
Vatnajokull ice sheet (Fig. 1b). Sub-glacial volcanic
activity resulted in the formation of hyaloclastite and
pillow-lava ridges and post-glacial activity was mostly
limited to the emplacement of basaltic magma
(Sigurdsson and Sparks, 1978). A system of subparallel
fissures emanates from the Askja volcano SSW where it
encounters a glacier, obscuring possible evidence of
fissure activity and NNE where it overlaps with the
Herdubreid volcano (number 5 in Fig. 1b). The northern
part of the fissure swarm is well expressed on the
surface by crater rows, fractures and fault systems,
including the Sveinagja and Veggir grabens.
The Sveinagja graben developed by several rifting
episodes over thousands of years with at least some
segments generated in Holocene times (Gudmundsson and
Backstrom, 1991). The largest part of the present Sveinagja
graben was probably formed before the voluminous
extrusion of lava in 1875 (Sigurdsson and Sparks, 1978).
Development of the graben continued in association with
the 1872–1875 rifting episode, during which extension was
accommodated by displacement on boundary faults and
formation of new fractures (Gudmundsson and Backstrom,
1991). Most of the northern portion of the graben was
covered by 1875 lava, while only limited outpourings of
lava occurred to the south. As a result, the southern part of
Sveinagja developed into the deep open graben observed at
present. Some of the lava flow units flowed within an
already existing graben, others have been faulted by a few
meters subsequent to their emplacement (Sigurdsson and
Sparks, 1978).
The formation of the Veggir graben remains some-
what obscure as, to our knowledge, there was no
previous systematic study. The boundary faults of the
Veggir dissect Holocene lava flows indicating that the
graben, at least in its present form, developed in
Holocene time. Similarly to the Sveinar and Sveinagja
grabens, the faults of Veggir probably followed the
growth of magmatic fissures and propagated stepwise
northwards, away from Askja.
4. Structures of the Sveinar graben
4.1. Fracture distribution
The 0.5–0.8-km-wide Sveinar graben extends north–
south for about 20 km (Fig. 2b). The area around it is
characterized by a large number of normal faults (Fig. 2c
and d) and dilational fractures that occur in clusters
elongated subparallel to the main graben. Isolated normal
faults are locally surrounded by short, subparallel dilational
fractures that nucleated within 2–20 m of their tips. They
also develop subparallel within 100 m of major faults
(Fig. 3a), particularly where segments link (Fig. 3b and c).
Such fractures are commonly absent within the next 700–
800 m away from the graben faults, but beyond this distance
they can again be observed. The strike of the 118 dilational
fractures in the area shows a slight variation from south to
north (Fig. 4). Most of these fractures in the southern sector
strike N058EG108 (Figs. 2b and 4, area 1). Here, linear
arrays of isolated normal faults outside the graben are
discontinuous and develop largely west of it. To the north,
the strike of the dilational fractures is dominantly
N3508WG108 and seems less irregular (Figs. 2b and 4,
area 2). Clusters of these fractures are rather small and
major normal faults are rare outside the graben. Most of the
dilational fractures consist of subparallel linked segments
(Fig. 5a). The widest openings are usually found in the
middle part of each fracture segment. The lengths of 128
dilational fractures around the Sveinar graben vary from a
few meters to 2–3 km (Fig. 5b). This length distribution
appears to be best described by the least-square power-law
function: YZ5967XK1.0938. This function overpredicts the
number of fractures shorter than 100 m, but the area
possibly contains a large amount of short fractures, not
sampled here.
4.2. Graben architecture
The boundary faults of Sveinar graben are discontinuous
and consist of segments that have commonly 25–30 m offset
(Fig. 2b). Major faults are subvertical at the surface (within
w58 from vertical), with well-defined scarps (Fig. 2d). Fault
segments are linear or slightly curved in a plane view and
fault tips are distinct. Laboratory modeling shows that
segmented fractures propagate and link in a different
manner, depending on their initial spacing and overlap
(Tentler, 2003a,b; Tentler and Temperley, 2003). Field
observations in the Sveinar area allowed five major modes
of fault segment interaction to be distinguished (Fig. 3c).
Individual segments are either propagated toward each other
by tips or they become linked by new intervening segments.
Non-overlapping, closely-spaced fault segments (number 1
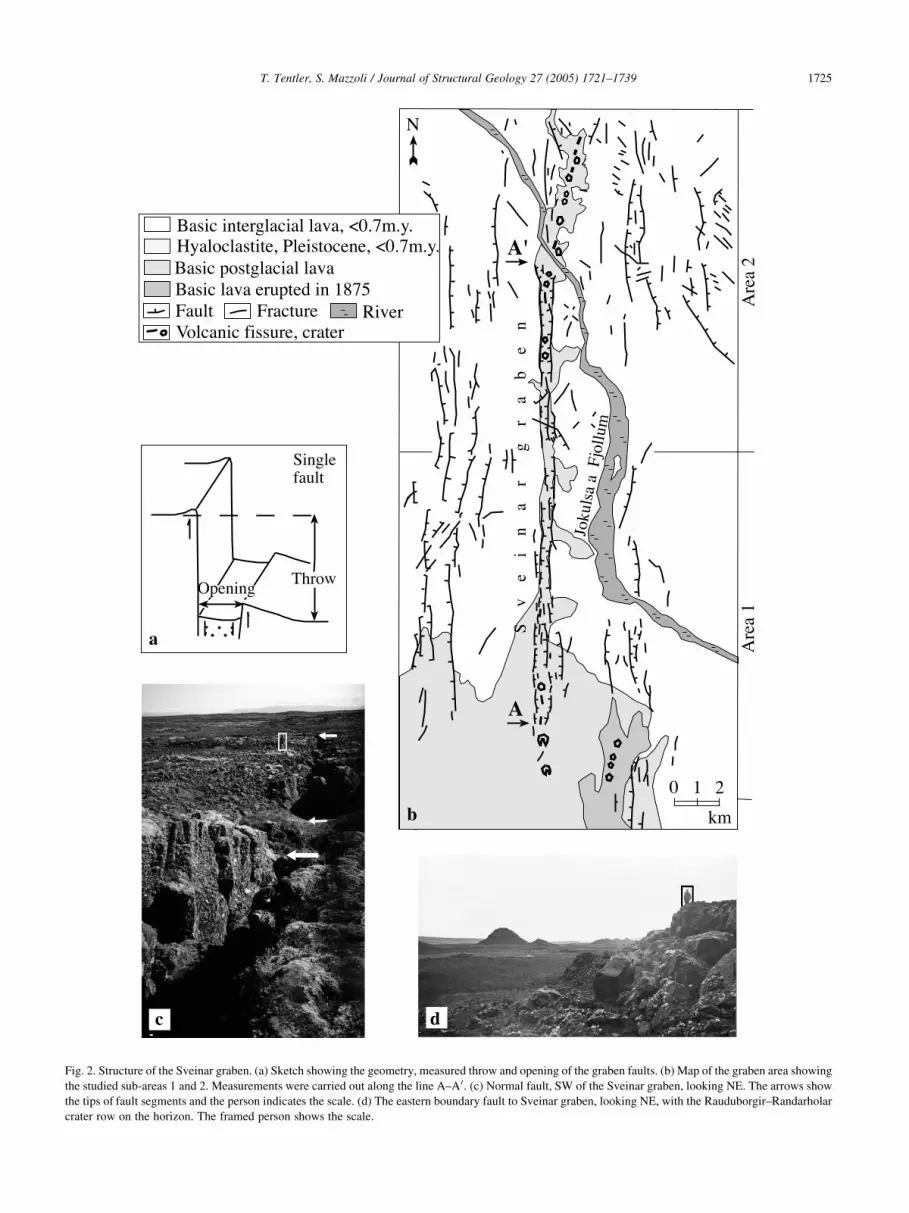
in Fig. 3c) tend to propagate along nearly straight paths
toward each other. The tips of overlapping segments
(number 2 in Fig. 3c) commonly propagate along curved
paths that enclose an intervening core of intact material. The
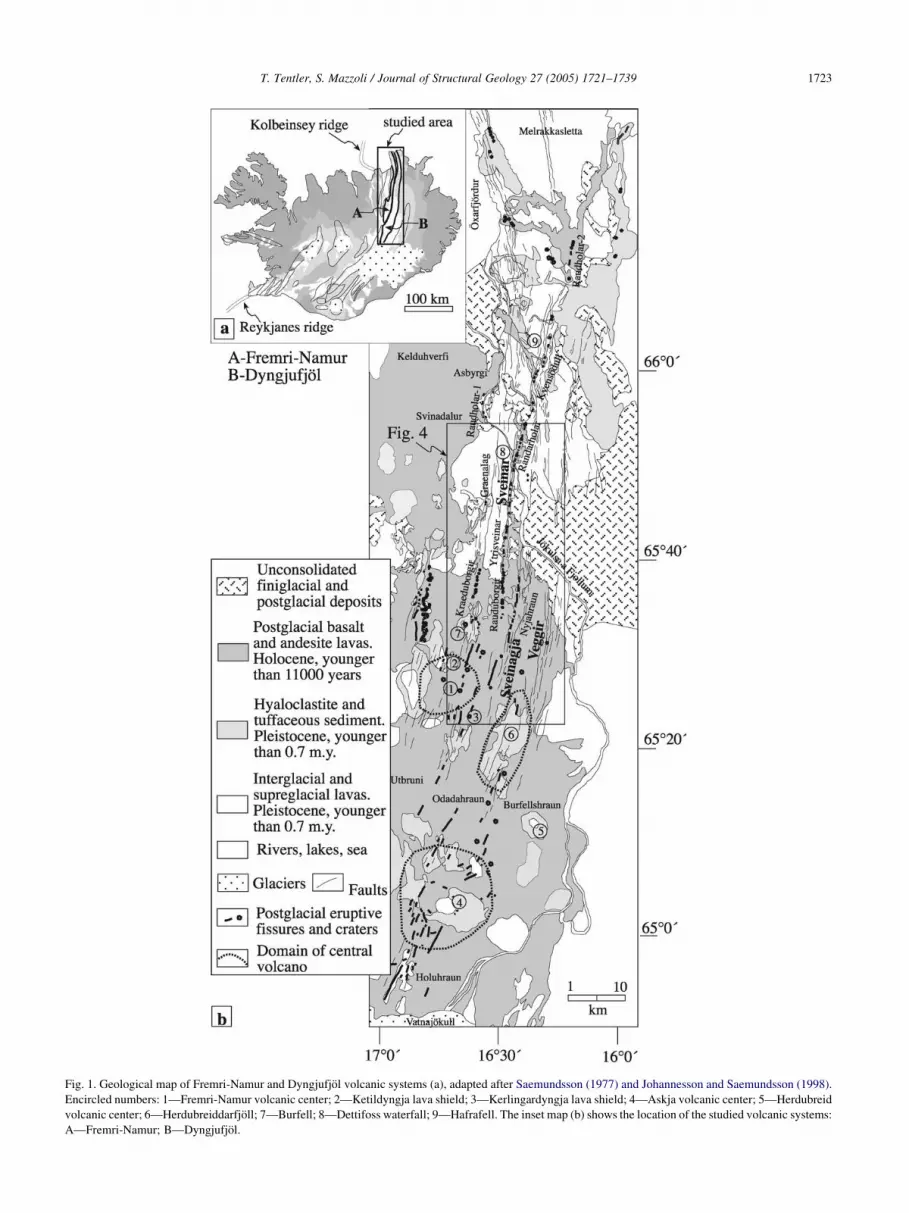
Fig. 2. Structure of the Sveinar graben. (a) Sketch showing the geometry, measured throw and opening of the graben faults. (b) Map of the graben area showing
the studied sub-areas 1 and 2. Measurements were carried out along the line A–A 0. (c) Normal fault, SW of the Sveinar graben, looking NE. The arrows show
the tips of fault segments and the person indicates the scale. (d) The eastern boundary fault to Sveinar graben, looking NE, with the Rauduborgir–Randarholar
crater row on the horizon. The framed person shows the scale.
T. Tentler, S. Mazzoli / Journal of Structural Geology 27 (2005) 1721–1739 1725
T. Tentler, S. Mazzoli / Journal of Structural Geology 27 (2005) 1721–17391726
curvature of tips in this case results from interaction of their
stress fields (Pollard et al., 1982; Willemse, 1997; Maerten
et al., 1999; Acocella et al., 2000; Walsh et al., 2003). In
non-overlapping, widely-spaced fault segments (numbers 3
and 4 in Fig. 3c), usually only one tip propagates to the
sidewall of the other. The tip of the other segment remains
largely passive (number 3 in Fig. 3c) or propagates a short
distance along its main strike (number 4 in Fig. 3c). Where
non-overlapping fault segments are separated by a
significant lateral distance (number 5 in Fig. 3c), they can
link via an intervening segment(s). Such an intervening
segment commonly develops from fractures nucleated in
between tips of the major fault segments. Minor faults and
fractures around the sites of fault segment linkage (Fig. 3b
and c) apparently form as a result of partitioning of the
regional extension associated with propagation of these
segments towards linkage. Such minor fractures are
commonly a few meters long, mostly either parallel to the
main parts of the fault segments or to their curved tips.
Fig. 3. Interaction of fault segments at the surface. (a) Northward view of a segmen
fractures. The arrows show the fracture tips and the person indicates the scale. (b
modes of linkage of fault segments: 1—segments propagate along straight paths to
curved paths; 3—one segment propagates to the sidewall of the other; 4—one seg
short distance along its main strike; 5—segments link via an intervening segmen
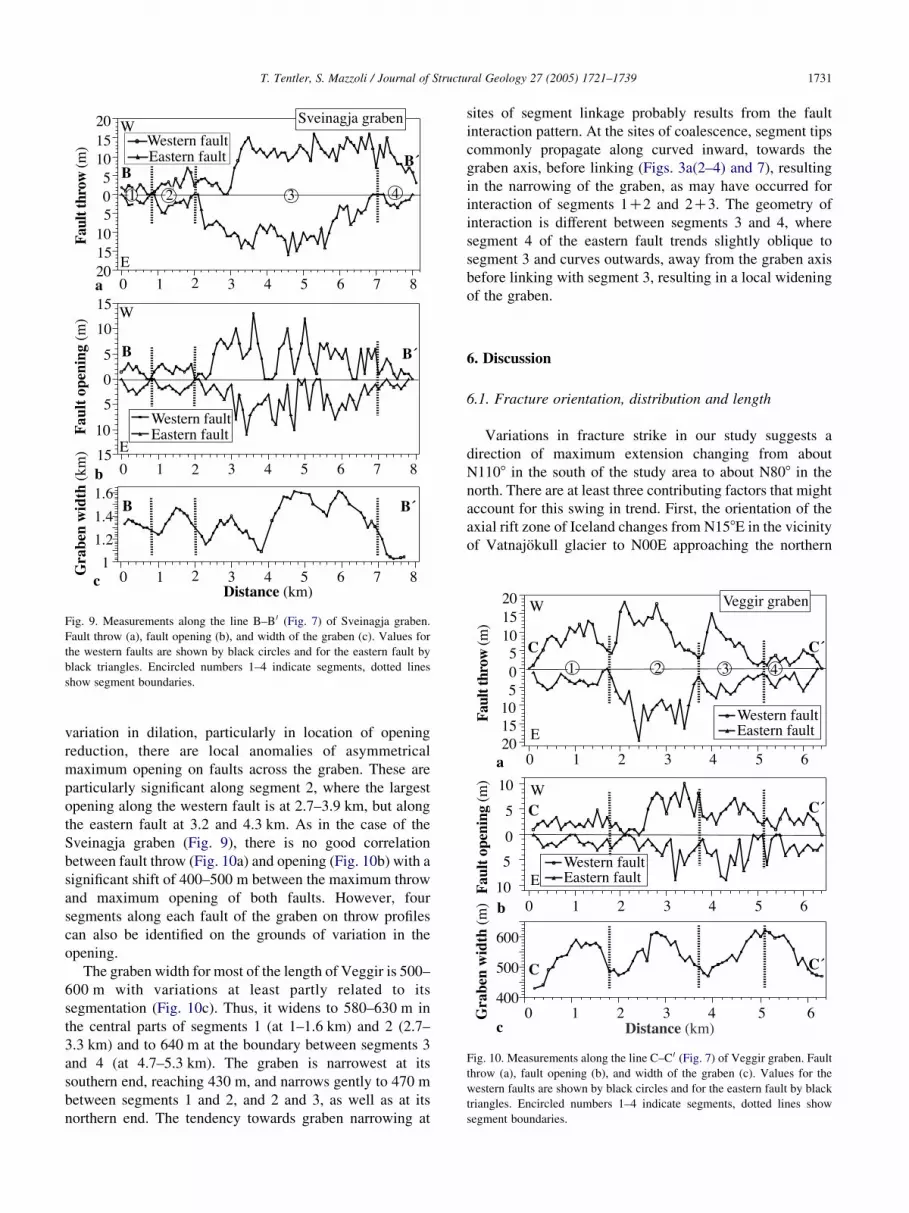
The throws of faults bounding the Sveinar graben
(Fig. 2b) were measured from A to A 0 every 100 m along
fault scarps (Fig. 2a). The average throw on both sides of the
graben is 10 m with a maximum of 23 m (Fig. 6a).
Maximum throws are offset from the center of both graben
faults. On both fault scarps, the throw generally increases
towards the north and deepens the graben. The distributions
of throw along both fault scarps are generally similar, but
the sites of throw amplification and reduction rarely match
exactly across the graben. The variation of throw and tip
zones distinguished along faults suggest that both faults
were strongly segmented on a variety of scales. The length
of the graben can be subdivided into four major segments
(encircled numbers 1–4 in Fig. 6a) that, in turn, consist of
smaller linked sub-segments (letters in Fig. 6a), all with
boundaries marked by throw reduction. Most sub-segment
boundaries match crudely across the graben (e.g. a, b, c of
segment 3; b, c of segment 4). However, there are local
anomalies of asymmetrical throw distribution on eastern
t of the western boundary fault to Sveinar graben and subparallel dilational
) Distribution of the fractures in the zones of fault linkages. (c) Suggested
ward each other; 2—segments propagate to the sidewall of each other along
ment propagates to the sidewall of the other, another segment propagates a
t(s).
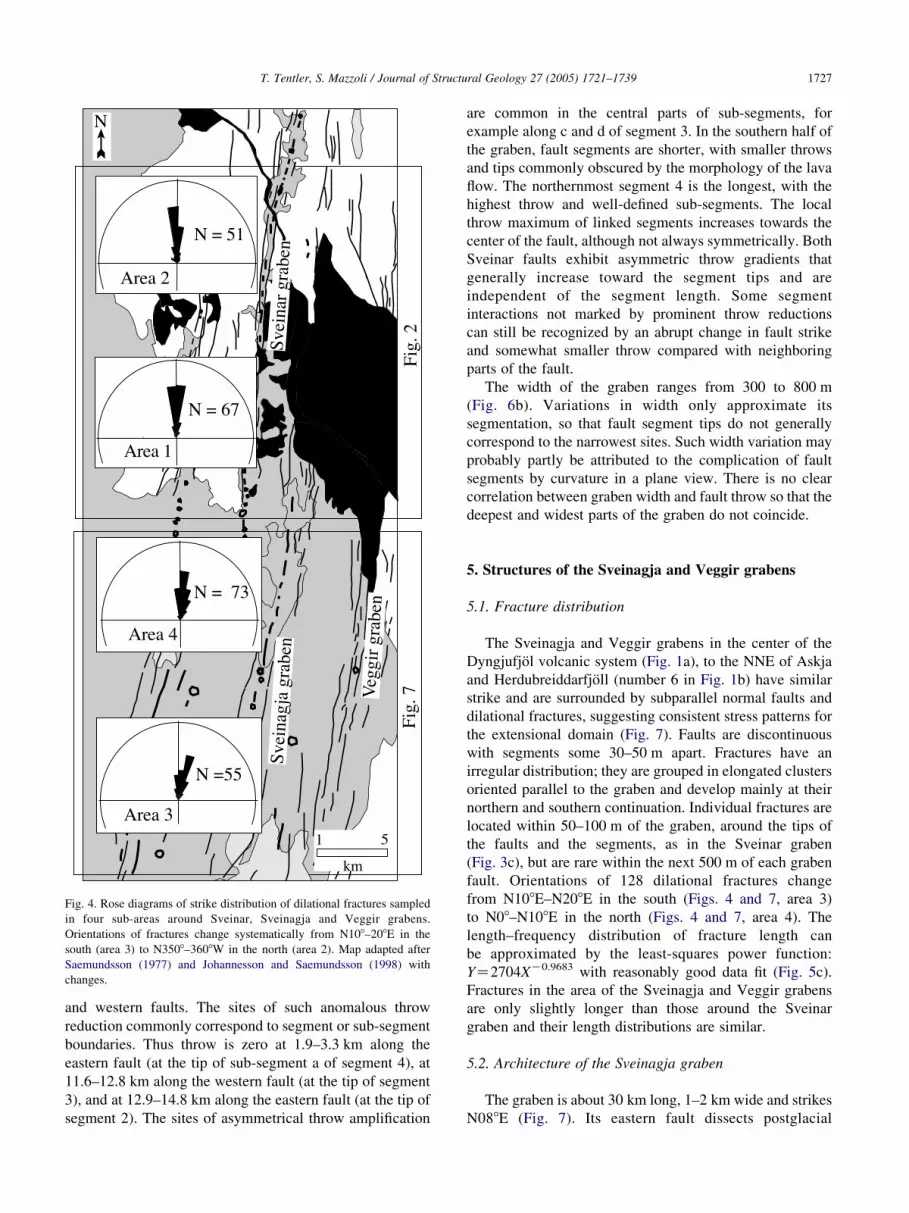
Fig. 4. Rose diagrams of strike distribution of dilational fractures sampled
in four sub-areas around Sveinar, Sveinagja and Veggir grabens.
Orientations of fractures change systematically from N108–208E in the
south (area 3) to N3508–3608W in the north (area 2). Map adapted after
Saemundsson (1977) and Johannesson and Saemundsson (1998) with
changes.
T. Tentler, S. Mazzoli / Journal of Structural Geology 27 (2005) 1721–1739 1727
and western faults. The sites of such anomalous throw
reduction commonly correspond to segment or sub-segment
boundaries. Thus throw is zero at 1.9–3.3 km along the
eastern fault (at the tip of sub-segment a of segment 4), at
11.6–12.8 km along the western fault (at the tip of segment
3), and at 12.9–14.8 km along the eastern fault (at the tip of
segment 2). The sites of asymmetrical throw amplification
are common in the central parts of sub-segments, for
example along c and d of segment 3. In the southern half of
the graben, fault segments are shorter, with smaller throws
and tips commonly obscured by the morphology of the lava
flow. The northernmost segment 4 is the longest, with the
highest throw and well-defined sub-segments. The local
throw maximum of linked segments increases towards the
center of the fault, although not always symmetrically. Both
Sveinar faults exhibit asymmetric throw gradients that
generally increase toward the segment tips and are
independent of the segment length. Some segment
interactions not marked by prominent throw reductions
can still be recognized by an abrupt change in fault strike
and somewhat smaller throw compared with neighboring
parts of the fault.
The width of the graben ranges from 300 to 800 m
(Fig. 6b). Variations in width only approximate its
segmentation, so that fault segment tips do not generally
correspond to the narrowest sites. Such width variation may
probably partly be attributed to the complication of fault
segments by curvature in a plane view. There is no clear
correlation between graben width and fault throw so that the
deepest and widest parts of the graben do not coincide.
5. Structures of the Sveinagja and Veggir grabens
5.1. Fracture distribution
The Sveinagja and Veggir grabens in the center of the
Dyngjufjol volcanic system (Fig. 1a), to the NNE of Askja
and Herdubreiddarfjoll (number 6 in Fig. 1b) have similar
strike and are surrounded by subparallel normal faults and
dilational fractures, suggesting consistent stress patterns for
the extensional domain (Fig. 7). Faults are discontinuous
with segments some 30–50 m apart. Fractures have an
irregular distribution; they are grouped in elongated clusters
oriented parallel to the graben and develop mainly at their
northern and southern continuation. Individual fractures are
located within 50–100 m of the graben, around the tips of
the faults and the segments, as in the Sveinar graben
(Fig. 3c), but are rare within the next 500 m of each graben
fault. Orientations of 128 dilational fractures change
from N108E–N208E in the south (Figs. 4 and 7, area 3)
to N08–N108E in the north (Figs. 4 and 7, area 4). The
length–frequency distribution of fracture length can
be approximated by the least-squares power function:
YZ2704XK0.9683 with reasonably good data fit (Fig. 5c).
Fractures in the area of the Sveinagja and Veggir grabens
are only slightly longer than those around the Sveinar
graben and their length distributions are similar.
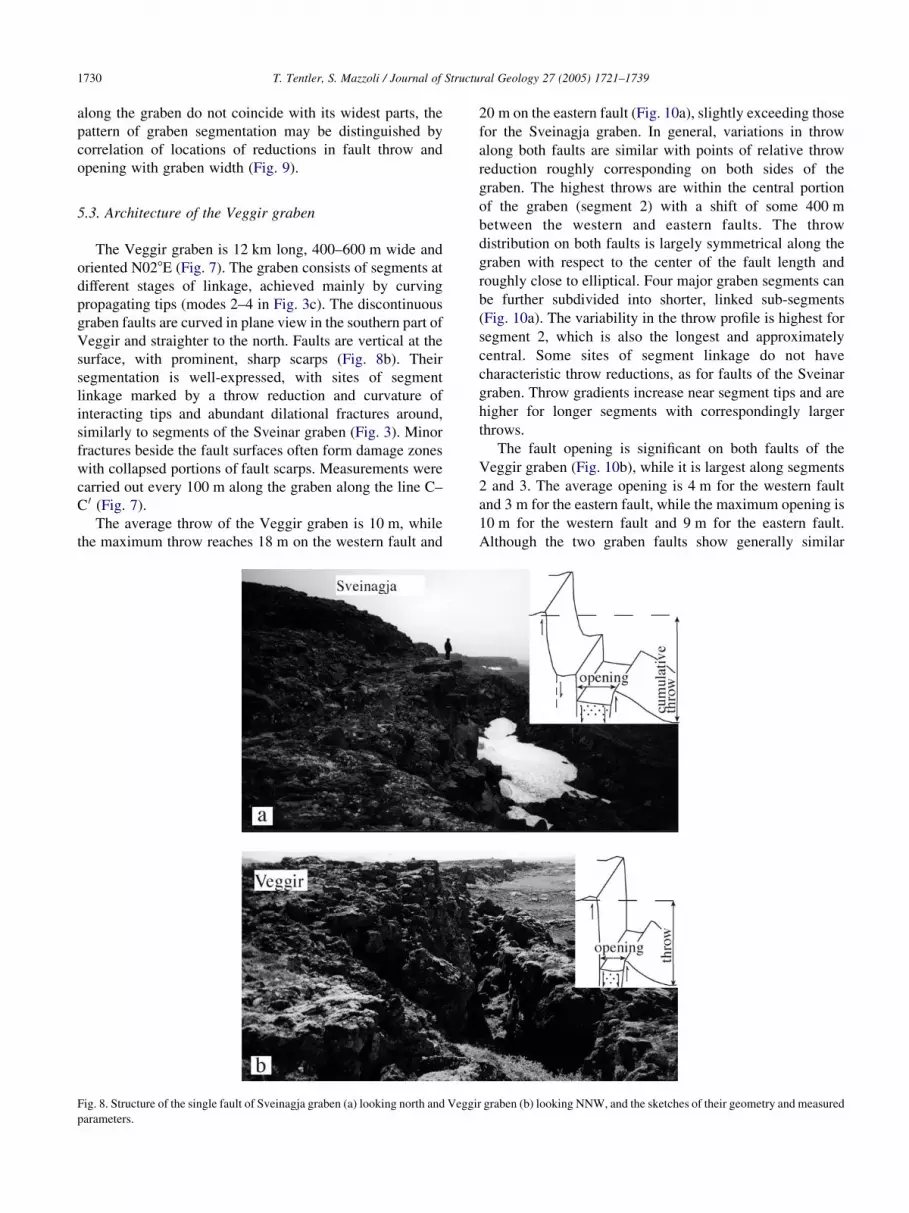
5.2. Architecture of the Sveinagja graben
The graben is about 30 km long, 1–2 km wide and strikes
N088E (Fig. 7). Its eastern fault dissects postglacial
Fig. 5. (a) Tension fractures in basaltic lava of the Fremri-Namur volcanic system. The direction of extension is shown by arrows, the hammer gives the scale.
(b) Histogram showing the length distribution of fractures around Sveinar graben. (c) Fracture length histogram for the Sveinagja and Veggir grabens.
T. Tentler, S. Mazzoli / Journal of Structural Geology 27 (2005) 1721–17391728
pahoehoe lava along most of its length, while the western
fault also dissects some younger aa lava from the volcano
Ketildyngja (Gudmundsson and Backstrom, 1991). The
graben consists of north and south parts that differ in the
degree of fault exposure.
Prior to the 1875 eruption, the northern part of the graben
was probably 10–15 km long, 400–500 m wide with throws
of 10–20 m on its faults (Gudmundsson and Backstrom,
1991). At present the northern part of Sveinagja is 15 km
long and is defined by faults with 4–10 m throw, largely
filled with the Nyjahraun lava covering about 30 km2 with
an estimated volume of 0.3 km3 erupted from the Sveinagja
crater row (Gudmundsson and Backstrom, 1991). The
magmatic fissure is flanked by a row of spatter cones and
consists of irregular segments of various lengths that are
offset by 30–40 m (Sigurdsson and Sparks, 1978). The
poorly defined faults of the northern part of Sveinagja have
not reactivated since the 1875 eruption (Gudmundsson and
Backstrom, 1991). Extensional structures developed in this
part of Sveinagja cover a wide area and the graben structure
is not well defined. The 1875s Nyjahraun lava crops out
only in small isolated patches in the southern part of the
Sveinagja graben, that is 9 km long, 1–1.7 km wide, and it
strikes N078E. Post-1875 activity has increased the throw of
the graben faults (Gudmundsson and Backstrom, 1991),
making the fault scarp of the southern segment prominent,
symmetrical about the magmatic fissure, particularly so at
its northern part. The faults at the southernmost end of this
segment have less regular spacing and orientations.
Because the northern part of Sveinagja is largely
obscured by lava, our field study focused on its southern
segment with well-exposed and continuous faults. These
consist of segments with dilational fractures being common
around sites of their linkage, similarly to structures of the
Sveinar graben (Fig. 3b). Five modes of segment interaction
defined along the Sveinar graben (Fig. 3c) are also
distinguished along Sveinagja. Measurements were carried
out in the southern part of the graben at an interval of 100 m
along the line B–B 0 (Fig. 7).
Faults of the Sveinagja graben are subvertical, with
openings at the surface and are commonly complicated by
fault-bounded relay ramps collapsed into the open fault zone
(Fig. 8a). The maximum throws, up to 17 m, occur near the
center of each fault and they taper off toward the tips
(Fig. 9a). Although variation in fault throw is largely similar
on both sides of Sveinagja, sites of local throw amplification
Fig. 6. (a) Throw profiles for the western (black circles) and eastern (black
triangles) boundary faults along the line A–A 0 (Fig. 2b) of Sveinar graben.
(b) Graben width profile along the line A–A 0 of the Sveinar graben.
Encircled numbers 1–4 indicate segments, letters a–d indicate sub-
segments, dotted lines show segment and sub-segment boundaries.
Fig. 7. Map of Sveinagja and Veggir grabens showing the sampling areas 3
and 4. Measurements were carried out along the lines B–B 0 and C–C 0. Map
adapted after Saemundsson (1977) and Johannesson and Saemundsson
(1998) with changes.
T. Tentler, S. Mazzoli / Journal of Structural Geology 27 (2005) 1721–1739 1729
match only locally across the graben. Four major linked
segments with boundaries, distinguished by throw reduction
and geometries of their tip zones, are numbered in Fig. 9a.
Segments increase in length and throw northward. Local
anomalies of asymmetrical throw distribution on faults
across the graben are mainly throw reductions related to
segment boundaries, such as at 2.8–3 km along the
western fault near the tip of segment 3 and at
6.8–7.3 km along the eastern fault between segments 3
and 4. Throw gradients are significant near segment tips
and highest for segment 3.
Fault opening varies along the faults (Fig. 9b), and the
maximum opening is in the southern part of both faults
(13 m on the western fault and 11 m on the eastern fault).
The shape of the curve for each fault departs from elliptical,
particularly so for the eastern fault. Boundaries of all
segments defined by reduction in throw (Fig. 9a) are also
distinguished by reduction in opening (Fig. 9b). Variation in
opening along the faults is significantly larger compared
with variation in throw, particularly along segment 3 where
the throw is large. Local anomalies of asymmetrical opening
distribution on faults across the graben also occur mainly
along segment 3, at 3.9–4.1, 4.5, and 4.8–5.1 km.
The width of the Sveinagja graben ranges between a
maximum of 1630 m and a minimum of 1030 m along the
line B–B 0 (Fig. 9c). The graben is generally wider at its
central part and widest along the longest segment 3 at 4.3–
5.2 and 5.8–6.2 km. It narrows gently towards its northern
end at about 7300 m and at three intervening points along it:
at 1, 2.3, and 3.8 km. The width fluctuates depending on the
segment location and degree of symmetry across the graben.
Width reductions roughly correspond to the boundaries of
the graben segments except for the width minimum at
3.8 km along segment 3. Fluctuations in graben width are
also imposed by the shape of the fault segments in plane
view, particularly their commonly enhanced curvature at
tips. Although the sites of highest fault throw and opening
T. Tentler, S. Mazzoli / Journal of Structural Geology 27 (2005) 1721–17391730
along the graben do not coincide with its widest parts, the
pattern of graben segmentation may be distinguished by
correlation of locations of reductions in fault throw and
opening with graben width (Fig. 9).
5.3. Architecture of the Veggir graben
The Veggir graben is 12 km long, 400–600 m wide and
oriented N028E (Fig. 7). The graben consists of segments at
different stages of linkage, achieved mainly by curving
propagating tips (modes 2–4 in Fig. 3c). The discontinuous
graben faults are curved in plane view in the southern part of
Veggir and straighter to the north. Faults are vertical at the
surface, with prominent, sharp scarps (Fig. 8b). Their
segmentation is well-expressed, with sites of segment
linkage marked by a throw reduction and curvature of
interacting tips and abundant dilational fractures around,
similarly to segments of the Sveinar graben (Fig. 3). Minor
fractures beside the fault surfaces often form damage zones
with collapsed portions of fault scarps. Measurements were
carried out every 100 m along the graben along the line C–
C 0 (Fig. 7).
The average throw of the Veggir graben is 10 m, while
the maximum throw reaches 18 m on the western fault and
Fig. 8. Structure of the single fault of Sveinagja graben (a) looking north and Veggi
parameters.
20 m on the eastern fault (Fig. 10a), slightly exceeding those
for the Sveinagja graben. In general, variations in throw
along both faults are similar with points of relative throw
reduction roughly corresponding on both sides of the
graben. The highest throws are within the central portion
of the graben (segment 2) with a shift of some 400 m
between the western and eastern faults. The throw
distribution on both faults is largely symmetrical along the
graben with respect to the center of the fault length and
roughly close to elliptical. Four major graben segments can
be further subdivided into shorter, linked sub-segments
(Fig. 10a). The variability in the throw profile is highest for
segment 2, which is also the longest and approximately
central. Some sites of segment linkage do not have
characteristic throw reductions, as for faults of the Sveinar
graben. Throw gradients increase near segment tips and are
higher for longer segments with correspondingly larger
throws.
The fault opening is significant on both faults of the
Veggir graben (Fig. 10b), while it is largest along segments
2 and 3. The average opening is 4 m for the western fault
and 3 m for the eastern fault, while the maximum opening is
10 m for the western fault and 9 m for the eastern fault.
Although the two graben faults show generally similar
r graben (b) looking NNW, and the sketches of their geometry and measured
Fig. 9. Measurements along the line B–B0 (Fig. 7) of Sveinagja graben.
Fault throw (a), fault opening (b), and width of the graben (c). Values for
the western faults are shown by black circles and for the eastern fault by
black triangles. Encircled numbers 1–4 indicate segments, dotted lines
show segment boundaries.
Fig. 10. Measurements along the line C–C 0 (Fig. 7) of Veggir graben. Fault
throw (a), fault opening (b), and width of the graben (c). Values for the
western faults are shown by black circles and for the eastern fault by black
triangles. Encircled numbers 1–4 indicate segments, dotted lines show
segment boundaries.
T. Tentler, S. Mazzoli / Journal of Structural Geology 27 (2005) 1721–1739 1731
variation in dilation, particularly in location of opening
reduction, there are local anomalies of asymmetrical
maximum opening on faults across the graben. These are
particularly significant along segment 2, where the largest
opening along the western fault is at 2.7–3.9 km, but along
the eastern fault at 3.2 and 4.3 km. As in the case of the
Sveinagja graben (Fig. 9), there is no good correlation
between fault throw (Fig. 10a) and opening (Fig. 10b) with a
significant shift of 400–500 m between the maximum throw
and maximum opening of both faults. However, four
segments along each fault of the graben on throw profiles
can also be identified on the grounds of variation in the
opening.
The graben width for most of the length of Veggir is 500–
600 m with variations at least partly related to its
segmentation (Fig. 10c). Thus, it widens to 580–630 m in
the central parts of segments 1 (at 1–1.6 km) and 2 (2.7–
3.3 km) and to 640 m at the boundary between segments 3
and 4 (at 4.7–5.3 km). The graben is narrowest at its
southern end, reaching 430 m, and narrows gently to 470 m
between segments 1 and 2, and 2 and 3, as well as at its
northern end. The tendency towards graben narrowing at
sites of segment linkage probably results from the fault
interaction pattern. At the sites of coalescence, segment tips
commonly propagate along curved inward, towards the
graben axis, before linking (Figs. 3a(2–4) and 7), resulting
in the narrowing of the graben, as may have occurred for
interaction of segments 1C2 and 2C3. The geometry of
interaction is different between segments 3 and 4, where
segment 4 of the eastern fault trends slightly oblique to
segment 3 and curves outwards, away from the graben axis
before linking with segment 3, resulting in a local widening
of the graben.
6. Discussion
6.1. Fracture orientation, distribution and length
Variations in fracture strike in our study suggests a
direction of maximum extension changing from about
N1108 in the south of the study area to about N808 in the
north. There are at least three contributing factors that might
account for this swing in trend. First, the orientation of the
axial rift zone of Iceland changes from N158E in the vicinity
of Vatnajokull glacier to N00E approaching the northern
T. Tentler, S. Mazzoli / Journal of Structural Geology 27 (2005) 1721–17391732
coast (Bergerat et al., 1990). Second, interaction takes place
between the spreading axis on Iceland’s northern coast and
the transform faults in the Tjornes fracture zone. Fissure
swarms near the northern coast do not quite strike parallel to
the rift zone axis (Sigurdsson and Sparks, 1978; Rogn-
valdsson et al., 1998), which may account for the strike of
fractures in this study. Third, fracture orientations probably
reflect the general curvature of fissures emanating from the
central volcano (Gudmundsson, 2000).
Dilational fractures form within 50–100 m of the graben
faults, particularly where segments interact. Most of them
develop as process zone fractures as fault segments
propagate laterally. Few of the isolated faults and fractures
occur within the next 500–800 m of the graben faults,
although this distance varies between grabens and depends
on the length of the corresponding fault segment. Such
fracture distribution indicates stress shadows flanking
grabens as stresses cannot be transmitted across the free
surface of a fault (Ackermann and Schlische, 1997;
Willemse, 1997). Most isolated normal faults here have
the single semi-continuous scarps with aligned segments,
common for small faults in Iceland (Gudmundsson, 1987a;
Angelier et al., 1997). By contrast, graben faults consist of
closely spaced overlapping segments with their interaction
resulting in composite structure with a collapsed block of
rock between fault walls, common along large faults in
Iceland (Acocella et al., 2000; Grant and Kattenhorn, 2004).
The fracture length distribution (Fig. 5) shows that
relatively short fractures are more common than the long
ones, as occurs elsewhere along the rift zone of Iceland
(Gudmundsson, 1987a,b, 2000). Fracture size distribution
can be characterized as power-law, albeit with an exponent
that varies for different fault populations (Cowie and
Scholz, 1992; Watterson et al., 1996). Power-law and
exponential populations probably develop in different strain
regimes when fractures reach a certain density (Gupta and
Scholz, 2000). Most fracture populations in oceanic crust
are described by exponential functions (Carbotte and
Macdonald, 1994; Cowie et al., 1994). However, the
distribution of fracture length in this study best fits power-
law functions (Fig. 5b and c), as common for fractures in
continental crust (Watterson et al., 1996; Cowie, 1998).
Icelandic crust is influenced by a mantle plume resulting in
its thickness (20–35 km) being more similar to that of
typical continental rather than oceanic crust. Such thickened
crust might be the reason for fracture populations
developing in a strain regime common on continents, with
the resulting power-law fracture length distribution obtained
in this study and reported by Gudmundsson (1987a,b) for
fractures in southwest Iceland.
6.2. Fault throw and propagation
Elastic fracture mechanics theory predicts that the throw
on an ideal fault surface is elliptical and decreases from a
central maximum to zero at the tip-line (Walsh and
Watterson, 1987). The throw profiles in Figs. 6a, 9a and
10a follow an elliptical pattern, as was interpreted by
Gudmundsson and Backstrom (1991) for the Sveinagja
graben, but only in the very broadest sense, when
exclusively throw maximums of segments along a fault
are compared. In detail, profiles largely depart from self-
similar elliptical shape with throw varying non-system-
atically and larger than predicted by models for the
propagation of a fault surface in a homogeneous elastic
medium (Walsh and Watterson, 1987; Cowie and Scholz,
1992; Watterson et al., 1996). Such oscillating profiles are
expected if the present throw accumulated by successive
increments (Dawers et al., 1993). Recent field studies
(Wilkins and Gross, 2002; Gawthorpe et al., 2003; Mazzoli
and Di Bucci, 2003) and theoretical models (Maerten et al.,
1999; Walsh et al., 2002, 2003) also advocate such complex
throw distribution. Profiles analyzed here thus represent
combined patterns of throw distribution on the fault
segments, which occurred in a succession of rupture events
as the fault planes grew. Throw gradients along our faults
are highest near segment tips as predicted by linear elastic
fracture mechanics models (Cowie and Scholz, 1992;
Watterson et al., 1996; Willemse, 1997; Walsh et al.,
2003) where a throw reduction at the tip determines the
finite stress concentration (Dawers et al., 1993). The
observed variation in throw gradients at segment tips
indicates that a concentration of stress there is not simply
a measure of rock strength, but depends also on the location
of segments and their mutual orientation (Cartwright et al.,
1995; Cowie, 1998; Acocella et al., 2000). High throw
gradients of some of the near tip segments may also reflect a
slight reactivation of portion(s) of graben.
Profiles of graben faults here reveal a few orders of
segmentation allowing a speculative reconstruction of the
history of segment linkage (Fig. 11). We assume that the
growth rate is the same for each segment within the con-
sidered fault (i.e. the amount of throw of each segment is a
measure of its stage of evolution). Thus the location of
maximum throw on a fault represents where it nucleated
(Dawers and Anders, 1995; Kattenhorn and Pollard, 2001)
and location of throw reduction indicates site of segment
linkage (Walsh et al., 2003).
The linked segments of faults (Figs. 6a, 9a and 10a)
suggest their incremental growth (Fig. 11a and b) where
large segments resulting from the coalescence of several
smaller sub-segments typically show several asymmetric
maximum throws (Fig. 11c). Throw variations are relatively
symmetrical with respect to the maximum throw for the
Sveinagja and Veggir grabens (Figs. 9a and 10a). However,
the southernmost part of the Sveinagja fault (Fig. 9a) and the
northernmost part of the Veggir fault (Fig. 10a), are both
characterized by short, linked segments with low throw
contrasting the abrupt throw decrease at the opposite ends of
faults. Such asymmetrical throw distribution at the opposite
ends of faults have been attributed to differences in segment
length, slip rates, or mechanical interaction effects (Cowie
T. Tentler, S. Mazzoli / Journal of Structural Geology 27 (2005) 1721–1739 1733
and Scholz, 1992; Cartwright et al., 1995; Wilkins and
Gross, 2002). Alternatively, such throw distribution may
indicate different rates of lateral propagation from the center
of the fault towards each of the fault tips (Fig. 11a and b). In
this way, rapidly and continuously propagated fault tips
would be recognized by an abrupt decrease of throw,
whereas slowly and episodically propagated fault tips would
be marked by short sub-segments with consistently low
throw. Another possibility is that the maximum throw on
each fault is where the fault could preferentially be
reactivated over time by slip events. Such a mechanism
could have been the case for the Sveinar faults that have
highly asymmetric throw profiles decreasing from a
maximum at the northern end towards lower values in the
south (Fig. 6a). Such patterns were attributed to mechanical
interaction between segments (Willemse, 1997; Maerten et
al., 1999), but can be alternatively explained by strongly
south-directed graben propagation. Our data (Figs. 6a and
9a) confirm that throw profiles increasingly differ from the
theoretical profiles as faults increase in length (Walsh and
Watterson, 1987). This difference is due to larger effects of
segment interaction and/or asymmetry of lateral fault
propagation.
Throw profiles of longer segments usually reflect
coalescence of their sub-segments. Recent coalescence of
two sub-segments results in a throw deficit with respect to
the new, increased length of the segment (Fig. 11c (i)). This
stage is commonly followed by a period of throw re-
equilibration for a lengthened segment to compensate its
throw deficit and satisfy the displacement–length scaling
(Cowie, 1998). Post-linkage strain accommodation results
in retardation of lateral propagation and accumulation of
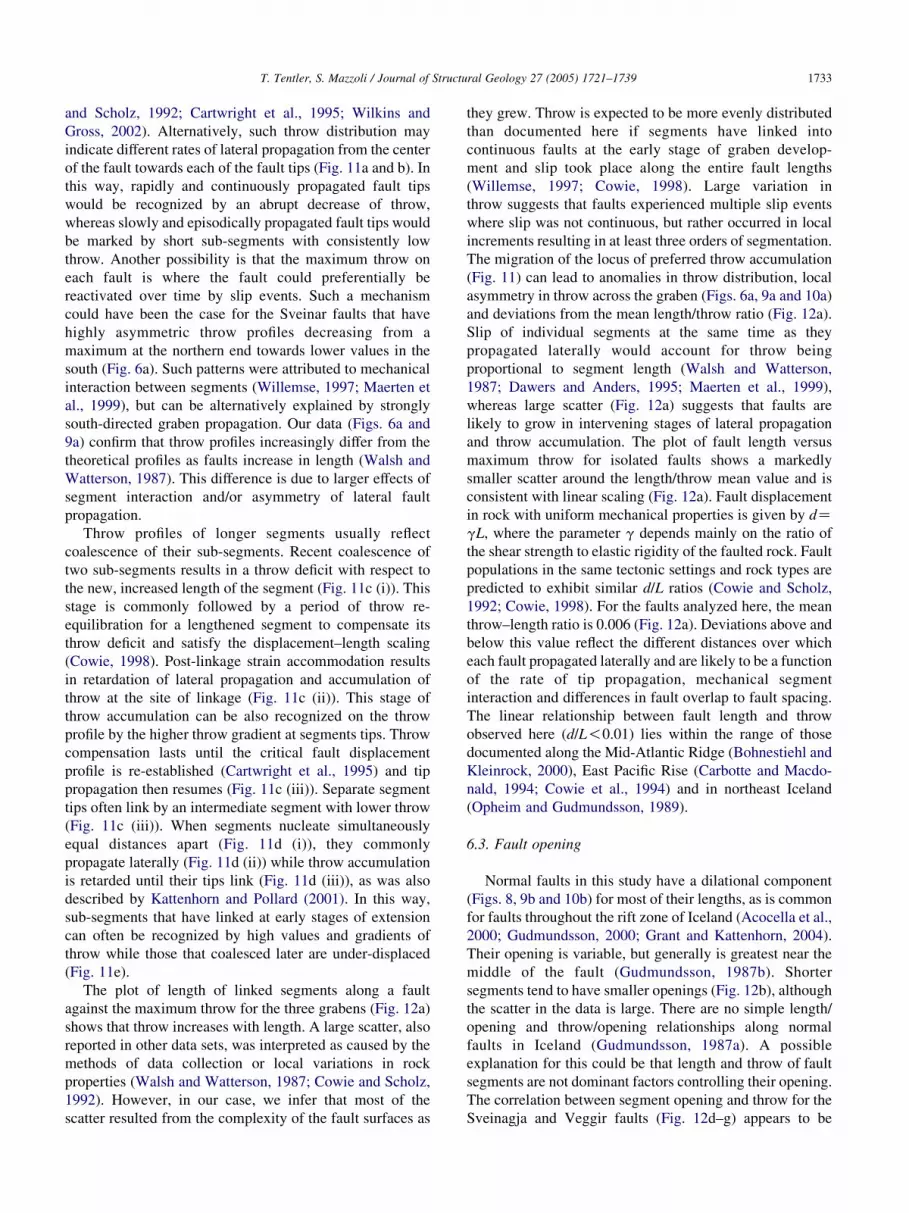
throw at the site of linkage (Fig. 11c (ii)). This stage of
throw accumulation can be also recognized on the throw
profile by the higher throw gradient at segments tips. Throw
compensation lasts until the critical fault displacement
profile is re-established (Cartwright et al., 1995) and tip
propagation then resumes (Fig. 11c (iii)). Separate segment
tips often link by an intermediate segment with lower throw
(Fig. 11c (iii)). When segments nucleate simultaneously
equal distances apart (Fig. 11d (i)), they commonly
propagate laterally (Fig. 11d (ii)) while throw accumulation
is retarded until their tips link (Fig. 11d (iii)), as was also
described by Kattenhorn and Pollard (2001). In this way,
sub-segments that have linked at early stages of extension
can often be recognized by high values and gradients of
throw while those that coalesced later are under-displaced
(Fig. 11e).
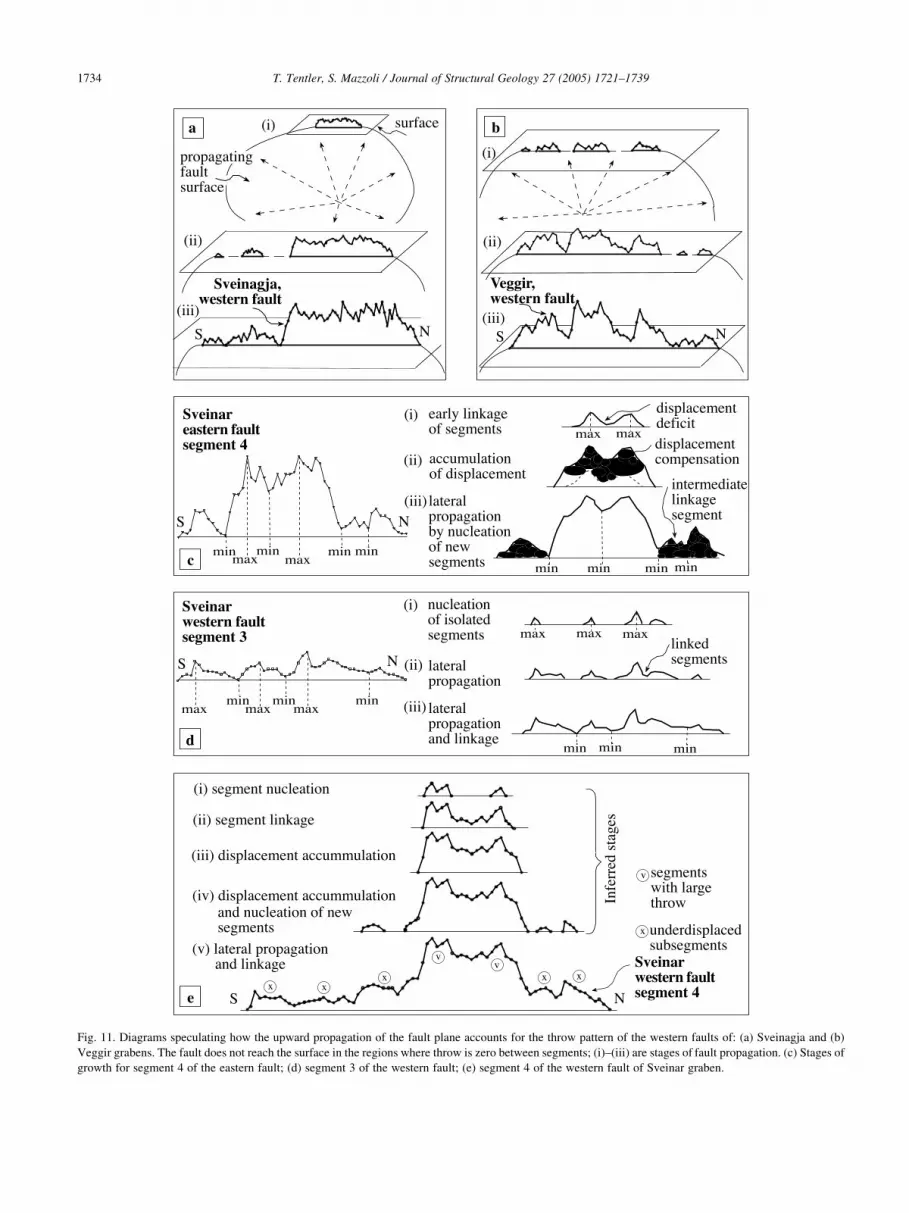
The plot of length of linked segments along a fault
against the maximum throw for the three grabens (Fig. 12a)
shows that throw increases with length. A large scatter, also
reported in other data sets, was interpreted as caused by the
methods of data collection or local variations in rock
properties (Walsh and Watterson, 1987; Cowie and Scholz,
1992). However, in our case, we infer that most of the
scatter resulted from the complexity of the fault surfaces as
they grew. Throw is expected to be more evenly distributed
than documented here if segments have linked into
continuous faults at the early stage of graben develop-
ment and slip took place along the entire fault lengths
(Willemse, 1997; Cowie, 1998). Large variation in
throw suggests that faults experienced multiple slip events
where slip was not continuous, but rather occurred in local
increments resulting in at least three orders of segmentation.
The migration of the locus of preferred throw accumulation
(Fig. 11) can lead to anomalies in throw distribution, local
asymmetry in throw across the graben (Figs. 6a, 9a and 10a)
and deviations from the mean length/throw ratio (Fig. 12a).
Slip of individual segments at the same time as they
propagated laterally would account for throw being
proportional to segment length (Walsh and Watterson,
1987; Dawers and Anders, 1995; Maerten et al., 1999),
whereas large scatter (Fig. 12a) suggests that faults are
likely to grow in intervening stages of lateral propagation
and throw accumulation. The plot of fault length versus
maximum throw for isolated faults shows a markedly
smaller scatter around the length/throw mean value and is
consistent with linear scaling (Fig. 12a). Fault displacement
in rock with uniform mechanical properties is given by dZgL, where the parameter g depends mainly on the ratio of
the shear strength to elastic rigidity of the faulted rock. Fault
populations in the same tectonic settings and rock types are
predicted to exhibit similar d/L ratios (Cowie and Scholz,
1992; Cowie, 1998). For the faults analyzed here, the mean
throw–length ratio is 0.006 (Fig. 12a). Deviations above and
below this value reflect the different distances over which
each fault propagated laterally and are likely to be a function
of the rate of tip propagation, mechanical segment
interaction and differences in fault overlap to fault spacing.
The linear relationship between fault length and throw
observed here (d/L!0.01) lies within the range of those
documented along the Mid-Atlantic Ridge (Bohnestiehl and
Kleinrock, 2000), East Pacific Rise (Carbotte and Macdo-
nald, 1994; Cowie et al., 1994) and in northeast Iceland
(Opheim and Gudmundsson, 1989).
6.3. Fault opening
Normal faults in this study have a dilational component
(Figs. 8, 9b and 10b) for most of their lengths, as is common
for faults throughout the rift zone of Iceland (Acocella et al.,
2000; Gudmundsson, 2000; Grant and Kattenhorn, 2004).
Their opening is variable, but generally is greatest near the
middle of the fault (Gudmundsson, 1987b). Shorter
segments tend to have smaller openings (Fig. 12b), although
the scatter in the data is large. There are no simple length/
opening and throw/opening relationships along normal
faults in Iceland (Gudmundsson, 1987a). A possible
explanation for this could be that length and throw of fault
segments are not dominant factors controlling their opening.
The correlation between segment opening and throw for the
Sveinagja and Veggir faults (Fig. 12d–g) appears to be
Fig. 11. Diagrams speculating how the upward propagation of the fault plane accounts for the throw pattern of the western faults of: (a) Sveinagja and (b)
Veggir grabens. The fault does not reach the surface in the regions where throw is zero between segments; (i)–(iii) are stages of fault propagation. (c) Stages of
growth for segment 4 of the eastern fault; (d) segment 3 of the western fault; (e) segment 4 of the western fault of Sveinar graben.
T. Tentler, S. Mazzoli / Journal of Structural Geology 27 (2005) 1721–17391734
Fig. 12. Diagram correlating parameters of normal faults. (a) Fault length versus maximum throw for segments of graben faults (open triangles), and for
isolated individual faults (black squares) within and around the three graben. The straight line d/LZ0.006 is fitted through data indicating a linear relationship
between fault length and throw. Deviations above and below this value reflect the different distances over which each fault propagated laterally. (b) Fault
segment length versus maximum opening along segments of Sveinagja and Veggir grabens. (c) Graben segment length versus maximum width of the three
grabens. (d) Segment opening versus throw near the fault tips, and (e) near the fault centers of Sveinagja faults. (f ) The same for the segments of Veggir near
the fault tips, and (g) near the fault centers.
T. Tentler, S. Mazzoli / Journal of Structural Geology 27 (2005) 1721–1739 1735
T. Tentler, S. Mazzoli / Journal of Structural Geology 27 (2005) 1721–17391736
generally weak, but has significantly different patterns for
segments at fault tips (Fig. 12d and f) compared with
segments near fault centers (Fig. 12e and g). Segment
opening/throw for the fault tips (Fig. 12d and f) shows a
significant clustering of data, whereas that for the fault
centers shows a larger scatter (Fig. 12e and g). Such a
difference in clustering for fault tips and middles may be
related to distinct stages in growth of corresponding fault
segments. Segments at propagating fault tips are commonly
at the early stages of displacement, with a small throw and
opening. Segments in the central parts of faults have
undergone a longer history of growth; they are in a more
mature stage of interaction where throw and opening of each
sub-segment results from a larger number of displacement
episodes and thus may show a higher scatter. Data points for
central parts of eastern and western faults of Sveinagja are
grouped into overlapping but distinctive areas (Fig. 12e).
Such a pattern could result from the variation in the
increments of fault growth across a wide graben. On the
contrary, data points for faults of the Veggir graben, which
is about three times narrower, are not grouped for each fault
(Fig. 12g), indicating more similarity in fault formation
across it.
The opening observed along faults in this study is
significant and comparable with their throw. The total
dilation needed for the formation the graben faults is likely
to be even greater, as it commonly exceeds fault opening
measured in situ (Gudmundsson, 1987b), while Fremri-
Namur and Dyngjufjol volcanic systems represent only a
fraction of the total dilation across the spreading zone.
Although the opening along analyzed faults may be
considered as local (as manifested only by faults within
the active rift zone) and superficial (as present only in
shallow, exposed portions of faults), it characterizes the
important stage of fault formation on the surface, where
most geological data is collected. The documented opening
also emphasizes the significance of the dilational com-
ponent that may be present along the entire fault plane but
obscured at depth where it may be accommodated by other
mechanisms, such as diking.
The dilation characteristic of normal faults in the rift
zone of Iceland has been also documented along continental
normal faults (Muffler et al., 1994). Similar features occur
on the flanks of shield volcanoes on ocean islands, such as
Hawaii (Peacock and Parfitt, 2002). However, to our
knowledge, such an opening has not been reported for
faults on the ocean floor. Nevertheless, the development of
normal faults along submarine ridges is controlled by
tectono-magmatic conditions similar to those operating in
Iceland. It is possible that oceanic faults also initiate with an
opening that is not easy to be preserved and recognized in
the marine environment. Such faults are partially buried by
basaltic flows and unconsolidated sediments at the base of
their scarps along the axes of both fast- (Macdonald et al.,
1996; Carbotte et al., 1997) and slow-spreading ridges
(Tucholke and Lin, 1994; Karson, 1998). However, even if
openings along oceanic faults are unlikely to survive in a
great number beneath the weight of water column and
sediments, the possibility of their existence during fault
formation should not be ruled out. The presence of dilational
components along normal faults is of general importance for
understanding their mechanics and is an obvious topic for
future research.
6.4. Graben width
The width of graben segments does not appear to be
simply proportional to their length (Fig. 12c). Thus for a
wide graben like Sveinagja, segment width increases with
length, while for a narrow graben such as Sveinar and
Veggir, segments are narrower with increasing length. This
apparent absence of simple length/width correlation may be
attributed to a difference in fault depth profiles and segment
interaction (Cartwright et al., 1995; Angelier et al., 1997).
Alternatively, it may be related to variations in dynamics of
magma beneath the graben. Within the rift zone of Iceland,
two main mechanisms have been suggested for the transport
of magma to the site of eruption. The first implies lateral
movement of magma along a propagating fissure, at
portions of volcanic systems located relatively close to the
crustal magma chamber beneath the central volcano
(Sigurdsson and Sparks, 1978; Einarsson, 1991). The
second mechanism involves dykes formed by magma
ascending vertically from a deep-seated magma reservoir
that occurs at larger lateral distances from the central
volcano (Thayer et al., 1981; Gudmundsson, 2000). In any
case, magma propagating laterally and/or vertically along
fissures at depths of 2–7 km may lead to the subsidence at
the surface initiating formation of a graben (Rubin and
Pollard, 1988; Einarsson, 1991). Correspondingly, fault
initiation, segmentation and, possibly, displacement in a
graben would be dependent not only upon the stress field
and mechanical properties of faulted rocks, but also on the
parameters related to magma dynamics. The depth of the
propagating magmatic fissure, the rate of its propagation,
and the volume of magma may vary between different
grabens resulting in varied length/width relationships of
graben segments.
6.5. Graben study in Iceland
Numerous sea-floor observations in recent decades have
documented surface normal faulting throughout the axial
depressions and on the flanks of mid-ocean ridges where
steep (70–908) fault scarps commonly have throws of a few
tens of meters (Carbotte and Macdonald, 1994; Tucholke
and Lin, 1994; Cowie, 1998; Macdonald, 1998). Faults
often form graben systems, shallow and short in the early
stages of the extensional cycle, but progressively deepening,
lengthening, and becoming more asymmetric as extension
continues (Macdonald et al., 1996; Carbotte et al., 1997).
Direct access to structures in Iceland, allowing field
T. Tentler, S. Mazzoli / Journal of Structural Geology 27 (2005) 1721–1739 1737
measurements, raises the possibility for a more thorough
understanding of fault geometry and kinematics than
submarine data sampling. The results of the present study
should be applicable to structures on the ocean floor that are,
despite the absence of mantle plume-related complications
(Saunders et al., 1997), probably operated by similar
mechanical processes (Angelier et al., 1997; Acocella et
al., 2000; Gudmundsson, 2000; Grant and Kattenhorn,
2004). Fault growth occurs in stages of throw accumulation,
opening and lateral propagation speculatively inferred in
this study, which alternate and superimpose in space and
time. Such stages may generally characterize development
of normal faults at divergent plate boundaries.
7. Conclusions
1. Grabens bounded by discontinuous normal faults
consisting of linked segments, analyzed in this study,
are common structures of volcanic systems within the
active rift zone of Iceland.
2. Graben, isolated normal faults and dilational fractures of
the Fremri-Namur and Dyngjufjol volcanic systems
typically develop within elongated domains in areas of
high extension. Dilational fractures are common near the
sites of fault segment linkage but unusual beyond 500 m
to 700–800 m of graben faults, suggesting a stress
shadow zone surrounding graben.
3. The dimensions of individual fractures may be con-
trolled by the fracture toughness of rocks, average
propagation velocity, the distribution of pre-existing
crustal weaknesses, geometry of already formed
fractures and relaxation of tensile stress in their vicinity.
Length–frequency distributions of fractures in the
studied areas are best described by power-law functions.
The anomalously thick crust in Iceland might account
for such fracture length distribution otherwise more
commonly found in continental crust.
4. The widths of the graben segments is not simply a
function of their length or fault throw, which may be
accounted for by complex superimposition of numerous
factors controlling segmentation and subsidence within
graben.
5. Throw on graben faults reaches 15 m, being lower at
fault ends and segment tips and increasing with segment
length. The shape of throw profiles departs from
elliptical being more irregular with increasing fault
length. Deviations from the mean length/throw ratio for
fault segments may have developed as a result of their
linkage.
6. Normal faults have dilational components with the
average opening of 2–5 m and the maximum located in
the middle parts of most faults. The correlation between
local opening and throw along faults is generally poor.
Although boundaries of fault segments are distinguished
both on throw and opening profiles, a significant shift
between the maximum throw and opening is common
for most segments. Local anomalies of asymmetrical
throw and opening on faults across grabens suggest that,
despite the general similarities in formation of graben
faults, their segments propagate and link in a complex
manner that involve a variety of structures largely
affecting fault plane geometries.
7. A few orders of fault segmentation indicate that the
present throw accumulated by many increments as faults
underwent a series of changes in their geometry. Lateral
propagation of fault segments occurs by means of new
fractures that nucleate at their tips. Segments link by one
or both tips propagating towards each other or by the
development of intervening segments.
Acknowledgements
The authors would like to thank C. Talbot for discussions
and for reviewing the manuscript.
References
Ackerman, R.V., Schlische, R.W., Withjack, M.O., 2001. The geometric
and statistical evolution of normal fault systems: an experimental study
of the effects of mechanical layer thickness on scaling laws. Journal of
Structural Geology 23, 1803–1819.
Ackermann, R.V., Schlische, R.W., 1997. Anticlustering of small normal
faults around larger faults. Geology 25, 1127–1130.
Acocella, V., Gudmundsson, A., Funiciello, R., 2000. Interaction and
linkage of extension fractures and normal faults: examples from the rift
zone of Iceland. Journal of Structural Geology 22, 1233–1246.
Angelier, J., Bergerat, R., Dauteuil, O., Villemin, T., 1997. Effective
tension–shear relationships in extensional fissure swarms, axial rift
zone of northeastern Iceland. Journal of Structural Geology 19,
673–685.
Bergerat, F., Angelier, J., Villemin, T., 1990. Fault systems and stress
patterns on emerged oceanic ridges: a case study in Iceland.
Tectonophysics 179, 183–197.
Bohnestiehl, D.R., Kleinrock, M.C., 2000. Evidence for spreading-rate
dependence in the displacement–length ratios of abyssal hill faults at
mid-ocean ridges. Geology 28, 395–398.
Carbotte, S.M., Macdonald, K., 1994. Comparison of seafloor tectonic
fabric at intermediate, fast and superfast spreading ridges: influence of
spreading rate, plate motions, and ridge segmentation on fault patterns.
Journal of Geophysical Research 99, 13609–13631.
Carbotte, S.M., Mutter, J.C., Xu, L., 1997. Contribution of volcanism and
tectonism to axial and flank morphology of the southern East pacific
Rise, 17810 0–17840 0S, from a study of layer 2A geometry. Journal of
Geophysical Research 102, 10165–10184.
Cartwright, J., Trudgill, B.D., Mansfield, C., 1995. Fault growth by segment
linkage: an explanation for scatter in maximum displacement and trace
length data from the Canyonlands grabens of SE Utah. Journal of
Structural Geology 17, 1319–1326.
Cowie, P.A., 1998. Normal fault growth in three-dimensions in continental
and oceanic crust. In: Buck, W.R., Delaney, P.T., Karson, J.A.,
Lagabrielle, Y. (Eds.), Faulting and Magmatism at Mid-Ocean Ridges.
American Geophysical Union, Washington, pp. 325–348.
T. Tentler, S. Mazzoli / Journal of Structural Geology 27 (2005) 1721–17391738
Cowie, P.A., Scholz, C.H., 1992. Displacement to length scaling
relationships for faults: data synthesis and discussion. Journal of
Structural Geology 14, 1149–1156.
Cowie, P.A., Malinverno, A., Ryan, W.B.F., Edwards, M.H., 1994.
Quantitative fault studies on the East Pacific Rise: a comparison of
sonar imaging techniques. Journal of Geophysical Research 99, 15205–
15218.
Dawers, N.H., Anders, M.H., 1995. Displacement–length scaling and fault
linkage. Journal of Structural Geology 17, 607–614.
Dawers, N.H., Anders, M.H., Scholz, C.H., 1993. Growth of normal faults:
displacement–length scaling. Geology 21, 1107–1110.
Einarsson, P., 1991. Earthquakes and present-day tectonism in Iceland.
Tectonophysics 189, 261–279.
Florenz, O.G., Gunnarsson, K., 1991. Seismic crustal structure in Iceland
and surrounding area. Tectonophysics 189, 1–17.
Foulger, G.R., Jahn, C., Seeber, G., Einarsson, P., Julian, B., Heki, K., 1992.
Post-rifting stress relaxation at the divergent plate boundary in northeast
Iceland. Nature 358, 488–490.
Gawthorpe, R.L., Jackson, C.A.-L., Young, M.J., Sharp, I.R.,
Moustafa, A.R., Leppard, C.W., 2003. Normal fault growth, displace-
ment localization and the evolution of normal fault populations: the
Hammam Faraun fault block, Suez rift, Egypt. Journal of Structural
Geology 25, 883–895.
Grant, J.V., Kattenhorn, S.A., 2004. Evolution of vertical faults at an
extensional plate boundary, southwest Iceland. Journal of Structural
Geology 23, 537–557.
Gudmundsson, A., 1987a. Geometry, formation and development of
tectonic fractures on the Reykjanes Peninsula, southwest Iceland.
Tectonophysics 139, 295–308.
Gudmundsson, A., 1987b. Tectonics of the Thingvellir fissure swarm, SW
Iceland. Journal of Structural Geology 9, 61–69.
Gudmundsson, A., 2000. Dynamics of volcanic systems in Iceland:
example of tectonism and volcanism at juxtaposed hot spot and mid-
ocean ridge systems. Annual Review of Earth and Planetary Sciences
28, 107–140.
Gudmundsson, A., Backstrom, K., 1991. Structure and development of the
Sveinagja graben, Northeast Iceland. Tectonophysics 200, 111–125.
Gupta, A., Scholz, C., 2000. Brittle strain regime transition in the Afar
depression: implications for fault growth and seafloor spreading.
Geology 28, 1087–1090.
Johannesson, H., Saemundsson, K., 1998. Geological map of Iceland.
Tectonics, 1:500,000. Icelandic Institute of Natural History, Reykjavik.
Karson, J.A., 1998. Internal structure of oceanic lithosphere: a perspective
from tectonic windows. In: Buck, W.R., Delaney, P.T., Karson, J.A.,
Lagabrielle, Y. (Eds.), Faulting and Magmatism at Mid-Ocean Ridges.
American Geophysical Union, Washington, pp. 177–218.
Kattenhorn, S.A., Pollard, D.D., 2001. Integrating 3-D seismic data, field
analyses, and mechanical models in the analyses of segmented normal
faults in the Wytch Farm oil field, southern England, United Kingdom.
AAPG Bulletin 85, 1183–1210.
Macdonald, K.C., 1998. Linkages between faulting, volcanism, hydrother-
mal activity and segmentation on fast spreading centres. In: Buck, W.
R., Delaney, P.T., Karson, J.A., Lagabrielle, Y. (Eds.), Faulting and
Magmatism at Mid-Ocean Ridges. American Geophysical Union,
Washington, pp. 27–58.
Macdonald, K.C., Fox, P.J., Alexander, R.T., Pockalny, R., Gente, P., 1996.
Volcanic growth faults and the origin of Pacific abyssal hills. Nature
380, 125–129.
Maerten, L., Willemse, E.J.M., Pollard, D.D., Rawnsley, K., 1999. Slip
distributions on intersecting normal faults. Journal of Structural
Geology 21, 259–271.
Mazzoli, S., Di Bucci, D., 2003. Critical displacement for normal fault
nucleation from en-echelon vein arrays in limestones: a case study from
the southern Apennines (Italy). Journal of Structural Geology 25,
1011–1020.
Muffler, L., Clynne, M., Champion, D.E., 1994. Late Quaternary normal
faulting of the Hat Creek basalt, northern California. Geological Society
of America Bulletin 106, 195–200.
Opheim, J.A., Gudmundsson, A., 1989. Formation and geometry of
fractures and related volcanism of the Krafla fissure swarm, northeast
Iceland. Geological Society of America Bulletin 101, 1608–1622.
Palmason, G., 1980. A continuum model of crustal generation in Iceland:
kinematic aspects. Journal of Geophysics 47, 7–18.
Peacock, D.C.P., Parfitt, E.A., 2002. Active relay ramps and normal fault
propagation on Kilauea Volcano, Hawaii. Journal of Structural Geology
24, 729–742.
Pollard, D.D., Segall, P., Delaney, P.T., 1982. Formation and interpretation
of dilatant echelon cracks. Geological Society of America Bulletin 93,
1291–1303.
Rognvaldsson, S.T., Gudmundsson, A., Slunga, R., 1998. Seismotectonic
analysis of the Tjornes Fracture Zone, an active transform fault in north
Iceland. Journal of Geophysical Research 103 (B12), 30117–30129.
Rubin, A.M., Pollard, D.D., 1988. Dike-induced faulting in rift zones of
Iceland and Afar. Geology 16, 413–417.
Saemundsson, K., 1977. Geological map of Iceland. Sheet 7, North East
Iceland, 1: 250,000. First edition. The Iceland Geodetic Survey and the
Museum of Natural History, Reykjavik.
Saemundsson, K., 1978. Fissure swarms and central volcanoes of the
neovolcanic zones of Iceland. Geological Journal 10, 415–432.
Saunders, A.D., Fitton, J.G., Kerr, A.C., Norry, M.J., Kent, R.W., 1997. The
North Atlantic Igneous Province. In: Mahoney, J.J., Coffin, M.F. (Eds.),
Large Igneous Provinces: Continental, Oceanic and Planetary Geo-
physical Monograph. American Geophysical Union, Washington, DC,
pp. 45–93.
Sigmundsson, F., Einarsson, P., Bilham, R., Sturkell, E., 1995. Rift-
transform kinematics in south Iceland: deformation from Global
Positioning System measurements, 1986 to 1992. Journal of Geo-
physical Research 100 (B4), 6235–6248.
Sigurdsson, H., Sparks, R.S.G., 1978. Rifting episode in north Iceland in
1874–1875 and the eruption of Askja and Sveinagja. Bulletin
Volcanologique 41, 149–167.
Smallwood, J.R., Staples, R.K., Richardson, K.R., White, R.S., 1999. Crust
generated above the Iceland mantle plume; from continental rift to
oceanic spreading center. Journal of Geophysical Research 104,
22885–22902.
Tentler, T., 2003a. Analogue modeling of tension fracture pattern in
relation to mid-ocean ridge propagation. Geophysical Research Letters
30, 11–14.
Tentler, T., 2003b. Analogue modeling of overlapping spreading centers:
insights into their propagation and coalescence. Tectonophysics 376,
99–115.
Tentler, T., Temperley, S., 2003. Segment linkage during evolution of
intracontinental rift systems: insights from analogue modelling. In:
Nieuwland, D. (Ed.), New Insights into Structural Interpretation and
Modelling Geological Society, London, Special Publications, 212,
pp. 181–196.
Thayer, R.E., Bjornsson, A., Alvarez, L., Hermance, J.F., 1981. Magma
genesis and crustal spreading in the northern neovolcanic zone of
Iceland: telluric–magnetotelluric constraints. Geophysical Journal of
Royal Astronomical Society 65, 423–442.
Thorarinsson, S., 1959. Some geological problems involved in the hydro-
electric development of the Jokulsa a Fjollum, Iceland. Report to the
State Electricity Authority, Reykjavik.
Tucholke, B.E., Lin, J., 1994. A geological model for the structure of ridge
segments in slow-spreading crust. Journal of Geophysical Research 99,
11937–11958.
Walsh, J.J., Watterson, J., 1987. Distribution of cumulative displacement
and of seismic slip on a single normal fault surface. Journal of Structural
Geology 9, 1039–1046.
Walsh, J.J., Bailey, W.R., Childs, C., Nicol, A., Bonson, C.G., 2003.
Formation of segmented normal faults: a 3-D perspective. Journal of
Structural Geology 25, 1251–1262.
T. Tentler, S. Mazzoli / Journal of Structural Geology 27 (2005) 1721–1739 1739
Watterson, J., Walsh, J.J., Gillespie, P.A., Easton, S., 1996. Scaling
systematics of fault sizes on a large-scale range fault map. Journal of
Structural Geology 18, 199–214.
Wilkins, S.J., Gross, M.R., 2002. Normal fault growth in layered rocks at
Split Mountain, Utah: influence of mechanical stratigraphy on dip
linkage, fault restriction and fault scaling. Journal of Structural Geology
24, 1413–1429.
Willemse, E.J., 1997. Segmented normal faults: correspondence between
three dimensional mechanical models and field data. Journal of
Geophysical Research 102, 675–692.