ASSESSING RESILIENT AGRICULTURE-BASED LIVELIHOODS: A CASE OF CONSERVATION AGRICULTURE IN KANTHONZWENI SUB-COUNTY BY JOHN KIMATHI MBAE B63/70286/2011 THESIS SUBMITTED IN PARTIAL FULFILMENT OF THE REQUIREMENT FOR THE AWARD OF MASTER OF ARTS DEGREE IN PLANNING. SCHOOL OF BUILT ENVIRONMENT UNIVERSITY OF NAIROBI 2014 DEPARTMENT OF URBAN AND REGIONAL PLANNING
A CASE OF CONSERVATION AGRICULTURE IN KANTHONZWENI
SUB-COUNTY
BY
JOHN KIMATHI MBAE
B63/70286/2011
THESIS SUBMITTED IN PARTIAL FULFILMENT OF THE
REQUIREMENT FOR THE AWARD OF MASTER OF ARTS DEGREE
IN PLANNING.
SCHOOL OF BUILT ENVIRONMENT
UNIVERSITY OF NAIROBI
2014
DEPARTMENT OF URBAN AND REGIONAL PLANNING
i
ABSTRACT
Exposure to climate variability and extremes, most particularly drought, poses a substantialrisk to people living in ASALs. A number of interventions on sustainable land use, livelihoodand environmental management have been promoted in Makueni County to enablehouseholds build resilience to stresses of drought and other climatic variations. With theincreasing trend in drought occurrences, there is need for evidence on the characteristics ofagriculture-dependent communities that have proven resilient to past climate variabilitywhich is lacking at the household and community levels.
This study identified characteristics of climate variability resilient farmers, land useapproaches and practices that significantly contribute to increased livelihood resilience andexamined factors influencing the capacity to develop and maintain resilient livelihoods. Italso identified policy options for enhancing resilient livelihoods.
The study adopted a survey design. Literature review, face to face interviews, observationand photography were used to collect data. The target population consisted of all farminghouseholds in Kathonzweni and Mavindini Divisions and service providers from all relevantinstitutions. Using multiple sampling strategies that included census of CA farmers,systematic random sampling for TT farmers and simple random sampling for NT farmers. Atotal of 138 households consisting of 46 conservation agriculture farmers (CA), 46 trained butnot practicing farmers (TT) and 46 not trained and not practicing farmers (NT) were sampled.Two focus group discussions were undertaken per category of farmers making a total of six.Local leaders and extension service providers were purposively identified and interviewed askey informants on farmer resilience. Households with resilient livelihoods were identified asthose with food access, financial security, entitlements in term of assets and sufficient humancapital.
Farmers in Makueni grow their own food which is supplemented through diversified incomesources, not only in crops, but also in other livelihood sources such as remittances. T-tests forcomparison of means indicated that CA farmers had significantly higher access to food thanTT and NT farmers. They also had higher financial security, remittances and better humanresource capital that contribute immensely to food production. Overall, CA was identified asa technique that has very high potential to improve yields, income, environmentalconservation and in the long term lead to increased household livelihood resilience. Droughtwas ranked as the main factor limiting farmers’ ability to develop and sustain resilientlivelihoods.
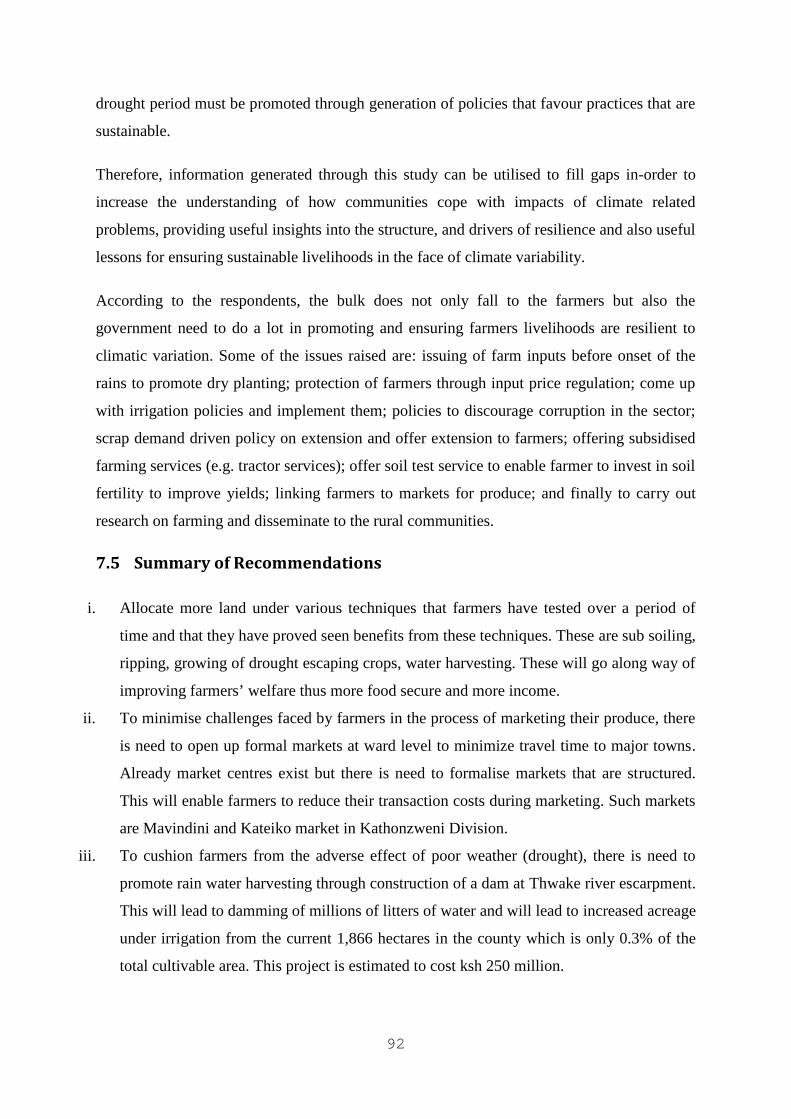
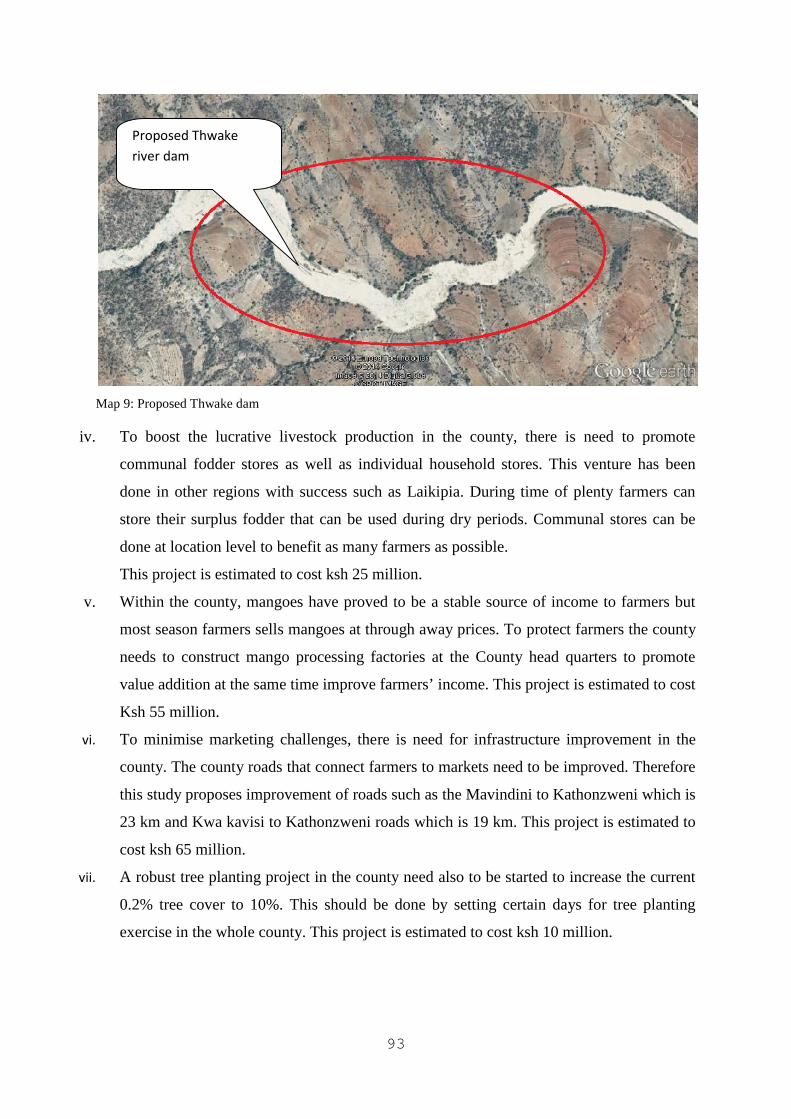
The study recommends increased promotion of CA, diversified income sources through landuse planning that allocates various enterprises optimally. Techniques such as sub-soiling,ripping, terracing and growing of drought tolerant crops that have proven to assist farmers toraise their agricultural output should be promoted through increased acreage under thesetechniques. The study also recommends construction of a dam at Thwake River to facilitaterain water harvesting for irrigation during drought.
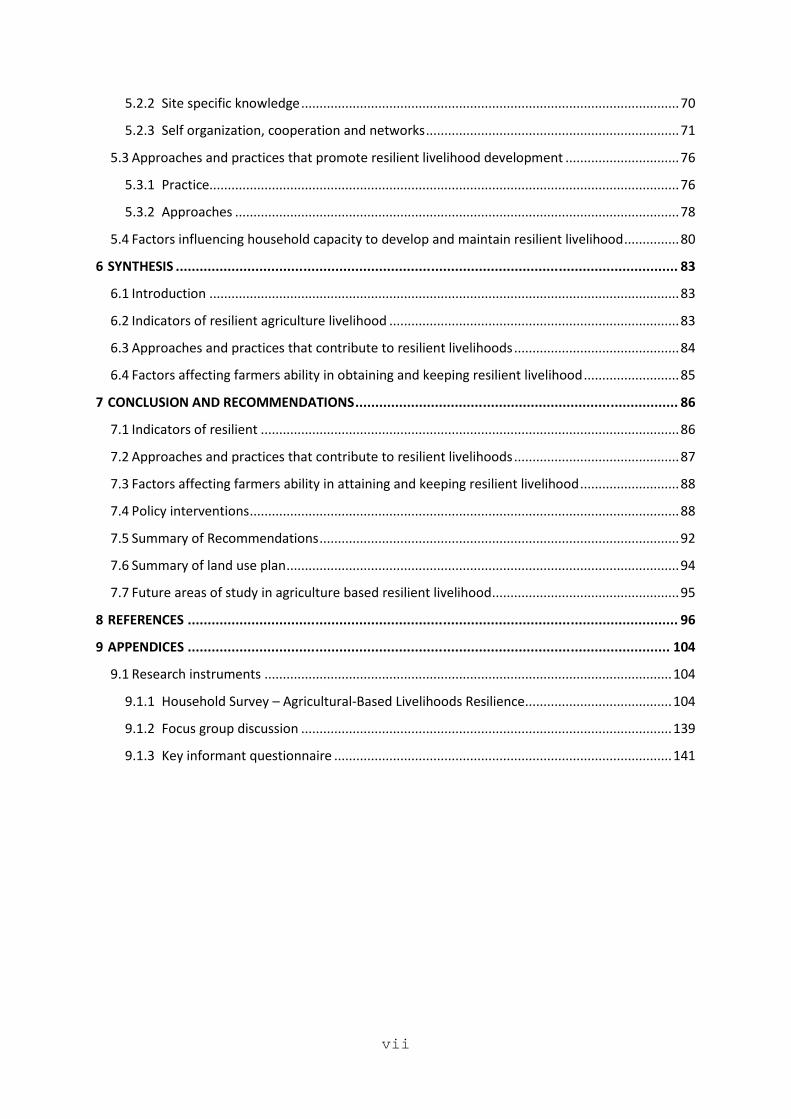
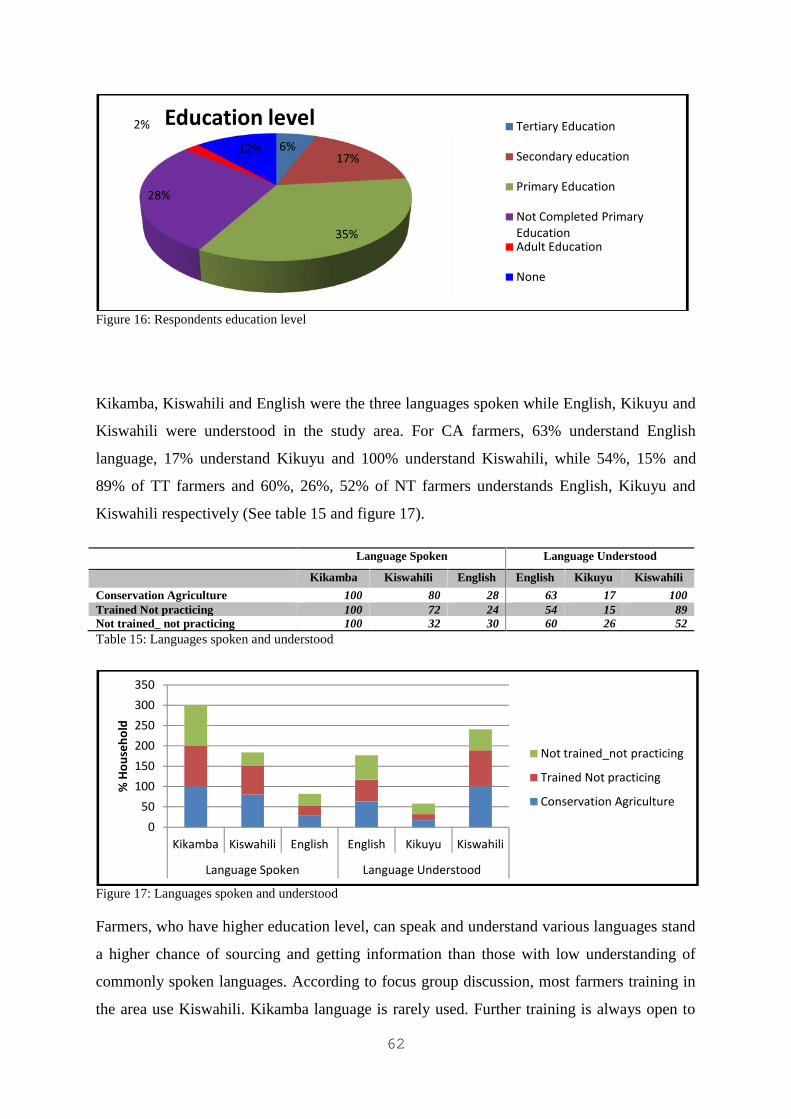
Table 1: Makueni agro-ecological zones ..............................................................................................32Table 2: Characteristics of Study area ..................................................................................................35Table 3: Average household maize yield per household/acre...............................................................46Table 4: Average greengrams yields/acre/household ...........................................................................48Table 5: Food expenditure/household/month .......................................................................................50Table 6: Sources of income...................................................................................................................51Table 7: Average annual household income .........................................................................................52Table 8: Respondents’ income levels....................................................................................................52Table 9: Income source reliability ........................................................................................................53Table 10: Average livestock units per household .................................................................................58Table 11: Common trees grown by households....................................................................................59Table 12: Household characteristic.......................................................................................................60Table 13: Education level vs average farm income ..............................................................................61Table 14: Respondents education level.................................................................................................61Table 15: Languages spoken and understood .......................................................................................62Table 16: Summary of performance on each indicator .........................................................................64Table 17: Land uses at household level ................................................................................................65Table 18: Land acquisition method.......................................................................................................65Table 19: Instituions interacting with farmers and activities ................................................................74
List of figures
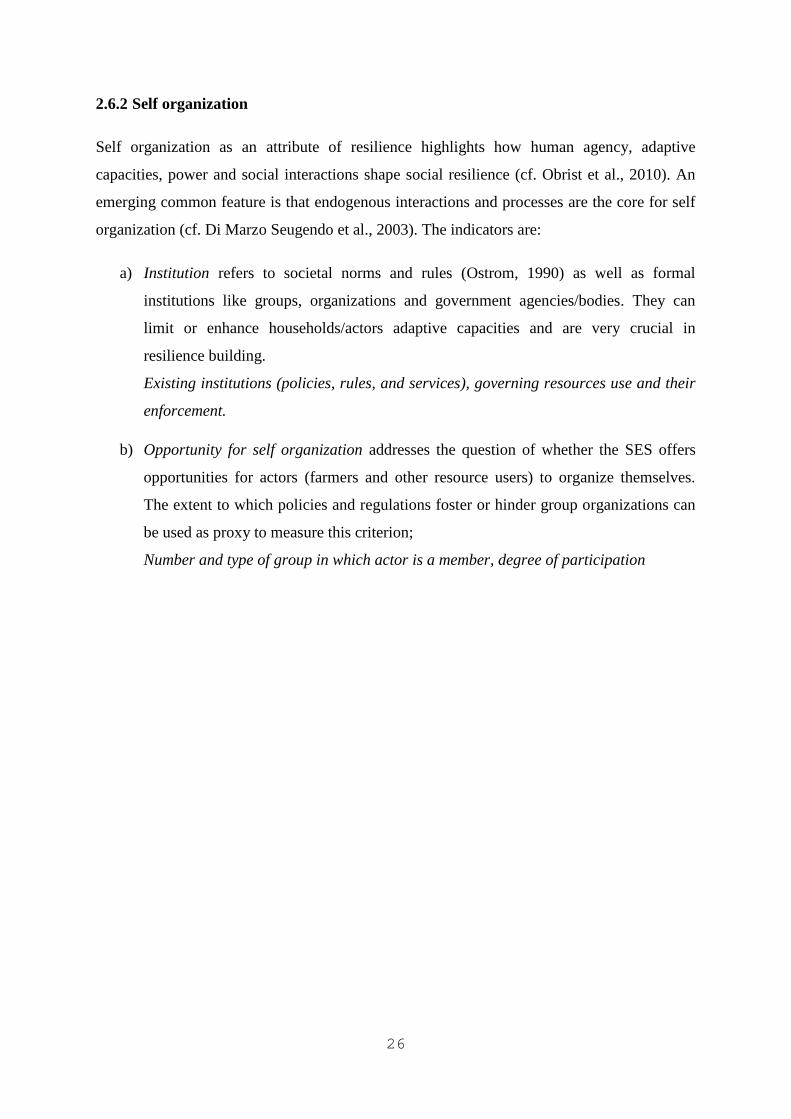
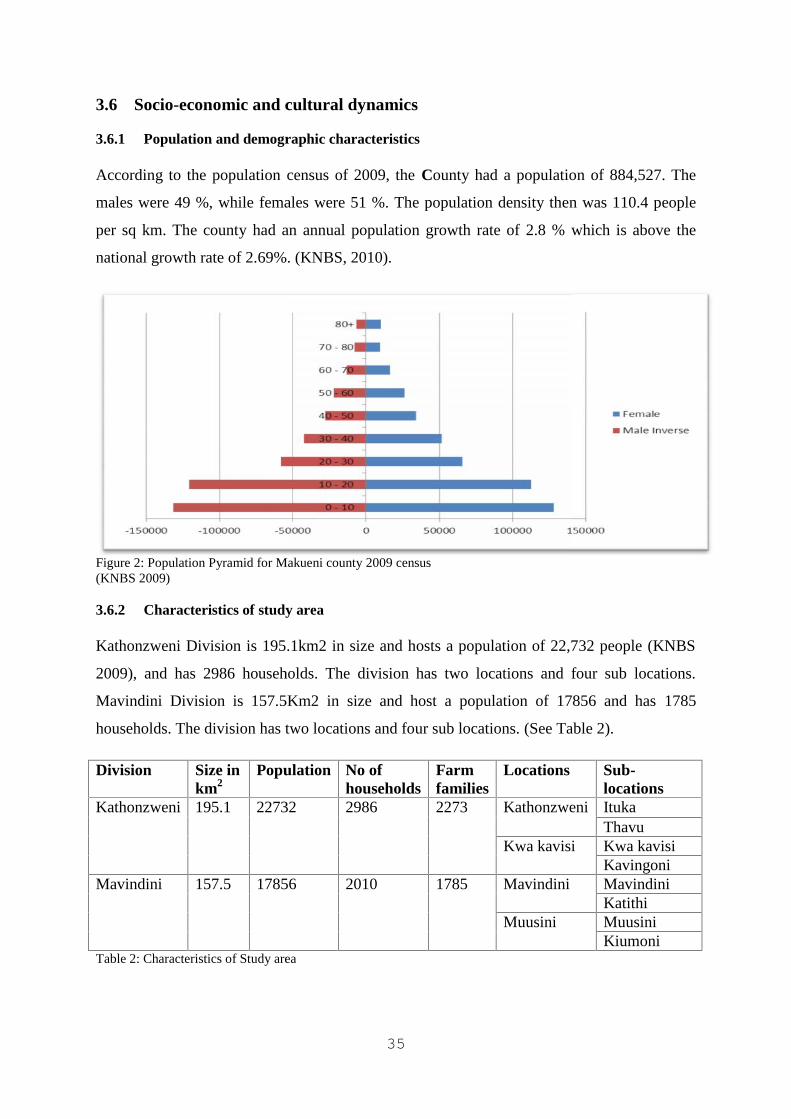
Figure 1: Resilience Conceptual framework.........................................................................................27Figure 2: Population Pyramid for Makueni county 2009 census ..........................................................35Figure 3: Radar chart on average household maize yield/acre .............................................................46Figure 4: Average household maize yield/acre per household .............................................................47Figure 5: Average yield of green-gram per acre HH ............................................................................49Figure 6: Sources of food during drought .............................................................................................50Figure 7: Radar chart on livelihood sources .........................................................................................51Figure 8: Average annual household income........................................................................................52Figure 9: Radar chart showing respondents incomes level ...................................................................53Figure 10: Incomes source reliability....................................................................................................54Figure 11: Radar chart showing the main reason for mixing crops ......................................................56Figure 12: Main income sources ...........................................................................................................57Figure 13: Reason for selling assets......................................................................................................58Figure 14: Trend of Livestock from 2009 to 2012................................................................................58Figure 15: Education level vs income from farming ............................................................................61Figure 16: Respondents education level ...............................................................................................62Figure 17: Languages spoken and understood ......................................................................................62Figure 18: Performance of each category to indicators ........................................................................64Figure 19: Legal status of farm owned by respondents ........................................................................66Figure 20: Frequency of public transport..............................................................................................68Figure 21: Distance to the nearest formal market .................................................................................69
ix
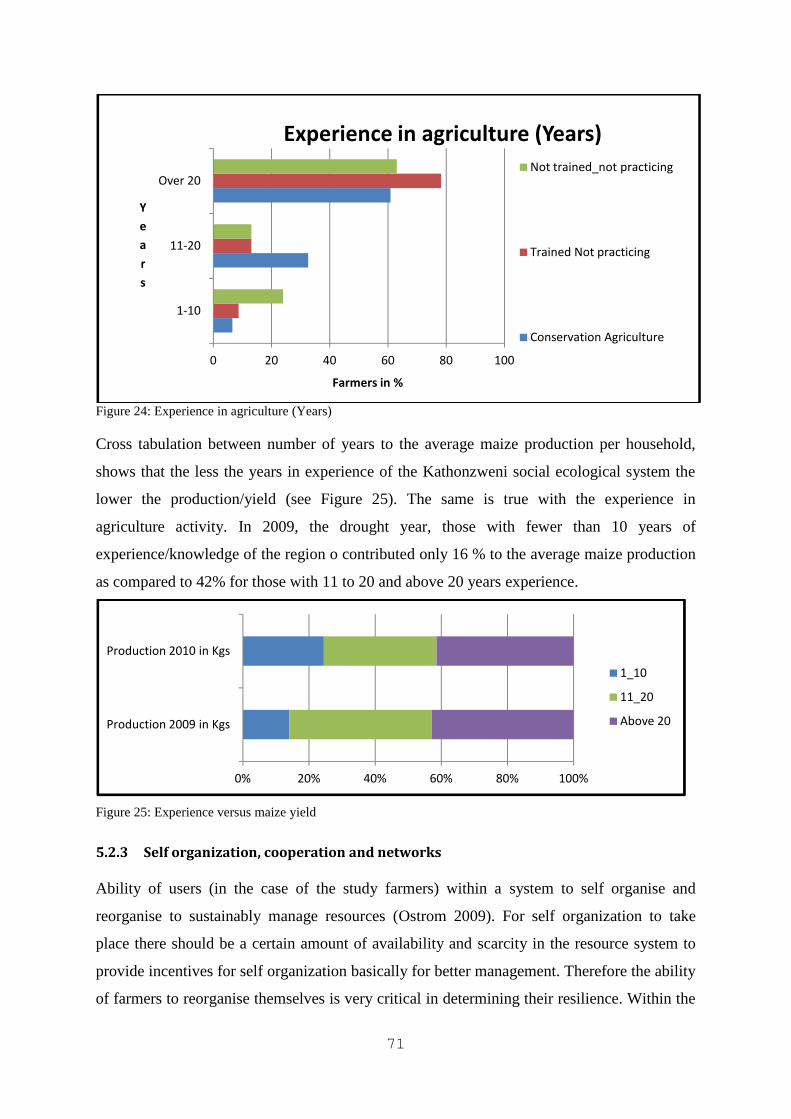
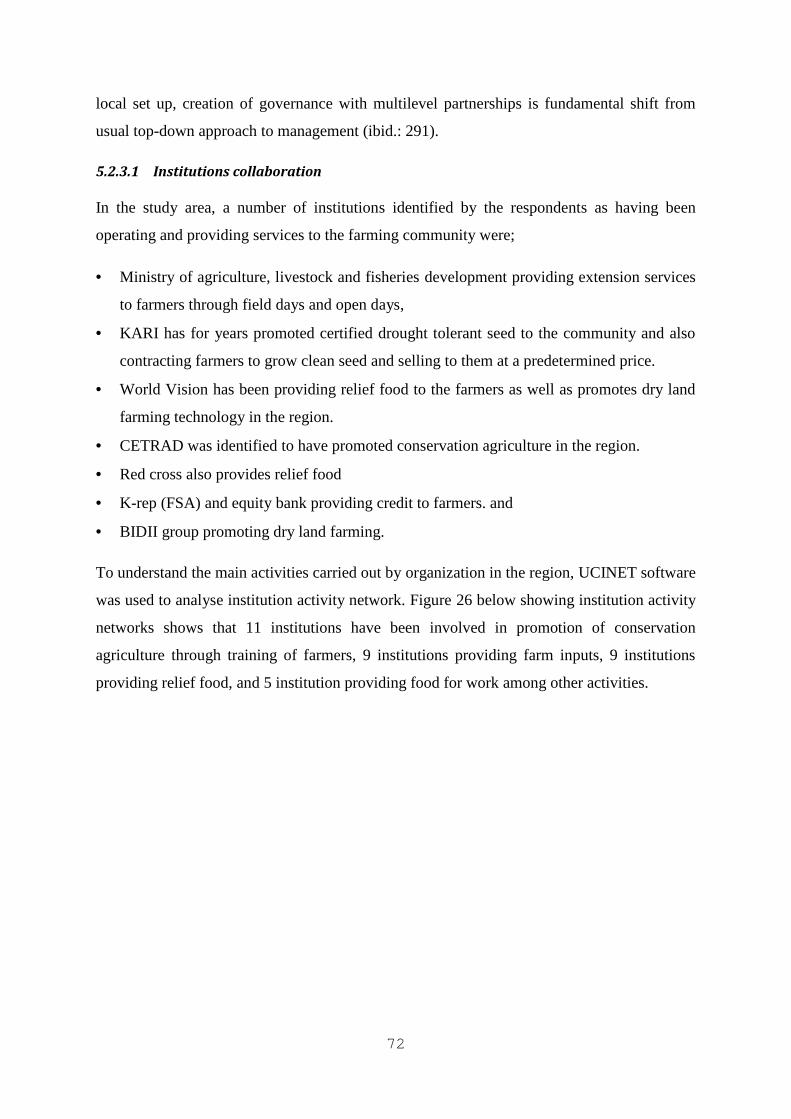
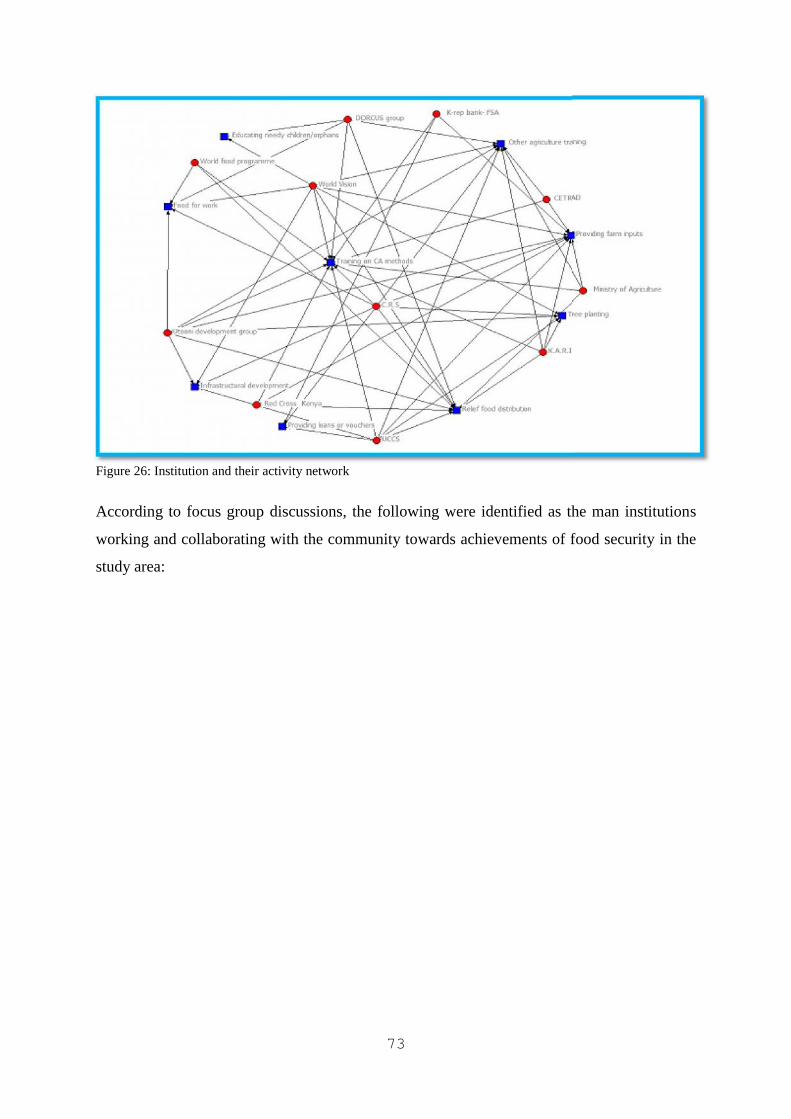
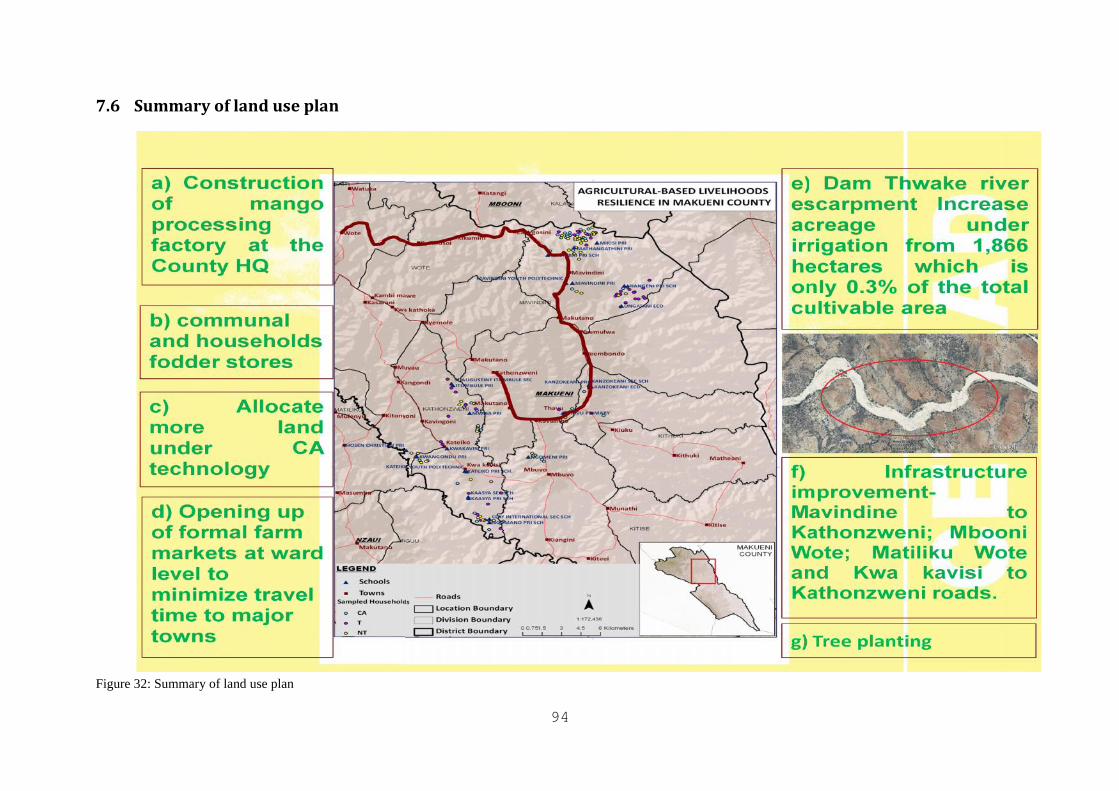
Figure 22: Time taken to schools..........................................................................................................69Figure 23: No of years in Kathonzweni ................................................................................................70Figure 24: Experience in agriculture (Years)........................................................................................71Figure 25: Experience versus maize yield ............................................................................................71Figure 26: Institution and their activity network ..................................................................................73Figure 27: Perceived benefit in being in a group ..................................................................................75Figure 28: Cooperation and network ....................................................................................................76Figure 29: Most preferred technique by respondents............................................................................77Figure 30: Factors affecting farmers’ capacity in crop farming ...........................................................81Figure 31: Factors affecting farmers’ capacity to have reliable livestock farming...............................81Figure 32: Summary of land use plan ...................................................................................................94
List of maps
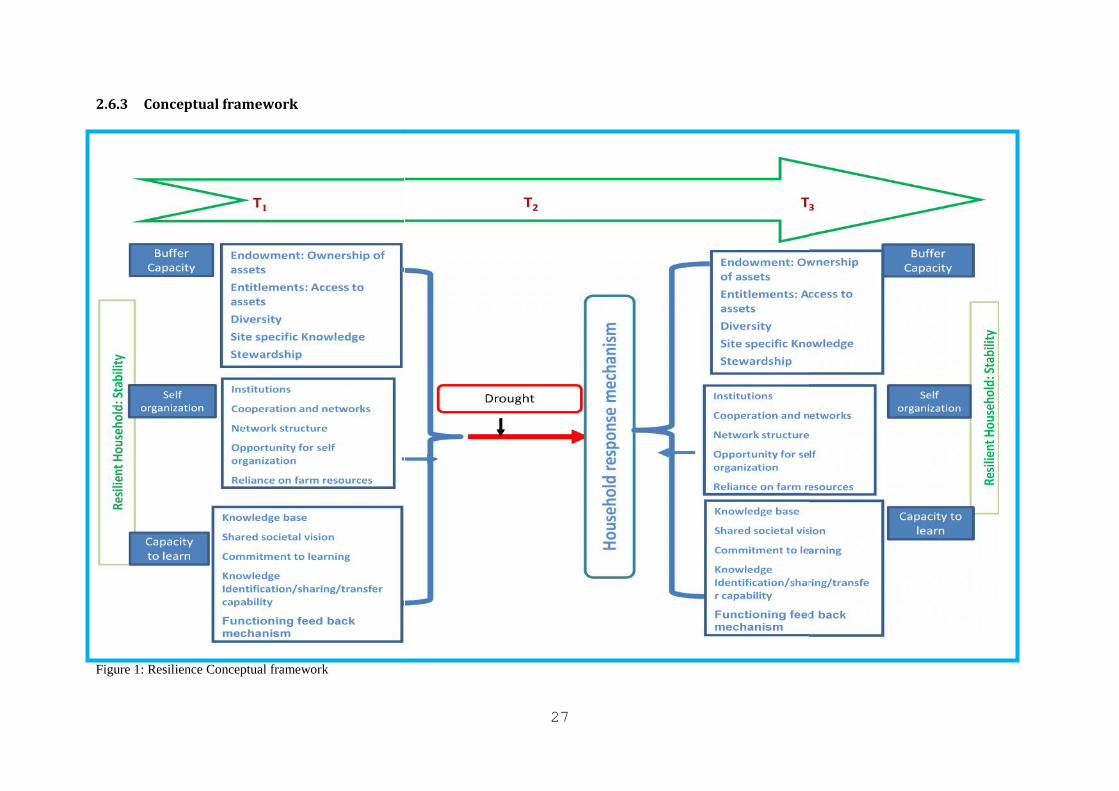
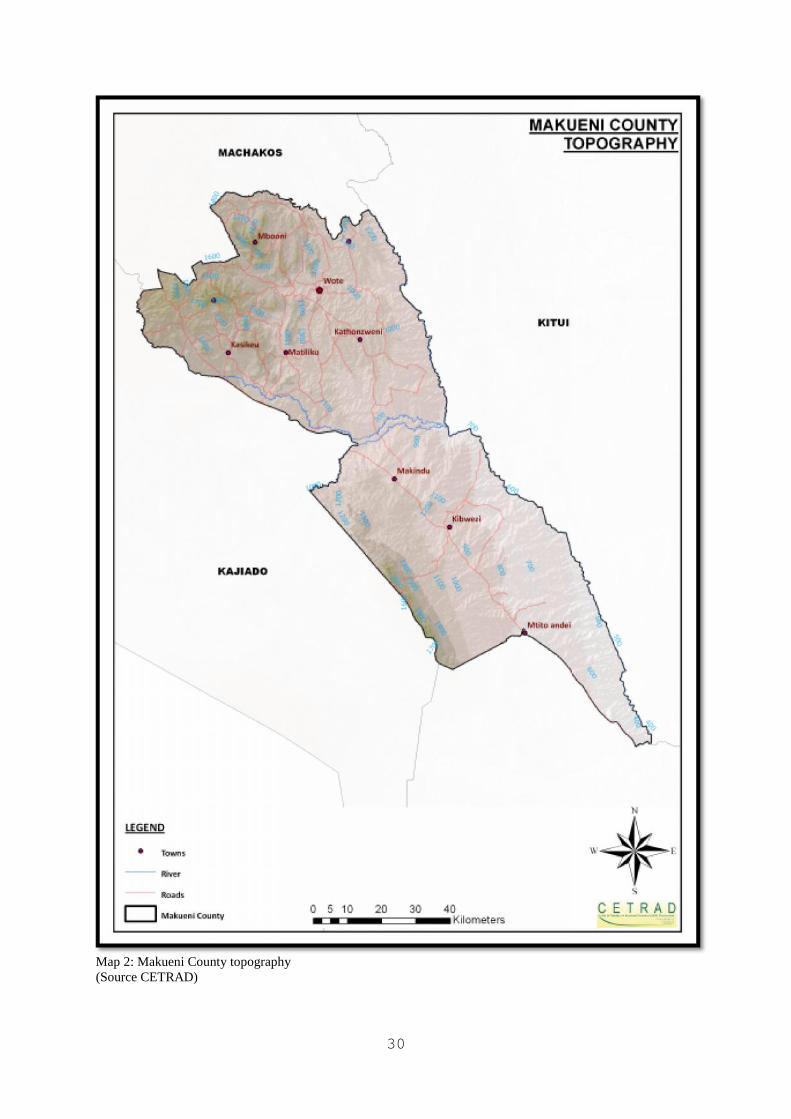
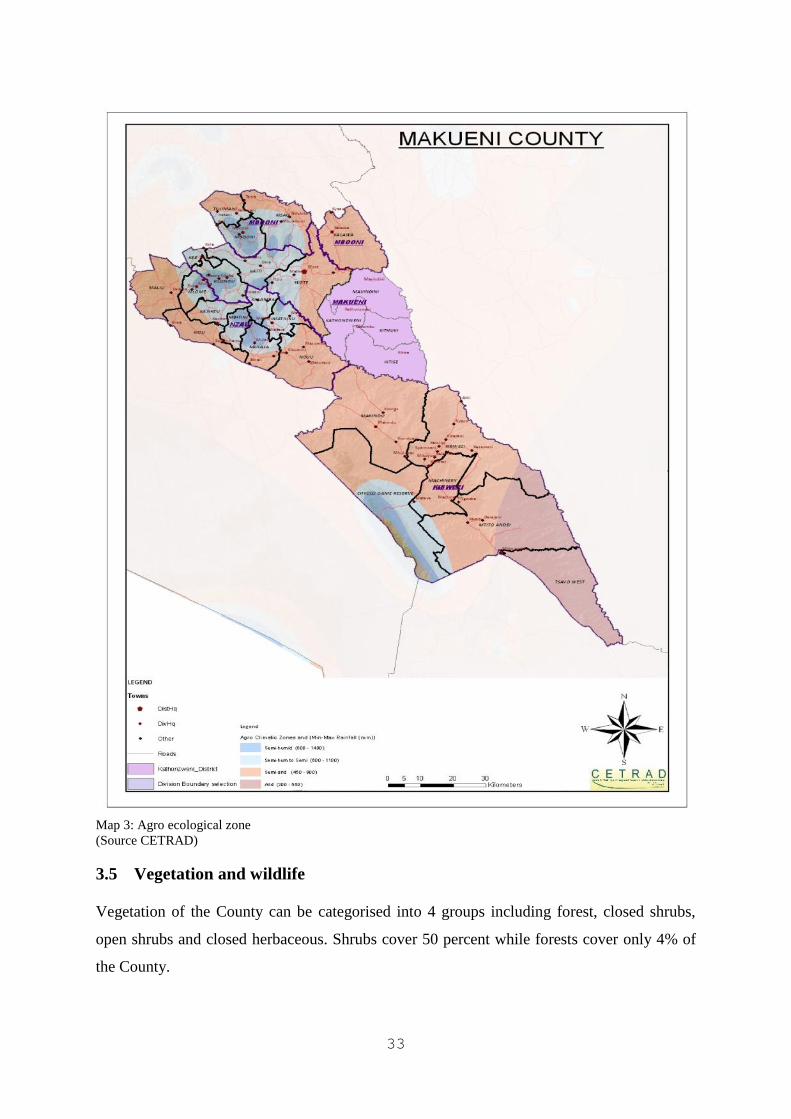
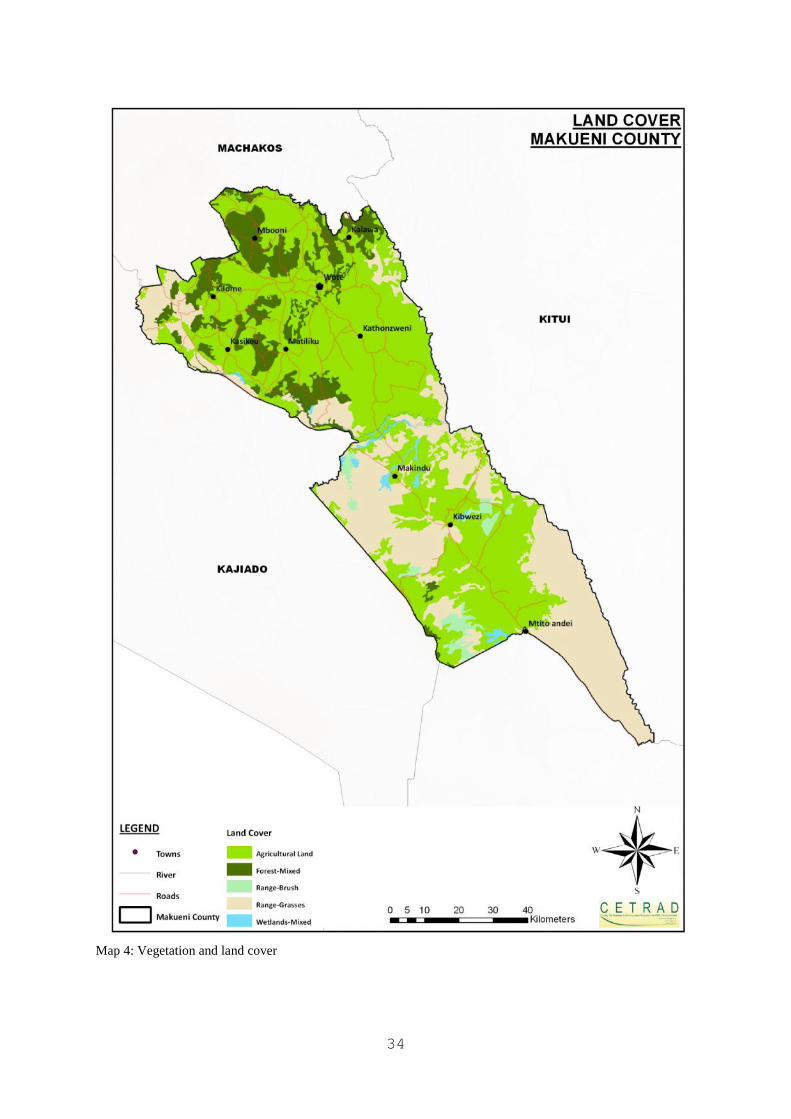
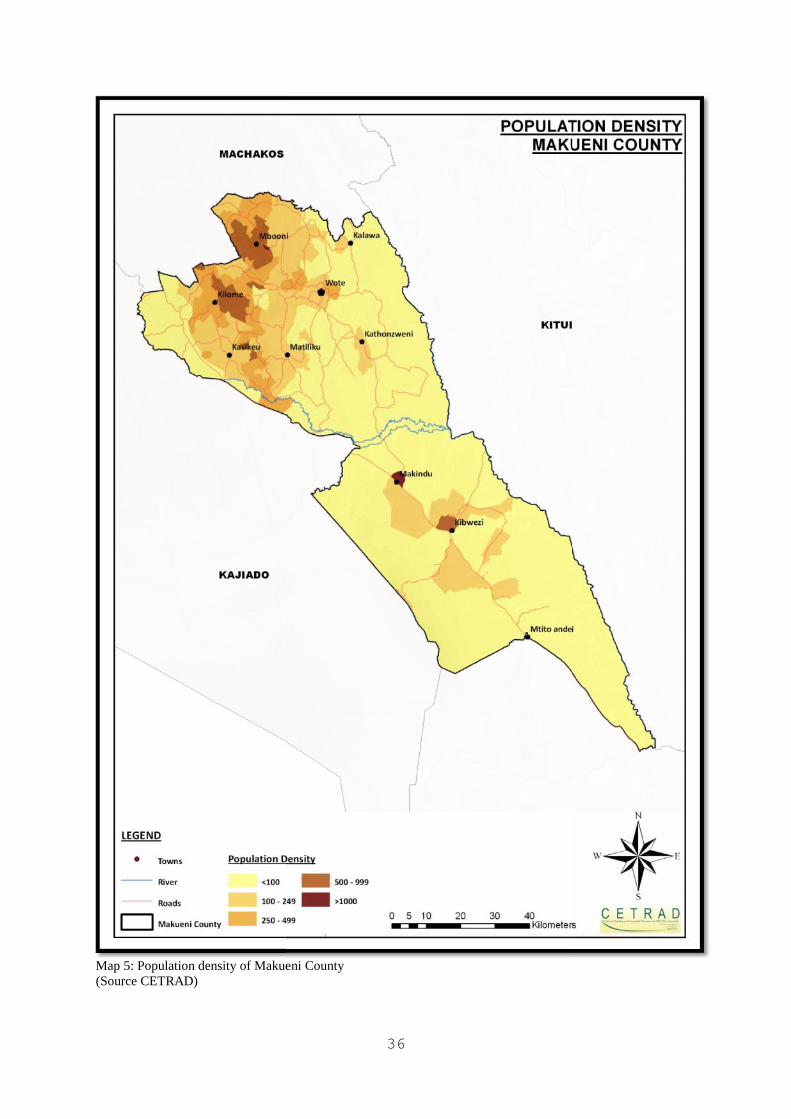
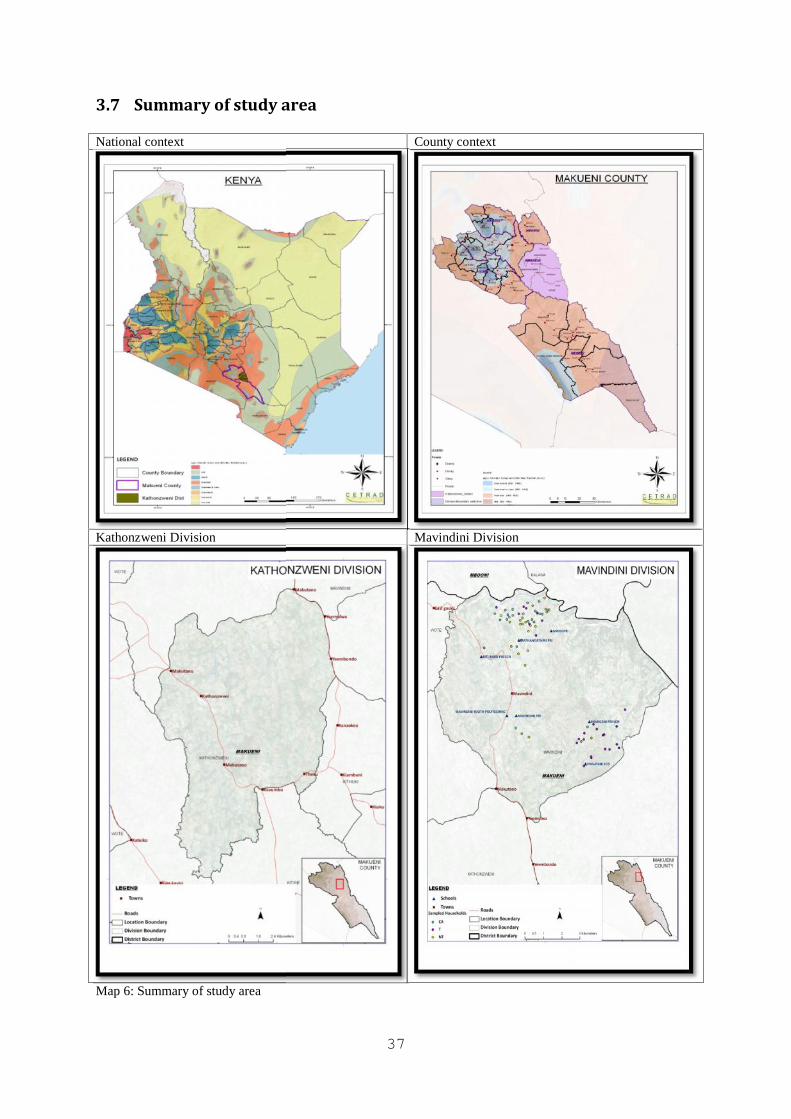
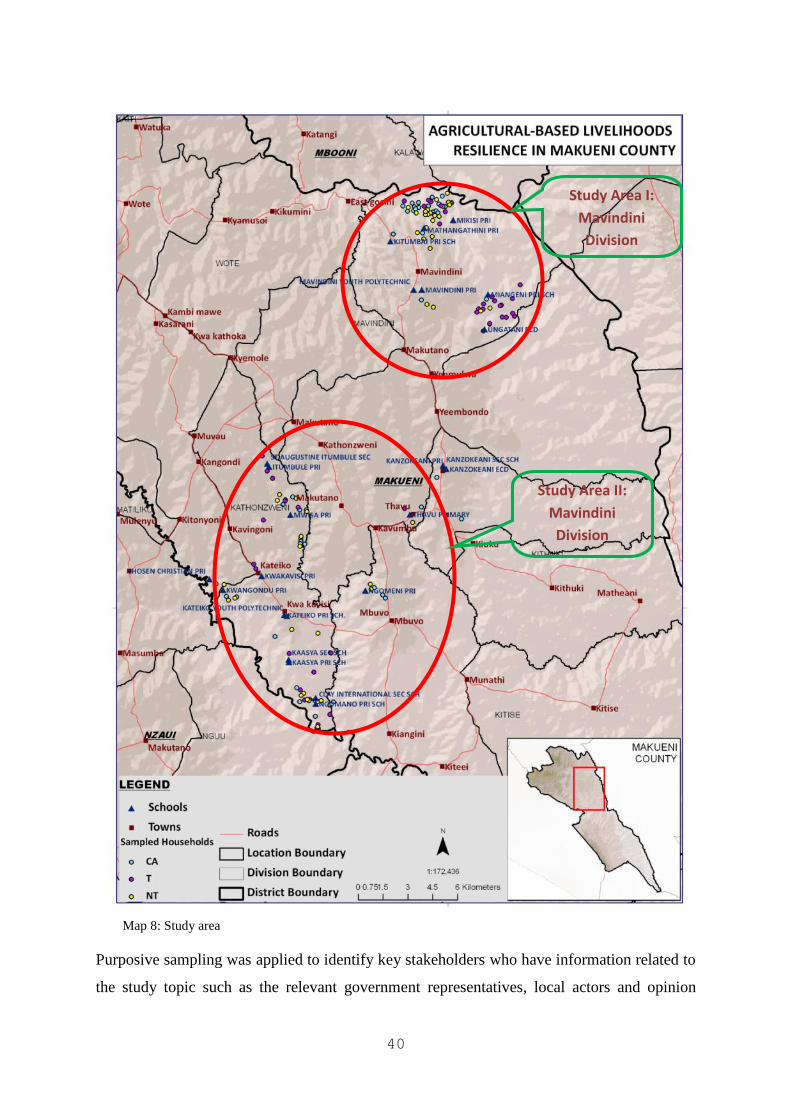
Map 1: Study area in the National context............................................................................................28Map 2: Makueni County topography ....................................................................................................30Map 3: Agro ecological zone ................................................................................................................33Map 4: Vegetation and land cover ........................................................................................................34Map 5: Population density of Makueni County ....................................................................................36Map 6: Summary of study area .............................................................................................................37Map 7: Sample distribution in the two divisions ..................................................................................39Map 8: Study area .................................................................................................................................40Map 1: Proposed Thwake dam..............................................................................................................93
List of Plates
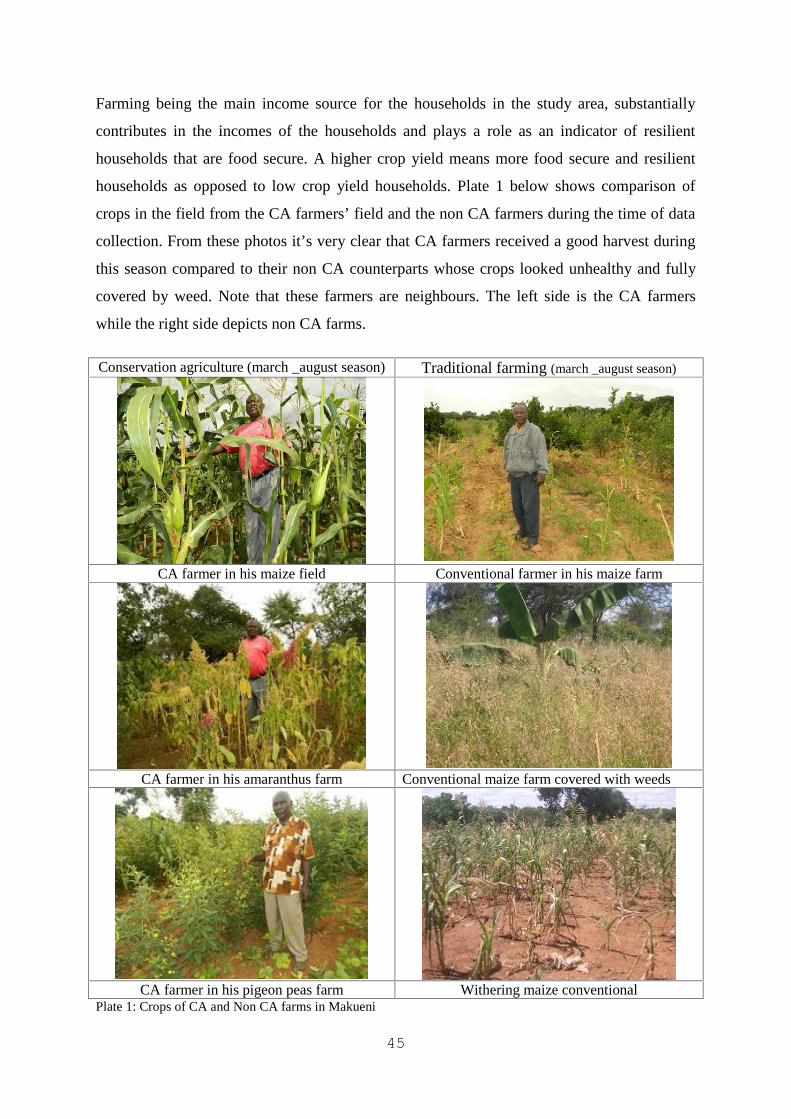
Plate 1: Crops of CA and Non CA farms in Makueni...........................................................................45Plate 2: Green grams and black beans (Dolichos) on a CA farm..........................................................49Plate 3: Poor state of roads in the study area ........................................................................................67Plate 4: Construction just two meters to the main road ........................................................................68
x
ACRONYMS
ALFA: Agriculture, Livestock, Fisheries and Food Authority
ASALs: Arid and Semi Arid Lands
BIDII: Benevolent Institute of Development Initiative
CA: Conservation Agriculture
CAADP: Comprehensive Africa Agricultural Development Programme
CETRAD: Centre for Training and Integrated Research for ASALs Development
C.R.S: Catholic Relief Services
CSA: Climate Smart Agriculture
DFID: Department for International development
ERS: Economic Recovery Strategy for Wealth and Employment Creation
EU: European Union
FAO: Food and Agriculture Organization
GOK: Government of Kenya
IFPRI: International Food Policy Research Institute
ILRI: International Livestock Research Institute
IPCC: Intergovernmental Panel on Climate Change
IPRSP: Interim Poverty Reduction Strategy
KIHBS: Kenya Integrated Household and Budget Survey
KIPPRA: The Kenya Institute for Public Policy Research and Analysis
KNBS: Kenya National Bureau of Statistics
LDGs: Least Developed countries
xi
MDGs: Millennium Development Goals
MOA: Ministry of Agriculture
NDMC: National drought mitigation centre
NEPAD: New Economic Partnership for African Development
NOAA: National Oceanic and Atmospheric Administration
NPEP: National Poverty Eradication Plan
NWP: Nairobi Work Program
PRSP: Poverty Reduction Strategy Paper
SES: Social ecological systems
SL: Sustainable Livelihood
SPSS: Statistical Package for Social Sciences
STI: Science, Technology and Innovation
THVC: Traditional High Value Crops
UN: United Nations
U.C.C.S: Ukambani Christian Community Services
UNFCCC: United Nations Framework Convention on Climate Change
USAID: United State Agency for International Development
USDA: United State Department of Agriculture
1
1 INTRODUCTION
Resilience has increasingly become a key concept in social science oriented environmental
research exploring how to deal successfully with climate, economic or social change. Much
has been written about ecosystem and socio-ecological resilience (Holling 1973; carpenter et
al., 2002; Berkes et la., 2003) or about social and ecological resilience (Adger 2000), but few
studies address resilience from a livelihoods perspective (e.g Sallu et al., 2010; Obrist et al.,
2010). Issues on how much a livelihood practice maintains or increases farmers’ capacity to
increase and maintain its livelihood especially during period of crisis are weakly
conceptualised and operationalized.
Though (Adger 2000) refers to livelihoods stability as an aspect of social resilience,
operationalization and assessment of what livelihood resilience entails are lacking. Obrist et
al., (2010) also note that social resilience remains neglected especially from agricultural
production system perspective. Authors define social resilience “the capacity of actors to
access capitals in order to –not only to cope with and adjust to adverse conditions (that is
reactive capacity) – but also search for and create options (that is proactive capacity), and
thus develop increased competence (that is positive outcomes) in dealing with threat” (Obrist
et al. 2010: 289). They developed a multi-layered social resilience framework emphasising
the interactions between enabling factors and capacities operating at different levels of
society, thereby highlighting ‘the interconnectedness of different dimensions and scale in
livelihood systems’ (Obrist et al. 2010: 287). Drawing from social and cultural theories such
as Bourdieu’s practice theory, capitals and social fields (1984; 1986) and Gidden’s
structuration theory (1979; 1984), the study explored resilience by examining indicators of
resilient and household performance using 2009 year as the perceived drought year,
approaches and techniques that have proved to promote resilient, factors affecting resilient
building and the policy option. Its acknowledged that resilience thinking is implicit in
Sustainable Livelihood (SL) approaches, e.g. the SL approach of the United Kingdom
Department for International development (DFID), that focuses on how people’s capabilities,
assets and activities, as well as transforming structures and processes have positive outcomes
like incomes, increased well being or improved food security (op. Cit. 286).
Therefore, linking livelihoods approaches to resilience thinking can enhance how livelihoods
approaches address long term change, but the link is yet to be made (Scoones). The paper
2
thus aims at extending the operationalization of resilience concept to livelihoods by
identifying criteria and variables that can measure or assess resilience for research and policy
practice departing from the livelihoods perspective. Therefore results in this study will inform
on research, development policy and practice on building and maintaining livelihoods
resilience and reducing vulnerability to shock and stresses.
The paper does not only focus on general livelihoods resilience but also illustrate examples of
techniques proven by farmers’ that have proven resilience to climate risks of droughts.
1.1 Background to the research problem
According to Oxfarm, almost 80 per cent of the world’s 925 million hungry people live in
rural areas, and most depend on agriculture as their main source of income and employment.
Approximately half of these are smallholder farmers. Overall, smallholder farmers constitute
1.5 billion of the three billion people living in rural areas and 87 per cent of all farmers in
developing countries. Of the one billion poor people living in rural areas, most rely mainly on
agriculture for their incomes (Oxfam GB, 2011). Global shocks and crises such as the 2008
3-F crisis (food, fuel, and financial), as well as more localized ones such as droughts, are
changing and deepening the risks already faced by the poor and vulnerable people,
particularly those involved in agriculture and other ecosystem-dependent livelihoods.
Reliance on subsistence agriculture means that the impact of these stresses and shocks are felt
more by rural poor people, who depend directly on food system outcomes for their survival.
This has profound implications for the security of their livelihoods and welfare (Mark Davies
et al, 2011).
According to the Government of Kenya, in 2011, one third of the total population of 39
million people in Kenya suffered from chronic food and nutrition insecurity. As Kenya’s
population continues to grow, producing enough food for all remains a challenge.
Unpredictable weather patterns, poor planning and slow adoption of modern farming methods
negatively influence food security. Data from the International Food Policy Research
Institute (IFPRI, 1990, 1996, 2001, and 2012) show that food security has worsened in the
last two decades, with the Global Hunger Index dropping from 24 points in 1992 to 20 points
in 2009. Further, the Kenya Economic Report (KIPPRA, 2009) indicates that about half of
Kenya’s population is poor, and about 7.5 million people live in extreme poverty. Over 10
3
million suffer from chronic food insecurity and poor nutrition. The Millennium Development
Goals (MDGs), to which Kenya is a signatory, place elimination of hunger at the top of the
list of international goals. In recent years, it is estimated that at any one time, about 2 million
Kenyans require food assistance. According to trends, during periods of drought, heavy rains
and floods, the number of the needy would double (MOA, 2008).
Drought cycles in the country seem to have shortened to every 2-3 years instead of 5-7 years
in the past (MOA, 2009). The effect of climate change and global warming is posing great
danger to agricultural productivity. This has been aggravated by population pressure in high
potential areas pushing human settlement to water catchment areas and also cultivation of the
fragile ASALs (Nyariki, 2009). Small scale farmers in arid areas of Kenya have continued to
face uncertainties on crop production thus increased vulnerability to climate changes and
have continued to depend on basic essentials from relief provided by the government and
other international organizations. Sixty percent of the 10 million people living in arid areas
live below poverty line thus they are the most affected by food insecurity and poverty.
Though the situation calls for a reliable measure/ or coping strategy, these communities
continue to face challenges from one year to another. The government has, through the new
constitution and vision 2030 formulated policies that aim to alleviate poverty and hunger in
the country. Thus Vision 2030, on social equity and poverty reduction strives to reduce
poverty from the current level of 46 per cent of total population by between 3 and 9 per cent,
which is where most industrializing countries in South East Asia currently are (GOK, 2007).
For the last five years, the Centre for Training and Integrated Research for ASALs
Development (CETRAD) introduced and promoted a water and soil conservation technology
(Conservation Agriculture) in Kanthonzweni District. The project aimed to improvement of
food security situation, livelihoods and for the long term improvement of resilience
livelihoods. This study result on resilience build by farmers practicing conservation
agriculture in the district will go a long way to inform on the best practices, approaches, and
opportunities that can build resilient communities.
Makueni communities generally derive their livelihoods from subsistence (small-scale)
farming. The mastery of multiple livelihood skills is a source of resilience in times of
uncertainty and change. Diversification by local farmers provides a buffer against
environmental variability and change. To be able to bounce back during these shocks,
4
communities adopt and build various strategies and resilience to cushion themselves from
shocks.
Thus, in the recent past resilience has increasingly become a key concept in human
geography and development studies partly due to the seemingly insurmountable challenges
posed by multiple stressors in a globalised world. However, operationalizing resilience for
research and practice is still largely lacking. The aim of the study was to identify and
characterise livelihood resilience to climate risks among farmers and determine key
contributing factors.
1.2 The problem statement
The national wide survey carried out in 2006 by Kenya Integrated Household and Budget
Survey (KIHBS), found that 46% of the total Kenyan population is absolutely poor, i.e.
below the poverty line, whereas 49% of the rural population is absolutely poor (Kenya
National Bureau of Statistics, 2007). The 1997 Welfare Monitoring Survey showed a poverty
rate of 57% overall and 60% in the rural population. Therefore, there has been some
reduction in poverty across the country and across rural areas over the last decade but the
challenge remains to reduce poverty levels in the Kenyan rural areas to enable rural people to
build resilient livelihoods.
Makueni is a food insecure county with a history of low food production and a marked
fluctuation due to unreliable rainfall. The county food security situation has been severely
compromised by five consecutive partial to total crop failures. In 2005, Makueni produced
only 9% of its estimated annual cereal demand of 127,720 metric tons (MOA, 2005). This has
been disastrous for the largely peasant households due to loss of their livelihood. In general,
food insecurity in the district is linked to inadequate rainfall, use of poor agricultural
technologies, low purchasing power, poor infrastructure and environmental degradation
(MOA, 2010). The county has relied on food and non-food aid continuously for several years
because of vulnerable livelihood systems which are not resilient to adverse effects of weather
(World Vision, 2006). This has created dependency syndrome within the community,
hindering innovativeness and participation in development initiatives (World Vision, 2006).
The poor and women are the most vulnerable, with over 64% of households being female-
headed. They are often left by the male youth in search of employment opportunities in towns
5
especially in Nairobi. According to constituency well being report, up to 50.5% of Makueni
County population lives below poverty line (KNBS, 2005/2006).
The government introduced new legislative and policy reforms to coordinate ecosystem
management and the sustainable use of natural resources which includes; Agricultural Sector
Development Strategy, which gives agriculture priority importance within Kenya’s economy,
as a means of livelihood for most of the rural population, and as the key to food security and
poverty reduction; Legal Notice No. 166, which offers guidelines for agricultural farm
forestry and requires that 10 per cent of all agricultural land be planted with trees. But
regardless of these envisioned strategies, Kenyan households’ have continued to face
challenges and the situation is more pronounced in ASALs where, they have continued to
rely on relief for survival. Makueni County is faced with adverse effects of climate and
weather; therefore farmers are faced with shocks year in and year out and continue to receive
donations as relief from the government and other international bodies such as Kenya Red
Cross, Catholic relief services and World Food Program. The key strides are for specific
households to generate sustainable livelihood strategies in order to build sustainable
resilience to ensure households bounce back after times of shock.
Resilience research is still largely lacking in the country. Thus there is need to characterise
livelihood resilience among farmers and to analyse how resilient the livelihoods are to
climatic risks and the determinant factors. Previous research has focused on agro-pastoral
production system contribution to resilient livelihoods thus need for study on adaptation on
farming system to understand the dynamics and contribution of such systems in the country
(Chinwe, 2010).
Empirical evidence on the characteristics of agriculture-dependent communities that have
proven resilient to past climate-related problems is lacking at the household and community
levels in Kenya. Generating information to fill this gap will increase the understanding of
how communities cope with the impacts of climate-related problems, providing useful
insights into the structure, and drivers of resilience and useful lessons for ensuring sustainable
livelihoods in the face of climate variability.
6
1.3 Research questions
This research sought to answer the following questions in order to achieve the set objectives:
a. What are the indicators of resilient agriculture-based livelihoods to seasonal climatic
variations?
b. Which farmers’ and local actors’ approaches and practices contribute to resilient
livelihoods in the face of seasonal climatic variation?
c. What factors influence farmers’ capacity to develop and maintain resilient livelihoods in
the face of climatic risks?
d. What are the policy options for improving resilient livelihoods?
1.4 Research objectives
The following objectives were pursued in order to carry out investigation of the stated
problem.
a. To identify and examine indicators of resilient agriculture-based livelihoods to seasonal
climatic variations.
b. To identify farmers’ and local actors’ approaches and practices that contribute to resilient
livelihoods in the face of seasonal climatic variation.
c. To examine factors influencing farmers’ capacity to develop and maintain resilient
livelihoods in the face of climatic risks.
d. To identify policy options for enhancing of resilient livelihoods.
1.5 Research hypothesis
Hypothesis II:
H0: Farmers practicing Conservation agriculture technology are less resilient or equal to
those who are not practising the technology.
H1: Farmers practising conservation agriculture technology are more resilient than those who
are not practising the technology.
7
1.6 Geographical and theoretical scope of the study
This study was carried out in two divisions; Mavindini and Kathonzweni of Kathonzweni sub
county in Makueni County. The area is 187km away from Nairobi and its geographical
coordinates are 1° 48' 0" South and 37° 37' 0" East. The sub County was curved from the
larger and former Makueni district. Kathonzweni sub county, is located in the southern end of
Eastern Province and covers an area of 7,965.8 sq Km with a projected population of
1,037,266 (2009 population projections) with an annual growth rate of 2.8% (KNBS, 2009).
There are three main livelihood zones in the county. They include marginal mixed farming,
mixed farming (dairy/irrigation), and mixed farming (food crops/cotton/livestock).
The study used the case of conservation agriculture farmers within Kathonzweni Sub County
in Kenya and examined how conservation agriculture (CA) practices contribute to
improvement of resilience and buffer capacity.
The cluster of practices that characterizes buffer capacity in conservation agriculture was
identified. All practices in conservation agriculture that increase resilience capacity were
evaluated from farmer’s point of view on; economic, social, and ecological. Also factors that
influence farmer capacity to maintain resilience and the principles underlying resilience were
identified.
1.7 Justification and significance of the study
With a population of 39 million people (about ten percent of which is classified as food
insecure) and growing at an annual rate of about three percent, Kenya remain the largest
importer of food and agricultural products in east Africa (USDA, 2009). The Government of
Kenya (GOK) recognized the seriousness of the evolving food shortage (precipitated by the
white corn shortfall) in 2009 and food state of emergency was declared stating that about 10
million Kenyans, or about 25 percent of the population, were at risk of food shortage. In
2009, the GOK requested potential donor countries to provide Kenya Shillings 32 billion
(approximately $401 million) to help with the hunger eradication effort. Thus this study can
help to save the country income used to eradicate poverty in the country. E.g. the 1998-2000
drought events were estimated to have economic costs of $2.8 billion from the loss of crops
and livestock (Stockholm Environment Institute, Project Report 2009)
8
According to trends, periods of drought, heavy rains and floods, the number of food needy
doubles during such occurrences (MOA, 2008) and 60% of 10 million people living in arid
areas live below poverty line and are the most affected by food insecurity and poverty.
Analyses on climate trend during 1960 to 2009 indicate consistent patterns of climate change
on rainfall and temperature data. When analysis is extended to2025, it indicates that large
parts of Kenya will have experienced more than a 100 millimeter (mm) decline in long-
season rainfall by that date (Williams and Funk, 2010).
Food insecurity in Kenya has been a major challenge that has faced the country for many
years plunging majority of Kenyans especially low income earners into abject poverty. The
latest index indicates that the national poverty levels stand at 47 per cent and it might increase
if inflation rates, shilling volatility and poor farming methods are not curbed early. In Kenya
food insecurity is concentrated in the rural areas. In April, 2008, about 3.5 million people in
the country were reported to be in need of emergency food aid (USAID, 2009). The food
security problem spreads to regional levels worsening as the agricultural potential declines,
and develops into famines in the dry lands with low agricultural productivity and purchasing
power, as livelihoods are based on extensive crop farming and herding (Muyanga, 2004).
Evidence on the generic characteristics of agriculture-dependent communities that have
proven resilient or vulnerable to past climate-related problems is lacking at the household and
community levels in Kenya.
1.8 Assumptions of the study
a) The study assumes that farmers respond to shocks by adopting various strategies to enable
them cope and bounce back.
9
1.9 Definition of terms and variables
1.9.1 Resilience
The term "resilience" and "adaptive capacity" are sometimes used interchangeably. For
resilience, I will adopt capenter’s (2001), Folke (2006), FAO’s (2011) and Garmezy, (1994)
in Saleebey, (1996). In this sense, resilience refers to,
The capacity of individuals, social groups or social-ecological systems to absorb (withstand,
live with, accommodate) disturbances (e.g. climate change impacts) while retaining the same
basic structure and ways of functioning, the capacity for self-organisation, and the capacity to
learn and adapt to change (cf. Carpenter et al. 2001; Berkes et al. 2003; Folke 2006; IPCC
2007+).
In a food security context, resilience is defined as “the ability of a household to keep with a
certain level of well-being (i.e. being food secure) by withstanding shocks and stresses.” This
depends on available livelihood options and on how well households are able to handle risks.
This definition implicitly considers both (ex-ante) actions that reduce the risk of households
becoming food insecure, and (ex-post) actions that help households cope after a crisis occurs
(FAO, 2011).
Resilience means the skills, abilities, knowledge, and insight that accumulate over time as
people struggle to surmount adversity and meet challenges. It is an ongoing and developing
of energy and skill that can be used in current struggles (Garmezy, (1994), in Saleebey,
(1996).
The study will also adapt to the following definitions
1.9.2 Livelihood
The concept of livelihood is about individuals, households, or groups making a living,
attempting to meet their various consumption and economic necessities, coping with
uncertainties, and responding to new opportunities (de Haan and Zoomers, 2003).
A livelihood comprises the capabilities, assets (including both material and social resources)
and activities required for a means of living.
10
1.9.3 Sustainable livelihood
A livelihood is sustainable when it can cope with and recover from stresses and shocks and
manage to enhance its capabilities and assets both now and in the future, while not
undermining the natural resource base” (Chambers & Conway, 1991).
1.9.4 Vulnerability
Likelihood of being harmed by a given adverse event, and has an external side consisting of
risks, shocks, and stresses to which individuals or households are subjected, and an internal
defenseless side characterized by a lack of means to cope without a damaging loss (Chambers
1989).
Degree to which a system is susceptible to, or unable to cope with, adverse effects of climate
change including climate variability and extremes. Vulnerability is a function of the
character, magnitude, and rate of climate variation to which a system is exposed, its
sensitivity, and its adaptive capacity.” (IPCC, 2001: 995).
1.9.5 Adaptive capacity
The ability of a system [human or natural] to adjust to climate change (including climate
variability and extremes) to moderate potential damages, to take advantage of opportunities,
or to cope with the consequences.
11
2 LITERATURE REVIEW
2.1 Introduction
2.1.1 Origin of resilience
The term resilience was introduced into the English language in the early 17th Century from
the Latin verb resilire, meaning to rebound or recoil (Concise Oxford Dictionary, Tenth
Edition). There is no evidence of resilience being used in any scholarly work until Tredgold
(1818) introduced the term to describe a property of timber, and to explain why some types of
wood were able to accommodate sudden and severe loads without breaking.
In less than a decade the term resilience evolved from the disciplines of materials
science and environmental studies to become a concept used liberally and enthusiastically
by policy makers, practitioners and academics.
2.1.2 Resilience
Resilience is the capacity of individual, social groups or social ecological system to absorb
withstand, live with, accommodate disturbances e.g. climate change impacts while retaining
some basic structure and ways of functioning, the capacity to self organization and capacity
to learn and adopt to change.
High dependence on natural resources and rain-fed agriculture in a context of a changing
climate, socio-economic pressures and low adaptive capacities make Africa’s smallholder
crop production farmer vulnerable to climate change (IPCC 2007a, McIntyre et al. 2009).
High rainfall variability in amount, time and location is common in African dry lands (Ogallo
1989) and poses a risk to maintaining and increasing agricultural production (Ifejika Speranza
et al. 2008). The likely increase in rainfall variability projected for African’s dry lands, a
projected decrease in reliable growing days and an increase in season failure rates up to 2050
(IPCC 37 2007a; Jones and Thornton 2009) will exacerbate the already precarious climatic
conditions for agricultural production. Thus, building resilience offers a pathway to reduce
the vulnerability of agricultural production to climate variability. However, few studies have
characterized resilience in the context of livelihoods-related environmental research.
Resilience has three characteristic features, namely, buffer capacity, self-organization and
12
capacity for learning, which also influence one another. The study will focus on the
contribution of Conservation Agriculture to building of agriculture resilient livelihood.
The way a household copes with and withstand climate change impacts depends on options
available in terms of capabilities, assets (both material and social resources) and activities.
Livelihood strategy for a household is the way those options are arranged and selected for
such household to withstand shocks during extreme effects of climate change.
Households belonging to different socio-economic groups have different strategies to earn
their own living thus different levels of resilience to climate change. E.g. farmer household
verses a household whose major income is from public sector employment- Each requiring
different type of interventions. Different communities and households have adopted various
livelihood strategies in order to cope with extreme climatic effect. In Makueni, the
occupation activities of most households can be classified as homogeneous groups of agro
pastoralists and small holder farmers. The district has for many years been involved in
farming as a means of economic activity and for survival.
2.1.3 Characteristics of resilience
A strawman paper by Alastair McAslan on “the concept of resilient” discuses at length a
number of characteristics of resilience. They include:
i) Threats and events- All definitions of resilience refer to threats and events which are
abnormal in terms of their scale, form or timing. Resilience is seen as the ability to
accommodate abnormal threats and events, be they enemy actions (Fairbairn, 1865), or
perturbations from climate change (Stockholm Resilience Centre, 2009), or natural disasters
such as earthquakes or floods (Bruneau et.al. 2003), or economic shocks (Hamel and
Välikangas, 2003). Most definitions, particularly those involving individuals, communities
and organisations also refer to identifying, assessing and communicating the risk from such
threats and events.
ii) Positive outcomes- All definitions refer to a positive outcome, be it the ability of a
material to absorb and release energy and return to its original state (Gere and
Goodman, 2009), or the ability of an individual, group or organisation to continue in
existence in the face of some sort of surprise event (Longstaff, 2005), or the ability to recover
from or adjust easily to misfortune or sustained life stress, or the capacity of a system to
13
absorb disturbance and still retain essentially the same function (Resilience Alliance, 2006).
In some cases a positive outcome means returning to the state or condition that existed
before the disturbance occurred. I n other cases a positive outcome means returning to
an improved state or condition.
iii) Being prepared- Resilience involves the ability or capacity to absorb, and then recover
from an abnormal event. This capacity may be built formally and deliberately by
developing plans, standards and operational procedures, or by developing physical, economic
and/or human capital (Mayunga, 2007). It may also evolve informally through the
development of social capital (Tierney, 2006), or it may exist naturally through the properties
of the material being used (Mallet, 1856). Individuals, communities, organisations and,
indeed, nations which are prepared and ready for an abnormal event, tend to be more
resilient.
iv) Desire/ commitment to survive- Survival is a basic human instinct, and individuals who
demonstrate the strongest will to remain alive are able to accept extreme and abnormal
conditions and recover from traumatic events.
v) Adaptability- We live in a world which is constantly evolving, in some cases through
natural processes and in other cases through the intervention of mankind. There is common
agreement in the literature that systems, organisations and people who are able and willing to
adapt tend to be more resilient.
vi) Gaining experience- The ability and willingness to learn is often linked to adaptability
and being prepared. The learning may come from personal experience or by studying the
lessons of others in a formal manner.
vii) Collective and coordinated response – interdependency- As society becomes more
complex and interconnected, and the impact of global factors become more immediate and
apparent, we find ourselves more vulnerable to disruptive events. In facing such
interconnected threats, resilient h o u s e h o l d s , communities and organisations and
indeed nations tend to be those which are well coordinated and share common values and
beliefs. But researchers such as Durodie (2004) suggest that shared community values and
beliefs in the modern world have been replaced by self interest and personal gain, resulting
invulnerable societies which are less able and willing to plan for, and react to, disruptive
events.
14
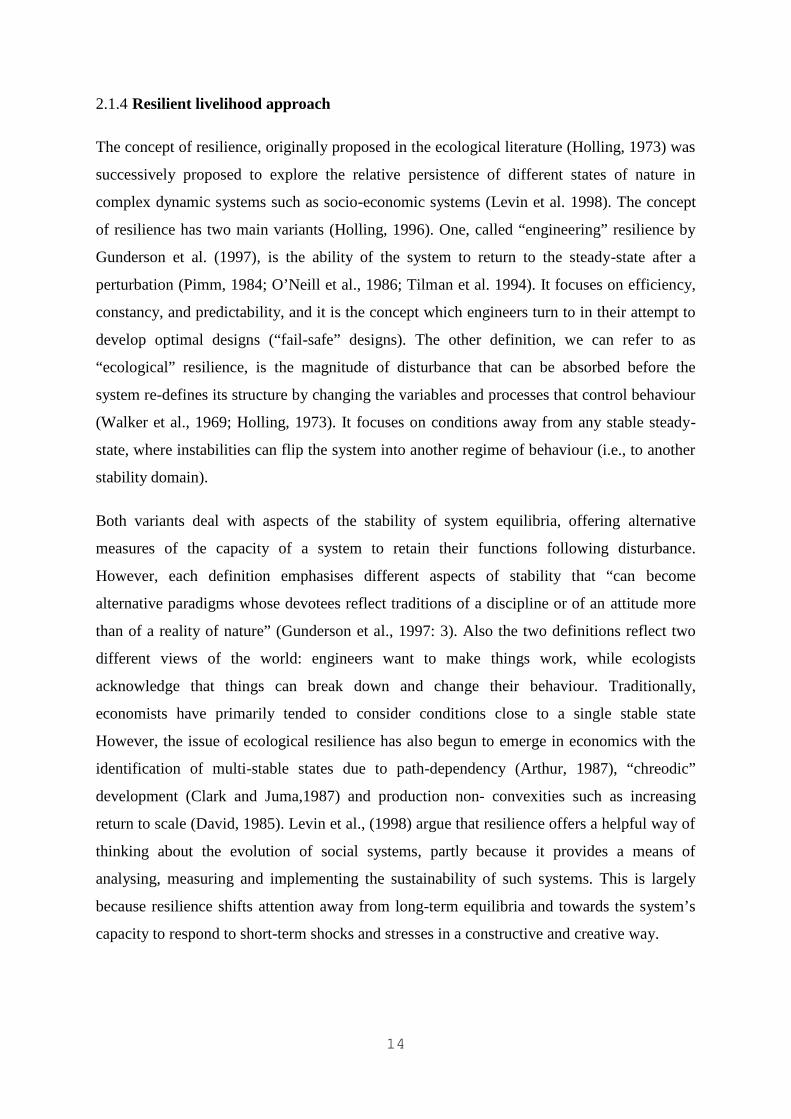
2.1.4 Resilient livelihood approach
The concept of resilience, originally proposed in the ecological literature (Holling, 1973) was
successively proposed to explore the relative persistence of different states of nature in
complex dynamic systems such as socio-economic systems (Levin et al. 1998). The concept
of resilience has two main variants (Holling, 1996). One, called “engineering” resilience by
Gunderson et al. (1997), is the ability of the system to return to the steady-state after a
perturbation (Pimm, 1984; O’Neill et al., 1986; Tilman et al. 1994). It focuses on efficiency,
constancy, and predictability, and it is the concept which engineers turn to in their attempt to
develop optimal designs (“fail-safe” designs). The other definition, we can refer to as
“ecological” resilience, is the magnitude of disturbance that can be absorbed before the
system re-defines its structure by changing the variables and processes that control behaviour
(Walker et al., 1969; Holling, 1973). It focuses on conditions away from any stable steady-
state, where instabilities can flip the system into another regime of behaviour (i.e., to another
stability domain).
Both variants deal with aspects of the stability of system equilibria, offering alternative
measures of the capacity of a system to retain their functions following disturbance.
However, each definition emphasises different aspects of stability that “can become
alternative paradigms whose devotees reflect traditions of a discipline or of an attitude more
than of a reality of nature” (Gunderson et al., 1997: 3). Also the two definitions reflect two
different views of the world: engineers want to make things work, while ecologists
acknowledge that things can break down and change their behaviour. Traditionally,
economists have primarily tended to consider conditions close to a single stable state
However, the issue of ecological resilience has also begun to emerge in economics with the
identification of multi-stable states due to path-dependency (Arthur, 1987), “chreodic”
development (Clark and Juma,1987) and production non- convexities such as increasing
return to scale (David, 1985). Levin et al., (1998) argue that resilience offers a helpful way of
thinking about the evolution of social systems, partly because it provides a means of
analysing, measuring and implementing the sustainability of such systems. This is largely
because resilience shifts attention away from long-term equilibria and towards the system’s
capacity to respond to short-term shocks and stresses in a constructive and creative way.
15
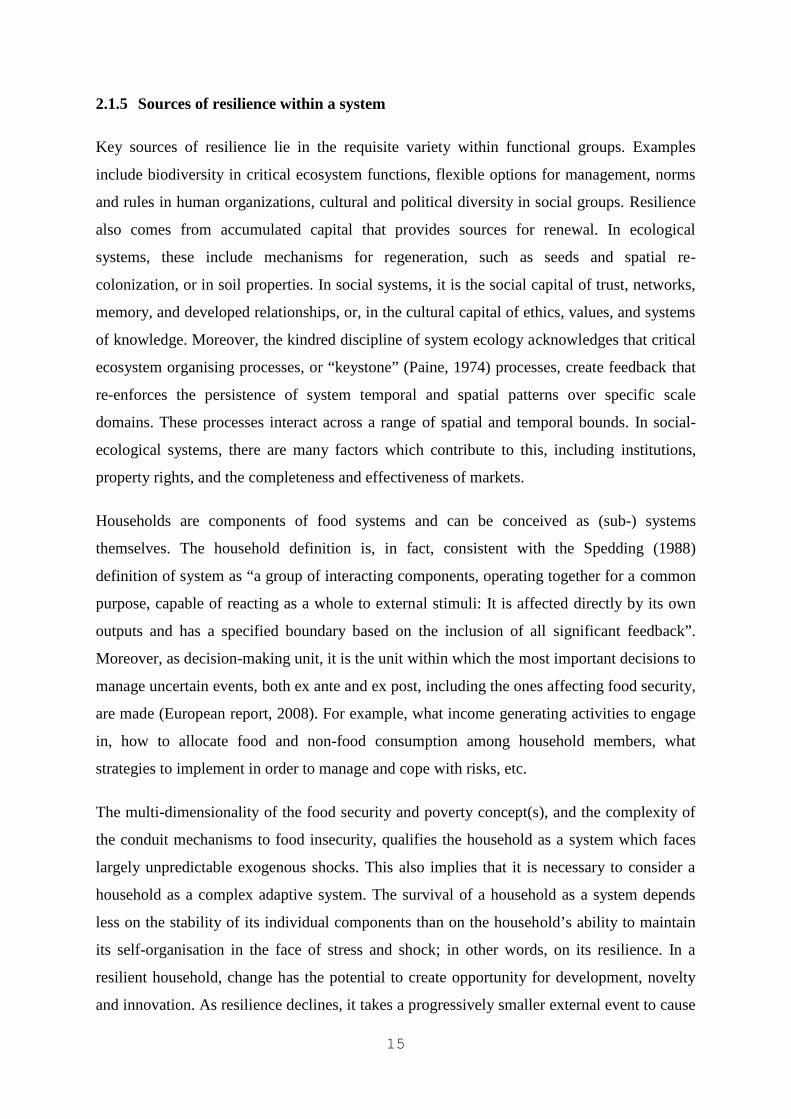
2.1.5 Sources of resilience within a system
Key sources of resilience lie in the requisite variety within functional groups. Examples
include biodiversity in critical ecosystem functions, flexible options for management, norms
and rules in human organizations, cultural and political diversity in social groups. Resilience
also comes from accumulated capital that provides sources for renewal. In ecological
systems, these include mechanisms for regeneration, such as seeds and spatial re-
colonization, or in soil properties. In social systems, it is the social capital of trust, networks,
memory, and developed relationships, or, in the cultural capital of ethics, values, and systems
of knowledge. Moreover, the kindred discipline of system ecology acknowledges that critical
ecosystem organising processes, or “keystone” (Paine, 1974) processes, create feedback that
re-enforces the persistence of system temporal and spatial patterns over specific scale
domains. These processes interact across a range of spatial and temporal bounds. In social-
ecological systems, there are many factors which contribute to this, including institutions,
property rights, and the completeness and effectiveness of markets.
Households are components of food systems and can be conceived as (sub-) systems
themselves. The household definition is, in fact, consistent with the Spedding (1988)
definition of system as “a group of interacting components, operating together for a common
purpose, capable of reacting as a whole to external stimuli: It is affected directly by its own
outputs and has a specified boundary based on the inclusion of all significant feedback”.
Moreover, as decision-making unit, it is the unit within which the most important decisions to
manage uncertain events, both ex ante and ex post, including the ones affecting food security,
are made (European report, 2008). For example, what income generating activities to engage
in, how to allocate food and non-food consumption among household members, what
strategies to implement in order to manage and cope with risks, etc.
The multi-dimensionality of the food security and poverty concept(s), and the complexity of
the conduit mechanisms to food insecurity, qualifies the household as a system which faces
largely unpredictable exogenous shocks. This also implies that it is necessary to consider a
household as a complex adaptive system. The survival of a household as a system depends
less on the stability of its individual components than on the household’s ability to maintain
its self-organisation in the face of stress and shock; in other words, on its resilience. In a
resilient household, change has the potential to create opportunity for development, novelty
and innovation. As resilience declines, it takes a progressively smaller external event to cause
16
a catastrophe. A household with low resilience may still maintain its functions and generate
resources and services – i.e., may seem to be in good shape – but when subject to
disturbances and stochastic events, it may exceed a critical threshold and change to a less
desirable state.
For all these reasons, the concept of resilience as applied to household food security seems to
be promising (EU, 2008): It aims to measure the capability of households to absorb the
negative effects of unpredictable shocks, rather than to predict the occurrence of a crisis (as in
the case of most vulnerability literature).
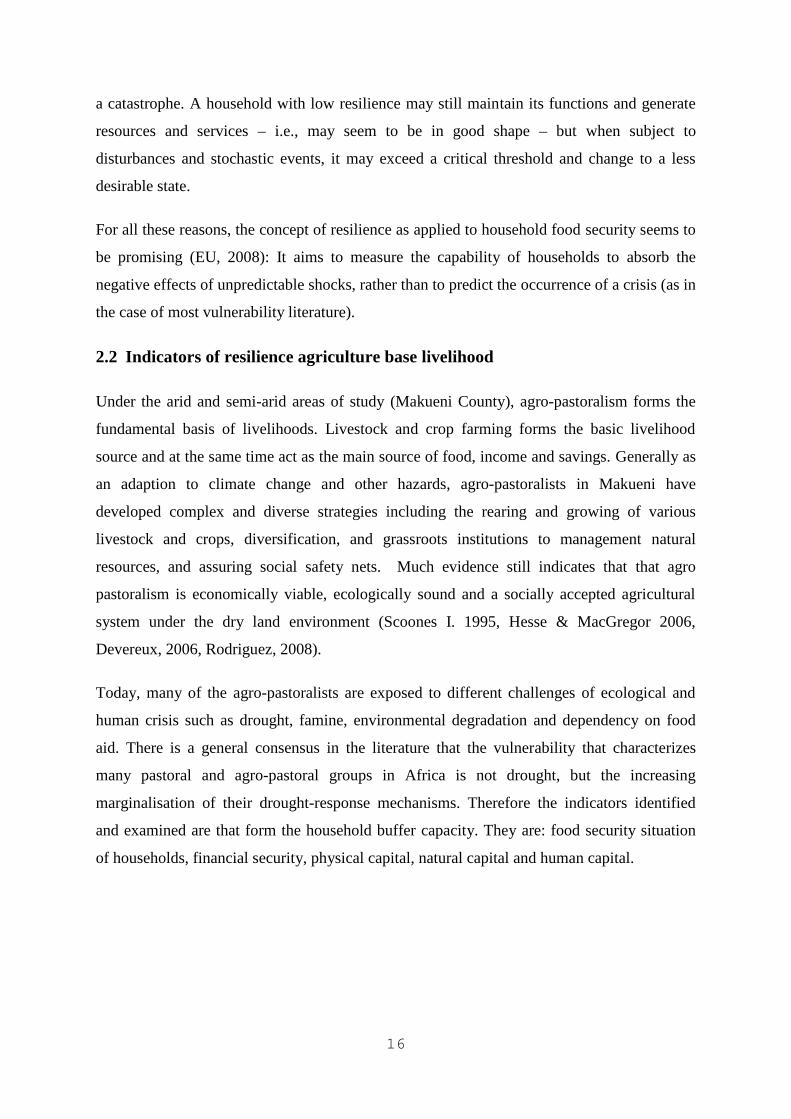
2.2 Indicators of resilience agriculture base livelihood
Under the arid and semi-arid areas of study (Makueni County), agro-pastoralism forms the
fundamental basis of livelihoods. Livestock and crop farming forms the basic livelihood
source and at the same time act as the main source of food, income and savings. Generally as
an adaption to climate change and other hazards, agro-pastoralists in Makueni have
developed complex and diverse strategies including the rearing and growing of various
livestock and crops, diversification, and grassroots institutions to management natural
resources, and assuring social safety nets. Much evidence still indicates that that agro
pastoralism is economically viable, ecologically sound and a socially accepted agricultural
system under the dry land environment (Scoones I. 1995, Hesse & MacGregor 2006,
Devereux, 2006, Rodriguez, 2008).
Today, many of the agro-pastoralists are exposed to different challenges of ecological and
human crisis such as drought, famine, environmental degradation and dependency on food
aid. There is a general consensus in the literature that the vulnerability that characterizes
many pastoral and agro-pastoral groups in Africa is not drought, but the increasing
marginalisation of their drought-response mechanisms. Therefore the indicators identified
and examined are that form the household buffer capacity. They are: food security situation
of households, financial security, physical capital, natural capital and human capital.
17
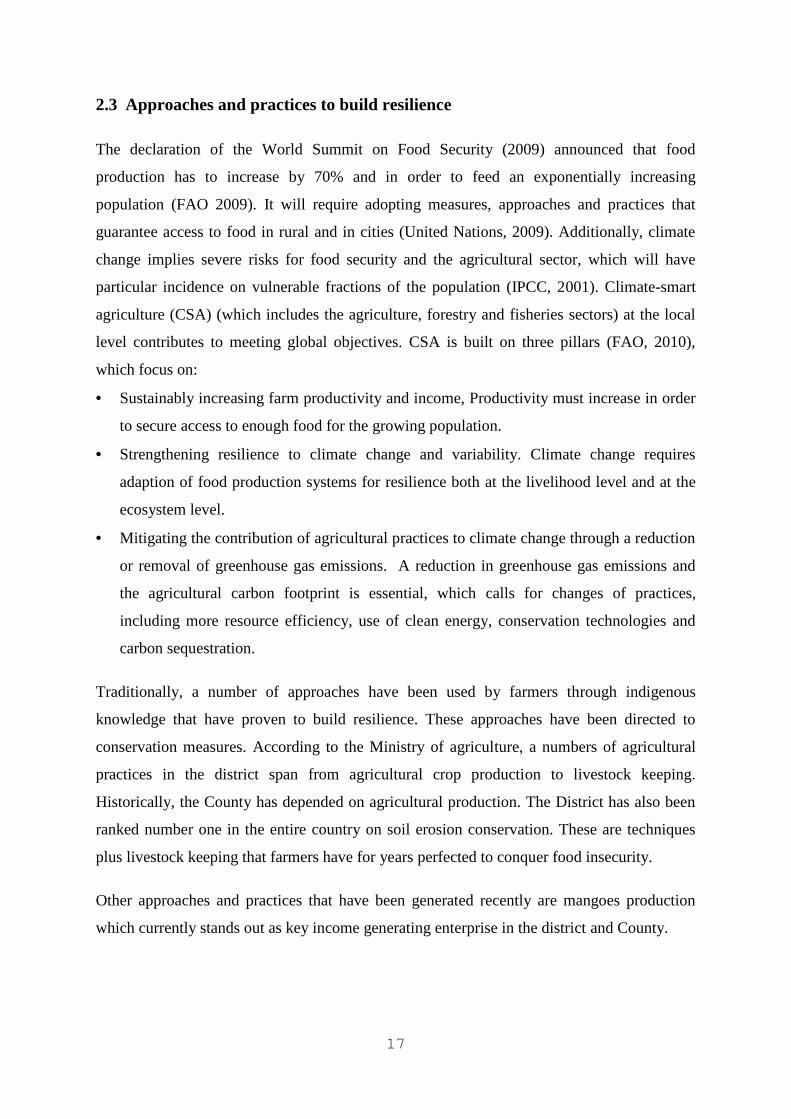
2.3 Approaches and practices to build resilience
The declaration of the World Summit on Food Security (2009) announced that food
production has to increase by 70% and in order to feed an exponentially increasing
population (FAO 2009). It will require adopting measures, approaches and practices that
guarantee access to food in rural and in cities (United Nations, 2009). Additionally, climate
change implies severe risks for food security and the agricultural sector, which will have
particular incidence on vulnerable fractions of the population (IPCC, 2001). Climate-smart
agriculture (CSA) (which includes the agriculture, forestry and fisheries sectors) at the local
level contributes to meeting global objectives. CSA is built on three pillars (FAO, 2010),
which focus on:
Sustainably increasing farm productivity and income, Productivity must increase in order
to secure access to enough food for the growing population.
Strengthening resilience to climate change and variability. Climate change requires
adaption of food production systems for resilience both at the livelihood level and at the
ecosystem level.
Mitigating the contribution of agricultural practices to climate change through a reduction
or removal of greenhouse gas emissions. A reduction in greenhouse gas emissions and
the agricultural carbon footprint is essential, which calls for changes of practices,
including more resource efficiency, use of clean energy, conservation technologies and
carbon sequestration.
Traditionally, a number of approaches have been used by farmers through indigenous
knowledge that have proven to build resilience. These approaches have been directed to
conservation measures. According to the Ministry of agriculture, a numbers of agricultural
practices in the district span from agricultural crop production to livestock keeping.
Historically, the County has depended on agricultural production. The District has also been
ranked number one in the entire country on soil erosion conservation. These are techniques
plus livestock keeping that farmers have for years perfected to conquer food insecurity.
Other approaches and practices that have been generated recently are mangoes production
which currently stands out as key income generating enterprise in the district and County.
18
2.3.1 Conservation agriculture (CA) to improve resilience livelihood to climate change
Conservation is a technique that entails three principles (permanent soil cover, minimum soil
disturbance and crop rotation) with overall role of soil and water conservation in-order to
increase production and minimize weather base risks. Conservation agriculture has for many
years been used to build resilient livelihoods in various parts of the world. Farmers in
Kathonzweni have practiced CA for a number of years-traditionally (Terraces) and post
modern society through the application of the three principles.
Kanthonzweni District is faced with adverse effect of climate and weather, thus farmers face
shocks year in and year out. And the key issue is for specific households to generate specific
livelihood strategies in-order to build sustainable resilience to enable the household to bounce
back in times of shock. Such strategies are; diversification of crops especially growing of
drought tolerant crops, and adopting better farming techniques that conserve moisture such as
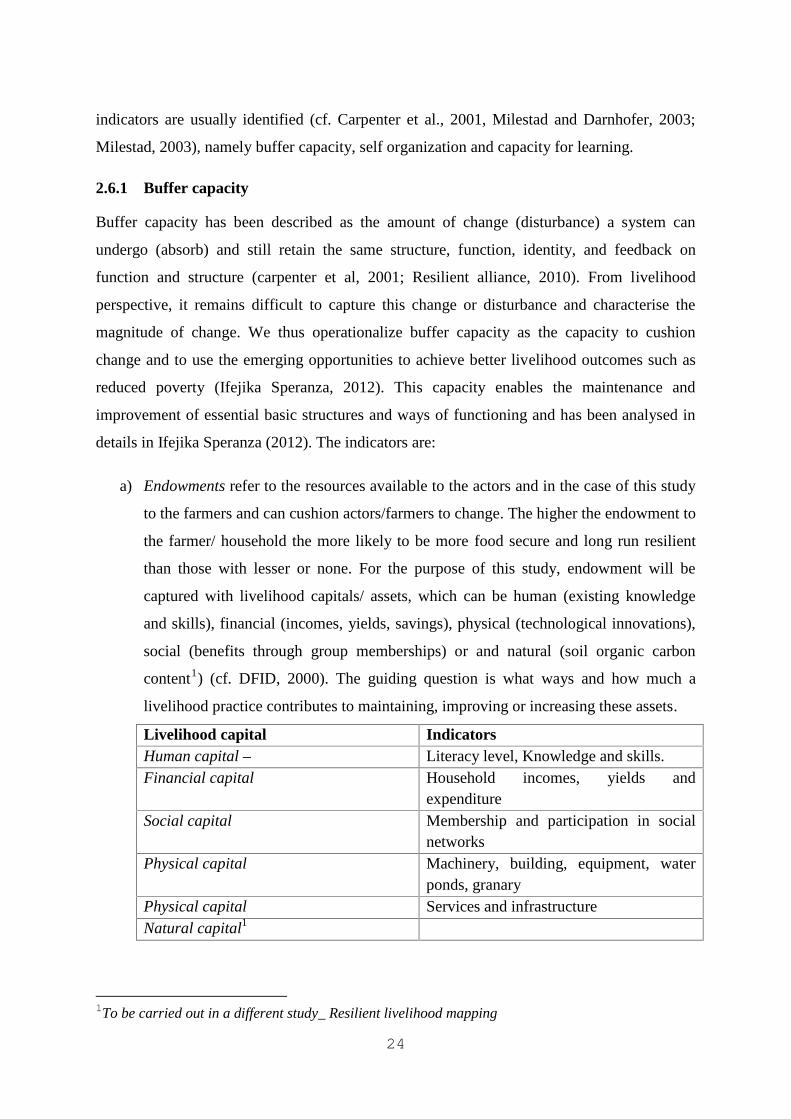
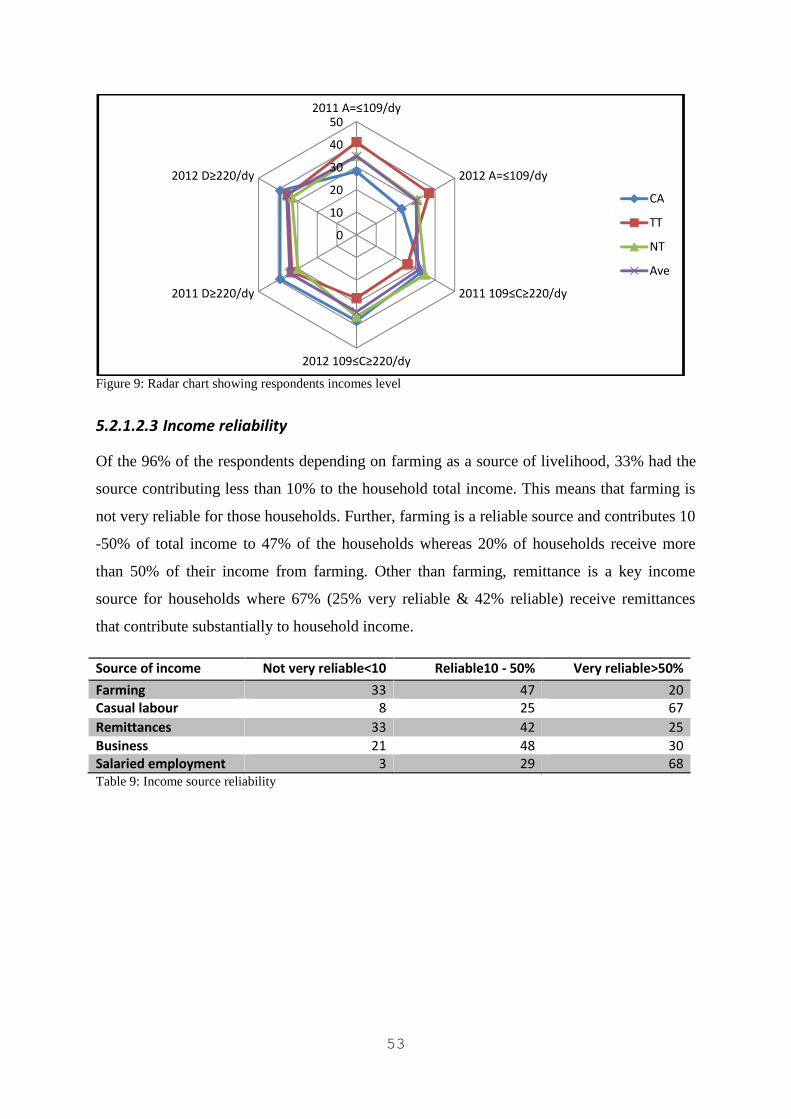
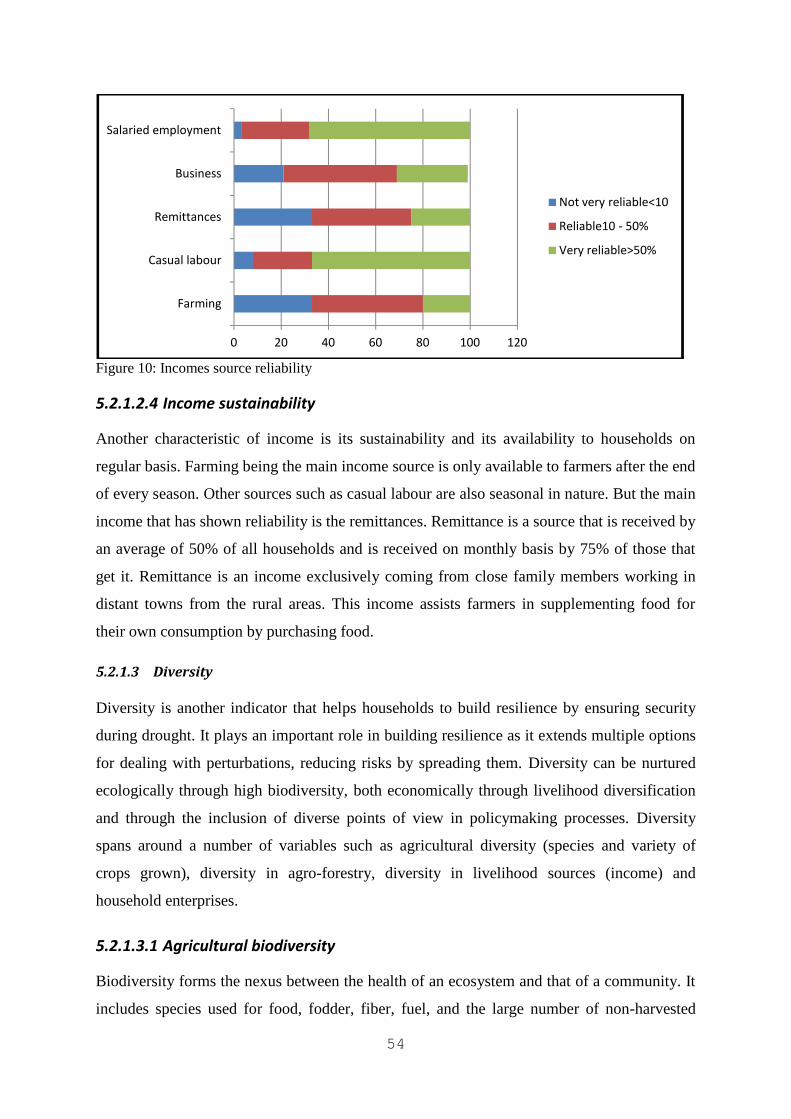
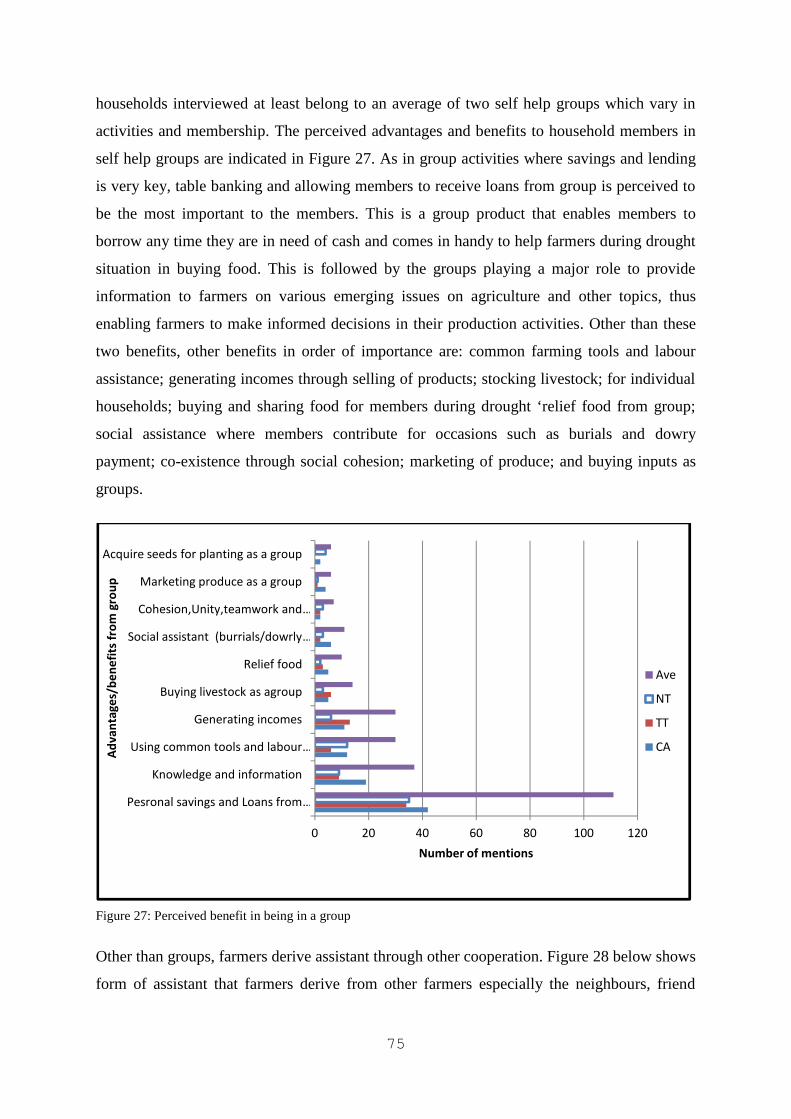
Of the 96% of the respondents depending on farming as a source of livelihood, 33% had the
source contributing less than 10% to the household total income. This means that farming is
not very reliable for those households. Further, farming is a reliable source and contributes 10
-50% of total income to 47% of the households whereas 20% of households receive more
than 50% of their income from farming. Other than farming, remittance is a key income
source for households where 67% (25% very reliable & 42% reliable) receive remittances
that contribute substantially to household income.
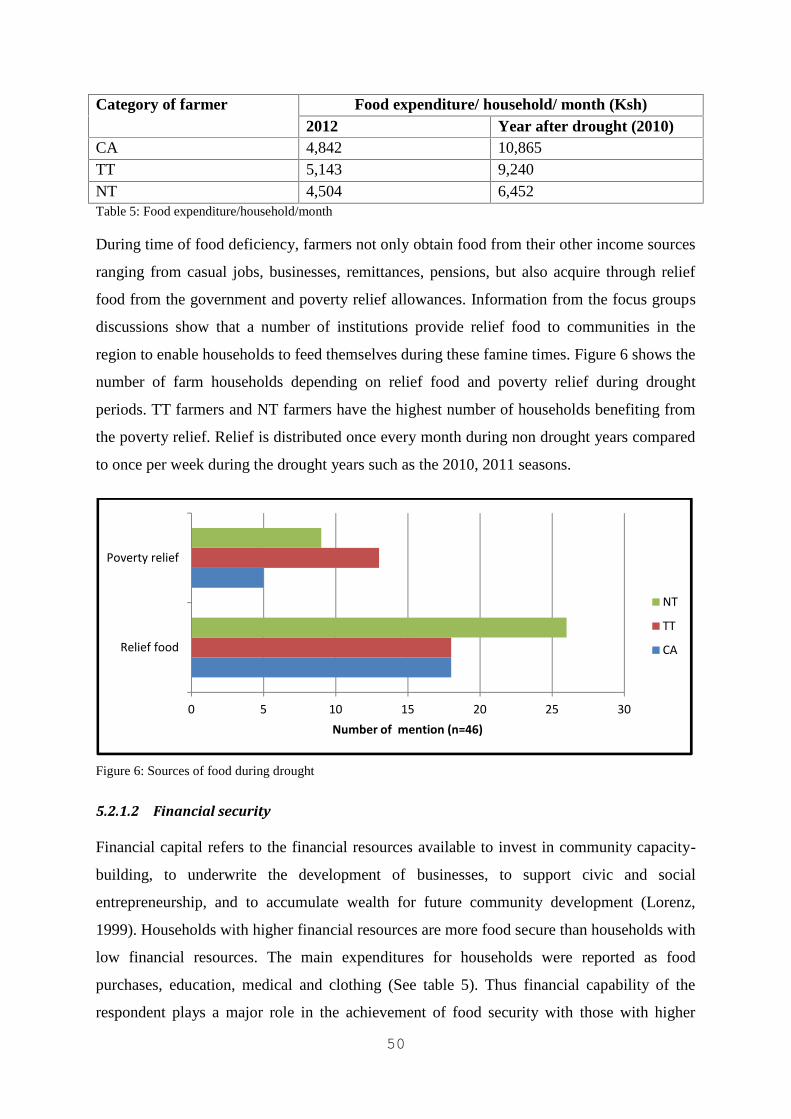
Source of income Not very reliable<10 Reliable10 - 50% Very reliable>50%Farming 33 47 20Casual labour 8 25 67Remittances 33 42 25Business 21 48 30Salaried employment 3 29 68Table 9: Income source reliability
0
10
20
30
40
502011 A=≤109/dy
2012 A=≤109/dy
2011 109≤C≥220/dy
2012 109≤C≥220/dy
2011 D≥220/dy
2012 D≥220/dy
CA
TT
NT
Ave
54
Figure 10: Incomes source reliability
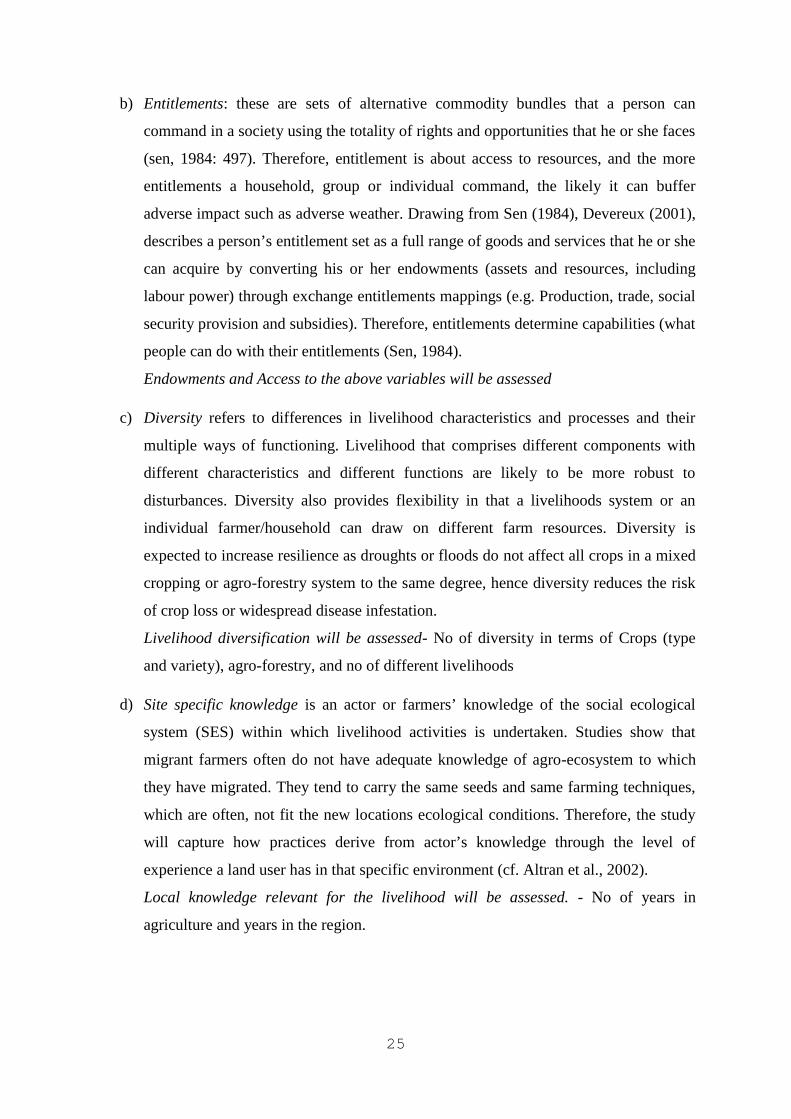
5.2.1.2.4 Income sustainability
Another characteristic of income is its sustainability and its availability to households on
regular basis. Farming being the main income source is only available to farmers after the end
of every season. Other sources such as casual labour are also seasonal in nature. But the main
income that has shown reliability is the remittances. Remittance is a source that is received by
an average of 50% of all households and is received on monthly basis by 75% of those that
get it. Remittance is an income exclusively coming from close family members working in
distant towns from the rural areas. This income assists farmers in supplementing food for
their own consumption by purchasing food.
5.2.1.3 Diversity
Diversity is another indicator that helps households to build resilience by ensuring security
during drought. It plays an important role in building resilience as it extends multiple options
for dealing with perturbations, reducing risks by spreading them. Diversity can be nurtured
ecologically through high biodiversity, both economically through livelihood diversification
and through the inclusion of diverse points of view in policymaking processes. Diversity
spans around a number of variables such as agricultural diversity (species and variety of
crops grown), diversity in agro-forestry, diversity in livelihood sources (income) and
household enterprises.
5.2.1.3.1 Agricultural biodiversity
Biodiversity forms the nexus between the health of an ecosystem and that of a community. It
includes species used for food, fodder, fiber, fuel, and the large number of non-harvested
0 20 40 60 80 100 120
Farming
Casual labour
Remittances
Business
Salaried employment
Not very reliable<10
Reliable10 - 50%
Very reliable>50%
55
species in the wider landscape directly used by or benefiting households and the communities
through the services they provide such as pollinators, soil biota and regulators of pests and
diseases. Agricultural biodiversity provides material for experimentation, innovation and
adaptation. The genetic diversity found in local crop varieties and animal breeds, expressed in
important traits such as drought tolerance as in the case of the study area, and resistance to
pests and diseases, helps them adapt to various soil and climate conditions. The loss in
diversity of these traits reduces options for risk management and adaptation. Local food
systems and landscape diversification, on the other hand, encourages the maintenance of
agricultural biodiversity and contributes to food security and self-sufficiency.
Crop diversity provides a typical landscape diversity that indicates the aesthetic value of a
diverse agricultural landscape from a social point of view 2 . On the other hand, in the
literature on risk management in agriculture, crop diversity has been attributed a private value
as an option for risk-averse farmers to hedge against uncertainty (Di Falco and Perrings,
2005). On these grounds, the trade-off between market output (crop yield) and non-market
ecological by-product (crop diversity) can be considered relevant for farmers’ decision
making. In this study concentration was on private value as an option to averse risks by
farmers.
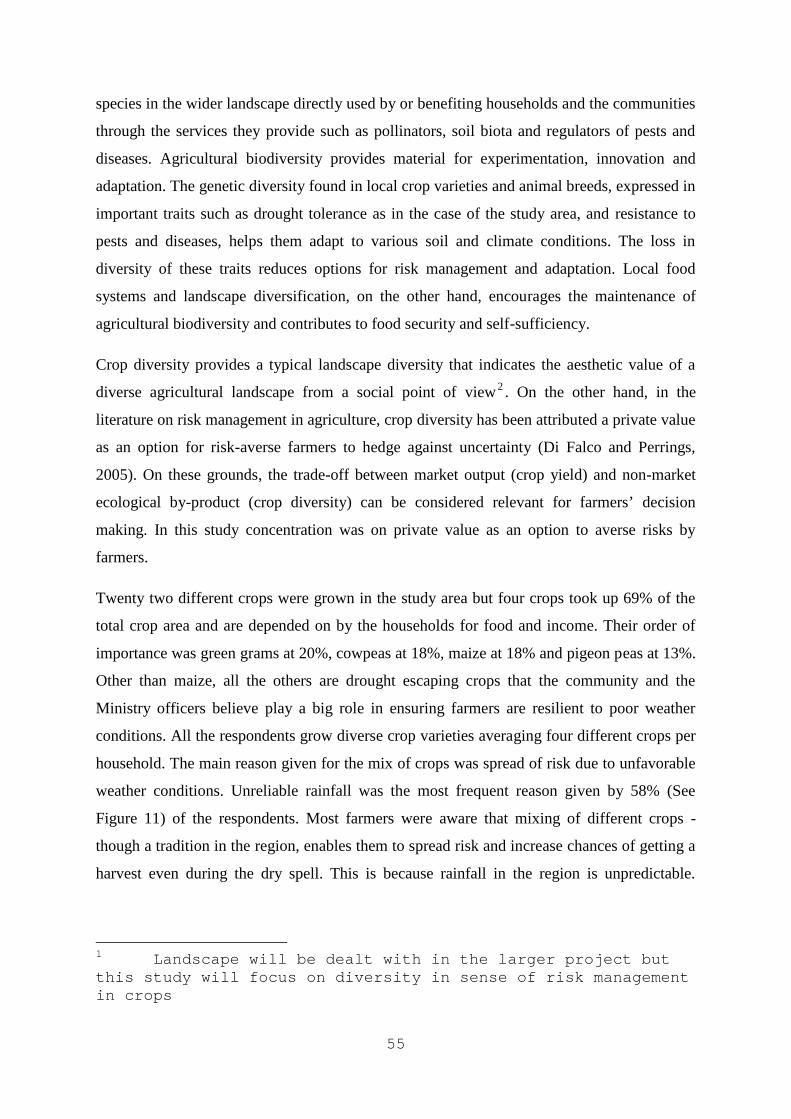
Twenty two different crops were grown in the study area but four crops took up 69% of the
total crop area and are depended on by the households for food and income. Their order of
importance was green grams at 20%, cowpeas at 18%, maize at 18% and pigeon peas at 13%.
Other than maize, all the others are drought escaping crops that the community and the
Ministry officers believe play a big role in ensuring farmers are resilient to poor weather
conditions. All the respondents grow diverse crop varieties averaging four different crops per
household. The main reason given for the mix of crops was spread of risk due to unfavorable
weather conditions. Unreliable rainfall was the most frequent reason given by 58% (See
Figure 11) of the respondents. Most farmers were aware that mixing of different crops -
though a tradition in the region, enables them to spread risk and increase chances of getting a
harvest even during the dry spell. This is because rainfall in the region is unpredictable.
1 Landscape will be dealt with in the larger project butthis study will focus on diversity in sense of risk managementin crops
56
Growing a mix of drought escaping crops plus other hybrid crops enables farmers to gain in-
case of low rainfall or high rainfall.
Figure 11: Radar chart showing the main reason for mixing crops
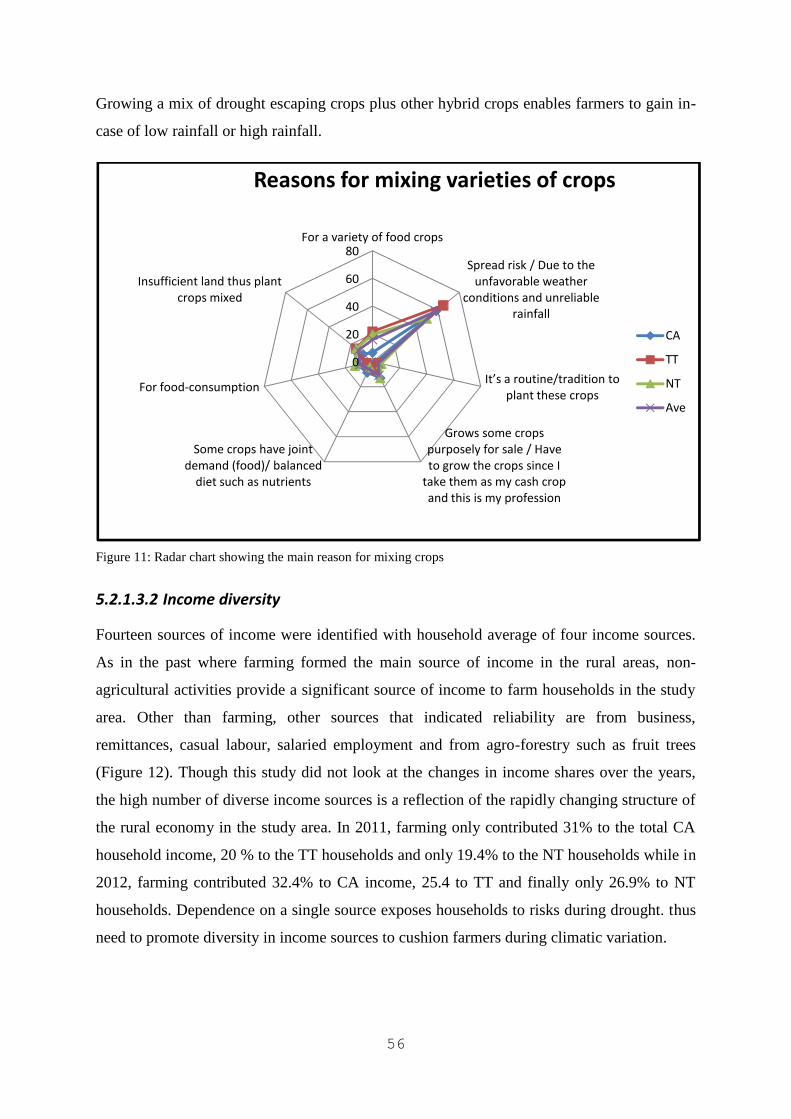
5.2.1.3.2 Income diversity
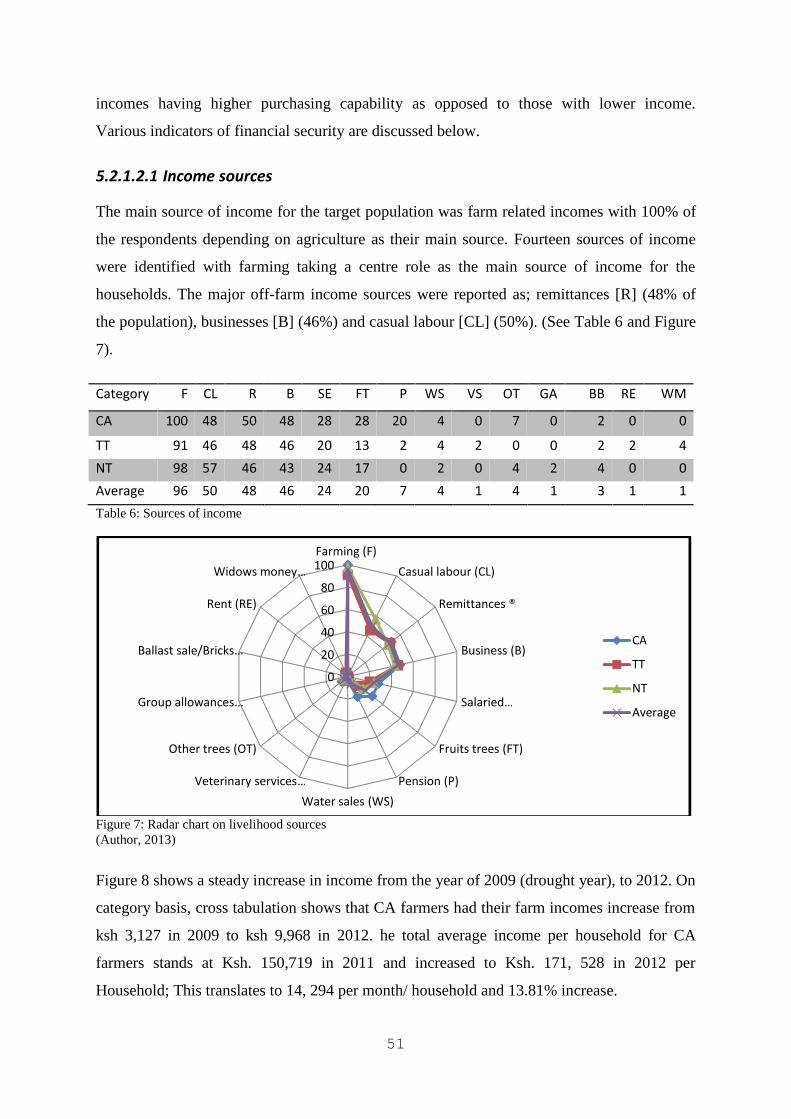
Fourteen sources of income were identified with household average of four income sources.
As in the past where farming formed the main source of income in the rural areas, non-
agricultural activities provide a significant source of income to farm households in the study
area. Other than farming, other sources that indicated reliability are from business,
remittances, casual labour, salaried employment and from agro-forestry such as fruit trees
(Figure 12). Though this study did not look at the changes in income shares over the years,
the high number of diverse income sources is a reflection of the rapidly changing structure of
the rural economy in the study area. In 2011, farming only contributed 31% to the total CA
household income, 20 % to the TT households and only 19.4% to the NT households while in
2012, farming contributed 32.4% to CA income, 25.4 to TT and finally only 26.9% to NT
households. Dependence on a single source exposes households to risks during drought. thus
need to promote diversity in income sources to cushion farmers during climatic variation.
0
20
40
60
80For a variety of food crops
Spread risk / Due to theunfavorable weather
conditions and unreliablerainfall
It’s a routine/tradition toplant these crops
Grows some cropspurposely for sale / Haveto grow the crops since I
take them as my cash cropand this is my profession
Some crops have jointdemand (food)/ balanced
diet such as nutrients
For food-consumption
Insufficient land thus plantcrops mixed
Reasons for mixing varieties of crops
CA
TT
NT
Ave
57
Figure 12: Main income sources
5.2.1.4 Entitlement
These are sets of alternative commodity bundles that a person can command in a society
using the totality of rights and opportunities that he or she faces (sen, 1984: 497).
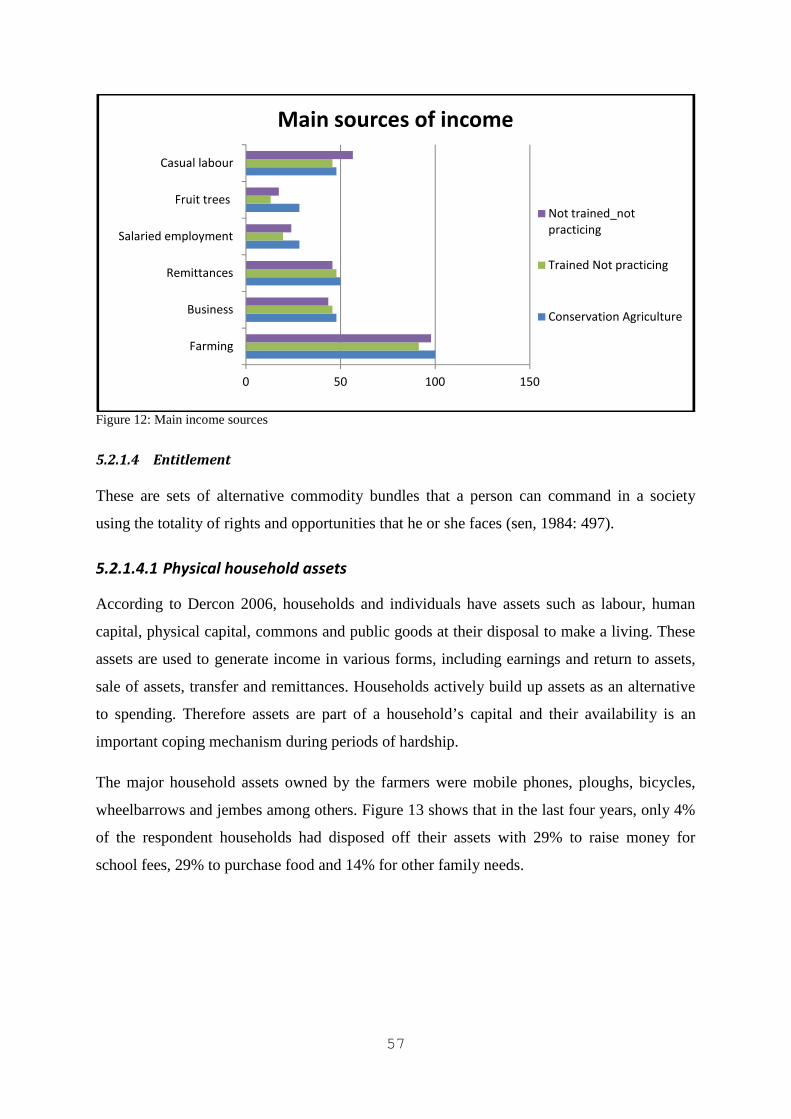
5.2.1.4.1 Physical household assets
According to Dercon 2006, households and individuals have assets such as labour, human
capital, physical capital, commons and public goods at their disposal to make a living. These
assets are used to generate income in various forms, including earnings and return to assets,
sale of assets, transfer and remittances. Households actively build up assets as an alternative
to spending. Therefore assets are part of a household’s capital and their availability is an
important coping mechanism during periods of hardship.
The major household assets owned by the farmers were mobile phones, ploughs, bicycles,
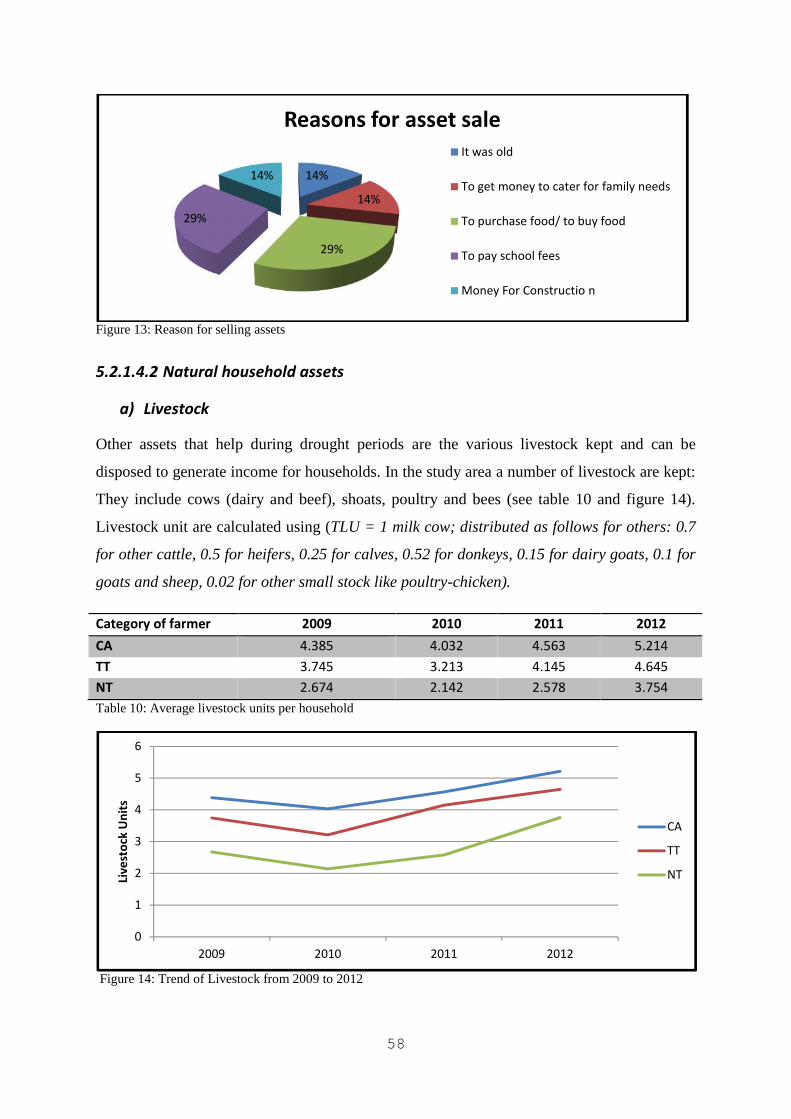
wheelbarrows and jembes among others. Figure 13 shows that in the last four years, only 4%
of the respondent households had disposed off their assets with 29% to raise money for
school fees, 29% to purchase food and 14% for other family needs.
0 50 100 150
Farming
Business
Remittances
Salaried employment
Fruit trees
Casual labour
Main sources of income
Not trained_notpracticing
Trained Not practicing
Conservation Agriculture
58
Figure 13: Reason for selling assets
5.2.1.4.2 Natural household assets
a) Livestock
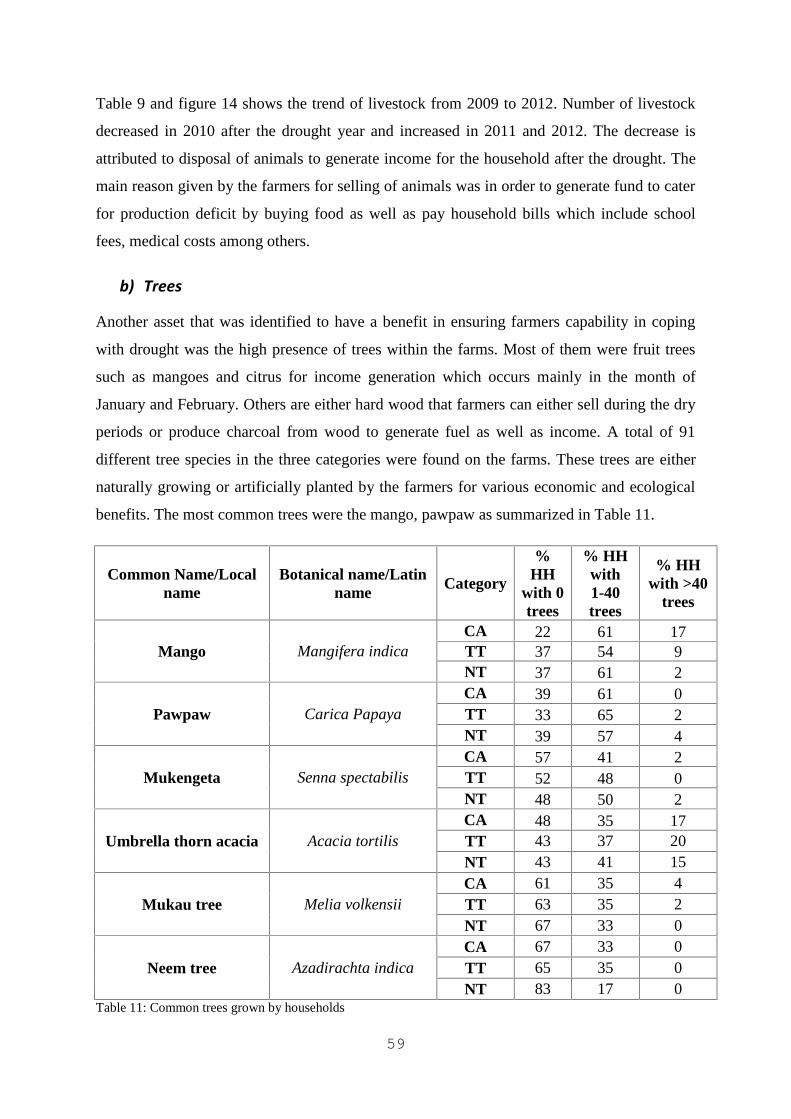
Other assets that help during drought periods are the various livestock kept and can be
disposed to generate income for households. In the study area a number of livestock are kept:
They include cows (dairy and beef), shoats, poultry and bees (see table 10 and figure 14).
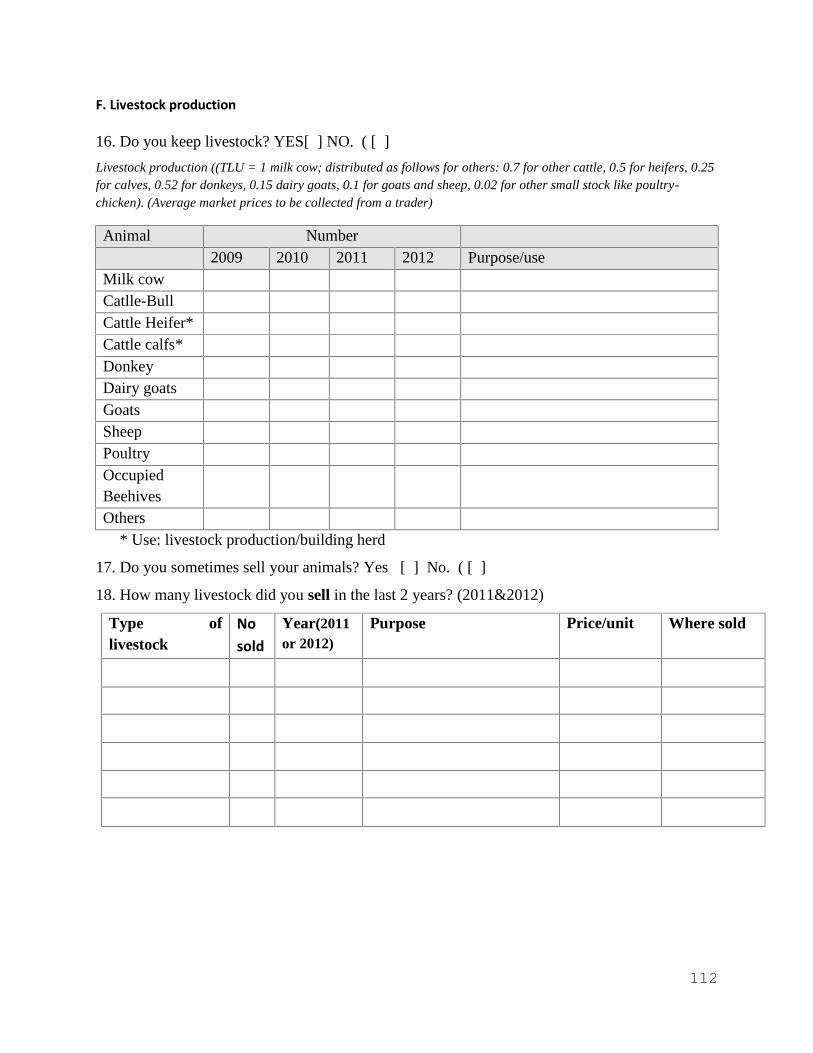
Livestock unit are calculated using (TLU = 1 milk cow; distributed as follows for others: 0.7
for other cattle, 0.5 for heifers, 0.25 for calves, 0.52 for donkeys, 0.15 for dairy goats, 0.1 for
goats and sheep, 0.02 for other small stock like poultry-chicken).
Category of farmer 2009 2010 2011 2012CA 4.385 4.032 4.563 5.214TT 3.745 3.213 4.145 4.645NT 2.674 2.142 2.578 3.754Table 10: Average livestock units per household
Figure 14: Trend of Livestock from 2009 to 2012
29%
14%
Reasons for asset sale
0
1
2
3
4
5
6
2009
Live
stoc
k U
nits
58
Figure 13: Reason for selling assets
5.2.1.4.2 Natural household assets
a) Livestock
Other assets that help during drought periods are the various livestock kept and can be
disposed to generate income for households. In the study area a number of livestock are kept:
They include cows (dairy and beef), shoats, poultry and bees (see table 10 and figure 14).
Livestock unit are calculated using (TLU = 1 milk cow; distributed as follows for others: 0.7
for other cattle, 0.5 for heifers, 0.25 for calves, 0.52 for donkeys, 0.15 for dairy goats, 0.1 for
goats and sheep, 0.02 for other small stock like poultry-chicken).
Category of farmer 2009 2010 2011 2012CA 4.385 4.032 4.563 5.214TT 3.745 3.213 4.145 4.645NT 2.674 2.142 2.578 3.754Table 10: Average livestock units per household
Figure 14: Trend of Livestock from 2009 to 2012
14%
14%
29%
Reasons for asset saleIt was old
To get money to cater for family needs
To purchase food/ to buy food
To pay school fees
Money For Constructio n
2010 2011 2012
58
Figure 13: Reason for selling assets
5.2.1.4.2 Natural household assets
a) Livestock
Other assets that help during drought periods are the various livestock kept and can be
disposed to generate income for households. In the study area a number of livestock are kept:
They include cows (dairy and beef), shoats, poultry and bees (see table 10 and figure 14).
Livestock unit are calculated using (TLU = 1 milk cow; distributed as follows for others: 0.7
for other cattle, 0.5 for heifers, 0.25 for calves, 0.52 for donkeys, 0.15 for dairy goats, 0.1 for
goats and sheep, 0.02 for other small stock like poultry-chicken).
Category of farmer 2009 2010 2011 2012CA 4.385 4.032 4.563 5.214TT 3.745 3.213 4.145 4.645NT 2.674 2.142 2.578 3.754Table 10: Average livestock units per household
Figure 14: Trend of Livestock from 2009 to 2012
To get money to cater for family needs
To purchase food/ to buy food
Money For Constructio n
2012
CA
TT
NT
59
Table 9 and figure 14 shows the trend of livestock from 2009 to 2012. Number of livestock
decreased in 2010 after the drought year and increased in 2011 and 2012. The decrease is
attributed to disposal of animals to generate income for the household after the drought. The
main reason given by the farmers for selling of animals was in order to generate fund to cater
for production deficit by buying food as well as pay household bills which include school
fees, medical costs among others.
b) Trees
Another asset that was identified to have a benefit in ensuring farmers capability in coping
with drought was the high presence of trees within the farms. Most of them were fruit trees
such as mangoes and citrus for income generation which occurs mainly in the month of
January and February. Others are either hard wood that farmers can either sell during the dry
periods or produce charcoal from wood to generate fuel as well as income. A total of 91
different tree species in the three categories were found on the farms. These trees are either
naturally growing or artificially planted by the farmers for various economic and ecological
benefits. The most common trees were the mango, pawpaw as summarized in Table 11.
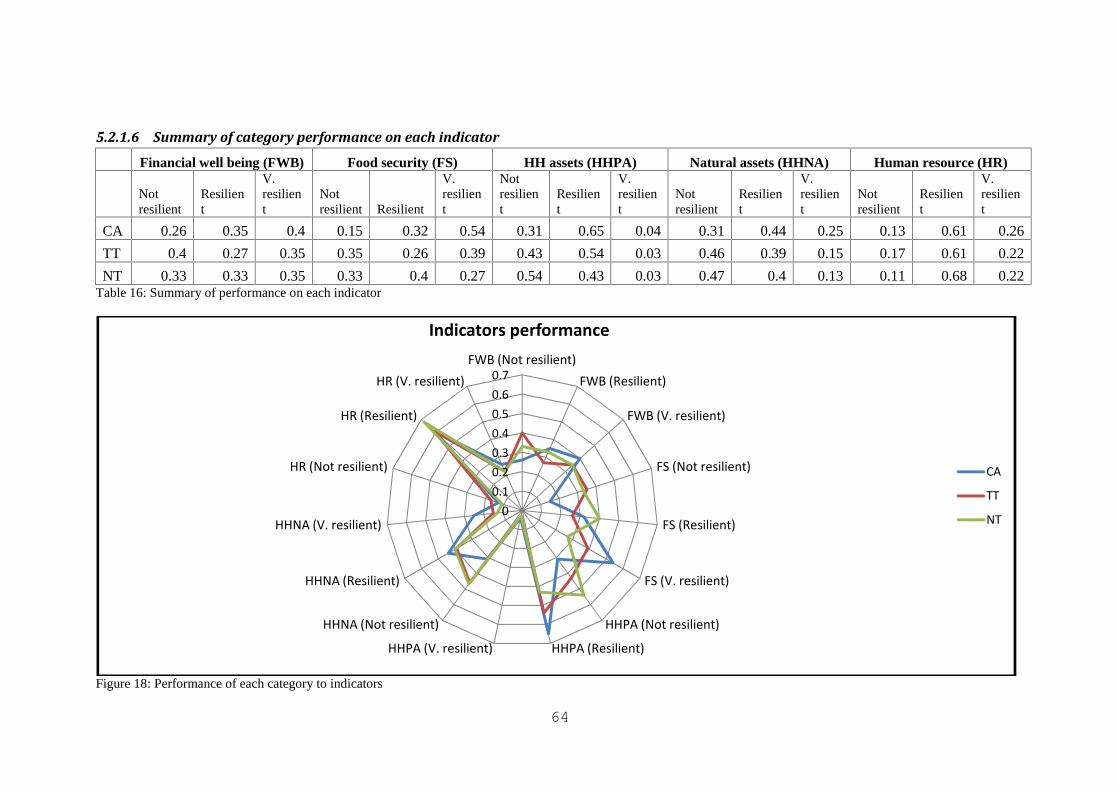
NT 0.33 0.33 0.35 0.33 0.4 0.27 0.54 0.43 0.03 0.47 0.4 0.13 0.11 0.68 0.22Table 16: Summary of performance on each indicator
Figure 18: Performance of each category to indicators
00.10.20.30.40.50.60.7
FWB (Not resilient)FWB (Resilient)
FWB (V. resilient)
FS (Not resilient)
FS (Resilient)
FS (V. resilient)
HHPA (Not resilient)
HHPA (Resilient)HHPA (V. resilient)
HHNA (Not resilient)
HHNA (Resilient)
HHNA (V. resilient)
HR (Not resilient)
HR (Resilient)
HR (V. resilient)
Indicators performance
CA
TT
NT
65
5.2.1.7 Other drivers of resilient agricultural livelihoods
5.2.1.7.1 Natural capital
a) Land and land Use
According to Abson et al., 2013, land-use diversity may have an important role in ensuring
resilient agricultural returns in the face of uncertainty and environmental conditions, and
land-holding size plays a pivotal role in determining the relationships between resilience and
returns at a landscape scale. Creating finer-grained land-use patterns based on pre-existing
local land uses may increase the resilience of individual farms, while maintaining aggregate
yield across landscapes (Ibid.: 14). This study analysed various land uses in the three
categories under study.
Count Mean CA (acre) Mean TT (Acre) Mean NT (Acre)Area under crops 46 4.6 5.5 4.5
Maize 1 1.8 1.4Cow peas 1.3 1.2 1
Pigeon peas 0.6 0.9 0.9Green gram 1 1.1 0.7
Others 0.7 0.5 0.5Area under grazing 46 3.2 4.8 3.5Area under forestry 46 0.2 0.2 0.1
Area under grass fodder 46 0.4 0.2 0.1Area under home compound 46 0.3 0.2 0.2
Table 17: Land uses at household level
The overall average household farm size was 9.3 acres of land with CA farmers having 8.7
acres, TT with 10.9 acres while NT farmers had 8.4 acres. From Table 18, 39% of the CA
farmers acquired their farm through inheritance but is good to note that 44% have acquired
through their own effort by purchasing land. With TT and NT farmers’ inheritance and
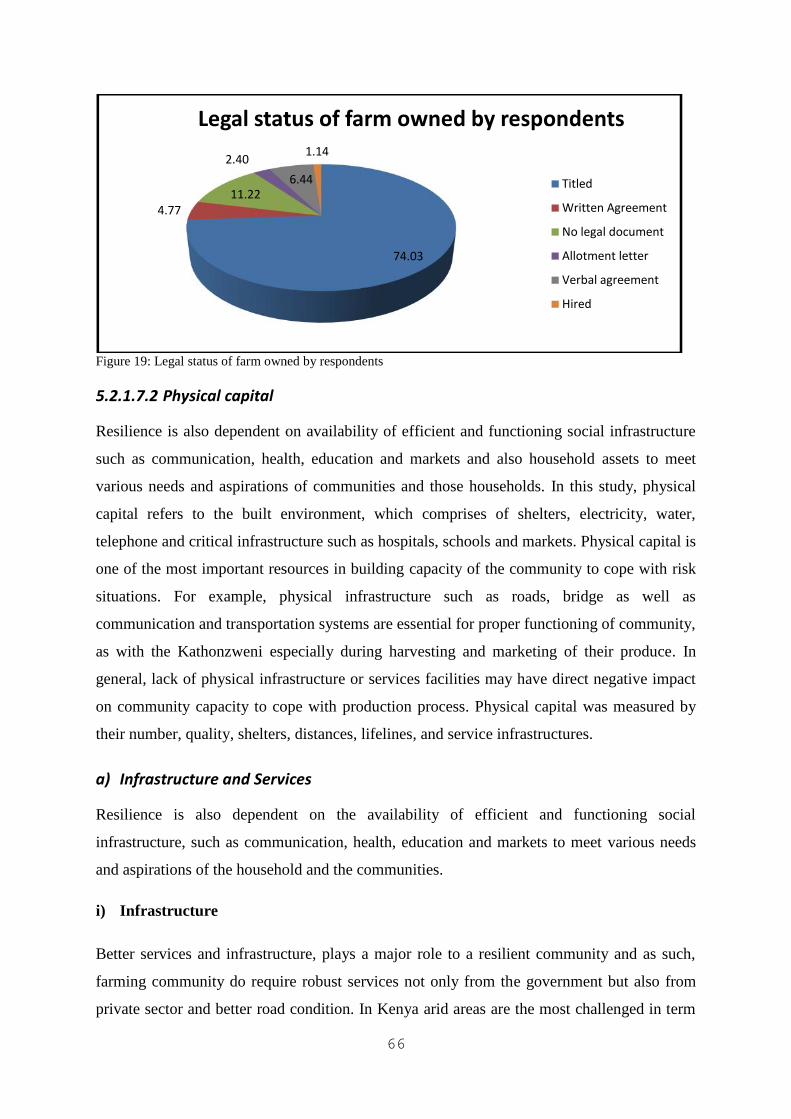
purchase of land increases and decreases respectively. On tenure system, 74% (Figure 19) of
the respondents had titled farms meaning that the area enjoys secure land tenure and can
utilize their farm to obtain financial assistance from financial institutions.
Inherited Purchased Self allocation Hired/rented Gift (by GOK) Gift (relative)
CA 39 44 6 9 2 0
TT 41 42 8 3 3 2
NT 56 22 13 9 0 0
Table 18: Land acquisition method
66
Figure 19: Legal status of farm owned by respondents
5.2.1.7.2 Physical capital
Resilience is also dependent on availability of efficient and functioning social infrastructure
such as communication, health, education and markets and also household assets to meet
various needs and aspirations of communities and those households. In this study, physical
capital refers to the built environment, which comprises of shelters, electricity, water,
telephone and critical infrastructure such as hospitals, schools and markets. Physical capital is
one of the most important resources in building capacity of the community to cope with risk
situations. For example, physical infrastructure such as roads, bridge as well as
communication and transportation systems are essential for proper functioning of community,
as with the Kathonzweni especially during harvesting and marketing of their produce. In
general, lack of physical infrastructure or services facilities may have direct negative impact
on community capacity to cope with production process. Physical capital was measured by
their number, quality, shelters, distances, lifelines, and service infrastructures.
a) Infrastructure and Services
Resilience is also dependent on the availability of efficient and functioning social
infrastructure, such as communication, health, education and markets to meet various needs
and aspirations of the household and the communities.
i) Infrastructure
Better services and infrastructure, plays a major role to a resilient community and as such,
farming community do require robust services not only from the government but also from
private sector and better road condition. In Kenya arid areas are the most challenged in term
4.7711.22
2.406.44
Legal status of farm owned by respondents
66
Figure 19: Legal status of farm owned by respondents
5.2.1.7.2 Physical capital
Resilience is also dependent on availability of efficient and functioning social infrastructure
such as communication, health, education and markets and also household assets to meet
various needs and aspirations of communities and those households. In this study, physical
capital refers to the built environment, which comprises of shelters, electricity, water,
telephone and critical infrastructure such as hospitals, schools and markets. Physical capital is
one of the most important resources in building capacity of the community to cope with risk
situations. For example, physical infrastructure such as roads, bridge as well as
communication and transportation systems are essential for proper functioning of community,
as with the Kathonzweni especially during harvesting and marketing of their produce. In
general, lack of physical infrastructure or services facilities may have direct negative impact
on community capacity to cope with production process. Physical capital was measured by
their number, quality, shelters, distances, lifelines, and service infrastructures.
a) Infrastructure and Services
Resilience is also dependent on the availability of efficient and functioning social
infrastructure, such as communication, health, education and markets to meet various needs
and aspirations of the household and the communities.
i) Infrastructure
Better services and infrastructure, plays a major role to a resilient community and as such,
farming community do require robust services not only from the government but also from
private sector and better road condition. In Kenya arid areas are the most challenged in term
74.03
6.44
1.14
Legal status of farm owned by respondents
Titled
Written Agreement
No legal document
Allotment letter
Verbal agreement
Hired
66
Figure 19: Legal status of farm owned by respondents
5.2.1.7.2 Physical capital
Resilience is also dependent on availability of efficient and functioning social infrastructure
such as communication, health, education and markets and also household assets to meet
various needs and aspirations of communities and those households. In this study, physical
capital refers to the built environment, which comprises of shelters, electricity, water,
telephone and critical infrastructure such as hospitals, schools and markets. Physical capital is
one of the most important resources in building capacity of the community to cope with risk
situations. For example, physical infrastructure such as roads, bridge as well as
communication and transportation systems are essential for proper functioning of community,
as with the Kathonzweni especially during harvesting and marketing of their produce. In
general, lack of physical infrastructure or services facilities may have direct negative impact
on community capacity to cope with production process. Physical capital was measured by
their number, quality, shelters, distances, lifelines, and service infrastructures.
a) Infrastructure and Services
Resilience is also dependent on the availability of efficient and functioning social
infrastructure, such as communication, health, education and markets to meet various needs
and aspirations of the household and the communities.
i) Infrastructure
Better services and infrastructure, plays a major role to a resilient community and as such,
farming community do require robust services not only from the government but also from
private sector and better road condition. In Kenya arid areas are the most challenged in term
Legal status of farm owned by respondents
Titled
Written Agreement
No legal document
Allotment letter
Verbal agreement
Hired
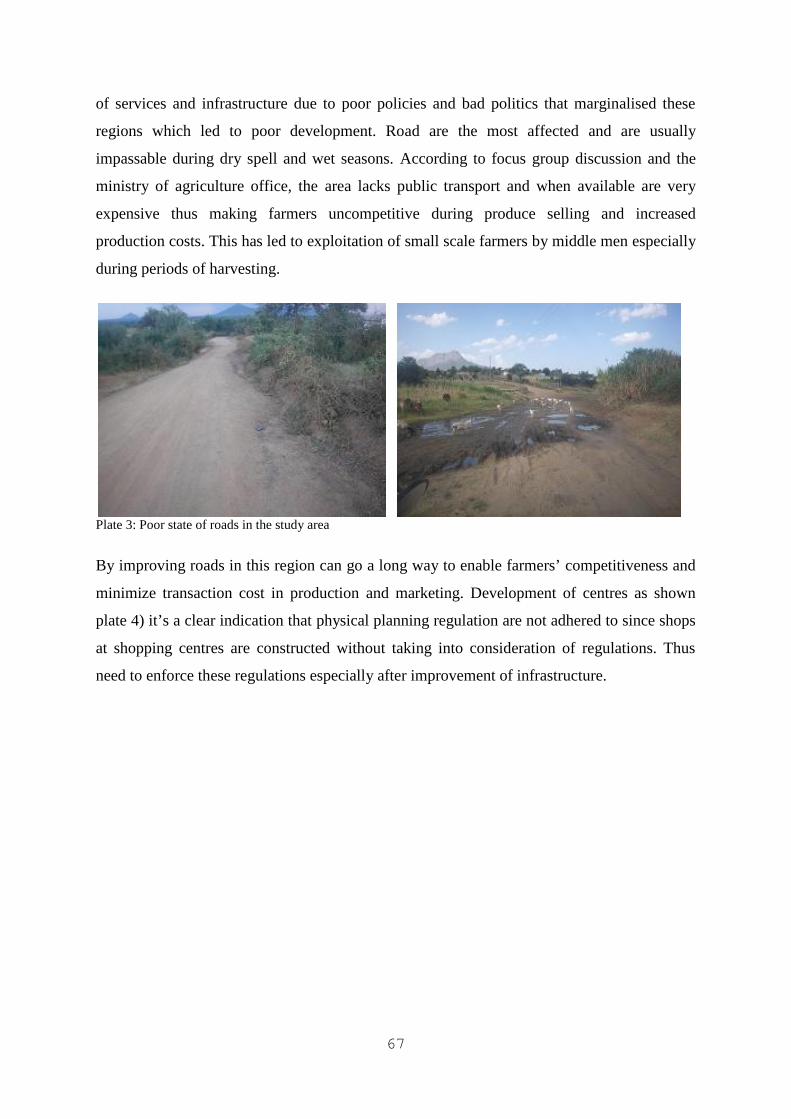
67
of services and infrastructure due to poor policies and bad politics that marginalised these
regions which led to poor development. Road are the most affected and are usually
impassable during dry spell and wet seasons. According to focus group discussion and the
ministry of agriculture office, the area lacks public transport and when available are very
expensive thus making farmers uncompetitive during produce selling and increased
production costs. This has led to exploitation of small scale farmers by middle men especially
during periods of harvesting.
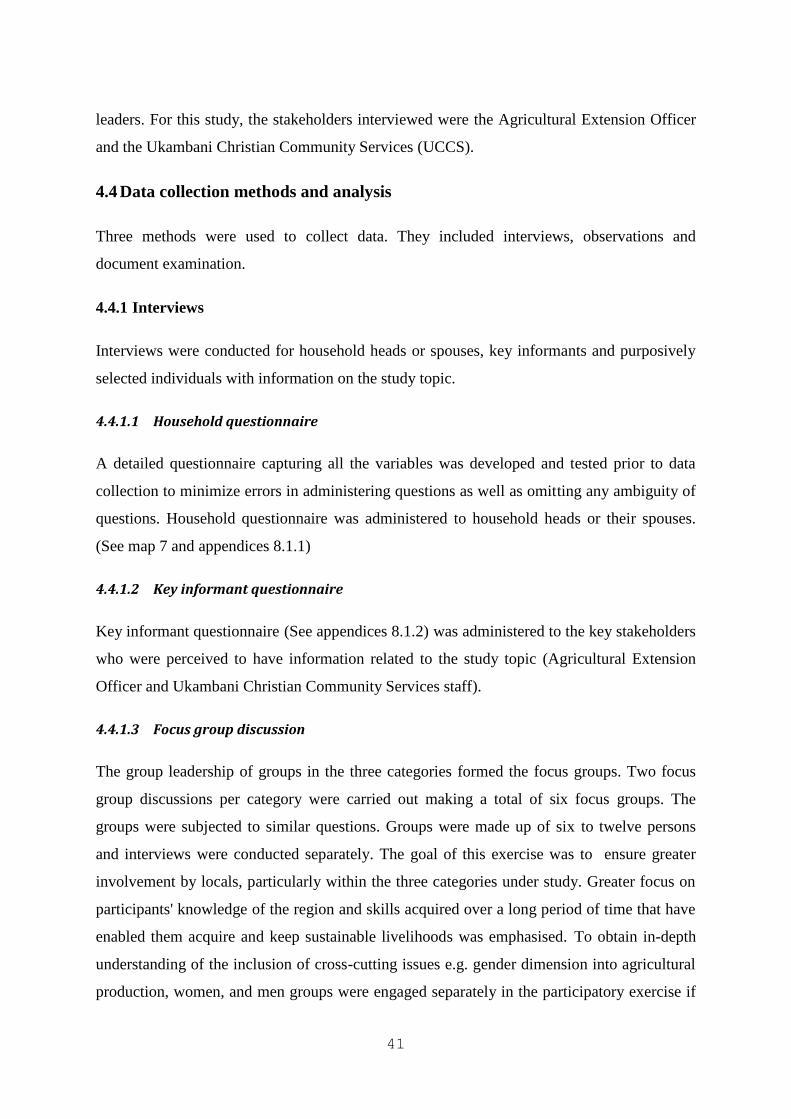
Plate 3: Poor state of roads in the study area
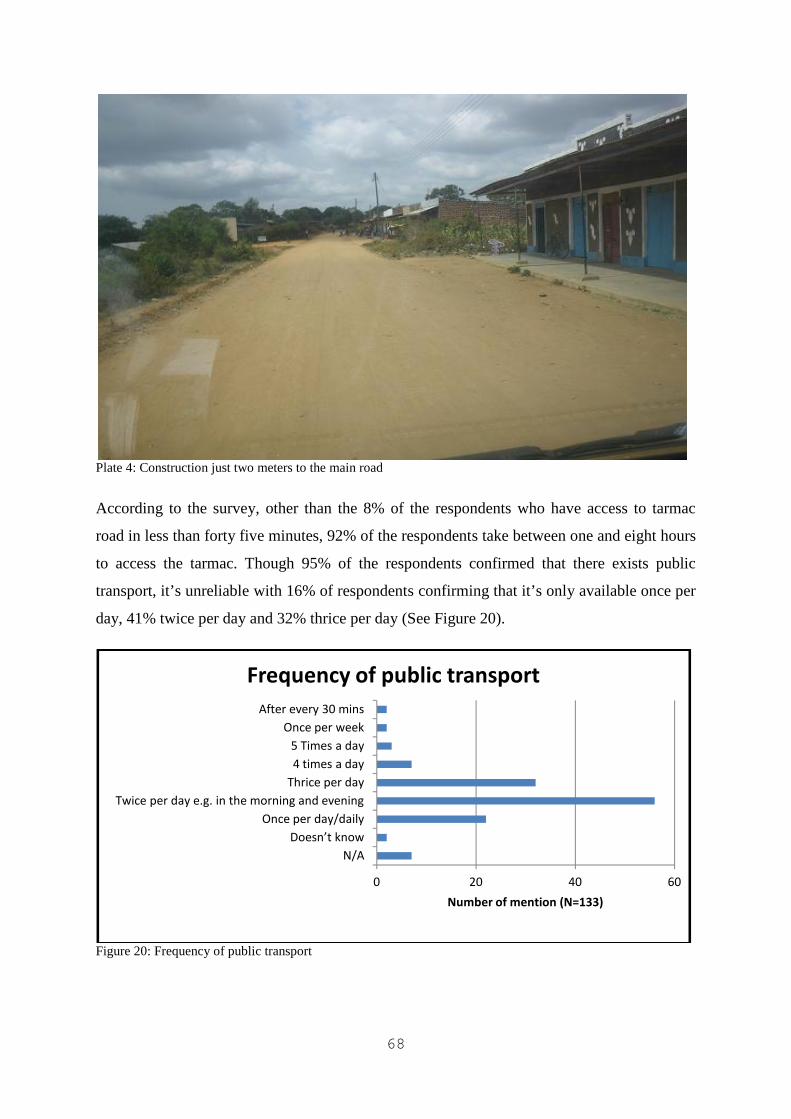
By improving roads in this region can go a long way to enable farmers’ competitiveness and
minimize transaction cost in production and marketing. Development of centres as shown
plate 4) it’s a clear indication that physical planning regulation are not adhered to since shops
at shopping centres are constructed without taking into consideration of regulations. Thus
need to enforce these regulations especially after improvement of infrastructure.
68
Plate 4: Construction just two meters to the main road
According to the survey, other than the 8% of the respondents who have access to tarmac
road in less than forty five minutes, 92% of the respondents take between one and eight hours
to access the tarmac. Though 95% of the respondents confirmed that there exists public
transport, it’s unreliable with 16% of respondents confirming that it’s only available once per
day, 41% twice per day and 32% thrice per day (See Figure 20).
Figure 20: Frequency of public transport
0 20 40 60
N/ADoesn’t know
Once per day/dailyTwice per day e.g. in the morning and evening
Thrice per day4 times a day5 Times a day
Once per weekAfter every 30 mins
Number of mention (N=133)
Frequency of public transport
69
Availability of market also is a major challenge affecting farmers in their production process.
In the study area, only 24% of farmers with an access to the formal market within 3 kms from
their farms while whereas 76% of the households have to travel a distance ranging from 3
kms away. Doubled by the poor roads and lack of transport, farmers continue to suffer
especially during produce marketing whey are exploited by brokers.
Figure 21: Distance to the nearest formal market
ii) Services
All respondents under this study had access to primary education with all primary schools
mentioned being public schools. The time taken to various primary schools range from one
minute to one hour but most respondents take less than 30 minutes to school (Figure 22). This
is a clear indication that schools are within the community reach with all primary students
walking to school. Secondary schools are further with over 40% taking more than thirty
minutes to reach school. Up to 85% of secondary schools are public while only 13% were
owned by private individuals.
Figure 22: Time taken to schools
0 10 20 30 40 50 60 70 80
<3km
≥3km
% farmers
Dist
ance
Distance to the nearest formal market
0 5 10 15 20 25 30 35
>1hr
>20-30min
1-10min
>30min-1hr
>10-20min
Tim
e ta
ken
topr
imar
ysc
hool
Tim
e ta
ken
toSe
cond
ary
scho
ol
Percentage (%) respondents
Time taken to schools
70
5.2.2 Site specific knowledge
Resilience thinking requires an acknowledgement of the fact that systems must learn to live
with uncertainty and that change is inevitable (Berkes 2007). ‘“Expecting the unexpected” is
said to be an oxymoron, but it means having the tools and the codes of conduct to fall back on
when an unexpected event happens’ (ibid.: 288); these tools and codes can spring from
memories held by societies of similar events in the past.
Household knowledge of social ecological system was identified through the farmers
experience from the number of years within Kathonzweni district and also experience gained
from the number of years in agriculture practice. Most of the respondents in the three
categories have a very high knowledge of the region, most having been born within
Kathonzweni District. Figure 23 indicates that over 80% have been residents of the region for
over 20 years with less than 10% having stayed for less than 10 years.
Figure 23: No of years in Kathonzweni
On agricultural practice knowledge, over 60% of the respondents had an experience of over
20 years in agriculture and less than 20% of respondents with less than 20 years of experience
in agriculture practice (See Figure 24).
0102030405060708090
100
ConservationAgriculture
Trained Not practicing Not trained_notpracticing
% count
Category of Farmers
Number of years in Kathonzweni
1-10
11-20
Above 20
71
Figure 24: Experience in agriculture (Years)
Cross tabulation between number of years to the average maize production per household,
shows that the less the years in experience of the Kathonzweni social ecological system the
lower the production/yield (see Figure 25). The same is true with the experience in
agriculture activity. In 2009, the drought year, those with fewer than 10 years of
experience/knowledge of the region o contributed only 16 % to the average maize production
as compared to 42% for those with 11 to 20 and above 20 years experience.
Figure 25: Experience versus maize yield
5.2.3 Self organization, cooperation and networks
Ability of users (in the case of the study farmers) within a system to self organise and
reorganise to sustainably manage resources (Ostrom 2009). For self organization to take
place there should be a certain amount of availability and scarcity in the resource system to
provide incentives for self organization basically for better management. Therefore the ability
of farmers to reorganise themselves is very critical in determining their resilience. Within the
0 20 40 60 80 100
1-10
11-20
Over 20
Farmers in %
Years
Experience in agriculture (Years)Not trained_not practicing
Trained Not practicing
Conservation Agriculture
0% 20% 40% 60% 80% 100%
Production 2009 in Kgs
Production 2010 in Kgs
1_10
11_20
Above 20
72
local set up, creation of governance with multilevel partnerships is fundamental shift from
usual top-down approach to management (ibid.: 291).
5.2.3.1 Institutions collaboration
In the study area, a number of institutions identified by the respondents as having been
operating and providing services to the farming community were;
Ministry of agriculture, livestock and fisheries development providing extension services
to farmers through field days and open days,
KARI has for years promoted certified drought tolerant seed to the community and also
contracting farmers to grow clean seed and selling to them at a predetermined price.
World Vision has been providing relief food to the farmers as well as promotes dry land
farming technology in the region.
CETRAD was identified to have promoted conservation agriculture in the region.
Red cross also provides relief food
K-rep (FSA) and equity bank providing credit to farmers. and
BIDII group promoting dry land farming.
To understand the main activities carried out by organization in the region, UCINET software
was used to analyse institution activity network. Figure 26 below showing institution activity
networks shows that 11 institutions have been involved in promotion of conservation
agriculture through training of farmers, 9 institutions providing farm inputs, 9 institutions
providing relief food, and 5 institution providing food for work among other activities.
73
Figure 26: Institution and their activity network
According to focus group discussions, the following were identified as the man institutions
working and collaborating with the community towards achievements of food security in the
study area:
73
Figure 26: Institution and their activity network
According to focus group discussions, the following were identified as the man institutions
working and collaborating with the community towards achievements of food security in the
study area:
73
Figure 26: Institution and their activity network
According to focus group discussions, the following were identified as the man institutions
working and collaborating with the community towards achievements of food security in the
study area:
74
Organization ActivityWorld Vision Trains farmers about the suitable farming techniques
for the region Promotes terracing of farms via a food for work
programme Promotes poultry keeping by offering training on the
sameINADES-Kenya Promotes tree planting
Advocates for terracing of farms in the region
DORCUS Promotes poultry and goat keeping. Has mobilizedfarmers into groups where they learn about the twopractices. Additionally, they help farmers to mobilizefunds for purchasing goats/poultry and assist wherenecessary.
They have a food for work programme that seeks topromote terracing of farms
CETRAD Training farmers on conservation agriculture Provides certified seed to the farmers
Catholic Relief Service They have a food for work programme-they issuevouchers to farmers involved in digging terraces
They assist farmers to get quality seeds. This is done intwo ways namely subsidizing the price of seeds orgiving farmers money for purchasing crop seeds.
Utooni Development Group Gabion construction Tree planting
Gives relief foodGovernment Providing farm inputs such as seeds and fertilizer
Provides relief food Training farmers on better farming techniques
Vaccinating livestock Water harvesting e.g. through construction of dams
BIDII(Benevolent Instituteof Development Initiative)
Community capacity building
U.C.C.S (UkambaniChristian CommunityServices)
Construction of weirs
Construction of dams
Table 19: Instituions interacting with farmers and activities
5.2.3.2 Cooperation and networks
Other than organization, farmers are members of groups which range from farming groups to
financial groups. In Kenya, self help groups have a long tradition (Wacker 1996:135). All the
75
households interviewed at least belong to an average of two self help groups which vary in
activities and membership. The perceived advantages and benefits to household members in
self help groups are indicated in Figure 27. As in group activities where savings and lending
is very key, table banking and allowing members to receive loans from group is perceived to
be the most important to the members. This is a group product that enables members to
borrow any time they are in need of cash and comes in handy to help farmers during drought
situation in buying food. This is followed by the groups playing a major role to provide
information to farmers on various emerging issues on agriculture and other topics, thus
enabling farmers to make informed decisions in their production activities. Other than these
two benefits, other benefits in order of importance are: common farming tools and labour
assistance; generating incomes through selling of products; stocking livestock; for individual
households; buying and sharing food for members during drought ‘relief food from group;
social assistance where members contribute for occasions such as burials and dowry
payment; co-existence through social cohesion; marketing of produce; and buying inputs as
groups.
Figure 27: Perceived benefit in being in a group
Other than groups, farmers derive assistant through other cooperation. Figure 28 below shows
form of assistant that farmers derive from other farmers especially the neighbours, friend
0 20 40 60 80 100 120
Pesronal savings and Loans from…
Knowledge and information
Using common tools and labour…
Generating incomes
Buying livestock as agroup
Relief food
Social assistant (burrials/dowrly…
Cohesion,Unity,teamwork and…
Marketing produce as a group
Acquire seeds for planting as a group
Number of mentions
Adva
ntag
es/b
enef
its fr
om g
roup
Ave
NT
TT
CA
76
within the same village. Kind of assistant includes receiving farm inputs, various advices,
free labour during land preparation and finance among others.
Figure 28: Cooperation and network
5.3 Approaches and practices that promote resilient livelihooddevelopment
5.3.1 Practice
From the perspective of the farmers, 21% of the respondents identified oxen ripping as a
practice and technique that promotes resilient livelihood. Terracing, which is a practice that
has been used for decades by the residents, was identified by 10.8% of the respondents to
build resilient livelihood. Other techniques mentioned in order of importance are water
harvesting, hand ripping, hand sub soiling, growing of drought tolerant crops and cover
crops. All techniques mentioned are conservation techniques in farming and they have been
practised and tested by farmers on their performance.
77
Figure 29: Most preferred technique by respondents
Interview with the key informant and focus groups, confirmed that oxen ripping has proved
to cushion farmers’ farms from adverse effect of weather and they have seen CA farmers
harvest during the 2009 drought where non CA farmers did not harvest. Other than ripping,
they also ranked terracing, water harvesting, drought tolerant crops and early timing in
descending order as the main techniques that have proven to promote resilient livelihood in
the past in the region. The MoA, gave an example of the high number of institution in the
entire lower eastern that are promoting these technology.
Further, focus groups discussion identified a number of a collective action that can assist
farmers to achieve sustainable livelihood. These are: i) social assistance where farmers can
organise themselves to assist each other to implement conservation measures. Studies carried
out have found that reciprocity in societies in sub-Saharan Africa has been declining and,
although it is still part and parcel of social norms, it is not strong as it was about two decades
ago (Campell et al. 2002: 34). The six focus groups held seemed to support Campell findings
where, they had a feeling that the traditional history in the region where farmers have assisted
each other is no longer there hence felt it’s an important capital that can build resilient
communities thus needed to be promoted and adopted in-order to enable households to be
food secure and in the long run maintain livelihoods that are resilient to drought; carrying out
conservation measures of planting trees to ensure social ecological systems are conserved; ii)
0
5
10
15
20
25Hand subsoiling
Handripping
Oxen ploughing
Oxen Ripping
Terracing
Water harvesting
Crop rotation
Growing DRCs
Oxen ploughingOxen Ripping
Terracing
Use ofHerbicide
Early Planting
Growing DRCs
Hand subsoiling
Intercropping
Terracing
Use of Cover Crops
Series1
Rank
1
Rank 2
Rank
3
78
farmers to embrace rain water harvesting and storage to supplement rain-fed agriculture to
irrigated during drought seasons; iii) formation of common farmers marketing and produce
source to minimise costs and remove brokers in the sector at the same time ensuring higher
income from the profession; and iv) policies from national government and county
government that encourage adoption of technologies such as CA and agro-forestry. An
example is the agriculture act cap 318 on farm forestry rule 2008, stipulate 10% forest cover
on the farms while sectional paper no 1 of 2007 on forest policy emphasise on the need to
support farmers with sound management and utilization principle, incentives, information,
better germ plasm and marketing strategies in forestry and improvement of farmers access to
information. From the household survey, no one category of farmer (CA, TT, and NT) that
has achieved the 10% tree cover on their farm. CA has only achieved a 2.3% cover, TT only
1.8% and NT only 1.1% tree cover (See Figure 11).
5.3.2 Approaches
From CETRAD Conservation Agriculture projects report (2008, 2007, 2009, and 2010), a
number of approaches were employed during the implementation of the project. These are:
first on the project inception where in the year 2002 a study by Chinwe (2002) found that
famines are often linked to drought in semi arid areas of sub-Saharan Africa where not only
the pastoralist, but also agro-pastoralists are increasingly affected. She suggested that
approaches to deal with drought and famine have to target factors causing household food
insecurity during non-drought periods. Therefore intervention by CETRAD by introducing
CA in Makueni was based on this field survey that proposed an intervention of dry-land
farming techniques in the region and other ASALs. First approach was to test the technology
in Laikipia before out scaling to Makueni; secondly was use of participatory approach by
using existing self help groups. This was by carrying out inventory of groups rather than
formation of new groups as an entry point to reach out to farmers and ensure farmers
participation in the implementation of the project and mobilization of other farmers; thirdly
was the collaboration with other key stakeholders in the region that were promoting
conservation approaches and also other activities to ensure interventions that are holistic in
nature to ensure farmers receive a full package as well avoid duplication of activities;
fourthly was carrying out farmers’ led demonstration farms and model farm to act as learning
centres and to stir social leaning among farmers; fifth approach was to capacity build farmers
through training as trainers to ensure continuity of training activities after
79
project exit; and finally involving the line ministry in the implementation to ensure continuity
of the project (project reports, 2008,2009, 2010 and 2011).
According to the Ministry of Agriculture Kathonzweni, they have a number of approaches
that they employ to reach out to farmers and to ensure a resilient livelihood within the region.
These are;
i. Trainings through farmer groups, field days, individual farm visits and holding a farmers
information desk day at the head quarters to reach out farmers during market days.
ii. Inputs: for the last 10 years, the ministry has provided free certified seed to farmers at the
beginning of every season in order to improve the district food security situation as well
as ensure their livelihoods are resilient.
iii. Promotion of drought escaping crops- [Traditional High Value Crops (THVC)]
(Cowpeas, Pigeon peas, Green grams and Maize). This is done to increase chances of
harvesting even during the dry seasons. Through this project, farmers are contracted by
KARI to deliver produce. They also promote root crops such as cassava.
iv.Market Information: Ministry of agriculture collects market information every week at
various markets. This information is provided to the farmers any time they require it.
Enables farmers to make informed decision in marketing of their produce. This has led
to reduced exploitation by brokers.
v. Technologies technical support through training and demonstrations. This is done through
collaboration with other partners such as CETRAD: Example; Conservation agriculture.
vi.Promoting Agro forestry: this is to ensure that vision 2030, and Agriculture act 2008, is
implemented in full. According to Campbell et al., government approach of
technological, structural, social, and economic development to bring about adoptive
measure in compacting climate change is not enough thus need for a system approach of
promoting biodiversity and climate change since strategies impact on biodiversity and
biodiversity also impact on the strategies set. Therefore, the policy brings about the
holistic way by ensuring the environment and forest resource are enhanced and
SNSF AMBIZIONE PROJECT PZ00P1_137068: RESILIENT AGRICULTURE-BASED LIVELIHOODS AND RESILIENTAGRICULTURAL LANDSCAPES? ADAPTATION TO CLIMATE CHANGE IN AFRICAN AGRICULTURE: CENTRE FORTRAINING AND INTEGRATED RESEARCH IN ARID AND SEMI-ARID LANDS DEVELOPMENT (CETRAD), NANYUKI,KENYA / UNIVE.OF BERN, CDE/INSTITUTUTE OF GEOGRAPHY, SWITZERLAND / BUR 604: MA (PLANNING) 2013,UNIVERSITY OF NAIROBI, DEPARTMENT OF URBAN AND REGIONAL PLANNING.
Disclaimer: The information collected during this survey is purely for academic
purposes and will not be divulged to any other person in whatever circumstance.
A: SITE CHARACTERISTICS
Questionnaire identification Enumerator names:
District: Tel. No:
Division: Interview date:
Location: Name of farmer group:
Sub-location Category:
Conservation agriculture farmer: [ ]
Conventional agriculture farmer: [ ]
Village: GPS Coordinate code:
GPS Coord:
Respondent name: Respondent Tel:
Time started: Time ended:
105
B. RESPONDENT AND HOUSHOLD CHARACTERISTICS
2. Characteristics for members of the householdNo Name Relation to
HH-headAge(years)
Gender(M/F)
Educationlevel attained
How oftenon farm?
Main economicactivity (work)?
What otherwork?
1 Household head HH
2 Respondent
3
4
5
6
7
8
9
10
11
12
13
3. Type of the household headship (male/female/children) Male headed [ ] b) Female managed [ ] c) Female headed [ ]d) Children headed [ ]
106
C. Financial/Economic capital (Incomes)
4. What are the sources of income from the following activities? Estimate amount for yourhousehold. (Household on-farm livelihoods diversity)
S/No Source Estimated amount per year (Kshs)2011 2012
A Casual labour
B Business (specify)
C Remittances
D Salaried employment
E Pension
F Fruit trees (pls. specify)
G Other trees
H Water sale
I Others; specify
Comment:Off-farm income: From the above we can determine how significant off-farmincome is for the household. (E.g. for "less than 10% of all income," "10-50%", ">50%")"
5. Household monthly expenditure Kshs.
a. Item Estimated Amount in Kshsb. Foodc. Clothingd. Healthe. Educationf. Fuelg. Renth. Transporti. Waterj. Entertainmentk. Donations to relativesl. Others (Specify)m.
6. a) Remittances: Does the family receive support from other members living outside thehomestead? Yes [ ]No [ ]
b) How often do you receive the money from family members?Amount Sending person1 Amount Sending person2
WeeklyMonthlyOccasionally (not often)Quarterly
107
D. Natural capital7. a) Household farms/plotsPlot no. Size
(acres)Use in 2012 (a) Distance/time
to the farm (c)How acquired?(d)
Tenuresituation (e)
Legalstatus(f)
Crops (in orderof importance)
Variety CA/TT
1(homestead) a.b.c.d.
2 a.b.c.
3 a.
b.
c.
4 a.
b.
a) Use (past year)1) Food crop2) Cash crop3) Grazing4) Fallow5) Not used6) Given out7) Other (specify)
d) How acquired?1) Inherited2) Hired/rented3) Purchased4) Gift6) Other (specify)
e) Land tenure1) Trust land2) Government land3) Rented land4) Family land5) Settlement scheme6) Publics7) Freehold
f) Legal status ofthis land
1. Titled
2. Allotment letter
3. Self-allocation
4. Verbal agreement
5. Written agreement
6. No legal document
108
8. a) Amount of crops harvested and sales (2009 – 2010)
Crop produced 2009 2010 Avg Price 2009Mar-Jun Oct-Jan Mar-Jun Oct-Jan
9. Where do you sell your produce? a) Farm gate [ ] b) market centre [ ], c) formal marketinggroups [ ], d) Others (specify
110
10. Crop produce (food) purchased (Quantity in Kg/bags 90kg/debes)
Crop purchased 2009 2010 2011 2012
AvgbuyingPrice2009
Avgbuyingprice
2010-2012
1 Maize: Amount bought
Month of purchase
2 Cow peas: Amount bought
Months of purchase
3
4
5
11. Where do you buy/purchase produce?a.................................................................................................................................................b. ...............................................................................................................................................c. ...............................................................................................................................................
111
12. Why do you grow these different types (mix) of crops?………….................................................…………………………………………………………………………………………………...............................................…………………………………………………………………………………………………...............................................
13. How much do you usually use per month of the crops you produce? ......................................
Crops Amount used (Kg)
E. Physical capital-household
14. Any other functional assets that the household has?
Indicate whether the household possesses the following items and how many.
Car Television Plough Bank savings
Motorcycle Radio Modern furniture Ripper/sub-soiler
Bicycle Cart Wheelbarrow Mobile phone
Others(specify)
15. Have you ever had to sell household assets? Yes [ ] No [ ]
If yes
Years of sale Item sold Reasons for selling
112
F. Livestock production
16. Do you keep livestock? YES[ ] NO. ( [ ]
Livestock production ((TLU = 1 milk cow; distributed as follows for others: 0.7 for other cattle, 0.5 for heifers, 0.25for calves, 0.52 for donkeys, 0.15 dairy goats, 0.1 for goats and sheep, 0.02 for other small stock like poultry-chicken). (Average market prices to be collected from a trader)
24. What other ways does your livestock production support your crop production?…………………………………………………………………………………………………..…….……………………….……………………………………………………………………………………………………………………………………………………………………….
115
G. Physical capital – services and infrastructure
25. Nearest community facilities and services
Facility Name/location
Mode ofTransport
Timetaken tofacility
Provider (Public,Private, Others)
a School;Pry
b School; Sec
c Health facility
d Social halle Crop ext.
servicesf Livestock ext.
servicesg Village centreh Recreationi Worshipj Public librariesk Slaughter
housesl Input marketm Food / Produce
marketn Livestock
marketo Other service
26. Indicate distance to the nearest tarmac road on foot. .................................................................
27. Indicate distance to the nearest murram road on foot. ................................................................
28. Is there public transport along these roads? ................................................................................
29. How often do you have Matatu?..................................................................................................
30. Indicate distance to the nearest market centre on foot (indicate time) ................................
31. List the types of services at the market centre (not shopping centre)
32. How many years have you continuously lived in this area/district? ....................................
33. How long have you worked in agriculture?Years:……………………Months:………………………
I. Crop Production
Farming and cropping characteristics
34. a) Area under (i) Crops; ……………………….. acres, (ii) Grazing: …………………. acres
(iii) Farm Forestry/woodlot size:…………..…..acres/No of trees …………….
(iv) Grass / fodder: ………………. acres
(v) Home compound: …………… acres, vi) Others: …………………… acres
b) Trees grown
Nr. Natural Nr. planted Name (list) Indigenous Exotic
117
35. Which of the following technologies/ approaches do you apply?
TechniquesYes/No
Gender(M/F)
No ofyearspracticed
From whomdid youlearn thetechnique?
Rank thebest 5techniques
Reasons for adoption
Minimum soil disturbance
a. Hand ripping (use of Jembe)
b. Oxen ripping
c. Hand Sub soiling (Use of Mattock)
d. Zero tillage (use of planting holes)
e. Pre emergence herbicide application
f. Post emergence herbicide application
Soil cover (mulch and cover crop)? Yes ( ) No ( )
g. Mulching
h. Cover crops/green manure
Crop rotation?Yes ( ) No ( ). If yes explain
Other CA related techniques
i. Fallowing
j. Growing drought tolerant crops
k. Early planting
l. Terracing
m. Water harvesting
n. Zai pits
o. Intercropping (name crops)
118
TechniquesYes/No
Gender(M/F)
No ofyearspracticed
From whomdid youlearn thetechnique?
Rank thebest 5techniques
Reasons for adoption
p. Agro-forestry
q. Relay cropping (green manure)
r. Alley cropping
s. Cut off drains
Conventional farming (TT)
t. Tractor ploughing
u. Hand ploughing
v. Oxen ploughing
w. Hand weeding
x. Oxen weeding
y. Others: specify
36. If herbicides are used, name them
Name of herbicides Seller Frequency of use per season
119
37. What are the advantages and disadvantages experienced in the implementation of these {CAor TT (traditional tillage)} techniques?Conservation tillage (CA) Traditional Tillage (TT)
Advantages Advantages
Disadvantages Disadvantages
38. What machinery or equipment do you use for farm productionMachinery/Equipment Ownership/Access Costs of hiring if not own
J. Stewardship
39. How do manage your soils so that they can remain healthy?
Practice(e.g. manure, mulch, etc.)
Frequency per season Effects on soil
40. Do you use fertilizer? Yes [ ] No [ ]41. If yes, what type do you use and how many times do you apply in a season?Type of fertiliser Frequency of application per season
120
42. Where is fertilizer placed? a) Applied uniformly on soil surface [ ] b) applied as a band onthe surface [ ] c) applied as a band below surface, usually 5-20 cm deep. [ ] d) banded withthe seed at planting [ ] e) banded below the seed at planting [ ] f) banded below and tothe side of the seed at planting [ ] Any explanations:………………………………………………………………………………………………………………………………………………………..……………………………………………………………………………………………………………………………………………………..
43. Where do you source seeds for planting?
Crop type Source of seed
44. a) Where do you store your farm produce?..............................................................................................................................................................................................................................................................................................................................................................................................................................................................
b) What are the major storage problems that you face and how you address them?
Problems Ways you address them Rankeffectiveness(1-4)
45. Have you received support in the form of inputs at a reduced price or free in the last 12months?
Inputs Source Use
121
46. Crop production Gross Margin for CA for season Oct 2012-Jan 2013Areas cropped (acres): …………………………… Units/Amounts Costs Who does
Value of own consumption: MaizeValue of own consumption: Cowpeas
123
48. Do you have any other source of food other than own production?
Other sources Tick Explanation
a) Social grants (disability, child support)
b) Pensions
c) Business
d) Formal employment
e) Informal employment (casual labour)
f) Poverty relief(government scheme)
g) Relief food
h) Remittances from relatives
i) Loans
j) Hunting
k) Collecting wild plants
l) Rely on neighbours
m) Rely on friends
n) Others (specify)
49. If relief food is identified as one of the sources, how has it been in the last 5 years?
Sources Frequency Quantity Quality Explanation
124
50. What are the main diseases/pests affecting crops and their possible causes? (to be comparedlater with information from extension officer)
Crops Disease Symptoms Possible Cause (e.g.pests, etc.)
CommonSeason orMonths
Maize
Beans
Cowpeas
Pigeonpeas
Others(specify)
51. How does your crop production contribute to your livestock production?…………………………………………………………………………………………………..………………………………………………………………………………………………….………………………………………………………………………………………………
52. What are some of the major problems faced in crop production by the household? Arrange indecreasing severity.
…………………………………………………………………………………………………..
………………………………………………………………………………………………….
………………………………………………………………………………………………
125
K. Natural capital
Water sector
53. Your current main water sources: Indicate distance and time taken (to & from).
SourceDistance(km)
Time tosource(hrs.)
Time atsource(hrs)
Monthsused (peryear)
Ownership Freq. Amountof waterfetchedper trip
Cost Whofetcheswater
Mode oftransport
Water uses
Shallowwell
Water hole
Bore hole
Tank /Jar
Dam
River/stream
Others
54. What amount of water does the household use daily?
55. If in table above, the household owns a water source, what necessitated you to develop your own water source?
………………………………………………………………………………………………………
………………………………………………………………………………………………………………..
126
56. Do you practise rainwater harvesting? Yes [ ] No [ ]57. If no (to above), why?
a)…..……………………………………………………………………………………………......
b) ………………………………………………………………………………………………….
c)……………………………………………………………………………………………………
58. Rain water harvesting techniques
RWH techniques applied Method1 Method2
Catchment area
Catchment method (silt
trap etc.)
Storage amount (M3)
Investment year
Investment costs
Maintenance costs
Uses
Domestic (cash
equivalent):
Irrigated area/crops (cash
equivalent):
Water sale (price per unit):
Livestock watering (cash
equivalent):
Months water available in
a year
Problems in method;
(water quality, health,
maintenance, security,
risks, enough water)?
127
59. What types of water storage facility or facilities are in the homestead? Indicate capacity.
Type of storage facility Capacity (litres)
60. Reliability of water supply for crop production (Mark the ones applied; Yes/No)
61. What major water-related problems do you experience here?………………………………………………………………………………………………………………………………………………………………………………………………………………………………………………………………………………………………………
L. LEARNING
Knowledge base
62. Which languages do you speak and hear (understand)?
Speak Understand
128
63. What training have you undergone in the last 5 years? (Can also provide information about farmers’ attitude towards innovation)Training topic Who offered the training? Year Language Duration (days) What did you apply from what
you learned?
Shared societal vision about conservation agriculture/agricultural production
64. In what ways are you supported in your crop production and by whom in the last 5 years?Crop productionsupport
Organization /personproviding support
frequency How did you use it in your crop production? Rank importance ofsupport (1-4)
Ranking: 1-not important; 2-somehow important; 3-important; 4- very important
129
M. SELF-ORGANISATION
Institutional analysis
65. Are there organizations in the area promoting agriculture and food security enhancement?Yes [ ] No [ ]
66. If yes, name them………………………………………………Organization Activity Year (s) Importance to your
household (rank 1-4)
Ranking: 1-not important; 2-somehow important; 3-important; 4- very important
Commitment to learning
67. Interactions with organisations - in the last 12 months, which extension meetings have youattended?
Topic Organisation/actor When Benefits/outcomes
130
Farmer knowledge identification capability
68. What plans do you have on crop production in the coming season?…………………………………………………………………………………………………..…..……………………………………………………………………………………………………..…………………………………………………………………………………………………….........................................................................................................................................
69. What new inputs and practices (seeds, tools, technologies, approaches) have you tried?Inputs/Practices When
triedWhen last tried(Mth/yr)
Why? Reasons/Explanations Innovation source
Knowledge sharing/transfer capability
70. What kind of support/advice did you give to other farmers in the last 12 months?Support/adviceprovided
To whom? Relationship Frequency Outcomes
71. What kind of support/advice did you receive from other farmers in the last 12 months?Support/advicereceived
From whom? Relationship Frequency Outcomes
131
Functioning feedback mechanisms
72. To whom do you go to when you seek support (information, money, inputs etc?) on crop production?Problems faced Person/organisation Support received Frequency of
contactingthe person
If in 2012,please tick
Rankusefulness ofsupport/advice
Outcomes
Ranking: 1-not important; 2-somehow important; 3-important; 4- very important
Knowledge feedback mechanism – Seasonal forecasts73. Did you have any forecasts (from any source) about the drought event of 2009? [YES] [NO]
What was predicted? …………………………………………………………………..............……….................................................
………………………………………………………………………………………………....
74. How accurate was the forecast? ………………………………………………………….......……………………………….............
75. What preparedness actions did you take? ………………………………………….……………………………..............................
132
76. Did you consult any sources on the current season? (e.g. radio-meteo-reports, churches, astrologers, diviners, others.)? (YES)(NO)Explain:…………………………………………………………………………………………..........................................................…………………………………………………………………………………………………..…........................................................
77. What actions have you taken/will you take based on the prediction(s)?……………………….......................................................
78. How often do you listen to the weather forecasts on radio? …………………………………………………………………………...............................................................................................................................................................................................................................
N. Cooperation and networks – structural social capital
79. Current group memberships (Farmers belonging to more groups are likely to improve their crop production resilience; Farmerswith old memberships are more likely to improve their farm resilience than others with no membership/ less maturity)
Group/organisationname
Year offormation
Group activities Nr ofmembers
Househldmember
Membership year
Freq.groupmeeting
Benefits(social capital)
Participationfrequency offarmer/year
Role of hhldmember
Rank1-4
Ranking: 1-not important; 2-somehow important; 3-important; 4- very important
133
80. If member of a famer group, how many times have you missed the meetings of the farmergroup in the last 12months?.......................................................................................................
81. Reasons for missing meetings.…………………………………………………………………………………………………..…..……………………………………………………………………………………………………..…………………………………………………………………………..........
82. What other benefits do you get from relationships with other people in the last 6 months?(Limit to 5)
Person/relationship Benefits Frequency Rank1-4
Support you gave(reciprocity) to sameperson
Frequency
Ranking: 1-not important; 2-somehow important; 3-important; 4- very important
Trust (Cognitive social capital)
83. Tick where appropriate.(Cognitive social capital, Barham J. and Chitemi C.2009)
(1)Agree
(2) Neutral or‘‘middle”
(3)Disagree
Most members in your village can be trusted (GeneralTrust);Most members in your village are willing to help if youneed it (Help Trust);In your village, members can generally trust each otherin matters of lending and borrowing money (MoneyTrust).
Social network (social learning):(measure of information on minimum soildisturbance from social networks)
84. How many of the people you know are practising minimum tillage?
85. How many of these belong to your household?
86. How many of these are neighbours and friends in the village?
134
O. Network structure
87. Which three (3) households do you exchange (give/receive) information, labour, food, ormoney in times of stress such as the 2009 Drought?
Production activities Name of household Relation to each Household
Information
Labour
Food
Money
Others:
Others:
Friend, relative –specify etc.
Lending network
88. Are there person(s) who you cannot do without their support to carry out your cropproduction?
Person/relationship Activity/support
89. Are there any persons who cannot do without your support to carry out their cropproduction?
Person/relationship Activity/support
135
P. Labour exchange/reciprocity:
90. If you needed people outside your household to help you for free in agricultural work(land clearing, planting), whom would you ask? (in order of importance) [if existing upto 10)
Person Relationship Activity12345678910
91. What do you think can be improved so that changes in rainfall do not harm your farmproduction?
92. Do you have traditional ways of determining the suitability of soils for cultivation? (a) Yes [ ] No[ ]; (b) If yes, how?.................................................................................................................……………………………………………………………………………………………………………………………………………….……………………………………………………………………………………………………………………………………………….
(c) Which ones do youapply?…………………………………………………………………………………….………….……………………………………………………………………………………………………………………………………………….
93. Do you have traditional ways of protecting crops from drying? (a) Yes [ ] No [ ]; (b) If yes,how?................................................................................................................................……………………………………………………………………………………………………………………………………………….……………………………………………………………………………………………………………………………………………….
(c) Which ones do youapply?…………………………………………………………………………………….………….……………………………………………………………………………………………………………………………………………….
94. Do you have traditional ways of protecting crops from pest and diseases? (a) Yes [ ] No [ ]; (b) Ifyes, how?.................................................................................................................……………………………………………………………………………………………………………………………………………….……………………………………………………………………………………………………………………………………………….
(c) Which ones do youapply?…………………………………………………………………………………….………….……………………………………………………………………………………………………………………………………………….
95. Do you have traditional ways of protecting livestock from pest and diseases? (a) Yes [ ] No [ ];(b) If yes, how?............................................................................................................……………………………………………………………………………………………………………………………………………….……………………………………………………………………………………………………………………………………………….
(c) Which ones do youapply?…………………………………………………………………………………….………….……………………………………………………………………………………………………………………………………………….
96. Do you have traditional ways of preserving seeds? (a) Yes [ ] No [ ]; (b) If yes,how?............................................................................................................................................……………………………………………………………………………………………………………………………………………….
(c) Which ones do youapply?…………………………………………………………………………………….………….……………………………………………………………………………………………………………………………………………….
97. Do you have traditional ways of preserving harvests? (a) Yes [ ] No [ ]; (b) If yes,how?............................................................................................................................................……………………………………………………………………………………………………………………………………………….……………………………………………………………………………………………………………………………………………….
(c) Which ones do youapply?…………………………………………………………………………………….………….……………………………………………………………………………………………………………………………………………….
98. Do you have traditional knowledge of rainfall patterns in this area? (a) Yes [ ] No [ ]; (b) If yes,please explain?.............................................................................................................……………………………………………………………………………………………………………………………………………….……………………………………………………………………………………………………………………………………………….
(c) How do you use thisknowledge?………………………………………………………………………….………….……………………………………………………………………………………………………………………………………………….
138
Q. OBSERVATIONS
99. Housing: What is your main house constructed of? (Observation rather than ask the
Type of Floor: 1= earth 2= wood 3= stone/brick/cement 4= others…………
100. Do you have a toilet /latrine? Yes [ ] No [ ]
101. If yes, what type?
102. Assess the present status, materials of construction, general cleanliness, hole cover,
etc.
…………………………………………………………………………………………………
…………………………………………………………………………………………………
…………………………………………………………………………………………………
Comment on the interview:
…………………………………………………………………………………………………
…………………………………………………………………………………………………
…………………………………………………………………………………………………
139
9.1.2 Focus group discussion
CA
Non CA
Farmers Present
Name Phone Number
i. …………………………………………… ……………………ii. …………………………………………… ……………………iii. …………………………………………… ……………………iv. …………………………………………… ……………………
Facilitators
i. ……………………………………………………….ii. ……………………………………………………….
1. What are the benefits of conservation agriculture (CA?)
2. Challenges faced by farmers practicing CA
3. Reasons for adoption of CA and continued practice
4. The adoption of different CA techniques by farmers:
Technique Number of farmers practicing
Reasons for selective adoption of the CA techniques
Reasons for not practicing CA on the whole shamba
5. Government support for CA in particular and agriculture in general and NGO/researchsupport in general
6. CA impact on food production
7. CA impact on soil
8. Problems faced in practicing CA, how to address them
9. Why are they not adopting across the whole farm?
140
10. How many farmers were affected by the 2009 drought?
11. What is needed to improve crop production in the area especially against rainfallvariability?
12. Potential of livestock fodder production in the area.
13. Collective action issues –what issues in crop production could be improved throughcollective action?
14. Sub –soiler, ripper:-if they were provided a rip[per/sub-soiler on a cost use basis ,howmany are willing to use them?
15. A lot of erosion (gully erosion) on roads and footpaths, sometimes on the farms –couldthey provide more information on this and the effect on their crop production?
16. Besides economic costs of adopting CA, are there other costs (e.g. social costs,environmental cost etc.) which need to be considered?
17. If lack of capital mentioned as a problem in crop production and adoption of CA-Assuming a farmer had a choice to buy herbicides for crops and money was provided for this,would they purchase the herbicide (opportunity costs).Also ask for fertilizer.