Connectivity of the Asiatic wild ass population in the MongolianGobi
Petra Kaczenskya,⁎, Ralph Kuehnb, Badamjav Lhagvasurenc,d, Stephanie Pietschb,Weikang Yange, and Chris WalzeraaResearch Institute of Wildlife Ecology, University of Veterinary Medicine, Vienna, AustriabUnit of Molecular Zoology, Department of Animal Science, Technical University Munich,GermanycMammalian Ecology Laboratory, Institute of Biology, Mongolian Academy of Science, MongoliadWWF Mongolia, Ulaanbaatar, MongoliaeXinjiang Institute of Ecology and Geography, Urumqi, Xinjiang, China
AbstractLong-distance migrations of wildlife have been identified as important biological phenomena, buttheir conservation remains a major challenge. The Mongolian Gobi is one of the last refuges forthe Asiatic wild ass (Equus hemionus) and other threatened migratory mammals. Using historicand current distribution ranges, population genetics, and telemetry data we assessed theconnectivity of the wild ass population in the context of natural and anthropogenic landscapefeatures and the existing network of protected areas. In the Mongolian Gobi mean biomassproduction is highly correlated with human and livestock density and seems to predict wild assoccurrence at the upper level. The current wild ass distribution range largely falls into areas belowthe 250 gC/m2/year productivity isoline, suggesting that under the present land use moreproductive areas have become unavailable for wild asses. Population genetics results identifiedtwo subpopulations and delineated a genetic boundary between the Dzungarian and TransaltaiGobi for which the most likely explanation are the mountain ranges separating the two areas.Home ranges and locations of 19 radiomarked wild asses support the assumed restricting effects ofmore productive habitats and mountain ranges and additionally point towards a barrier effect offences. Furthermore, telemetry data shows that in the Dzungarian and Transaltai Gobi individualwild ass rarely ventured outside of the protected areas, whereas in the southeast Gobi asses onlyspend a small fraction of their time within the protected area network. Conserving the continuityof the wild ass population will need a landscape level approach, also including multi-uselandscapes outside of protected areas, particularly in the southeast Gobi. In the southwest Gobi,allowing for openings in the border fence to China and managing the border area as an ecologicalcorridor would connect three large protected areas together covering over 70,000 km2 of wild asshabitat.
1 IntroductionHabitat loss and fragmentation have been identified as key threats to biodiversityconservation worldwide. Busy transportation routes and fences are significant mortalityfactors (Harrington and Conover, 2006; Lovari et al., 2007), impede movement of wildlifeby creating access barriers to important resources (Frair et al., 2008), stop or slowpopulation expansion (Kramer-Schadt et al., 2004), or subdivide once-continuouspopulations into more or less isolated subpopulations (Lankester et al., 1991). Large-bodied,far-ranging mammals like large carnivores and large herbivores are particularly sensitive tofragmentation because they need access to large tracts of continuous habitat. Seasonalchanges in habitat conditions can force large herbivore populations to migrate betweendistinct seasonal ranges (Wolanski et al., 1999; Ferguson and Elkie, 2004), whereasunpredictable changes in habitat conditions can force them to resume nomadic movements(Mueller et al., 2008). The fragmentation of habitat into small and often non-contiguouspatches decreases their capacity to escape locally poor habitat conditions and may result indramatic population declines (Berger, 2004; Bolger et al., 2007). Furthermore, small andfragmented subpopulations become vulnerable to chance events like demographic, genetic,and environmental stochasticity (van Noordwijk, 1994; Frankham, 2005). The smaller thesubpopulation and the more unpredictable the habitat, the higher the risk of local extinctionsbecomes.
Landscape genetics has become a powerful tool for addressing population fragmentation onthe landscape level (Holderegger and Wagner, 2008). Several studies have revealed clearassociations between habitat fragmentation and the genetic structure of wide-ranging, long-lived, and large-bodied mammal species (McRae et al., 2005), and identified barriers (Rileyet al., 2006) as well as corridors (Dixon et al., 2006). A recent approach applied landscapegenetics to optimize dispersal and corridor models (Epps et al., 2007); however, theapplication of genetic tools for conservation is still largely method and theory driven, ratherthan focused on real data sets with relevance to conservation problems (Vernesi et al., 2008).
Although long-distance migrations and nomadic movements over extensive areas have beenidentified as important biological phenomena (Convention on Migratory Species (CMS),2002), their conservation remains a major challenge of the 21st century (Berger, 2004;Thirgood et al., 2004; Bolger et al., 2007; Wilcove and Wikelski, 2008). The steppes, desertsteppes, and deserts of Central Asia are still home to several globally threatened migratoryor nomadic large herbivores (Berger, 2004; Bolger et al., 2007). However, a growing humanpopulation, changes in land management, exploitation of natural resources, and thedevelopment of infrastructure place increasing pressure on these species and their habitats(Reading et al., 1998; Milner-Gulland et al., 2003; Ito et al., 2005; Clark et al., 2006; Qui,2007; Wingard and Zahler, 2006). Among these species is the Asiatic wild ass, Equushemionus.
The Mongolian Gobi and adjacent areas in northern China provide the last refuge for theAsiatic wild ass and other threatened wildlife (Clark et al., 2006; Yang, 2007). Anecdotalevidence suggests that the Asiatic wild ass may have lost as much as 70% of its range sincethe 19th century because of direct persecution and competition with humans and theirlivestock over water and pasture use (Zevegmid and Dawaa, 1973; Reading et al., 2001).
Kaczensky et al. Page 2
Published as: Biol Conserv. 2011 February ; 144(2): 920–929.
Sponsored Docum
ent Sponsored D
ocument
Sponsored Docum
ent
Reliable historic population numbers for wild asses are unavailable (Reading et al., 2001)and recent estimates are either plagued by a high variance of the estimate (Reading et al.,2001; B. Lkhagvasuren and S. Strindberg, unpubl. data) or a lack of statistical rigor in theanalysis (Lhagvasuren 2007; Yang, 2007). Most likely the Mongolian population stillnumbers in the magnitude of 10–20,000 animals (B. Lkhagvasuren and S. Strindberg,unpubl. Data; Kaczensky, unpubl. Data), while adjacent China likely houses another fewthousand animals (Yang, 2007; Yang, unpubl. data).
The Asiatic wild ass has been fully protected in Mongolia since the 1950s (Clark et al.,2006), and large portions of its habitat are under formal protection. Nevertheless, little isknown about the degree of connectivity and whether or not the current protected area systemis adequate to safeguard the wild ass population of the Gobi.
People consider wild asses to compete with their livestock for pasture and water. As aconsequence wild asses are actively chased away or illegally killed by people (Kaczensky etal., 2006; Wingard and Zahler, 2006) and the mere presence of people and their livestock atwater points can limit or block access for Asiatic wild asses (Denzau and Denzau, 1999;Kaczensky et al., 2006). In recent years, Mongolia has been anticipating the development ofa commercialized agricultural sector that could easily cause greater intrusion of humanactivities into the Gobi areas (World Bank, 2003). Development of other sectors of theMongolian economy, especially mining and road construction (World Bank, 2006), couldfurther affect the environmental security and habitat needs of the Asiatic wild ass andassociated wildlife in the Gobi (Kaczensky et al., 2006).
An evaluation of the connectivity of the still abundant Asiatic wild ass population wouldyield important information about the integrity of the Gobi ecosystem and identify possiblemovement barriers. Such barriers are likely to also affect other species that presently have amore restricted distribution range, such as the wild Bactrian camel (Camelus ferusbactrianus), the saiga (Saiga tatarica), or the re-introduced Przewalski’s horse (Equus ferusprzewalskii, Clark et al., 2006). Using telemetry, population genetics, and distribution rangedata, we assessed the connectivity of the wild ass population in the context of natural andanthropogenic landscape features.
2 Study areaThe Gobi areas cover roughly 300,000 km2 of desert steppe and desert areas in southernMongolia (Fig. 1). The climate is strongly continental with long cold winters (January mean,−15 °C to −20 °C) and short hot summers (July mean, 20–25 °C). Average annualprecipitation ranges from 50 mm in the Transaltai Gobi, to 100 mm in the Dzungarian Gobi,and up to 200 mm in parts of the southeastern Gobi (von Wehrden and Wesche, 2007).Because the area also shows high levels of inter-annual variation in precipitation, themajority of the Gobi is believed to follow non-equilibrium dynamics (von Wehrden et al.,submitted for publication) and thus to have a low risk for degradation caused by grazing.
Elevations range from 550 to 3750 m. The Dzungarian Gobi is located in a natural basinflanked by the southern tip of the Altai Mountain range to the north and east and a mountainrange along the border to China in the south. The Transaltai Gobi is flanked by the Edrenemountain range in the north but also encompasses a medium-sized mountain range in thesouth–central part. The southeastern Gobi is largely a flat landscape with few distincttopographic features (Fig. 1).
The plant community of the desert areas is widely dominated by Chenopodiaceae, such assaxaul (Haloxylon ammodendron) and Anabasis brevifolia. Asteraceae, such as Artemisiaand Ajania, and Poaceae like Stipa and Ptilagrostis, dominate the steppe areas. High
Kaczensky et al. Page 3
Published as: Biol Conserv. 2011 February ; 144(2): 920–929.
productivity riparian vegetation and Nitraria sibirica communities are rare and restricted tolarger oases and intermittent river valleys (Hilbig, 1995).
Open water is unevenly distributed, with varying predictability among the areas. In theDzungarian Gobi, open water is rare, but springs tend to be permanent. In the TransaltaiGobi, open water is extremely rare and except for a few large oases, smaller water pointsmay fall dry during certain seasons or years. Although the southeastern Gobi receives themost precipitation, intra-annual and inter-annual availability of open water is highly variable(Kaczensky et al., 2006).
The Gobi region is at the center of the Cashmere goat industry in Mongolia, and livestockproducts generate the main income of local herders (World Bank, 2003). Human populationdensity in the 24 Gobi districts (>30% of the area within the wild ass range) is very low,averaging 0.2 inhabitants/km2, and there are only 17 villages, with 500–1500 inhabitantseach. Livestock numbers, on the other hand, total 2 million sheep and goats, 614,000 horses,413,000 domestic camels, and 280,000 cows and yaks (National Statistical Office ofMongolia, 2004 and 2007, unpubl. data). The state owns all grazing land in Mongolia, andthe district governments allocate grazing rights based on pasture condition, previous use,and family relationships. In most Gobi areas, herders and their livestock follow a semi-nomadic lifestyle (Fernandez-Gimenez and Batbuyan, 2004). No fences are allowed todelineate grazing plots; the only fences dissecting the Gobi today are along the internationalborder to China and the Ulaanbaatar–Beijing railway (Fig. 1). The Gobi is rich in mineraldeposits, and official exploration and mining activities are increasing (World Bank, 2006).In October 2009 Ivanhoe Mines and Rio Tinto signed an Investment Agreement with theGovernment of Mongolia for the construction and operation of the Oyu Tolgoi copper–goldmining complex in the southeast Gobi (Ivanhoe Mines, 2009). Additionally, illegal miningby so-called “Ninja miners” mechanically destroys large tracts of pastureland and depletesor pollutes local water sources (Grayson 2007).
There are eight protected areas within or intersecting the present-day wild ass distributionrange amounting to 29% of the area being under formal protection: Great Gobi B strictlyprotected area (SPA; 9000 km2), Great Gobi A SPA (44,000 km2), Small Gobi A SPA(11,500 km2), Small Gobi B SPA (6500 km2), the southern parts of Gobi Gurvan SaikhanNational Park (5900 km2), Ergeliin Zoo Nature Reserve (620 km2), Zagiin Us NatureReserve (2500 km2), and the Suikhent Uul National Monument (50 km2; Fig. 1). The closestprotected area on the Chinese side, less than 40 km from the border, is the Kalimalai NatureReserve (17,300 km2). Distances between the four large protected areas in the Mongolianwild ass range are 190 km between Great Gobi A and B, 420 km between Great Gobi A andSmall Gobi A, and 80 km between Small Gobi A and B.
The ungulate community of the Mongolian Gobi consists of goitered gazelle (Gazellasubgutturosa), Mongolian gazelle (Procapra gutturosa), saiga, Asiatic wild ass, re-introduced Przewalski’s horse, and wild Bactrian camels on the plains, and Siberian ibex(Capra sibirica) and argali sheep (Ovis ammon) in the mountains (Clark et al., 2006). Thewild ass population is not evenly distributed over the entire Gobi. The majority of wildasses, likely as many as 70%, are found in the eastern part of the southeast Gobi. Theremaining asses largely occur in the Dzungarian Gobi, while the Transaltai Gobi onlyhouses wild asses at very low densities (Reading et al. 2001; Lhagvasuren, 2007; B.Lkhagvasuren and S. Strindberg, unpubl. data; P. Kaczensky, unpubl. data).
Kaczensky et al. Page 4
Published as: Biol Conserv. 2011 February ; 144(2): 920–929.
3 Methods3.1 Wild ass distribution range and habitat database
Historic wild ass distribution ranges were digitized from maps provided in Zevegmid andDawaa (1973) and from information summarized in Denzau and Denzau (1999). Todetermine the northern border of the current distribution range of Asiatic wild ass inMongolia, we combined our telemetry data with wild ass observations made during thenational surveys in 2003 and 2009 and observations made during multiple trips to theTransaltai and southeast Gobi between 2003 and 2007 (see Supporting Data Appendix S1).
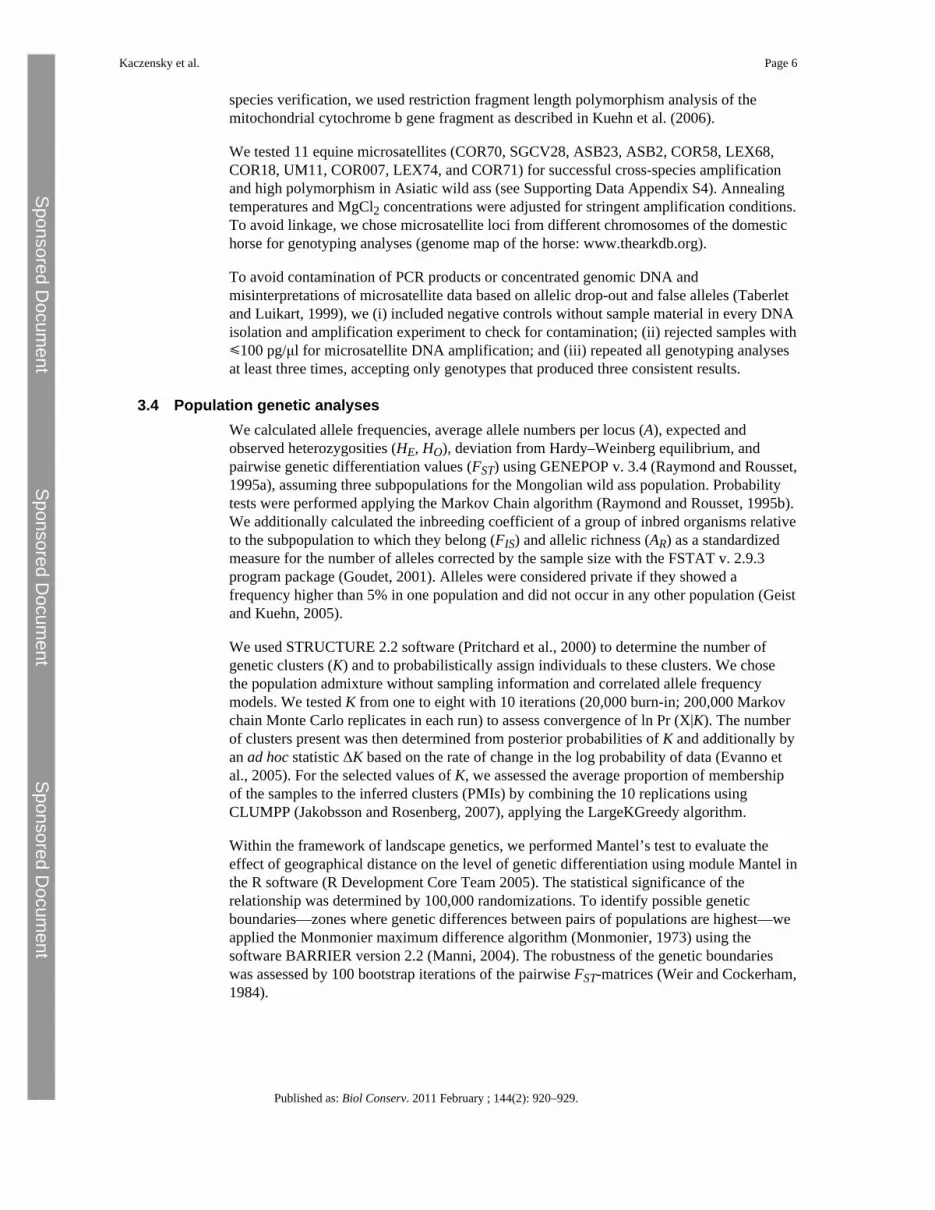
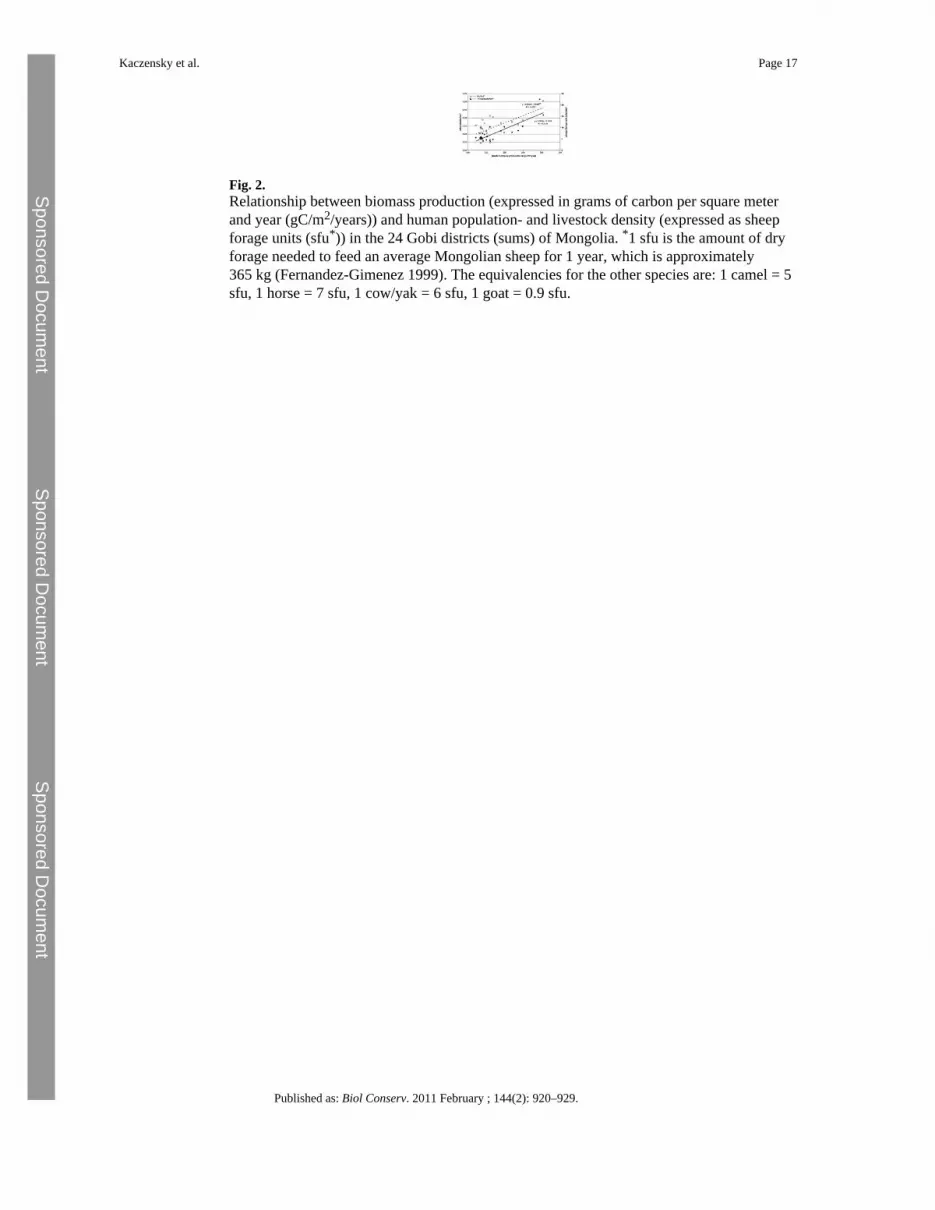
3.2 Mean biomass production as a proxi for human and livestock densitiesWe purchased livestock numbers for all 24 Gobi districts (sums) from the Statistical Officeof Mongolia for the year 2004 for the eastern Gobi and for the year 2007 for the westernGobi. We additionally obtained a digital layer with all sum boundaries and humaninhabitants dating from 2002 (see Supporting Data Appendix S2). However, the Gobidistricts are rather large (range: 7106–27,784 km2) and often expand into more productivemountainous habitat, particularly in the west. In addition, Mongolia does not have acommon database with exact locational data on herder camp distribution, movement paths,and associated herd sizes. Furthermore, in the highly variable non-equilibrium Gobiecosystem pasture quality, and thus human and livestock presence, can vary tremendouslyon an inter- as well as an intra-annual basis. Nevertheless, on average human population-and livestock densities in the Gobi clearly increase with higher biomass production (Fig. 2).In order to have a measure independent of administrational units we thus chose to use meanbiomass production as a proxy for human and livestock densities.
For the overall estimate of biomass production, we used the global layer of biomassproduction expressed in grams of carbon per square meter and year (gC/m2/years) for 1981–2000. This open-source GIS data set is available on an 8 × 8 km raster basis underhttp://glcf.umiacs.umd.edu/data/glopem/ with data processing described in Prince andGoward (1995). For our analysis, we used the mean biomass production over all 20 years.
Shuttle Radar Topography Mission tiles for Mongolia and northern China were downloadedfrom http://glcf.umiacs.umd.edu/ and merged into one file with a spatial resolution of 90 m(Fig. 1). We extracted slope from the digital elevation model and classified slopes ⩽ 5°as“flat”; slopes 5–20° as “mountains”; and slopes >20° as “steep mountains”.
3.3 Genetic sampling and extractionWe collected 80 wild ass samples between 2002 and 2005 that yielded sufficient DNA foranalysis: 19 in the Dzungarian Gobi, 18 in the Transaltai Gobi, and 43 in the southeasternGobi (Fig. 1). We obtained 65 samples from carcass remains and 15 from fecal deposits. Foreach sample, we recorded the GPS position and the date. The distances between thearithmetic means of the sample coordinates from the Dzungarian and the Transaltai Gobiwere 325 km (range for individual samples: 265–504 km), and between the Transaltai andthe southeastern Gobi, 930 km (range for individual samples: 640–1205 km). Fresh fecalpellets were stored in 90% ethanol. Old fecal samples, tissue, and bones were preserved dry,packed in plastic bags, and stored at −20 °C prior to DNA extraction.
We used commercially available DNA extraction kits (Qiagen and MACHEREY- NAGELGmbH and Co. KG, Germany) with some modifications to prepare genomic DNA fromdeep-frozen fecal and 90% ethanol–preserved fecal pellets as well as from bones and driedtissue samples. We used the SYBR Green detection system in a LightCycler (Roche) forquantitative PCR (qPCR) for quality control (see Supporting Data Appendix S3). For
Kaczensky et al. Page 5
Published as: Biol Conserv. 2011 February ; 144(2): 920–929.
species verification, we used restriction fragment length polymorphism analysis of themitochondrial cytochrome b gene fragment as described in Kuehn et al. (2006).
We tested 11 equine microsatellites (COR70, SGCV28, ASB23, ASB2, COR58, LEX68,COR18, UM11, COR007, LEX74, and COR71) for successful cross-species amplificationand high polymorphism in Asiatic wild ass (see Supporting Data Appendix S4). Annealingtemperatures and MgCl2 concentrations were adjusted for stringent amplification conditions.To avoid linkage, we chose microsatellite loci from different chromosomes of the domestichorse for genotyping analyses (genome map of the horse: www.thearkdb.org).
To avoid contamination of PCR products or concentrated genomic DNA andmisinterpretations of microsatellite data based on allelic drop-out and false alleles (Taberletand Luikart, 1999), we (i) included negative controls without sample material in every DNAisolation and amplification experiment to check for contamination; (ii) rejected samples with⩽100 pg/μl for microsatellite DNA amplification; and (iii) repeated all genotyping analysesat least three times, accepting only genotypes that produced three consistent results.
3.4 Population genetic analysesWe calculated allele frequencies, average allele numbers per locus (A), expected andobserved heterozygosities (HE, HO), deviation from Hardy–Weinberg equilibrium, andpairwise genetic differentiation values (FST) using GENEPOP v. 3.4 (Raymond and Rousset,1995a), assuming three subpopulations for the Mongolian wild ass population. Probabilitytests were performed applying the Markov Chain algorithm (Raymond and Rousset, 1995b).We additionally calculated the inbreeding coefficient of a group of inbred organisms relativeto the subpopulation to which they belong (FIS) and allelic richness (AR) as a standardizedmeasure for the number of alleles corrected by the sample size with the FSTAT v. 2.9.3program package (Goudet, 2001). Alleles were considered private if they showed afrequency higher than 5% in one population and did not occur in any other population (Geistand Kuehn, 2005).
We used STRUCTURE 2.2 software (Pritchard et al., 2000) to determine the number ofgenetic clusters (K) and to probabilistically assign individuals to these clusters. We chosethe population admixture without sampling information and correlated allele frequencymodels. We tested K from one to eight with 10 iterations (20,000 burn-in; 200,000 Markovchain Monte Carlo replicates in each run) to assess convergence of ln Pr (X|K). The numberof clusters present was then determined from posterior probabilities of K and additionally byan ad hoc statistic ΔK based on the rate of change in the log probability of data (Evanno etal., 2005). For the selected values of K, we assessed the average proportion of membershipof the samples to the inferred clusters (PMIs) by combining the 10 replications usingCLUMPP (Jakobsson and Rosenberg, 2007), applying the LargeKGreedy algorithm.
Within the framework of landscape genetics, we performed Mantel’s test to evaluate theeffect of geographical distance on the level of genetic differentiation using module Mantel inthe R software (R Development Core Team 2005). The statistical significance of therelationship was determined by 100,000 randomizations. To identify possible geneticboundaries—zones where genetic differences between pairs of populations are highest—weapplied the Monmonier maximum difference algorithm (Monmonier, 1973) using thesoftware BARRIER version 2.2 (Manni, 2004). The robustness of the genetic boundarieswas assessed by 100 bootstrap iterations of the pairwise FST-matrices (Weir and Cockerham,1984).
Kaczensky et al. Page 6
Published as: Biol Conserv. 2011 February ; 144(2): 920–929.
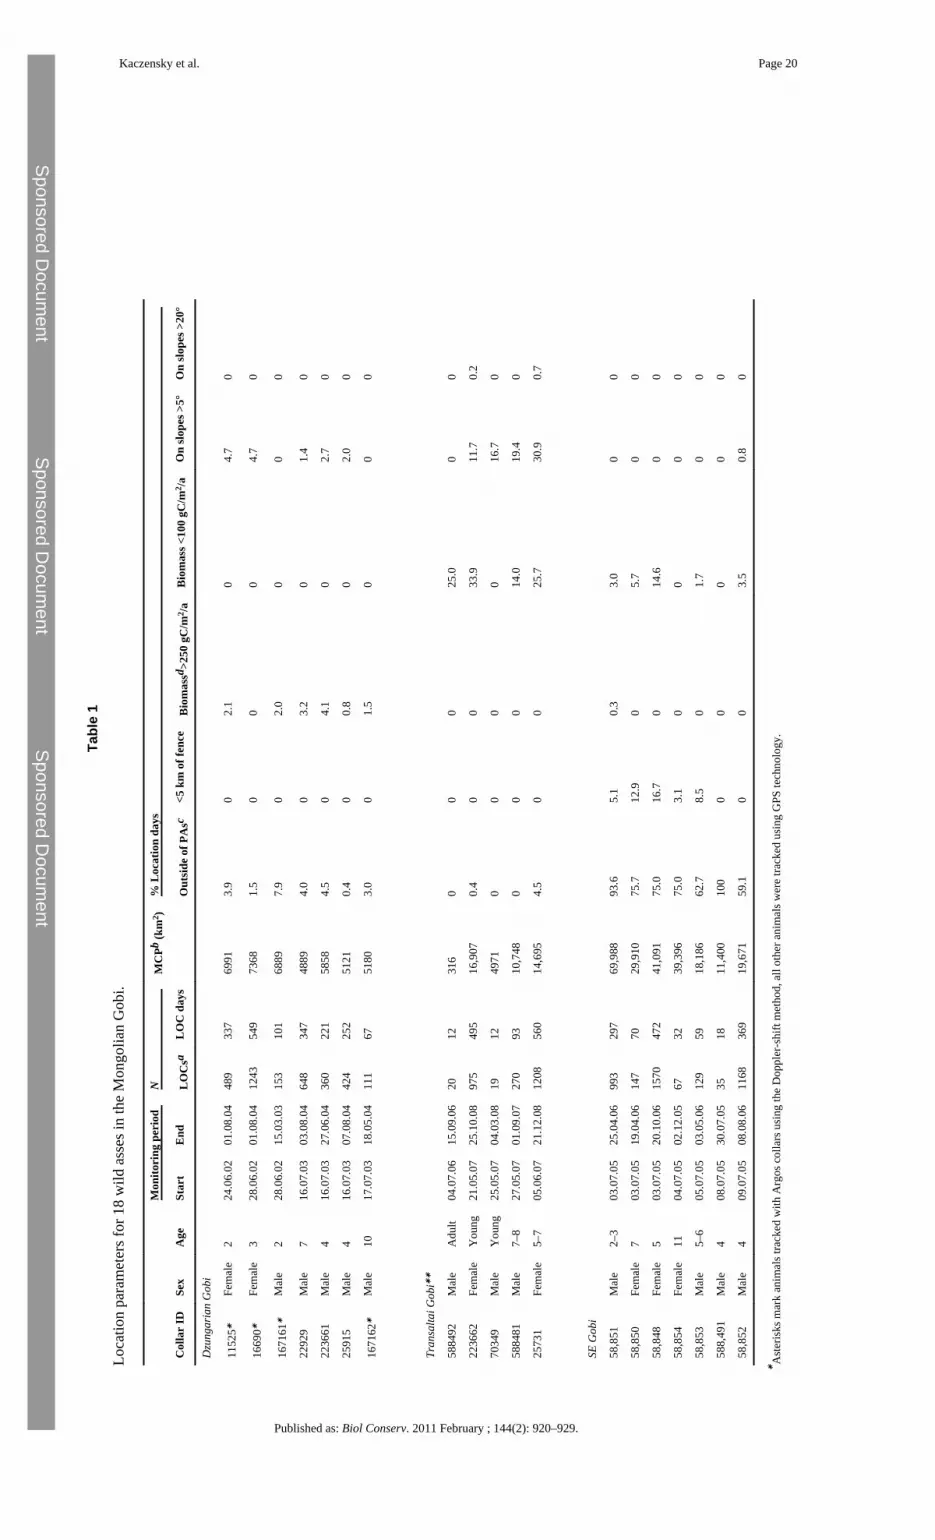
3.5 TelemetryBetween 2002 and 2007, we captured and radio-collared 19 Asiatic wild asses, seven maresand 12 stallions, in the three assumed subpopulations (Fig. 1, Table 1). For darting, weapproached animals using a 4 × 4 vehicle or hid at water points (for details see Walzer et al.,2006). The first four wild asses were collared with Argos (2-D cell Doppler PTT; NorthStar,Baltimore, Maryland, USA) and the remaining 15 with GPS-Argos collars (TWG-3580,Telonics, Mesa, Arizona, USA). While the Argos collars determined animal locations usingthe Doppler-shift method through the Argos satellite system, the GPS-Argos collars used theArgos system only for data transfer of GPS locations. For animal welfare reasons and toallow collar retrieval, all units were equipped with pre-programmed drop-off devices(CR-2a, Telonics).
Precisions of the GPS locations were in the range of ±15–100 m (P. Kaczensky unpublisheddata). For Argos locations we only used the three most precise location classes, where theexpected error is ±150–1000 m (Hays et al. 2001). Because of multiple technical failures(Kaczensky et al., accepted for publication), individual collars collected from 19–1570locations on 12–560 days (location days). The number of daily locations varied from 1–7,depending on collar type, performance, and duty cycle. On average, 2.1 locations wereobtained per animal and location day (range 1.5–3.3).
For visualization and analysis of spatial data, we used ArcMap 9.1 (ESRI, EnvironmentalSystems Research Institute, Inc., Redlands, California, USA) with the Hawth’s AnalysisTool extension (http://www.spatialecology.com/htools). We calculated home rangesexpressed as 100% minimum convex polygons (MCPs) for all individuals. However, forstatistical comparison among the three bio-geographic regions we only used the MCPs ofanimals which were located over at least 5 months with >8 locations summing up to at least50 location days. To avoid problems of autocorrelation for the descriptive statistics, we usedthe mean value of all locations per day and put it in relation to the total number of locationdays. Statistical analysis was performed in SPSS 14.0 (Statistical Package for the SocialSciences; SPSS Inc., Chicago, Illinois, USA).
4 Results4.1 Wild ass distribution and connectivity
Superimposing the current wild ass distribution range over the mean annual productivitylayer shows that Asiatic wild asses have become almost exclusively confined to areas southof the 250 gC/m2/year productivity isoline (see Supporting Data Appendix S5). That thespecies once thrived in higher productivity areas is shown by the historic distribution rangefrom the 19th century, where the distribution range reached much further north up to theproductivity isoline of 500 gC/m2/year (see Supporting Data Appendix S5).
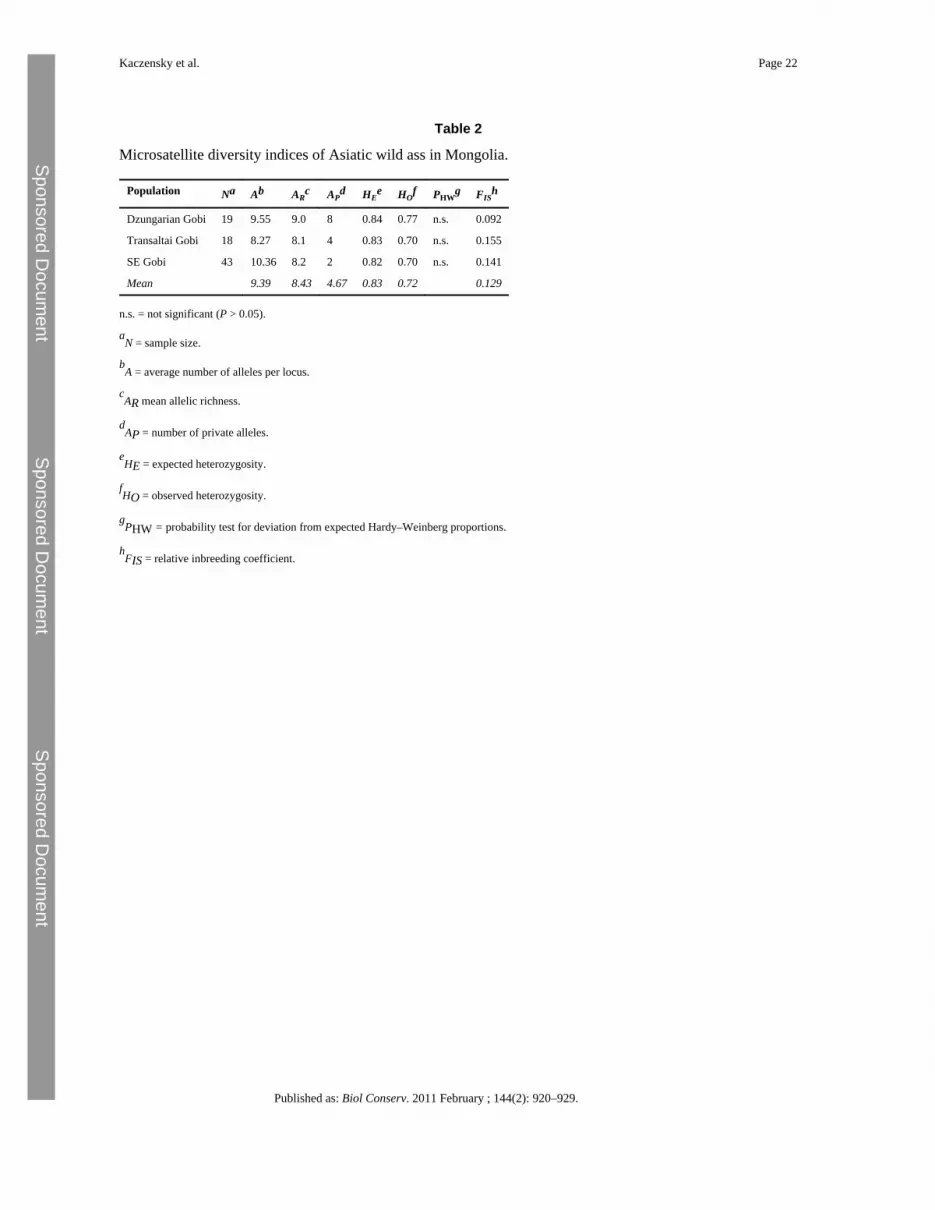
4.2 Population geneticsThe Mongolian wild ass population showed a high level of overall microsatellite diversitywith an average of 9.39 alleles per locus and a mean allelic richness of 0.83 and mean FIS of0.129 across the three bio-geographic regions. Expected and observed heterozygosities were⩾0.82 and ⩾0.70 for each area, respectively. Although the genetic variability within thethree areas was quite homogeneous, the samples from the Dzungarian Gobi revealed arecognizably higher genetic variability than those from the other two areas (Table 2). A totalof 14 private alleles were detected, eight in the Dzungarian Gobi, four in the TransaltaiGobi, and two in the southeastern Gobi.
Kaczensky et al. Page 7
Published as: Biol Conserv. 2011 February ; 144(2): 920–929.
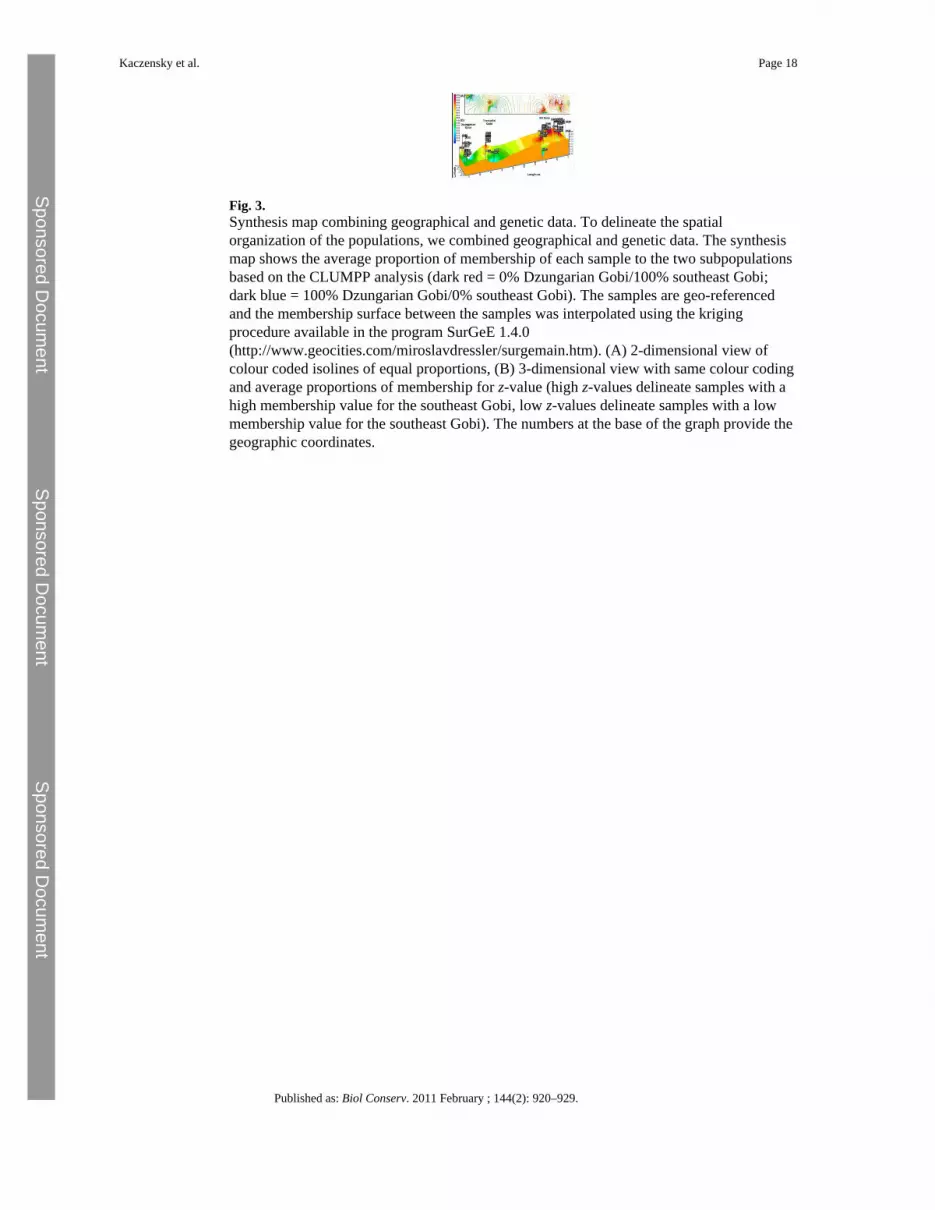
The highest FST value was observed between the Dzungarian and the southeastern Gobi(FST = 0.0191), the lowest between the Transaltai and the southeastern Gobi (FST = 0.0068),and an intermediate between the Dzungarian and the Transaltai Gobi (FST = 0.0088; allpairwise FST values were highly significant at P < 0.001). The Mantel analysis did notreveal an “isolation by distance” relationship (no significant positive correlation betweengenetic and geographical distances; r2 = 0.0115; P > 0.05). Individual multilocus genotypes-based STRUCTURE analyses clearly indicated the presence of a substructure, with the mostlikely grouping into two subpopulations. CLUMPP analysis showed that the samples fromthe Dzungarian and the southeastern Gobi cluster separately, whereas samples from theTransaltai Gobi were undefined (see Supporting Data Appendix S6). BARRIER analysisidentified one genetic boundary with 89% of the bootstrap values between the Dzungarianand the Transaltai Gobi (Fig. 3, also see Supporting Data Appendix S6).
4.3 TelemetryRange size of wild asses showed a tendency to increase from west to east, but differenceswere not significant due to the small sample sizes and the rather large variation in rangesizes within the three areas (ANOVA, P = 0.008, but post hoc comparisons with Tamhanecorrection for unequal variance all had P > 0.100). In the Dzungarian Gobi ranges for theseven animals averaged 5860 km2 (Kaczensky et al., 2008) and locations were almostcompletely confined to the Great Gobi B SPA (Fig. 1, Table 1). Locational data from theTransaltai Gobi is largely based on two individuals due to faulty collars. These animalsroamed over large areas of 14,695–16,907 km2 and rarely ventured outside of the protectedarea (Fig. 1, Table 1). In the southeastern Gobi ranges for five animals varied from 18,186 to69,988 km2. The ranges of two additional animals, followed over a rather short time period,were also large. Contrary to the two other areas, wild asses in the southeast Gobi spend themajority of time outside of protected areas (Table 1, Fig. 1).
Wild ass home ranges and locations largely fell below the 250 gC/m2/year productivityisoline and primarily fell into flat terrain (Table 1). Average productivity within theminimum convex polygon encompassing all wild ass locations averaged 164 gC/m2/year(SD = 41.8) in the Dzungarian Gobi, 111 gC/m2/year (SD = 27.6) in the Transaltai Gobi and144 gC/m2/year (SD = 39.5) in the southeast Gobi. In the southeast Gobi mountains are rareand steep terrain is absent, but the Dzungarian and Transaltai Gobi both encompassmountain ranges. Whereas wild asses in the Dzungarian Gobi seem to stay away frommountainous terrain altogether, asses in the Transaltai Gobi do make use of mountainousterrain (Table 1).
In the Dzungarian and Transaltai Gobi, none of our collared Asiatic wild asses came close toany fence and thus we had no means of assessing the effect of fences. However, in thesoutheastern Gobi five animals stayed in the vicinity of the border fence for 1–79 days, andone animal (ID 58851) moved for 8 days (20–27 July 2005), 92 km within 0.09–10 km(mean: 3.8 km; N = 28) along the west side of the fenced Ulaanbaatar–Beijing railroad track(Fig. 1). Although the animals stayed close to the fence, none of them was able or willing tocross.
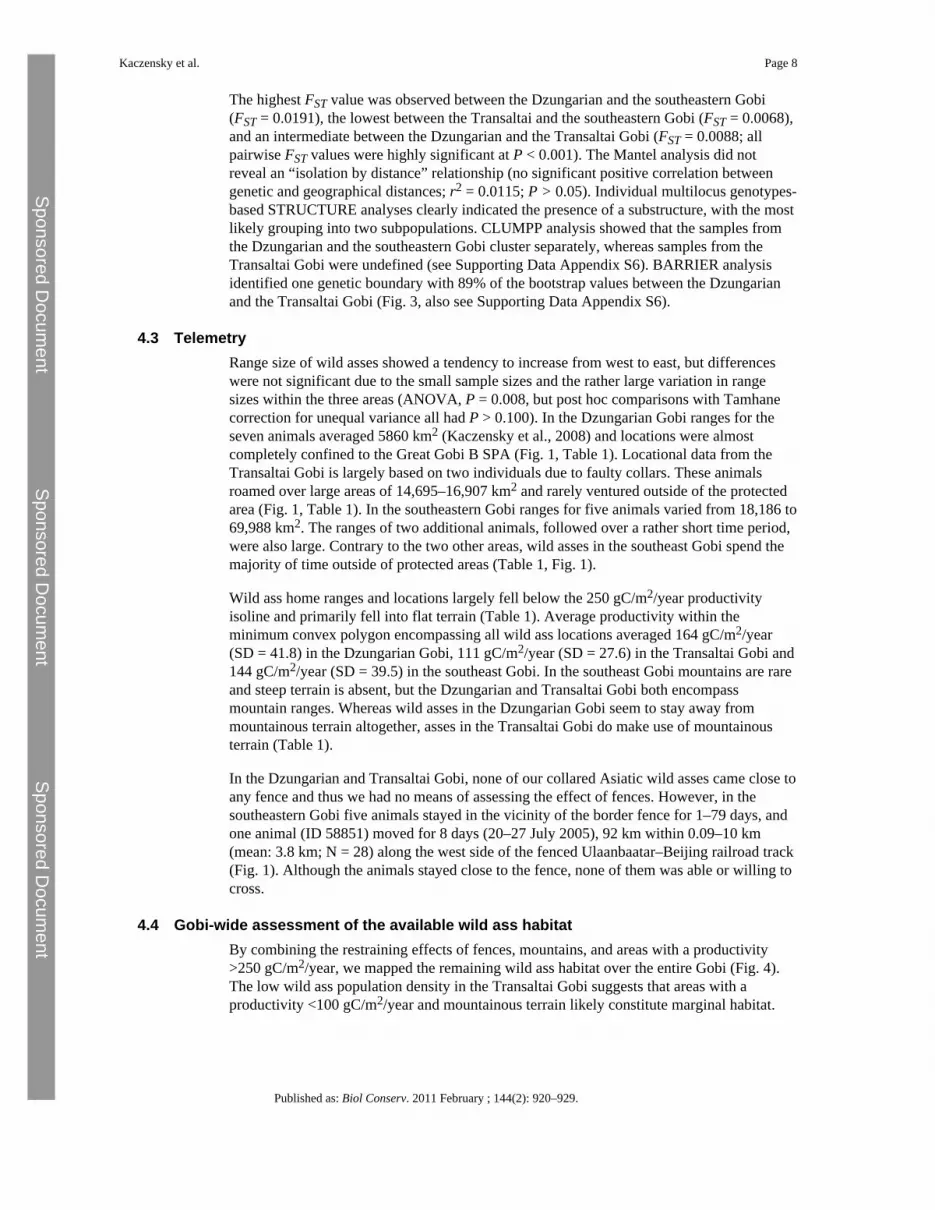
4.4 Gobi-wide assessment of the available wild ass habitatBy combining the restraining effects of fences, mountains, and areas with a productivity>250 gC/m2/year, we mapped the remaining wild ass habitat over the entire Gobi (Fig. 4).The low wild ass population density in the Transaltai Gobi suggests that areas with aproductivity <100 gC/m2/year and mountainous terrain likely constitute marginal habitat.
Kaczensky et al. Page 8
Published as: Biol Conserv. 2011 February ; 144(2): 920–929.
Sponsored Docum
ent Sponsored D
ocument
Sponsored Docum
ent
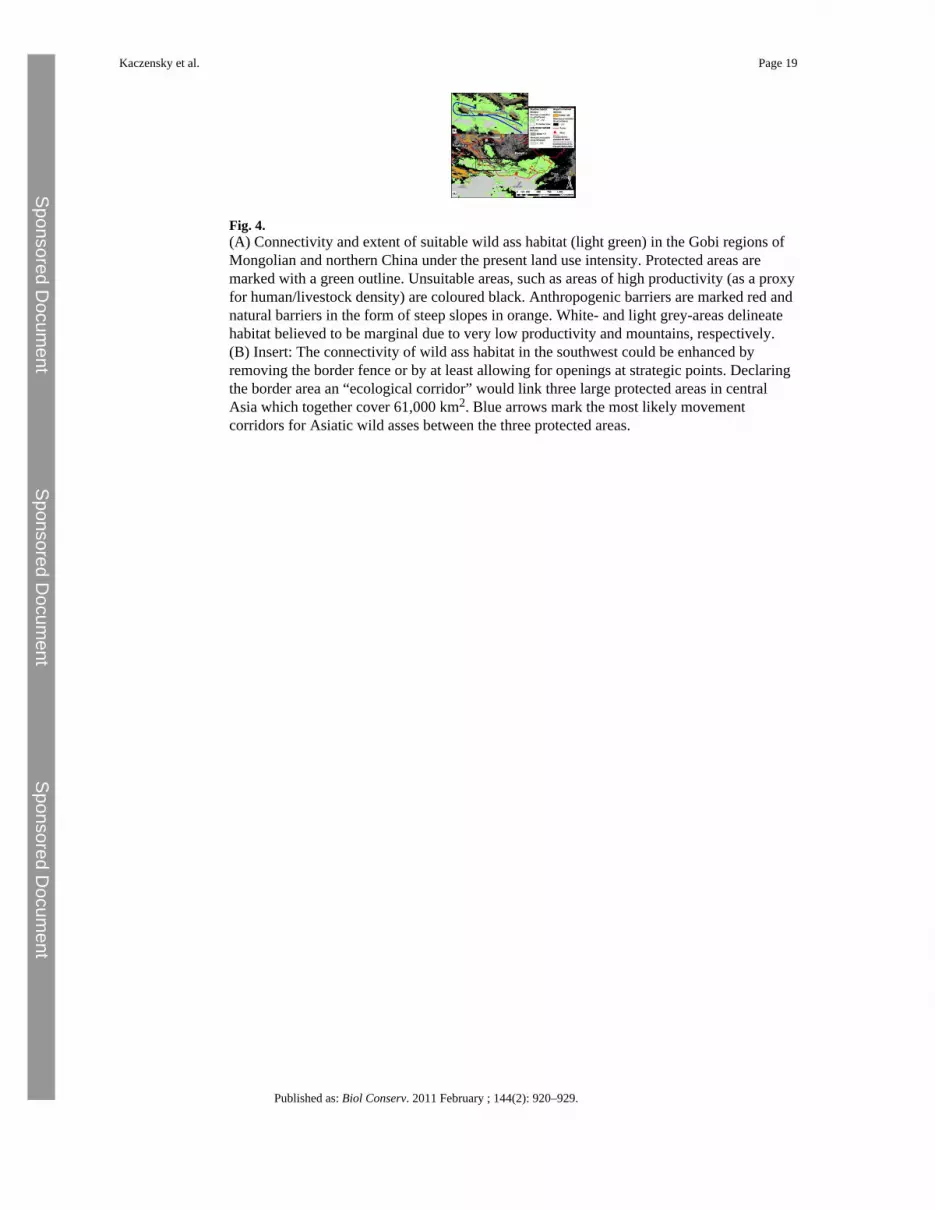
In the Mongolian Gobi the best habitat, under the present human land-use pattern andintensity, stretches more or less continuously from the southeastern to the Transaltai Gobi,but connectivity between the Transaltai and Dzungarian Gobi is constrained by mountainranges (Fig. 4). On the east side of the southeast Gobi the habitat is intersected by the fencedUlaanbaatar–Beijing railway, which cuts off about 17,000 km2 of wild ass habitat. In thesouthwest, the suitable habitat stretches far into Xinjiang Province in China, but is presentlycut off by the fence along the international border and over large areas also by highmountains. The habitat in northern Xinjing, including the Kalimalai Nature Reserve,encompasses around 100,000 km2. Southeast of the southeast Gobi, there is another43,000 km2 area that seems to be suitable habitat for wild assess; it runs along a 50 km stripon the Chinese side of the border. Further west, habitat productivity is very low and likelyconstitutes only marginal habitat for wild asses (Fig. 4).
5 Discussion5.1 One single large or several small subpopulations?
The Mongolian wild ass population has a high level of overall microsatellite diversity, bothwithin and among the two subpopulations. The amount of heterozygosity examined in thisstudy is consistent with previous studies on other equids using the correspondingmicrosatellite panel (Krüger et al., 2005). The Asiatic wild ass population in Mongoliashows no evidence of a recent bottleneck as reported for other wide-ranging animal speciessuffering from habitat fragmentation or range constriction (e.g. cougar Puma concolor;McRae et al., 2005). Although alleles in the Mongolian wild ass population are clearlystructured in a non-random way, gene flow is still occurring, suggesting one Gobipopulation. From the number of private alleles, FST values, and Bayesian clustering, the wildass population of the Gobi can be subdivided into 2, rather than 3, subpopulations.BARRIER analysis identified one main genetic boundary differentiating the subpopulationin the Dzungarian from those in the Transaltai and southeastern Gobi.
5.2 Range constriction due to human land use intensitySince the 19th century, the Asiatic wild ass in Mongolia has probably lost as much as 70%of its original range because of human encroachment (Zevegmid and Dawaa, 1973; Denzauand Denzau, 1999). Spatially explicit data on human land use intensity are extremelydifficult to collect over the entire expanse of the highly variable Gobi environment with itssemi-nomadic human population. Wild ass distribution in the southeastern Gobi shows thathuman settlements per se do not seem to be a limiting factor for wild ass distribution(Kaczensky et al., 2006). Average biomass production, on the other hand, seems a goodproxy for human/livestock presence. In the 19th century, when the human population was<500,000, wild asses ranged north into areas with a mean productivity <500 gC/m2/year.Today, with a human population numbering >2.6 million and livestock numbers >40millions (National Statistical Office of Mongolia 2008), wild asses have become confined toareas south of the 250 gC/m2/year productivity isocline. This suggests that the presentcoexistence of wild asses with humans and their livestock in the Gobi is sensitive toincreases in human/livestock densities. This negative relationship needs to be consideredwhen discussing means to improve livestock grazing and access to remote Gobi pastures, forexample by providing wells (Kaczensky et al. 2006). The low population density of wildasses in the Transaltai Gobi (Reading et al., 2001; Lhagvasuren, 2007), on the other hand,suggests that a mean productivity <100 gC/m2/year likely constitutes only marginal habitatfor wild ass. Previous analysis suggests a high flexibility in respect to the use of differentplant communities (Kaczensky et al., 2008); thus, vegetation type is unlikely to be of highimportance for wild ass distribution.
Kaczensky et al. Page 9
Published as: Biol Conserv. 2011 February ; 144(2): 920–929.
Under the current land-use pattern and intensity, areas between 100 and 250 gC/m2/yearseem to provide wild ass with the best available habitat. However, our assessment is basedon observed use on the order of the distribution range (first order selection) and home rangelevel (second order selection), rather than on statistical analysis on the third-order habitatselection within the home range (Johnson 1980). Consequently we cannot provide and neverattempted to provide hard boundaries or a truly quantitative assessment of the effects ofproductivity, slope and fences. Rather our habitat and connectivity map is meant to providea first large-scale assessment and planning tool. On a local scale, the availability of water, aswell as socioeconomic and political factors, are likely to modify this general, landscape-level pattern. The northwestern part of the southeast Gobi receives a much higher human use(also see Supporting Data Appendix S5) than expected from the average productivity andasses seem to no longer occur in these areas. Mining activity and the availability of wells area likely explanation for the disproportionately higher human presence. On the other hand,large portions of the Eastern Steppe have a much lower human population density than onewould expect based on the productivity layer. The reasons for this deviation are the longdistances to the nearest urban centers and the population exodus during the Russian–Japanese conflict in 1939. Thus available wild ass habitat might actually stretch muchfurther east into the higher productivity areas of the Eastern Steppe than our 250 gC/m2/yearlimit would indicate.
5.3 Movement barriersThe population genetics data identified a potential barrier between the subpopulations in theTransaltai- and Dzungarian Gobi. Home ranges of radio-collared wild asses mainlyencompassed flat terrain and few wild ass positions fell into steep terrain. In the DzungarianGobi wild asses even select against slope within their home ranges (Kaczensky et al. 2008).Thus, the barrier effect between the Dzungarian and Transaltai Gobi can be best explainedby the topography between these two bio-geographic regions. However, we believe that thebarrier effect by the mountains has likely been enhanced by the construction (in the 1970s)and the recent upgrading (in the 1980s and 1990s) of the border fence between Mongoliaand China. Fences have been identified as serious movement barriers for Mongolian gazelles(Ito et al., 2005), and our telemetry data and direct observations (see Supporting DataAppendix S7) suggest the same barrier effect for Asiatic wild asses. Between the Transaltaiand Dzungarian Gobi the border fence largely inhibits animals from moving south of theborder mountains, from where they could reach the Great Gobi B SPA via China along largevalleys from the south or through the plains from the west. Nowadays only the valleys onthe east side of Great Gobi B SPA allow for population exchange between the Dzungarianand the rest of the Mongolian Gobi (Fig. 4).
In the east, the Ulaanbaatar–Beijing railway line cuts off about 17,000 km2 of suitable wildass habitat, where asses have basically disappeared (P. Kaczensky, unpubl. data). Althoughthe fence is interrupted by small under- and over-passes to allow herders and their livestockto cross, none of these crossing structures have been designed or positioned for wildlife use(see Supporting Data Appendix S7). Mongolian gazelles, which occur on both sides of therailway, seem largely unable to find or use these openings (Ito et al., 2008) and the longwalk of one collared wild ass parallel to the fence suggests the same for wild asses (Fig. 1).
The lack of wildlife crossing structures makes re-colonization of the suitable habitat on theeast side of the Ulaanbaatar–Beijing railway rather unlikely. Mitigation measures, like well-designed under- or over-passes, can reduce the barrier effect of fenced transportation routes(e.g. Luell et al., 2003; Clevenger and Huijser, 2009) and would be desirable for theUlaanbaatar–Beijing railway. Such measures would not only help wild ass restoration east ofthe railway, but would also improve the connectivity among subpopulations of Mongolian
Kaczensky et al. Page 10
Published as: Biol Conserv. 2011 February ; 144(2): 920–929.
Sponsored Docum
ent Sponsored D
ocument
Sponsored Docum
ent
gazelle (Ito et al., 2005; Mueller et al., 2008), and most likely would also benefit goiteredgazelle and argali wild sheep.
5.4 Protected areas are an important piece of a larger pictureProtected areas cover 29% of the wild ass range in the Mongolian Gobi. The two strictlyprotected areas in the Dzungarian and Transaltai Gobi seem large enough to provide wildass and other large ungulates with sufficient water and pasture year-round (Kaczensky et al.,2008). However, the situation is quite different in the southeastern Gobi, which likelyhouses the majority of the Mongolian wild ass population (Reading et al., 2001;Lhagvasuren 2007; B. Lkhagvasuren and S. Strindberg, unpubl. data). In this regionindividual ranges of the wild asses are very large. We believe that the driving force behindthe observed large-scale wild ass movements are the strong spatio-temporal dynamicsrelated to the availability of pastures, forage, and water in the southeastern Gobi (Kaczenskyet al., 2006). A similar relationship has been shown for Mongolian gazelles (Ito et al. 2006;Mueller et al. 2008). Consequently, conservation of wild asses and other plain ungulates inthe southeastern Gobi cannot focus on protected areas alone, but needs to incorporate thesurrounding multi-use landscapes.
This is not an easy task because the southeastern Gobi is rich in mineral deposits, andexploration and mining activities are increasing (World Bank, 2006). In the area around theSmall Gobi SPA, a single company holds 117,000 km2 of mineral concessions. To allowtransport to China, roads and parallel railway track are either being upgraded or underconstruction in at least two locations (Fig. 4; Ivanhoe Mines, 2010). These transportationcorridors cut through prime wild ass habitat and will likely result in the separation of theSmall Gobi A from the Small Gobi B SPA (Kaczensky et al., 2006) and on a larger scalewill inhibit, or greatly reduce, movements from the southeast Gobi west into the Transaltaiand Dzungarian Gobi. Thus, without imposition of appropriate mitigation measures, thesetransport corridors threaten to disrupt one of the few remaining intact ecosystems allowingfor mass migrations of large plain ungulates in central Asia.
5.5 Transboundary protected area networkAlthough the Dzungarian Gobi constitutes a rather distinct bio-geographic unit surroundedby natural movement barriers, the border fence further aggravates population exchange ofplains ungulates with the rest of the Mongolian Gobi (via corridors that pass through China).Furthermore, northern Xinjiang and especially Kalimalai Nature Reserve seem to still housea wild ass population, possibly numbering several thousand individuals (Yang 2007, Yangunpubl. data). According to our wild ass habitat assessment, northern Xinjiang has about100,000 km2 of suitable wild ass habitat continuous with the Mongolian Gobi. XinjiangProvince is home to a large Uigur minority and for fear of riots firearm ownership is strictlyregulated and controlled. This largely inhibits poaching, which seems to be a major problemin the adjacent Chinese province of Inner Mongolia further east (Wang and Schaller, 1996;Reading et al., 1998).
Although wild asses have been observed on the Chinese side of the fence (W. Yang, unpubl.data) and crossings have been documented (P. Kaczensky unpubl. data), an exchange withthe Mongolian population seems severely restricted to times when the fence is breached(e.g., by smugglers/poachers) or to certain locations where the fence is not continuous (e.g.,in steep terrain; see Supporting Data Appendix S8). The continuity and spatial extant of thewild ass population in the Gobi would certainly profit from a coordinated transboundaryconservation strategy. The border areas in northern Xinjiang are almost uninhabited, andthey link three large important protected areas totaling 70,300 km2: Kalimalai NatureReserve in Xinjiang China, and Great Gobi A and B SPA in Mongolia. The entire border
Kaczensky et al. Page 11
Published as: Biol Conserv. 2011 February ; 144(2): 920–929.
strip should be given the status of a “transboundary ecological corridor” and should ideallybe managed as a peace park (Ali, 2007). Opening the fence, at least in places, would mostlikely also allow for the expansion or re-connection of other rare mammal populations likewild Bactrian camels or re-introduced Przewalski’s horses.
ReferencesAliS.H.Introduction: a natural connection between ecology and peace?AliS.H.Peace Parks:
Conservation and Conflict Resolution2007MIT PressCambridge, MA118BergerJ.The last mile: how to sustain long-distance migration in mammalsConservation
Biology182004320331BolgerD.T.NewmarkW.D.MorrisonT.A.DoakD.F.The need for integrative approaches to understand
and conserve migratory ungulatesEcological Letters1120076377ClarkE.L.MunkhbatJ.DulamtserenS.BaillieJ.E.M.BatsaikhanN.SamiyaR.StubbeM.Mongolian Red List
of Mammals. Regional Red List Series, vol. 12006Zoological Society of LondonLondonClevengerA.P.HuijserM.P.Handbook for Design and Evaluation of Wildlife Crossing Structures in
North America2009Federal Highway Administration (FHWA)Washington, DC,USA<http://www.westerntransportationinstitute.org/documents/reports/425259_Final_Report.pdf>
CMS, 2002. Convention on Migratory Species. Appendix II. <http://www.cms.int/documents/appendix/cms_app2.htm>.
DenzauG.DenzauH.Wildesel1999Jan Thorbecke VerlagStuttgart, Germany(in German)DixonJ.D.OliM.K.WootenM.C.EasonT.H.McCownJ.W.PaetkauD.Effectiveness of a regional corridor
in connecting two Florida black bear populationsConservation Biology2200615516216909668EppsC.W.WehausenJ.D.BleichV.C.TorresS.G.BrasharesJ.S.Optimizing dispersal and corridor models
using landscape geneticsJournal of Applied Ecology442007714724EvannoG.RegnautS.GoudetJ.Detecting the number of clusters of individuals using the software
STRUCTURE: a simulation studyMolecular Ecology1420052611262015969739FergusonS.H.ElkieP.C.Seasonal movement patterns of woodland caribouJournal of
Zoology2622004125134Fernandez-GimenezM.E.Reconsidering the role of absentee herd owners: a view from
MongoliaHuman Ecology271999127Fernandez-GimenezM.E.BatbuyanB.Law and disorder: local implementation of Mongolia’s land
lawDevelopment and Change352004141165FrairJ.L.MerrillE.H.BeyerH.L.MoralesJ.M.Thresholds in landscape connectivity and mortality risks in
response to growing road networksJournal of Applied Ecology45200815041513FrankhamR.Genetics and extinctionBiological Conservation1262005131140GeistJ.KuehnR.Genetic diversity and differentiation of Central European freshwater pearl mussel
(Margaritifera margaritifera) populations: Implications for conservation andmanagementMolecular Ecology14200542543915660935
Goudet, J., 2001. Fstat, a program to estimate and test gene diversities and fixation indices, version2.9.3. <http://www2.unil.ch/popgen/softwares/fstat.htm>.
GraysonR.Anatomy of the people’s gold rush in modern MongoliaWorld PlacerJournal72007166<http://www.mine.mn/WPJ7_1_Peoples_Gold_Rush.pdf>
HarringtonJ.L.ConoverM.R.Characteristics of ungulate behavior and mortality associated with wirefencesWildlife Society Bulletin34200612951305
HaysG.C.AkessonS.GodleyB.J.LuschiP.SantidrianP.The implications of location accuracy for theinterpretation of satellite-tracking dataAnimal Behaviour61200110351040
HilbigW.The vegetation of Mongolia1995SPB Academic PublishingAmsterdam, Netherlands andNew York, USA
HoldereggerR.WagnerH.H.Landscape geneticsBioScience58200819207ItoT.Y.MuraN.LhagvasurenB.EnkhbilegD.TakasukiS.TsunekawaA.JiangZ.Preliminary evidence of a
barrier effect of a railroad on the migration of Mongolian gazellesConservationBiology192005945948
Kaczensky et al. Page 12
Published as: Biol Conserv. 2011 February ; 144(2): 920–929.
ItoT.Y.MiuraN.LhagvasurenB.EnkhbilegD.TakasukiS.TsunekawaA.JiangZ.Satellite tracking ofMongolian gazelles (Procapra gutturosa) and habitat shifts in their seasonal rangesJournal ofZoology2692006291298
ItoT.Y.BuuveibaatarB.LhagvasurenB.TakatsukiS.TsunekawaA.One-sided barrier impact of aninternational railroad on Mongolian gazellesJournal of Wildlife Management722008940943
Ivanhoe Mines, 2010. Oyu Tolgoi Project. Technical Report June 2010. Available at: <http://www.ivanhoemines.com/i/pdf/IDP10_June062010.PDF>.
JakobssonM.RosenbergN.A.CLUMPP: a cluster matching and permutation program for dealing withlabel switching and multimodality in analysis of populationstructureBioinformatics2320071801180617485429
JohnsonD.H.The comparison of usage and availability measurements for evaluating resourcepreferenceEcology6119806571
Kaczensky, P., Sheehy, D.P., Johnson, D.E., Walzer, C., Lhkagvasuren, D., Sheehy, C.M., 2006.Room to roam? The threat to khulan (Wild Ass) from human intrusion. Mongolia DiscussionPapers, East Asia and Pacific Environment and Social Development Departure. Washington, DC,World Bank.
KaczenskyP.GanbaatarO.von WehrdenH.WalzerC.Resource selection by sympatric wild equids in theMongolian GobiJournal of Applied Ecology45200817621769
Kaczensky, P., Ito, T.Y., Walzer, C., accepted for publication. Satellite telemetry of large mammals inMongolia: what expectations should we have for collar function? Wildlife Biology in Practice.
Kramer-SchadtS.RevillaE.WiegandT.BreitenmoserU.Fragmented landscapes, road mortality and patchconnectivity: modelling influences on the dispersal of Eurasian LynxJournal of AppliedEcology412004711723
KrügerK.GaillardC.StranzingerG.RiederS.Phylogenetic analysis and species allocation of individualequids using microsatellite dataJournal of Animal Breeding and Genetics1222005788616130461
KuehnR.KaczenskyP.LkhagvasurenD.PietschS.WalzerC.Differentiation of meat samples fromdomestic horses (Equus caballus) and Asiatic wild asses (Equus hemionus) using a speciesspecific restriction site in the mitochondrial cytochrome b regionMongolian Journal of BiologicalScience420065560
LankesterK.van ApeldoornR.MeelisE.VerboomJ.Management perspectives for populations of theEurasian badger (Meles meles) in a fragmented landscapeJournal of AppliedEcology281991561573
LhagvasurenB.Population assessment of khulan (Equus hemionus) in MongoliaExploration into theBiological Resources of Mongolia1020074548
Luell, B., Bekker, G.J., Cuperus, R., Dufek, J., Fry, G., Hicks, C., Hlava, V., Keller, V., Rosell, C.,Sangwine, T., Torslov, N., Wandall, B. le Maire (Eds)., 2003. Wildlife and Traffic: A EuropeanHandbook for Identifying Conflicts and Designing Solutions. European Co-operation in the Fieldof Scientific and Technical Research (COST Transport). Brussels, Belgium. <http://www.iene.info/cost-341/COST%20341-handbook.pdf>.
LovariS.SforziA.ScalaC.FicoR.Mortality parameters of the wolf in Italy: does the wolf keep himselffrom the door?Journal of Zoology London2722007117124
ManniF.GuérardE.HeyerE.Geographic patterns of (genetic, morphologic, linguistic) variation: howbarriers can be detected by using Monmonier’s algorithmHuman Biology762004173190
McRaeB.H.BeierP.DewaldL.E.HuynhL.Y.KeimP.Habitat barriers limit gene flow and illuminatehistorical events in a wide-ranging carnivore, the American pumaMolecularEcology1420051965197715910319
Milner-GullandE.J.BukreevaO.M.CoulsonT.LushchekinaA.A.KholodovaM.V.BekenovA.B.GrachevI.A.Reproductive collapse in saiga antelope haremsNature4222003125
MonmonierM.Maximum-difference barriers: an alternative numerical regionalizationmethodGeographical Analysis31973245261
Kaczensky et al. Page 13
Published as: Biol Conserv. 2011 February ; 144(2): 920–929.
Sponsored Docum
ent Sponsored D
ocument
Sponsored Docum
ent
MuellerT.OlsonK.A.FullerT.K.SchallerG.B.MurrayM.G.LeimgruberP.In search of forage: predictingdynamic habitats of Mongolian gazelles using satellite-based estimates of vegetationproductivityJournal of Applied Ecology452008649658
National Statistical Office of Mongolia, 2008. Yearbook 2007. <http://www.statis.mn/v3/index2.php?page=free_access>.
PrinceS.D.GowardS.N.Global primary production: a remote sensing approachJournal ofBiogeography221995815833
PritchardJ.K.StephensM.DonnellyP.Inference of population structure using multilocus genotypedataGenetics155200094595910835412
QuiJ.Riding on the roof of the worldNature449200739840217898743R Development Core Team, 2005. R: A Language and Environment for Statistical Computing. R
Foundation for Statistical Computing, Vienna, Austria.RaymondM.RoussetF.GENEPOP (Version 1.2): population genetics software for exact tests and
ecumenicismJournal of Heredity861995248249RaymondM.RoussetF.An exact test for population differentiationEvolution49199512831286ReadingR.P.MixH.LhagvasurenB.TseveenmyadagN.The commercial harvest of wildlife in Dornod
Aimag, MongoliaJournal of Wildlife Management6219985971ReadingR.P.MixH.M.LhagvasurenB.FehC.KaneD.P.DulamtserenS.EnkhboldS.Status and distribution
of khulan (Equus hemionus) in MongoliaJournal of Zoology, London2542001381389RileyS.P.D.PollingerJ.P.SauvajotR.M.YorkE.C.BromleyC.FullerT.K.WayneR.K.A southern California
freeway is a physical and social barrier to gene flow in carnivoresMolecularEcology1520061733174116689893
TaberletP.LuikartG.Non-invasive genetic sampling and individual identificationBiological Journal ofthe Linnean Society6819994155
ThirgoodS.MosserA.ThamS.HopcraftG.MwangomoE.MlengeyaT.KilewoM.FryxellJ.SinclairA.R.E.BornerM.Can parks protect migratory ungulates? The case of the Serengeti wildebeestAnimalConservation72004113120
van NoordwijkA.J.The interaction of inbreeding depression and environmental stochasticity in the riskof extinction of small populationsLoeschckeV.TomiukJ.JainS.K.ConservationGenetics1994Birkhäuser VerlagBasel, Switzerland131146
VernesiC.BrufordM.W.BertorelleG.PecchioliR.A.HauffeH.C.Where’s the conservation inconservation genetics?Conservation Biology22200880280418336619
von WehrdenH.WescheK.Relationships between climate, productivity and vegetation in southernMongolian drylandsBasic and Applied Dryland Research12007100120
von Wehrden, H., Hanspach, J., Kaczensky, P., Wesche, K., submitted for publication. Testing theglobal validity of the non-equilibrium theory of rangeland science by evaluating field studiesagainst a common climatic data base. Journal of Biogeography.
WalzerC.KaczenskyP.GanbaatarO.LenggerJ.EnkhsaikhanN.LkhagvasurenD.Capture and anesthesia ofwild Mongolian equids - the Przewalski’s horse (E. ferus przewalskii) and khulan (E.hemionus)Mongolian Journal of Biological Sciences420061928
WangX.SchallerG.B.Status of large mammals in western inner Mongolia, ChinaJournal of East ChinaNormal University12199693104
WeirB.S.CockerhamC.C.Estimating F-statistics for the analysis of populationstructureEvolution38198413581370
WilcoveD.S.WikelskiM.Going, going, gone: is animal migration disappearing?PLOSBiology67200813611364
Wingard, J.R., Zahler, P., 2006. Silent Steppe: The illegal wildlife trade crisis. Mongolia DiscussionPapers, East Asia and Pacific Environment and Social Development Department. World Bank,Washington, DC.
WolanskiE.GeretaE.BornerM.MdumaS.Water, migration and the Serengeti ecosystemAmericanScientist871999526533
Kaczensky et al. Page 14
Published as: Biol Conserv. 2011 February ; 144(2): 920–929.
Sponsored Docum
ent Sponsored D
ocument
Sponsored Docum
ent
World Bank, 2003. From Goats to Coats: Institutional Reform in Mongolia’s Cashmere Sector. ReportNo. 26240-MOG. East Asia and Pacific Environment and Social Development Department. WorldBank, Washington, DC.
World Bank, 2006. A review of Environmental and Social Impacts in the Mining Sector. MongoliaDiscussion Papers, East Asia and Pacific Environment and Social Development Department.World Bank, Washington, DC.
YangW.An overview of the state of Equus hemionus in whole ChinaExploration into the BiologicalResources of Mongolia102007155158
ZevegmidD.DawaaN.Die seltenen Großsäuger der Mongolischen Volksrepublik und ihr SchutzArchivfür Naturschutz und Landschaftsforsch13197387106(in German)
Appendix A Supplementary materialRefer to Web version on PubMed Central for supplementary material.
AcknowledgmentsThis research was conducted within the framework of the Przewalski’s horse re-introduction project of theInternational Takhi Group, in cooperation with the Mongolian Ministry of Nature and Environment and theNational University of Mongolia. Funding was provided by the Austrian Science Foundation (FWF project P14992and P18624) and the World Bank’s Netherlands–Mongolia Trust Fund for Environmental Reform. We thank R.Samjaa, D. Lkhagvasuren, N. Enkhsaikhaan, O. Ganbaatar, B. Mijiddorj, Y. Adiya, D. Enkhbileg, G. Dorvchindorj,Y. Nyambayar, D. Sheehy, T. Whitten, H. von Wehrden, and the local rangers and their families for their much-needed support. The Norwegian Institute for Nature Research (NINA) in Norway provided office space during thesubmission phase of the manuscript and John Linnell provided helpful corrections and suggestions.
Kaczensky et al. Page 15
Published as: Biol Conserv. 2011 February ; 144(2): 920–929.
Sponsored Docum
ent Sponsored D
ocument
Sponsored Docum
ent
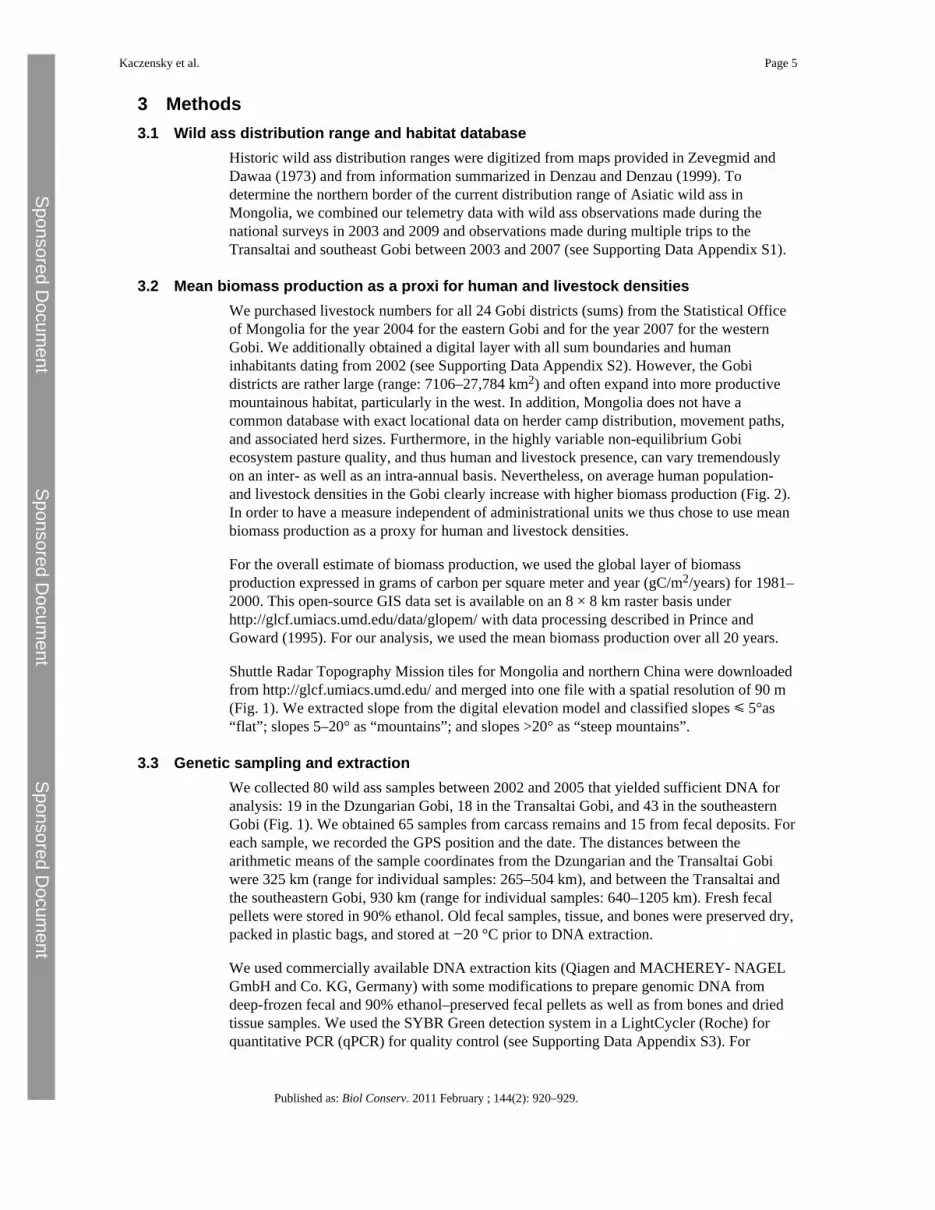
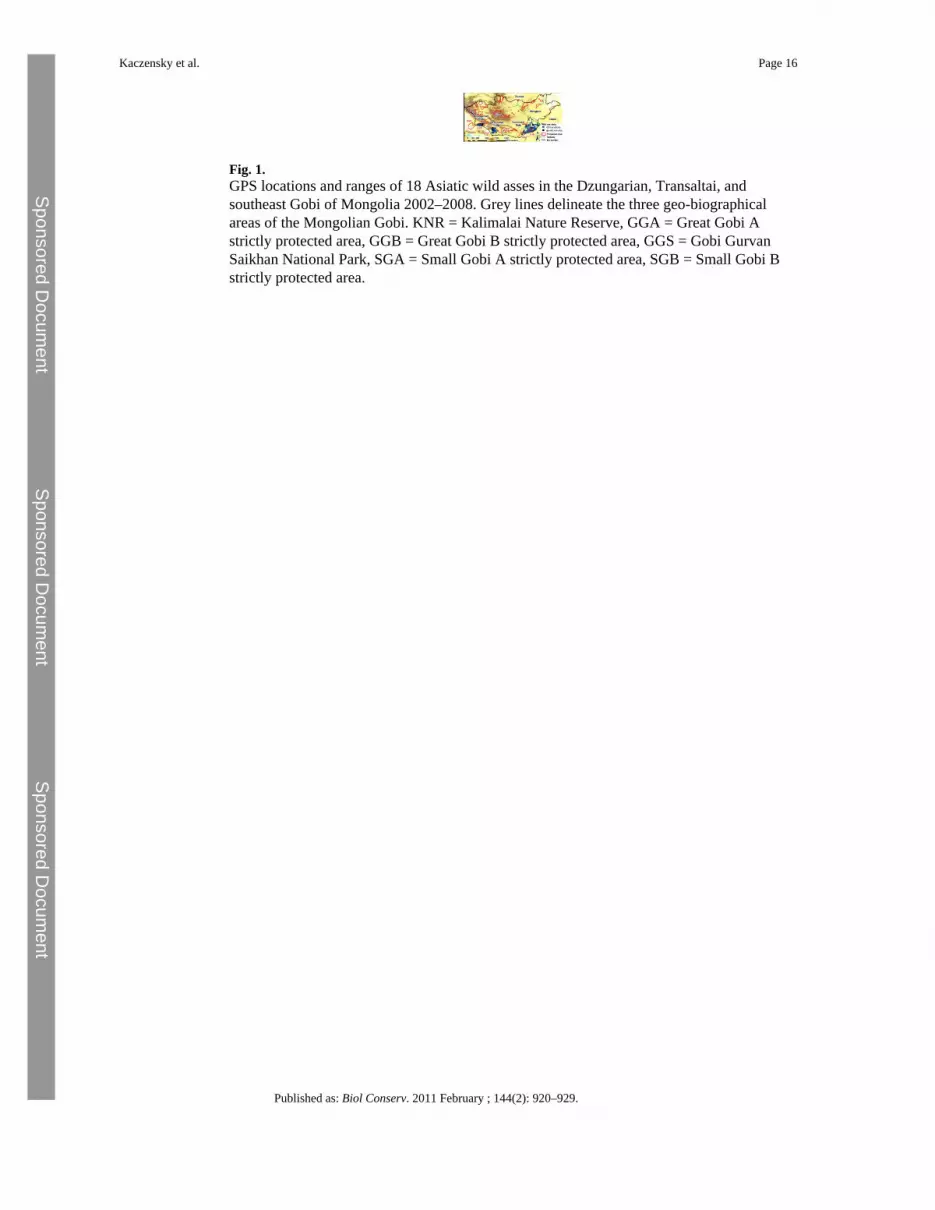
Fig. 1.GPS locations and ranges of 18 Asiatic wild asses in the Dzungarian, Transaltai, andsoutheast Gobi of Mongolia 2002–2008. Grey lines delineate the three geo-biographicalareas of the Mongolian Gobi. KNR = Kalimalai Nature Reserve, GGA = Great Gobi Astrictly protected area, GGB = Great Gobi B strictly protected area, GGS = Gobi GurvanSaikhan National Park, SGA = Small Gobi A strictly protected area, SGB = Small Gobi Bstrictly protected area.
Kaczensky et al. Page 16
Published as: Biol Conserv. 2011 February ; 144(2): 920–929.
Sponsored Docum
ent Sponsored D
ocument
Sponsored Docum
ent
Fig. 2.Relationship between biomass production (expressed in grams of carbon per square meterand year (gC/m2/years)) and human population- and livestock density (expressed as sheepforage units (sfu*)) in the 24 Gobi districts (sums) of Mongolia. *1 sfu is the amount of dryforage needed to feed an average Mongolian sheep for 1 year, which is approximately365 kg (Fernandez-Gimenez 1999). The equivalencies for the other species are: 1 camel = 5sfu, 1 horse = 7 sfu, 1 cow/yak = 6 sfu, 1 goat = 0.9 sfu.
Kaczensky et al. Page 17
Published as: Biol Conserv. 2011 February ; 144(2): 920–929.
Sponsored Docum
ent Sponsored D
ocument
Sponsored Docum
ent
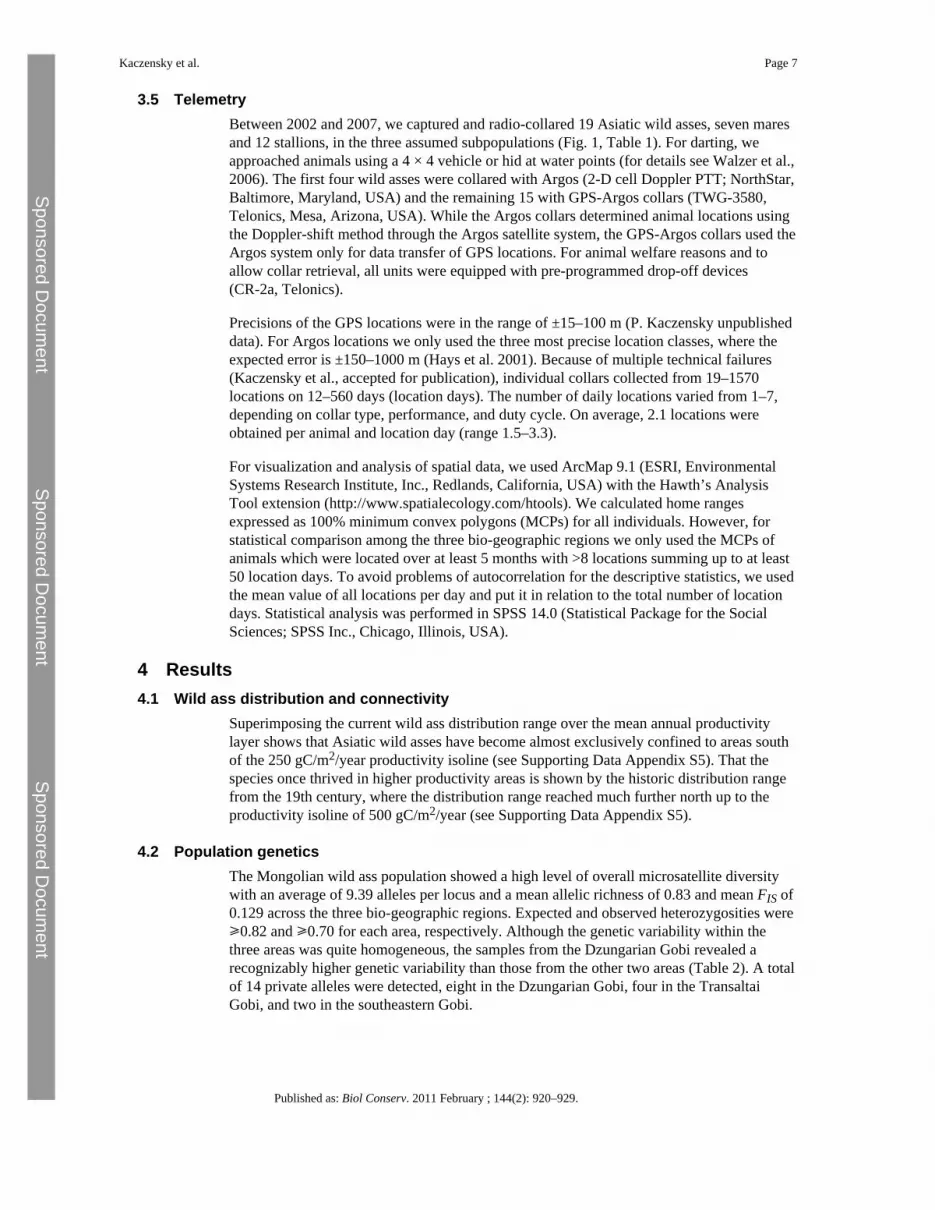
Fig. 3.Synthesis map combining geographical and genetic data. To delineate the spatialorganization of the populations, we combined geographical and genetic data. The synthesismap shows the average proportion of membership of each sample to the two subpopulationsbased on the CLUMPP analysis (dark red = 0% Dzungarian Gobi/100% southeast Gobi;dark blue = 100% Dzungarian Gobi/0% southeast Gobi). The samples are geo-referencedand the membership surface between the samples was interpolated using the krigingprocedure available in the program SurGeE 1.4.0(http://www.geocities.com/miroslavdressler/surgemain.htm). (A) 2-dimensional view ofcolour coded isolines of equal proportions, (B) 3-dimensional view with same colour codingand average proportions of membership for z-value (high z-values delineate samples with ahigh membership value for the southeast Gobi, low z-values delineate samples with a lowmembership value for the southeast Gobi). The numbers at the base of the graph provide thegeographic coordinates.
Kaczensky et al. Page 18
Published as: Biol Conserv. 2011 February ; 144(2): 920–929.
Fig. 4.(A) Connectivity and extent of suitable wild ass habitat (light green) in the Gobi regions ofMongolian and northern China under the present land use intensity. Protected areas aremarked with a green outline. Unsuitable areas, such as areas of high productivity (as a proxyfor human/livestock density) are coloured black. Anthropogenic barriers are marked red andnatural barriers in the form of steep slopes in orange. White- and light grey-areas delineatehabitat believed to be marginal due to very low productivity and mountains, respectively.(B) Insert: The connectivity of wild ass habitat in the southwest could be enhanced byremoving the border fence or by at least allowing for openings at strategic points. Declaringthe border area an “ecological corridor” would link three large protected areas in centralAsia which together cover 61,000 km2. Blue arrows mark the most likely movementcorridors for Asiatic wild asses between the three protected areas.
Kaczensky et al. Page 19
Published as: Biol Conserv. 2011 February ; 144(2): 920–929.
Sponsored Docum
ent Sponsored D
ocument
Sponsored Docum
ent
Sponsored Docum
ent Sponsored D
ocument
Sponsored Docum
ent
Kaczensky et al. Page 20
Tabl
e 1
Loca
tion
para
met
ers f
or 1
8 w
ild a
sses
in th
e M
ongo
lian
Gob
i.
Mon
itori
ng p
erio
dN
MC
Pb (k
m2 )
% L
ocat
ion
days
Col
lar
IDSe
xA
geSt
art
End
LO
Csa
LO
C d
ays
Out
side
of P
Asc
<5 k
m o
f fen
ceB
iom
assd
>250
gC
/m2 /a
Bio
mas
s <10
0 gC
/m2 /a
On
slop
es >
5°O
n sl
opes
>20
°
Dzu
ngar
ian
Gob
i
1152
5⁎Fe
mal
e2
24.0
6.02
01.0
8.04
489
337
6991
3.9
02.
10
4.7
0
1669
0⁎Fe
mal
e3
28.0
6.02
01.0
8.04
1243
549
7368
1.5
00
04.
70
1671
61⁎
Mal
e2
28.0
6.02
15.0
3.03
153
101
6889
7.9
02.
00
00
2292
9M
ale
716
.07.
0303
.08.
0464
834
748
894.
00
3.2
01.
40
2236
61M
ale
416
.07.
0327
.06.
0436
022
158
584.
50
4.1
02.
70
2591
5M
ale
416
.07.
0307
.08.
0442
425
251
210.
40
0.8
02.
00
1671
62⁎
Mal
e10
17.0
7.03
18.0
5.04
111
6751
803.
00
1.5
00
0
Tran
salta
i Gob
i⁎⁎
5884
92M
ale
Adu
lt04
.07.
0615
.09.
0620
1231
60
00
25.0
00
2236
62Fe
mal
eY
oung
21.0
5.07
25.1
0.08
975
495
16,9
070.
40
033
.911
.70.
2
7034
9M
ale
You
ng25
.05.
0704
.03.
0819
1249
710
00
016
.70
5884
81M
ale
7–8
27.0
5.07
01.0
9.07
270
9310
,748
00
014
.019
.40
2573
1Fe
mal
e5–
705
.06.
0721
.12.
0812
0856
014
,695
4.5
00
25.7
30.9
0.7
SE G
obi
58,8
51M
ale
2–3
03.0
7.05
25.0
4.06
993
297
69,9
8893
.65.
10.
33.
00
0
58,8
50Fe
mal
e7
03.0
7.05
19.0
4.06
147
7029
,910
75.7
12.9
05.
70
0
58,8
48Fe
mal
e5
03.0
7.05
20.1
0.06
1570
472
41,0
9175
.016
.70
14.6
00
58,8
54Fe
mal
e11
04.0
7.05
02.1
2.05
6732
39,3
9675
.03.
10
00
0
58,8
53M
ale
5–6
05.0
7.05
03.0
5.06
129
5918
,186
62.7
8.5
01.
70
0
588,
491
Mal
e4
08.0
7.05
30.0
7.05
3518
11,4
0010
00
00
00
58,8
52M
ale
409
.07.
0508
.08.
0611
6836
919
,671
59.1
00
3.5
0.8
0
⁎ Ast
eris
ks m
ark
anim
als t
rack
ed w
ith A
rgos
col
lars
usi
ng th
e D
oppl
er-s
hift
met
hod,
all
othe
r ani
mal
s wer
e tra
cked
usi
ng G
PS te
chno
logy
.
Published as: Biol Conserv. 2011 February ; 144(2): 920–929.
Sponsored Docum
ent Sponsored D
ocument
Sponsored Docum
ent
Kaczensky et al. Page 21⁎⁎
Gre
y sh
adin
g m
arks
ani
mal
s whi
ch w
ere
not i
nclu
ded
in th
e st
atis
tical
com
paris
on o
f hom
e ra
nge
size
s as t
hey
did
not f
ulfil
l the
crit
eria
of h
avin
g be
ing
mon
itore
d >5
mon
ths w
ith >
50 lo
catio
n da
ys m
ore
or le
ss e
venl
y di
strib
uted
ove
r the
mon
itorin
g pe
riod.
a LOC
= lo
catio
n.
b MC
P =
100%
min
imum
con
vex
poly
gon.
c PA =
pro
tect
ed a
rea.
d gC/m
2 /a
= gr
am c
arbo
n pe
r squ
are
met
er a
nd y
ear.
Published as: Biol Conserv. 2011 February ; 144(2): 920–929.
Sponsored Docum
ent Sponsored D
ocument
Sponsored Docum
ent
Kaczensky et al. Page 22
Table 2
Microsatellite diversity indices of Asiatic wild ass in Mongolia.