Coupled conduit and atmospheric dispersal dynamics of the AD 79 Plinian eruption of Vesuvius Augusto Neri a; , Paolo Papale b , Dario Del Seppia c , Roberto Santacroce c a Consiglio Nazionale delle Ricerche, Istituto di Geoscienze e Georisorse, Dipartimento di Scienze della Terra, Pisa, Italy b Istituto Nazionale di Geo¢sica e Vulcanologia, Dipartimento di Scienze della Terra, Pisa, Italy c Dipartimento di Scienze della Terra, Universita ' degli Studi di Pisa, Pisa, Italy Received 21 October 2001; accepted 26 May 2002 Abstract The AD 79 eruption of Vesuvius is certainly one of the most investigated explosive eruptions in the world. This makes it particularly suitable for the application of numerical models since we can be quite confident about input data, and the model predictions can be compared with field-based reconstruction of the eruption dynamics. Magma ascent along the volcanic conduit and the dispersal of pyroclasts in the atmosphere were simulated. The conduit and atmospheric domain were coupled through the flow conditions computed at the conduit exit. We simulated two different peak phases of the eruption which correspond to the emplacement of the white and gray magma types that produced Plinian fallout deposits with interlayered pyroclastic flow units during the gray phase. The input data, independently constrained and representative of each of the two eruptive phases, consist of liquid magma composition, crystal and water content, mass flow rate, and pressure^temperature^depth of the magma at the conduit entrance. A parametric study was performed on the less constrained variables such as microlite content of magma, pressure at the conduit entrance, and particle size representative of the eruptive mixture. Numerical results are substantially consistent with the reconstructed eruptive dynamics. In particular, the white eruption phase is found to lead to a fully buoyant eruption plume in all cases investigated, whereas the gray phase shows a more transitional character, i.e. the simultaneous production of a buoyant convective plume and pyroclastic surges, with a significant influence of the microlite content of magma in determining the partition of pyroclast mass between convective plumes and pyroclastic flows. ß 2002 Elsevier Science B.V. All rights reserved. Keywords: numerical simulation; conduit dynamics; dispersal dynamics; Vesuvius 1. Introduction Vesuvius roared into the historical records in AD 79 with one of the most famous volcanic eruptions known to man. This was also the ¢rst eruption for which a detailed eyewitness descrip- tion is available. The AD 79 eruption has been, and continues to be, studied by a great number of 0377-0273 / 02 / $ ^ see front matter ß 2002 Elsevier Science B.V. All rights reserved. PII:S0377-0273(02)00381-5 * Corresponding author. Tel.: +38-50-846263; Fax: +39-50-500675. E-mail address: [email protected](A. Neri). Journal of Volcanology and Geothermal Research 120 (2002) 141^160 www.elsevier.com/locate/jvolgeores
Transcript
Coupled conduit and atmospheric dispersal dynamics ofthe AD 79 Plinian eruption of Vesuvius
Augusto Neri a;�, Paolo Papale b, Dario Del Seppia c, Roberto Santacroce c
a Consiglio Nazionale delle Ricerche, Istituto di Geoscienze e Georisorse, Dipartimento di Scienze della Terra, Pisa, Italyb Istituto Nazionale di Geo¢sica e Vulcanologia, Dipartimento di Scienze della Terra, Pisa, Italy
c Dipartimento di Scienze della Terra, Universita' degli Studi di Pisa, Pisa, Italy
Received 21 October 2001; accepted 26 May 2002
Abstract
The AD 79 eruption of Vesuvius is certainly one of the most investigated explosive eruptions in the world. Thismakes it particularly suitable for the application of numerical models since we can be quite confident about inputdata, and the model predictions can be compared with field-based reconstruction of the eruption dynamics. Magmaascent along the volcanic conduit and the dispersal of pyroclasts in the atmosphere were simulated. The conduit andatmospheric domain were coupled through the flow conditions computed at the conduit exit. We simulated twodifferent peak phases of the eruption which correspond to the emplacement of the white and gray magma types thatproduced Plinian fallout deposits with interlayered pyroclastic flow units during the gray phase. The input data,independently constrained and representative of each of the two eruptive phases, consist of liquid magmacomposition, crystal and water content, mass flow rate, and pressure^temperature^depth of the magma at the conduitentrance. A parametric study was performed on the less constrained variables such as microlite content of magma,pressure at the conduit entrance, and particle size representative of the eruptive mixture. Numerical results aresubstantially consistent with the reconstructed eruptive dynamics. In particular, the white eruption phase is found tolead to a fully buoyant eruption plume in all cases investigated, whereas the gray phase shows a more transitionalcharacter, i.e. the simultaneous production of a buoyant convective plume and pyroclastic surges, with a significantinfluence of the microlite content of magma in determining the partition of pyroclast mass between convective plumesand pyroclastic flows.2 2002 Elsevier Science B.V. All rights reserved.
Vesuvius roared into the historical records inAD 79 with one of the most famous volcaniceruptions known to man. This was also the ¢rsteruption for which a detailed eyewitness descrip-tion is available. The AD 79 eruption has been,and continues to be, studied by a great number of
0377-0273 / 02 / $ ^ see front matter 2 2002 Elsevier Science B.V. All rights reserved.PII: S 0 3 7 7 - 0 2 7 3 ( 0 2 ) 0 0 3 8 1 - 5
scientists. It is constantly being re-interpreted fol-lowing the progress made in the ¢eld of volcanol-ogy (Lirer et al., 1973, 1993; Sheridan et al.,1981; Sigurdsson et al., 1982, 1985, 1990; Careyand Sigurdsson, 1987; Barberi et al., 1989; Ci-vetta et al., 1991; Cioni et al., 1992, 1995, 1999;Cioni, 2000). Due to the wide interest and thefascination that this eruption exerts on volcanol-ogists, as well as to our generally good knowledgeof the volcanic processes and erupted magmaproperties, this eruption has often been selectedfor the application of numerical models (Macedo-nio et al., 1988, 1994; Dobran, 1992; Papale andDobran, 1993; Dobran et al., 1994). On the onehand, the AD 79 eruption represents a good his-torical test-case for comparing data to numericalmodel outputs. On the other hand, numerical sim-ulations contribute to understanding the basicphenomena and also to the quanti¢cation of pro-cesses and parameters that might be of criticalimportance in the eruption dynamics and thatcan not be investigated by any other methods.
The AD 79 eruption can be roughly dividedinto three main phases (Sigurdsson et al., 1985;Barberi et al., 1989; Civetta et al., 1991; Cioni etal., 1992, 1995): (1) an initial phreato-magmaticphase of conduit opening; (2) a main magmatic‘Plinian’ phase producing a buoyant eruptionplume with some partial column collapse epi-sodes; (3) a phreato-magmatic phase, associatedwith the caldera collapse, producing pyroclastic£ows and surges. In total, the Plinian stage (in-cluding both the convecting column and associ-ated pyroclastic surges) lasted 18 h, during whicha phonolitic ‘white’ magma, followed by a tephri-phonolitic ‘gray’ magma, was erupted (Sigurdssonet al., 1982, 1985, 1990; Carey and Sigurdsson,1987; Cioni et al., 1992). The origin of thesetwo magma types is interpreted as due to the ex-istence of a strati¢ed magma chamber feeding theAD 79 eruption. In this interpretation, the whitemagma represents the uppermost portion of thereservoir, whereas the gray magma is the result ofthe syn-eruptive mixing between the white magmaand a ma¢c end-member which was never eruptedwithout being mixed (Sigurdsson et al., 1990; Ci-vetta et al., 1991; Cioni et al., 1995; Marianelli etal., 1995; Cioni, 2000). About 80% of the magma
was erupted during the Plinian stage (Cioni,2000). Based on ¢eld reconstruction and applica-tion of clast dispersal modeling, the volcanic col-umn was found to have undergone signi¢cantheight variations, with peaks corresponding ap-proximately to 26^27 and 32^33 km during thedischarge of the white and gray magmas, respec-tively (Sigurdsson et al., 1985; Carey and Sigurds-son, 1987). The transition from white to graypumice (for simplicity in this paper we indicatewith ‘white’ and ‘gray’ either the two pumicetypes or the corresponding magma compositions,volcanic deposits, and eruptive phases) is sharp inthe deposits and is marked by the occurrence of a¢rst pyroclastic surge unit (Sigurdsson et al.,1985; Cioni et al., 1992). Other pyroclastic surgesare interbedded in the gray pumice fallout depositwith their frequency increasing upwards, whereasthey are completely absent in the white pumicedeposit (Sigurdsson et al., 1985, 1990; Careyand Sigurdsson, 1987; Cioni et al., 1992).
In this research we carried out a ¢rst-ordercomparison between the reconstructed dynamicsderiving from ¢eld evidence and numerical simu-lations. In order to do this, we used the results ofchemical, mineralogical, and petrographic studieson the eruption products (Barberi and Leoni,1980; Barberi et al., 1981; Sigurdsson et al.,1982, 1985, 1990 Cioni et al., 1992, 1995, 1999;Cioni, 2000), in conjunction with numerical mod-els of magma ascent and gas^pyroclast dispersaldynamics (Papale and Dobran, 1994; Papale etal., 1998; Neri et al., 1998a,b, 2001). Such a com-parison was necessarily limited to the study oflarge-scale dynamics of two speci¢c moments ofthe Plinian phase of the eruption (correspondingto the peak discharge rates of the white and grayphases), since most eruption parameters are onlyknown for this phase and because the numericalmodels adopted cannot be applied to the phreato-magmatic phases of the eruption. In order to ob-tain a quantitative and consistent picture of large-scale features of the eruption dynamics, the mag-ma properties and conditions calculated at theconduit exit by using the magma ascent modellingwere employed as steady boundary conditions forthe atmospheric dispersal modeling. Simulationresults are presented for both domains investi-
VOLGEO 2526 4-11-02
A. Neri et al. / Journal of Volcanology and Geothermal Research 120 (2002) 141^160142
gated (i.e. conduit and atmosphere) and their con-sistencies with ¢eld evidences are discussed.
2. Simulation approach and overview of physicalmodels
The dynamics of the Plinian phases of the AD79 Vesuvius eruption were investigated by model-ing the ascent of magma along the volcanic con-duit and the subsequent pyroclastic dispersal inthe atmosphere. In the present study we simulatethe eruption dynamics corresponding to the peakdischarge rates for the white and gray Plinianphases of the eruption. These eruptive phasesare particularly suitable for the modeling becausesome eruption parameters, such as the mass £owrate, can be more precisely estimated and becausethe conduit £ow dynamics can be considered ap-proximately stationary and therefore can be de-scribed by steady-state models. This is evident ifwe consider that the time scale of magma ascent isone to two orders of magnitude smaller than thetime scale of the Plinian phases we are investigat-ing (several minutes vs. several hours). As a con-sequence, we do not simulate the temporal evolu-tion of the eruption during the Plinian phase butonly some main features of the eruption dynamicscharacterizing two speci¢c and signi¢cant mo-ments of the eruptive event. For each simulatederuptive phase we selected input data representingthe liquid magma composition, crystal and watercontents, temperature, mass £ow rate, as well asmagma chamber pressure and average particlesize after fragmentation. For the gray magma,which is considered the product of syn-eruptivemixing, we assumed that such a mixing was com-pleted before the magma entered the conduit.
Before discussing the input data in greater de-tail a summary of the physical models used isgiven in the following two subsections. A morecomplete description of the physics and numericalaspects of the magma ascent and gas^pyroclastdispersal models used, together with their assump-tions, limits, and predictive capability, can befound in Papale and Dobran (1994), Papale(1998, 2001), Papale et al. (1998), Neri et al.(1998a,b, 2001), and references therein.
2.1. Magma ascent model
Magma ascent simulations were performed byapplying the model used in Papale et al. (1998,2001). This is a two-phase £ow model which de-scribes the steady-state and isothermal £ow of amagmatic mixture from the magma chamberroof to the conduit exit (or vent) into the atmo-sphere. The conduit is considered to have a con-stant circular cross-section. The magma is repre-sented as a single-phase homogeneous mixturebelow the nucleation level and as a two-phasemixture above it. In particular, the model solvesthe two-phase £ow equations of the bubbly £owregime between the nucleation and fragmentationlevels and the two-phase £ow equations of thegas^droplet regime between the fragmentationlevel and the vent, or conduit exit. In the bubbly£ow regime the two phases consist of a homoge-neous continuous phase, made up of liquid mag-ma and crystals, and a bubble phase, made up ofvolatiles exsolved from magma. Although themodel can handle a two-component volatilephase made up of H2O+CO2, the simulationspresented here are made by neglecting CO2 sincesuch volatile component is not accurately knownfor the AD 79 eruption. Magmatic properties,such as viscosity, are evaluated as a function ofmagma composition in terms of 10 major oxidesplus dissolved water, and corrected to accountfor gas bubbles and crystal content. The amountof exsolved water is determined using the modelof Papale (1997) expressing water solubility as afunction of pressure, temperature, and liquidmagma composition. Above the fragmentationlevel, the gas phase becomes continuous andthe dispersed magmatic particles are consideredof uniform size and properties. Despite the exis-tence of more recent fragmentation models (Pa-pale, 1999; Melnik, 2000), in the present workwe assumed that fragmentation occurs at a voidfraction of 0.75, in accordance with vesicularitydata on white and gray pumice by Cioni et al.(1995) and Cioni (2000). Typical simulation re-sults consist of pressure, velocity, magmaticproperties, and gas/solid fraction distributionsalong the vertical conduit as well as of £owconditions at the conduit outlet. The latter are
VOLGEO 2526 4-11-02
A. Neri et al. / Journal of Volcanology and Geothermal Research 120 (2002) 141^160 143
used as boundary conditions for the dispersalmodel.
2.2. Pyroclastic dispersal model
Pyroclastic dispersal simulations were carriedout with a multiparticle £ow code (PDAC2D,Neri et al., 1998b, 2001) deriving from the Do-bran et al. (1993) and Neri and Macedonio (1996)models. This model describes the transient, two-dimensional (axisymmetric), and multiphase £owdynamics of a mixture of solid particles of di¡er-ent sizes in a continuous gas phase. Speci¢cally,the model solves the generalized Navier^Stokesequations of multiphase mixtures and accountsfor the fully mechanical and thermal non-equilib-rium between the gas phase and the N solidphases. Balance equations are closed by constitu-tive equations expressing equations of state, stresstensors, and interphase terms between the phasesconsidered. Speci¢cally, gas turbulence is de-scribed by a sub-grid scale model in terms of an‘eddy’ viscosity whereas interphase transportterms are described by semi-empirical correlationsderiving from the extensive literature on £uidiza-tion. Model equations are solved by a ¢rst-orderupwind ¢nite di¡erences algorithm described inthe original papers. The computational domainadopted in the simulations extends, typically,8 km in the radial direction and 20^40 km in thevertical direction and is characterized by a non-uniform distribution of the cell size. The modeloutput illustrates the transient dynamics of thedispersal process starting from t=0, when theeruptive mixture is injected in a step-like wayinto the atmosphere with £ow conditions com-puted by the ascent model, up to 600 s, whenthe eruptive style of the column is clearly de¢nedand the in£uence of the ¢ctitious initial conditionassumed has been ‘forgotten’. Parametric studiesperformed on similar simulations have indeedshown that the adoption of a di¡erent initial con-dition, for instance the assumption of a fully con-vective column in the atmosphere at t=0, doesnot signi¢cantly a¡ect the eruptive style of thecolumn (Longo et al., 1998). In addition, in orderto reduce the computing load, a mean particlediameter of the eruptive mixture was determined
and a two-phase version of the code was adoptedin all runs. This choice is justi¢ed by the fact thatthe multiparticle formulation does not appear, inthe investigated range of conditions, to be criticalin the de¢nition of the eruptive style of the col-umn provided that an appropriate mean particlediameter is de¢ned (Neri et al., 1998a,b, 2002).Although several means may be de¢ned, the sur-face area is of prime importance in order to prop-erly describe the dynamics of the two-phase mix-ture (Kunii and Levelspiel, 1991). Accordingly,the mean size adopted (see below) was determinedto produce the same total surface area per totalvolume of the reconstructed grain size distribu-tion.
3. Selection of input data
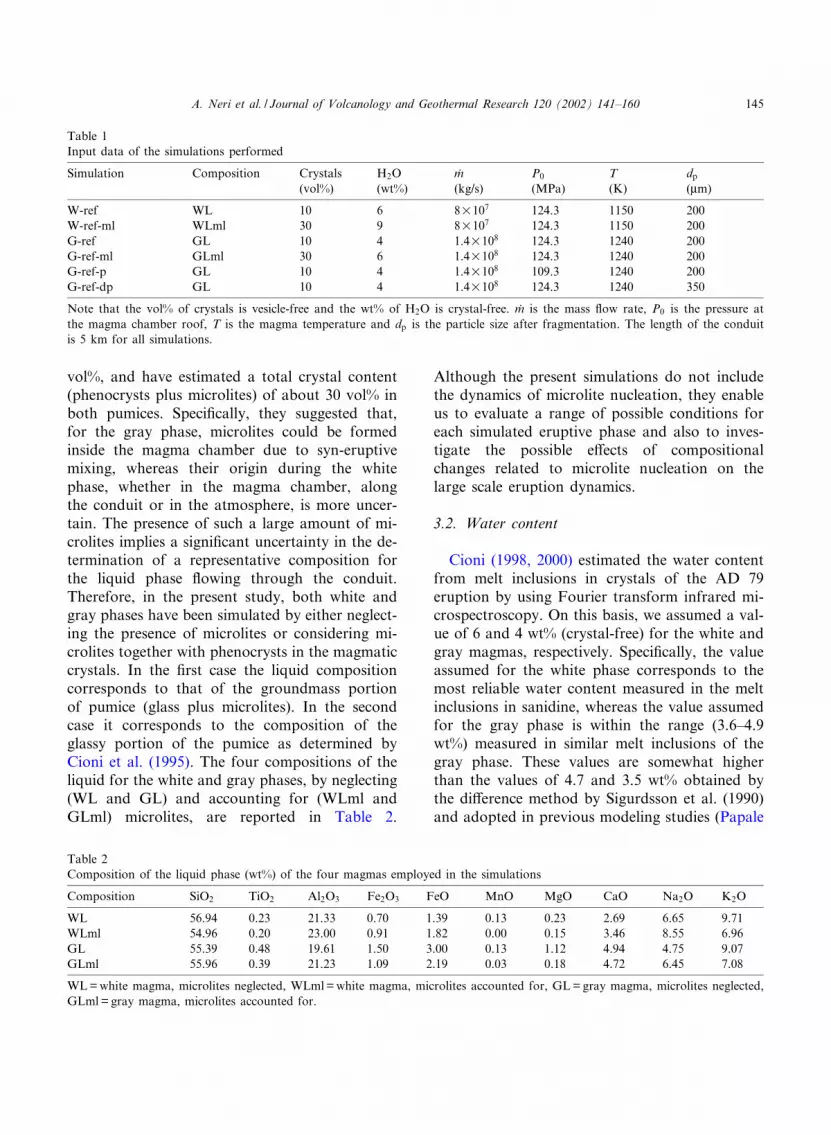
In this section the main input data for the sim-ulations describing the white and gray peakphases of the AD 79 eruptions are described indetail. Table 1 summarizes the input data as-sumed for the six simulations performed.
3.1. Magma composition and crystal content
The determination of these variables is partic-ularly critical since they strongly a¡ect the magmaviscosity and the gas exsolution law of the risingmagma along the conduit and consequently ventconditions. Data on magma composition, includ-ing crystal content, have been extensively producedby Barberi et al. (1981), Sigurdsson et al. (1982),Carey and Sigurdsson (1987), Civetta et al. (1991),and Cioni et al. (1995). The composition rangesbetween phonolitic (white phase) and tephri-pho-nolitic (gray phase). In selecting appropriate mag-ma compositions, one point of major uncertaintyis the origin and amount of microlites in both thewhite and gray magma (Cioni et al., 1995). Inseveral works (Barberi et al., 1981; Carey andSigurdsson, 1987; Civetta et al., 1991) microliteshave been considered together with phenocrystsand a total crystal content of about 20^30 vol%has been measured. More recently, Cioni et al.(1995) have measured a phenocryst content,both in white and in gray pumice, of about 10
VOLGEO 2526 4-11-02
A. Neri et al. / Journal of Volcanology and Geothermal Research 120 (2002) 141^160144
vol%, and have estimated a total crystal content(phenocrysts plus microlites) of about 30 vol% inboth pumices. Speci¢cally, they suggested that,for the gray phase, microlites could be formedinside the magma chamber due to syn-eruptivemixing, whereas their origin during the whitephase, whether in the magma chamber, alongthe conduit or in the atmosphere, is more uncer-tain. The presence of such a large amount of mi-crolites implies a signi¢cant uncertainty in the de-termination of a representative composition forthe liquid phase £owing through the conduit.Therefore, in the present study, both white andgray phases have been simulated by either neglect-ing the presence of microlites or considering mi-crolites together with phenocrysts in the magmaticcrystals. In the ¢rst case the liquid compositioncorresponds to that of the groundmass portionof pumice (glass plus microlites). In the secondcase it corresponds to the composition of theglassy portion of the pumice as determined byCioni et al. (1995). The four compositions of theliquid for the white and gray phases, by neglecting(WL and GL) and accounting for (WLml andGLml) microlites, are reported in Table 2.
Although the present simulations do not includethe dynamics of microlite nucleation, they enableus to evaluate a range of possible conditions foreach simulated eruptive phase and also to inves-tigate the possible e¡ects of compositionalchanges related to microlite nucleation on thelarge scale eruption dynamics.
3.2. Water content
Cioni (1998, 2000) estimated the water contentfrom melt inclusions in crystals of the AD 79eruption by using Fourier transform infrared mi-crospectroscopy. On this basis, we assumed a val-ue of 6 and 4 wt% (crystal-free) for the white andgray magmas, respectively. Speci¢cally, the valueassumed for the white phase corresponds to themost reliable water content measured in the meltinclusions in sanidine, whereas the value assumedfor the gray phase is within the range (3.6^4.9wt%) measured in similar melt inclusions of thegray phase. These values are somewhat higherthan the values of 4.7 and 3.5 wt% obtained bythe di¡erence method by Sigurdsson et al. (1990)and adopted in previous modeling studies (Papale
Table 2Composition of the liquid phase (wt%) of the four magmas employed in the simulations
Note that the vol% of crystals is vesicle-free and the wt% of H2O is crystal-free. m7 is the mass £ow rate, P0 is the pressure atthe magma chamber roof, T is the magma temperature and dp is the particle size after fragmentation. The length of the conduitis 5 km for all simulations.
VOLGEO 2526 4-11-02
A. Neri et al. / Journal of Volcanology and Geothermal Research 120 (2002) 141^160 145
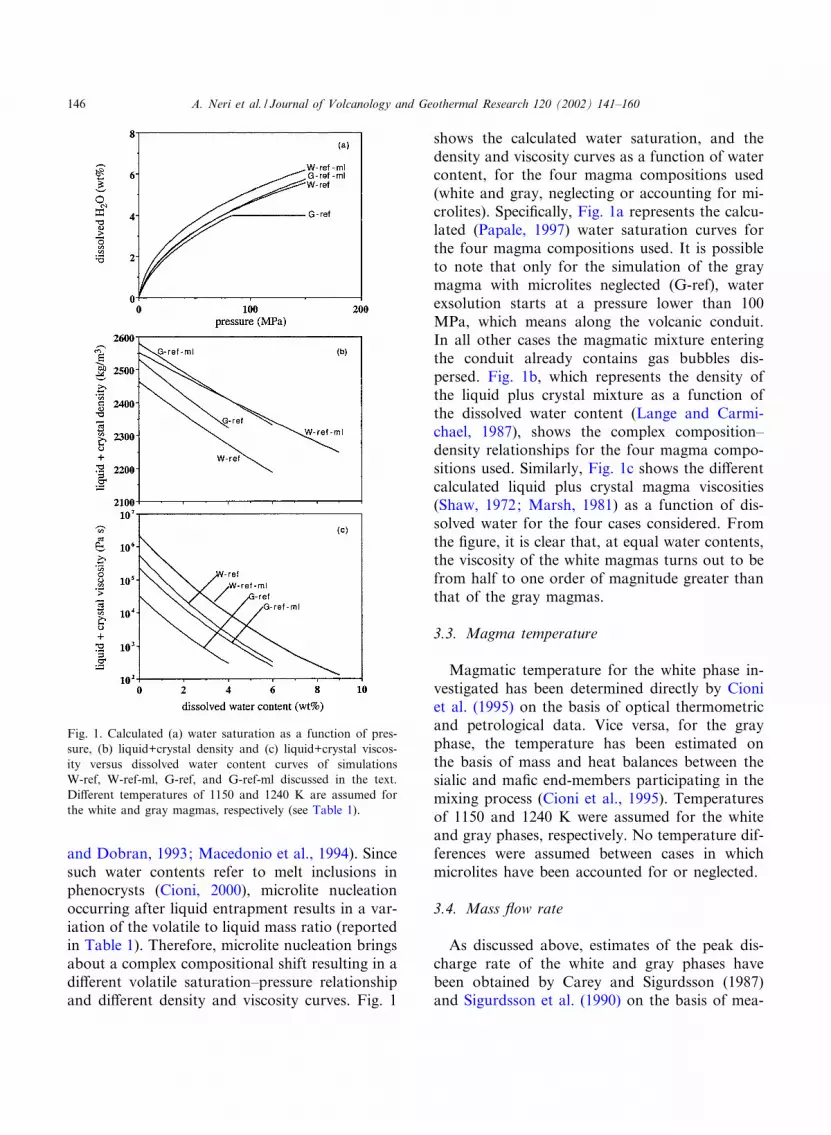
and Dobran, 1993; Macedonio et al., 1994). Sincesuch water contents refer to melt inclusions inphenocrysts (Cioni, 2000), microlite nucleationoccurring after liquid entrapment results in a var-iation of the volatile to liquid mass ratio (reportedin Table 1). Therefore, microlite nucleation bringsabout a complex compositional shift resulting in adi¡erent volatile saturation^pressure relationshipand di¡erent density and viscosity curves. Fig. 1
shows the calculated water saturation, and thedensity and viscosity curves as a function of watercontent, for the four magma compositions used(white and gray, neglecting or accounting for mi-crolites). Speci¢cally, Fig. 1a represents the calcu-lated (Papale, 1997) water saturation curves forthe four magma compositions used. It is possibleto note that only for the simulation of the graymagma with microlites neglected (G-ref), waterexsolution starts at a pressure lower than 100MPa, which means along the volcanic conduit.In all other cases the magmatic mixture enteringthe conduit already contains gas bubbles dis-persed. Fig. 1b, which represents the density ofthe liquid plus crystal mixture as a function ofthe dissolved water content (Lange and Carmi-chael, 1987), shows the complex composition^density relationships for the four magma compo-sitions used. Similarly, Fig. 1c shows the di¡erentcalculated liquid plus crystal magma viscosities(Shaw, 1972; Marsh, 1981) as a function of dis-solved water for the four cases considered. Fromthe ¢gure, it is clear that, at equal water contents,the viscosity of the white magmas turns out to befrom half to one order of magnitude greater thanthat of the gray magmas.
3.3. Magma temperature
Magmatic temperature for the white phase in-vestigated has been determined directly by Cioniet al. (1995) on the basis of optical thermometricand petrological data. Vice versa, for the grayphase, the temperature has been estimated onthe basis of mass and heat balances between thesialic and ma¢c end-members participating in themixing process (Cioni et al., 1995). Temperaturesof 1150 and 1240 K were assumed for the whiteand gray phases, respectively. No temperature dif-ferences were assumed between cases in whichmicrolites have been accounted for or neglected.
3.4. Mass £ow rate
As discussed above, estimates of the peak dis-charge rate of the white and gray phases havebeen obtained by Carey and Sigurdsson (1987)and Sigurdsson et al. (1990) on the basis of mea-
Fig. 1. Calculated (a) water saturation as a function of pres-sure, (b) liquid+crystal density and (c) liquid+crystal viscos-ity versus dissolved water content curves of simulationsW-ref, W-ref-ml, G-ref, and G-ref-ml discussed in the text.Di¡erent temperatures of 1150 and 1240 K are assumed forthe white and gray magmas, respectively (see Table 1).
VOLGEO 2526 4-11-02
A. Neri et al. / Journal of Volcanology and Geothermal Research 120 (2002) 141^160146
surements of maximum pumice and lithic diame-ters in the fallout deposits. On that basis, we haveassumed a mass £ow rate of 8U107 and 1.4U108
kg/s for the white and gray phases, respectively.
3.5. Magma chamber pressure and conduit length
The pressure in the magma chamber and thecorresponding chamber depth have been esti-mated on the basis of petrography and chemistryof metamorphosed carbonatic lithics (Barberi andLeoni, 1980), phase relationships between ground-mass and phenocrysts (Barberi et al., 1981), and£uid inclusion geobarometry (Belkin et al., 1985).Speci¢cally, Barberi and Leoni (1980) indicated a£uid pressure of 150^200 MPa with a magmachamber depth of 5^6 km. Barberi et al. (1981)suggested a total pressure of 100 MPa and a cor-responding depth of 3^4 km. Finally, Belkin et al.(1985) found a minimum pressure of about 130MPa with a chamber depth of 5 km. On the basisof the above estimates, we assumed a pressure atthe top of the magma chamber of 125 MPa and aconduit length of 5 km. This choice is also con-sistent with the rock density pro¢le of the Tre-case-1 well located about 4 km southeast of thepresent crater rim (Balducci et al., 1985). In orderto evaluate the possible importance of signi¢cantmagma chamber pressure decrease accompanyingthe discharge of magma, one simulation pertain-ing to the gray phase (G-ref-p in Table 1) hasbeen repeated by assuming a chamber pressurelower by 15 MPa, this value approximately corre-sponding to the tensile strength of the dolomiticrocks (Touloukin et al., 1989) constituting theroof of the AD 79 magma chamber.
3.6. Particle size
The mean particle size representative of theeruptive mixture, and used above the fragmenta-tion level within the conduit and in the atmo-spheric domain, has been determined on the basisof the grain size distribution in the pumice £owdeposit immediately following the Plinian grayphase of the eruption (Barberi et al., 1989). Thispumice £ow is interpreted as being due to thetotal collapse of the column (Sigurdsson et al.,
1985, 1990; Carey and Sigurdsson, 1987; Cioniet al., 1992). In addition, in order to take intoaccount a depletion in ¢ne ash commonly occur-ring during pyroclastic £ow emplacement (Sparksand Walker, 1977; Woods and Wohletz, 1991;Neri et al., 1998b, 2001), 40 wt% of particleswith a diameter equal to 44 Wm was added tothe above distribution. The resulting particle di-ameter is equal to 200 Wm. However, in order toevaluate the e¡ects on the results of the assumedmean particle size, in one simulation pertaining tothe gray phase (G-ref-dp in Table 1), we assumeda particle diameter equal to 350 Wm as resultingdirectly from the pumice £ow deposit without theaddition of ¢nes.
3.7. Volcano topography and crater shape
As topography of the volcano we have assumeda £at shape at a height of 400 m above sea level.This choice mainly derives from the reconstruc-tion of the volcano topography by Cioni et al.(1999) indicating the existence of a relatively £atplateau around the volcano. In the present study,this simpli¢cation is justi¢ed by the fact that ourmain interest consists in the description of thelarge-scale dynamics of the column rather thanin pyroclastic £ow features. A ¢xed crater geom-etry, with an opening angle of 45‡ and a height of200 m, was also considered in all simulations per-formed in order to realistically describe the de-compression of the volcanic jet (Woods andBower, 1995).
4. Simulation results
4.1. Magma ascent along the conduit
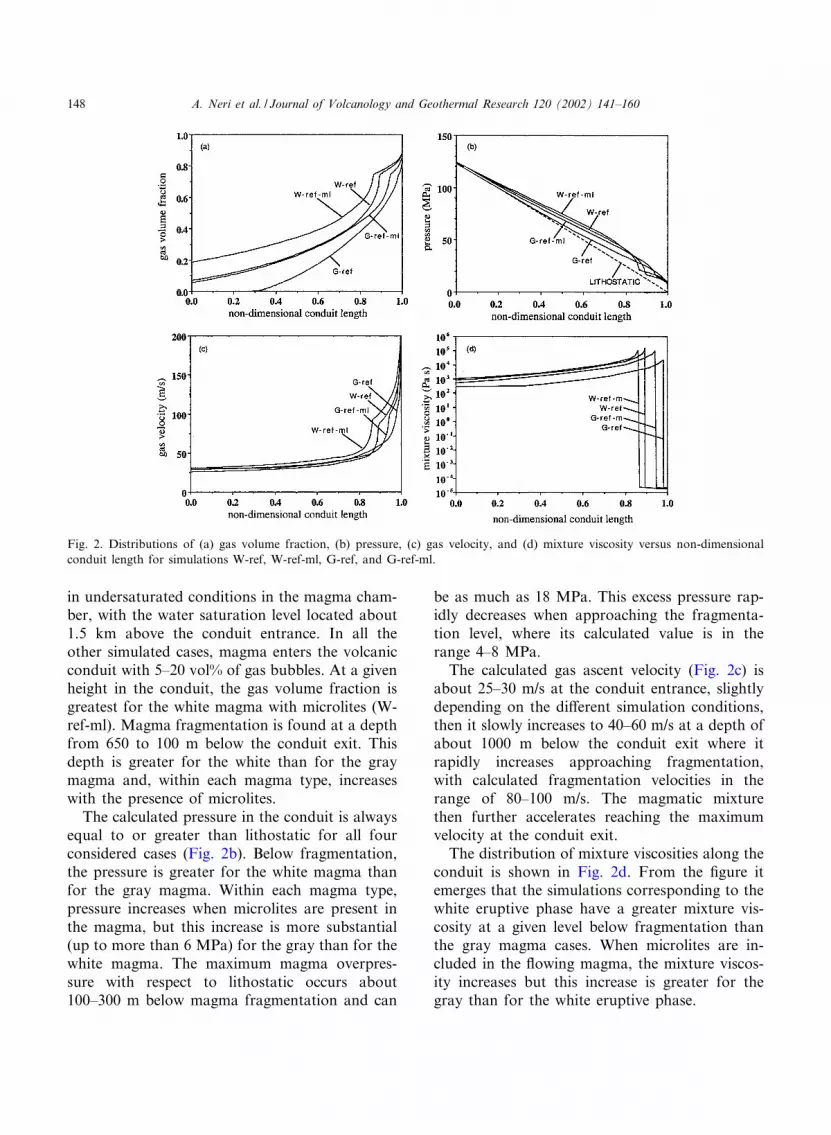
Fig. 2 shows the calculated distribution of themost important £ow variables along the volcanicconduit for the four reference simulations, i.e.white and gray magmas with microlites neglectedor accounted for, and equal magma chamberpressure and particle size (W-ref, W-ref-ml,G-ref, G-ref-ml of Table 1).
Similarly to Fig. 1a, Fig. 2a shows that the caseof gray magma with no microlites (G-ref) results
VOLGEO 2526 4-11-02
A. Neri et al. / Journal of Volcanology and Geothermal Research 120 (2002) 141^160 147
in undersaturated conditions in the magma cham-ber, with the water saturation level located about1.5 km above the conduit entrance. In all theother simulated cases, magma enters the volcanicconduit with 5^20 vol% of gas bubbles. At a givenheight in the conduit, the gas volume fraction isgreatest for the white magma with microlites (W-ref-ml). Magma fragmentation is found at a depthfrom 650 to 100 m below the conduit exit. Thisdepth is greater for the white than for the graymagma and, within each magma type, increaseswith the presence of microlites.
The calculated pressure in the conduit is alwaysequal to or greater than lithostatic for all fourconsidered cases (Fig. 2b). Below fragmentation,the pressure is greater for the white magma thanfor the gray magma. Within each magma type,pressure increases when microlites are present inthe magma, but this increase is more substantial(up to more than 6 MPa) for the gray than for thewhite magma. The maximum magma overpres-sure with respect to lithostatic occurs about100^300 m below magma fragmentation and can
be as much as 18 MPa. This excess pressure rap-idly decreases when approaching the fragmenta-tion level, where its calculated value is in therange 4^8 MPa.
The calculated gas ascent velocity (Fig. 2c) isabout 25^30 m/s at the conduit entrance, slightlydepending on the di¡erent simulation conditions,then it slowly increases to 40^60 m/s at a depth ofabout 1000 m below the conduit exit where itrapidly increases approaching fragmentation,with calculated fragmentation velocities in therange of 80^100 m/s. The magmatic mixturethen further accelerates reaching the maximumvelocity at the conduit exit.
The distribution of mixture viscosities along theconduit is shown in Fig. 2d. From the ¢gure itemerges that the simulations corresponding to thewhite eruptive phase have a greater mixture vis-cosity at a given level below fragmentation thanthe gray magma cases. When microlites are in-cluded in the £owing magma, the mixture viscos-ity increases but this increase is greater for thegray than for the white eruptive phase.
Fig. 2. Distributions of (a) gas volume fraction, (b) pressure, (c) gas velocity, and (d) mixture viscosity versus non-dimensionalconduit length for simulations W-ref, W-ref-ml, G-ref, and G-ref-ml.
VOLGEO 2526 4-11-02
A. Neri et al. / Journal of Volcanology and Geothermal Research 120 (2002) 141^160148
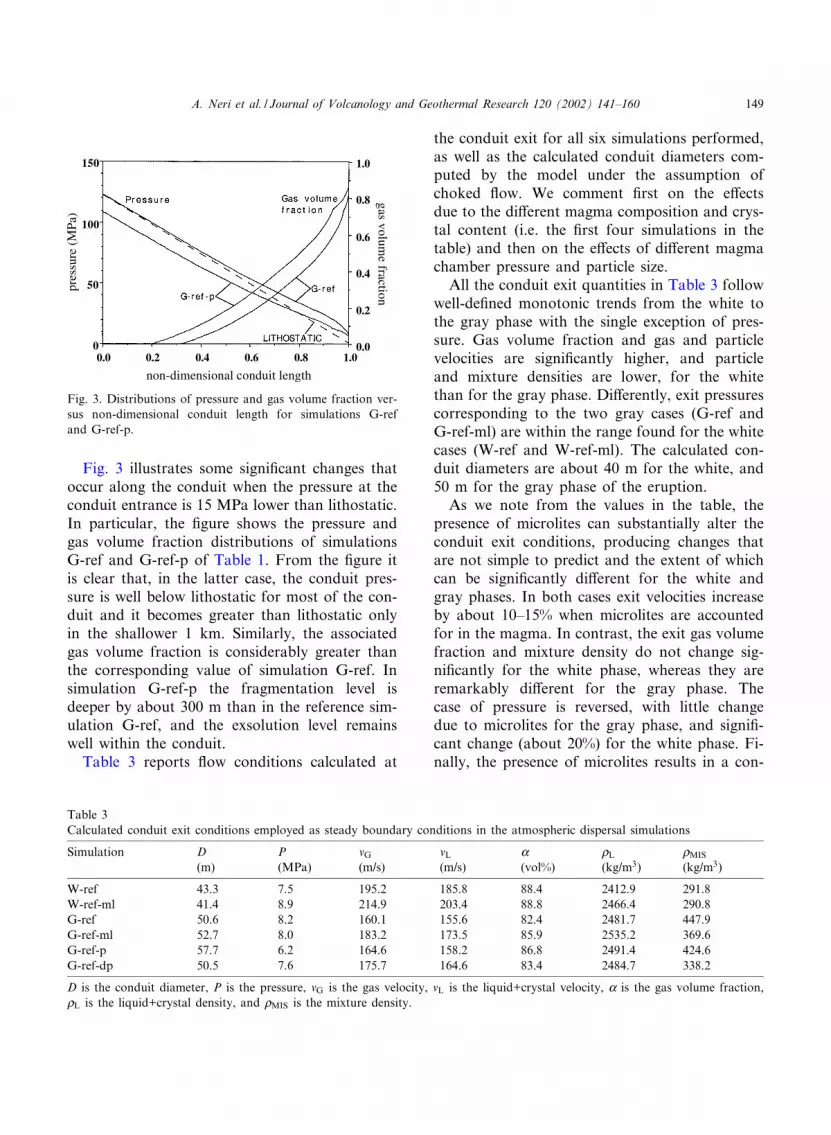
Fig. 3 illustrates some signi¢cant changes thatoccur along the conduit when the pressure at theconduit entrance is 15 MPa lower than lithostatic.In particular, the ¢gure shows the pressure andgas volume fraction distributions of simulationsG-ref and G-ref-p of Table 1. From the ¢gure itis clear that, in the latter case, the conduit pres-sure is well below lithostatic for most of the con-duit and it becomes greater than lithostatic onlyin the shallower 1 km. Similarly, the associatedgas volume fraction is considerably greater thanthe corresponding value of simulation G-ref. Insimulation G-ref-p the fragmentation level isdeeper by about 300 m than in the reference sim-ulation G-ref, and the exsolution level remainswell within the conduit.
Table 3 reports £ow conditions calculated at
the conduit exit for all six simulations performed,as well as the calculated conduit diameters com-puted by the model under the assumption ofchoked £ow. We comment ¢rst on the e¡ectsdue to the di¡erent magma composition and crys-tal content (i.e. the ¢rst four simulations in thetable) and then on the e¡ects of di¡erent magmachamber pressure and particle size.
All the conduit exit quantities in Table 3 followwell-de¢ned monotonic trends from the white tothe gray phase with the single exception of pres-sure. Gas volume fraction and gas and particlevelocities are signi¢cantly higher, and particleand mixture densities are lower, for the whitethan for the gray phase. Di¡erently, exit pressurescorresponding to the two gray cases (G-ref andG-ref-ml) are within the range found for the whitecases (W-ref and W-ref-ml). The calculated con-duit diameters are about 40 m for the white, and50 m for the gray phase of the eruption.
As we note from the values in the table, thepresence of microlites can substantially alter theconduit exit conditions, producing changes thatare not simple to predict and the extent of whichcan be signi¢cantly di¡erent for the white andgray phases. In both cases exit velocities increaseby about 10^15% when microlites are accountedfor in the magma. In contrast, the exit gas volumefraction and mixture density do not change sig-ni¢cantly for the white phase, whereas they areremarkably di¡erent for the gray phase. Thecase of pressure is reversed, with little changedue to microlites for the gray phase, and signi¢-cant change (about 20%) for the white phase. Fi-nally, the presence of microlites results in a con-
Fig. 3. Distributions of pressure and gas volume fraction ver-sus non-dimensional conduit length for simulations G-refand G-ref-p.
Table 3Calculated conduit exit conditions employed as steady boundary conditions in the atmospheric dispersal simulations
D is the conduit diameter, P is the pressure, vG is the gas velocity, vL is the liquid+crystal velocity, K is the gas volume fraction,bL is the liquid+crystal density, and bMIS is the mixture density.
VOLGEO 2526 4-11-02
A. Neri et al. / Journal of Volcanology and Geothermal Research 120 (2002) 141^160 149
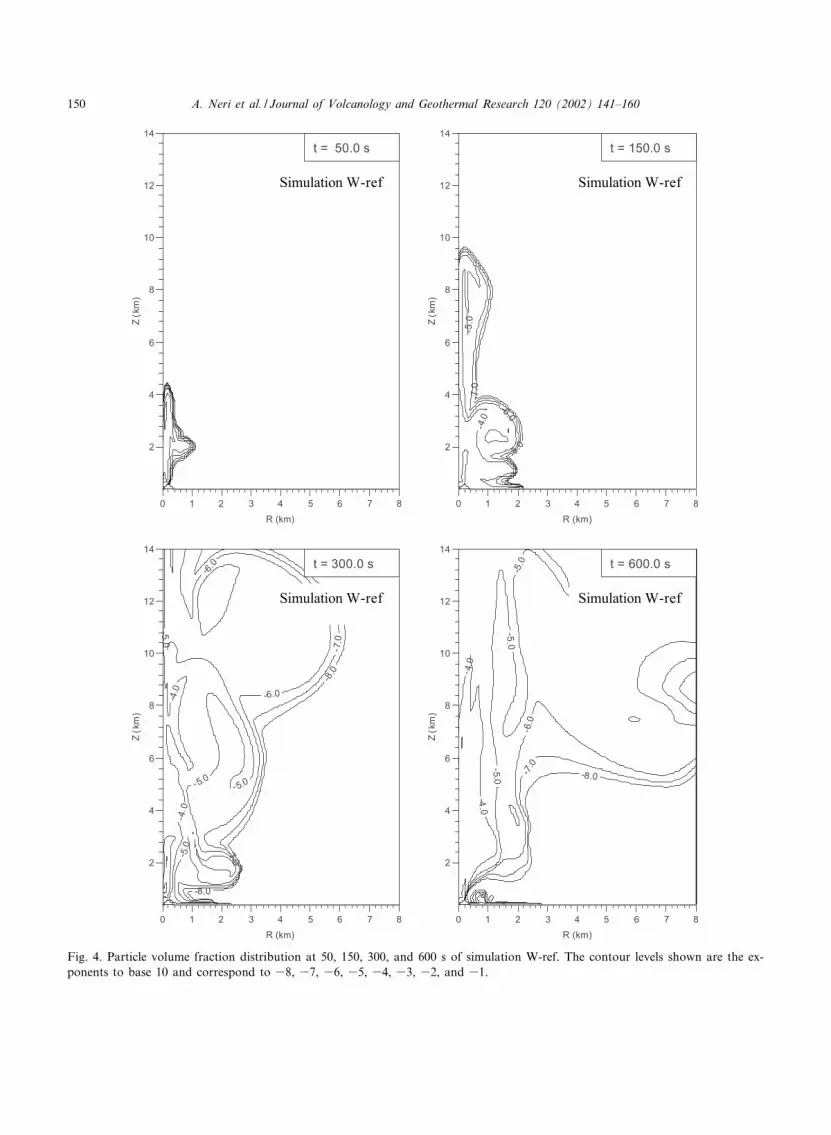
Fig. 4. Particle volume fraction distribution at 50, 150, 300, and 600 s of simulation W-ref. The contour levels shown are the ex-ponents to base 10 and correspond to 38, 37, 36, 35, 34, 33, 32, and 31.
VOLGEO 2526 4-11-02
A. Neri et al. / Journal of Volcanology and Geothermal Research 120 (2002) 141^160150
Fig. 5. Distribution of gas velocity at 50, 150, 300, and 600 s of simulation W-ref.
VOLGEO 2526 4-11-02
A. Neri et al. / Journal of Volcanology and Geothermal Research 120 (2002) 141^160 151
duit diameter which is slightly smaller for thewhite phase, and slightly larger for the grayphase.
Simulation G-ref-p in Table 3 can be comparedwith simulation G-ref to quantify the net e¡ect onvent conditions of magma chamber pressure de-crease by 15 MPa. Such an e¡ect is to reduce theexit pressure by about 25%, resulting in a moreexpanded, less dense, and slightly faster magmaticmixture at the conduit exit. In addition, in orderto maintain the same mass £ow rate with de-creased driving pressure, the conduit diameter isfound to increase from about 51 up to 58 m.
Finally, the comparison between simulationsG-ref-dp and G-ref allows us to evaluate the nete¡ect of a larger particle size (350 Wm for G-ref-dp compared to 200 Wm for all other simulations).The larger particle size results in a larger decou-pling between gas and particles above the frag-mentation level, leading to a larger velocity di¡er-ence between the phases and to further pressureand density decreases. However, no signi¢cant ef-fect of particle size is observed on the conduitdiameter calculated.
4.2. Pyroclastic dispersal in the atmosphere
The conduit exit conditions in Table 3 wereused as boundary conditions for the modeling ofgas^particle dispersal in the atmosphere. Figs. 4and 5 illustrate the distribution of particle volumefraction and gas velocity, at four di¡erent timesfrom the beginning of the eruption, for simulationW-ref characterized by a white magma with nomicrolites accounted for. The two distributionsdescribe the initial formation of the jet (50 s),the rising of a buoyant plume above the jet andthe formation of a temporary pyroclastic £ow(150 s), and the development of a large buoyantcolumn with the pyroclastic £ow no longer fed (at300 and 600 s in Fig. 4). As discussed above,despite the rough description of the eruption on-set, simulation results over longer time periodsclearly indicate the eruptive style of the volcaniccolumn. Speci¢cally, for the simulation examinedhere (W-ref), the formation of a buoyant columnis de¢nitely evident from the two sequences.
Fig. 6 shows a comparison between the pre-
dicted distributions of particle volume fractionfor the ¢rst four simulations of Table 3 (i.e. thetwo studied magmatic phases, with and withoutmicrolites accounted for) as obtained by thecoupled simulation of magma ascent and dispersaldynamics. All four distributions refer to 600 safter the onset of the eruption in order to illus-trate the di¡erent eruptive style at a well-devel-oped stage of the eruption.
Fig. 6a refers to the above described simulationW-ref, corresponding to white magma with nomicrolites. As already noted above, in this case,predicted vent conditions result in a buoyant col-umn that rises up in the atmosphere and spreadsradially to form a large convective cloud. At thebase of the column, a dilute low-inertia pyroclas-tic £ow is fed for a short period of time at theeruption onset, but it only drives about 2 wt% oferupted solid particles, and the general eruptivestyle is clearly buoyant.
Fig. 6b again shows the case of the white mag-ma but with microlites accounted for (simulationW-ref-ml). In this case, the buoyant character ofthe column is strengthened. After 600 s from thebeginning of the eruption, pyroclastic £ows aretotally absent and the volcanic cloud spreads hor-izontally at a height of about 6.5 km, signi¢cantlyhigher than the 5 km produced by the same whitemagma with no microlites accounted for (Fig. 6a).
Fig. 6c shows the results for the gray magmawith no microlites accounted for (simulationG-ref). In this case, the character of the volcaniccolumn becomes remarkably collapsing, with theformation of a pyroclastic £ow that reaches thecomputational domain boundary 8 km away fromthe vent after about 300 s from the beginning ofthe eruption. At this time, about 80 wt% of thetotal amount of pyroclasts erupted is transportedin the pyroclastic £ow. After 600 s, a voluminousco-ignimbritic cloud is present over the pyroclas-tic current, largely merging with the convectiveplume rising above the fountain.
Finally, Fig. 6d refers to the gray magma casewith microlites accounted for (simulation G-ref-ml). As for the white magma, the presence ofmicrolites signi¢cantly enhances the buoyancy ofthe volcanic column. In this case the in£uence ofmicrolites is even more evident since the eruptive
VOLGEO 2526 4-11-02
A. Neri et al. / Journal of Volcanology and Geothermal Research 120 (2002) 141^160152
Fig. 6. Distribution of particle volume fraction at 600 s of simulations W-ref (a), W-ref-ml (b), G-ref (c), and G-ref-ml (d). Thecontour levels shown are the exponents to base 10 and correspond to 38, 37, 36, 35, 34, 33, 32, and 31.
VOLGEO 2526 4-11-02
A. Neri et al. / Journal of Volcanology and Geothermal Research 120 (2002) 141^160 153
VOLGEO 2526 4-11-02
A. Neri et al. / Journal of Volcanology and Geothermal Research 120 (2002) 141^160154
style of the column drastically changes from fullycollapsing (G-ref) to almost fully buoyant (G-ref-ml). The small pyroclastic £ow observable at 600s at the base of the column was only fed duringthe initial transient of the eruption and particlesforming it are less than 1 wt% of the total par-ticles erupted.
As illustrated in Fig. 7, we have also consid-ered, for the gray phase, the cases of lower mag-ma chamber pressure and larger particle size. Asmentioned above, these two simulations havebeen done in order to evaluate the e¡ects of pres-sure decrease in the chamber due to magma with-drawal (Sigurdsson et al., 1990) and uncertaintyin the de¢nition of an average particle size of themixture, respectively. The ¢gure compares theparticle volume fraction distribution of (a) simu-lation G-ref with (b) simulation invert G-ref-p,and (c) simulation G-ref-dp, at 300 s after theinjection of the mixture in the atmosphere. Thetwo comparisons, however, do not show signi¢-cant di¡erences concerning gas^particle dispersaldynamics in the atmosphere. Speci¢cally, in allcases, the percentage of mass forming the pyro-clastic £ow ranges between 70 and 80 wt% of thetotal mass erupted, making the three simulationsde¢nitely collapsing in style.
5. Discussion
In this paper we simulated the coupled conduitand atmospheric dynamics for the peak dischargephases of the AD 79 Plinian eruption of Vesuvius.For each simulated phase, white and gray, weselected appropriate input data in terms of mass£ow rate, magma composition, pressure^temper-ature conditions in magma chamber, conduitlength, and mean particle size, taking advantageof the abundant literature on this very famouseruption. We then ran the codes, by using theconduit exit conditions computed by the ascentmodel as boundary conditions for the gas/particle
dispersal model. The eruptive dynamics producedby the models are not determined a priori, butrepresent independent outcomes that can be com-pared with the available knowledge on the erup-tion coming from reconstructions based on vol-canic deposits. This comparison allows us toevaluate the capability of the modeling to repro-duce the eruption dynamics, and gives us furtherinsights into the role played by various eruptionparameters.
The most signi¢cant character of the eruptivephases considered is certainly their dominanteruptive style. We de¢nitely know that the whitephase produced a fully convective column, where-as the presence of ashy layers, with a typical py-roclastic surge signature, intercalated in the grayfallout deposit indicates a less buoyant characterof this phase than of the white phase (Sigurdssonet al., 1985; Carey and Sigurdsson, 1987; Cioni etal., 1992).
The results from numerical simulations show asubstantial agreement with the above scenario.The simulated white phase is buoyant, both ne-glecting (W-ref) and accounting for (W-ref-ml)the presence of microlites (Fig. 6a,b). In contrast,the simulated gray phase is dominantly collapsingwhen neglecting microlites (G-ref) and buoyantwhen microlites are accounted for (G-ref-ml)(Fig. 6c,d). Comparison between the two eruptivephases simulated (Fig. 6a vs. c, and b vs. d)clearly shows a loss of buoyancy from the whiteto the gray phase.
An additional result concerns the role played bymicrolites on the eruption dynamics. For bothwhite and gray phases, microlites signi¢cantly in-crease the buoyancy of the column. This couldnot be assessed a priori since microlites have anumber of e¡ects on magma properties, some ofwhich are counteracting (Stevenson et al., 1996).In fact, the formation of microlites implies an in-crease of the water/liquid mass ratio which resultsin a decrease of liquid viscosity. At the same time,however, the formation of microlites implies a
Fig. 7. Comparison among the distribution of particle volume fractions at 300 s of simulations G-ref (a), G-ref-dp (b), and invertG-ref-p (c). The contour levels shown are the exponents to base 10 and correspond to 38, 37, 36, 35, 34, 33, 32, and 31.
VOLGEO 2526 4-11-02
A. Neri et al. / Journal of Volcanology and Geothermal Research 120 (2002) 141^160 155
compositional shift of the liquid as well as theincrease of the total crystal content, both workingtoward an increase of magma viscosity. In addi-tion, the liquid compositional shift produces amodi¢cation of magma density and pressure^solubility relationships (Fig. 1). The overall mi-crolite e¡ect on eruption dynamics can only beevaluated numerically for each speci¢c case. Thepresent results show that, in the range of inves-tigated conditions, the presence of 20 vol% micro-lites results in a signi¢cantly more buoyant vol-canic column. The cases with microlites accountedfor in the magma (Fig. 6b,d) show a better corre-spondence with the eruptive scenarios recon-structed from ¢eld studies, with the predictedwhite phase being de¢nitely buoyant, and the pre-dicted gray phase being dominantly buoyant butcloser to a transitional regime (Neri et al., 1998a,2002) characterized by column collapse episodesinvolving some fraction of the discharged pyro-clasts.
In the real case, microlite nucleation might haveoccurred during the ascent of magma along theconduit as a consequence of magma degassingand associated liquidus temperature increase(Rutherford and Gardner, 2000), or might bethe consequence of mixing in the magma chamberand conduit between two magma types havingdi¡erent temperature and composition (Sigurds-son et al., 1990; Civetta et al., 1991; Cioni etal., 1995; Marianelli et al., 1995; Cioni, 2000).In any case, the uncertainty remains on the depthat which microlite nucleation did occur. Our sim-ulations, considering the two end-member casescorresponding to no microlite nucleation (Fig.6a,c) and microlite nucleation within the magmachamber (Fig. 6b,d), do not give us any informa-tion about the dynamics of microlite formation.Nonetheless, they suggest that the overall e¡ect ofmicrolite nucleation on the eruption dynamics, forboth the white and gray phases of the AD 79eruption, is that of increasing the buoyancy ofthe column. It is relevant to note that, in thecase of gray magma, the inclusion of microlitesin the erupted magma results in a signi¢cantchange of the eruptive style, from dominantly col-lapsing to dominantly buoyant (Fig. 6b,d). There-fore, at least in some cases, microlite nucleation
could represent a controlling process in the de¢-nition of the eruptive style.
Further consistencies between ¢eld studies andnumerical simulations can be found by comparingthe calculated conduit diameters with those ob-tained by using the independently estimatedmass of carbonatic lithics in the white and grayfallout deposits. These cumulative masses, corre-sponding to the simulated phases of peak dis-charge rate, are about 1.4U1010 kg for the whiteand 2.1U1010 kg for the gray phase (Arrighi andGiannini, 1996). Assuming an average density ofcarbonatic rocks of 2700 kg/m3, a depth of car-bonates of 1670 m below the conduit vent (Bal-ducci et al., 1985; Cioni et al., 1999), and a cylin-drical conduit with circular cross-section, theestimated diameters for the white and gray phasesare about 45 and 55 m, respectively. These valuescompare well with the computed values of 41^43and 50^58 m reported in Table 3 for the whiteand gray phases, respectively. The conduit diam-eters obtained are approximately half of thosepredicted by Papale and Dobran (1993) and Ma-cedonio et al. (1994), mostly due to the consider-ably lower water content of the magma assumedin those studies.
In addition, the increase in the proportion oflithics and deep calcareous rocks from the whiteto the gray deposits (Lirer et al., 1973; Sheridanet al., 1981; Barberi et al., 1989) is consistent withthe pressure distribution predicted for the grayphase with assumed magma chamber pressurelower than lithostatic (simulation G-ref-p). Inthis simulation, the pressure in the deeper portionof the conduit is considerably lower than litho-static (Fig. 3), thus making possible an e¡ectivegeneration of carbonatic rocks due to partial in-ward collapse of the conduit walls (Macedonio etal., 1994).
It is worth noting here that the comparisonbetween model predictions and reconstructederuption dynamics is necessarily approximatedand limited to some large-scale semi-quantitativeaspects of the eruption. This is due to the largeuncertainty a¡ecting the knowledge of the actualeruption (in terms of sequence of events, magmaproperties, conduit geometry, atmospheric condi-tions, volcano topography, etc.), as well as to the
VOLGEO 2526 4-11-02
A. Neri et al. / Journal of Volcanology and Geothermal Research 120 (2002) 141^160156
limits of the modeling that prevent a more thor-ough description of the eruption dynamics (one/two-dimensional assumption, short time periodsimulated, etc.). As an example, although the ¢treported above between the predicted conduit di-ameter and the diameter estimated from theejected wall rock volume is impressive, it shouldbe noted that the magma pathway in the deepconduit regions is more likely to be a ¢ssure. Con-duit geometry changes can signi¢cantly in£uencethe magma ascent dynamics (Wilson et al., 1980;Buresti and Casarosa, 1989, 1990). Therefore, theabove correspondence between predicted and in-dependently estimated conduit size should be con-sidered with care. However, it remains that theorder of magnitude of the conduit diameter andits relative variation between the white and grayphases are notable features well reproduced by themodels.
It is useful to compare the present results toprevious numerical studies on the e¡ects of com-positional changes on the eruptive style. Papale etal. (1998) and Neri et al. (1998a) performed aparametric analysis of the role of liquid composi-tion, water content, and crystal content on thecoupled magma ascent and dispersal dynamics.Those results were, to a large extent, interpretedin terms of variation of magma viscosity that wasrecognized as a critical magma property in theeruption dynamics. The total water content, i.e.the weight fraction of water with respect to theentire mixture, was identi¢ed as the main variabledetermining the eruptive style. The present analy-sis, however, indicates that the dynamics of a realeruption can be considerably more complex anddi⁄cult to interpret. In this case, in fact, we areinterested in the reproduction of two distincteruptive phases of a speci¢c event. This meansthat we do not undertake a parametric studywhere a given parameter changes with other inputparameters held constant, but several parametersvary simultaneously from one simulated phase tothe next, according to conditions determined bythe analysis of volcanic products.
An example of the above is given by the pres-sure distribution along the conduit. In Papale etal. (1998) it was found that, with equal conduitdiameter and other conditions, a more viscous
magma produces a lower pressure in the conduit.In contrast, the more viscous white magma of theAD 79 eruption (Figs. 1c and 2d) corresponds toa larger conduit pressure (Fig. 2b). In this case,however, the conduit diameter and the water con-tent change from the white to the gray phase.
A second example is given by the in£uence ofmicrolites on the eruptive style of the column. Asmentioned above, Neri et al. (1998a) found thatthe eruptive style was mainly determined by thewater content with respect to total magma (in-cluding crystals). In the present study, the totalwater content does not change when consideringthe presence of microlites in the white or graymagma. Nevertheless, comparison of Fig. 6c andd pertaining to the gray phase shows that theeruptive style changes signi¢cantly although thetotal water content in the two simulations is con-stant. Also in this case, however, we must notethat, di¡erently from the two above papers, thepresence of microlites signi¢cantly modi¢es thewater/liquid mass ratio (Table 1) and the dis-solved water content curve (Fig. 1a), also bringingabout a change in the conduit diameter in orderto reproduce the mass £ow rate assumed.
6. Conclusions
Existing models on conduit and atmosphericdispersal dynamics have rarely been coupled tosimulate real eruptions. Such an integrated simu-lation of conduit and atmospheric processes al-lows a quantitative description of the large-scalefeatures of the eruption and a consistent evalua-tion of the e¡ects of magmatic properties on dis-persal dynamics. In the present work we haveused conduit and atmospheric dispersal models,in conjunction with the most updated set of erup-tive parameters, to simulate two peak dischargerate phases of the AD 79 eruption of Vesuvius,one of the most investigated historic eruptionsworldwide.
Simulation results are in substantial agreementwith the eruption dynamics reconstructed fromindependent volcanological studies. Speci¢cally,both the simulated white and gray phases resultin buoyant convective columns when the presence
VOLGEO 2526 4-11-02
A. Neri et al. / Journal of Volcanology and Geothermal Research 120 (2002) 141^160 157
of 20 vol% of microlites in pumice is accountedfor in the modeling. However, the gray phaseshows a less buoyant character that can result inpartial column collapses typical of the transition-al regime. In particular, with no microlites ac-counted for, simulations predict the full collapseof the column indicating that, at least in somecases, microlite nucleation can play a criticalrole in the large-scale eruption dynamics. Furtherconsistencies, regarding conduit diameter and ero-sion rate, have been found between predictedmagma ascent features and independent data re-constructed from the deposits.
The present analysis shows, once again, the im-portance of magma properties in determining theeruptive phenomena, and the need to carry out adhoc numerical simulations for the speci¢c erup-tion under consideration. It therefore underlinesthe importance of a good knowledge of eruptiveparameters, such as magma composition, waterand crystal contents, as well as of constitutiveequations, in order to simulate real eruptioncases. However, although the present simulationsare satisfactory in reproducing the reconstructederuption style for each eruption phase, they alsogive evidence of the limits of applying numericalsimulations to ancient eruptions. From this pointof view, a more thorough and accurate compar-ison requires the application of existing models torecent and monitored eruptions (Papale and Do-bran, 1994; Clarke et al., 2002). In such cases,data and boundary conditions for use in the sim-ulations can be determined with much higher ac-curacy, resulting in a more robust description ofthe eruption dynamics as well as in a more con-¢dent validation of the physical models.
Acknowledgements
This work was supported by the EuropeanCommunity, Projects ENV4-CT98-0699 andENV4-CT98-0703, and by Gruppo Nazionaleper la Vulcanologia, Istituto Nazionale di Geo¢-sica e Vulcanologia, Italy, Project 2000-2/09. Wewish to thank Prof. Lionel Wilson and an anon-ymous referee for their critical review of themanuscript.
References
Arrighi, A., Giannini, F., 1996. Studio vulcano-sedimentologi-co del deposito pliniano di pomici bianche e grigie dell’eruzione vesuviana del 79 d.C. e modellizzazione ¢sica dellarisalita nel condotto. Master’s Thesis, University of Pisa,201 pp.
Balducci, S., Vaselli, M., Verdiani, G., 1985. Exploration wellin the ‘Ottaviano’ permit, Italy. In: Strub, A.S., Ungemach,P. (Eds.), European Geothermal Update. Proc. 3rd Int.Seminar on the Results of the EC Geothermal Energy Re-search, Munich. Reidel, Dordrecht, pp. 407^418.
Barberi, F., Leoni, L., 1980. Metamorphic carbonate ejectafrom Vesuvius plinian eruptions: evidence of the occurrenceof shallow magma chambers. Bull. Volcanol. 43, 107^120.
Barberi, F., Bizouard, H., Clocchiati, R., Metrich, N., Santa-croce, R., Sbrana, A., 1981. The Somma-Vesuvius magmachamber: a petrological and volcanological approach. Bull.Volcanol. 44, 295^315.
Barberi, F., Cioni, R., Rosi, M., Santacroce, R., Sbrana, A.,Vecci, R., 1989. Magmatic and freato-magmatic phases inexplosive eruptions of Vesuvius as deduced by grain-size andcomponent analysis of the pyroclastic deposits. J. Volcanol.Geotherm. Res. 38, 287^307.
Belkin, H.E., De Vito, B., Roedder, E., Cortini, M., 1985.Fluid inclusion geobarometry from ejected Mt. Somma-Ve-suvius nodules. Am. Mineral. 70, 288^303.
Buresti, G., Casarosa, C., 1989. One-dimensional adiabatic£ow of equilibrium gas-particle mixtures in long verticalducts with friction. J. Fluid Mech. 203, 251^272.
Buresti, G., Casarosa, C., 1990. A one-dimensional model forthe £ow of equilibrium gas-particle mixtures in variable-areaducts with friction. Atti del Dipartimento di IngegneriaAerospaziale, no. ADIA 90-1, University of Pisa.
Carey, S., Sigurdsson, H., 1987. Temporal variations in col-umn height and magma discharge rate during the 79 ADeruption of Vesuvius. Geol. Soc. Am. Bull. 99, 303^314.
Cioni, R., 2000. Volatile content and degassing processes inthe AD 79 magma chamber at Vesuvius (Italy). Contrib.Mineral. Petrol. 140, 40^54.
Cioni, R., 1998. Pre-eruptive volatiles in AD 79 magma cham-ber of Vesuvius (Italy). Ann. Geophis. 16, 176.
Cioni, R., Marianelli, P., Sbrana, A., 1992. Dynamics ofthe A.D. 79 eruption stratigra¢c, sedimentological andgeochemical data on the successions from the Somma-Vesuvius southern and eastern sectors. Acta Vucanol. 2,109^123.
Cioni, R., Santacroce, R., Sbrana, A., 1999. Pyroclastic depos-its as a guide for reconstructing the multi-stage evolution ofSomma-Vesuvius Caldera. Bull. Volcanol. 60, 207^222.
Cioni, R., Civetta, L., Marianelli, P., Metrich, N., Santacroce,R., Sbrana, A., 1995. Compositional layering and syn-erup-tive mixing of periodically re¢lled shallow magma chamber:the AD 79 Plinian eruption of Vesuvius. J. Petrol. 36, 739^776.
Civetta, L., Galati, R., Santacroce, R., 1991. Magma mixing
VOLGEO 2526 4-11-02
A. Neri et al. / Journal of Volcanology and Geothermal Research 120 (2002) 141^160158
and convective compositional layering within the Vesuviusmagma chamber. Bull. Volcanol. 53, 287^300.
Clarke, A.B., Voight, B., Neri, A., Macedonio, G., 2002. Tran-sient dynamics of vulcanian explosions and column collapse.Nature 415, 897^901.
Dobran, F., 1992. Non-equilibrium £ow in volcanic conduitsand application to the eruption of Mt. St. Helens on May18, 1980, and Vesuvius in 79 AD. J. Volcanol. Geotherm.Res. 49, 285^311.
Dobran, F., Neri, A., Macedonio, G., 1993. Numerical simu-lation of collapsing volcanic columns. J. Geophys. Res. 98,4231^4259.
Dobran, F., Neri, A., Todesco, M., 1994. Assessing pyroclastic£ow hazard at Vesuvius. Nature 367, 551^554.
Kunii, D., Levelspiel, O., 1991. Fluidization Engineering. But-terworth-Heinemann, Newton, WA.
Lange, R.A., Carmichael, I.S.E., 1987. Densities of Na2O-K2O-CaO-MgO-FeO-Fe2O3-Al2O3-TiO2-SiO2 liquids: newmeasurements and derived partial molar properties. Geo-chim. Cosmochim. Acta 51, 2931^2946.
Lirer, L., Munno, R., Petrosino, P., Vinci, A., 1993. Tephro-stratigraphy of the AD79 pyroclastic deposits in perivolcanicareas of Mount Vesuvius (Italy). J. Volcanol. Geotherm.Res. 58, 133^149.
Longo, A., Macedonio, G., Neri, A., Rosi, M., 1998. Simula-zione numerica dello scorrimento di £ussi piroclastici dell’eruzione massima attesa ai Campi Flegrei: Analisi del set-tore est. Rapporto CNR-GNV, Pisa, 35 pp.
Macedonio, G., Pareschi, M.T., Santacroce, R., 1988. A nu-merical simulation of the Plinian fall phase of 79 A.D. erup-tion of Vesuvius. J. Geophys. Res. 93, 14817^14827.
Macedonio, G., Dobran, F., Neri, A., 1994. Erosion processesin volcanic conduits and application to the AD 79 eruptionof Vesuvius. Earth Planet. Sci. Lett. 121, 137^152.
Marianelli, P., Metrich, N., Sanracroce, R., Sbrana, A., 1995.Ma¢c magma batches at Vesuvius; a glass inclusion approchto the modalities of feeding stratovolcanoes. Contrib. Min-eral. Petrol. 120, 159^169.
Marsh, B.D., 1981. On the cristallinity, probability of occur-rence, and rheology of lava and magma. Contrib. Mineral.Petrol. 78, 85^98.
Melnik, O., 2000. Dynamics of two-phase conduit £ow ofhigh-viscosity gas-saturated magma: large variations of sus-tained explosive eruption intensity. Bull. Volcanol. 62, 153^170.
Neri, A., Macedonio, G., 1996. Numerical simulation of col-lapsing volcanic columns with particles of two sizes. J. Geo-phys. Res. 101, 8153^8174.
Neri, A., Papale, P., Macedonio, G., 1998a. The role of mag-ma composition and water content in explosive eruptions.II. Pyroclastic dispersion dynamics. J. Volcanol. Geotherm.Res. 87, 95^115.
Neri, A., Gidaspow, D., Macedonio, G., Barberi, F., 1998b.Simulation of explosive volcanic eruptions by using multi-
Neri, A., Macedonio, G., Gidaspow, D., Esposti Ongaro, T.,2001. Multiparticle simulation of collapsing volcanic col-umns and pyroclastic £ows. VSG Report 2001-2 and subjudice.
Neri, A., Di Muro, A., Rosi, M., 2002. Mass partition duringtransitional and collapsing volcanic columns by using nu-merical simulations. J. Volcanol. Geotherm. Res. 115, 1^18.
Papale, P., 1997. Modeling of the solubility of a one-compo-nent H2O or CO2 £uid in silicate liquids. Contrib. Mineral.Petrol. 126, 237^251.
Papale, P., 1998. Volcanic conduit dynamics. In: Freundt, A.,Rosi, M. (Eds.), From Magma to Tephra, Developments inVolcanology 4. Elsevier, Amsterdam, pp. 55^89.
Papale, P., 1999. Strain-induced magma fragmentation in ex-plosive eruptions. Nature 397, 425^428.
Papale, P., 2001. Dynamics of magma £ow in volcanic con-duits with variable fragmentation e⁄ciency and nonequili-brium pumice degassing. J. Geophys. Res. 106, 11042^11065.
Papale, P., Dobran, F., 1993. Modeling of the ascent of mag-ma during the plinian eruption of Vesuvius in A.D. 79.J. Volcanol. Geotherm. Res. 58, 101^132.
Papale, P., Dobran, F., 1994. Magma £ow along the volcanicconduit during the Plinian and pyroclastic £ow phases of theMay 18, 1980 Mt. St. Helens eruptions. J. Geophys. Res. 99,4355^4373.
Papale, P., Neri, A., Macedonio, G., 1998. The role of magmacomposition and water content in explosive eruptions. I.Conduit ascent dynamics. J. Volcanol. Geotherm. Res. 87,75^93.
Rutherford, M.J., Gardner, J.E., 2000. Rates of magma ascent.In: Sigurdsson, H. (Ed.), Encyclopedia of Volcanoes. Aca-demic Press, San Diego, CA, pp. 207^217.
Shaw, H.R., 1972. Viscosities of magmatic silicate liquids:an empirical method of prediction. Am. J. Sci. 272, 870^893.
Sheridan, M.F., Rosi, M., Santacroce, R., 1981. A model forplinian eruptions of Vesuvius. Nature 289, 282^285.
Sigurdsson, H., Cashdollar, S., Sparks, R.S.J., 1982. The erup-tion of Vesuvius in AD 79: reconstruction from historicaland volcanological evidence. Am. J. Archeol. 86, 39^51.
Sigurdsson, H., Cornell, W., Carey, S., 1990. In£uence of mag-ma withdrawal on compositional gradients during the AD79 Vesuvius eruption. Nature 345, 519^521.
Sigurdsson, H., Carey, S., Cornell, W., Pescatore, T., 1985.The eruption of Vesuvius in AD 79. Natl. Geogr. Res. 1,332^387.
Sparks, R.S.J., Walker, G.P.L., 1977. The signi¢cance of vit-ric-enriched air-fall ashes associated with crystal-enrichedignimbrites. J. Volcanol. Geotherm. Res. 2, 329^341.
A. Neri et al. / Journal of Volcanology and Geothermal Research 120 (2002) 141^160 159
erties of Rocks and Minerals. Hemisphere, New York, 548pp.
Wilson, L., Sparks, R.S.J., Walker, G.P.L., 1980. Explosivevolcanic eruptions. IV. The control of magma propertiesand conduit geometry on eruption column behaviour. Geo-phys. J. R. Astron. Soc. 63, 117^148.
Woods, A.W., Wohletz, K.H., 1991. Dimensions and dynam-ics of co-ignimbrite eruption columns. Nature 350, 225^227.
Woods, A.W., Bower, S.M., 1995. The decompression of vol-canic jets in a crater during explosive volcanic eruptions.Earth Planet. Sci. Lett. 131, 189^205.
VOLGEO 2526 4-11-02
A. Neri et al. / Journal of Volcanology and Geothermal Research 120 (2002) 141^160160