Page 1
ـــــــــــــــــــــــــــــــــــــــــــــــــــــــــــــــــــــــــــــــــــــــــ
This paper will be published at Ashrae journal. For any questions please contact [email protected] .
Dependence of ESD Charge Voltage on Humidity in Data Centers (Part2 - Data Analysis) Atieh Talebzadeh Abhishek Patnaik Xu Gao Mahdi Moradian Yunan Han David E. Swenson David Pommerenke
ABSTRACT
This is Part2 of a three-part paper investigating the dependence of charge voltage generated by
human activity on humidity in data centers. The first paper described the experimental methods, while
this paper is devoted to the analysis of the electrostatic charge voltage levels along the following
parameters: relative humidity, absolute humidity, footwear, flooring, and type of activity. The human
activities studied included well-defined walking, random walking, taking off and dropping a sweater,
and standing up from a chair. This study confirms the importance of footwear and flooring and
quantifies their effectiveness. The results indicate that lower absolute humidity may not always lead to
higher voltages, while reducing the relative humidity will cause the average voltages to increase. The
high voltages created by removing and dropping a sweater and by standing up from a chair indicate
that these types of user activities might pose a higher risk of generating voltages greater than 6 kV
much larger than the walking activities. The analyses are based on the definition of walking, standing,
chair event and sweater event voltages, as presented in Part1.
INTRODUCTION
Typically, triboelectric charging caused by friction between non-conducting objects or between
one conducting and one insulating object creates the charges that may cause an electrostatic discharge
(ESD). Various researchers have studied the effect of the relative humidity (RH) on tribo-charge
generation. Simonic (1981) investigated ESD discharges in different carpeted rooms, confirming the
known strong correlation between the RH and the peak discharge current. For a range of 15% to 55%
RH, a relationship has been derived between the probability of an ESD event occurring at a given
current level and the RH; this relationship states that the probability of an ESD event occurring at a
Page 2
ـــــــــــــــــــــــــــــــــــــــــــــــــــــــــــــــــــــــــــــــــــــــــ
This paper will be published at Ashrae journal. For any questions please contact [email protected] .
given magnitude increases by (RH)-3.39
.Based on this equation, a reduction in the RH from 45% to 15%
increases the probability of ESD event occurrence by a factor of 41(Mardiguian 2009). Simonic’s study
dates back to the late 1980s and investigated carpeted floors, which are no longer used in data centers.
Another report (McFarland 1981) presented a table of voltages measured during various activities, such
as walking across vinyl and synthetic carpet floors, and sliding a styrene box on a carpet. The data from
that table have been cited by other authors (Kolyer and Watson 1996; Allen 1998) as well. According
to Kolyer and Watson (1996), the data, which were measured at nd t , indicates
that for walking across a vinyl floor, decreasing the RH from 80% to 20% increased the voltage by 48
times (from 250 V at 80% RH to 12 kV at 20% RH).Another study (Ryser 1990) presented the voltage
results for walking with different shoes and floor materials under different RH values. For most of the
materials, the charge voltages increased at lower RH values. However, the rate of increase varied
greatly, and some materials yielded no increase. (Greason 1999) showed the effect of the RH on the
charge generation at different temperatures by rolling a metallic ball through different plastic tubes and
measuring the charge accumulated on the ball. The results indicated that for a given temperature,
reducing the RH increased the amount of charge generated.(Keyence 2014) focused on removing
charge from insulators and also presented data on the effect of humidity on the charge generation on
insulated flooring.(Clements-Croome2004)studied the number of electrostatic shocks that people
experienced while walking, rising from a seat, or wearing clothes in outdoor and indoor environments.
In dry weather (RH lower than 30%), people complained about the frequency of electrostatic shocks. In
(Anderson et al.2008), the effect of sitting up from various car seats under different environmental
conditions was discussed. However, each measurement was performed at a specific RH value, which
did not allow for an analysis of the effect of the RH on any one seat/garment combination. Another
study related to automobile seats (Katrak 1995) analyzed the voltages accumulated inside a car and
when a person exited a car. The data indicated that the maximum voltage was reached at a dew point of
approximately0oC.Sharmaet al.(2003) observed that the charge-to-mass ratio increased for polymer
powder deposited on an aluminum panel as a result of reduced RH. Although the paper focused on the
deposition of powder coating, it provided additional data pertaining to the effect of the RH on charge
generation. However, Montoya (2002) suggested that the dew point is more important for charge
Page 3
ـــــــــــــــــــــــــــــــــــــــــــــــــــــــــــــــــــــــــــــــــــــــــ
This paper will be published at Ashrae journal. For any questions please contact [email protected] .
generation; his data indicated that the RH had no effect. The following two reasons generally are cited
for the increase in voltage with reduced RH: 1) reduced conductivity leads to less charge neutralization
by the current, and 2) the charge separation is more effective in dry air. This complex picture is caused
by the multitude of possible material combinations, the type of surface to surface movement and the
fact that some data pertaining to ESD caused by human activity is more anecdotal data rather than the
result of well-documented studies. As all surface effects, triboelectricity depends on not only the
material, but also the atomic surface properties and the environmental conditions. Therefore, it is not
surprising to see so many conflicting conclusions from different experiments. For the study presented
in this paper, 3596 experiments were conducted, having a total of 5645 minutes of recorded time-
domain data. The materials were selected to be as similar as possible to materials used in data centers.
Table 1 shows the environmental conditions under which the measurements were taken. The
following activities were considered: (a) well-defined walking pattern (WDP), (b) random walking, (c)
taking off and dropping a sweater, and (d) standing up from a chair. Other parameters included the
flooring and footwear used.
The results and discussions attempt to answer the following relevant questions of interest:
By how much will the random walking voltage exceed the WDP walking voltage?
By how many times does the voltage in each experiment surpass the threshold, e.g., 1kV?
By what factor will the voltages increase, on average, if the RH value decreases?
How can the effectiveness of ESD-controlling footwear and flooring be quantified?
What is the effect of standing up from a chair or taking off a sweater on the charge voltage
level at different dew points?
How does the control effectiveness vary with the human activity?
Which experiment yields the highest voltage?
Table 1. List of Selected Environmental Conditions
RH (%)
5 41 25 -13.13 8
27 80.6 8 -10 14
18 64.4 15 -8.89 16
38 100.4 8 -1.67 29
27 80.6 25 5 41
Page 4
ـــــــــــــــــــــــــــــــــــــــــــــــــــــــــــــــــــــــــــــــــــــــــ
This paper will be published at Ashrae journal. For any questions please contact [email protected] .
18 64.4 45 5.55 42
27 80.6 45 13.89 57
WELL-DEFINED PATTERN AND RANDOM WALKING EXPERIMENT
The WDP experiment (as explained in the ANSI/ESD STM97.2 test method) provides a walking
voltage and a standing voltage. The random walking pattern (as defined in Part1 of this three-part series
of papers) provides a walking voltage but no standing voltage, as the operator walks continuously. As
discussed in Part1, three voltages were compared for three different types of experiments. The WDP
had been developed and standardized to allow for the best reproducibility, the random walking pattern
better reflects actual walking behavior, and the standing voltage is the voltage on an operator after he
or she stops walking for about 2 seconds. Figure 1 and Figure 2 present a comparison of the voltages
for these three types of experiments for the following six categories of floors and shoes:
1. ESD shoes with ESD floors
2. ESD shoes with medium ESD floors
3. ESD shoes with non-ESD floor
4. Non-ESD shoes with ESD floors
5. Non-ESD shoes with medium ESD floors
6. Non-ESD shoes with non-ESD floor
Table 2 and Table 3present the available shoes and floors for each category. These categories
cover a large set of conditions in data centers and are based on using ESD or non-ESD floors and
shoes.
Table 2. ESD Shoes with Different Types of Floor
ESD Shoes, ESD Floors ESD Shoes, Medium ESD Floors ESD Shoes, Non-ESD Floor
Mid-Range Dissipative ESD
Shoes, Rubber1
Mid-Range Dissipative ESD Shoes,
Vinyl 1
Mid-Range Dissipative ESD
Shoes, High-Pressure Laminate
Mid-Range Dissipative ESD Mid-Range Dissipative ESD Shoes, Low-Range Dissipative ESD
Page 5
ـــــــــــــــــــــــــــــــــــــــــــــــــــــــــــــــــــــــــــــــــــــــــ
This paper will be published at Ashrae journal. For any questions please contact [email protected] .
Shoes, Rubber 2 Vinyl 2 Shoes, High-Pressure Laminate
Low-Range Dissipative ESD
Shoes, Rubber 1
Low-Range Dissipative ESD Shoes,
Vinyl 1 -
Low-Range Dissipative ESD
Shoes, Rubber 2
Low-Range Dissipative ESD Shoes,
Vinyl 2 -
Table 3. List of Non-ESD Shoes with Different Types of Floors
Non-ESD Shoes, ESD
Floors
Non-ESD Shoes, Medium-ESD
Floors
Non-ESD Shoes, Non-ESD
Floor
Deck Shoes 2, Rubber 1 Deck Shoes 1, Vinyl1 Deck Shoes 1, High-Pressure
Laminate
Deck Shoes 2, Rubber 2 Deck Shoes1, Vinyl2 Deck Shoes 2, High-Pressure
Laminate
Deck Shoes 1, Rubber 1 Deck Shoes 2, Vinyl1 Plastic Shoes, High-Pressure
Laminate
Deck Shoes 1, Rubber 2 Deck Shoes 2, Vinyl2 Leather Dress Shoes, High-
Pressure Laminate
Plastic Shoes, Rubber 1 Plastic Shoes, Vinyl1 Running Shoes, High-Pressure
Laminate
Plastic Shoes, Rubber 2 Plastic Shoes, Vinyl2 Deck Shoes 3, High-Pressure
Laminate
Leather Dress Shoes, Rubber1
Leather Dress Shoes, Vinyl1 -
Leather Dress Shoes, Rubber 2
Leather Dress Shoes, Vinyl2 -
Running Shoes, Rubber 1
Running Shoes, Vinyl1 -
Running Shoes, Rubber 2
Running Shoes, Vinyl2 -
Deck Shoes 3, Rubber 1
Deck Shoes 3, Vinyl1 -
Deck Shoes 3, Rubber 2
Deck Shoes 3, Vinyl2 -
Figure 1 shows the voltages as a function of the dew point for the case in which the operator is
wearing ESD-mitigating shoes. The data in Figure 1 (a) were collected by selecting voltages from the
test results for the c tegory “ESD shoes and ESD floors,” nd then t king the ver ge of the volt ges.
Moreover, (b) and (c) show the average voltage for the categories “ESD shoes nd medium ESD
floors” nd “ESD shoes nd non-ESD floors,” respectively. The data show that random walking
produced the highest voltage in most cases, and standing produced the lowest voltage. For the best
combination of materials (ESD shoes and ESD floors),as shown in Figure 1(a), the voltages remained
below 100V. If the judgment of the ESD risk were based solely on the walking voltages obtained
during the 100 sec experiment, one may conclude that using ESD shoes is sufficient to avoid voltages >
Page 6
ـــــــــــــــــــــــــــــــــــــــــــــــــــــــــــــــــــــــــــــــــــــــــ
This paper will be published at Ashrae journal. For any questions please contact [email protected] .
500V,a voltage treshold in (Moradian et al.2013). However, the voltages shown are the average
walking voltages generated while stepping for 100 sec. Especially on the non-ESD floor, this average
gives no assurance that the voltage threshold was not surpassed during the 100 seconds of the
experiment, nor does it exclude this voltage from being surpassed under slightly different conditions or
a longer period of walking time. The third paper in this series discusses using the probability density
function of the measured voltage values to estimate the probability of a voltage exceeding a limit.
Figure 1 Comparison between walking voltage (in WDP), standing voltage (in WDP), and random
walking voltage: (a) average of ESD material, (b) average of ESD shoes and medium ESD floors, and
(c) average of ESD shoes and non-ESD floor.
Figure 2 presents the voltage for the cases in which non-ESD-mitigating shoes were worn during
testing. The data are presented for ESD-mitigating floors, medium floors and non-ESD-mitigating
floors. Figure 2 (a), (b) and (c) present the ver ge volt ges for “non-ESD shoes and ESD floors,”
“non-ESD shoes and medium ESD floors” nd “non-ESD shoes and non-ESD floors,” respectively.
Similar to the data in Figure 1, the random walking voltage values were approximately30% higher than
the well-defined walking voltages. The standing voltage was much lower, having a more complex
variation than the ratio between the random and well-defined walking voltages. Not surprisingly, using
no ESD mitigation methods yielded the highest voltages, as shown in Figure 2. The highest voltages
were measured at 38°C with a dew point of -1.67 °C, as shown in Figure 2 (c). This result indicates that
low RH will promote charge build-up and cause it to remain; however, highly polar water molecules
Page 7
ـــــــــــــــــــــــــــــــــــــــــــــــــــــــــــــــــــــــــــــــــــــــــ
This paper will be published at Ashrae journal. For any questions please contact [email protected] .
are needed to create tribo-charging between certain materials. The distribution of charge voltages
versus the dew point is represented by the dotted, curved line in Figure 2 (c). Similar behavior was
observed by (Katrak1995).
As noted previously, WDP walking was considered for its reproducibility. However, operators do
not follow a WDP, which motivated the authors to introduce the random walking pattern. However,
operators are not likely to touch instruments while walking; they are more likely to stop first and stand
still for a moment before touching any instruments. This likelihood is reflected in the standing voltage.
Consequently, while an analysis using WDP offers better reproducibility and allows for a better
comparison between experiments performed under different environmental conditions, it may
overestimate the voltages compared to the standing voltage and underestimate the voltages relative to
random walking. This effect can be analyzed by comparing the average voltages of random walking,
WDP walking, and standing.
Figure 2 Comparison between WDP walking voltage, standing voltage and random walking voltage
for: (a) average of non-ESD shoes and ESD floors, (b) average of non-ESD shoes and medium ESD
floors and(c) average of non-ESD material.
Figure 3 illustrates the observed ratio between the random walking voltage and WDP walking
voltage for the six categories of shoes and floors based on approximately 280 experiments each for
WDP walking and random walking (8 shoes, 5 floors and 7 environmental conditions). The random
Page 8
ـــــــــــــــــــــــــــــــــــــــــــــــــــــــــــــــــــــــــــــــــــــــــ
This paper will be published at Ashrae journal. For any questions please contact [email protected] .
walking voltage was greater than the WDP walking voltage at almost all dew points (ratio greater than
1). The ratio varied between 1 and 2. This was the result of the higher walking speeds during random
walking, further enhanced by shoe dragging and scraping during walking.
Figure 3 Ratio between the average random walking voltage and WDP voltage for three different
floors with: (a) ESD shoes and (b) non-ESD shoes.
As shown previously in Figure 2 (c), the voltage decreased at lower dew points (dotted, curved
line). The next step was to analyze the effect of the RH, as shown in. Two categories were selected:
ESD shoes with ESD floors (Figure 4 (a)), and non-ESD shoes with non-ESD floors (Figure 4 (b)).In
the figures, a dashed line connects the data obtained at 27 °C. Comparing (a) and (b) shows that the
voltage level for the non-ESD material set was higher than for the ESD material set. The voltages
increased as the humidity decreased. To quantify this increase, a Relative Humidity Voltage (RHV)
factor was defined by normalizing the voltages at a lower humidity to the voltages at reference
humidity. The factor indicates how much the voltage would increase on average if a data center
changed the humidity without changing the operator activities, flooring or footwear.
Page 9
ـــــــــــــــــــــــــــــــــــــــــــــــــــــــــــــــــــــــــــــــــــــــــ
This paper will be published at Ashrae journal. For any questions please contact [email protected] .
Figure 4 WDP walking voltage versus RH reduction for: (a) ESD shoes, ESD floors and (b)
non-ESD shoes, non-ESD floor.
VOLTAGE DISTRIBUTION
In data centers, not only are the average voltages of interest, but so are the occurrences of high-
voltage events, which might be under estimated when analyzing only the average voltage. The
distribution of the observed voltages appears in Figure 5. The histogram was obtained using the
following steps. For each recorded voltage versus time waveform, the walking voltage was obtained
(Part1 of this series). This yielded 280 walking voltage values for 7 environmental conditions, 8 shoe
types and 5 floor types. Each subfigure shows the distribution under one environmental condition.
Furthermore, the number of occurrences of V > 1kV is indicated. For example, at a de point of -
. Figure 5 (d)), the WDP walking voltage exceeded 1kVeleven times. However, for the lowest
and highest dew points (Figure 5 (a) and (g)), there were two and zero instances, respectively, where
the voltage was higher than 1kV. Only considering the voltage was greater than 1kV four times
at 8% RH (Figure 5 (b)), while at 25% RH (Figure 5 (e)), only one WDP exceeded 1kV. No such
instances occurred at 45%RH (Figure 5 (g)).
Page 10
ـــــــــــــــــــــــــــــــــــــــــــــــــــــــــــــــــــــــــــــــــــــــــ
This paper will be published at Ashrae journal. For any questions please contact [email protected] .
Figure 5 Distribution of walking voltage versus the dew points for WDP walking experiment.
Random walking yielded higher voltages; the distributions appear in Figure 6.At , a walking
voltage > 1kV was observed in 16 experiments at 8%RH (Figure 6 (b)), and in 8 experiments at 25%
RH (Figure 6 (b)).The voltages did not exceed 1kV at 45% RH (Figure 6 (g)).
Figure 6 Distribution of walking voltage versus dew points for the random walking experiment.
Page 11
ـــــــــــــــــــــــــــــــــــــــــــــــــــــــــــــــــــــــــــــــــــــــــ
This paper will be published at Ashrae journal. For any questions please contact [email protected] .
Figure 7 shows the number of experiments that recorded a walking voltage > 1kV for WDP and
random walking at different dew points. The approximate overall behavior is indicated by a dashed
line. The average voltages (Figure 2(c)) and the distributions (
Figure 7(a)) follow the same trend.
Figure 7 Number of experiments that recorded a walking voltage > 1 kV for: (a)WDP walking voltage
and (b) random walking voltage.
RHV DEFINITION
The RHV factor is defined as the ratio of the walking voltage at a higher RH to the walking
voltage at a lower RH. It expresses that the voltage increases as the humidity decreases. o c lcul te
this f ctor three de points t having a RH of 8%, 25% and 45% RH were selected.
As discussed in the introduction, the data in the literature came from studying a wide range of
materials, and the experimental setups often were not documented well. The data from the literature
were processed and compared to data from the two sets of experiments performed in the present study.
Page 12
ـــــــــــــــــــــــــــــــــــــــــــــــــــــــــــــــــــــــــــــــــــــــــ
This paper will be published at Ashrae journal. For any questions please contact [email protected] .
First, the voltage data were normalized to voltages at a high RH. Next, a function was fitted to the data
points and extrapolated to 8% RH. Due to the varying experimental conditions and the uncertainty
introduced by the extrapolation, the resulting data were only able to provide a qualitative impression. In
the data from the literature, an average 3.5-fold voltage increase occurred when the humidity decreased
from 45% RH to 8% RH, as shown in
Figure 8. Different setups and material pairings may explain this wide spread.
Figure 8 Increase of voltages with reduced humidity based on data from the literature.
The second RHV prediction was based on studies by (Fayu et al2013; Moradian et al2014), which
measured walking voltages at 60% RH, 35% RH and 15% RH. Applying a similar normalization,
fitting and extrapolation methodology yielded the predictions shown in Figure 9. The low-risk cases
(ESD shoes, ESD floor) exhibited the largest increase. However, as the voltage levels remain low even
when the RH decreased to 8% RH, they did not pose a risk. The cases with the highest voltage (non-
ESD shoes and non-ESD floor) only exhibited a moderate increase. This overall behavior is similar to
the data presented in Figure 8.
Page 13
ـــــــــــــــــــــــــــــــــــــــــــــــــــــــــــــــــــــــــــــــــــــــــ
This paper will be published at Ashrae journal. For any questions please contact [email protected] .
Figure 9 Prediction of the normalized voltage increase with reduced humidity based on the studies by
(Fayu et al2013; Moradian et al2014) for WDP walking.
Table 4 summarizes the resulting factors. For the combination that yielded the highest voltages
(non-ESD shoes and non-ESD floor), this previous study predicted a factor of 2.3, and a much larger
factor of 16 for the ESD shoes and ESD floors category, which posed no risk due to the low voltage
levels
Table 4. Prediction of RHV factor based on Figure 9
Category Predicted RHV factor (45%
to 8%RH)
ESD Shoes, ESD Floors 16
ESD Shoes, Medium-ESD Floors 3.8
ESD Shoes, Non-ESD Floor 2.9
Non-ESD Shoes, ESD Floors 19
Non-ESD Shoes, Medium-ESD Floors 2.85
Non-ESD Shoes, Non-ESD Floor 2.3
All Shoes, All Floors 3.2
The measurements from the current study verified those previous predictions. The relative voltage
increase was analyzed at three RH conditions, i.e., 45% RH, 25% RH and 8% RH, t Table 5).
The extrapolation results also appear in the table of WDP walking voltages (Table 5).
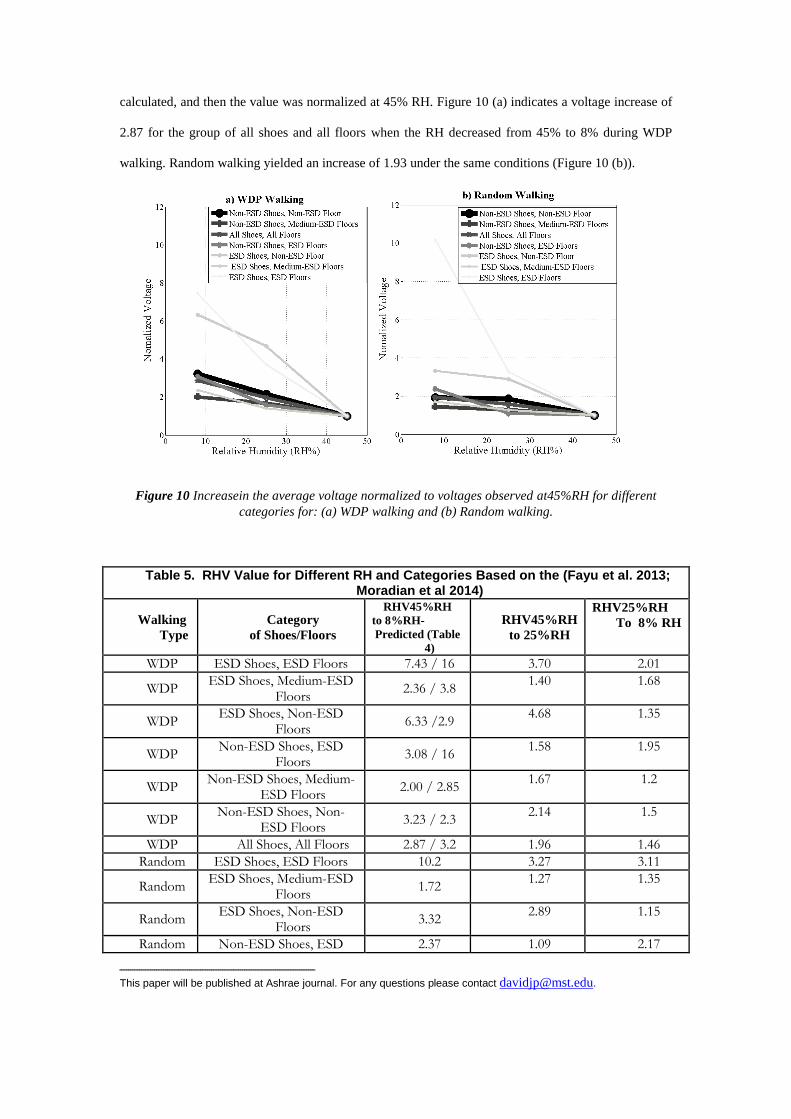
Figure 10 illustrates the normalized voltages for random and WDP walking. The same
methodology was used to process these data. For each category, the average walking voltage was
Page 14
ـــــــــــــــــــــــــــــــــــــــــــــــــــــــــــــــــــــــــــــــــــــــــ
This paper will be published at Ashrae journal. For any questions please contact [email protected] .
calculated, and then the value was normalized at 45% RH. Figure 10 (a) indicates a voltage increase of
2.87 for the group of all shoes and all floors when the RH decreased from 45% to 8% during WDP
walking. Random walking yielded an increase of 1.93 under the same conditions (Figure 10 (b)).
Figure 10 Increasein the average voltage normalized to voltages observed at45%RH for different
categories for: (a) WDP walking and (b) Random walking.
Table 5. RHV Value for Different RH and Categories Based on the (Fayu et al. 2013; Moradian et al 2014)
Walking
Type
Category
of Shoes/Floors
RHV45%RH
to 8%RH-
Predicted (Table
4)
RHV45%RH
to 25%RH
RHV25%RH
To 8% RH
WDP ESD Shoes, ESD Floors 7.43 / 16 3.70 2.01
WDP ESD Shoes, Medium-ESD
Floors 2.36 / 3.8
1.40 1.68
WDP ESD Shoes, Non-ESD
Floors 6.33 /2.9
4.68 1.35
WDP Non-ESD Shoes, ESD
Floors 3.08 / 16
1.58 1.95
WDP Non-ESD Shoes, Medium-
ESD Floors 2.00 / 2.85
1.67 1.2
WDP Non-ESD Shoes, Non-
ESD Floors 3.23 / 2.3
2.14 1.5
WDP All Shoes, All Floors 2.87 / 3.2 1.96 1.46
Random ESD Shoes, ESD Floors 10.2 3.27 3.11
Random ESD Shoes, Medium-ESD
Floors 1.72
1.27 1.35
Random ESD Shoes, Non-ESD
Floors 3.32
2.89 1.15
Random Non-ESD Shoes, ESD 2.37 1.09 2.17
Page 15
ـــــــــــــــــــــــــــــــــــــــــــــــــــــــــــــــــــــــــــــــــــــــــ
This paper will be published at Ashrae journal. For any questions please contact [email protected] .
Floors
Random Non-ESD Shoes, Medium-
ESD Floors 1.44
1.28 1.13
Random Non-ESD Shoes, Non-
ESD Floors 1.91
1.85 1.03
Random All Shoes, All Floors 1.93 1.57 1.23
The following conclusions can be drawn from the data obtained from the walking experiments:
Reducing the RH from 45% to 8% and having no ESD mitigation will increase the
voltage levels by a factor of 2-3, while reducing the RH from 25% to 8% will increase the
voltage by a factor of 1-2.
The RHV is much larger in settings with good ESD mitigation. The larger increase poses
no risk because the voltage remains low.
ANALYSIS OF TWO OPERATOR ACTIONS: (1) SITTING UP FROM A CHAIR AND (2)
DROPPING A SWEATER
Part1of this series defined the event voltage. The following two unrelated operator actions were
considered: 1) sitting up from a non-ESD-mitigating chair and 2) taking off and dropping a sweater.
Three chairs and three sweaters were usedin the experiment,and the average event voltages were
considered. Figure 11 compares the average voltages generated during five different actions: random
walking, WDP walking, standing, taking off and dropping a sweater and sitting up from a chair. Sitting
up from a chair caused the highest recorded event voltages. ESD shoes worn on ESD-mitigating
flooring produced only 900V, as shown in Figure 11 (a)), at a dew point of10 °C (27 °C & 8% RH).
The figure indicates the tendency of ESD-mitigating flooring and shoes to have less of an effect on the
chair and sweater event voltages than on the walking voltages. The last section of this article
investigates the effectiveness of ESD-mitigating conditions in detail.
Page 16
ـــــــــــــــــــــــــــــــــــــــــــــــــــــــــــــــــــــــــــــــــــــــــ
This paper will be published at Ashrae journal. For any questions please contact [email protected] .
Figure 11 Average voltages as a function of dew point for: (a) ESD shoes with ESD floors, (b) ESD
shoes with medium ESD floors and (c) ESD shoes with non-ESD floors.
Figure 12presents the results of five experiments conducted at the same dew points for three
categories, including non-ESD shoes with different types of floors (ESD, medium ESD and non-ESD).
The event voltages when wearing non-ESD shoes (Figure 12) were approximately 3-5 times greater
than when wearing ESD mitigating shoes (Figure 11). Moreover, the capacitance of the participant
changed during the sitting and standing experiment, so the voltage changed significantly just due to the
capacitance changes (V=Q/C).Table 6 presents the measured capacitance between three used chair and
participant. The measurement was done by a LCR meter at 100 kHz.
Page 17
ـــــــــــــــــــــــــــــــــــــــــــــــــــــــــــــــــــــــــــــــــــــــــ
This paper will be published at Ashrae journal. For any questions please contact [email protected] .
Figure 12 Comparison of all four experiments based on walking, standing, and event voltages for: (a)
average of non-ESD shoes with ESD flooring, (b) average of non-ESD shoes with medium ESD
flooring and (c) non-ESD shoes with non-ESD flooring.
Table 6. Capacitance between Chair and Participant
Chair Standing Mode Sitting Mode
Chair #1 16.5 pF 78 pF
Chair #2 20 pF 137 pF
Chair #3 16 pF 43.4 pF
EVENT VOLTAGE DISTRIBUTION DIAGRAM
Figure 13 shows the distribution of the average event voltages for 3 chairs and 3 sweaters among
40 combinations of floors and shoes at 27°C and 8%, 25% and 45% RH. The total number of voltages
> 1kV is indicated for each condition. The histogram in Figure 13(a) indicates that the sweater event
produced 29 such voltages at 27 °C and 8% RH (-10°C dew point). The chair event produced 32 such
voltages (Figure 13 (b)). These results are comparable with the walking voltage results (i.e., 4 for WDP
walking and 16 for random walking), which were shown in Figure 5 (b) and Figure 6 (b). These
numbers indicate that the event voltage distribution occurred at a higher voltage level than the walking
voltage. Furthermore, the sweater event voltage varied between 1-4kV at 27 °C and 8% RH, while the
chair event voltage distribution ranged from 1-8.5 kV. This voltage distribution shows that standing up
from a chair yielded higher event voltage than taking off and dropping a sweater. Moreover, the lower
RH value (8% RH) had more experiments with an event voltage > 1 kV than the higher RH value (8%
RH).
Page 18
ـــــــــــــــــــــــــــــــــــــــــــــــــــــــــــــــــــــــــــــــــــــــــ
This paper will be published at Ashrae journal. For any questions please contact [email protected] .
Figure 13 Distribution of event voltages for different dew points. The three top subfigures are related
to sweater event voltages and three bottom subfigures are related to chair event voltages.
RHV FACTORSFOR CHAIR AND SWEATER EVENTS
Figure 14 shows the average event voltages of 3 chair events and 3 sweater events for each of six
shoe and floor categories. The RHV factor for the event voltages can be derived in a way similar to that
for the walking voltage. Table 7summarizes each category. For example, the RHV factors for the chair
event voltage (considering all shoes and all floors) were 4 (45% RH reduced to 8%RH) and 1.18 (25%
RH reduced to 8%RH). The RHV factors for the sweater event voltage were 7 and 2.07 before and
after the RH reduction, respectively. Furthermore, the average RHV values for all user actions (i.e.,
event voltages, random walking and WDP walking) were 3.8 (45% RH reduced to 8%RH) and 1.5
(25% RH reduced to 8%RH).
Page 19
ـــــــــــــــــــــــــــــــــــــــــــــــــــــــــــــــــــــــــــــــــــــــــ
This paper will be published at Ashrae journal. For any questions please contact [email protected] .
Figure 14 Average of event voltages for 7 categories of shoes and floors for: (a) chair event and (b)
sweater event.
Table 7. RHV Value for Different RH and Categories
Experiment Category
of Shoes/Floors
RHV 8%RH
per 45%RH
RHV25%RH
per 45%RH
RHV8%RH
per 25%RH
Chair ESD Shoes, ESD
Floors 5.21 2.95
1.77
Chair ESD Shoes, Medium-
ESD Floors 5.11 2.95
1.73
Chair ESD Shoes, Non-
ESD Floors 2.49 3.12
0.796
Chair Non-ESD Shoes,
ESD Floors 3.05 2.94
1.04
Chair Non-ESD Shoes,
Medium-ESD Floors
4.34 3.17 1.37
Chair Non-ESD Shoes,
Non-ESD Floors 2.98 2.79
1.07
Chair All Shoes, All Floors 3.52 2.97 1.18
Sweater ESD Shoes, ESD
Floors 9.86 5.29
1.87
Sweater ESD Shoes, Medium-
ESD Floors 8.17 2.82
2.9
Sweater ESD Shoes, Non-
ESD Floors 6.34 3.71
1.71
Sweater Non-ESD Shoes,
ESD Floors 9.06 3.94
2.3
Sweater Non-ESD Shoes,
Medium-ESD Floors
7.74 3.36 2.3
Sweater Non-ESD Shoes,
Non-ESD Floors 4.61 2.88
1.6
Sweater All Shoes, All Floors 7.02 3.39 2.07
Page 20
ـــــــــــــــــــــــــــــــــــــــــــــــــــــــــــــــــــــــــــــــــــــــــ
This paper will be published at Ashrae journal. For any questions please contact [email protected] .
ESD EFFECTIVENESS
To quantify the effect of ESD-mitigating floors and shoes, ESD effectiveness must be defined.
ESD effectiveness is the ratio between the voltage measured using non-ESD-mitigating floors and
shoes, and the voltage measured using ESD-mitigating floors and shoes. Figure 15 presents the ESD
effectiveness for the dew points measured, and Table 8 presents the values. The maximum ESD
effectiveness was 116, calculated for the standing voltage at the critical conditions of 38°C and 8% RH.
It remains unclear whether the walking, random or standing voltage yielded higher ESD effectiveness,
no systematic trend was observed. However, the ESD effectiveness clearly was much lower for the
sweater and chair event voltages, dropping below 10 in some cases. This finding, together with the high
event voltages measured for the chair and sweater events, emphasizes the need to avoid standard office
chairs and to educate personnel about this risk. However, one must remember that the event voltage
only represents the increase at the moment of the event. If the floor and shoes are conductive, the
voltage will decay within a few seconds. This quick discharge is not reflected in the definition of ESD
effectiveness, which only takes the momentary voltages into account.
Figure 15 ESD effectiveness defined as the ratio of voltage for non-ESD-mitigating conditions to ESD-
mitigating conditions, shown here for four different environmental conditions.
Page 21
ـــــــــــــــــــــــــــــــــــــــــــــــــــــــــــــــــــــــــــــــــــــــــ
This paper will be published at Ashrae journal. For any questions please contact [email protected] .
Table 8. ESD Effectiveness (ESD Material to Non-ESD Material)
Experiment 27 °C&8%RH
38 °C & 8%RH
27°C & 25%RH
27°C& 45%RH
Standing (WDP) voltage 24.31 116.38
12.55 25.92
Walking (WDP) voltage 11.59 44.21
15.49 26.71
Walking (random) voltage 13.94 58.6
41.98 74.37
Sweater event voltage 4.42 10.36 5.16 9.46
Chair event voltage 4.15 9.97 6.85 7.24
CONCLUSION
This paper analyzed the charge voltages measuredfor walking and other experiments for dew
points from -13.13 to 13.89 °C using RH values between 8% and 45%. Different ESD-mitigating and
non-ESD mitigating flooring systems and shoes were used.The following five types of user activities
wereconsidered: WDP walking, random walking, standing, sitting up from a chair and removing and
dropping a sweater.The data suggest that:
Reducing the RH increases the average voltages.
Decreasing the RH from 45% to 8% at 27°C leads to an average voltage increase between
3 and 4.
Reducing the RH from 25% to 8% at 27°C leads to an average voltage increase between 2
and 3.
As the dew point decreases, the voltages initially increase; however, if the dew point falls
below -10°C, the voltages decrease.
The effectiveness of ESD mitigating methods is very high for walking. However, for
sitting up from a chair or dropping a sweater, ESD footwear and ESD flooring is less
effective at reducing the charge voltages. However, they still provide a fast discharge
path.
Page 22
ـــــــــــــــــــــــــــــــــــــــــــــــــــــــــــــــــــــــــــــــــــــــــ
This paper will be published at Ashrae journal. For any questions please contact [email protected] .
The high voltages created by removing and dropping a sweater or standing up from a
chair indicate that these types of user activities might pose a higher risk of inducing
voltages greater than 2 kV in comparison with walking.
Standing up from a chair produced the highest event voltage. Therefore, using an ESD-
mitigating chair could be a reasonable requirement in data centers.
ACKNOWLEDGMENTS
We thank ASHRAE TC 9.9 for supporting this work.
REFERENCES
Allen, R. C. 1998. Humidity and ESD control. ESD Systems. Desco Industries, Inc.
http://esdsystems.descoindustries.com/whitepapers/wp_humidity.html
Andersson, B., L. Fast, P. Holdstock, D. Pirici. 2008. Charging of a person exiting a car seat.
In Journal of Physics: Conference Series. IOP Publishing, (142)1.
ANSI/ESD STM97.2-2006. 2006. For the protection of electrostatic discharge susceptible items-
Floor material and footwear-voltage measurement in combination with a person. Rome: American
National Standards Institute.
ATT-TP-76306 Electrostatic Discharge Control, 2009.
https://ebiznet.sbc.com/sbcnebs/Documents/ATT-TP-76306.pdf
Clements-Croome, D. 2004. Electromagnetic environments and health in buildings. Taylor & Francis.
Fayu, W., D.E.Swenson, M.Hillstrom, D.Pommerenke, and C.Stayler. 2013. The effect of humidity on
static electricity induced reliability issues of ICT equipment in data centers —Motivation and
setup of the study. ASHRAE Transaction 119(2): DE-13-031.
Greason, W. D. 1999. Investigation of a test methodology for triboelectrification. Electrical Overstress/
Electrostatic Discharge Symposium Proceedings, Orlando, FL, USA, 344-5.
Katrak, K. 1995.Human body electrostatic charge (ESC) levels: Are they limited by corona bleed off or
environmental conditions? Electrical Overstress/Electrostatic Discharge Symposium
Proceedings,Milford, MI, USA, 73-12.
Keyence. 2014. Static electricity and static eliminator resource site. Static electrocity solution for
insulators. http://www.keyence.com/ss/products/static/resource/solution/insulator.jsp.
Kolyer, J. M., D. Watson. 1996. ESD from A to Z. Springer.
Mardiguian, M. 2009.Electrostatic discharge: Understand, simulate and fix ESD problems. 3rd
Edition.Wiley-IEEE Press.
McFarland, W.Y. 1981. The economic benefits of an effective ESD awareness and control program-an
empirical analysis. Electrical Overstress/Electrostatic Discharge Symposium Proceedings,EOS
3:28.
Montoya, A. 2002. Effect of dew point and relative humidity in electrostatic charge control.
http://www.sematech.org/meetings/archives/esd/20021014/montoya.pdf
Moradian, M., F.Wan, A.Patnaik, D.Pommerenke, Y.Han, D.E.Swenson. 2014. Determination of the
effect of humidity on the probability of ESD failure or upset in data centers. ASHRAE Transaction
120(2): SE-14.
Ryser, H. 1990. The relationship between ESD test voltage and personnel charge voltage. In
Proceedings of EOS/ESD Symposium Orlando: Session2 – paper1.
Simonic, R. 1981.Personal ESD statistics.IEEE/EMC Symposium. Boulder, CO.
Sharma, R., S.Trigwell, A.S.Biris, R.A.Sims, M.K.Mazumder. 2003. Effect of ambient relative
humidity and surface modification on the charge decay properties of polymer powders in powder
coating. IEEE Transactions on Industry Applications (39).
Page 23
ـــــــــــــــــــــــــــــــــــــــــــــــــــــــــــــــــــــــــــــــــــــــــ
This paper will be published at Ashrae journal. For any questions please contact [email protected] .
Talebzadeh, A., M.Moradian, Y.Han, A.Patnaik, D.E.Swenson, D.Pommerenke. 2014. Determination
of ESD charge voltage on humidity in data centers (Part1-Test Methods). Manuscript submitted to
ASHRAE Transaction for review.