151
| Date post: | 31-Mar-2023 |
| Category: |
Documents |
| Upload: | khangminh22 |
| View: | 0 times |
| Download: | 0 times |
UNIVERSITÀ DEGLI STUDI DI URBINO CARLO BO
Dipartimento di Scienze Pure e ApplicateScuola di Scienze e Tecnologie dell'Informazione
Ph.D. Thesis
DESIGN OF A SCENARIO-BASED
IMMERSIVE EXPERIENCE ROOM
Tutor: Candidate:
Prof. Alessandro Bogliolo Cuno Lorenz Klopfenstein
Dottorato in Scienze della Terra e Scienza della Complessità
Ciclo XXVIII

Contents
List of Figures 7
1 Introduction 9
1.1 Overview of this work . . . . . . . . . . . . . . . . . . . . . . . 19
1.2 Contributions and acknowledgements . . . . . . . . . . . . . 19
2 Large-scale visualization 21
2.1 Experience . . . . . . . . . . . . . . . . . . . . . . . . . . . . . . 21
2.2 Technological overview . . . . . . . . . . . . . . . . . . . . . . 25
2.2.1 Single large displays . . . . . . . . . . . . . . . . . . . . 25
2.2.2 Multi-monitor desktops . . . . . . . . . . . . . . . . . . 27
2.2.3 Tiled displays . . . . . . . . . . . . . . . . . . . . . . . . 28
2.2.4 Multi-projector arrays . . . . . . . . . . . . . . . . . . . 30
2.2.5 Stereoscopic displays . . . . . . . . . . . . . . . . . . . 32
2.3 Usability . . . . . . . . . . . . . . . . . . . . . . . . . . . . . . . . 32
2.3.1 Bene�ts . . . . . . . . . . . . . . . . . . . . . . . . . . . . 33
2.3.2 Issues . . . . . . . . . . . . . . . . . . . . . . . . . . . . . 35
2.4 Immersive visualization . . . . . . . . . . . . . . . . . . . . . . 38
2.4.1 Small-scale displays . . . . . . . . . . . . . . . . . . . . 39
2.4.2 Medium-scale displays . . . . . . . . . . . . . . . . . . 41
2.4.3 Large-scale displays . . . . . . . . . . . . . . . . . . . . 43
3 Scalable Adaptive Graphics Environment 45
3.1 Architecture . . . . . . . . . . . . . . . . . . . . . . . . . . . . . 47
3.1.1 Frame buffer and tiling . . . . . . . . . . . . . . . . . . 48
3.1.2 Components . . . . . . . . . . . . . . . . . . . . . . . . . 51
3.1.2.A Free Space Manager . . . . . . . . . . . . . . 52
3.1.2.B Receivers . . . . . . . . . . . . . . . . . . . . . 52
3.1.2.C Applications . . . . . . . . . . . . . . . . . . . 53
3
4 CONTENTS
3.1.2.D Controllers . . . . . . . . . . . . . . . . . . . . 57
3.2 Communication and streaming . . . . . . . . . . . . . . . . . . 62
3.2.1 Interconnection . . . . . . . . . . . . . . . . . . . . . . . 63
3.2.2 Reliable Blast UDP . . . . . . . . . . . . . . . . . . . . . 64
3.2.3 Message passing protocol . . . . . . . . . . . . . . . . . 66
3.3 Drawing and composition . . . . . . . . . . . . . . . . . . . . . 67
3.3.1 Pixel-streaming protocol . . . . . . . . . . . . . . . . . 68
3.3.2 Pixel encoding . . . . . . . . . . . . . . . . . . . . . . . . 69
3.3.3 Composition pipeline . . . . . . . . . . . . . . . . . . . 70
3.4 Synchronization . . . . . . . . . . . . . . . . . . . . . . . . . . . 73
3.4.1 Synchronization channels . . . . . . . . . . . . . . . . 74
3.4.2 Rendering synchronization . . . . . . . . . . . . . . . . 74
3.4.3 Display synchronization . . . . . . . . . . . . . . . . . . 75
3.4.4 Effects on performance and scalability . . . . . . . . . 77
3.5 Performance . . . . . . . . . . . . . . . . . . . . . . . . . . . . . 77
3.6 Interoperation . . . . . . . . . . . . . . . . . . . . . . . . . . . . 79
3.6.1 SAIL interface . . . . . . . . . . . . . . . . . . . . . . . . 80
3.6.2 Control messaging . . . . . . . . . . . . . . . . . . . . . 83
3.6.2.A Message format . . . . . . . . . . . . . . . . . 83
3.6.2.B Application IDs . . . . . . . . . . . . . . . . . 86
4 Immersive Virtual Environment for SAGE 89
4.1 Software architecture . . . . . . . . . . . . . . . . . . . . . . . . 90
4.2 Implementation . . . . . . . . . . . . . . . . . . . . . . . . . . . 94
4.2.1 Messaging protocol . . . . . . . . . . . . . . . . . . . . . 94
4.2.1.A Message transport . . . . . . . . . . . . . . . . 95
4.2.1.B Message encoding and types . . . . . . . . . 96
4.2.1.C Message routing . . . . . . . . . . . . . . . . . 100
4.2.1.D Application identi�cation . . . . . . . . . . . 101
4.2.1.E Sample message exchange . . . . . . . . . . 101
4.2.2 Interoperation with SAGE . . . . . . . . . . . . . . . . . 103
4.2.3 User management and security . . . . . . . . . . . . . 105
4.2.4 Auto discovery . . . . . . . . . . . . . . . . . . . . . . . 105
4.2.5 Load balancing . . . . . . . . . . . . . . . . . . . . . . . 106
4.2.6 IVE controller for Android . . . . . . . . . . . . . . . . 107
4.3 Experimental setup . . . . . . . . . . . . . . . . . . . . . . . . . 109

CONTENTS 5
5 Hardware acceleration 111
5.1 SAGE2 . . . . . . . . . . . . . . . . . . . . . . . . . . . . . . . . . 112
5.1.1 Architecture . . . . . . . . . . . . . . . . . . . . . . . . . 113
5.1.2 Application model . . . . . . . . . . . . . . . . . . . . . 115
5.1.3 Video streaming model . . . . . . . . . . . . . . . . . . 117
5.1.3.A Pull streaming . . . . . . . . . . . . . . . . . . 118
5.1.3.B Push streaming . . . . . . . . . . . . . . . . . 119
5.2 Renderer acceleration . . . . . . . . . . . . . . . . . . . . . . . 120
5.2.1 Chromium architecture . . . . . . . . . . . . . . . . . . 121
5.2.2 Video decoder pipeline . . . . . . . . . . . . . . . . . . 123
5.2.3 Decoder acceleration . . . . . . . . . . . . . . . . . . . 124
5.3 Server acceleration . . . . . . . . . . . . . . . . . . . . . . . . . 125
5.4 Proof of concept implementation . . . . . . . . . . . . . . . . 126
5.4.1 Hardware . . . . . . . . . . . . . . . . . . . . . . . . . . 126
5.4.2 Implementation . . . . . . . . . . . . . . . . . . . . . . . 127
5.4.3 Benchmarks . . . . . . . . . . . . . . . . . . . . . . . . . 129
5.5 Modular acceleration with embedded systems . . . . . . . . 131
6 Conclusions 133
Tour of the ArtRoom 135
Acknowledgments 141
Bibliography 143

6 CONTENTS
List of Figures
1.1 Gestural interface as seen in “Minority Report” . . . . . . . . 15
1.2 Live performance using the “Audiovisual Environment Suite” 16
1.3 Screenshot of “Glasbead” by John Klima . . . . . . . . . . . . 17
2.1 Microsoft Surface Hub . . . . . . . . . . . . . . . . . . . . . . . 26
2.2 Sky Screen in Suzhou (China) . . . . . . . . . . . . . . . . . . . 26
2.3 Tiled display setup with 8 LCD monitors . . . . . . . . . . . . 29
2.4 Large curved monitor . . . . . . . . . . . . . . . . . . . . . . . . 34
2.5 Oculus VR Rift virtual reality headset . . . . . . . . . . . . . . 40
2.6 Microsoft HoloLens . . . . . . . . . . . . . . . . . . . . . . . . . 41
2.7 CAVE projection schematic . . . . . . . . . . . . . . . . . . . . 42
2.8 CAVE installation . . . . . . . . . . . . . . . . . . . . . . . . . . 43
3.1 Sample SAGE use-case . . . . . . . . . . . . . . . . . . . . . . . 47
3.2 SAGE architecture overview . . . . . . . . . . . . . . . . . . . . 49
3.3 Examples of frame buffer tiling in SAGE . . . . . . . . . . . . 51
3.4 SAGE pointer running on computer desktop . . . . . . . . . 58
3.5 Manipulating SAGE through Microsoft Kinect . . . . . . . . . 60
3.6 SAGE Web Control interface . . . . . . . . . . . . . . . . . . . 61
3.7 RBUDP communication scheme . . . . . . . . . . . . . . . . . 65
3.8 Split streaming from application to multiple receivers . . . . 69
3.9 SAGE receiver architecture and synchronization mechanism 76
3.10 Sample SAGE ECL message . . . . . . . . . . . . . . . . . . . . 84
4.1 IVE architecture overview . . . . . . . . . . . . . . . . . . . . . 91
4.2 Relations between IVE and SAGE components . . . . . . . . 92
4.3 Message routing in IVE . . . . . . . . . . . . . . . . . . . . . . . 96
4.4 Application load balancing scheme . . . . . . . . . . . . . . . 107
4.5 Android application controlling IVE . . . . . . . . . . . . . . . 108
7
8 LIST OF FIGURES
4.6 IVE installation . . . . . . . . . . . . . . . . . . . . . . . . . . . . 109
5.1 SAGE2 architecture overview . . . . . . . . . . . . . . . . . . . 114
5.2 Pull streaming scheme . . . . . . . . . . . . . . . . . . . . . . . 118
5.3 Push streaming scheme . . . . . . . . . . . . . . . . . . . . . . 119
5.4 Chromium video decoder architecture . . . . . . . . . . . . . 122
5.5 VP9 format stream layout . . . . . . . . . . . . . . . . . . . . . 123
5.6 Texas Instruments Keystone II 66AK2H12 board . . . . . . . 127
5.7 Control �ow of hardware accelerated frame decoding . . . . 128
5.8 VP9 decoding performance on CPU . . . . . . . . . . . . . . . 130
5.9 VP9 decoding performance on CPU (NEON) . . . . . . . . . . 130
5.10 Comparison of VP9 decoding performance on CPU and DSP 131
A.1 ArtRoom from the outside . . . . . . . . . . . . . . . . . . . . . 135
A.2 ArtRoom installation location . . . . . . . . . . . . . . . . . . . 136
A.3 Projector running the ArtRoom . . . . . . . . . . . . . . . . . . 136
A.4 Projector bracketing inside the ArtRoom . . . . . . . . . . . . 137
A.5 Screen alignment in the ArtRoom . . . . . . . . . . . . . . . . 138
A.6 Video playback inside the ArtRoom . . . . . . . . . . . . . . . 138
A.7 Immersive projection inside the ArtRoom . . . . . . . . . . . 139
Chapter 1
Introduction
Thought is impossible without an image.
— Aristotle, “On Memory and Recollection”
Since the advent of computers and digital equipment, an evergrowing effort
of research and engineering has been devoted to applying digital processing
techniques to the management of multimedia data. The de�ning charac-
teristics of digital multimedia is the incorporation of multiple, continuous
kinds of information, such as voice, full-motion video, music, images, and
the interweaving animation thereof, in a digital medium. In the last decades,
advances in multimedia systems and applications have merged and pushed
the interests, ambitions and innovations of three industries: computing,
communication and broadcasting.
Research and development efforts in multimedia computing fall into
two major groups.
On one hand there is continuous ongoing development focused on the
aspects of content production and user-facing multimedia applications.
That is, software systems and tools aiding music composition, video editing
and playback, or computer-aided learning.
On the other hand, there is ongoing fundamental research in how mul-
timedia content is encoded, delivered to users, stored, represented and
is made to be easily available or—even—interactive to users. This aspect
constitutes the basis of what makes multimedia possible in a digital world.
Also, developments in this area have heavy ties to many other �elds related
to computer science and information theory, but also software engineering
and distributed systems.
9
10 CHAPTER 1. INTRODUCTION
In fact, real-world multimedia systems are preeminently built as a form
of distributed system, requiring notable engineering efforts in order to work
reliably. This applies to multimedia information systems, content indexing
and distribution systems, collaboration and conferencing technologies, on-
demand delivery networks, and large-scale media databases. And more.
In particular, distributed multimedia systems require continuous media
transfer over relatively long periods of time, may contain a huge amount of
data, require equally large storage, synchronization, and special indexing
or retrieval systems. As outlined in the overview by Fuhrt, the technical
demands of multimedia systems largely depend on the speci�c application—
for instance, large storage and high computational power is required for
high-resolution video indexing, while interactive live conferencing has the
entirely different requirement of low-jitter high-bandwidth data transmis-
sion [33].
For any of those speci�c requirements however, the complexity of mul-
timedia applications stresses all components of a computer system: they
require great processing power, fast and reliable encoding and decoding
software, high data bandwidth, ef�cient I/O, high capacity and fast access
times.
Satisfying these requirements has spawned many different research
and development �elds, that so often �nd their foundation in the more
theoretical aspects of computer science, ranging from multimedia com-
pression techniques, networking protocols, synchronization methods, and
other algorithmic topics. And in physically bringing multimedia systems to
reality, decades of engineering and development have been spent likewise.
It is in the convergence of those research efforts that today’s world of
rich multimedia applications is possible and, in some way, now taken for
granted. Most real-world tech developments that touch us directly as users,
from the pervasive availability of modern smartphones to our capability of
getting pictures sent in from a rover on Mars, derive in large part from the
growing stock of knowledge in this area.
Existing technologies have been transformed over the course of the last
years to enable growing complexity and the skyrocketing demand for even
better, more enticing multimedia systems.
This doesn’t concern computer architecture and performance alone of
course, but also—for instance—networking and storage solutions. It is both
evident and impressing to ascertain the rapidity with which technologies
11
have evolved over time, moving exponentially from the expensive memory
cards of the ’60s, with capabilities ranging up to a handful of bytes, to the
huge storage capabilities which are available to us nowadays [20]. In fact,
only in the last two decades, computing power, storage density, and network
bandwidth have improved by more than three orders of magnitude.
This kind of impressive technological growth has been at the foundation
of entire new industries, which—like the life-changing research develop-
ments cited before—have already deeply impacted our ability to experience,
manipulate, create, and shape the world.
Not only that, the pace and scale of this technological acceleration also
has profound sociological and economic consequences. Pervasive comput-
ing and its derivatives can clearly have a deep effect on society, especially a
society that is increasingly dependent on the artifacts of said technology.
As these artifacts further empower people—in almost all aspects of their
lives—at the same time they encroach into the realm of human skills. And
as digital systems are only going to become more powerful and capable in
the future, they will indeed have an even bigger impact on human life.
Our technologies are racing forward, while many of our skills are lagging
behind, in what—Brynjolfsson and McAfee argue—can be said to be a “Great
Restructuration” of our relationship with technology and our respective
roles [13]. As the following quote by David Leonhardt clearly substantiates,
even groundbreaking change is dif�cult to predict and to notice except in
hindsight.
When Bill Clinton assembled the top minds of the nation to
discuss the economy in 1992, no one mentioned the Internet.
— David Leonhardt
And if the groundbreaking change is dif�cult to notice, it is safe to say
that also the consequences of this technological acceleration are not easily
predictable as well.
Ten years ago, not many people would have bet on the fact that in
2014, in some African regions, mobile Internet had a better reach than
electri�cation and, in some ways, was exactly as important as improved
water services [30].
Change can and will come in many unexpected forms, spawning new
opportunities and radical rethinking that sound outlandish at a historical
distance of only a couple of years. However, the increase in sophistication
12 CHAPTER 1. INTRODUCTION
and the increase of the scale at which it operates, has given the multimedia
realm and the tech industry an enormous leverage on how they affect our
lives and how they dominate our attention [31].
But a strong impact can nonetheless be a positive impact. As Brynjolfs-
son and McAfee put it, when we have a look at the full effects of computers
and networks, now and in the immediate future, there is reason to be very
optimistic indeed. Technology at large, and these tools in particular, is
improving our lives and will continue to do so. In fact, it can be argued that
the only sensible stance to keep is to be “digital optimists” [13].
All the changing factors enumerated above have contributed to a world en-
tangled by the massive availability of multimedia data of all forms, available
at all times, matching an equally massive and growing demand. Multime-
dia data like pictures, audio, videos, text, graphics, animations, and other
multi-modal sensory data have grown at a phenomenal rate and are now
almost ubiquitous.
As a result, not only the methods and tools to organize, manage, and
search such data have gained widespread attention, but the methods and
tools to discover hidden knowledge from such data have become extremely
valuable. The ability to extract meaningful information from a large col-
lection of information is at the foundation of many aspects of our current
world [8]. As Leigh et al. argue, whether sensor nets, supercomputers, or the
Cloud, the changes to the global computing infrastructure are transform-
ing the way that scientists and engineers study and understand complex
systems. Whether physical, geological, biological, environmental, or atmo-
spheric data is in play; whether at the micro or the macro scale; whether
in time or in space—data is produced in higher volumes than ever and its
interpretation is crucial to gain insight and knowledge [57].
The major challenge is in �nding a way to effectively manage the in-
creased scale and complexity of data, and thus be able to understand it
without being overwhelmed by it.
Getting back to the opening quote: “Thought is impossible without an
image.”
Today’s computers have become a crucial tool for storing, transmitting
and analysing information, giving us the opportunity to understand, ma-
nipulate, and grasp complex phenomena in novel ways. Many of these
uses require some form of visualization. The same term that stands for the
cognitive activity of forming mental images, also represents an important

13
discipline of computer science related to multimedia.
The act of “visualizing” links the two most powerful information pro-
cessing systems that we know today: the human mind and the modern
computer [36]. It becomes more than a computing discipline—as Gershon
and Eick put it, visualization is the process of transforming information
and knowledge into a visual, understandable form, thus enabling users to
observe the information, understand and elaborate on it, exploiting their
natural strengths.
Effective visualization—Gershon and Page write—is far more than pretty
pictures alone. The environment in which information visualization is best
applied involves massive streams of information and data sources arriving
in real time or from existing data sources. The users of the visualization
need to integrate the information streams, thoroughly understand them,
and make decisions based on their information in a timely fashion [37].
The impact of visualization in this scenario is formidable, in that is
capable of leading to new insights, to more productive analysis, and to more
ef�cient decision making. In fact Diehl too states that a good visualization
often enables the user to perceive features that are hidden, but nevertheless
are needed for a thorough analysis [27].
Much of the research in this �eld arose from the scienti�c community’s
need to cope with huge volumes of data collected by scienti�c instruments
or generated by massive simulations. As an example thereof, it is easy to
point to cases such as the CERN Data Centre surpassing a volume of over
100 petabytes of data over the last 20 years, and it is equally easy to see
how these advances have and will further challenge the state of the art in
computation, networking, and data storage [60].
Visualization can in fact serve three important roles: it can be used
to verify the correctness of a model, as in a simulation; it can make re-
sults more readily available and suggest the presence of correlations or
other unintuitive information; it can help in making results more easily
understandable by the general public and lay audiences [57].
Visualization is in fact still the most effective mean to gain direct insight
for researchers. It has been shown that nearly one-third of the human brain
is dedicated to the endeavor of processing visual data, process in which 3D
or stereoscopic cues have also been shown to be bene�cial [105, 74].
A growing area of interest in this �eld is the visualization of big data
sets on very large displays. The aforementioned process of analysis and
perception of information through visualization is particularly suited to
14 CHAPTER 1. INTRODUCTION
large-scale displays, given their capability to show more data, with higher
bandwidth and higher resolution.
The trend of producing large-format displays for scienti�c visualization,
such as video walls or immersive environments [48], is a natural approach
that has started decades ago. In the last years, the introduction of more
cost-effective solutions has driven this approach even to commodity PCs
and consumer-level hardware [11]. Large-scale visualization provides sev-
eral advantages over other forms of visualization, and of course it is not a
complete novelty: large walls of standard TVs, that replicate or enlarge the
image over an expanse of monitors, have long been a feature of museums,
public fairs, trade exhibitions [25]—and science �ction movies, of course.
It is not by chance that in movies and other popular �ction, computing
and visualization interfaces have long been evolving, fueling our imagina-
tions. In the early ’80s, while real computer interfaces were still revolving
around the blinking cursors of a command line, the “Electric Dreams” movie
predicted the �uid use of natural communication, giving an extremely
personal look into our relationship with technology. Steven Spielberg’s
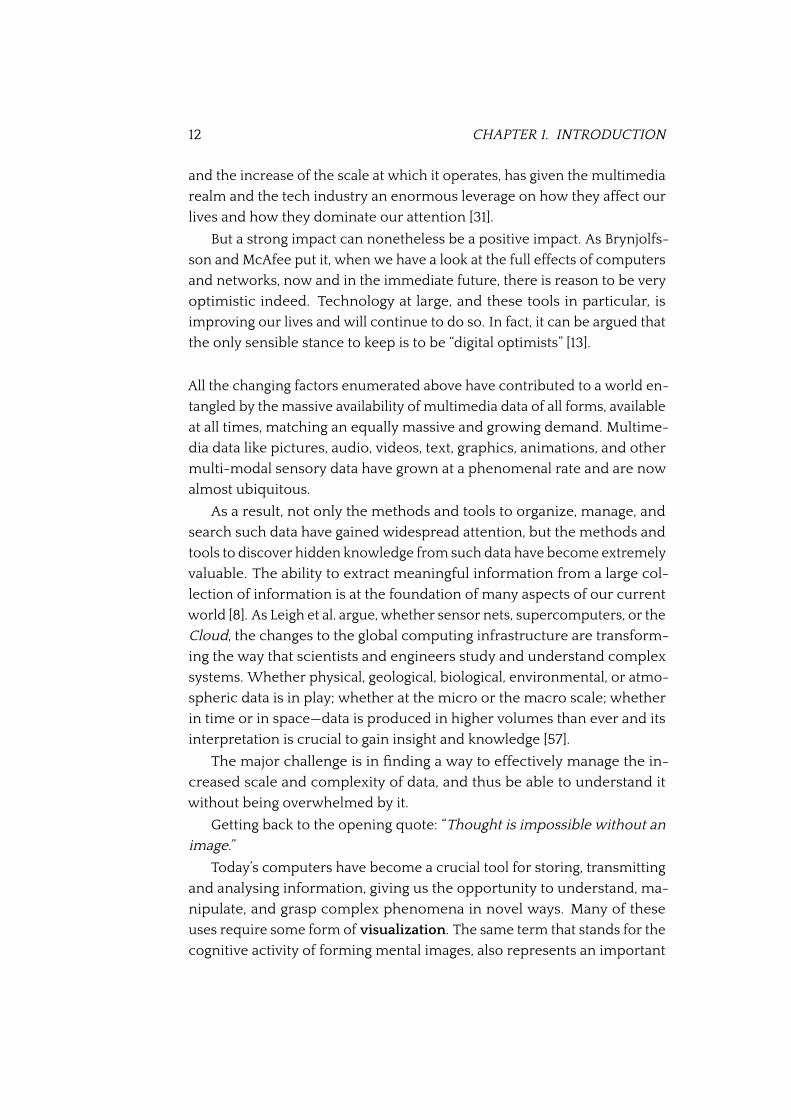
“Minority Report” gave us one of the most iconic futuristic user interfaces,
in a scene that shows Tom Cruise’s character shifting images and screens
around on an enormous glass wall interface, using only his hands to “scrub”
through huge amounts of video data, as shown in Figure 1.1. What in 2002
was seen as a very stimulating science �ction concept—perhaps the most
memorable element of the movie in the minds of the general public—is
now very much a reality. Same thing will be said, eventually, for the more
recent “Avatar” by James Cameron, where futuristic visions of large touch
screens and gesture technologies devolve into the ultimate virtual reality
dream.
These futuristic visions of course serve a speci�c purpose: to immerse
the audience—essentially a non-participating observer—to be actively en-
gaged in the process of understanding the context and the meaning behind
the character’s actions. Physical interactions and larger wall-sized displays
exploit an emerging idea in interface design, termed external legibility.
External legibility is “a property of user interfaces that affects the ability of
non-participating observers to understand the context of a user’s actions”,
argues Zigelbaum [109]. This property does not need to be constrained
to movie theaters alone, however. It is easy to conceive ways in which
the immersive capabilities of these futuristic scenarios can bring better
collaboration opportunities for single users and groups of people as well.
15
Figure 1.1: The iconic gestural interface as seen in “Minority Report”.(© Twentieth Century Fox.)
As often is the case, emerging ideas make their way from �ction to
the real world through a series of experimental setups, before becoming
commonplace. Because of their immersive graphical nature, futuristic im-
mersive interfaces have often found a rich playground in digital art, just
like digital music was largely shaped by early musical experiments. These
experiments pointed to the possibilities of the new medium, hinting at the
new boundaries given by absolute freedom in copying, remixing, and gen-
erating music and sound. Paul and Werner in their “Digital Art” book [78]
cite several examples, spanning from Brian Eno’s early soundscapes and re-
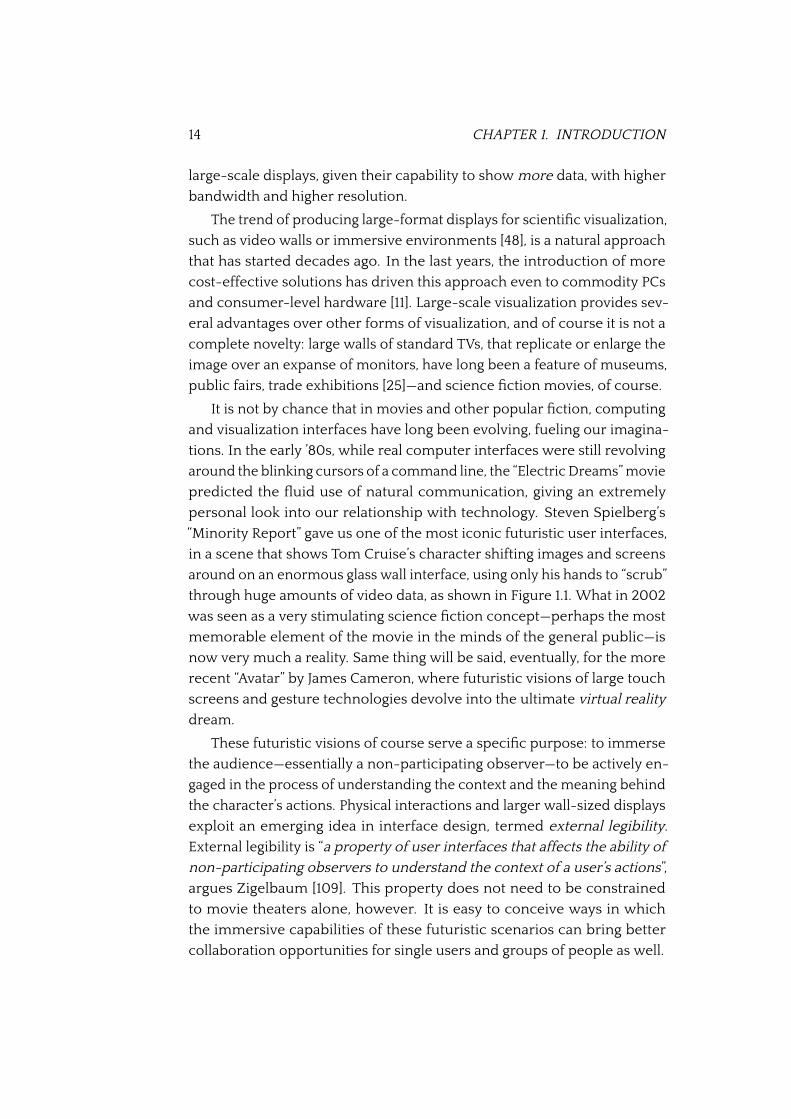
cent audio-visual installations, like Golan Levin’s “Audiovisual Environment
Suite” (AVES) software, which examined the possibilities of experimental
interfaces in composition, allowing the performers to create abstract visual
forms and sounds (see Figure 1.2).
Paul’s overview of digital art shows that this movement did not develop
in an art-historical vacuum, but instead marks the natural progression of
experiments with art and technology, also incorporating many in�uences
from previous art movements [77]. In fact, the E.A.T. (Experiments in Art
and Technology ) project—as early as 1966—is cited as starting point into
such explorations, without the preconception of either the engineer and
artist. The ’70s marked the beginning of complex collaboration between
artists, engineers, programmers, researchers, and scientists, that would
become a characteristic of digital art.
16 CHAPTER 1. INTRODUCTION
Figure 1.2: “Scribble” live performance by Golan Levin, Gregory Shakar andScott Gibbons, live at the Ars Electronica Festival 2000 using the “Audiovi-sual Environment Suite”.Video: https://youtu.be/ucVFa7re6xI. (© Golan Levin, Flickr.)
Moreover, the digital medium displays other distinguishing characteris-
tics as well. It is interactive, allowing various forms of navigation, assembly,
and contribution to the artwork itself, which go beyond the traditional
ways of experiencing art. It is often dynamic, in that it can respond to its
audience. It can be participatory, relying on multi-user input. It can be
customizable and adaptable to a single user’s needs, to a scenario, or to
the venue it is exposed in. These developments have challenged the tradi-
tional notions of artwork, audience, and artist, suggesting a paradigm shift
in what constitutes an art object, as a �uid interaction between different
manifestations of information [77].
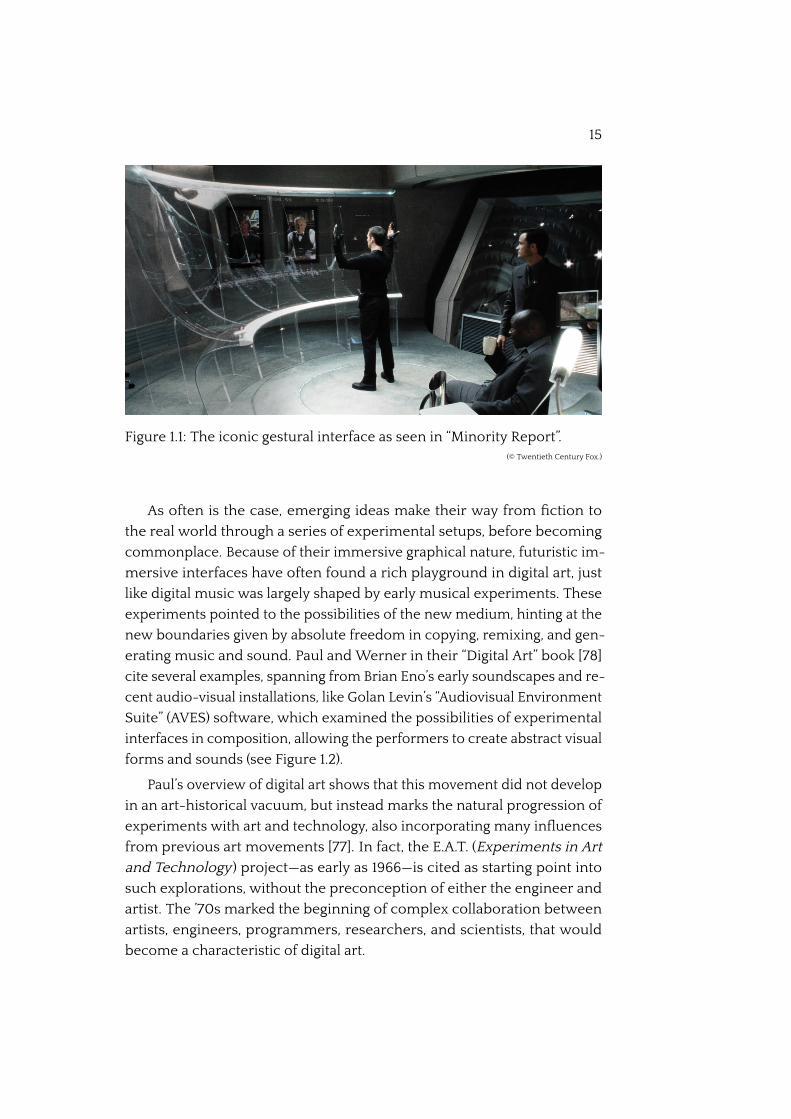
These concepts of multi-user environments, interaction, sharing and
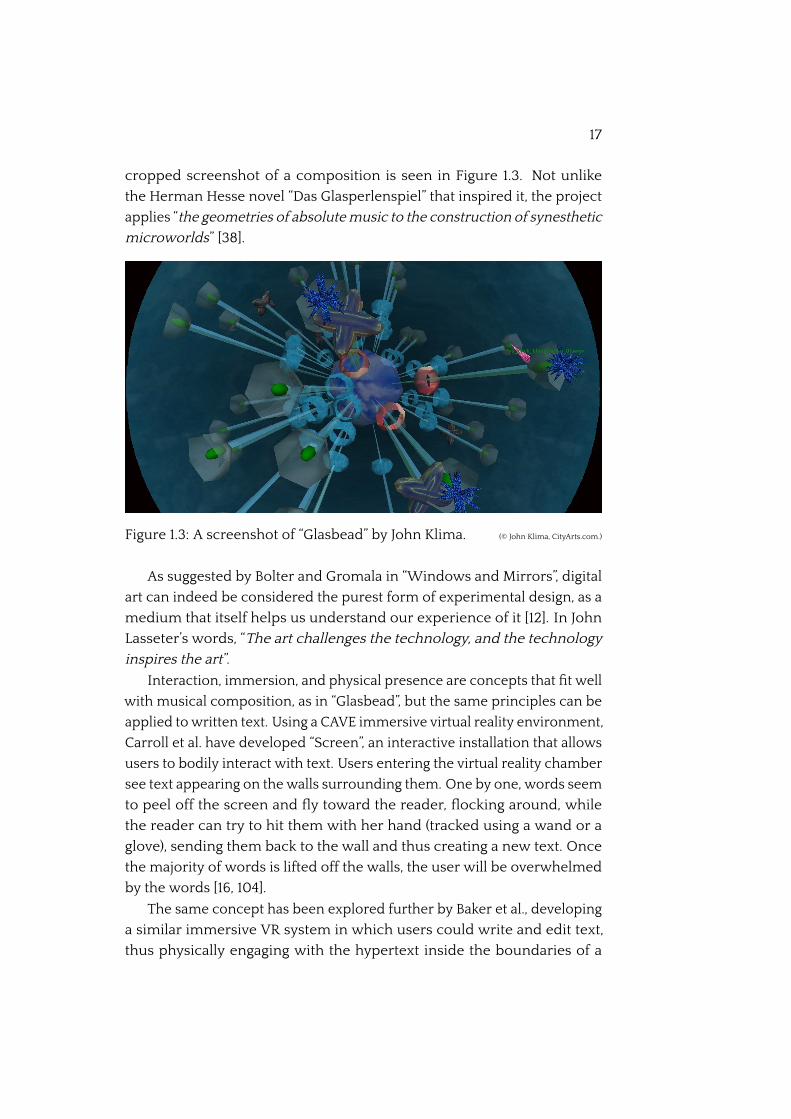
dynamism, are central to John Klima’s “Glasbead”. This experimental project,
a musical instrument and toy at the same time, allows multiple players to
manipulate and exchange sound samples, in order to create rhythmic
musical sequences through a highly visual, aestheticized interface, rich in
visual detail. Composition is done through the manipulation of a translucent
blue orb, with musical stems and hammers that can be �ung around. A
17
cropped screenshot of a composition is seen in Figure 1.3. Not unlike
the Herman Hesse novel “Das Glasperlenspiel” that inspired it, the project
applies “the geometries of absolute music to the construction of synesthetic
microworlds” [38].
Figure 1.3: A screenshot of “Glasbead” by John Klima. (© John Klima, CityArts.com.)
As suggested by Bolter and Gromala in “Windows and Mirrors”, digital
art can indeed be considered the purest form of experimental design, as a
medium that itself helps us understand our experience of it [12]. In John
Lasseter’s words, “The art challenges the technology, and the technology
inspires the art”.
Interaction, immersion, and physical presence are concepts that �t well
with musical composition, as in “Glasbead”, but the same principles can be
applied to written text. Using a CAVE immersive virtual reality environment,
Carroll et al. have developed “Screen”, an interactive installation that allows
users to bodily interact with text. Users entering the virtual reality chamber
see text appearing on the walls surrounding them. One by one, words seem
to peel off the screen and �y toward the reader, �ocking around, while
the reader can try to hit them with her hand (tracked using a wand or a
glove), sending them back to the wall and thus creating a new text. Once
the majority of words is lifted off the walls, the user will be overwhelmed
by the words [16, 104].
The same concept has been explored further by Baker et al., developing
a similar immersive VR system in which users could write and edit text,
thus physically engaging with the hypertext inside the boundaries of a
18 CHAPTER 1. INTRODUCTION
virtual environment [4].
“The digital landscape is littered with failed virtual environments”, warns
Guynup [41]. What is the real purpose of designing such interactive virtual
environments, like those in the aforementioned projects?
In the abstract, a virtual environment can be interpreted as a pure in-
formation space. An environment can be organized, it divides information,
categorizes it, places it within a narrative framework, in order to be pre-
sented and—by any chance—enjoyed by the user. This, in fact, mirrors real
world galleries and museums.
This function of displaying objects and information is the underlying
connection between modern virtual environments and the historical role
of galleries. From the ancestral groupings of precious objects in ancient
tombs, the small galleries of art hung in English country homes and French
castles, to the Italian studiolo, the German Kunstkammer, there is a very
speci�c purpose and a declaration of intent in the act of organizing, the act
of imposing order on objects and space.
Unlike other spaces like restaurants, bathrooms or garages, the
purpose of a museum is not a physical one. It is an educational,
often experiential, even spiritual one. With a degree of spatial
freedom found nowhere else, museums structure space and
house the widest possible array of objects and information. [...]
Space itself facilitates the access of art. At their best, museums
and galleries are �exible spaces that uplift, amuse, educate, clas-
sify and present information with a degree of spatial freedom
found in no other structures. In this sense, the purpose of the
gallery is the same as the [computer] graphical user interface.
For the designer, art = information, in its widest array of con�g-
urations [41].
— Stephen Lawrence Guynup
It can be said that the museum is the original virtual interface; the gallery is
designed to support information, to allow users to visualize, access, and
explore it. As Benedickt put it in his seminal cyberspace work, “museums
are ideal candidates for hybrid cyberspaces” [6]. In the merging point
between digital art, interactivity, dynamism, and the experiential role of
the museum, lies the future of virtual environments.
1.1. OVERVIEW OF THIS WORK 19
Of course, one of the preeminent components of such virtual envi-
ronments is vision, and—as far as this work is concerned—large-display
systems.
As early as in 2000, Funkhouser and Li covered the incipient work in
the space of building large-display systems using sets of screens, projectors,
clusters of computers, and complex distributed multimedia systems [35].
Five years later, Fitzmaurice and Kurtenbach continued to collect the
developments of the same topic. As they wrote: “the emergence of large
displays holds the promise of basking us in rich and dynamic visual land-
scapes of information, art, and entertainment” [32].
1.1 Overview of this work
The scope of this thesis is to �rstly present the state of the art in large-
display technologies, focusing on their ability to provide an immersive
experience to their users, giving an overview of existing techniques, sys-
tems, installations, and applications. In particular, one of the most widely
used middlewares for managing such installations is presented in Chapter 3.
In Chapter 4 an extension of this system is presented in depth, which allows
the creation of interactive immersive scenarios and the management of a
complex multi-room installation. Hardware acceleration of this system is
discussed in Chapter 5. In closing, an overview of a real-world installation,
that was designed and built during the course of the work on this thesis, is
shown in Appendix A.
1.2 Contributions and acknowledgements
Work on this thesis was co-funded by Università di Urbino, DSign Allesti-
menti1, and the “Eureka” scholarship offered by Regione Marche.
The experimental setup was designed and developed in collaboration
with DSign Allestimenti, which culminated with the construction of an
immersive experience room installation.
Signi�cant parts of the IVE system, presented in Chapter 4, have been
designed and implemented by Gioele Luchetti and Brendan D. Paolini.
1DSign di Cimadamore Anna Luisa & C. S.a.s., Monte Giberto (Fermo), Italy.http://www.dsignallestimenti.com

20 CHAPTER 1. INTRODUCTION
Chapter 2
Large-scale visualization
2.1 Experience
As outlined in the previous section, multimedia systems are by de�nition
capable of delivering various sensorial experiences, but the main and most
common application involves vision, usually as the primary experience
driver.
From the �rst consumer-grade color monitors in the late ’70s, the evolu-
tion of GUIs in application design, the continuous development of compu-
ter graphics hardware and software, to the wide adoption of touchscreens
and VR (Virtual Reality) headsets, large part of the evolution of computing
revolves around innovations in screen and display technology. Together
with the continuous rapid improvements in performance, the progression
of bandwidth and computational resources has made possible the support
of high-resolution displays and more natural human-computer interac-
tions. It could be argued, as in Funkhouser and Li’s essay, that nowadays the
main bottleneck in an interactive computer system lies in the link between
computer and human, instead between computer components within the
system [35]. In fact, the developments in increasing computer performance
and display technology are followed by research that addresses the user
interface issues. More capable display technologies have changed and will
continue to change how users relate to and interact with information.
Viewing experience can be divided into four main categories, according
to a study by Mayer [65].
The “postage stamp experience”, where the �eld of view is very con-
strained by the display, bandwidth, or scarcity of other resources. This
experience can be linked to the recent development of smart watches, but
21

22 CHAPTER 2. LARGE-SCALE VISUALIZATION
also heads-up displays, or LED displays in public places or transportation,
where display size or resolution are necessarily constrained by space or
cost requirements. The even more recent prototypes of “rollable” paper-
like displays show promise in making this kind of display experience truly
pervasive [55].
The second is the “television experience”: this kind of experience is
ubiquitous nowadays and can be likened to the general experience of using
a modern computer system using a traditional interface. It is, usually, also
the more comfortable for interacting with the device in most common
home or of�ce scenarios, like sitting at a desk or on a couch, close to the
display.
The “theatrical experience” offers a large �eld of view, which expects
the viewers to use eye scan motion in order to appreciate the entire image.
This kind of experience ranges from home large-screen TVs to de facto
theaters or cinemas, and thus usually evokes a more emotional experience.
Viewing is however still constrained by the frame size, i.e. it doesn’t grow
across the display or projectable surface.
At last, the “immersive experience” is obtained when the scope and
resolution of the imagery allows the viewers to leave the center of their
focus, discovering and examining details of the scene and its context, in
an entirely captivating environment. This experience can be, for example,
found in an IMAX movie theater and will be further discussed in Section 2.4.
As described, the most common display surface used in computing and in
multimedia systems lacks the �eld of view to provide anything more than a
“television experience”. Based on data provided by Czerwinski et al., despite
large displays getting increasingly affordable and available to consumers,
commonly the display space available by users (i.e. the effective pixels
composing the screen area they can use) covers less than 10% of their
physical workspace area [24].
Trying to browse through the growing amount of useful information
in our storage devices or on the Internet using the limited viewport of
a standard monitor con be as frustrating as attempting to navigate and
understand our physical surroundings based on a view restricted to 10%
of its normal range [40]. It can be assumed that a conspicuous share of
an user’s working time is wasted in arranging her workspace, in order
to �t it inside an undersized display. In contrast, large-scale displays are
able to almost fully immerse their users in their workspace as if it were a

2.1. EXPERIENCE 23
computer-generated scenery, thus transforming the space in front of them
into an interactive and, potentially, collaborative canvas.
Such large-format displays have traditionally been used for very special-
ized high-end applications. For instance intensive scienti�c visualizations,
Computer-Aided Design (CAD) applications, professional �ight simulators,
or immersive gaming setups.
Recently the software and hardware required to build and drive large
displays have seen a dramatic lowering of price, with a parallel rise in
performance. As lower cost technologies are developed, both by research
and commercial institutions, the usage of such large visualization systems
will spread to become commonplace. Potentially, any surface will be able
to transform into a display site with interactive capabilities.
In the previously cited work by Funkhouser and Li, the following pre-
scient but realistic scenario is described:
I’m walking down the hall toward my of�ce when I’m reminded
that I’m late for a meeting with Mary to discuss the design of the
students’ center being built on campus. Unsure of the location
of her of�ce, I tap on the wall next to me and a large �oorplan
appears. After following a path displayed on the �oor to guide
me, I arrive at her of�ce, and we begin to work. Mary and I
view an immersive walkthrough of the design on her “smart
wall”, and I draw modi�cations with a virtual marker, whose
strokes are recognized and used to manipulate the computer
model. . . [35]
A future like the one envisioned above no longer pertains only to science
�ction tales, but is quickly becoming our forthcoming reality, where the
promise of rich, dynamic, and interactive visual landscapes of information,
entertainment, and art will be at hand.
The introduction of large displays in our workplace and home also draws
attention to another, orthogonal issue: as very large-scale displays radically
change how users relate to the space around them and how they can
interact with digital information, new User Experience (UX) paradigms
must be developed.
Input technology lags behind display output technology, and many
traditional desktop user interfaces and interaction techniques (e.g. the
established mouse-and-keyboard model, but also the modern touchscreen
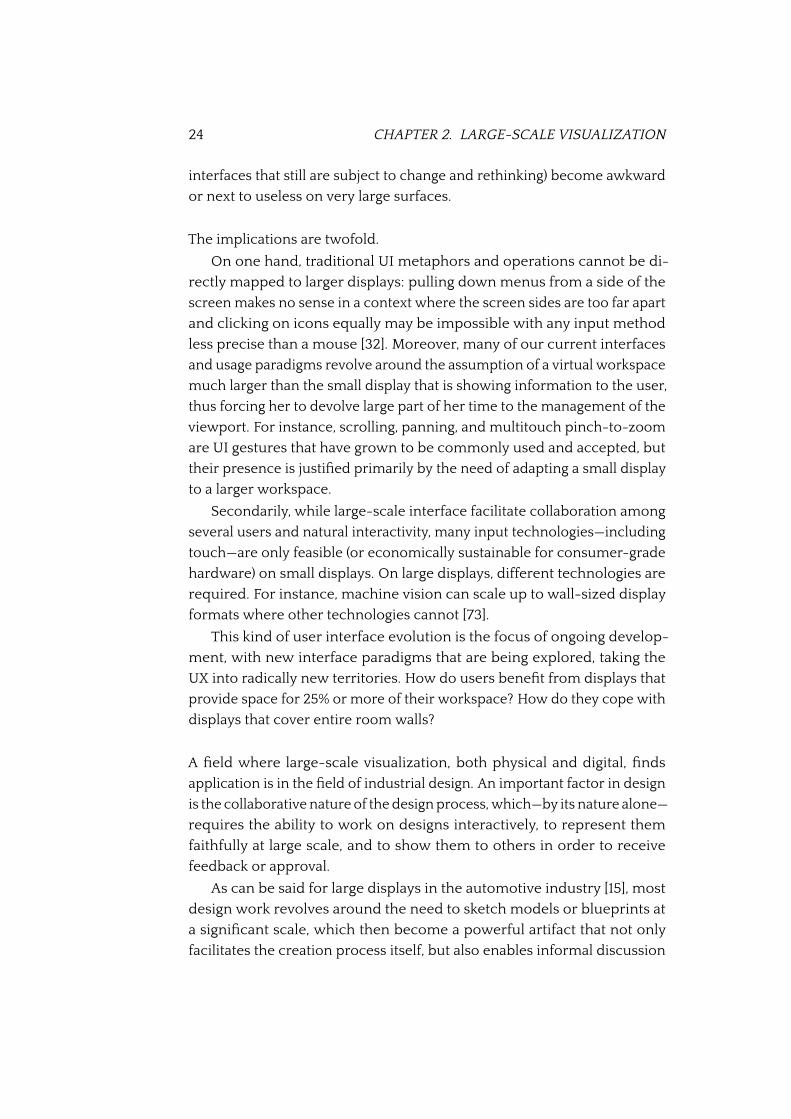
24 CHAPTER 2. LARGE-SCALE VISUALIZATION
interfaces that still are subject to change and rethinking) become awkward
or next to useless on very large surfaces.
The implications are twofold.
On one hand, traditional UI metaphors and operations cannot be di-
rectly mapped to larger displays: pulling down menus from a side of the
screen makes no sense in a context where the screen sides are too far apart
and clicking on icons equally may be impossible with any input method
less precise than a mouse [32]. Moreover, many of our current interfaces
and usage paradigms revolve around the assumption of a virtual workspace
much larger than the small display that is showing information to the user,
thus forcing her to devolve large part of her time to the management of the
viewport. For instance, scrolling, panning, and multitouch pinch-to-zoom
are UI gestures that have grown to be commonly used and accepted, but
their presence is justi�ed primarily by the need of adapting a small display
to a larger workspace.
Secondarily, while large-scale interface facilitate collaboration among
several users and natural interactivity, many input technologies—including
touch—are only feasible (or economically sustainable for consumer-grade
hardware) on small displays. On large displays, different technologies are
required. For instance, machine vision can scale up to wall-sized display
formats where other technologies cannot [73].
This kind of user interface evolution is the focus of ongoing develop-
ment, with new interface paradigms that are being explored, taking the
UX into radically new territories. How do users bene�t from displays that
provide space for 25% or more of their workspace? How do they cope with
displays that cover entire room walls?
A �eld where large-scale visualization, both physical and digital, �nds
application is in the �eld of industrial design. An important factor in design
is the collaborative nature of the design process, which—by its nature alone—
requires the ability to work on designs interactively, to represent them
faithfully at large scale, and to show them to others in order to receive
feedback or approval.
As can be said for large displays in the automotive industry [15], most
design work revolves around the need to sketch models or blueprints at
a signi�cant scale, which then become a powerful artifact that not only
facilitates the creation process itself, but also enables informal discussion
2.2. TECHNOLOGICAL OVERVIEW 25
around a table, interactive modi�cation, review, feedback, and ultimately
business decision-taking.
Models at large scale are traditionally drawn on large sheets of paper
in order to address the scale issue. But large-scale displays can �ll the gap
between size requirements and the demand for interactivity, while closing
the distance between physical and digital tools.
Especially in this case, affordability issues meet the technological and
interfacing issues mentioned above. As large-scale displays become more
common, new ways to bridge the gap between computer and human must
be explored.
2.2 Technological overview
Large high-resolution display technology is gaining increasing popularity,
both in terms of consumers and in terms of new research efforts—also
pushed partially by industry interests. These efforts are �rmly invested in
addressing the fundamental issues that affect and limit the adoption of large
displays: making large-display setups technically possible, commercially
viable and approachable for the mass market, functional, and enticing for
end-users [35].
As shown before, there are as many bene�ts in using large displays
than there are issues. Research in this area is very active and is progressing
rapidly, both on the software and the hardware side. The �rst is bringing
to the table novel UX paradigms, GUI toolkits and ways to make the usage
of these tools advantageous to users. The latter is exploring ways to cope
with the extraordinary requirements of a large display, which push the
boundaries of what is possible or economically feasible.
Building large display surfaces can rely on a wide variety of hardware
technologies with very different characteristics, advantages and drawbacks.
This section will give a brief overview of state of the art technologies.
2.2.1 Single large displays
Even less than a decade ago, a single display surface achieving 4K resolu-
tions would have seemed impossible (albeit certainly foreseeable in retro-
spect). This is corroborated by Grudin, who gives evidence that the size of
the standard monitor has increased slowly throughout the years, not-quite
keeping pace with Moore’s famed law and its expectations [40]. Already
in 2005 Fitzmaurice and Kurtenbach also claimed that there were different
26 CHAPTER 2. LARGE-SCALE VISUALIZATION
affordable solutions in creating a large, high-resolution display—but using
a single ultra-HD screen certainly wasn’t one of them [32].
However, current consumer grade monitors are rapidly reaching such
de�nition levels and will quickly outgrow them. Screens sold in common
electronic shops not only reach very high pixel density, they also have
become quite big in terms of size in the last years. It is not rare to see
television sets spanning more than 60 inches, and prices of such screens
are rapidly becoming more affordable.
Even if other technologies, like tiled displays or projector arrays, pro-
vide more affordable, more capable or even the only feasible solutions in
some cases, the possibility of using a single large display cannot be ignored
nowadays.
Dedicated monitors reaching 80 or even 100 inches in diagonal exist
and, even if not cheaply, are available to consumers. Single screen large
displays avoid the need for complex software and con�gurations, since
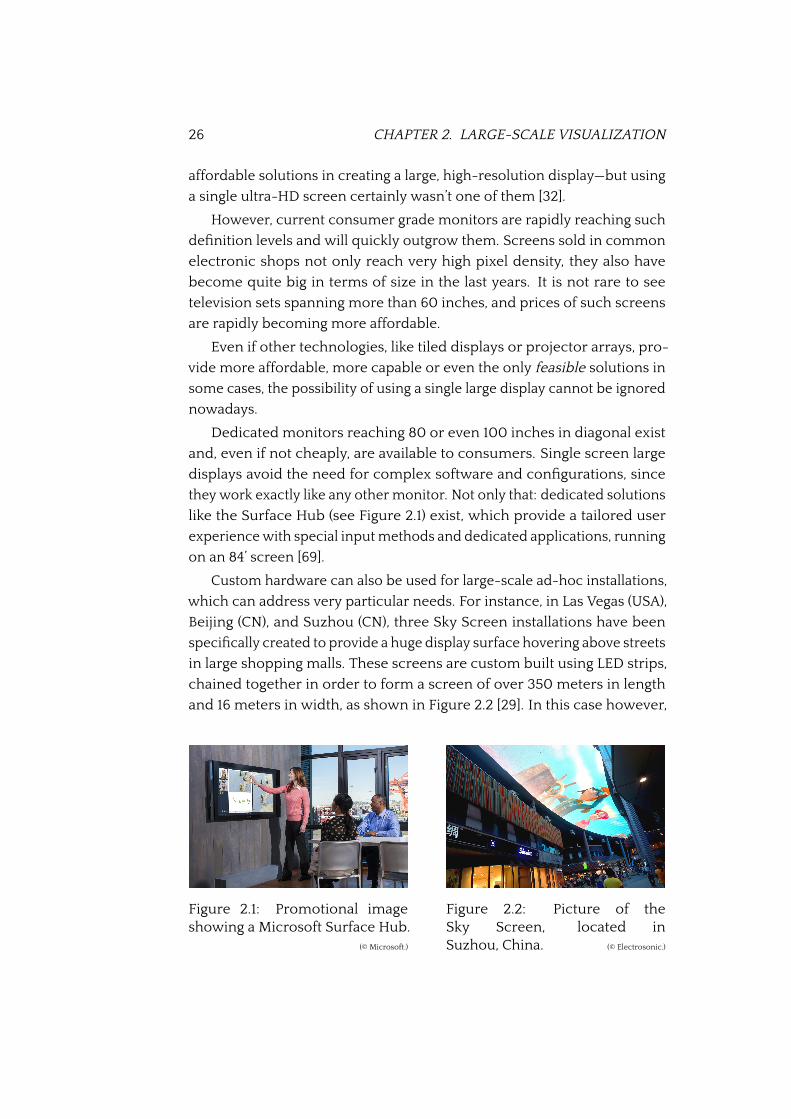
they work exactly like any other monitor. Not only that: dedicated solutions
like the Surface Hub (see Figure 2.1) exist, which provide a tailored user
experience with special input methods and dedicated applications, running
on an 84’ screen [69].
Custom hardware can also be used for large-scale ad-hoc installations,
which can address very particular needs. For instance, in Las Vegas (USA),
Beijing (CN), and Suzhou (CN), three Sky Screen installations have been
speci�cally created to provide a huge display surface hovering above streets
in large shopping malls. These screens are custom built using LED strips,
chained together in order to form a screen of over 350 meters in length
and 16 meters in width, as shown in Figure 2.2 [29]. In this case however,
Figure 2.1: Promotional imageshowing a Microsoft Surface Hub.
(© Microsoft.)
Figure 2.2: Picture of theSky Screen, located inSuzhou, China. (© Electrosonic.)
2.2. TECHNOLOGICAL OVERVIEW 27
both hardware and software will be heavily tailored to the target scenario
and all advantages listed above are not applicable.
2.2.2 Multi-monitor desktops
For over a quarter of a century it has been possible to take advantage
of multiple monitors on a consumer-grade personal computer. One of
the �rst machines supporting dual monitors was the Classic Macintosh
released in 1989. Thanks to the presence of a single expansion slot, the
Macintosh could host an additional display adapter (which supported color
output, in contrast to the built-in monochrome monitor). Later Microsoft
Windows 98 also added software support for multiple monitors [40]. Tech-
nology continues to reduce challenges to setting up multiple monitors:
high-resolution multiheaded graphics cards have become affordable for
the mass market and are a viable alternative to mid-sized display walls for
some scenarios [32].
Specialized application environments, such as Computer-Aided Design
(CAD), day trading at stock markets, software development, accounting or
multimedia editing, are increasingly using multiple monitor workstations.
Especially in investment banking or similar work environments, where
large amounts of data must be kept under control and the worker must be
able to quickly cross-reference certain entries, it is not uncommon to see
six or more monitors used at the same desk. Also, digital video or audio
editing workstations often rely on multi-monitor con�gurations to increase
the available area for the user interface [7, 84].
Multi-monitor use has several noteworthy advantages against other
technologies presented here: it easily provides for more screen real estate,
it is relatively inexpensive—two standard monitors usually cost less than
one very large monitor—, and con�guration has become easier thanks to
better software support.
There are drawbacks as well. Multiple monitors take up more desk
space of course, and can be unwieldy to con�gure in constrained rooms.
The total screen space can be split between many, heterogeneous displays,
which can make for an inconsistent work area. Better software support
notwithstanding, managing a multiple monitor con�guration can be trou-
blesome for users, especially when using multimedia applications that
were not designed with multi-monitor setups in mind.
As argued by Leigh et al., there mainly are two trends that have made
multiple monitors approachable for general consumers [57].
28 CHAPTER 2. LARGE-SCALE VISUALIZATION
Firstly, the introduction of �at panels, Liquid-Crystal Displays (LCDs) or
based on Organic Light-Emitting Diodes (OLED). Though early LCD models
had large screen borders, the vast difference in volume and weight with
traditional Cathode Ray Tube (CRT) monitors makes the usage of many
monitors much more practicable.
Secondarily, component parallelization in mainstream computers: while
the race to higher frequencies has in a way stopped in today’s computer
industry, processing units have instead become increasingly parallel. A
common laptop available in 2015 has as many as 4 cores (with 8 hardware
threads), while workstations can sport even even better multi-core technol-
ogy. Graphical processing units in particular employ a massively parallel
computing architecture. The role of yesterday’s cluster is being taken over
by today’s workstation, with large amounts of memory, processing power
and the capability of driving a large number of displays.
Several hardware solutions are already available in the mass market.
Most current graphical adapters support at least 2 displays, while many
pro-sumer or professional-grade adapters may support even more1. Latest
Intel Skylake processors feature GPUs capable of driving up to 5 displays
over HDMI. Even adapters not supporting more than one output display,
can be used in multi-monitor setups using hardware modules that disguise
two or more monitors as a single larger display2.
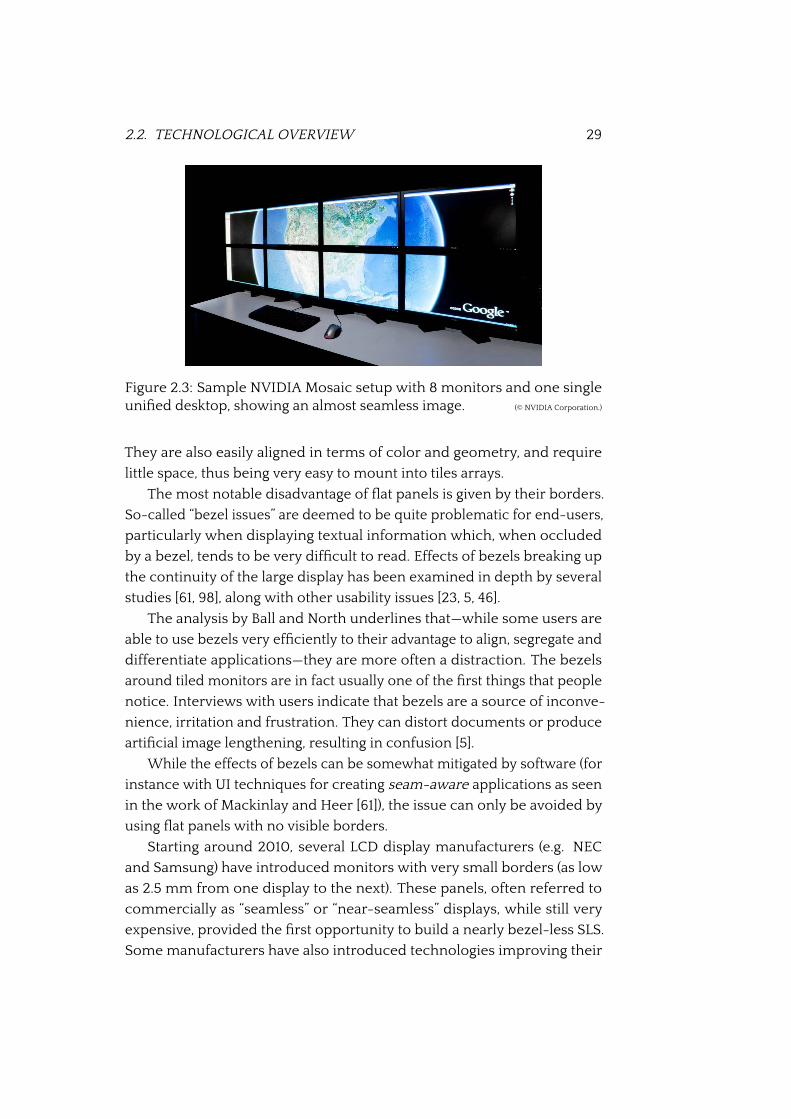
2.2.3 Tiled displays
In some way an evolution of multi-monitor con�gurations seen before,
“tiled displays” are large displays built by joining many �at screen panels into
a single wall-like surface. By keeping the panels as close as possible, and
by using special panels with very small borders, the impression for users
is that of one homogeneous screen. An example is shown in Figure 2.3.
Displays built in this fashion are also known as Single Large Surface displays
(SLS).
The innovation in �at panel technology has expanded the design space,
having taken over both as desktop monitors and consumer high-de�nition
TV sets. Current LCD panels work reliably for tens of thousands of hours,
are easy to calibrate and present a homogeneous picture to the viewer.
1AMD adapters supporting AMD Eye�nity can theoretically support up to 6 displays.NVIDIA Quadro adapters supporting NVIDIA Mosaic can run up to 4 displays.
2Matrox DualHead2Go and TripleHead2Go: http://www.matrox.com/graphics/en/products/gxm/dh2go/digital_se/
2.2. TECHNOLOGICAL OVERVIEW 29
Figure 2.3: Sample NVIDIA Mosaic setup with 8 monitors and one singleuni�ed desktop, showing an almost seamless image. (© NVIDIA Corporation.)
They are also easily aligned in terms of color and geometry, and require
little space, thus being very easy to mount into tiles arrays.
The most notable disadvantage of �at panels is given by their borders.
So-called “bezel issues” are deemed to be quite problematic for end-users,
particularly when displaying textual information which, when occluded
by a bezel, tends to be very dif�cult to read. Effects of bezels breaking up
the continuity of the large display has been examined in depth by several
studies [61, 98], along with other usability issues [23, 5, 46].
The analysis by Ball and North underlines that—while some users are
able to use bezels very ef�ciently to their advantage to align, segregate and
differentiate applications—they are more often a distraction. The bezels
around tiled monitors are in fact usually one of the �rst things that people
notice. Interviews with users indicate that bezels are a source of inconve-
nience, irritation and frustration. They can distort documents or produce
arti�cial image lengthening, resulting in confusion [5].
While the effects of bezels can be somewhat mitigated by software (for
instance with UI techniques for creating seam-aware applications as seen
in the work of Mackinlay and Heer [61]), the issue can only be avoided by
using �at panels with no visible borders.
Starting around 2010, several LCD display manufacturers (e.g. NEC
and Samsung) have introduced monitors with very small borders (as low
as 2.5 mm from one display to the next). These panels, often referred to
commercially as “seamless” or “near-seamless” displays, while still very
expensive, provided the �rst opportunity to build a nearly bezel-less SLS.
Some manufacturers have also introduced technologies improving their
30 CHAPTER 2. LARGE-SCALE VISUALIZATION
monitors for display wall installations, for instance Frame Comp by NEC
synchronizes video output across monitors composing a wall, thus reduc-
ing tearing of animated images and further enhancing the illusion of one
single video wall.
Other manufacturers specialized in video wall equipment have resort to
slightly distorting lenses wedged between monitors, that optically extend
the image surface above the bezel and thus creating a fully covered SLS
with minimal distortion3. Projection-based displays (also known as retro-
projected monitors) also come very close to seamless tiling. However,
this technology presents other issues: for instance, higher maintenance
cost, reduced clarity and brightness of the projected picture, larger space
requirements, and higher price relative to �at panels. [57].
The combined pixel count of a tiled display video wall can reach up into
the 100 million pixel range. Several live installations of high resolution walls
have been created in the last decade, some of which are listed in the survey
by Ni et al. [75]. For example, the LambdaVision display, developed at the
Electronic Visualization Laboratory at the University of Illinois (EVL-UIC),
uses 55 LCD with 1600 × 1200 pixels each, for a total of 17600 pixels by
6000—i.e., a resolution of 100 megapixels [80]. NASA has developed a wall,
known as the Hyperwall, built using 49 LCD panels tiled in a7 × 7 array for
specialized visualizations and interactive exploration of multidimensional
data [87].
However, also creating more modest tiled displays is now both tech-
nically approachable and relatively affordable: a display wall composed
of one PC with two graphic adapters and four tiles monitors is a viable
and robust approach for many smaller scale scenarios [32]. Because of
the growing component parallelization in mainstream computers, it can
be practical to build even large high-resolution walls driven by a single
computer, as seen in the overview by Leigh et al..
One such example is the Cyber Commons wall at EVL, an 18 megapixel
display designed for science and education built around 18 near-seamless
LCD panels and driven by one single PC with three graphical adapters [57].
2.2.4 Multi-projector arrays
A large array of tiled LCD screens has the potential to create a very large
high resolution video wall, and also has an advantage of con�guration and
3For instance, Pallas LCD proposes commercial solutions for very large seamless videowalls: http://www.pallaslcd.com.
2.2. TECHNOLOGICAL OVERVIEW 31
alignment simplicity. However, in terms of constructing displays on very
wide surfaces, they are not very cost-effective: the most affordable solution
still remains an array of front projectors, con�gured in order to simulate
one uniform display space.
While not exactly inexpensive—projectors are still expensive and have
a very high maintenance cost, with high-performance lamps that have
lifespans counted in mere thousands of hours—the ratio of price against
covered surface is strongly tilted in favor of projectors. They offer what
�at panels cannot: a separation between the size of the device and the
size of the projected image, i.e. a small projector can indeed be used to
create a very large—or a very small—image. The possible range of image
size is limited only by the lumen output of the projector, its resolution, and
the optical capabilities of its lens. Also, multi-projector arrays are quite
more versatile than their �at panel counterparts: they are easier to move,
to recon�gure, to adapt to existing structures and require less hardware for
the same area of covered wall. They also lack of bezels, making it possible
to create a really seamless image when tiled together.
On the other hand, projectors require very dark rooms in order to
appear at suf�cient brightness, and thus need to be used in controlled
scenarios. Also, while relatively easy to setup singularly, projectors require
painstakingly precise alignment in order to simulate one contiguous dis-
play space. This process requires specialized software and, in some cases,
equipment to be done even for small setups. Projectors can also be quite
noisy, almost always requiring fans for active cooling. This can, to an extent,
disrupt the large-display experience.
Research has been aimed at gradually perfecting projector technology
and techniques in setting up tiled display walls, improving color gamut
matching of the projected images [102], seams [96], misalignment between
projectors [45, 18], luminance matching [62], and image blending [44].
Video walls based on projector arrays have been used pro�ciently for
very large surfaces. For instance, as described by Wallace et al., the “Prince-
ton scalable display wall project” scaled up its original setup to 24 Digi-
tal Light Processing (DLP) projectors, running on a custom built cluster
of computers and distributed components. In order to con�gure, align
and manage such a system, custom-built software was used—including
a custom-built video decoder capable of handling the high bandwidth
data presented on the screen [103]. In another research project conducted
by Starkweather, the projection system DSHARP was built, using 3 low-
32 CHAPTER 2. LARGE-SCALE VISUALIZATION
distortion projectors on a surface curved at 90° and with an aspect ratio of
4 to 1, in order to achieve a truly immersive experience centered around the
viewer [94]. Bishop and Welch instead created a simple desktop environ-
ment using projectors on the wall, in order to alleviate bezel and ergonomic
issues, attempting to get the feel of the “of�ce of real soon” [10].
Moreover, several kinds of commercial high-resolution tiled projector
walls exist and are used in production. For instance the scalable VisWall
solution by VisBox4.
2.2.5 Stereoscopic displays
Stereoscopic displays show two sets of pixels for an image, making one set
visible to the user’s left eye and the other to the right eye. Typically the user is
required to wear special glasses or viewing aids to notice the 3D effects. This
kind of technology is risen to vast diffusion thanks to 3D cinemas, where
stereoscopic movies are projected usually with the aid of polarized viewing
glasses. Recent developments introduced autostereoscopic displays, which
eliminate the need for special glasses or other aids.
When applied to large-scale displays, these technologies have been
successfully applied to high-resolution stereoscopic video walls, like the
autostereoscopic display Varrier, which involves a curved LCD tiled display
with a parallax barrier af�xed in front [86]. Liao et al. also have developed a
high-resolution display using 33 projectors, capable of generating geomet-
rically accurate autostereoscopic images, and reproducing motion parallax
in 3D space [58].
2.3 Usability
Effects on productivity and usability issues of larger display surfaces are
hard to gauge, but can be likened to the ones given by multiple monitor
workstations. According to a survey (dated 2005) mentioned by Robertson
et al. [82], as many as 20% of “information workers” using Microsoft Win-
dows operating systems routinely run multiple monitors on a workstation
or on a laptop. Most users, while possibly not using such a setup because
of space issues or pricing, are at least aware of the possibility to do so.
4http://www.visbox.com/products/tiled/viswall/
2.3. USABILITY 33
2.3.1 Bene�ts
Grudin gave an overview of the usage patterns of multiple monitor users,
such as CAD/CAM designers and programmers, air traf�c controllers, and
factory production managers. Despite the limitations of large-scale displays
on the workplace, chie�y due to the presence of bezels between single mon-
itors and scarce support from the operating systems used, multi-monitor
setups are clearly loved by their users. In fact, most users claim “they would
never go back to a single monitor” [40]. These �ndings are supported by
other studies [82, 23, 5] that show signi�cant performance bene�ts and
satisfaction preference for large displays on the workplace.
It is also interesting to note that traditional multi monitor setups re-
quire the users to adapt their work�ow and their application layouts to
the number, size and orientation of their displays. In particular, additional
monitors are not considered “additional space” by default: application ac-
tivities, including ones that deal with large complex graphical objects, are
rarely extended on multiple screens. Instead, monitors are used as a “space
partitioning” method, consciously dividing primary task from secondary
ones [40]. Secondary tasks may include communication channels and “live”
information channels that are less disruptive when con�ned to the user’s
peripheral awareness. In the study of Ball and North it was shown that users
tend to develop a certain preference in positioning applications, relying on
their spatial memory abilities in order to dedicate regions of the screens to
speci�c activities. In particular it was observed that the application with the
user’s main focus was usually positioned in front, while supporting tasks
(like email clients, calendars or instant messaging applications) tended to
be moved toward the periphery. Users are shown to naturally categorize
applications when they have more available screen estate [5].
Notwithstanding the preference that users show for the partitioning
of tasks, usually a multiple-monitor setup is considered to be inferior to
a single-display setup with a comparable increase in total screen size. In
Grudin’s work the metaphor of a multi-room house is used to explain how
people generally value large rooms and more rooms in different ways [40].
In a house, multiple rooms can facilitate logical separation and usage di-
versity. Similarly, tasks of different type can be logically subdivided onto
multiple screens according to their priority or requirements. Tasks of lesser
importance can be “parked” out to secondary surfaces. Using the same
house analogy, as larger rooms are more likely to be used as a shared physi-
cal space, large-scale displays also are more suited as shared work surfaces
34 CHAPTER 2. LARGE-SCALE VISUALIZATION
or interactive multi-user environments.
In both cases, the increase in display surface allows the user to take
advantage of peripheral awareness. As large displays become more com-
mon, it is getting easier to arrange the workspace in order to have instant
access to a given resource knowing its location based only on peripheral
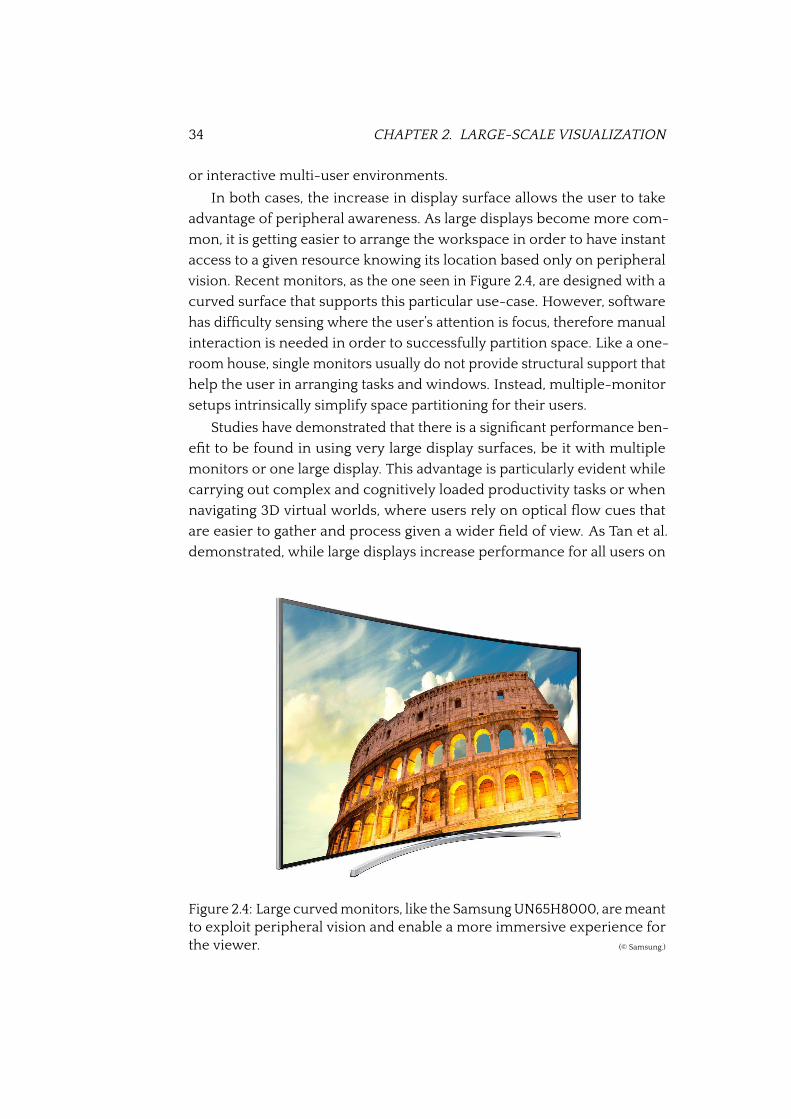
vision. Recent monitors, as the one seen in Figure 2.4, are designed with a
curved surface that supports this particular use-case. However, software
has dif�culty sensing where the user’s attention is focus, therefore manual
interaction is needed in order to successfully partition space. Like a one-
room house, single monitors usually do not provide structural support that
help the user in arranging tasks and windows. Instead, multiple-monitor
setups intrinsically simplify space partitioning for their users.
Studies have demonstrated that there is a signi�cant performance ben-
e�t to be found in using very large display surfaces, be it with multiple
monitors or one large display. This advantage is particularly evident while
carrying out complex and cognitively loaded productivity tasks or when
navigating 3D virtual worlds, where users rely on optical �ow cues that
are easier to gather and process given a wider �eld of view. As Tan et al.
demonstrated, while large displays increase performance for all users on
Figure 2.4: Large curved monitors, like the Samsung UN65H8000, are meantto exploit peripheral vision and enable a more immersive experience forthe viewer. (© Samsung.)
2.3. USABILITY 35
average, female users improve so much that the disadvantage they usually
have in virtual 3D navigation disappears completely [99].
Although these bene�ts may sound self-evident, it can be argued they
are less obvious in light of the fact that current graphical interfaces are
not optimally designed for very large surfaces [23]. Therefore, an even
larger performance advantage could be expected by a tailored experience,
speci�cally designed to exploit the capabilities of large-scale displays.
2.3.2 Issues
While the aforementioned studies demonstrate the bene�ts of using large
displays, there are several serious usability issues that impact the user’s
experience, especially due to how current software behaves on very large
surfaces and—as mentioned previously—because of unre�ned UI para-
digms still bound to small screen surfaces.
Desktop workstations are often used with multiple monitor con�gu-
rations with visible seams between screens, because of the bezels found
around consumer-grade monitors. Wall-sized displays instead offer seam-
less display surfaces using large or multiple projectors. However, most
of the following usability issues are relevant for both approaches, while
additional challenges can be given by the seams in multiple monitor con-
�gurations.
Formal laboratory studies [82, 47, 5] have been performed by observing
real multi-monitor users in the �eld and gathering data from in-depth
logging tools. Window management activities (like the number of opened
windows and the frequency of window activations or movements) were
logged in order to detect patterns for different sized displays. The analysis of
real-world data discloses the following main friction points for large-scale
display users:
Input method friction As mentioned before, traditional input methods
are not very well suited for large displays and thus can rapidly become
unwieldy to use. For instance, using a standard mouse and keyboard
interface, it is easy to lose track of the pointer’s position or the window
which has keyboard focus.
Distal access to information Distance between users and the screen neg-
atively in�uences the amount of time required to access information
and UI elements needed for interaction. Also, if information is repre-

36 CHAPTER 2. LARGE-SCALE VISUALIZATION
sented more sparsely on a large screen, acquiring the same amount
of information may require more time and more cognitive effort.
Window management Standard UI widgets like windows of a standard
operating system GUI are not designed to work well on very large
surfaces. Windows, dialogs, pop-ups, and noti�cations are created
with the constraints of a standard display in mind and may pop up in
unexpected places, which makes them more prone to go unnoticed
or harder to reach. Also, window management is made more complex
on a multi-monitor setup, since users will try to move windows in
order to avoid monitor bezels and distortions.
Task management As screen size increases, the number of windows and
active tasks also may increase. This may especially be the case in a
multi-user collaboration scenario. Better task management and multi-
tasking support is required to handle this workload and, eventually,
multiple concurrent input devices on different areas of the display.
An approach to supporting multi-user input on large tiled displays
has been proposed by Lou et al., for instance [59].
Con�guration issues Multiple monitor or large scale setups entail a higher
complexity in terms of con�guration and maintenance. Setting up a
system based on multiple projectors requires very precise alignment,
color correction and hardware that may be dif�cult to con�gure. Also
multi-monitor systems, while easier to align, are often con�gured
through interfaces which are overly complex and hard to use. Oper-
ating system support for multiple output surfaces is rather poor as
well, which is re�ected in dif�cult use of applications, unreliable con-
�guration and poor support for heterogeneous setups (like monitors
with different pixel densities).
Insuf�cient software support The move from small scale to large scale dis-
plays exposes the lack of support by software applications. Programs
written for small scale user experiences have a hard time adapting to
the larger displays and sport interaction paradigms that often actively
hinder the user in completing her task. For instance, simply maxi-
mizing browsing or text editing applications on very large surfaces
make the information harder to �nd (even if it is visible) and move
interactive UI controls such as buttons to the edges of the visible
surface. Games or multimedia playback software may also work in
2.3. USABILITY 37
ways that are dif�cult to predict. Even if users are initially excited by
the prospect of playing games or watching movies on large surfaces,
the experience can easily become disappointing [5].
Failure to leverage periphery Large displays sport a true “visual periphery”,
inasmuch that parts of the output are located far from the center focus
of the user. This feature should be leveraged for better peripheral
awareness in support of the user’s primary task, for instance providing
accessory information, context or noti�cations in a manner that is
both supportive and non-invasive. (Bene�ts of peripheral awareness
are mentioned before at page 34.) Failure to do so may provide for an
underwhelming user experience.
Wasted space As shown in the analysis by Ball and North, as there is more
space, more of it is wasted. Users are rarely able to use all the space
available, because some parts of the image are out of the view �eld
or uncomfortable to view. In comparison to work�ows with one
monitor, while the work process may be more ef�cient, the usage of
display space is actually less ef�cient due to them being used only
to a lesser degree most of the time (typically only about 50-60% at a
time) [5].
Physical size An obvious, but unavoidable, issue of large-scale displays
is their cumbersome physical size. In fact, most very-large-display
setups would not �t in any standard of�ce, thus requiring special
provisioning and complicated installations. There is also potential for
additional physical stress: if using a traditional keyboard and mouse
input system for extended period of time can cause problems [14,
3], it can be assumed that their use with a large display may also
cause discomfort or pain to the neck or the back. More research in
large display ergonomics is needed in order to asses how their usage
impacts user comfort.
Privacy issues When your computer screen takes up most part of the
wall there isn’t much privacy to be had. As reported in some of�ce
experiments with large screens, this usually is not a fundamental
issue, but has to be taken in account when working with sensitive
information [10].
38 CHAPTER 2. LARGE-SCALE VISUALIZATION
2.4 Immersive visualization
So far, advantages and applications of large-scale visualizations have been
presented, in terms that are close to the traditional computing model we
are used to. However, a true computing model paradigm shift is required
when discussing Virtual Reality (VR).
In a nutshell, VR replicates an environment that simulates the physical
presence of the user, allowing her to interact with said world. The percep-
tion of this virtual world is created by surrounding the user in arti�cial
sensorial experiences, including sight, hearing, touch, and smell.
In this context, immersion stands for the metaphoric submersion of the
user into the virtual experience. The concept appears somewhat opaque
and vague, but it can be summed up as the process “characterized by
diminishing critical distance to what is shown and increasing emotional
involvement in what is happening” [39].
While, as stated by Schuemie et al., a thorough understanding of the
reason why VR is effective and what effect it has on the human psyche
is still missing, most research on the psychological aspects of VR is also
related to the concepts and the de�nition of presence and immersion [88].
Several de�nitions of presence have been proposed in literature. Even
if none has really stuck, most often the concept can be intuitively described
as such: people are considered to be “present” in an immersive VR when
they subjectively report the sensation of being in the virtual world. An
important distinction on this point is proposed by Slater and Wilbur: in this
case immersion is an objective description of technical aspects of the VR
(such as �eld of view or display resolution), while presence is a subjective
phenomenon such as the sensation of being in a virtual environment [91].
Theories on presence are also debated and far from conclusive as well.
Slater et al., for instance, stress that an user’s sense of “being there” is
somehow exclusive, and thus that a high sense of presence in a virtual envi-
ronment implies a simultaneous low level of presence in the real world [92].
Biocca also states that users of VR constantly oscillate between feeling
physically present in one of three places: the physical environment, the
virtual environment, or the imaginal environment [9].
As mentioned before, there is no conclusive research on the relationship
between presence and emotional responses caused by VR, as there is no
unitary and clear de�nition of the concept in itself. However, it can be
argued that the point of any virtual environment is to ensure that the user’s
2.4. IMMERSIVE VISUALIZATION 39
awareness of her physical self is transformed or in�uenced by the arti�cial
environment. An immersed user reaches partial or complete suspension
of disbelief, and feels part of another world at least in a fraction of her
consciousness.
It is interesting to note, as Grau brings to our attention in “Virtual Art:
from illusion to immersion”, that the idea of installing an observer into a
closed-off space of illusion—like in modern VR systems—is not an invention
bound to computer-aided visualization. The idea seems to go back to the
classical world, throughout art history, starting from the cult frescoes of the
Villa dei Misteri in Pompeii, to the many illusion spaces of the Renaissance,
such as the Sala delle Prospettive in Rome. Before the electronic virtual
environment, there were successful attempts to create illusionist image
spaces using traditional images and trompe-l’œil [39].
In his survey on immersive displays, Lantz states that immersive re-
ality systems generally fall within three categories: small-scale displays
for single users, medium-scale displays designed for a small amount of
collaborative users, and large-scale displays intended for group immersion
experiences [54].
These three categories will be taken under exam in the next sections.
2.4.1 Small-scale displays
The small-scale virtual reality display category is mainly divided into head-
mounted displays and stereoscopic displays for desktop monitors. While
stereoscopic displays have found good application in consumer grade elec-
tronics, latest research and industry developments are focused in bringing
virtual reality headsets to consumers.
The Oculus Rift virtual reality head-mounted display has been in de-
velopment since at least 2011. After a series of prototypes, the �rst Rift
development kits were produced thanks to a very successful crowdfunding
campaign on Kickstarter by Oculus VR. In 2014 the second development
kit version started shipping, while the consumer version was announced
to be released in the �rst quarter of 2016.
The headset, shown in Figure 2.5, will feature two OLED panels for each
eye, with a resolution of 1080 × 1200 pixels each and a refreshing rate
of 90 Hz. The system sports a sophisticated head-tracking system, called
Constellation, which tracks the position of the user’s head with millimetric
precision.
Technically, the Rift works just like an old-fashioned optical stereoscope,
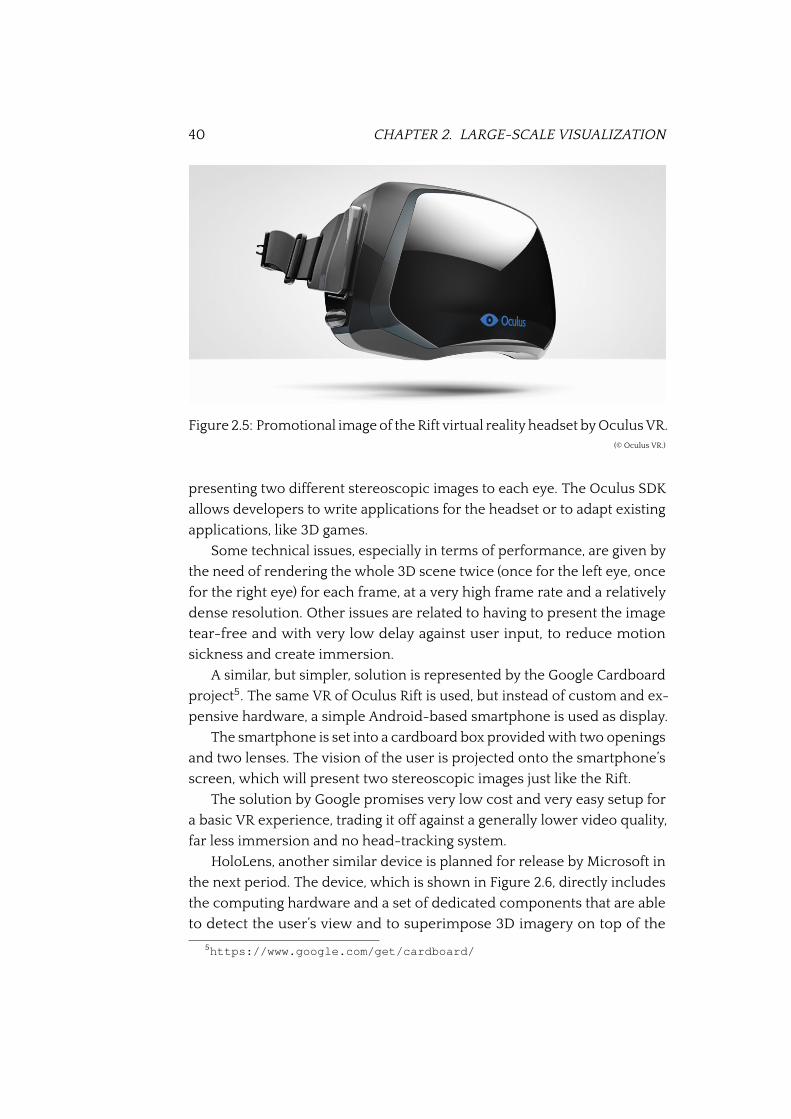
40 CHAPTER 2. LARGE-SCALE VISUALIZATION
Figure 2.5: Promotional image of the Rift virtual reality headset by Oculus VR.(© Oculus VR.)
presenting two different stereoscopic images to each eye. The Oculus SDK
allows developers to write applications for the headset or to adapt existing
applications, like 3D games.
Some technical issues, especially in terms of performance, are given by
the need of rendering the whole 3D scene twice (once for the left eye, once
for the right eye) for each frame, at a very high frame rate and a relatively
dense resolution. Other issues are related to having to present the image
tear-free and with very low delay against user input, to reduce motion
sickness and create immersion.
A similar, but simpler, solution is represented by the Google Cardboard
project5. The same VR of Oculus Rift is used, but instead of custom and ex-
pensive hardware, a simple Android-based smartphone is used as display.
The smartphone is set into a cardboard box provided with two openings
and two lenses. The vision of the user is projected onto the smartphone’s
screen, which will present two stereoscopic images just like the Rift.
The solution by Google promises very low cost and very easy setup for
a basic VR experience, trading it off against a generally lower video quality,
far less immersion and no head-tracking system.
HoloLens, another similar device is planned for release by Microsoft in
the next period. The device, which is shown in Figure 2.6, directly includes
the computing hardware and a set of dedicated components that are able
to detect the user’s view and to superimpose 3D imagery on top of the
5https://www.google.com/get/cardboard/
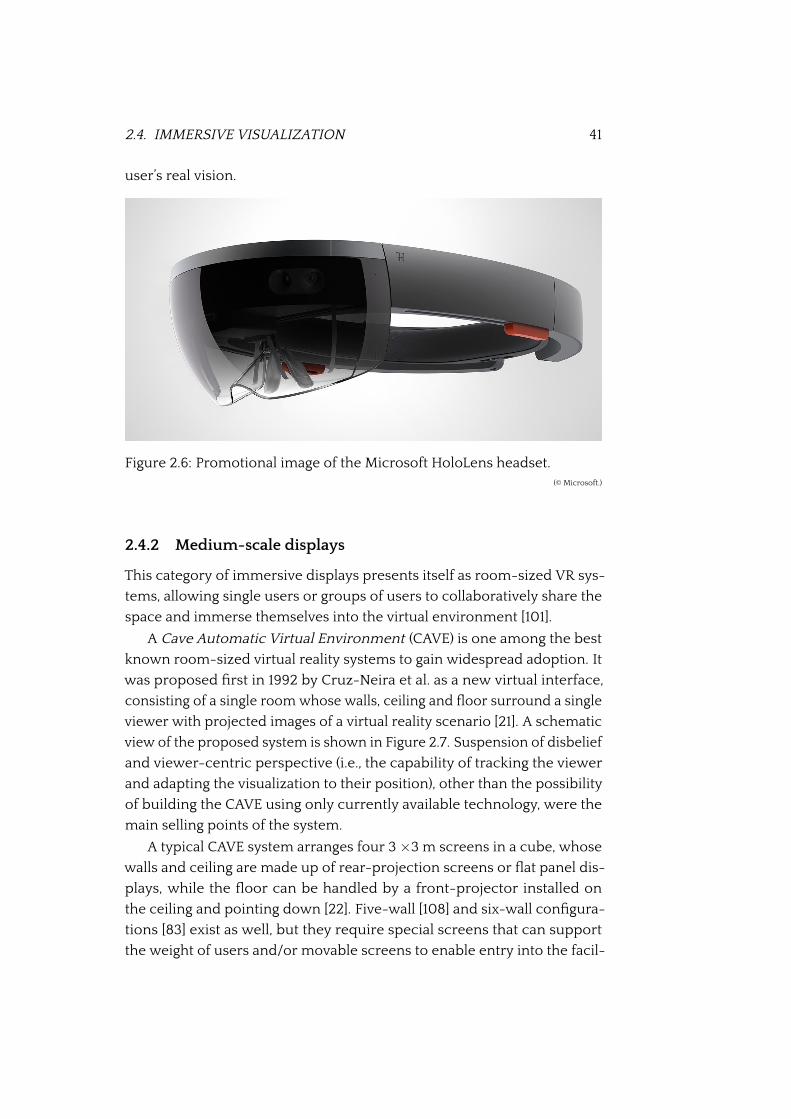
2.4. IMMERSIVE VISUALIZATION 41
user’s real vision.
Figure 2.6: Promotional image of the Microsoft HoloLens headset.(© Microsoft.)
2.4.2 Medium-scale displays
This category of immersive displays presents itself as room-sized VR sys-
tems, allowing single users or groups of users to collaboratively share the
space and immerse themselves into the virtual environment [101].
A Cave Automatic Virtual Environment (CAVE) is one among the best
known room-sized virtual reality systems to gain widespread adoption. It
was proposed �rst in 1992 by Cruz-Neira et al. as a new virtual interface,
consisting of a single room whose walls, ceiling and �oor surround a single
viewer with projected images of a virtual reality scenario [21]. A schematic
view of the proposed system is shown in Figure 2.7. Suspension of disbelief
and viewer-centric perspective (i.e., the capability of tracking the viewer
and adapting the visualization to their position), other than the possibility
of building the CAVE using only currently available technology, were the
main selling points of the system.
A typical CAVE system arranges four 3 ×3 m screens in a cube, whose
walls and ceiling are made up of rear-projection screens or �at panel dis-
plays, while the �oor can be handled by a front-projector installed on
the ceiling and pointing down [22]. Five-wall [108] and six-wall con�gura-
tions [83] exist as well, but they require special screens that can support
the weight of users and/or movable screens to enable entry into the facil-
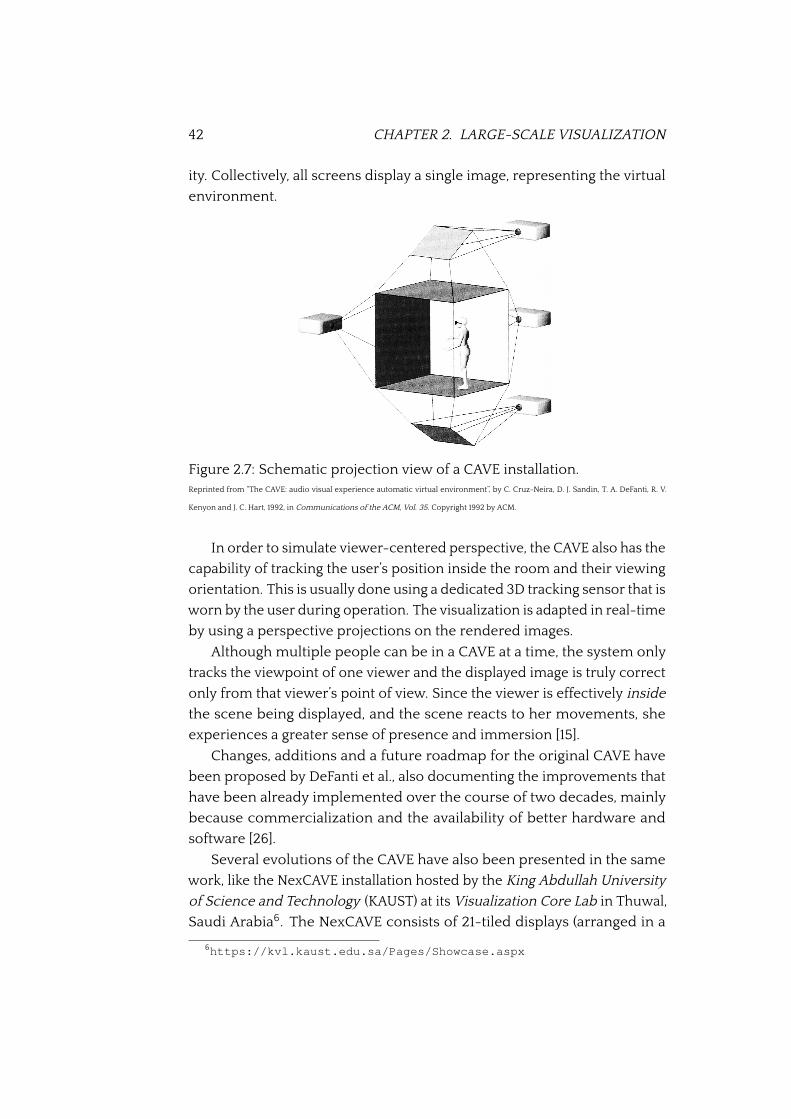
42 CHAPTER 2. LARGE-SCALE VISUALIZATION
ity. Collectively, all screens display a single image, representing the virtual
environment.
Figure 2.7: Schematic projection view of a CAVE installation.Reprinted from “The CAVE: audio visual experience automatic virtual environment”, by C. Cruz-Neira, D. J. Sandin, T. A. DeFanti, R. V.
Kenyon and J. C. Hart, 1992, in Communications of the ACM, Vol. 35. Copyright 1992 by ACM.
In order to simulate viewer-centered perspective, the CAVE also has the
capability of tracking the user’s position inside the room and their viewing
orientation. This is usually done using a dedicated 3D tracking sensor that is
worn by the user during operation. The visualization is adapted in real-time
by using a perspective projections on the rendered images.
Although multiple people can be in a CAVE at a time, the system only
tracks the viewpoint of one viewer and the displayed image is truly correct
only from that viewer’s point of view. Since the viewer is effectively inside
the scene being displayed, and the scene reacts to her movements, she
experiences a greater sense of presence and immersion [15].
Changes, additions and a future roadmap for the original CAVE have
been proposed by DeFanti et al., also documenting the improvements that
have been already implemented over the course of two decades, mainly
because commercialization and the availability of better hardware and
software [26].
Several evolutions of the CAVE have also been presented in the same
work, like the NexCAVE installation hosted by the King Abdullah University
of Science and Technology (KAUST) at its Visualization Core Lab in Thuwal,
Saudi Arabia6. The NexCAVE consists of 21-tiled displays (arranged in a
6https://kvl.kaust.edu.sa/Pages/Showcase.aspx
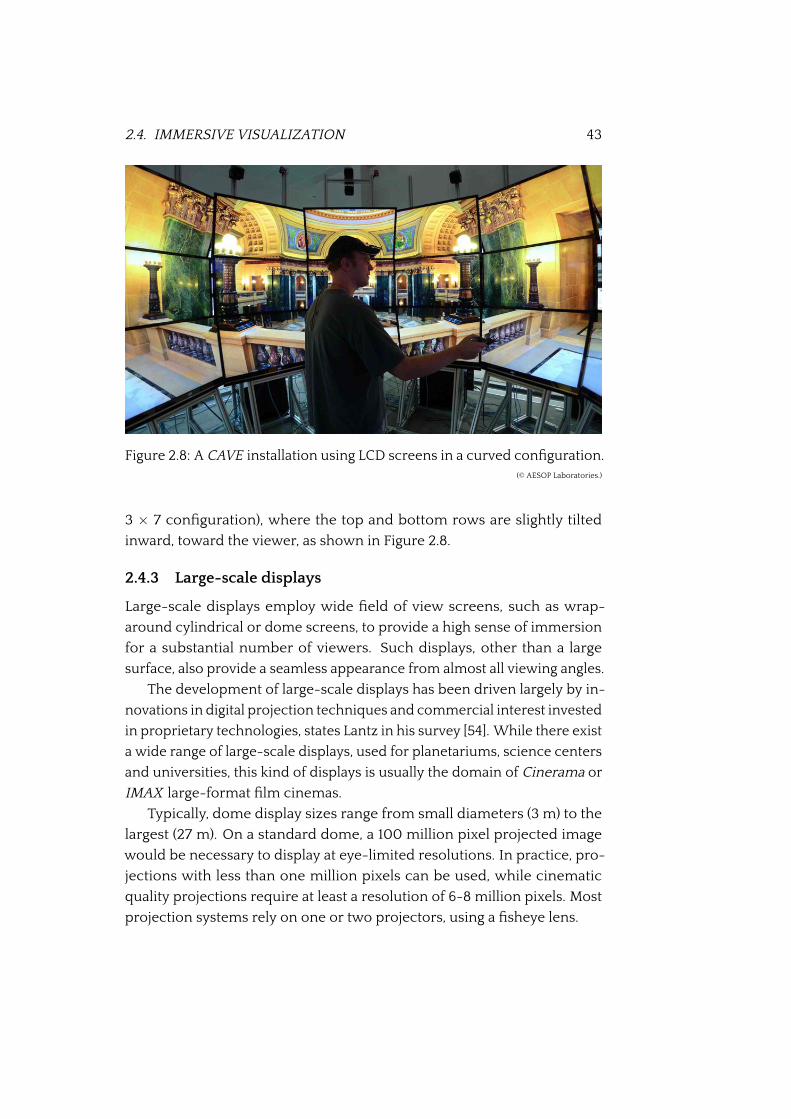
2.4. IMMERSIVE VISUALIZATION 43
Figure 2.8: A CAVE installation using LCD screens in a curved con�guration.(© AESOP Laboratories.)
3 × 7 con�guration), where the top and bottom rows are slightly tilted
inward, toward the viewer, as shown in Figure 2.8.
2.4.3 Large-scale displays
Large-scale displays employ wide �eld of view screens, such as wrap-
around cylindrical or dome screens, to provide a high sense of immersion
for a substantial number of viewers. Such displays, other than a large
surface, also provide a seamless appearance from almost all viewing angles.
The development of large-scale displays has been driven largely by in-
novations in digital projection techniques and commercial interest invested
in proprietary technologies, states Lantz in his survey [54]. While there exist
a wide range of large-scale displays, used for planetariums, science centers
and universities, this kind of displays is usually the domain of Cinerama or
IMAX large-format �lm cinemas.
Typically, dome display sizes range from small diameters (3 m) to the
largest (27 m). On a standard dome, a 100 million pixel projected image
would be necessary to display at eye-limited resolutions. In practice, pro-
jections with less than one million pixels can be used, while cinematic
quality projections require at least a resolution of 6-8 million pixels. Most
projection systems rely on one or two projectors, using a �sheye lens.

44 CHAPTER 2. LARGE-SCALE VISUALIZATION
Chapter 3
Scalable Adaptive GraphicsEnvironment
The Scalable Adaptive Graphics Environment (SAGE) is a cross-platform,
community-driven, open-source middleware for �exible graphics stream-
ing systems. It was originally conceived in 2004, at the Electronic Visual-
ization Laboratory (EVL) of the University of Illinois at Chicago (UIC).
As the of�cial project description states:
SAGE provides a common environment, or framework, enabling
its users to access, display and share a variety of data-intensive
information, in a variety of resolutions and formats, from multi-
ple sources, on tiled display walls of arbitrary size.1
SAGE is meant to enable teams of users, not only local but also distributed
and dislocated, to share and inspect data on an interactive large-display
visualization. In fact, it allows its users to make use of an entire room as if it
were one seamless canvas. Information, visualizations and animations can
be displayed through SAGE and manipulated directly by any participating
user. As described by Renambot et al., the primary aim of the software is
to aid scienti�c research and education, by enabling easy group collabo-
ration on large datasets, which bene�t from big-scale visualizations [79].
Users are thus aided to come to conclusions with greater speed, accuracy,
comprehensiveness and con�dence.
At its basis, the framework provides the means to compose multiple
heterogeneous visualization applications, seamlessly and in real-time, on a
1Of�cial web-site: http://sage.sagecommons.org/.
45
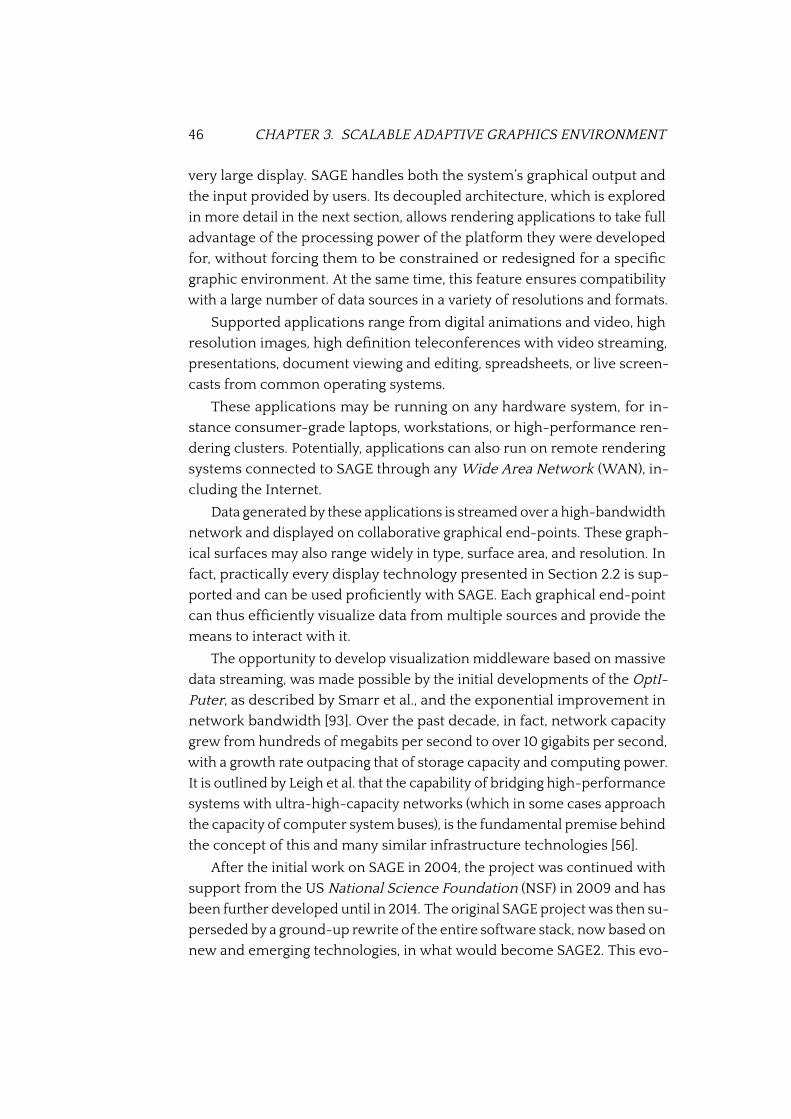
46 CHAPTER 3. SCALABLE ADAPTIVE GRAPHICS ENVIRONMENT
very large display. SAGE handles both the system’s graphical output and
the input provided by users. Its decoupled architecture, which is explored
in more detail in the next section, allows rendering applications to take full
advantage of the processing power of the platform they were developed
for, without forcing them to be constrained or redesigned for a speci�c
graphic environment. At the same time, this feature ensures compatibility
with a large number of data sources in a variety of resolutions and formats.
Supported applications range from digital animations and video, high
resolution images, high de�nition teleconferences with video streaming,
presentations, document viewing and editing, spreadsheets, or live screen-
casts from common operating systems.
These applications may be running on any hardware system, for in-
stance consumer-grade laptops, workstations, or high-performance ren-
dering clusters. Potentially, applications can also run on remote rendering
systems connected to SAGE through any Wide Area Network (WAN), in-
cluding the Internet.
Data generated by these applications is streamed over a high-bandwidth
network and displayed on collaborative graphical end-points. These graph-
ical surfaces may also range widely in type, surface area, and resolution. In
fact, practically every display technology presented in Section 2.2 is sup-
ported and can be used pro�ciently with SAGE. Each graphical end-point
can thus ef�ciently visualize data from multiple sources and provide the
means to interact with it.
The opportunity to develop visualization middleware based on massive
data streaming, was made possible by the initial developments of the OptI-
Puter, as described by Smarr et al., and the exponential improvement in
network bandwidth [93]. Over the past decade, in fact, network capacity
grew from hundreds of megabits per second to over 10 gigabits per second,
with a growth rate outpacing that of storage capacity and computing power.
It is outlined by Leigh et al. that the capability of bridging high-performance
systems with ultra-high-capacity networks (which in some cases approach
the capacity of computer system buses), is the fundamental premise behind
the concept of this and many similar infrastructure technologies [56].
After the initial work on SAGE in 2004, the project was continued with
support from the US National Science Foundation (NSF) in 2009 and has
been further developed until in 2014. The original SAGE project was then su-
perseded by a ground-up rewrite of the entire software stack, now based on
new and emerging technologies, in what would become SAGE2. This evo-
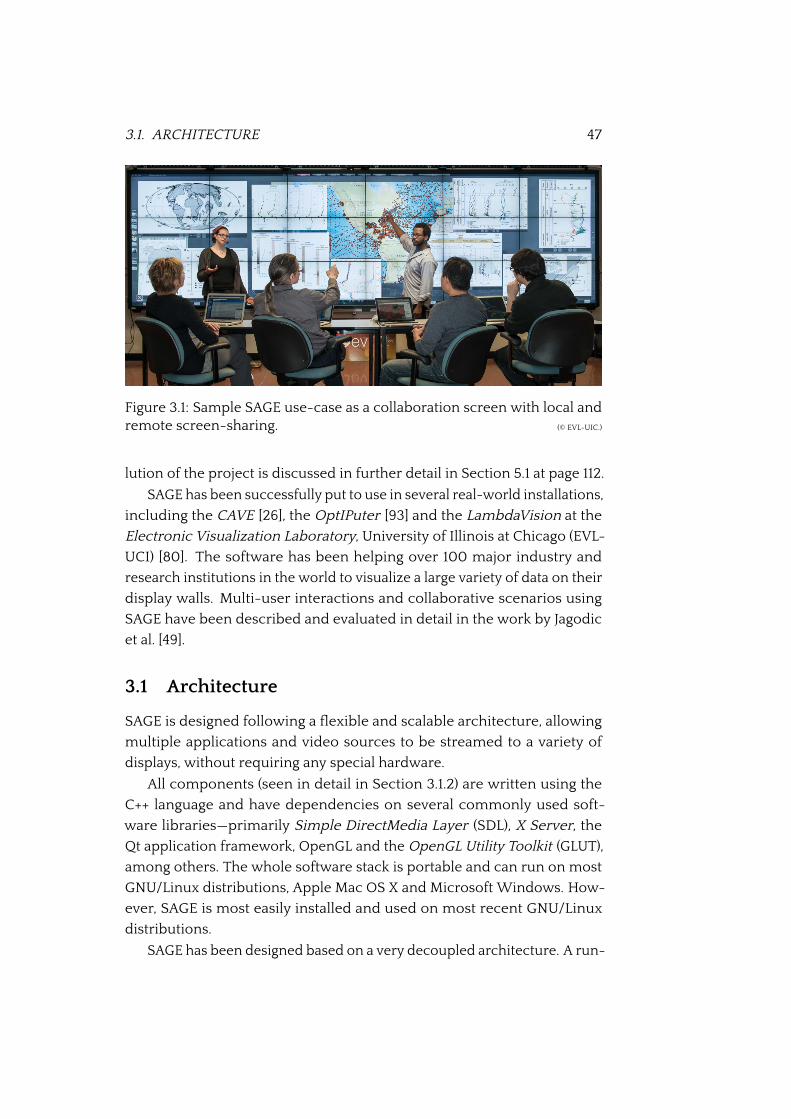
3.1. ARCHITECTURE 47
Figure 3.1: Sample SAGE use-case as a collaboration screen with local andremote screen-sharing. (© EVL-UIC.)
lution of the project is discussed in further detail in Section 5.1 at page 112.
SAGE has been successfully put to use in several real-world installations,
including the CAVE [26], the OptIPuter [93] and the LambdaVision at the
Electronic Visualization Laboratory, University of Illinois at Chicago (EVL-
UCI) [80]. The software has been helping over 100 major industry and
research institutions in the world to visualize a large variety of data on their
display walls. Multi-user interactions and collaborative scenarios using
SAGE have been described and evaluated in detail in the work by Jagodic
et al. [49].
3.1 Architecture
SAGE is designed following a �exible and scalable architecture, allowing
multiple applications and video sources to be streamed to a variety of
displays, without requiring any special hardware.
All components (seen in detail in Section 3.1.2) are written using the
C++ language and have dependencies on several commonly used soft-
ware libraries—primarily Simple DirectMedia Layer (SDL), X Server, the
Qt application framework, OpenGL and the OpenGL Utility Toolkit (GLUT),
among others. The whole software stack is portable and can run on most
GNU/Linux distributions, Apple Mac OS X and Microsoft Windows. How-
ever, SAGE is most easily installed and used on most recent GNU/Linux
distributions.
SAGE has been designed based on a very decoupled architecture. A run-
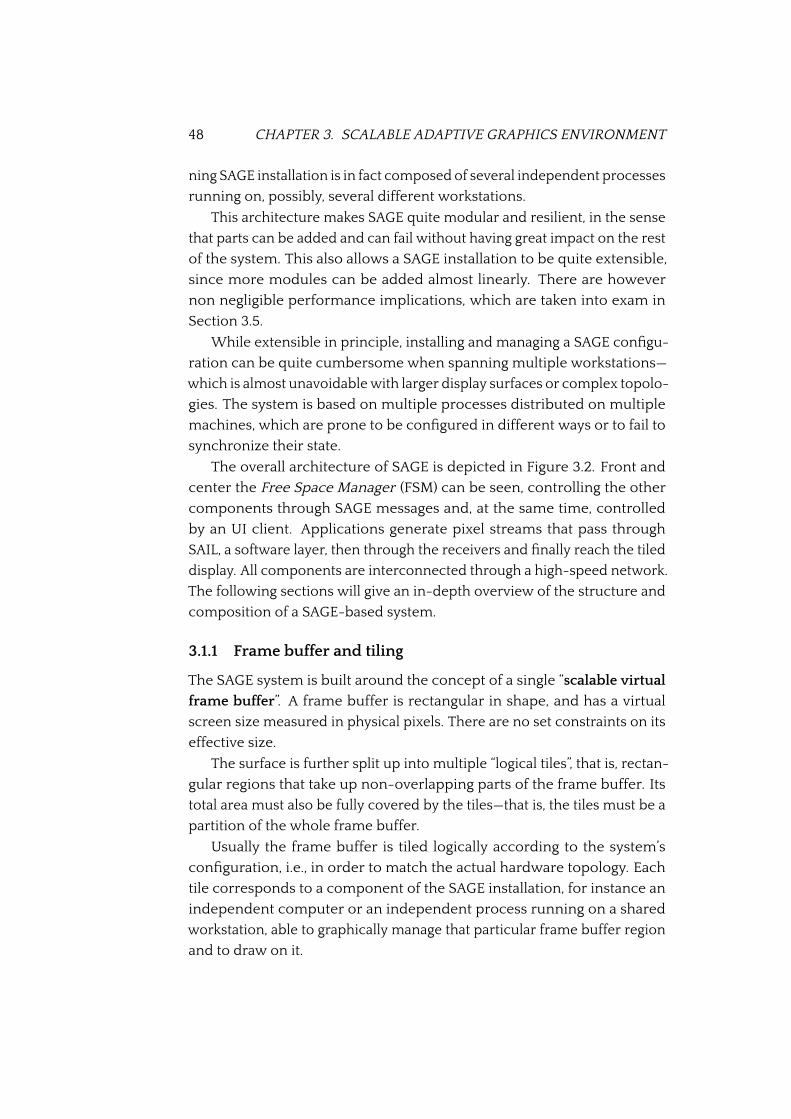
48 CHAPTER 3. SCALABLE ADAPTIVE GRAPHICS ENVIRONMENT
ning SAGE installation is in fact composed of several independent processes
running on, possibly, several different workstations.
This architecture makes SAGE quite modular and resilient, in the sense
that parts can be added and can fail without having great impact on the rest
of the system. This also allows a SAGE installation to be quite extensible,
since more modules can be added almost linearly. There are however
non negligible performance implications, which are taken into exam in
Section 3.5.
While extensible in principle, installing and managing a SAGE con�gu-
ration can be quite cumbersome when spanning multiple workstations—
which is almost unavoidable with larger display surfaces or complex topolo-
gies. The system is based on multiple processes distributed on multiple
machines, which are prone to be con�gured in different ways or to fail to
synchronize their state.
The overall architecture of SAGE is depicted in Figure 3.2. Front and
center the Free Space Manager (FSM) can be seen, controlling the other
components through SAGE messages and, at the same time, controlled
by an UI client. Applications generate pixel streams that pass through
SAIL, a software layer, then through the receivers and �nally reach the tiled
display. All components are interconnected through a high-speed network.
The following sections will give an in-depth overview of the structure and
composition of a SAGE-based system.
3.1.1 Frame buffer and tiling
The SAGE system is built around the concept of a single “scalable virtual
frame buffer”. A frame buffer is rectangular in shape, and has a virtual
screen size measured in physical pixels. There are no set constraints on its
effective size.
The surface is further split up into multiple “logical tiles”, that is, rectan-
gular regions that take up non-overlapping parts of the frame buffer. Its
total area must also be fully covered by the tiles—that is, the tiles must be a
partition of the whole frame buffer.
Usually the frame buffer is tiled logically according to the system’s
con�guration, i.e., in order to match the actual hardware topology. Each
tile corresponds to a component of the SAGE installation, for instance an
independent computer or an independent process running on a shared
workstation, able to graphically manage that particular frame buffer region
and to draw on it.
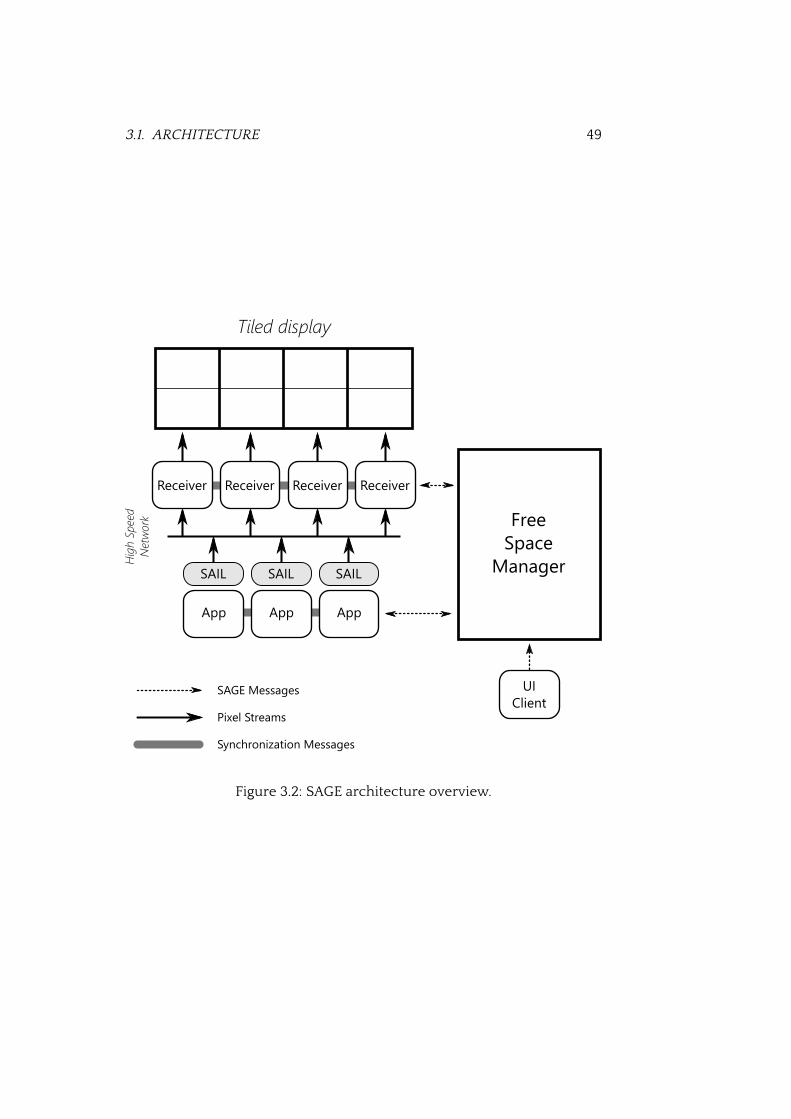
3.1. ARCHITECTURE 49
Figure 3.2: SAGE architecture overview.
50 CHAPTER 3. SCALABLE ADAPTIVE GRAPHICS ENVIRONMENT
In addition to the tiling done by SAGE, operating systems with mul-
tiple output devices already split up their graphical output on their own.
This mechanism varies by operating system and con�guration. How the
graphical output is split up has an impact on how screen coordinates are
interpreted by the operating system, and thus also on how SAGE operates.
Systems based on Microsoft Windows have one single Desktop span-
ning all output screens, i.e. windows and graphical objects exist in one
connected rectangular region. GNU/Linux systems using the X Window
System may instead create an independent Screen for each output device,
or even multiple X Server instances. In these cases, graphical objects exist
on multiple disconnected regions, each with its own coordinate system.
In the easiest case, all SAGE tiles live inside the same graphical region
(for instance a single Desktop on Windows or a single X Server Screen)
and thus the operating system’s coordinate management has no impact
on SAGE. In fact, in this case SAGE can act likewise any other graphical
application on top of the operating system’s desktop manager.
When multiple X Server instances are used instead, on one or more
physical machines, they can still be merged into one SAGE screen. In this
case SAGE will consider each server as an independent output component.
X Server instances run independently and are identi�ed by a unique IP
and TCP Port combination. Instances running on the same physical server
will share its IP address.
On some hardware, a special X Server mode can be used that merges
multiple output devices—which would require multiple server instances—
into one single logical screen at the operating system level. For instance,
NVIDIA hardware can use the so-called “Xinerama” mode in order to unite
multiple output screens into one single X Server Screen, with a single
coordinate system.
Another way of creating a single screen at the operating system’s level,
is to use additional hardware devices. For instance, Matrox’s DualHead2Go
and TripleHead2Go can join the inputs of two or three screens respectively
and can then be connected to a single adapter output. Multiple screens
connected through these devices appear as a single screen to both the
graphical adapter and the operating system, and thus can be managed by
only one X Server. This solution is also useful in order to expand a system’s
capability of driving multiple displays: a single graphical adapter can be
connected to more displays than the ones supported by default.
With any of those solutions, SAGE can be effectively con�gured in
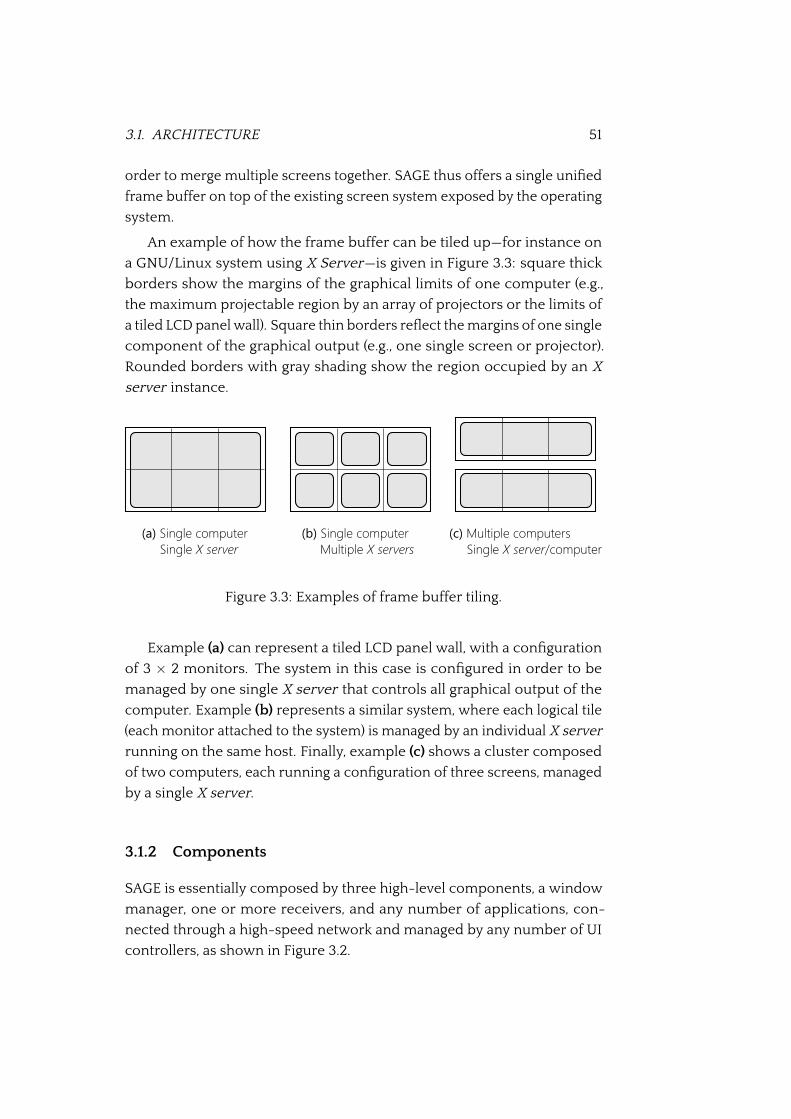
3.1. ARCHITECTURE 51
order to merge multiple screens together. SAGE thus offers a single uni�ed
frame buffer on top of the existing screen system exposed by the operating
system.
An example of how the frame buffer can be tiled up—for instance on
a GNU/Linux system using X Server—is given in Figure 3.3: square thick
borders show the margins of the graphical limits of one computer (e.g.,
the maximum projectable region by an array of projectors or the limits of
a tiled LCD panel wall). Square thin borders re�ect the margins of one single
component of the graphical output (e.g., one single screen or projector).
Rounded borders with gray shading show the region occupied by an X
server instance.
Figure 3.3: Examples of frame buffer tiling.
Example (a) can represent a tiled LCD panel wall, with a con�guration
of 3 × 2 monitors. The system in this case is con�gured in order to be
managed by one single X server that controls all graphical output of the
computer. Example (b) represents a similar system, where each logical tile
(each monitor attached to the system) is managed by an individual X server
running on the same host. Finally, example (c) shows a cluster composed
of two computers, each running a con�guration of three screens, managed
by a single X server.
3.1.2 Components
SAGE is essentially composed by three high-level components, a window
manager, one or more receivers, and any number of applications, con-
nected through a high-speed network and managed by any number of UI
controllers, as shown in Figure 3.2.
52 CHAPTER 3. SCALABLE ADAPTIVE GRAPHICS ENVIRONMENT
3.1.2.A Free Space Manager
Each SAGE instance is controlled by a single window manager, called the
“Free Space Manager” (FSM), acting as a master controller for the system.
The window manager, like its homonymous counterpart in most oper-
ating system UI shells, manages the whole drawing surface (i.e., the “virtual
frame buffer”) and controls how and where applications are drawn on the
screen.
The FSM also exposes a developer-facing layer, called the “Event Com-
munication Layer” (FSM ECL), that allows SAGE’s controllers and third-party
UI controllers to interact with the system. The adopted message exchange
protocol is seen in more detail in Section 3.6.2.
3.1.2.B Receivers
A SAGE instance is composed by one or more SAGE receivers. Each single
receiver manages one of the independent “logical tiles” of the screen, as
described before in Section 3.1.1, representing a contiguous screen area on
the video wall.
Depending on the con�guration, a single receiver may also drive mul-
tiple tiles. If the receiver runs on hardware capable of running multiple
screens, con�gured as separated tiles, a single receiver instance can actu-
ally span more than one tile. Since tiling—on a single hardware system—is
mostly just an issue of assigning screen space and handling coordinates,
this has no real impact on the receiver. For the rest of this book, if not
speci�ed otherwise, it is assumed that a single receiver manages a single
tile.
The layout of the screens is speci�ed through con�guration to both the
FSM and each single receiver.
Receivers are managed by the FSM ECL and accept incoming pixel data
transmissions from any number of SAGE applications. Receivers handle
the pixel data, managing all operations needed to making sure they are
drawn on the output surface at the correct position.
Internally receivers use a single accelerated OpenGL output surface
to draw the data on screen with as little overhead as possible. In most
cases a direct copy from the network stream to the output surface can be
performed.
If needed, the pixel data can be transformed and converted as required
to be displayed. For instance, when the incoming pixel stream is encoded
3.1. ARCHITECTURE 53
in a different format than the one used by the OpenGL surface, a data
conversion is unavoidable.
Receivers are also able to ensure that data display is kept in sync be-
tween components, using a simple synchronization mechanism between
receivers (see Section 3.4).
3.1.2.C Applications
SAGE is capable of running any number of different application instances.
Applications can be very heterogeneous, but share one common feature:
they render the pixels that need to be drawn on the SAGE screen.
Each application runs in the context of the two-dimensional “virtual
frame buffer”, on which it is assigned a region where it is drawn onto. The
region is strictly rectangular and can be sized and moved freely inside
the frame buffer. A z-index2 is also assigned to the region, indicating its
depth ordering in relation to other application regions, and how it is drawn
on screen (i.e., under or above other applications). During the course of
operation, the FSM can alter the application’s region (e.g., moving, resizing,
or altering its z-ordering).
In fact, like windows of an operating system, applications live inside a
rectangular region and are characterized by the pixel data that is drawn on
screen. In a similar fashion, these rectangular regions can be manipulated
and moved, both by the system and by the users. As this exempli�es, SAGE
in large part behaves like any compositing window management system of
a modern operating system.
Applications contributing to a SAGE setup may run on any workstation
connected to the system, even remote computing systems—for instance
an external rendering cluster—which are connected through a wide-area
network.
Lifecycle All running applications inside a SAGE system are registered
by the FSM. Acting as a window manager, the FSM con�gures receivers
and applications, making sure that pixel data is generated and sent to the
correct target receivers.
2The z-order is a property of overlapping two-dimensional objects, such as windows orother GUI elements. When the covered areas of two objects have an intersection, how theyare represented on screen depends on their relative z-ordering, i.e., their ordering alongthe viewer’s looking axis. When the order is determined by an integer value expressing theobject’s depth (along the so-called Z-axis), this value is usually known as z-index.
54 CHAPTER 3. SCALABLE ADAPTIVE GRAPHICS ENVIRONMENT
When an application has to be started, the FSM creates a channel to the
target workstation through a Secure Shell connection (SSH) and executes
the application as a remote process. Parameters and other con�guration
options are passed through command-line parameters or precon�gured
setting �les.
Once an application is running, the SAGE Free Space Manager practi-
cally has no control over its execution and has no further understanding
of its lifecycle. In a nutshell, an application in SAGE is considered to be
“running” as soon as its process is spawned and as long as its termination is
not signaled. In most cases, it is up to the application to notify the FSM of
its own termination. If this is not the case, the application is considered to
be alive even if the process has been terminated and no graphical data is
generated anymore.
As long as the application is considered to be running, the FSM makes
sure that it streams pixel data to the correct receivers of the system. When
needed, the FSM sends recon�guration messages to all involved applica-
tions to update their streaming targets.
Interface library As mentioned before, applications do not need to be
redesigned or rearchitected for a particular system in order to contribute to
a SAGE system. There is no strict dependency on any runtime or graphical
environment, nor is there any effective technological requirement. In fact,
applications on SAGE can be of very heterogeneous nature: they can run
on a simple workstation or run as a distributed system on a full-�edged
cluster, they can have a graphical user interface or run “headless”, as a
command-line executable.
All applications must, however, make use of the SAGE Application In-
terface Library (SAIL). This library includes the simple primitives needed
to interact with SAGE and exposes a limited set of APIs to application pro-
grammers. These interfaces can be accessed either by using the low-level
C++ code in which SAIL itself is written, or a higher level interface written
in C. Both these interfaces provided by the library allow the programmer to
initialize the application’s cooperation context with the SAGE system and
then to provide pixel data to receivers at runtime.
Most communication tasks, like sending and receiving messages, man-
aging the streaming con�guration provided by SAGE’s FSM, and actually
performing the transmission of the graphical data, are handled internally
by SAIL itself.

3.1. ARCHITECTURE 55
Additionally, SAIL also takes care of splitting up the generated pixel data
and streaming it to multiple receivers if needed, based on the directions
from the Free Space Manager. For instance, when the application’s draw
region spans across two separate tiles, its output is split and sent to two
independent receivers.
Messages sent by external components are received by SAIL and can be
processed by the application using a standard message pump pattern3 (see
Section 3.6.2 for details). Even though SAGE provides standard message
types for events and UI interactions by the user, SAIL does not provide a
coherent standard way to manage the application’s behavior and lifecycle.
Also, there is no facility to provide feedback back to the UI component
(except through graphical updates visible to the user). In fact, extensions
to SAGE have been proposed in order to overcome this limitation of the
messaging protocol, and to enhance the interactivity of applications [34].
SAIL exposes a very simple programming model: application program-
mers render directly to raw data buffers, that are transmitted using a double-
buffering swapping technique. This simple architecture, while making the
developer relinquish some control over transmission and buffer manage-
ment, makes porting existing rendering applications to SAGE very easy.
In fact, the software package in which SAGE is distributed by default
provides a version of the widespread MPlayer multimedia player, modi�ed
in order to make it work with SAIL’s buffer swapping mechanism.
The full C API and the messaging aspects of SAIL are discussed further
in Section 3.6.1.
Other than MPlayer, the SAGE distribution includes several other sample
applications that make use of SAIL and can be used out of the box. Most
commonly used applications include:
• Checker: sample benchmark application to test streaming perfor-
mance.
On start-up a simple checker pattern is generated procedurally in an
in-memory buffer and is the continuously streamed to output at the
maximum frame rate.
• ImageViewer: basic image viewing application.
3The message pump pattern, also known as event loop or message dispatcher, is acommon programming construct that waits for and dispatches events or messages. It is acentral pattern for UI programming, where messages from the UI toolkit must be processedin order to interact with the user.
56 CHAPTER 3. SCALABLE ADAPTIVE GRAPHICS ENVIRONMENT
The application uses the ImageMagick library to convert the input
image (any common format is supported, including JPEG) to an in-
memory buffer using the compressed DXT format. The converted
image is then streamed as a single frame to the tiled display.
• MPlayer: a modi�ed version of the very popular open-source media
player, based on the FFMpeg libraries.
The version distributed with SAGE includes a custom video output
module which streams individual decoded video frames to the SAGE
video wall. Thanks to the underlying decoders, a large variety of
formats are supported.
• VNCViewer: simple desktop sharing application.
For each shared desktop session (usually launched through SAGE
pointer), an instance of the application is spawned. A VNC client
is started on the host running the application, that will attempt to
connect to the VNC server on the desktop through SSH. Once a con-
nection is established, the desktop stream is forwarded to SAGE as a
continuous sequence of images.
Because of the nature of the connection, VNC is capable of bridging
wide-area networks, thus enabling remote collaboration through the
Internet.
• qShare: advanced desktop sharing application.
This custom program, capable of running on Windows of Mac OS X
desktops, written to be a SAGE application itself. That is, no client-
server bridge is needed like with VNC, but a direct connection be-
tween the shared desktop and the SAGE system can be established.
While the desktop can thus be streamed in high quality and at a very
high frame rate, a direct LAN connection is required and bandwidth
consumption can be quite high (the minimum of a 1 Gbps link is
speci�ed by the documentation, while 10 Gbps are suggested for
4K screens).
• DeckLinkCapture: video application that connects with a DeckLink
HD high-performance video capture card by Blackmagic design.
Blackmagic hardware is capable of real-time capture of a HD, 2K or
even 4K video source (over dual-link SDI, HDMI, S-Video, analog
3.1. ARCHITECTURE 57
component or analog composite video connectors). The captured
stream can be sent to SAGE receivers to be presented on the tiled
display.
• Of�ceViewer: viewer for common Microsoft Of�ce �le formats or
Adobe PDF �les.
Of�ce �les are passed through an on-the-�y converter using the
LibreOf�ce environment (if available on the system) and stored as
PDF �les. Original or converted PDFs are rendered as bitmap images
and streamed.
• Webcam: sample webcam capture application.
The application uses the Video for Linux (V4L) interfaces in order to
capture video data from a speci�ed hardware device, representing
the input webcam. Captured images are streamed to the video wall.
Some other, more speci�c, applications are also included in the SAGE
distribution, like the UltraGrid video transmission streamer4.
Generally, existing streaming applications—like movie players—, and
applications making use of an interoperation API that works using a frame-
swapping mechanism can be easily adapted to make use of SAIL.
3.1.2.D Controllers
The SAGE components examined this far do not concern themselves with
user-facing features, such as UI features for manipulating the frame buffer
and its applications. The Free Space Manager, receivers and applications
are managed by a message passing protocol that provides the primitives
for additional applications to provide support for users.
These applications are known as “SAGE controllers” (or simply “SAGE
clients”, as they act as clients of SAGE applications and the FSM) and can be
quite heterogeneous in terms of interface and usage experience.
The SAGE distribution includes a basic controller module, known as “SAGE
pointer”. The pointer application runs on a standard desktop computer and
extends the user’s desktop interaction space to cover the whole tiled display
managed by SAGE. That is, the user’s mouse pointer can be transferred
over to the tiled display—as if it where an extension of the computer’s
4http://www.ultragrid.cz
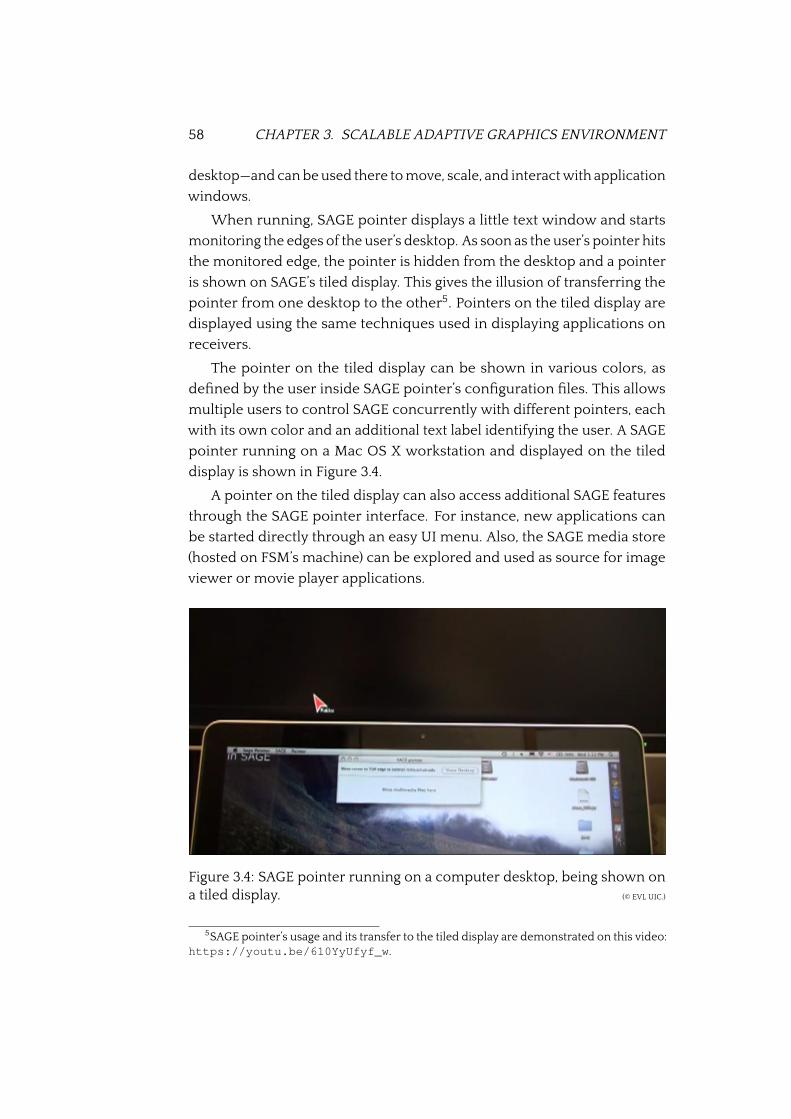
58 CHAPTER 3. SCALABLE ADAPTIVE GRAPHICS ENVIRONMENT
desktop—and can be used there to move, scale, and interact with application
windows.
When running, SAGE pointer displays a little text window and starts
monitoring the edges of the user’s desktop. As soon as the user’s pointer hits
the monitored edge, the pointer is hidden from the desktop and a pointer
is shown on SAGE’s tiled display. This gives the illusion of transferring the
pointer from one desktop to the other5. Pointers on the tiled display are
displayed using the same techniques used in displaying applications on
receivers.
The pointer on the tiled display can be shown in various colors, as
de�ned by the user inside SAGE pointer’s con�guration �les. This allows
multiple users to control SAGE concurrently with different pointers, each
with its own color and an additional text label identifying the user. A SAGE
pointer running on a Mac OS X workstation and displayed on the tiled
display is shown in Figure 3.4.
A pointer on the tiled display can also access additional SAGE features
through the SAGE pointer interface. For instance, new applications can
be started directly through an easy UI menu. Also, the SAGE media store
(hosted on FSM’s machine) can be explored and used as source for image
viewer or movie player applications.
Figure 3.4: SAGE pointer running on a computer desktop, being shown ona tiled display. (© EVL UIC.)
5SAGE pointer’s usage and its transfer to the tiled display are demonstrated on this video:https://youtu.be/610YyUfyf_w.
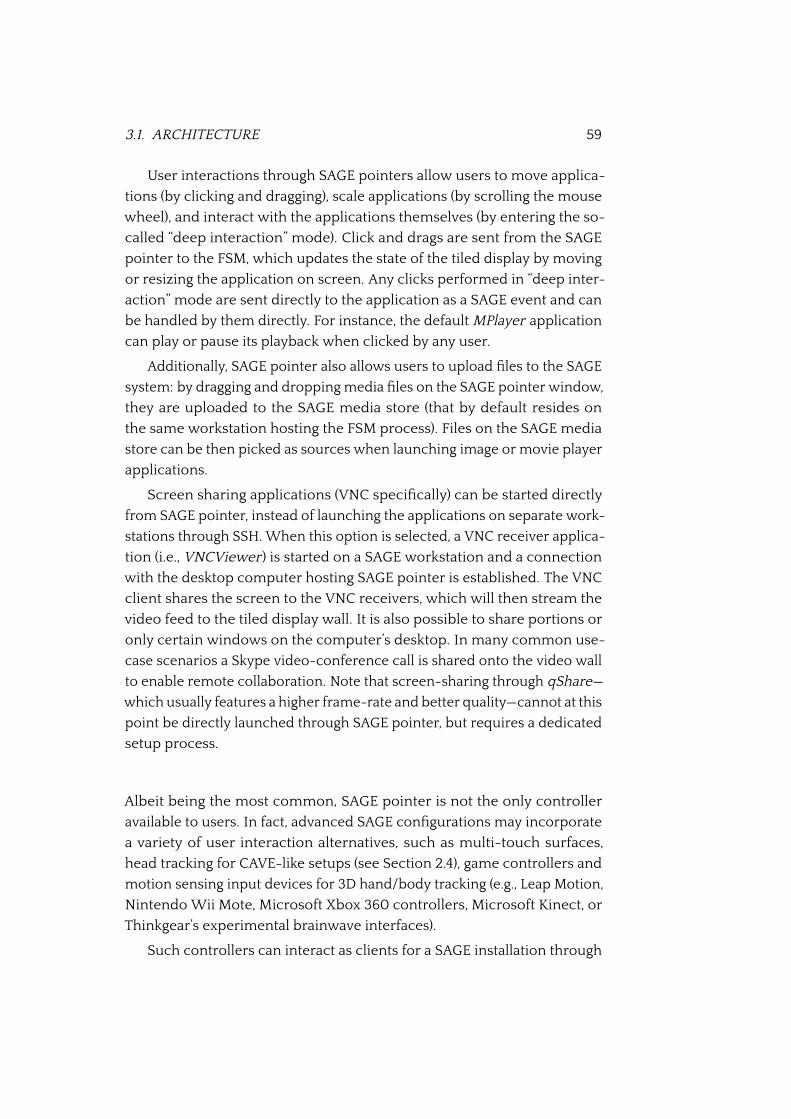
3.1. ARCHITECTURE 59
User interactions through SAGE pointers allow users to move applica-
tions (by clicking and dragging), scale applications (by scrolling the mouse
wheel), and interact with the applications themselves (by entering the so-
called “deep interaction” mode). Click and drags are sent from the SAGE
pointer to the FSM, which updates the state of the tiled display by moving
or resizing the application on screen. Any clicks performed in “deep inter-
action” mode are sent directly to the application as a SAGE event and can
be handled by them directly. For instance, the default MPlayer application
can play or pause its playback when clicked by any user.
Additionally, SAGE pointer also allows users to upload �les to the SAGE
system: by dragging and dropping media �les on the SAGE pointer window,
they are uploaded to the SAGE media store (that by default resides on
the same workstation hosting the FSM process). Files on the SAGE media
store can be then picked as sources when launching image or movie player
applications.
Screen sharing applications (VNC speci�cally) can be started directly
from SAGE pointer, instead of launching the applications on separate work-
stations through SSH. When this option is selected, a VNC receiver applica-
tion (i.e., VNCViewer ) is started on a SAGE workstation and a connection
with the desktop computer hosting SAGE pointer is established. The VNC
client shares the screen to the VNC receivers, which will then stream the
video feed to the tiled display wall. It is also possible to share portions or
only certain windows on the computer’s desktop. In many common use-
case scenarios a Skype video-conference call is shared onto the video wall
to enable remote collaboration. Note that screen-sharing through qShare—
which usually features a higher frame-rate and better quality—cannot at this
point be directly launched through SAGE pointer, but requires a dedicated
setup process.
Albeit being the most common, SAGE pointer is not the only controller
available to users. In fact, advanced SAGE con�gurations may incorporate
a variety of user interaction alternatives, such as multi-touch surfaces,
head tracking for CAVE-like setups (see Section 2.4), game controllers and
motion sensing input devices for 3D hand/body tracking (e.g., Leap Motion,
Nintendo Wii Mote, Microsoft Xbox 360 controllers, Microsoft Kinect, or
Thinkgear’s experimental brainwave interfaces).
Such controllers can interact as clients for a SAGE installation through
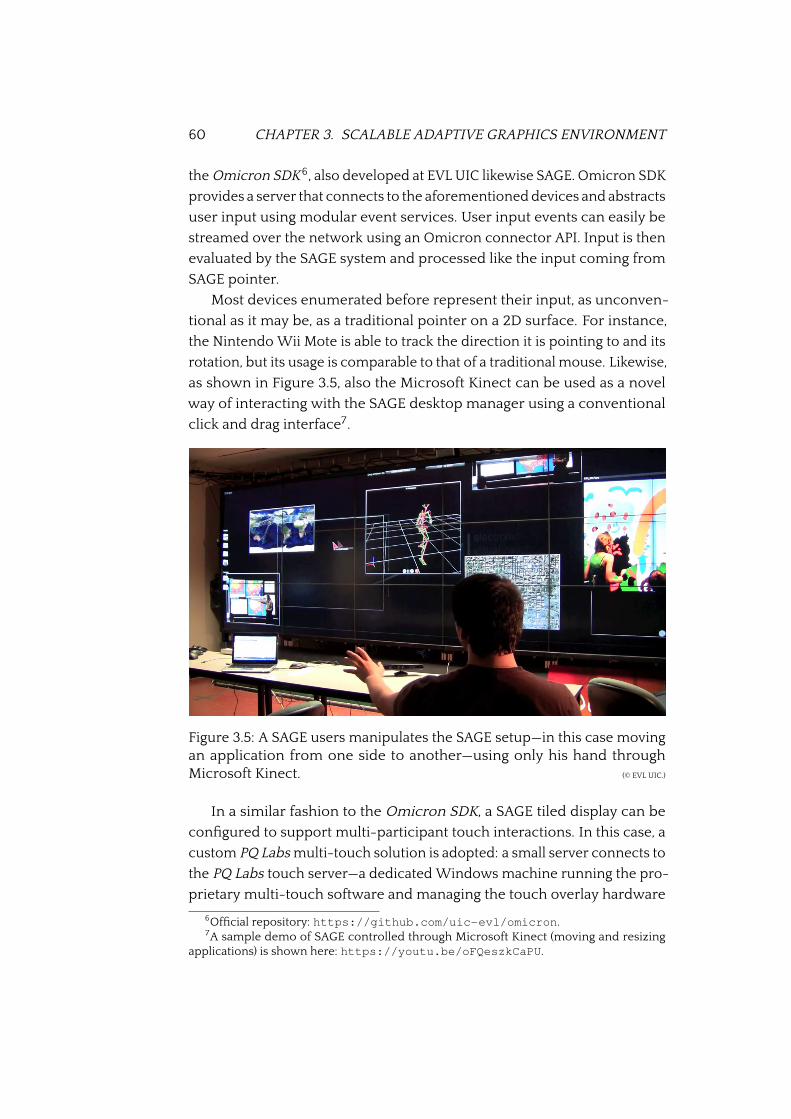
60 CHAPTER 3. SCALABLE ADAPTIVE GRAPHICS ENVIRONMENT
the Omicron SDK6, also developed at EVL UIC likewise SAGE. Omicron SDK
provides a server that connects to the aforementioned devices and abstracts
user input using modular event services. User input events can easily be
streamed over the network using an Omicron connector API. Input is then
evaluated by the SAGE system and processed like the input coming from
SAGE pointer.
Most devices enumerated before represent their input, as unconven-
tional as it may be, as a traditional pointer on a 2D surface. For instance,
the Nintendo Wii Mote is able to track the direction it is pointing to and its
rotation, but its usage is comparable to that of a traditional mouse. Likewise,
as shown in Figure 3.5, also the Microsoft Kinect can be used as a novel
way of interacting with the SAGE desktop manager using a conventional
click and drag interface7.
Figure 3.5: A SAGE users manipulates the SAGE setup—in this case movingan application from one side to another—using only his hand throughMicrosoft Kinect. (© EVL UIC.)
In a similar fashion to the Omicron SDK, a SAGE tiled display can be
con�gured to support multi-participant touch interactions. In this case, a
custom PQ Labs multi-touch solution is adopted: a small server connects to
the PQ Labs touch server—a dedicated Windows machine running the pro-
prietary multi-touch software and managing the touch overlay hardware
6Of�cial repository: https://github.com/uic-evl/omicron.7A sample demo of SAGE controlled through Microsoft Kinect (moving and resizing
applications) is shown here: https://youtu.be/oFQeszkCaPU.
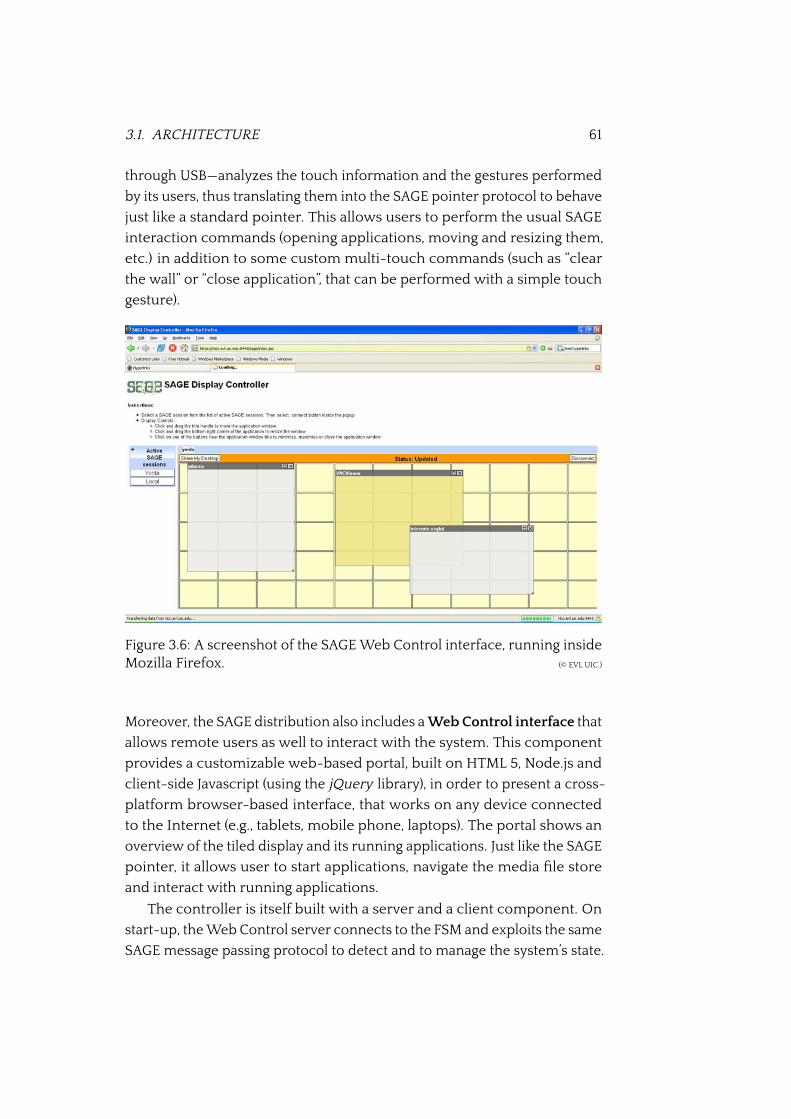
3.1. ARCHITECTURE 61
through USB—analyzes the touch information and the gestures performed
by its users, thus translating them into the SAGE pointer protocol to behave
just like a standard pointer. This allows users to perform the usual SAGE
interaction commands (opening applications, moving and resizing them,
etc.) in addition to some custom multi-touch commands (such as “clear
the wall” or “close application”, that can be performed with a simple touch
gesture).
Figure 3.6: A screenshot of the SAGE Web Control interface, running insideMozilla Firefox. (© EVL UIC.)
Moreover, the SAGE distribution also includes a Web Control interface that
allows remote users as well to interact with the system. This component
provides a customizable web-based portal, built on HTML 5, Node.js and
client-side Javascript (using the jQuery library), in order to present a cross-
platform browser-based interface, that works on any device connected
to the Internet (e.g., tablets, mobile phone, laptops). The portal shows an
overview of the tiled display and its running applications. Just like the SAGE
pointer, it allows user to start applications, navigate the media �le store
and interact with running applications.
The controller is itself built with a server and a client component. On
start-up, the Web Control server connects to the FSM and exploits the same
SAGE message passing protocol to detect and to manage the system’s state.
62 CHAPTER 3. SCALABLE ADAPTIVE GRAPHICS ENVIRONMENT
The Web Control client interface can be loaded by any modern browser
by connecting to the controller server, thus presenting the system state to
the end-user. Details about the design, the implementation and the inner
workings of the SAGE Web Controller are given in the thesis byMeerasa [66].
The primary UI is mainly composed of a schematic overview of the
tiled display managed by SAGE: boxes with yellow background indicate
single tiles of the setup, while applications running inside the environment
are shown as gray overlaid rectangles, as shown in Figure 3.6. By dragging
and dropping the application rectangles, the user can move and resize
them interactively on the tiled display. Applications can also be started
from scratch or terminated by clicking the “X” symbol on their placeholder
rectangles.
3.2 Communication and streaming
The overall architecture of the entire SAGE system is shown in Figure 3.2,
at page 49. The �gure shows how the components of SAGE interact with
each other, and how the tiled display managed by SAGE is split up into
independent tiles, each one of which gets pixel data from a SAGE receiver.
Receivers are connected to a given number of applications, which stream
data through the SAIL software layer and a high-speed network. All com-
ponents are managed by the Free Space Manager, which on its turn can be
managed by an UI client.
Communication between components can be distinguished by their
line stroke. Streams marked in the aforementioned �gure include pixel
streams (high-bandwidth connections between applications and receivers,
transferring pixel data to the tiled display), SAGE messages (that use the
custom message exchange protocol in order to sent commands and events
to the FSM), and synchronization messages (used to keep application ren-
dering and receivers in sync).
As mentioned before, SAGE can be seen as a distributed windowing
manager, matching all components above to the corresponding elements
of a windowing system analogy.
According to SAGE’s decoupled architecture, all components are in-
terconnected very loosely, with only the FSM having an overview of the
system at a time. In fact, since even the FSM does not actively manage the
lifecycle of its applications—as mentioned at page 53—the overview it has
over the whole system can be out of sync or partial.
3.2. COMMUNICATION AND STREAMING 63
3.2.1 Interconnection
The interconnection between SAGE components is achieved using standard
Transmission Control Protocol (TCP) and User Datagram Protocol (UDP)
network sockets. Using this low-level type of connection primitives entails
several advantages and some disadvantages for SAGE’s use-case.
On one hand, this choice allows to use the same communication mech-
anisms both between remote and local processes. Processes local to the
same machine can communicate ef�ciently through the loopback inter-
face8, without effectively hitting the network, using the same primitives also
used to communicate with remote processes. This is particularly effective
when applications and receivers run on the same hardware device, where
a very expensive network data transfer of video data is avoided in favor of
an in-memory copy.
A bene�t of this solution is also that a highly distributed system re-
quires almost the same con�guration steps of a localized simple system,
running on a single machine. The type of SAGE processes and components
interacting stays the same, and they use the same mechanisms and con�g-
uration �les. Once a SAGE setup is running on a local machine, provided
that the network works correctly, the setup can be replicated on multiple
machines just by setting the respective IP addresses. Also, this extends
to remote machines connected through a wide area network: both when
data is streamed through a local high-performance network or through
a slower WAN, like the Internet, as long as the two hardware devices can
communicate through IP routing, they can participate in a SAGE setup.
On the other hand, raw sockets are a low-level network interface which
is hard to use for reliable, rich communication. Messages between SAGE
components must be formatted and encoded according to a custom proto-
col, in order to �t the required information into single packets, with correct
client-server synchronization. For several SAGE use-cases, foremost the
message passing protocol seen in the next sections, a higher level network
protocol would be perhaps more useful and easier to use, like for instance
the HyperText Transfer Protocol (HTTP).
However, using sockets instead of a higher level protocol layer, allows
SAGE to make use of some IP-level routing features that make better use
8In signal routing, a loopback refers to a �ow of items back to their original source,without modi�cation. In terms of IP routing used by sockets, using the “loopback interface”is intended as opening a socket on one machine and connecting it to a second socket onthe same network adapter.
64 CHAPTER 3. SCALABLE ADAPTIVE GRAPHICS ENVIRONMENT
of the network’s bandwidth on LAN. For instance, it is possible to send
some commands using broadcast IP addresses, thus �ooding the message
to all components on the local network. Likewise, it would be possible to
use multicast addressing to send certain multimedia streams to multiple
receivers. The advantages in using multicast addressing for video delivery
has been examined in a real-case scenario by Seraghiti et al. [89]. This
feature is not used by SAGE, and not useful by default for video streaming,
since normally there is no overlap on the tiled display. However, multi-
casting could well be used for audio streaming or for some other speci�c
use-cases, in order to reduce SAGE’s bandwidth requirement.
In practice, SAGE uses the reliable TCP for most messaging-related
communications and Reliable Blast UDP (RBUDP) for bulk data transfer, as
in video streaming. The latter is seen in detail in the next section.
3.2.2 Reliable Blast UDP
As made evident by the presence of a “high-speed network” in Figure 3.2,
when not operating through loopback on a single machine setup, SAGE’s
data transmission from applications to receivers may reach very high data
rates. This is especially true given the way pixel data is encoded, as de-
scribed at page 69.
The standard and widely used User Datagram Protocol (UDP), with no
handshaking, no guarantee of delivery or ordering, and no duplicate protec-
tion, is usually described as being a very good �t for video streaming [107].
In fact, since the network bandwidth can be one of the main bottlenecks
for its performance, SAGE makes use of Reliable Blast UDP (RBUDP).
Essentially, RBUDP is an aggressive bulk data transfer scheme, intended
for extremely high-bandwidth on Quality of Service (QoS) enabled net-
works. The protocol was developed for QUANTA, a cross-platform adaptive
networking toolkit for data delivery in interactive bandwidth-intensive ap-
plications, especially on optical networks. As described by He et al. [43], the
paradigm taken in exam by QUANTA is a distributed computing system,
where optical networks serve as the system’s bus and computing clusters,
taken as a whole, serve as peripherals in a—potentially—planetary-scale
computer. This same paradigm, on a smaller scale, is similar to the aims of
SAGE, where workstations serve as parts of a heterogeneous system that
streams video onto a large tiled wall.
The protocol is described in detail by He et al.: its main goals are to
keep the network pipe as full as technically possible during data transfer,
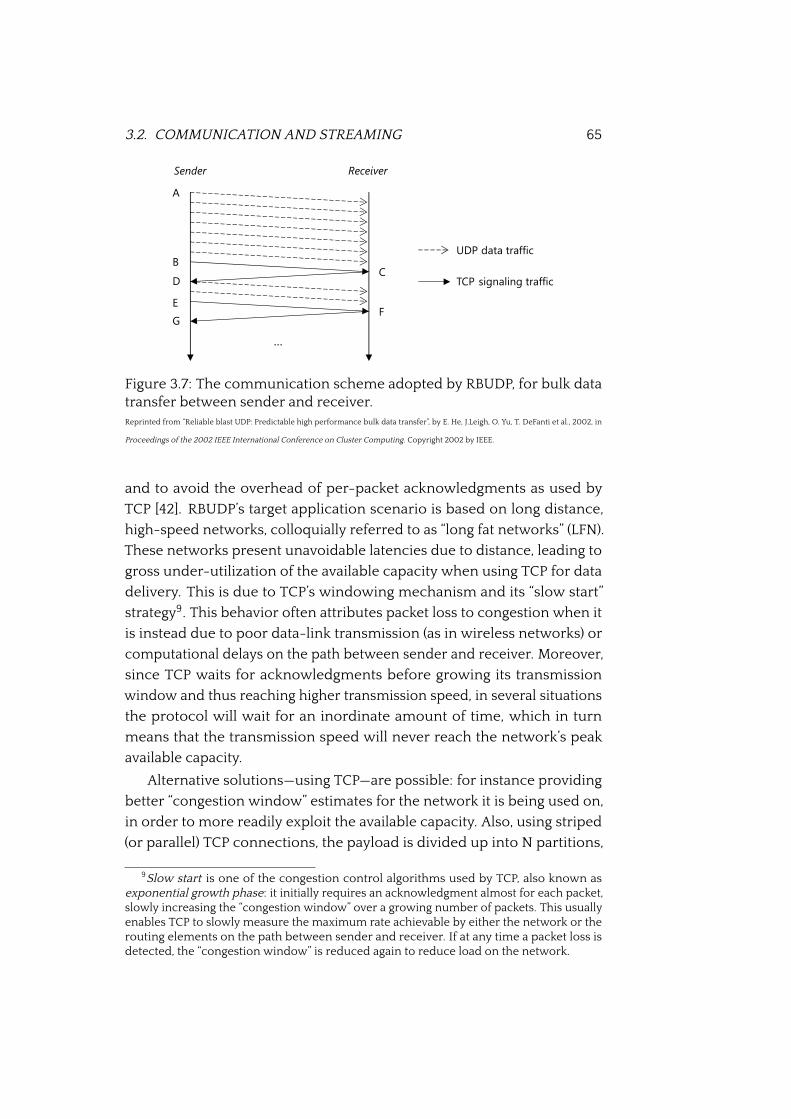
3.2. COMMUNICATION AND STREAMING 65
Figure 3.7: The communication scheme adopted by RBUDP, for bulk datatransfer between sender and receiver.Reprinted from “Reliable blast UDP: Predictable high performance bulk data transfer”, by E. He, J.Leigh, O. Yu, T. DeFanti et al., 2002, in
Proceedings of the 2002 IEEE International Conference on Cluster Computing. Copyright 2002 by IEEE.
and to avoid the overhead of per-packet acknowledgments as used by
TCP [42]. RBUDP’s target application scenario is based on long distance,
high-speed networks, colloquially referred to as “long fat networks” (LFN).
These networks present unavoidable latencies due to distance, leading to
gross under-utilization of the available capacity when using TCP for data
delivery. This is due to TCP’s windowing mechanism and its “slow start”
strategy9. This behavior often attributes packet loss to congestion when it
is instead due to poor data-link transmission (as in wireless networks) or
computational delays on the path between sender and receiver. Moreover,
since TCP waits for acknowledgments before growing its transmission
window and thus reaching higher transmission speed, in several situations
the protocol will wait for an inordinate amount of time, which in turn
means that the transmission speed will never reach the network’s peak
available capacity.
Alternative solutions—using TCP—are possible: for instance providing
better “congestion window” estimates for the network it is being used on,
in order to more readily exploit the available capacity. Also, using striped
(or parallel) TCP connections, the payload is divided up into N partitions,
9Slow start is one of the congestion control algorithms used by TCP, also known asexponential growth phase: it initially requires an acknowledgment almost for each packet,slowly increasing the “congestion window” over a growing number of packets. This usuallyenables TCP to slowly measure the maximum rate achievable by either the network or therouting elements on the path between sender and receiver. If at any time a packet loss isdetected, the “congestion window” is reduced again to reduce load on the network.
66 CHAPTER 3. SCALABLE ADAPTIVE GRAPHICS ENVIRONMENT
which are delivered over N parallel TCP streams. This technique is shown
by Allcock et al. in GridFTP to achieve a throughput as high as 80% of the
network’s available bandwidth. However, it is dif�cult to correctly estimate
the number of connections to use [1].
The Reliable Blast UDP scheme takes a more aggressive approach, by
sending the entirety of the payload at an user-speci�ed sending rate using
simple UDP packets (i.e., “blasting” the payload through the network). Since
UDP is unreliable, a number of packets may be lost—especially if the trans-
mission rate is too high for the network or the receiving host. The receiver
will keep a tally of the packets received, in order to signal the need for
retransmission. Missing packet noti�cations or the completion signal (i.e.,
the “DONE” signal) are sent via TCP, back from receiver to sender. The
sender will respond resending the missing packets, as requested. A sample
interaction of this scheme is seen in Figure 3.7.
To minimize packet loss and retransmission needs, the sending rate
should not be greater than the capacity of the bottleneck link. It has been
shown experimentally that RBUDP eliminates TCP’s slow start issues, and
is capable of fully exploiting the available bandwidth, given that the target
sending rate is estimated correctly. In controlled scenarios, it is possible to
further optimize transmission by assuming that the capacity of the network
will not be exceeded and that UDP packets—albeit not guaranteed to be
ordered on arrival—will in practice arrive in order [42].
Even if designed for use across high-bandwidth, high-latency networks,
RBUDP can provide ef�cient delivery at user-speci�ed sending rates, es-
pecially with large payloads (with smaller payloads, the time needed to
complete the delivery approaches the time needed to acknowledge the
payload). This protocol can in fact be easily extended for use in streaming
applications [43].
In practice the SAGE system makes use of the protocol for video stream-
ing between applications and receivers, even if SAGE setups are usually not
centered around a “long fat network”—quite the contrary, high-speed local
networks are frequently used as the system’s backbone. However, RBUDP
makes sure that data transmission is as fast as possible, reliable and does
not require TCP’s long exponential growth time.
3.2.3 Message passing protocol
The Free Space Manager orchestrates the system’s con�guration through
a message passing protocol. It allows direct communication with both
3.3. DRAWING AND COMPOSITION 67
applications and receivers, in order to get updates about other components
and send commands to them if needed.
Messages are very varied and serve various components through their
lifecycle. Not only does the FSM signal events about the whole system’s
status (start-up, shutdown, pausing and resuming of streaming), receivers
can give indications about sync and performance, UI client applications
(like SAGE pointer) can query the FSM, which will return status updates and
information about running applications as messages. Likewise, message
exchanges can also be generated by the action of UI clients as SAGE pointer.
User commands are sent to the FSM and can entail an exchange of messages
between it and its receivers. Also, UI clicks and interactions by the user can
originate a sequence of commands to applications, which will be able to
react accordingly.
Most important commands concern application execution, for instance
application start-up, window movement, resizing and reordering. Addi-
tionally, the FSM also collects and maintains the information needed to
setup the dynamic pixel streaming from applications to receivers. One of its
paramount roles is in fact to issue a streaming recon�guration when needed.
Whenever applications change in state or are moved across the frame
buffer, the FSM sends out messages recon�guring the applications and
ensuring that they send the appropriate data to the correct receivers [51].
To deliver these control messages among SAGE components, data is
sent through reliable TCP sockets and encoded using a very simple data
format, with a �xed structure.
As described before, some UDP features (like broadcast and multicast
routing) could be used to enhance network utilization in some circum-
stances. However SAGE always uses direct TCP connection to each of its
components, even when distributing events.
More details about SAGE’s control messaging system, its protocol and
its message encoding, are given in Section 3.6.2.
3.3 Drawing and composition
A running SAGE system is composed of one Free Space Manager, one or
more receivers and any number of applications, which produce graphical
data and can in fact run on any hardware component of the system.
Once one or more applications are running on a SAGE system and have
been con�gured by the FSM, through a sequence of con�guration messages,
68 CHAPTER 3. SCALABLE ADAPTIVE GRAPHICS ENVIRONMENT
their main mode of operation is exclusively the generation of graphical
data streams. These streams of graphical data need to be visualized on the
“virtual frame buffer”, and thus displayed on the physical output devices of
the system.
3.3.1 Pixel-streaming protocol
The SAGE system is architected as a “pixel-streaming system”. That is, it
is a system where actual pixel data is streamed and directly drawn onto
the screen. Raw encoded bitmap data is transferred through the network,
directly to the display, without further processing or decoding on the re-
ceiver’s end. This is in contrast with other system, where instead geometri-
cal primitives are encoded and sent through the network to the display.
For instance, the Microsoft Remote Desktop Protocol (RDP) also pro-
vides remote display capabilities over network connections. On the server,
RDP uses a custom video driver to render display output and sending it
through RDP to the client. The latter receives this rendering data and in-
terprets the packets into corresponding graphics device interface (GDI)
primitives [68]. X Server also makes use of a protocol in which the client
application sends drawing operations to the server in terms of drawing
primitives, expressed using the Xlib library. The actual drawing is then
ef�ciently executed on the server, with very low bandwidth consumption,
except for the transmission of bitmap data (which cannot be expressed as
a vectorial primitive).
The advantage of pixel-streaming is that the generated output is fully
platform-independent, requires almost no transformation in most cases
and is very easy for receiving systems. In practice, the server part of a pixel-
streaming client-server system has only to perform the actual memory
copy from network to display driver.
On the other hand, primitive drawing commands are much more ef�-
cient in terms of bandwidth occupation: raw rendered pixels, especially
when paired with high resolutions or lack of good compression (often
required for real-time streaming), have an extremely high bit-rate. Pixel
encoding and bandwidth requirements in SAGE are further discussed in
the next section.
In some cases, SAGE’s pixel streaming protocol is not only about send-
ing a constant stream of pixel data to a single receiver, but must be also
concerned about some corner-cases. For instance, when an application is
resized or moved in a way to span multiple output tiles—that is, the appli-
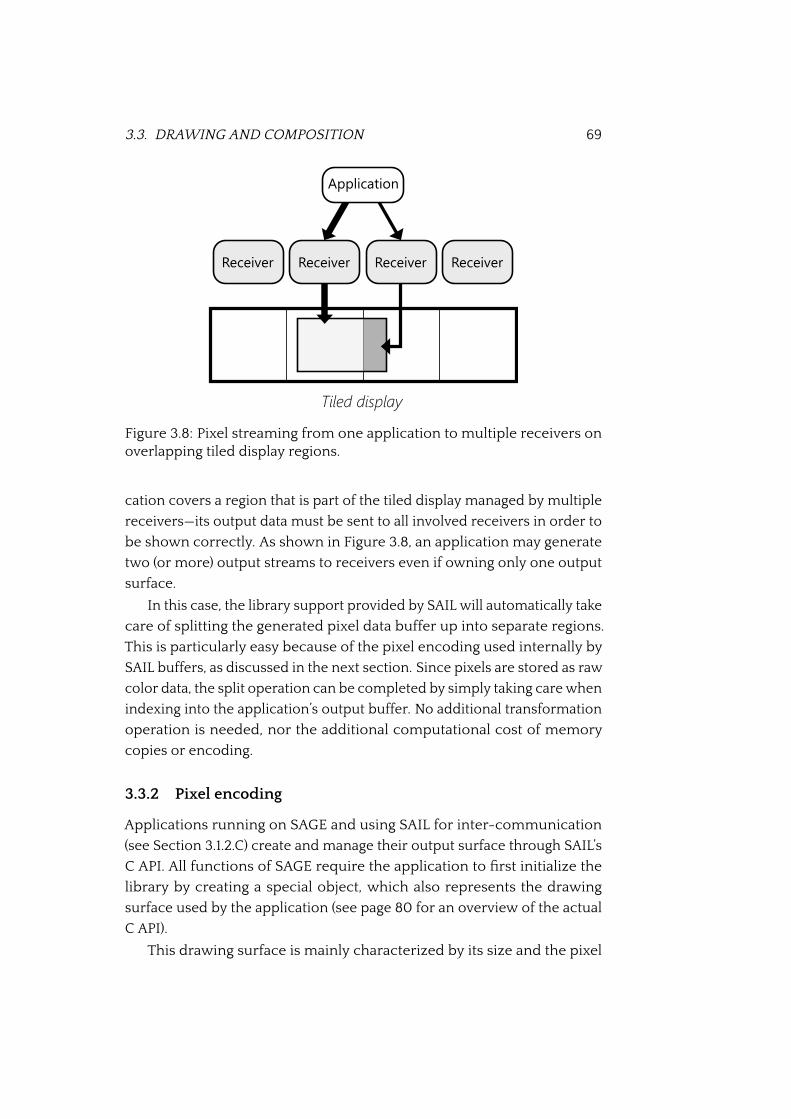
3.3. DRAWING AND COMPOSITION 69
Figure 3.8: Pixel streaming from one application to multiple receivers onoverlapping tiled display regions.
cation covers a region that is part of the tiled display managed by multiple
receivers—its output data must be sent to all involved receivers in order to
be shown correctly. As shown in Figure 3.8, an application may generate
two (or more) output streams to receivers even if owning only one output
surface.
In this case, the library support provided by SAIL will automatically take
care of splitting the generated pixel data buffer up into separate regions.
This is particularly easy because of the pixel encoding used internally by
SAIL buffers, as discussed in the next section. Since pixels are stored as raw
color data, the split operation can be completed by simply taking care when
indexing into the application’s output buffer. No additional transformation
operation is needed, nor the additional computational cost of memory
copies or encoding.
3.3.2 Pixel encoding
Applications running on SAGE and using SAIL for inter-communication
(see Section 3.1.2.C) create and manage their output surface through SAIL’s
C API. All functions of SAGE require the application to �rst initialize the
library by creating a special object, which also represents the drawing
surface used by the application (see page 80 for an overview of the actual
C API).
This drawing surface is mainly characterized by its size and the pixel
70 CHAPTER 3. SCALABLE ADAPTIVE GRAPHICS ENVIRONMENT
encoding format used internally to store graphical data. Size and format
also impact the size and type of the data buffers used by the application
when generating and transmitting rendered frames to be displayed on
screen.
The library supports a variety of pixel formats which are common for
graphical applications and largely overlap with pixel formats de�ned by the
OpenGL standard. Most 16, 24 and 32-bit formats are supported, including
some formats with an alpha channel (4 8-bit channels following the RGBA
layout). Raw YUV pixel data is also supported (a format mostly used as
raw source data for video encoders and decoders), in addition to the DXT
compressed pixel formats 10.
Due to the match between SAIL formats and OpenGL formats, incoming
pixel streams can directly be forwarded by SAGE receivers to their OpenGL
rendering pipeline, without further transcoding. Eventually, transcoding
can be performed by fast fragment shaders running directly on the graphics
hardware.
3.3.3 Composition pipeline
A standard, “feed-forward” rendering pipeline—like most pipelines used in
real-time graphics production, including 3D renderers adapted for parallel
rendering—consists of two main parts: geometry processing and rasteriza-
tion. Both this parts can be parallelized: geometry processing is parallelized
by assigning each processor a subset of objects or primitives to render. The
second part is parallelized by assigning each processor a portion of pixel
calculations. When both parts are done in parallel, the pipeline is fully
parallel [71].
In essence, each rendering task is concerned in computing what ef-
fect on which �nal pixel is applied by each primitive (be it geometry or
actual color pixels). Due to the arbitrary nature of input data and viewing
transformations, one of the main operations is to detect where on screen
a particular input structure will be located. As noted by Sutherland et al.,
rendering can be seen as a problem of sorting primitives in relation to the
screen. The nature and location of this sorting step largely depends on the
rendering system [97].
10SAGE makes use of the S3 Texture Compression compression formats, which are a groupof commonly used compression algorithms. They provide very quick lossy compressionand are well suited for real-time graphics, as they are currently supported both by theOpenGL standard and the Microsoft DirectX platform.
3.3. DRAWING AND COMPOSITION 71
In general, the sorting step can take place anywhere on the rendering
pipeline, as described in the classi�cation by Molnar et al. [71]:
• Sort-�rst: primitives are sorted early in the rendering pipeline. This is
generally done by dividing the screen into disjoint regions and making
processors entirely responsible for the whole rendering process of
each single screen region.
When rendering begins, enough transformation must be done in
order to determine which primitives fall into which screen region.
This pre-transformation step, and the following redistribution of the
workload, clearly involves some overhead.
• Sort-middle: primitives are redistributed in the middle of the ren-
dering pipeline, between processing and rasterization. At this point
primitives have been transformed into screen-ready primitives. Since
geometry processing and rasterization are performed on separate
processors or on separate tasks in most system, this is a very natural
place to break the pipeline.
This approach is general and straightforward, since primitives need
only to be sorted and redistributed to the appropriate rasterizers,
keeping the rest of the pipeline intact.
• Sort-last: this approach defers sorting until the end of the rendering
pipeline—i.e., after primitives have been rasterized to pixels. Render-
ers can process primitives to pixels no matter where they ultimately
fall onto the �nal screen (including off-screen regions).
This greatly simpli�es the renderers, at the cost of having to transmit
the pixel data over an interconnect network to a compositor, that will
resolve the visibility of each pixel. Renderers operate independently,
up to the composition stage.
A SAGE system can be interpreted just as a rendering pipeline. In SAGE’s
case however, the geometry processing phase is represented by the work
done by applications: they could be effectively rendering 3D geometry, or
simply decoding a video �le. The rasterization step is done by receivers
actually presenting the data to screen.
Notice however that the result of the �rst phase is not represented
in terms of primitive geometric data (3D vertices or such), but instead is
composed of rendered video streams, i.e. pixels.
72 CHAPTER 3. SCALABLE ADAPTIVE GRAPHICS ENVIRONMENT
Among the previously described sorting schemes, SAGE adopts the
sort-last approach in its rendering pipeline. The sort-�rst strategy clearly
appears as not feasible: albeit sorting before rendering could be done (the
FSM has information about where applications are rendered on the tiled
display), applications cannot easily be moved from one machine to another,
in an attempt to move them close to the receiver. Also, the sort-middle
approach has no useful applicability, since the �nal primitives generated
by applications are given as raw pixel buffers. Since SAGE—and its auxiliary
streaming library SAIL—have no higher level representation of the data
shown on the video wall, sort-last appears as the only feasible strategy.
As a reference, PixelFlow is presented by Molnar et al. as an architec-
ture for high-speed image generation using composition—that is sort-last
ordering—which works using a method similar to the one adopted by SAGE.
PixelFlow is presented as having several advantages: it is linearly scalable
and offers a very simple programming model. The bandwidth required to
compute the composition is determined only by screen size, frame rate and
the number of sources generating pixel data. Very little synchronization is
required, renderers can operate in a perfectly independent fashion (like
applications on SAGE), and the parallel nature of the rendering process is
fully transparent to the programmer [70].
Also, in the work presented by Cavin et al., a sort-last pipelined render-
ing approach using non-dedicated hardware with several similarities to
SAGE is presented. As noted by the authors, many optimizations could take
advantage of any sparsity in the input data to the rasterization phase, in
order to save bandwidth and speed up rendering [17]. Tay gives an in-depth
overview of techniques and optimizations that can be used in rendering
pipelines adopting the sort-last strategy, such as tree composition, binary-
swap, direct pixel forwarding and snooping [100].
However, since SAGE applications send full bitmaps for each generated
frame, none of these optimizations can lead to real performance improve-
ments. Nonetheless, SAGE retains all advantages already mentioned for
PixelFlow, associated to the last-sort approach, including decoupling of
applications and receivers (applications have a very simple programming
model that does require very few modi�cations to existing code), little syn-
chronization between components, and no additional rendering phases.
Image composition architectures entail several disadvantages, however.
Even though the bandwidth required by the system is �xed, the network
must transfer every pixel for every frame. As noted by Molnar et al., this
3.4. SYNCHRONIZATION 73
can result in very high data rates for interactive applications [71]. Secondly,
pixels must be reduced to a common format for compositing, reducing
the amount of compatible data formats the system can accept (this can be
mitigated by transforming pixel data on the �y, as mentioned previously,
however this entails a computational cost). Finally, up to an entire frame of
pixel storage is required for each renderer, since frames must be buffered
before being sent and being composited [70].
During composition of the �nal image, receivers must pay particular
attention to the way SAGE applications are ordered spatially. Each SAGE
application is ordered using a z-index, which expresses its depth position
in relation to the other applications, on the Z axis (i.e., the axis along the
viewer’s sight). Applications with a lower z-index are rendered �rst, appli-
cations with higher indexes are rendered later, covering up existing pixels
of other applications if there is an overlap.
This depth-ordering process lays bare another inef�ciency of SAGE’s
rendering pipeline: all pixel data is always transferred, independently of
how those pixels are then composited on the �nal output image. Since
visibility testing and compositing is entirely done on the receivers’ end,
applications that are fully covered up exercise the same pressure on the
network as if they were fully visible.
On the up side, this approach allows applications and receivers to be
fully decoupled from each other. Applications do not need to be updated
about their status, nor about their position on the screen, while receivers
don’t need to care about applications per se, but only about incoming pixel
streams to layout on screen.
3.4 Synchronization
Most part of SAGE’s video streaming architecture derives from the Tera-
Vision system, also developed at the Electronic Visualization Laboratory (EVL)
of the University of Illinois at Chicago (UIC). The need for synchronization,
in delivering a coherent, high quality video experience on a large scale
display, emerged largely from this preliminary work.
When multiple video streams need to be transmitted and presented in
the context of a complex display system, such as stereoscopic displays but
also tiled-display clusters, there is a stringent requirement to synchronize
both the video rendering aspect and the video display aspect at the viewing
end. Synchronization must be kept for each frame, for the video to be
74 CHAPTER 3. SCALABLE ADAPTIVE GRAPHICS ENVIRONMENT
displayed effectively to the end-user [19].
This principle is also con�rmed in the work by Singh et al.: in TeraVision,
and thus SAGE as well, not only display nodes but also rendering nodes
need to be synchronized to yield better results. Failure to do so would
produce de-alignment between videos from different rendering nodes
or de-alignment during the composition and display phase. While the
�rst issue only causes visible problems in case of applications that require
synchronized rendering, the latter produces tearing, misaligned pictures,
and distortions between tile boundaries [90].
3.4.1 Synchronization channels
The SAGE software stack makes use of two synchronization channels: the
display synchronization channel among SAGE receivers, and the render-
ing synchronization channel among applications using SAIL. These two
channels are visible in the architecture overview in Figure 3.2 at page 49.
Both synchronization channels can optionally be turned off, when not
needed. For instance, if a parallel application naturally synchronizes its
output, the additional rendering synchronization is unnecessary. Moreover,
users may also want to turn off synchronization on the receiver end, in
order to remove its overhead in case synchronization is deemed to be non
critical for the use-case scenario.
In practice, both synchronization channels are implemented as high-
priority, low-latency channels used by multiple peer processes in order to
closely synchronize the video streams across processes potentially running
on different machines. Sync channels are implemented as a two-way
handshake over TCP, among a group of processes which elect a “master”
node, signaling sync steps to all other slave nodes. To get the best results
possible, this TCP channel should provide very little latency. In order to
ensure this, Nagle’s packet buffering algorithm used by TCP is disabled by
settings the TCP_NO_DELAY option at the socket level.
Details about the synchronization mechanisms, as described in the
work by Jeong et al., are explained in the next two sections [51].
3.4.2 Rendering synchronization
All SAIL applications with enabled rendering synchronization participate in
the rendering synchronization process. A master synchronization thread is
elected on one of the SAIL nodes, while the other applications act as slaves.
3.4. SYNCHRONIZATION 75
During the normal buffer-swapping operation of an application, each
SAIL node will send an “update” signal to the master as soon as it �nishes
transferring an image frame to its receivers. This means that the application
has correctly sent a full frame and is ready to send the next.
When the synchronization master has collected signals from all slaves,
it sends a synchronization signal back to all SAIL nodes. After receiving
the signal, SAIL nodes may start to transfer a new frame as soon as it is
rendered by the application via a buffer-swap.
This simple process keeps all applications in step in their rendering
process, throttling fast applications to render at the pace of the slowest
application in the SAGE setup.
3.4.3 Display synchronization
Synchronization of screen rendering is done in a similar fashion to the
application synchronization mechanism seen before. For each running
application, SAGE creates a network worker thread on every receiver. The
worker creates a circular buffer that will collect frame data coming from that
particular application, and will setup the synchronization infrastructure.
One of the receivers is elected to be the “master”, while the other receivers
act as synchronization slaves in reference to that same application.
As shown in Figure 3.9, describing the internal synchronization archi-
tecture of a SAGE receiver, a single receiver can act as a master for one
application (application B in the example), while also acting as slave for
another application (applications A and C ).
Synchronization occurs on a per-application, per-receiver basis. That is,
each SAGE application is effectively lock-stepped at a receiver level (frames
do not advance until all receivers have obtained the next frame from that
application), but applications can advance independently one from each
other. A stalled application does not block rendering, nor does it prevent
other applications from sending new frames.
For each application displaying data on a receiver, the following mech-
anism is applied:
1. The network worker waits until all the data of frame N has been
transferred into the circular buffer.
2. Once the image data is stored, it is transferred to the graphical mem-
ory of the display adapter. This will update the internal OpenGL data
buffers used to render the application on screen.
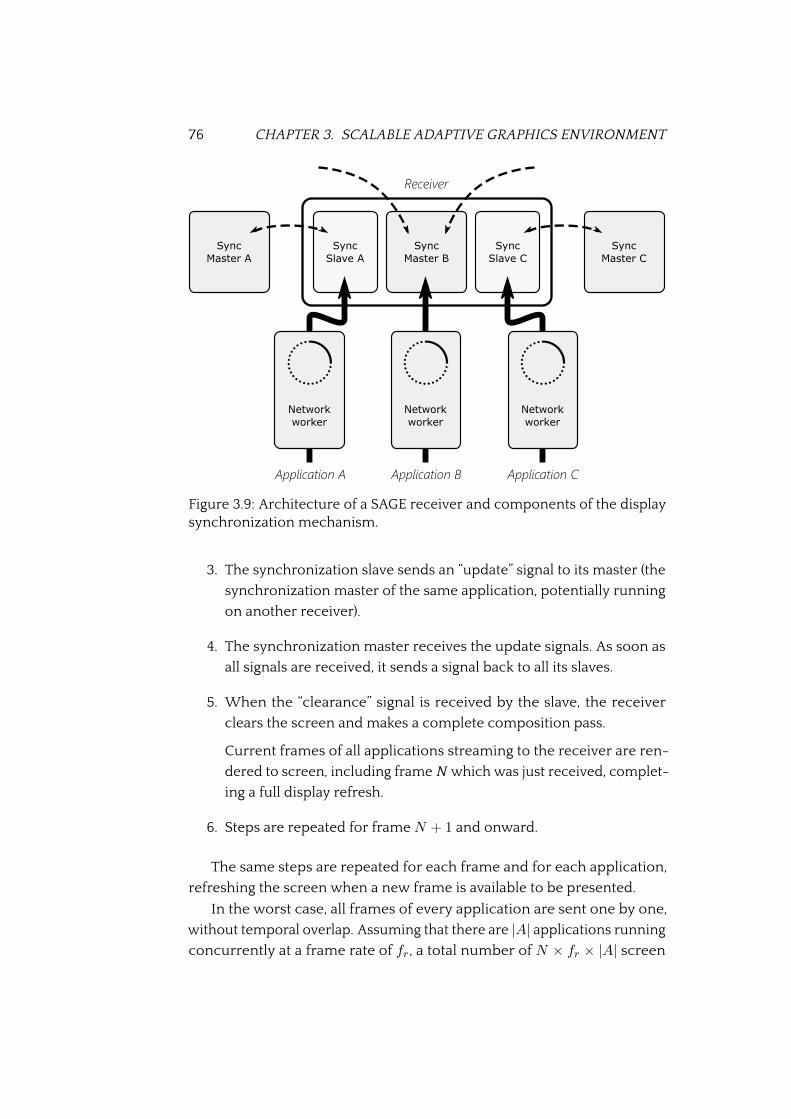
76 CHAPTER 3. SCALABLE ADAPTIVE GRAPHICS ENVIRONMENT
Figure 3.9: Architecture of a SAGE receiver and components of the displaysynchronization mechanism.
3. The synchronization slave sends an “update” signal to its master (the
synchronization master of the same application, potentially running
on another receiver).
4. The synchronization master receives the update signals. As soon as
all signals are received, it sends a signal back to all its slaves.
5. When the “clearance” signal is received by the slave, the receiver
clears the screen and makes a complete composition pass.
Current frames of all applications streaming to the receiver are ren-
dered to screen, including frame N which was just received, complet-
ing a full display refresh.
6. Steps are repeated for frame N + 1 and onward.
The same steps are repeated for each frame and for each application,
refreshing the screen when a new frame is available to be presented.
In the worst case, all frames of every application are sent one by one,
without temporal overlap. Assuming that there are |A| applications running
concurrently at a frame rate of fr , a total number of N × fr × |A| screen
3.5. PERFORMANCE 77
refreshes are needed to get all applications up to frame number N . How-
ever, once a frame has been transferred to graphical memory, a screen
repainting is a very simple operation that can be done quickly even by very
slow hardware [51]. Repainting inef�ciency never represents a bottleneck,
except with extremely high frame-rates (which however will max out the
network before hitting the maximum graphical �ll-rate of a receiver).
3.4.4 Effects on performance and scalability
Synchronization implicates a non-negligible impact on system throughput.
Not only does the total available sending bandwidth from applications to
receivers decrease, but the mean CPU utilization increases as well.
In particular, it has been shown that increasing the number of receivers
an application is connected to, the amount of video data received by the
receivers decreases, and this also lowers their CPU utilization [90].
On the contrary, when increasing the number of applications on the
system, the amount of data received by receivers increases, and their CPU
utilization goes up. This may create a communication bottleneck in syn-
chronization, causing TCP’s congestion mechanism to reduce the sending
rate. This pushes the frame rate down, also reducing the CPU utilization of
applications.
3.5 Performance
Large-scale collaborative visualization environments intrinsically have very
high requirements, both on the software and the hardware side, to achieve
a satisfactory performance.
At the time when SAGE was being designed, the ability of visualization
software to scale—in terms of amount of data they can visualize and in terms
of visualization resolution—was still an area of intensive graphics research.
And it still is, based on the work by Stoll et al. on Lightning-2 [95], the work
by Blanke et al. on the Metabuffer [11], Equalizer by Eilemann et al. [28], and
the more recent Piko by Patney et al. [76]. Most of SAGE’s video streaming
architecture derives from the work on TeraVision. As described by Singh
et al., this particular architecture provides support only for pixels being
routed to the actual display machines [90]. In the original plans, SAGE would
then allow to route also geometry and custom graphics format, drastically
reducing the amount of data required for presentation and shifting the
computational requirement from the network to the renderers. However,
78 CHAPTER 3. SCALABLE ADAPTIVE GRAPHICS ENVIRONMENT
this has not been implemented so far.
As mentioned in Section 3.3.3, since SAGE adopts a sort-last composi-
tion engine based on pixel-streaming, its requirements in terms of network
bandwidth are intrinsically very high. When a receiver and an application
are not located on the same machine, the amount of video data that must
be streamed through the network can be very substantial, growing with
video resolution and frame rate.
Performances of pixel compositing systems based on a sort-last ap-
proach have been widely taken under exam in literature [85, 72, 17]. Unlike
sort-�rst and sort-middle strategies, the performance of sort-last parallel
rendering drops sharply as the resolution of the display increases. As spec-
i�ed before, this is not due to �ll rate or graphical throughput, but mostly
to the cost of distributing the rendered pixels to the receivers for display.
Video streams that traverse the network on which SAGE runs may be
of the order of multiple gigabits per second, since the streams need to be
transmitted without compression, or with a very inef�cient compression
encoding. Even if SAGE, theoretically, could accommodate on-the-�y com-
pression and decompression, inexpensive dedicated network connections
of multiple gigabits per second are far easier to envision than perform-
ing real-time high quality compression without comparably expensive
dedicated hardware, as argued by Singh et al. [90].
For example, a single desktop screen, with a resolution of 1280 × 1024
pixels, at 24 bits per pixel and at a frame rate of 30 frames per second,
translates to a raw network stream of approximately 943 Mbps. This video
stream is thus enough to saturate a 1 Gb network.
Interesting performance metrics about a SAGE testing environment
have been compiled by Jeong et al. [51]. Since the output rate of an ap-
plication, once the rendering resolution, frame rate and pixel format are
known, is easy to estimate, the network requirements of the full system
is easy to estimate. As seen in the work referenced, given a number of
applications with a perfectly foreseeable output rate (nearly 1 Gbps in the
example), the throughput of the system scales linearly when adding more
applications, until the network is saturated. The results point to very good
network utilization, reaching up to 93.5% using RBUDP and 90.3% when
streaming through TCP.
In the same work, different tests using applications streaming through
a wide area network and using heterogeneous streaming sources have
been taken in exam. It was also shown that performance can be improved
3.6. INTEROPERATION 79
linearly by adding more rendering nodes (that is, more receivers handling
the input streams and pushing the pixels to the screen). Given the nature
of the pixel streaming, there is a hard bound on the system’s capability
of handling very large video sources. Increasing video resolution leads to
higher latency and lower frame rate, with a higher packet loss rate.
These inherent limits to the system call for high-grade multiple gigabit
network equipment, in order to accommodate video streams at suf�cient
resolutions. Particularly when reaching 4K resolutions, or higher, handling
video in real-time puts a very high strain on the network, more than on
the processing components. Large resolutions can however be taxing
computationally if videos need to be scaled or their pixel format needs
transcoding before presentation. These operations need to be executed
either on CPU or through a GPU-based transformation.
3.6 Interoperation
The SAGE system is built up on a group of independent processes, the
Free Space Manager, applications, receivers and controllers, that cooperate
in order to present multiple video streams onto a common tiled display.
The quality of the visualization depends entirely on the interoperation of
these components, thus an ef�cient communication and interfacing layer
is required.
Applications contributing to the tiled frame buffer make use of the
SAGE Application Interface Library (SAIL). Each application pushes its data
through the high-bandwidth network that bridges the SAGE system using
the same protocol provided by the library. The protocol represents a thin
layer between application and network, that allows application developers
to easily transmit output pixels and stream them to the correct display as
uncompressed pixel data. This library and its interface will be discussed in
the next section.
All SAGE components also communicate with each other using a mes-
sage exchange protocol. Messages sent and received range from informa-
tive events about the system, to important commands and recon�guration
instructions. An overview of the control message exchange is given in
Section 3.6.2.
80 CHAPTER 3. SCALABLE ADAPTIVE GRAPHICS ENVIRONMENT
3.6.1 SAIL interface
As described in the SAGE Documentation [50], two compatible software
levels can be used to program SAGE applications: a low-level API provided
in C++, and a simpli�ed higher-level API in plain C. Both APIs are exposed
by SAIL, the library that provides access to all SAGE features for application
developers.
The �rst API is built upon the programming constructs of the library
itself, thus providing insight into the primitives on which SAGE and SAIL
are built.
The latter API instead provides a simple wrapper around these compo-
nents, which make the task of writing a SAGE application more approach-
able. Being exposed as a plain C interface, this API can be used easily both
from C and C++ code, and almost any other programming language and
environment—for instance using the Java Native Interface (JNI) on Java or
Platform Invoke (PInvoke) on .NET.
In the following overview, only the high-level C API will be taken under
exam.
The exposed surface of this simpli�ed API reduces the interoperation
with SAGE to a couple of simple method calls which entirely wrap setting up
the context and the streaming con�guration with other SAGE components.
More advanced features, like messaging, can be used only if needed by the
application developer.
The following are the primary C API functions used by applications:
• createSAIL() is the main starting point for SAGE applications.
This synchronous function takes the application name and the FSM’s
IP address as parameters, in addition to other parameters de�ning
the graphical properties of the application (width, height, desired
frame-rate and pixel format).
When the function returns, a SAIL object is returned: this opaque
structure is used as a handle to the SAGE context and is required as a
parameter for almost all other functions.
The SAGE handle can be destroyed using deleteSAIL() , the spec-
ular function which will disconnect all existing connections to the
FSM, stop streaming and correctly dispose of the SAIL object.
• getWallSize() allows an application to query the full size of the
FSM’s wall (i.e., the “virtual frame buffer” size). This can be used to
3.6. INTEROPERATION 81
scale the output region’s size according to the scale of the wall.
• While the application runs, it will be concerned almost exclusively
with functions that handle output data generation and streaming.
SAIL offers four different functions that perform these operations
with different semantics.
All functions work on data “frames”, i.e. a simple data buffer that
represents a single full frame of the application to be shown on the
display. A SAIL frame is always as large as the application’s whole
output region.
The data buffer is seen as a raw array of bytes (that is, expressed in
standard C’s type system, an array of unsigned char values) and
its size is expressed as
width× height× pixel depth
where pixel depth is the size in bytes of a single pixel (usually 16, 24,
or 32 bits).
Internally, SAIL adopts a double-buffering technique in handling out-
bound data frames. This technique is based on a producer–consumer
pattern, that allows the application to create a new data frame while
SAIL transmits the previous data frame to the receiver in order for it
to be displayed. Data production and transmission can thus occur in
parallel.
At any time, there is a current frame that is available to the developer
(that needs to be �lled in), and a previous frame that is held by SAIL
and is transmitted to one or more SAGE receivers. Frames can be
“swapped” by the developer: in this case SAIL ensures that the previous
frame has completed transmission and swaps pointers to the frame
buffers. The previous frame becomes the current one, and vice-versa.
Calling the nextBuffer() function will, at any time, return a pointer
to the current frame’s data buffer. The developer can freely access
data inside the buffer and alter it as needed by the application.
When the buffer is ready to be transmitted, calling swapBuffer()
will block until the previous frame is transmitted and then will swap
buffers. Transmission of the current buffer (that now becomes the
previous buffer) begins at once.
82 CHAPTER 3. SCALABLE ADAPTIVE GRAPHICS ENVIRONMENT
SAIL also exposes two additional convenience functions: swapping
buffers and getting the new current buffer can be done with a sin-
gle call to the swapAndNextBuffer() function. Conversely, the
function swapWithBuffer() allows the developer to pass in an
external data buffer, to be used as the source of data. (Notice that SAIL
does not take ownership over the data pointer given as argument and
keeps operating on its internal buffers.)
• As mentioned before, some applications may need to process in-
coming SAGE messages in order to react to particular events of the
system.
In this case SAIL works by adopting a blocking “message pump” pat-
tern: the running thread calls into the processMessages() func-
tion, which will process any pending message if available. When
message processing is completed, execution is returned back to the
application.
SAGE messages are parsed and passed to a callback function speci�ed
by the developer for further processing. Applications can distinguish
between different kinds of messages based on their code and their
payload data.
For instance, applications may receive a APP_QUIT message when
they are terminated by the FSM and need to exit the process. An
EVT_KEY message is received when the user generates a key press
on a UI controller, and so on.
More details about SAGE’s message exchange protocol and mecha-
nisms can be found at page 80.
As seen, an application basically needs only two function calls in order
to start working inside SAGE: one function to initialize SAIL and to con�gure
its output surface, one function to get access to the output data buffer and
to swap it out for transmission.
Thanks to this simple application and streaming model, existing pro-
grams, for most platforms and written in most programming languages, can
easily be adapted to take advantage of the large visualization capabilities of
SAGE, without requiring deep changes. In fact, the double-buffer swapping
pattern adopted by SAIL is very easy to adapt to most video or audio players,
which usually work using a similar buffer-swapping paradigm.
3.6. INTEROPERATION 83
In fact, the software package in which SAGE is distributed by default
provides a modi�ed version of MPlayer, which includes a custom video
output module. Since MPlayer video output modules work through an
interface that swap in “planes” of data as they are decoded, these data
structures can simply be swapped into SAIL for network transmission.
3.6.2 Control messaging
While SAIL is mainly concerned with pushing pixels from applications
to receivers, a large part of SAGE’s operation revolves around message
exchanges with the Free Space Manager.
The FSM exposes a developer-facing layer, called the “Event Communi-
cation Layer” (ECL), that allows applications, receivers, and SAGE UI clients
(including third-party controllers) to interact with the system using mes-
sages.
Acting on user input, clients can send messages to control the FSM
and the applications it manages, for instance setting up a new application,
moving it from one location of the frame buffer to another or resizing its
output region. In return, clients obtain SAGE event messages informing
them about the current state of the system and its running applications.
The layer is based on a low-level message exchange protocol on top of
raw TCP sockets between the FSM and other components. It supports a
very high message exchange rate, in virtue of having very low overhead, but
the messages use a simple text-based format and are thus limited to basic
unstructured data payloads, enclosed within a �xed message packet format.
Moreover, the barebone message format and the simple exchange protocol
make the task of keeping track of the whole system’s status burdensome.
3.6.2.A Message format
SAGE ECL messages have 4 �xed-size data �elds of 8 bytes, and 1 payload
�eld, all separated by null characters, following the layout seen in Table 3.1.
By convention, there is a distinction between command messages (sent
from a controller to the FSM) and event messages (sent from the FSM
to a controller to signal an update to the system or an update between
components). This distinction has no concrete impact on the message
format however.
The Distance and App code message parameters are generally unused.
Message Codes are de�ned by the SAGE Documentation [50]: commands
intended for the FSM are to be found in the 1000–1100 range, commands
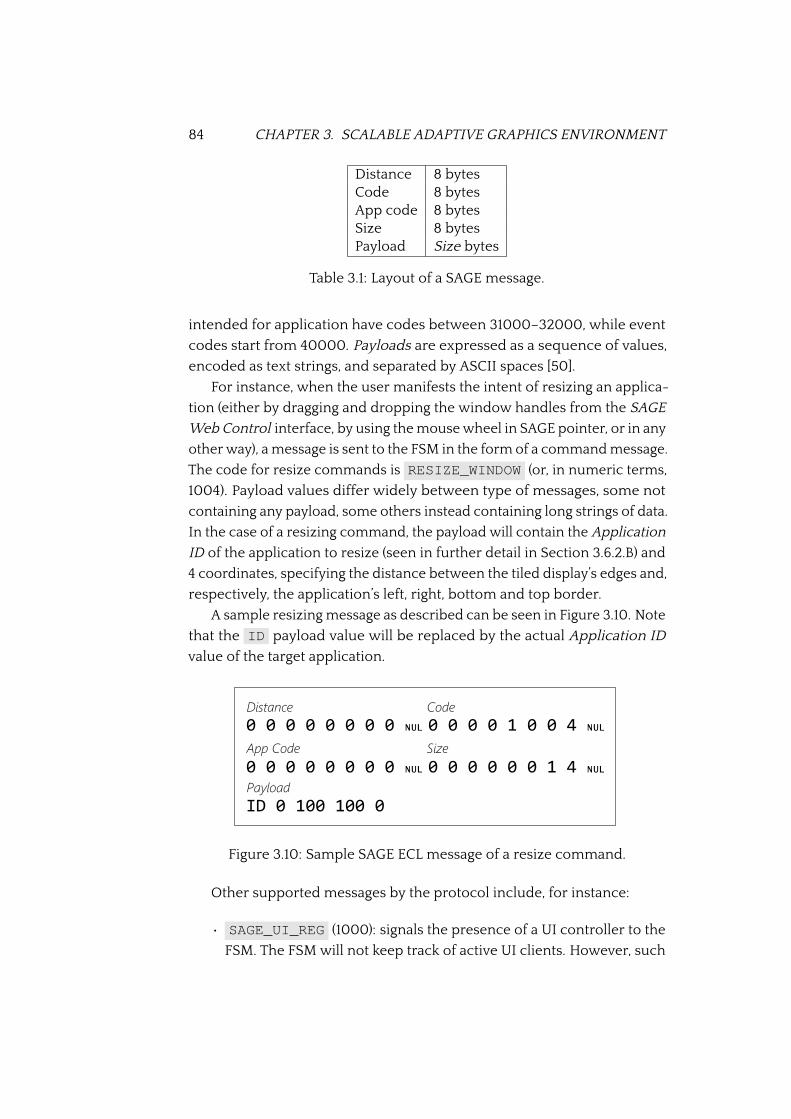
84 CHAPTER 3. SCALABLE ADAPTIVE GRAPHICS ENVIRONMENT
Distance 8 bytesCode 8 bytesApp code 8 bytesSize 8 bytesPayload Size bytes
Table 3.1: Layout of a SAGE message.
intended for application have codes between 31000–32000, while event
codes start from 40000. Payloads are expressed as a sequence of values,
encoded as text strings, and separated by ASCII spaces [50].
For instance, when the user manifests the intent of resizing an applica-
tion (either by dragging and dropping the window handles from the SAGE
Web Control interface, by using the mouse wheel in SAGE pointer, or in any
other way), a message is sent to the FSM in the form of a command message.
The code for resize commands is RESIZE_WINDOW (or, in numeric terms,
1004). Payload values differ widely between type of messages, some not
containing any payload, some others instead containing long strings of data.
In the case of a resizing command, the payload will contain the Application
ID of the application to resize (seen in further detail in Section 3.6.2.B) and
4 coordinates, specifying the distance between the tiled display’s edges and,
respectively, the application’s left, right, bottom and top border.
A sample resizing message as described can be seen in Figure 3.10. Note
that the ID payload value will be replaced by the actual Application ID
value of the target application.
Figure 3.10: Sample SAGE ECL message of a resize command.
Other supported messages by the protocol include, for instance:
• SAGE_UI_REG (1000): signals the presence of a UI controller to the
FSM. The FSM will not keep track of active UI clients. However, such
3.6. INTEROPERATION 85
a registration message forces the FSM to respond to the UI controller
with a list of the running applications, known to the server.
Once the appropriate response is sent by the FSM, an UI client can
build its user interface and show SAGE’s state to the user.
• EXEC_APP (1001): is interpreted by the FSM as an application launch
attempt. The payload includes the application name and the com-
mand line arguments that need to be supplied to the application on
launch.
The application process is started by the SAGE Application Launcher,
which usually entails the spawning of a new application process on a
machine on the SAGE cluster.
Once an application process has been started correctly, the Applica-
tion Launcher reports the success through an event message, using
code APP_INFO_RETURN (40001), which includes the application’s
new ID (see 3.6.2.B for more details) and its position on the tiled dis-
play.
• SHUTDOWN_APP (1002): issues a termination command to a speci�c
application, whose Application ID is speci�ed in the payload.
The FSM removes the application from its bookkeeping system imme-
diately, also sending an UI_APP_SHUTDOWN (40003) event message
back as con�rmation. An APP_QUIT (33000) message is then sent
to the application itself. It is customary, for well-behaved SAGE ap-
plications, to terminate their process as soon as they receive the quit
message. Once the process terminates, the application shutdown
process is complete (no additional event message is sent to signal this
success, however).
• MOVE_WINDOW (1003): moves an application to another region of the
tiled display. The message payload contains the target application’s
ID and the new coordinates to be used.
• RESIZE_WINDOW (1004): similarly, this message resizes the draw
region of an application on the tiled display. The message payload
contains the target application’s ID and the new distances from the
4 edges of the tiled display.
• EVT_CLICK (31000) or EVT_KEY (31007): these messages (along
with other message types expressing double-clicks, panning gesture,
86 CHAPTER 3. SCALABLE ADAPTIVE GRAPHICS ENVIRONMENT
and so on) are generated by an UI controller and sent to an application
using SAIL. The message payload usually contains the coordinates (in
application space) of where the click has been performed.
Messages are received by SAIL and delivered to the application code,
which will be able to process them using a common message pump pattern.
As can be seen from the previous list of message types, SAGE does not
provide a real distinction between messages directed to the FSM and mes-
sages directed to other components, just as it doesn’t formally distinguish
between commands and events. Messages of the any kind can be sent in-
discriminately to any component, which will receive the message, process
it, and—if not interested—discard it. Some messages can be forwarded to
the intended recipient, some other messages can be converted into an
appropriate message and then routed to the correct recipient.
As an example of the last scenario, when the FSM receives a message
with type SAGE_Z_VALUE or BRING_TO_FRONT (i.e., the command from
a controller to push an application to the foreground), the FSM sends out
a RCV_CHANGE_DEPTH message to all receivers on the system. The �rst
two message types make sense only to the FSM, while the last one is only
useful when sent to a receiver.
3.6.2.B Application IDs
As shown in the previous section, when issuing commands to a SAGE
application through the FSM, applications need to be identi�ed precisely.
The FSM must know which message exchange channel will be used to
forward commands and which application exactly will be receiving and
handling the communication. That is, it must be easy to �nd out the IP
address and the identity of the target application.
This task is carried out by the “Application ID”. IDs are numeric, progres-
sive values—starting from 1—which are ensured to be unique on a single
SAGE installation. That is, any application running on a SAGE system can
be sure it will be assigned an ID perfectly identifying it during its lifecycle.
Notice that Application IDs are not recycled when applications termi-
nate, thus there is no danger of con�ict.
All applications running on SAGE are assigned such a number, which
is done by the FSM itself when starting a new application instance. There
is no other way to know an ID before launch, nor is there a way to get a
speci�c ID.
3.6. INTEROPERATION 87
Assigned IDs are made known by the FSM asynchronously: after receiv-
ing an application launch command (i.e., EXEC_APP ), the FSM launches
the process and adds the new instance to its list of running applications.
When the applications has completed initialization and has created a SAIL
output surface, an event message with code APP_INFO_RETURN (40001)
will be sent, containing the name of the application, its output region posi-
tion, and the assigned Application ID. After receiving this event message,
SAGE clients can use the ID to interact with the application.
No safety nor authentication mechanisms are provided for Application
IDs: once an ID is known, any user can issue any kind of command to the
application.

88 CHAPTER 3. SCALABLE ADAPTIVE GRAPHICS ENVIRONMENT
Chapter 4
Immersive VirtualEnvironment for SAGE
Over the course of Chapter 3, Scalable Adaptive Graphics Environment
(SAGE) was presented as a performing and �exible open-source middle-
ware solution for video walls, enabling data-intensive and collaborative
visualizations for local and remote users.
In this chapter, the Interactive Virtual Environment (IVE) system is
introduced [53]. IVE was designed to provide a simple and scalable way
of controlling and managing virtual environment systems. The system is
also intended for multi-tenant scenarios (like home automation systems
with multiple rooms, each one potentially used to provide an immersive
experience).
The system presented is built on top of SAGE, and presents a more
extensible and abstracted way to coordinate immersive multisensorial
virtual environments, on one or more high resolution video walls. As far
as SAGE is lacking as a simple to use and simple to manage solution for
consumer-oriented virtual reality systems, IVE is designed to close these
gaps. The system is intended to fully control one or more SAGE installations,
including their start up and con�guration.
IVE also allows the creation of simple interactive scenarios, that can be
used to control or manipulate the experience, determining what is seen
on screen. Also, the system provides a number of friendly APIs that allow
interaction with the system’s components. These programming interfaces
are also used by mobile applications, providing access and control to end-
users.
In Section 4.1 an overview of IVE’s software architecture and its rela-
89
90 CHAPTER 4. IMMERSIVE VIRTUAL ENVIRONMENT FOR SAGE
tion to SAGE is presented. Section 4.2 goes into the details of IVE’s imple-
mentation, including its messaging protocol used to connect servers to
clients (4.2.1) and how it interoperates with SAGE (4.2.2). Finally, in Sec-
tion 4.3 the experimental setup used to develop and test IVE is be pre-
sented.
4.1 Software architecture
According to the scope and goals of the project, the Interactive Virtual
Environment (IVE) system has been designed with the following main
requisites and features in mind:
• Automatically start IVE itself and the virtual environment based on
its con�guration.
• Manage one or more video walls running SAGE, independently.
• Expose a friendly API for client applications and developers.
• Support easy extensibility, in terms of new sensors and actuators, and
in terms of scenarios that can be created.
In order to control multiple SAGE setups, an IVE system is architecturally
split up into logical groups, one for each video wall. All logical groups are
controlled by one central server, which at the same time can be controlled
by users through dedicated client applications. Each logical group is bound
to an entire, independent video surface, with no intersections nor overlaps
with surfaces of other groups.
IVE is structured in a complex master/slave topology, as depicted in
Figure 4.1: the whole system is managed by a single supervising IVE Master,
while each independent display region is controlled by an IVE Devil server.
On its turn, each Devil may control any given number of IVE Slave servers,
whose activities and interactions are still orchestrated by the master server.
In detail, the main components of an IVE system are the following:
• IVE Master: a standalone server, controlling the IVE system and ex-
posing a high-level communication protocol for clients and end-
users.
It manages the system’s state and controls communication channels
to all other components. The master will also bootstrap other servers
if needed by the con�guration.
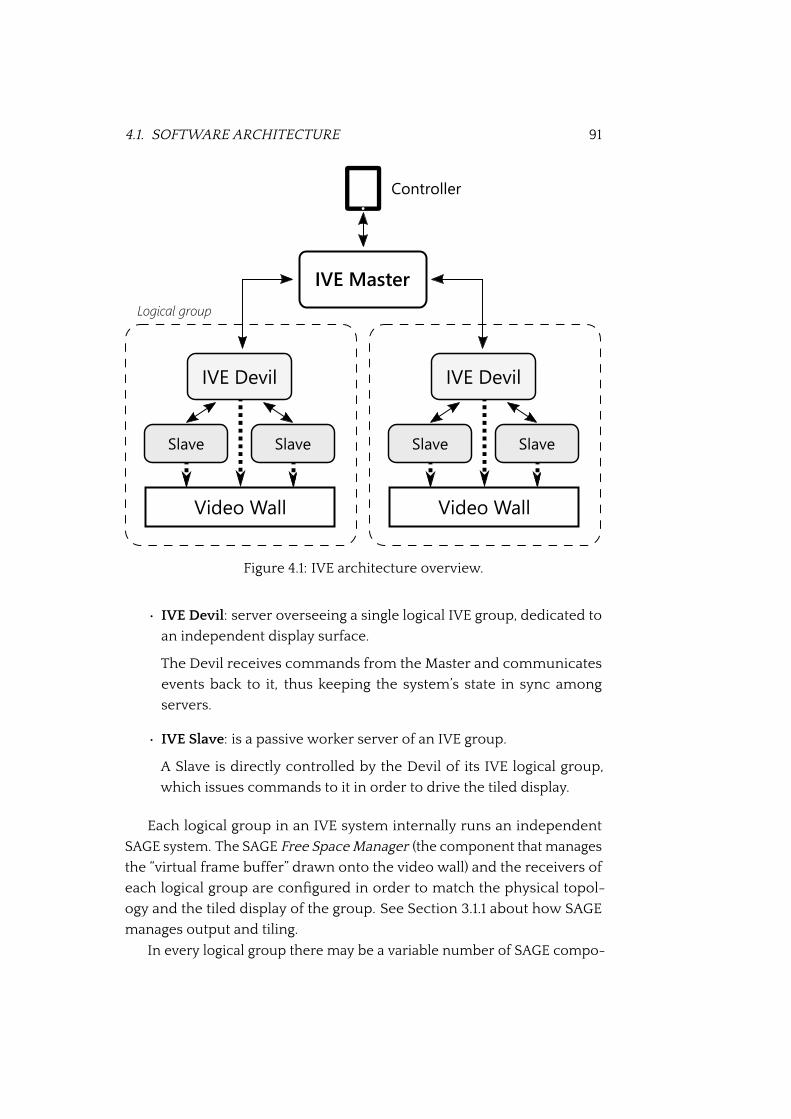
4.1. SOFTWARE ARCHITECTURE 91
Figure 4.1: IVE architecture overview.
• IVE Devil: server overseeing a single logical IVE group, dedicated to
an independent display surface.
The Devil receives commands from the Master and communicates
events back to it, thus keeping the system’s state in sync among
servers.
• IVE Slave: is a passive worker server of an IVE group.
A Slave is directly controlled by the Devil of its IVE logical group,
which issues commands to it in order to drive the tiled display.
Each logical group in an IVE system internally runs an independent
SAGE system. The SAGE Free Space Manager (the component that manages
the “virtual frame buffer” drawn onto the video wall) and the receivers of
each logical group are con�gured in order to match the physical topol-
ogy and the tiled display of the group. See Section 3.1.1 about how SAGE
manages output and tiling.
In every logical group there may be a variable number of SAGE compo-
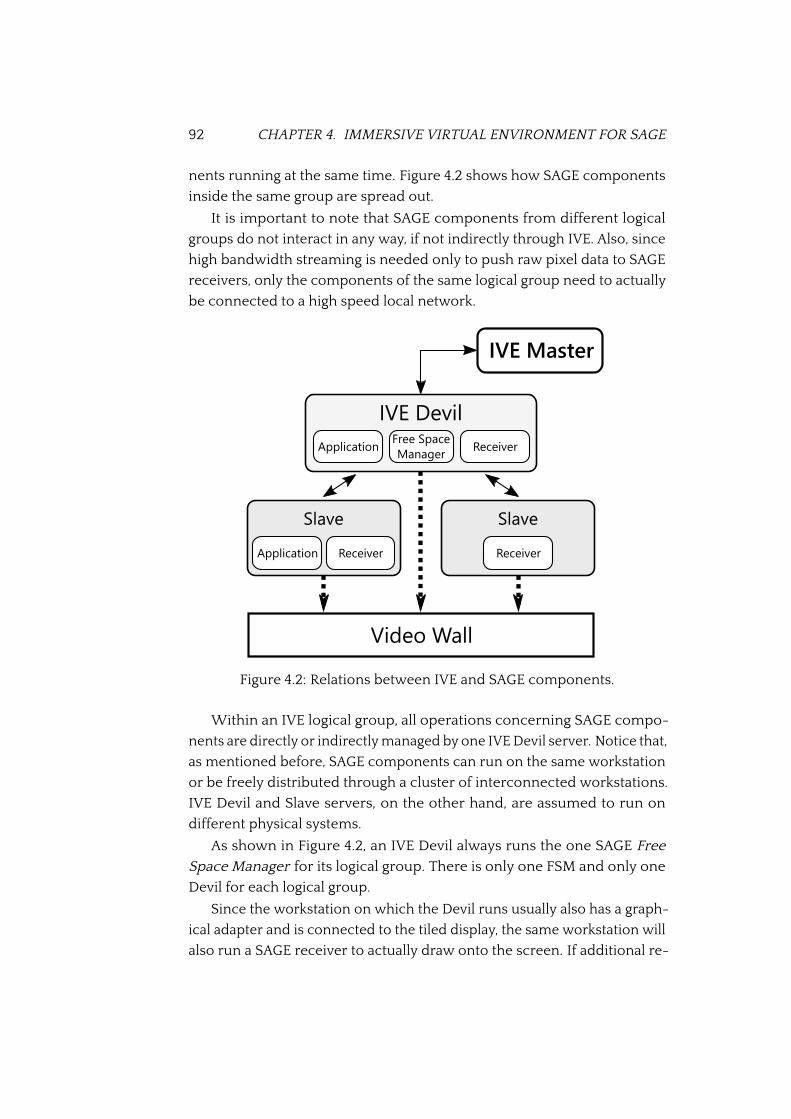
92 CHAPTER 4. IMMERSIVE VIRTUAL ENVIRONMENT FOR SAGE
nents running at the same time. Figure 4.2 shows how SAGE components
inside the same group are spread out.
It is important to note that SAGE components from different logical
groups do not interact in any way, if not indirectly through IVE. Also, since
high bandwidth streaming is needed only to push raw pixel data to SAGE
receivers, only the components of the same logical group need to actually
be connected to a high speed local network.
Figure 4.2: Relations between IVE and SAGE components.
Within an IVE logical group, all operations concerning SAGE compo-
nents are directly or indirectly managed by one IVE Devil server. Notice that,
as mentioned before, SAGE components can run on the same workstation
or be freely distributed through a cluster of interconnected workstations.
IVE Devil and Slave servers, on the other hand, are assumed to run on
different physical systems.
As shown in Figure 4.2, an IVE Devil always runs the one SAGE Free
Space Manager for its logical group. There is only one FSM and only one
Devil for each logical group.
Since the workstation on which the Devil runs usually also has a graph-
ical adapter and is connected to the tiled display, the same workstation will
also run a SAGE receiver to actually draw onto the screen. If additional re-
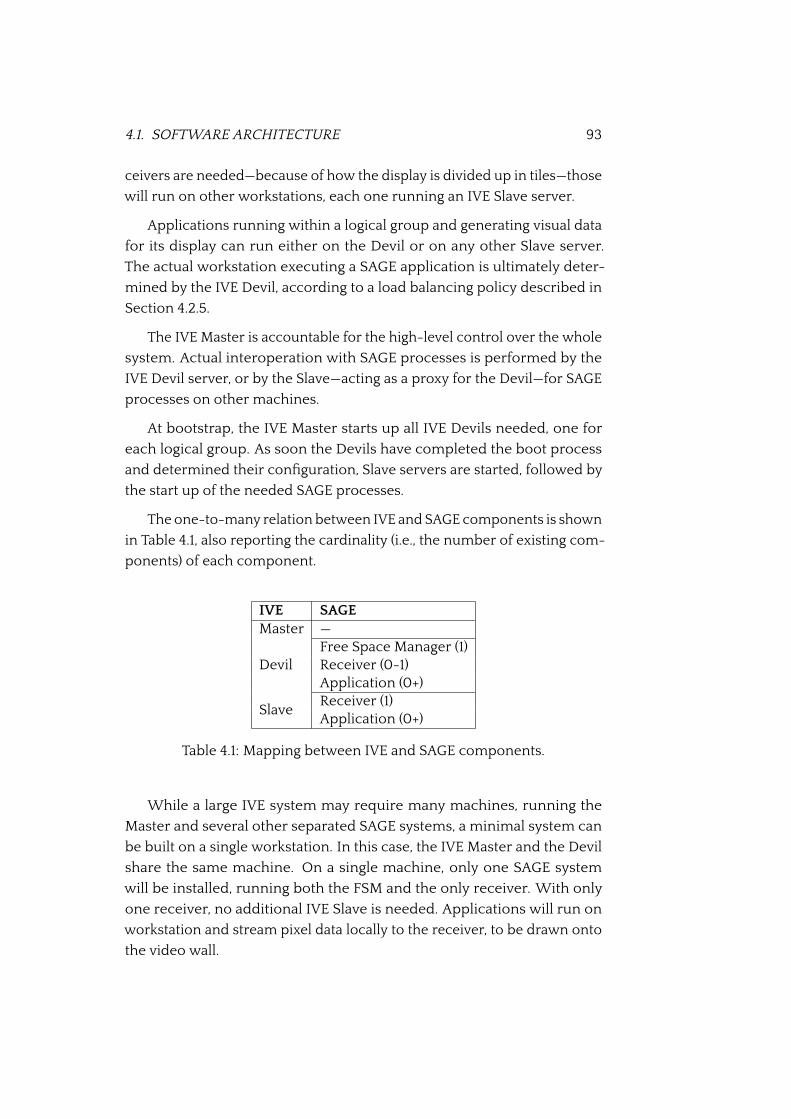
4.1. SOFTWARE ARCHITECTURE 93
ceivers are needed—because of how the display is divided up in tiles—those
will run on other workstations, each one running an IVE Slave server.
Applications running within a logical group and generating visual data
for its display can run either on the Devil or on any other Slave server.
The actual workstation executing a SAGE application is ultimately deter-
mined by the IVE Devil, according to a load balancing policy described in
Section 4.2.5.
The IVE Master is accountable for the high-level control over the whole
system. Actual interoperation with SAGE processes is performed by the
IVE Devil server, or by the Slave—acting as a proxy for the Devil—for SAGE
processes on other machines.
At bootstrap, the IVE Master starts up all IVE Devils needed, one for
each logical group. As soon the Devils have completed the boot process
and determined their con�guration, Slave servers are started, followed by
the start up of the needed SAGE processes.
The one-to-many relation between IVE and SAGE components is shown
in Table 4.1, also reporting the cardinality (i.e., the number of existing com-
ponents) of each component.
IVE SAGEMaster —
DevilFree Space Manager (1)Receiver (0-1)Application (0+)
SlaveReceiver (1)Application (0+)
Table 4.1: Mapping between IVE and SAGE components.
While a large IVE system may require many machines, running the
Master and several other separated SAGE systems, a minimal system can
be built on a single workstation. In this case, the IVE Master and the Devil
share the same machine. On a single machine, only one SAGE system
will be installed, running both the FSM and the only receiver. With only
one receiver, no additional IVE Slave is needed. Applications will run on
workstation and stream pixel data locally to the receiver, to be drawn onto
the video wall.
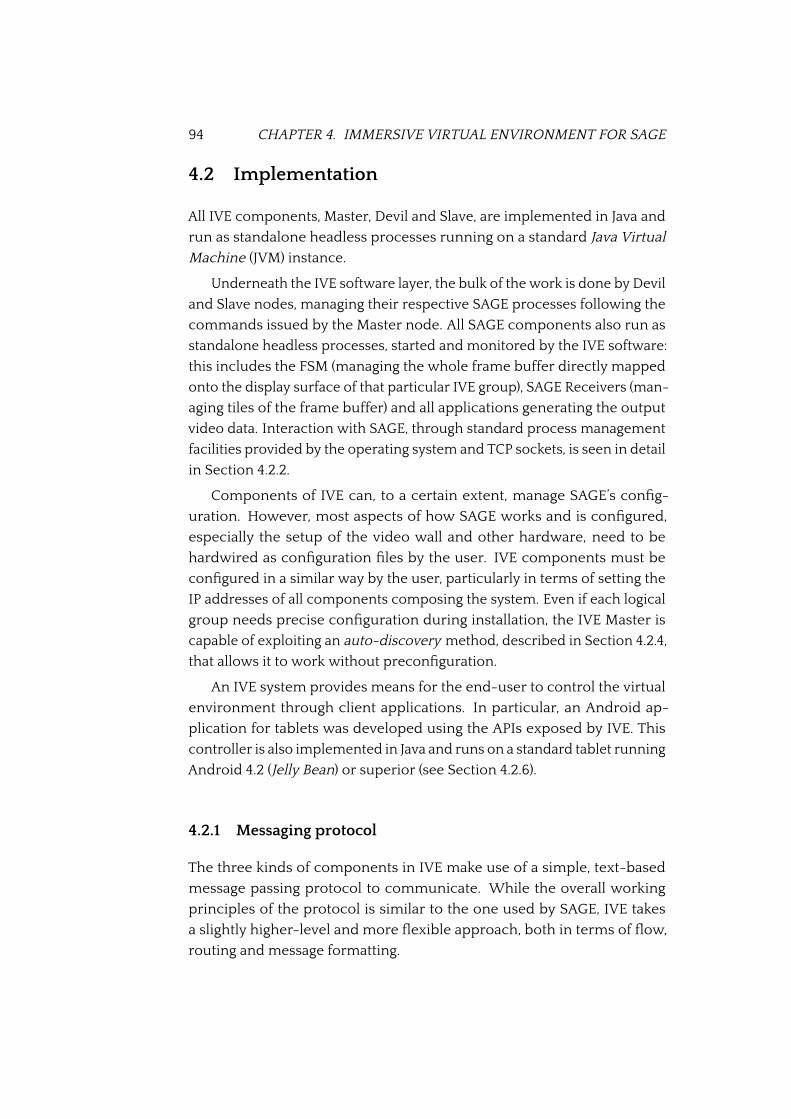
94 CHAPTER 4. IMMERSIVE VIRTUAL ENVIRONMENT FOR SAGE
4.2 Implementation
All IVE components, Master, Devil and Slave, are implemented in Java and
run as standalone headless processes running on a standard Java Virtual
Machine (JVM) instance.
Underneath the IVE software layer, the bulk of the work is done by Devil
and Slave nodes, managing their respective SAGE processes following the
commands issued by the Master node. All SAGE components also run as
standalone headless processes, started and monitored by the IVE software:
this includes the FSM (managing the whole frame buffer directly mapped
onto the display surface of that particular IVE group), SAGE Receivers (man-
aging tiles of the frame buffer) and all applications generating the output
video data. Interaction with SAGE, through standard process management
facilities provided by the operating system and TCP sockets, is seen in detail
in Section 4.2.2.
Components of IVE can, to a certain extent, manage SAGE’s con�g-
uration. However, most aspects of how SAGE works and is con�gured,
especially the setup of the video wall and other hardware, need to be
hardwired as con�guration �les by the user. IVE components must be
con�gured in a similar way by the user, particularly in terms of setting the
IP addresses of all components composing the system. Even if each logical
group needs precise con�guration during installation, the IVE Master is
capable of exploiting an auto-discovery method, described in Section 4.2.4,
that allows it to work without precon�guration.
An IVE system provides means for the end-user to control the virtual
environment through client applications. In particular, an Android ap-
plication for tablets was developed using the APIs exposed by IVE. This
controller is also implemented in Java and runs on a standard tablet running
Android 4.2 (Jelly Bean) or superior (see Section 4.2.6).
4.2.1 Messaging protocol
The three kinds of components in IVE make use of a simple, text-based
message passing protocol to communicate. While the overall working
principles of the protocol is similar to the one used by SAGE, IVE takes
a slightly higher-level and more �exible approach, both in terms of �ow,
routing and message formatting.

4.2. IMPLEMENTATION 95
4.2.1.A Message transport
Like the SAGE message exchange protocol, covered in Section 3.2.3, the
protocol adopted for IVE distinguishes between messages going “down-
ward”, from Master to Slave, and messages going “upward”, from Slave to
Master. While in SAGE nomenclature the �rst are known as “commands”
and the latter as “events”, IVE makes the distinction between “in-messages”
(messages that go downward, into the inner levels) and “out-messages”
(messages that go upward, out of the inner levels).
In SAGE there is no concept of routing a message to destination, and
messages need to be actively processed by a component in order to be,
possibly, forwarded to another component. In most cases, commands and
events are sent to the FSM, that does the heavy lifting of processing mes-
sages and sending the appropriate message to the intended components.
On the other hand, IVE performs routing of messages to a certain extent:
since most messages originate from clients and controllers connected
to the Master server, the latter takes care of forwarding in-messages as
appropriate, to the concerned Devil or Slave servers. IVE Master servers
have full knowledge of all running servers, and can deliver the message
directly. Same considerations apply to out-messages: on receiving an
update from a Devil or a Slave, the Master can forward it to any connected
clients, or give the information back through an API.
The way messages are exchanged between components of IVE and
SAGE is shown in Figure 4.3. Dashed lines between IVE components in-
dicate an out-message (traveling up), while continuous lines indicate an
in-message (traveling down). Other messages exchanged, between SAGE
components and bridging between IVE and SAGE, are SAGE messages
(direction is not noted graphically in this case).
In a similar fashion to the message exchanging adopted in SAGE, the
protocol used by IVE works across socket-based TCP channels. On start up
it is the Master server’s duty to open up persistent TCP socket connections
to Devil and Slave servers alike. These sockets are kept alive in order to
continuously exchange messages. As for SAGE, the maximum throughput
rate of messages is quite high. The slight overhead for JSON encoding and
decoding is offset by the far lower exchange rate needed by IVE: while SAGE
must communicate with receivers and applications frequently for each
update to the streaming con�guration, IVE sends out far fewer messages.
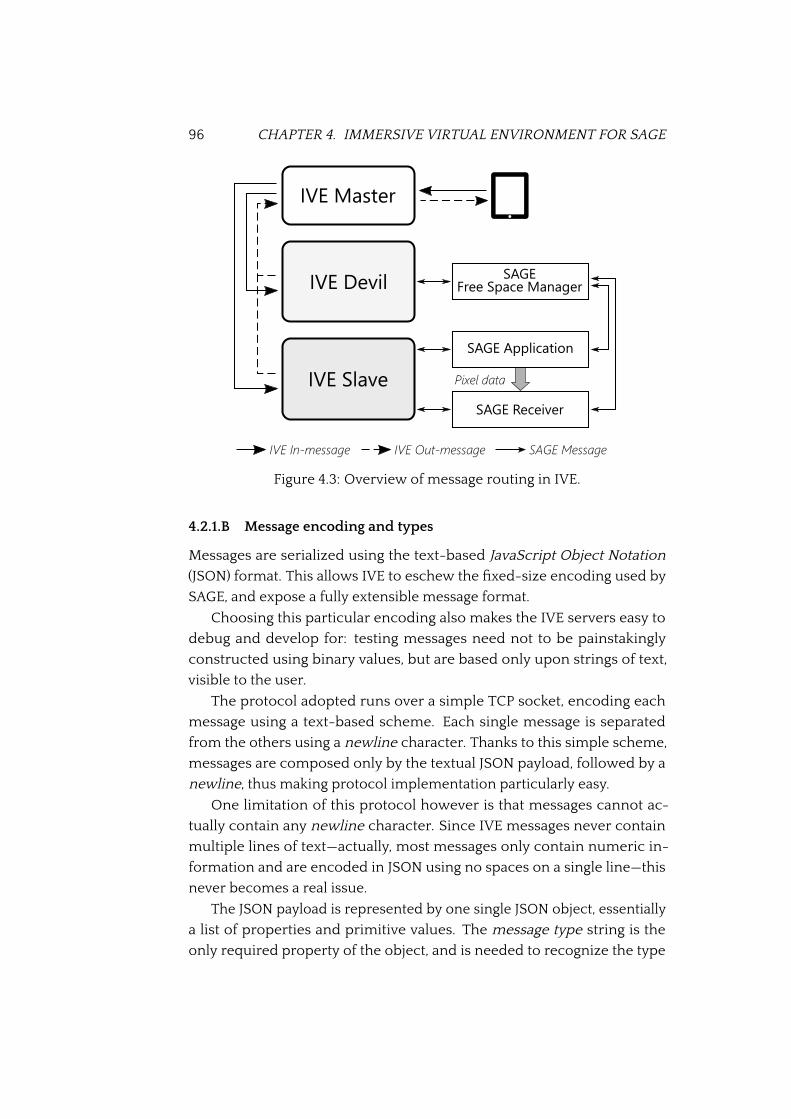
96 CHAPTER 4. IMMERSIVE VIRTUAL ENVIRONMENT FOR SAGE
Figure 4.3: Overview of message routing in IVE.
4.2.1.B Message encoding and types
Messages are serialized using the text-based JavaScript Object Notation
(JSON) format. This allows IVE to eschew the �xed-size encoding used by
SAGE, and expose a fully extensible message format.
Choosing this particular encoding also makes the IVE servers easy to
debug and develop for: testing messages need not to be painstakingly
constructed using binary values, but are based only upon strings of text,
visible to the user.
The protocol adopted runs over a simple TCP socket, encoding each
message using a text-based scheme. Each single message is separated
from the others using a newline character. Thanks to this simple scheme,
messages are composed only by the textual JSON payload, followed by a
newline, thus making protocol implementation particularly easy.
One limitation of this protocol however is that messages cannot ac-
tually contain any newline character. Since IVE messages never contain
multiple lines of text—actually, most messages only contain numeric in-
formation and are encoded in JSON using no spaces on a single line—this
never becomes a real issue.
The JSON payload is represented by one single JSON object, essentially
a list of properties and primitive values. The message type string is the
only required property of the object, and is needed to recognize the type
4.2. IMPLEMENTATION 97
of decoding and processing is needed by the message.
Using legible JSON formating, a sample payload looks like the following:
{
type: "START_SAGE"
}
The JSON object can contain other information, formatted as additional
properties, in order to pass additional parameters to the message handler.
The main in-message types available are as follows:
• CMD_LOG_IN : sent by clients to the Master server in order to login
for control. On a successful login, the Master responds with an out-
message of type LOGIN .
User management and login is discussed in Section 4.2.3.
• START_SAGE : when received by a Devil or Slave server, this message
kicks off the SAGE system (if it isn’t already running). Needed SAGE
processes (the FSM or the receivers) are started and the IVE server
waits for the system to be up and running before processing other
messages.
• SAGE_SHUTDOWN : when this message is received, all SAGE pro-
cesses, including receivers and applications, are terminated.
• SAGE_START_APP : this generic message includes an “app-name”
parameter, determining the kind of application that should be started.
Additionally, it can include any number of additional parameters,
that will be sent to the application and can determine its mode of
operation (for instance the video �le that should be played back by a
video player).
The message can be sent by a client to the Master server, which will
then forward it to the intended Devil server for execution. How the
target server is picked is described in Section 4.2.5.
When the application is started successfully, an APP_STARTED out-
message is generated, which can be used to uniquely identify the
application instance on the IVE system (application identi�cation and
tracking is discussed in Section 4.2.2).
In Section 4.2.1.E the full exchange of messages needed to start an
application is described.
98 CHAPTER 4. IMMERSIVE VIRTUAL ENVIRONMENT FOR SAGE
• SAGE_CMD_SHUTDOWN_APP : this message contains an ID of the ap-
plication to be terminated. The Master server will forward the mes-
sage to the correct Slave or Master server, which will remove the
application from the virtual environment (and kill its related process).
When the application is terminated, a corresponding APP_SHUTDOWN
message is sent back.
Once applications are running on IVE, they can of course be manipu-
lated by sending update commands. The following messages can be sent to
running applications, applying immediate changes or scheduling smooth
animations, which are performed by the Devil server:
• SAGE_CMD_MW ,
SAGE_CMD_RESIZE_W ,
SAGE_CMD_ROTATE_W ,
SAGE_CMD_SET_ALPHA : these message types allow controllers to,
respectively, move, resize, rotate, or set the alpha transparency of a
target application. The application targeted by the message is speci-
�ed as a parameter. The message will be routed to the correct Devil
or Slave server by the Master.
When the update is performed, a corresponding APP_UPDATED
out-message is generated.
• DRIFT_ANIM ,
ZOOM_ANIM : these messages allow the Devil or Slave server to pro-
gressively change the applications parameters (either its position or
its size) in order to simulate a smooth animation of the application
window.
Animations are implemented by scheduling a sequence of timed
application updates, sent to the SAGE system. On large SAGE systems
and with large applications running on multiple tiles, this can have
some performance implications, since SAGE streaming needs to be
recon�gured for each application update.
An IVE system also provides controllers with means to query about the
state of the virtual environment. This is particularly useful for controllers
that connect to a running system and need to setup their view in order to
represent the current state of IVE.
4.2. IMPLEMENTATION 99
These messages mark a decisive improvement over SAGE, which does
provide only a very limited—and in some ways unreliable—interface to the
system. In IVE, SAGE’s states is constantly monitored by Devil and Slave
servers, enabling the Master server to reliably respond to status queries.
Also notice that IVE has the concept of a “media library”, that is a collec-
tion of media �les that is located on the same network of the IVE system
and can be streamed from any component. Similarly to the SAGE “media
store” available to SAGE pointer users (see 3.1.2.D), this collection of media
�les can be used when starting applications—for instance selecting a video
�le to be played back by a video player.
• REQUIRE_LIBRARY : this message can be sent to the Master server,
which will respond with a LIBRARY message, containing a list of
registered media items.
Media items are identi�ed by a unique ID and some additional prop-
erties, like a title and a thumbnail image (accessible through HTTP).
Items can be of the following type:
– Video �les,
– Audio �les,
– Static images,
– Youtube videos.
All kinds of media items are streaming using HTTP by the respective
applications accessing them.
• REQUIRE_CONFIGURATION : a message of this type requests a com-
plete view of the system’s logical groups and servers. The Master
responds with a CONFIGURATION message, which contains a list of
servers, their information (IP address, role and status), and the list of
running applications.
Finally, there is a set of additional messages that apply only to speci�c
applications. These messages can be generated by a controller and will be
forwarded to the correct Devil or Slave by the Master. If there is a mismatch
between type of message and type of application (for instance, a message
intended for a movie player is sent to an image viewer) the message is
dropped. Otherwise, the corresponding SAGE command is sent to the
application process.
100 CHAPTER 4. IMMERSIVE VIRTUAL ENVIRONMENT FOR SAGE
For instance, the following message types only apply to movie player
applications (that is, applications that rely on the MPlayer application for
SAGE):
• MPLAYER_CHANGE_VOLUME_CMD : change the audio output volume
of an existing movie player application.
• MPLAYER_SEEK_CMD : seeks inside the �le currently played back by
the movie player. The message contains a seek position parameter
indicating the position where the playhead should be moved to.
• MPLAYER_PAUSE : pauses and resumes playback of an existing movie
player application.
4.2.1.C Message routing
An IVE system may span multiple computing devices, from a smartphone
running a controller, to the workstation running the SAGE receiver and
presenting pixels onto the screen.
While in SAGE there is no facility to understand which process is run-
ning where, except tracking processes as they are spawned, IVE supervises
how components are started and where they are physically located. Instead
of requiring the sender to know where the message’s destination node is
located on the network, all IVE components are able to route messages to
their destination.
In practice, client applications only need to open one connection to
the Master server. All messages will be sent to the Master, which will then
hierarchically route them to the �nal destination.
There are two routing parameters, that can appear inside the mes-
sage payload, which help IVE to route the message correctly. Firstly, the
slaveIp parameter indicates the IP address of the logical group master
(i.e., the IVE Devil) that should handle the message. Secondly, if the message
needs to be forwarded to an IVE Slave server, the subSlaveIp parameter
is used to specify the �nal IP address the message is sent to.
For instance, when launching a new application, the controller will de-
cide beforehand on which logical group the application will be spawned.
Once decided, the slaveIp parameter is set to the logical group’s Devil
server IP address, and sent to the Master. The Master forwards the mes-
sage to the Devil. On its turn, the Devil determines if the message can be
4.2. IMPLEMENTATION 101
handled by himself. If not, the Devil determines the target Slave, sets the
subSlaveIp parameter, and forwards the message along its last hop.
The �nal payload of a message sent to Devil 192.168.1.2 and relayed
to Slave 192.169.1.3 would look like this:
{
type: "START_SAGE",
slaveIp: "192.168.1.2",
subSlaveIp: "192.168.1.3"
}
4.2.1.D Application identi�cation
Applications running inside a SAGE environment are equipped by an Ap-
plication ID, as described in Section 3.6.2.B. This ID uniquely identi�es the
application instance inside SAGE and allows controllers to interact with it.
However, these IDs are only visible to the SAGE system itself and have no
particular meaning outside of it.
IVE provides an additional, all-comprising Application ID, which can be
used to uniquely identify applications, no matter on which SAGE system
they are in fact running. Application IDs generated by IVE are simple integer
numbers, and they are ensured to be unique during an IVE session.
The IVE Master server keeps track of all instantiated applications, also
keeping a map of all instances, their IVE Application ID, their SAGE Appli-
cation ID, and the IP of the machine they are running on. (See Section 4.2.2
for more about the interoperation with SAGE.) Thus, when sending a mes-
sage to an application, controller can send messages only to the Master,
providing the target ID as a message parameter. The message will be routed
correctly to the intended application.
To ensure that IDs are always unique, they are always assigned by the
Master itself when creating a new application.
4.2.1.E Sample message exchange for application launch
To illustrate how the message passing protocol works in detail, the scenario
of a user launching a video player application will be shown.
Assuming the user is already connected to the IVE system through their
client application, the user will pick to start a video player application. The
application will generate the following in-message, directed to the Master
server:
102 CHAPTER 4. IMMERSIVE VIRTUAL ENVIRONMENT FOR SAGE
{
type: "SAGE_START_APP",
slaveIp: "192.168.1.2",
appId: 123,
parameters: {
"app-name": "mplayer",
"loop": "true",
"srcs": [
{
type: 3,
source: "http://192.168.1.1/file.mp4"
}
]
}
}
The controller knows in which logical group the application should be
launched, therefore the slaveIp parameter is set to the IP address of
the intended target Devil server. The subSlaveIp parameter is not set
instead (see 4.2.1.C).
A new application ID is generated randomly for the message. In this
case, the value 123 is used for parameter appId (see 4.2.1.D).
Additional parameters indicate the launch arguments for the MPlayer
process. In the example above, the video player will be launched to play
back a single audio/video �le, streamed over HTTP, and will loop this single
�le inde�nitely.
When the message reaches the Devil server, the draw region of the
application is determined. Then, the draw region is used to determine the
best server to run the application. In this sample, IVE determines that the
application will mainly run on a secondary workstation in the same logical
group, and thus forwards the message accordingly.
{
type: "SAGE_START_APP",
slaveIp: "192.168.1.2",
subSlaveIp: "192.168.1.3",
appId: 123,
parameters: ...
}
4.2. IMPLEMENTATION 103
The contents of the message are left intact, while the subSlaveIp
parameter is added, containing the IP address of the target Slave server.
Once the Slave receives the message, it processes the command by
registering the application locally and spawning a new MPlayer process,
with the supplied command lines arguments. The Slave listens for updates
from SAGE’s FSM, in particular for the SAGE Application ID assigned to the
new application (in this sample the generated ID is 12).
When the new application is correctly registered by SAGE, the applica-
tion instance is registered by the IVE Slave as well. A con�rmation message,
with all the details about the application, is sent back to the Master, which
will forward the information to the controller.
{
type: "APP_STARTED",
application: {
slaveIp: "192.168.1.2",
subSlaveIp: "192.168.1.3",
id: 123,
appName: "mplayer",
isSageApp: true,
sageAppID: 12,
left: 100,
right: 100,
bottom: 100,
top: 100,
z: 0,
alpha: 255
},
slaveIp: "192.168.1.2"
}
After this exchange, the controller can continue controlling the applica-
tions behavior and its lifecycle, by identifying the application through its
ID.
4.2.2 Interoperation with SAGE
As described before in Section 3.1, a SAGE installation is composed of
several independent processes, that cannot be managed through a single
interface. Also, the SAGE system has no high-level understanding of the
104 CHAPTER 4. IMMERSIVE VIRTUAL ENVIRONMENT FOR SAGE
lifecycle of applications that draw on its frame buffer, nor of how these
applications interact with each other and other components. IVE tackles
this issue by essentially wrapping each SAGE process by an IVE component,
and keeping track of their status.
All SAGE components are launched by IVE as external processes using
the system runtime. In particular, for each logical group, the SAGE Free
Space Manager is launched by the IVE Devil, while receivers and applica-
tions are launched by Devil and Slave servers.
Processes that are part of SAGE have two methods of communicating
information: either they send messages through the FSM’s “Event Com-
munication Layer” (see Section 3.1.2.A), or to the standard output stream
( stdout ). IVE components will thus both read update messages, by open-
ing a TCP socket connection, and intercept output streams, attempting to
parse the output for updates or other information.
In this way IVE is capable of providing a complete and coherent over-
view of the system, even if by default SAGE does not expose such detailed
information and has a far more limited vision of its components and the
running applications. Commands and status queries exposed through IVE
thus enable a much more powerful and rich message exchange than would
be possible by using SAGE alone.
For instance, SAGE’s MPlayer application can be controlled by send-
ing ECL command messages (in order to pause and resume playback, for
instance), but the application does not provide detailed updates about its
status through event messages. Nonetheless, MPlayer writes different sta-
tus updates directly to its standard output stream, like its playback position
inside the �le. When the application is launched, the managing IVE com-
ponent (an IVE Devil or Slave) hooks onto the output stream, parses out
interesting information and forwards it as IVE out-messages. This means
that the IVE Master can keep track of whether a video player application is
playing or is paused, or its position within the played back �le—based on
messages coming from lower-level IVE components—and is thus able to
provide a full snapshot of the system’s state through its API.
A full map of the system’s con�guration and details of all running ap-
plications, including their metadata (like SAGE Application IDs, needed to
send SAGE commands), are stored by the IVE Master.
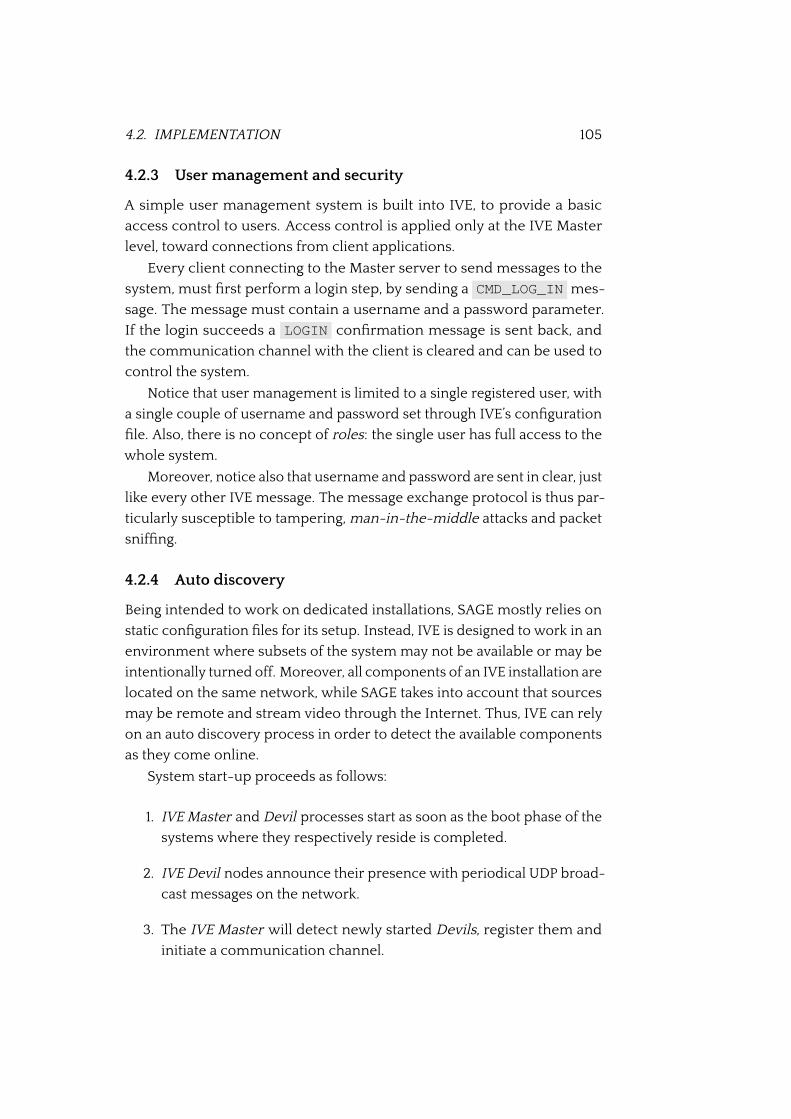
4.2. IMPLEMENTATION 105
4.2.3 User management and security
A simple user management system is built into IVE, to provide a basic
access control to users. Access control is applied only at the IVE Master
level, toward connections from client applications.
Every client connecting to the Master server to send messages to the
system, must �rst perform a login step, by sending a CMD_LOG_IN mes-
sage. The message must contain a username and a password parameter.
If the login succeeds a LOGIN con�rmation message is sent back, and
the communication channel with the client is cleared and can be used to
control the system.
Notice that user management is limited to a single registered user, with
a single couple of username and password set through IVE’s con�guration
�le. Also, there is no concept of roles: the single user has full access to the
whole system.
Moreover, notice also that username and password are sent in clear, just
like every other IVE message. The message exchange protocol is thus par-
ticularly susceptible to tampering, man-in-the-middle attacks and packet
snif�ng.
4.2.4 Auto discovery
Being intended to work on dedicated installations, SAGE mostly relies on
static con�guration �les for its setup. Instead, IVE is designed to work in an
environment where subsets of the system may not be available or may be
intentionally turned off. Moreover, all components of an IVE installation are
located on the same network, while SAGE takes into account that sources
may be remote and stream video through the Internet. Thus, IVE can rely
on an auto discovery process in order to detect the available components
as they come online.
System start-up proceeds as follows:
1. IVE Master and Devil processes start as soon as the boot phase of the
systems where they respectively reside is completed.
2. IVE Devil nodes announce their presence with periodical UDP broad-
cast messages on the network.
3. The IVE Master will detect newly started Devils, register them and
initiate a communication channel.
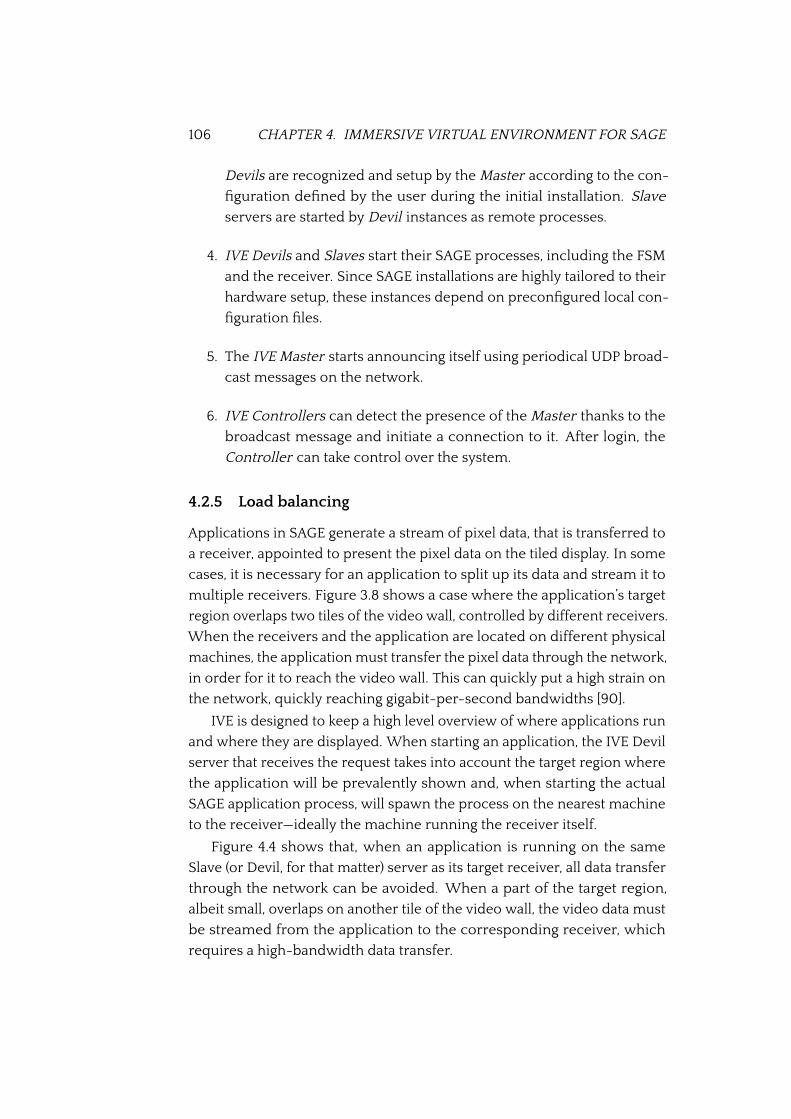
106 CHAPTER 4. IMMERSIVE VIRTUAL ENVIRONMENT FOR SAGE
Devils are recognized and setup by the Master according to the con-
�guration de�ned by the user during the initial installation. Slave
servers are started by Devil instances as remote processes.
4. IVE Devils and Slaves start their SAGE processes, including the FSM
and the receiver. Since SAGE installations are highly tailored to their
hardware setup, these instances depend on precon�gured local con-
�guration �les.
5. The IVE Master starts announcing itself using periodical UDP broad-
cast messages on the network.
6. IVE Controllers can detect the presence of the Master thanks to the
broadcast message and initiate a connection to it. After login, the
Controller can take control over the system.
4.2.5 Load balancing
Applications in SAGE generate a stream of pixel data, that is transferred to
a receiver, appointed to present the pixel data on the tiled display. In some
cases, it is necessary for an application to split up its data and stream it to
multiple receivers. Figure 3.8 shows a case where the application’s target
region overlaps two tiles of the video wall, controlled by different receivers.
When the receivers and the application are located on different physical
machines, the application must transfer the pixel data through the network,
in order for it to reach the video wall. This can quickly put a high strain on
the network, quickly reaching gigabit-per-second bandwidths [90].
IVE is designed to keep a high level overview of where applications run
and where they are displayed. When starting an application, the IVE Devil
server that receives the request takes into account the target region where
the application will be prevalently shown and, when starting the actual
SAGE application process, will spawn the process on the nearest machine
to the receiver—ideally the machine running the receiver itself.
Figure 4.4 shows that, when an application is running on the same
Slave (or Devil, for that matter) server as its target receiver, all data transfer
through the network can be avoided. When a part of the target region,
albeit small, overlaps on another tile of the video wall, the video data must
be streamed from the application to the corresponding receiver, which
requires a high-bandwidth data transfer.
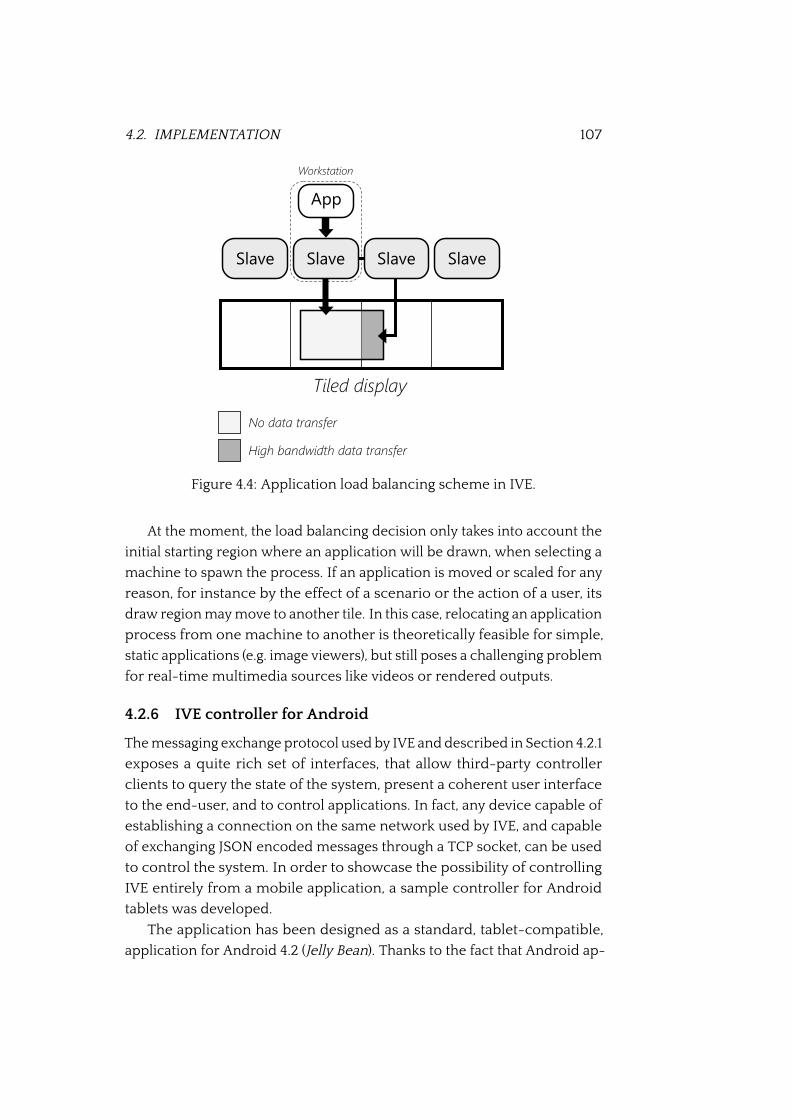
4.2. IMPLEMENTATION 107
Figure 4.4: Application load balancing scheme in IVE.
At the moment, the load balancing decision only takes into account the
initial starting region where an application will be drawn, when selecting a
machine to spawn the process. If an application is moved or scaled for any
reason, for instance by the effect of a scenario or the action of a user, its
draw region may move to another tile. In this case, relocating an application
process from one machine to another is theoretically feasible for simple,
static applications (e.g. image viewers), but still poses a challenging problem
for real-time multimedia sources like videos or rendered outputs.
4.2.6 IVE controller for Android
The messaging exchange protocol used by IVE and described in Section 4.2.1
exposes a quite rich set of interfaces, that allow third-party controller
clients to query the state of the system, present a coherent user interface
to the end-user, and to control applications. In fact, any device capable of
establishing a connection on the same network used by IVE, and capable
of exchanging JSON encoded messages through a TCP socket, can be used
to control the system. In order to showcase the possibility of controlling
IVE entirely from a mobile application, a sample controller for Android
tablets was developed.
The application has been designed as a standard, tablet-compatible,
application for Android 4.2 (Jelly Bean). Thanks to the fact that Android ap-
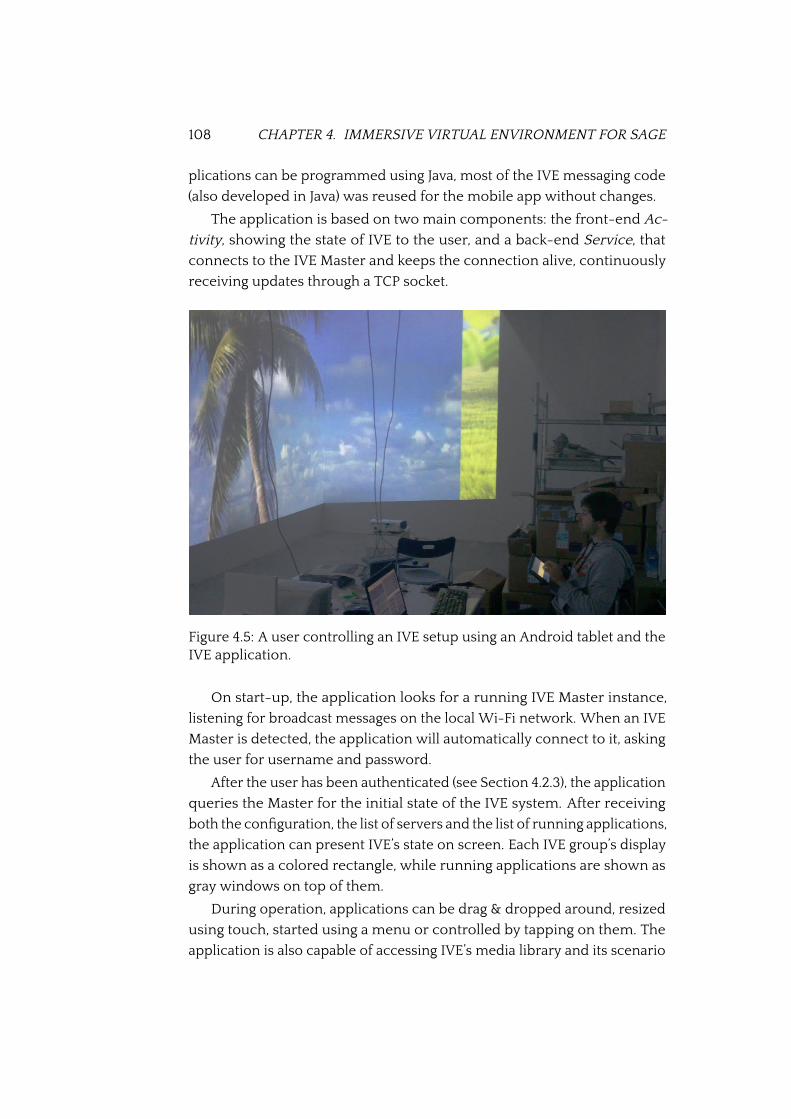
108 CHAPTER 4. IMMERSIVE VIRTUAL ENVIRONMENT FOR SAGE
plications can be programmed using Java, most of the IVE messaging code
(also developed in Java) was reused for the mobile app without changes.
The application is based on two main components: the front-end Ac-
tivity, showing the state of IVE to the user, and a back-end Service, that
connects to the IVE Master and keeps the connection alive, continuously
receiving updates through a TCP socket.
Figure 4.5: A user controlling an IVE setup using an Android tablet and theIVE application.
On start-up, the application looks for a running IVE Master instance,
listening for broadcast messages on the local Wi-Fi network. When an IVE
Master is detected, the application will automatically connect to it, asking
the user for username and password.
After the user has been authenticated (see Section 4.2.3), the application
queries the Master for the initial state of the IVE system. After receiving
both the con�guration, the list of servers and the list of running applications,
the application can present IVE’s state on screen. Each IVE group’s display
is shown as a colored rectangle, while running applications are shown as
gray windows on top of them.
During operation, applications can be drag & dropped around, resized
using touch, started using a menu or controlled by tapping on them. The
application is also capable of accessing IVE’s media library and its scenario
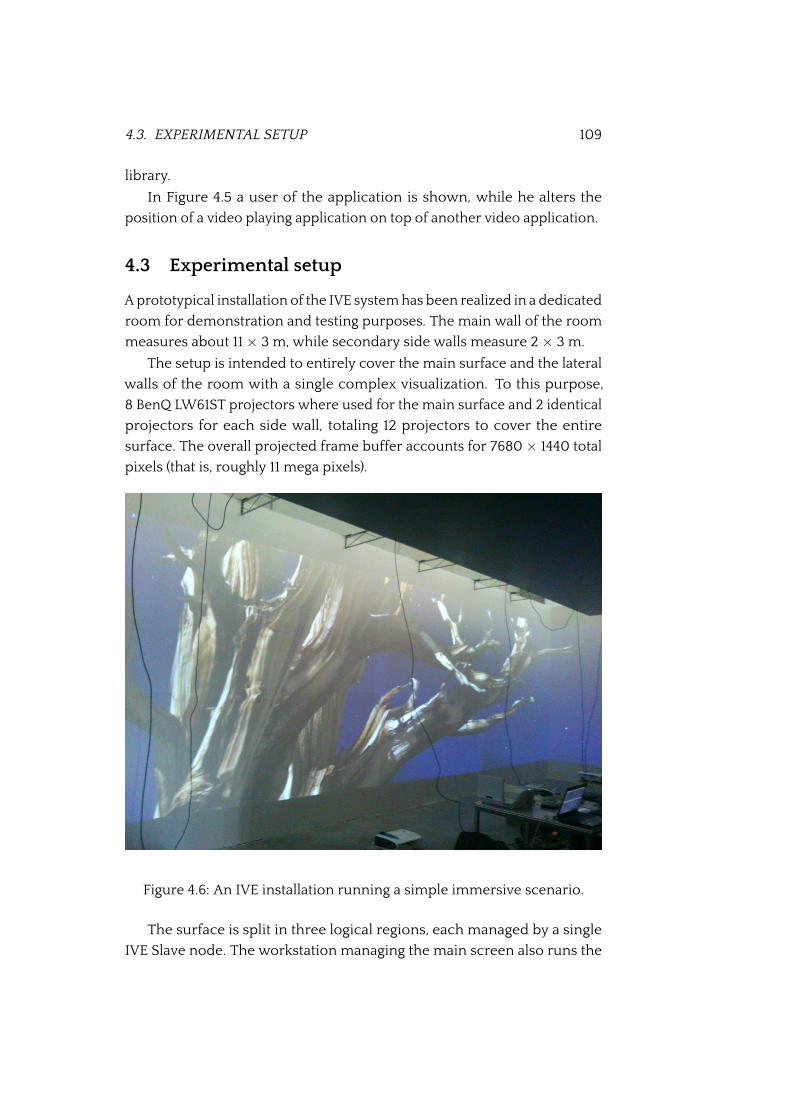
4.3. EXPERIMENTAL SETUP 109
library.
In Figure 4.5 a user of the application is shown, while he alters the
position of a video playing application on top of another video application.
4.3 Experimental setup
A prototypical installation of the IVE system has been realized in a dedicated
room for demonstration and testing purposes. The main wall of the room
measures about 11 × 3 m, while secondary side walls measure 2 × 3 m.
The setup is intended to entirely cover the main surface and the lateral
walls of the room with a single complex visualization. To this purpose,
8 BenQ LW61ST projectors where used for the main surface and 2 identical
projectors for each side wall, totaling 12 projectors to cover the entire
surface. The overall projected frame buffer accounts for 7680 × 1440 total
pixels (that is, roughly 11 mega pixels).
Figure 4.6: An IVE installation running a simple immersive scenario.
The surface is split in three logical regions, each managed by a single
IVE Slave node. The workstation managing the main screen also runs the
110 CHAPTER 4. IMMERSIVE VIRTUAL ENVIRONMENT FOR SAGE
Master and a Devil server at the same time. (This adopted setup makes IVE
run as a de facto standalone system, like a single logical group. However,
the IVE Master might in fact be located outside the room, or even remotely,
while also managing other IVE Devil servers at the same time.)
All IVE nodes are connected by a high-performance 10 gigabit network,
which supports high bit-rate raw pixel data passing from one server to
another. The network makes use of one Netgear Prosafe XS708E gigabit
Ethernet switch and workstations are equipped with Intel X540-T1 network
cards. A Wi-Fi access point is also present in order to provide access to the
controller running on an Android tablet.
The central workstation running the Master and the Devil has the more
onerous workload of the scenario, having to drive 8 projectors while also
controlling the other two machines. The workstation is equipped with two
NVIDIA Quadro K5000 video cards (each sporting 2 DVI and 2 Display-
port video outputs) and an NVIDIA Quadro Sync card1. The two secondary
computers driving the total of 4 projectors on the sides of the room are
equipped with single NVIDIA GTX670 video cards. Both kinds of worksta-
tion are also equipped with Intel i7 3770 processors, SSDs and respectively
8 and 4 GB of RAM.
Each machine runs Ubuntu 12.04 LTS, using the Compiz desktop man-
ager and the LightTwist plug-in for projection deformation correction and
alignment.
An overview of the physical IVE installation in pictures can be seen in
Appendix A.
1This particular card is needed to synchronize the two video cards and allow them to runthe 8 output screens as a single coherent desktop surface on Linux systems. On Windows,on an NVIDIA-approved workstation, the Sync card would not have been necessary.
Chapter 5
Hardware acceleration
The Scalable Adaptive Graphics Environment, known as SAGE, has been
shown to be a viable solution to drive and manage large-scale shared
displays, without resolutions constraints, that enable collaborative work
or immersive virtual environment systems, such as the Interactive Virtual
Environment (IVE), presented in Chapter 4.
These results are supported by the variety of reported installations
and real-world applications, leading to the joint project of a persistent
distributed visualization facility (i.e., the GLVF, Global Lambda Visualization
Facility, introduced by Leigh et al. in 2006) grown out of the OptIPuter and
its related projects [56, 93, 25].
Practical advantages of such systems have been explored at length, for
instance as multi-user collaborative environments for educational sce-
narios as documented by Jagodic et al. [49], or in pilot studies in remote
multi-directional conferencing for medical consultation and education, as
described by Mateevitsi et al. [64].
However, as previously discussed (see Section 3.5), high resolution pixel
streaming entails very high performance requirements, in particular in
terms of network capacity. In most cases, memory and transfer bandwidth
are the primary bottlenecks of the system.
As such, once the capacity of transferring memory from one compo-
nent of the system to another is saturated, exploiting advanced hardware
capabilities to speed up computation does not bring any concrete bene�t
to the system. Even if the decoding of compressed �les, or the composition
of the �nal rendered image, could bene�t from acceleration, the frame
rate of images displayed by SAGE is almost exclusively determined by the
network’s capacity [90].
111

112 CHAPTER 5. HARDWARE ACCELERATION
Since SAGE was �rst developed and deployed, the technical landscape
has changed profoundly. With the advent and popularization of HTML 5,
high-performance JavaScript interpreters, WebGL, Canvas with accelerated
2D rendering, and so-called Rich Internet Application, Internet browsers
have become powerful and ubiquitous rendering tools.
In fact, contemporary browsers, by their nature, provide access to high-
performance graphics with easy programmability and full networking ca-
pabilities at the same time. Both features were formerly available only to
native applications, while nowadays web applications written with HTML
and JavaScript are increasingly popular, portable, and far more accessible
by a growing community of developers.
The evolution of the SAGE project, which started in 2004, matured into
the SAGE2 project during the last years. While keeping SAGE’s original
foundations intact, SAGE2 adopts the browser, the “cloud”, and portable
web technology as its new cornerstones.
A detailed introduction and technical overview of SAGE2 will be given
in the next section. Because of the peculiar way in which video streams
are decoded and presented on screen in SAGE2, two different hardware
acceleration approaches are presented. The �rst exploits acceleration tech-
niques on the renderer’s side, just before drawing and composition, and
is described in Section 5.2. The second works by decoding videos on the
server’s hardware, and is discussed in Section 5.3. In the closing section, a
sample implementation using real hardware is discussed, together with per-
formance benchmarks, and a glimpse of a modular hardware acceleration
scheme using commodity embedded systems.
5.1 SAGE2
The Scalable Ampli�ed Group Environment project (SAGE2) is a portable,
browser-based, open-source solution for data intensive co-located and
remote collaboration. The software is based around modern web techno-
logies, both on the server and the client side, and can be used as a �exible
graphics streaming system.
Development of SAGE2 started in 2003 at the Laboratory for Advanced
Visualization & Applications (LAVA) of the University of Hawai‘i at Manoa
and at the Electronic Visualization Laboratory (EVL) of the University of
Illinois at Chicago (UIC).
Much like its predecessor SAGE, the new system is designed as a dis-
5.1. SAGE2 113
tributed streaming system and its main focus is to enable multiple users
to interact and show contents on a large display video wall. Many of the
original requirements have been dropped, in favor of components which
are more affordable and easy to setup, thus also being more approach-
able for developers and end-users alike. In fact, SAGE2 can be controlled
from anywhere (even remotely), documents and content can be shared
directly through drag ’n drop, and entire laptop screens can be shared
directly through a browser window, on any modern platform and without
additional software.
SAGE2’s version 1.0 “Ko‘olau” was released on the 17th November, 2016.
5.1.1 Architecture
SAGE2 has been designed from the ground-up to follow a �exible and
distributed architecture, similar to the one adopted in SAGE, but relying en-
tirely on more modern infrastructure and the capabilities of web browsers.
In fact, the SAGE2 architecture is presented by Marrinan et al. as a proof of
concept that the web browser runtime environment can be leveraged to
drive large display experiences and intensive applications which require
very large volumes of data [63].
The system consists of several components, as illustrated in Figure 5.1.
At the core of SAGE2 is the Server, which takes over a similar role of SAGE’s
Free Space Manager, synchronizes other components, runs applications
and stores media �les. Any number of Display Clients can be connected, ac-
tually performing the rendering to the output display, and running most of
the application code. Finally, the Interaction Clients allow users to interact
with SAGE2 via a multi-user user interface.
The SAGE2 Server is built upon Node.js1, a server-oriented platform for
building network applications entirely written in Javascript. Node.js is fully
cross-platform and provides built-in platform manager for managing soft-
ware dependencies. This feature greatly reduces the effort required to in-
stall the system—compared to SAGE and its many low-level dependencies—
and speeds up development. Display and Interaction Clients are also writ-
ten in Javascript and run in any recent browser [81]. However, using the
latest version of Google Chrome is strongly suggested by developers for
compatibility.
Most of the tiling aspects are similar to the ones of SAGE, discussed in
Section 3.1.1. However, SAGE2 effectively gets rid of the “virtual frame buffer”
1https://nodejs.org

114 CHAPTER 5. HARDWARE ACCELERATION
Figure 5.1: SAGE2 architecture overview.
concept. The system still presents one seamless graphical environment,
regardless of the number or con�gurations of the Display Client machines.
The layout of such graphical environment is set in a con�guration �le on
the SAGE2 Server.
SAGE2 Display Clients are instances of a web browser that connect to
the Server by simply accessing a speci�c URL through an HTTP connection,
with a standard web request. Each Display Client sets the DisplayID
parameter of the requested URL with a unique ID, mapping it to a speci�c
tile on the output display. The Client will receive an HTML page representing
the output to be rendered on that tile.
After the initial HTTP connection, further updates—in both directions—
are transmitted using a Web Socket connection opened by the web page
back to the SAGE2 Server. The Web Socket is used both to get further
updates, to handle user input and to synchronize app and video rendering
across Display Clients. Additional resources, including videos to render,
images and other resources, can be delivered through HTTP connections
to the Server.
5.1. SAGE2 115
An Interaction Client also runs inside a web browser connected to a
speci�c URL on the Server. The web page displayed in this case is similar in
purpose and appearance to the SAGE Web Control Interface (see page 61).
The page opens up a Web Socket connection back to the Server, that allows
the user to start or terminate applications, move running applications
across screens and to interact with them.
Finally, the SAGE2 system requires one Audio Client, that takes over
playback of all audio sources currently on screen. For instance, when a
video �le is loaded into SAGE2 and played back, its video part is played
back by one or more Display Clients (depending on the video’s position on
screen), while its audio part will be delivered to the Audio Client. This client
receives audio data for all media resources played back on the system, and
mixes the different streams to the system’s audio output.
SAGE2 is also designed to synchronize video and audio playback be-
tween the Audio Client and all Display Clients. To that end, the Audio Client
also works as a synchronization source, ensuring that playback of video
�les on Display Clients proceeds in sync with audio playback.
5.1.2 Application model
Applications in SAGE2 also rely fully on the web technologies adopted by
the rest of the system.
In essence, an application is composed by a JSON manifest and a bundle
of Javascript and optional resource �les. The manifest includes some basic
information, like title, description, and an icon, that can be used by the
system to present the application to the user.
The Javascript code bundled by the application only needs to supply an
object instance implementing the app interface, as speci�ed by the SAGE2
API. Being fully written in Javascript, applications can make use of any
method available through the language or the web browser environment,
including Web Sockets or HTTP requests to SAGE2 and to remote servers.
Application instances are registered and managed on the Server. The
Server keeps track of the application’s identity, its data, its position, and
screen size. However, unlike in SAGE, applications do not run on the Server,
nor on any other external workstation: the code of applications runs directly
inside the web browser runtime of Display Clients.
The Javascript �les bundled with the application are loaded directly by
the Display Client and code is executed inside the web browser. However,
execution is strictly controlled by the Server, which synchronizes rendering
116 CHAPTER 5. HARDWARE ACCELERATION
and drawing, thus ensuring that applications show a coherent state across
display tiles.
Synchronization is achieved using the constant Web Socket connection
between Display Client and Server. In this client/setup con�guration, the
SAGE2 Server broadcasts instructions to draw a new frame of an application
to all concerned Display Clients. Clients respond when the application has
�nished rendering the requested frame, which on its turn triggers a new
request for the next frame.
Applications implement the following interface, which will be called by
each Display Client on request by the Server:
• init(data) : called once, when the application is initialized and be-
gins its lifecycle on the Display Client. The data parameter contains
application state data (if provided by the developer) that is shared
across instances.
Applications can set some of the basic properties, like the container
item that represents the application inside the web browser. This is
done by creating a new Document Object Model (DOM) element (e.g.,
a simple block, a 2D canvas, or any other HTML element), which will
contain all graphical elements of the application.
Additionally, applications can specify a maximum rendering frame
rate or set other synchronization options.
• draw(date) : updates the application and renders out a new frame.
This can be done either by altering the DOM, or rendering to an HTML
canvas, or by making use of any other rendering facility provided by
the browser. Once rendering is complete the application automati-
cally calls back to the Server to synchronize drawing.
The date parameter contains the rendering timestamp: since the
Server issues drawing calls, applications must take this timestamp as
a reference when performing time-sensitive rendering. For instance,
a clock application should always update the time shown using this
timestamp. Also, applications showing moving images must use the
timestamp to keep pace.
• event(type, position, userId, data, date) : signals an
input event.
5.1. SAGE2 117
Since input is not handled through the Display Client, but through
an Interaction Client, events are brokered by the Server and sent in
through the Web Socket connection. When an input event—like a
click or a key press—is performed, this event is called and provides
the application with the possibility of handling it.
• quit() : sent to application instances when the application is termi-
nated. The Display Client will remove the application’s HTML DOM
element from its surface after termination.
In reference to SAGE’s application model (see Section 3.1.2.C), SAGE2
clearly adopts a very different architecture and programming model. Ap-
plications no longer are represented by native code processes tangentially
collaborating with the SAGE system by participating in the message ex-
change and by feeding pixel data to the receivers. In SAGE2, applications
are closed-off bundles of Javascript code that runs distributed inside vari-
ous web browsers, while its drawing process is tightly kept under control
by the Server.
These boundaries put limits on what an application can do, to a certain
extent, and force applications to be rewritten from scratch, especially for
SAGE2. As is seen in the next section, this also has different implications
on the video streaming model that can be used by applications.
5.1.3 Video streaming model
In SAGE, applications have only one way of pushing video data to the
frame buffer: they assemble a pixel buffer and stream it to receivers, which
then draw the pixels on the display. While there are some possibilities of
interaction with the rest of the system through message exchange, each
application in practice runs monolithically, without being really coupled to
SAGE.
Things are radically different in SAGE2, where applications run inside a
very controlled environment and there is no trace of the “frame buffer” as
an output target anymore. While these evolutions mean that developers
do not need to directly interact with buffers of graphical data—a welcome
change—these limitations also restrain how video and audio data can be
streamed to applications.
In the next two sections, two methods of streaming pixel data to the
output screen are taken into exam.
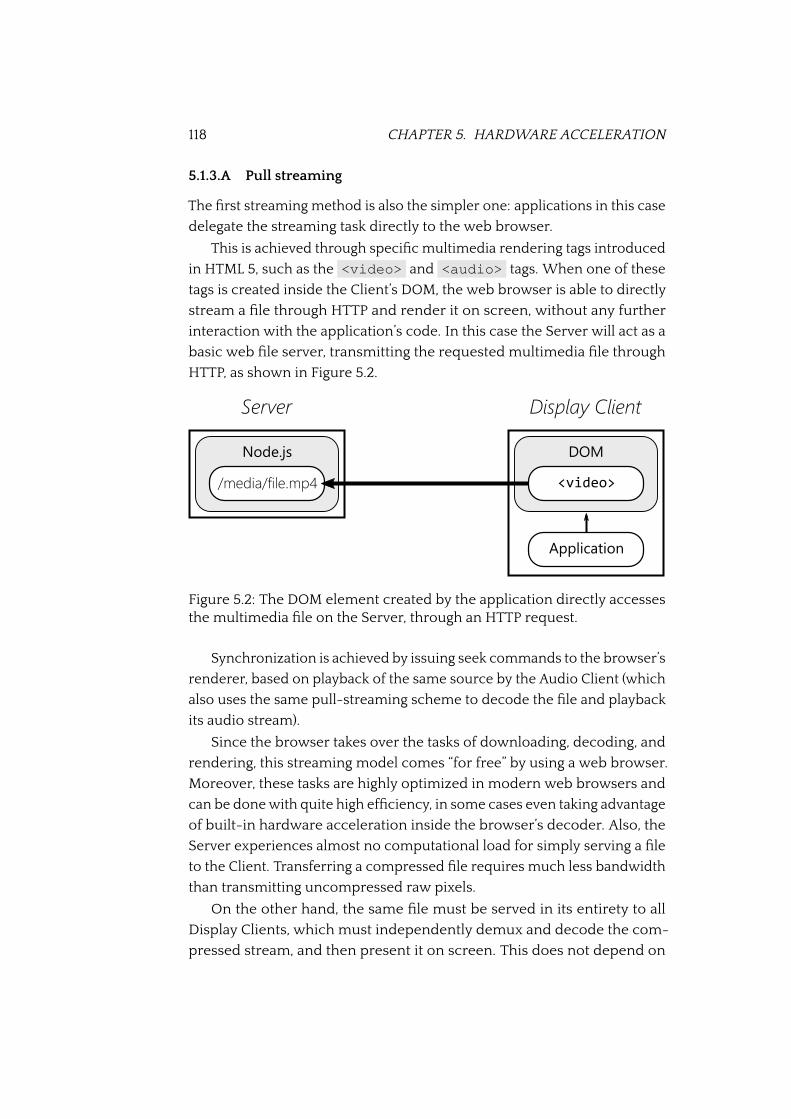
118 CHAPTER 5. HARDWARE ACCELERATION
5.1.3.A Pull streaming
The �rst streaming method is also the simpler one: applications in this case
delegate the streaming task directly to the web browser.
This is achieved through speci�c multimedia rendering tags introduced
in HTML 5, such as the <video> and <audio> tags. When one of these
tags is created inside the Client’s DOM, the web browser is able to directly
stream a �le through HTTP and render it on screen, without any further
interaction with the application’s code. In this case the Server will act as a
basic web �le server, transmitting the requested multimedia �le through
HTTP, as shown in Figure 5.2.
Figure 5.2: The DOM element created by the application directly accessesthe multimedia �le on the Server, through an HTTP request.
Synchronization is achieved by issuing seek commands to the browser’s
renderer, based on playback of the same source by the Audio Client (which
also uses the same pull-streaming scheme to decode the �le and playback
its audio stream).
Since the browser takes over the tasks of downloading, decoding, and
rendering, this streaming model comes “for free” by using a web browser.
Moreover, these tasks are highly optimized in modern web browsers and
can be done with quite high ef�ciency, in some cases even taking advantage
of built-in hardware acceleration inside the browser’s decoder. Also, the
Server experiences almost no computational load for simply serving a �le
to the Client. Transferring a compressed �le requires much less bandwidth
than transmitting uncompressed raw pixels.
On the other hand, the same �le must be served in its entirety to all
Display Clients, which must independently demux and decode the com-
pressed stream, and then present it on screen. This does not depend on

5.1. SAGE2 119
how much of the video is actually visible: no matter how small the section
rendered by a Display Client, its computational load will be the same.
Showing multiple high-resolution videos on the same Display Client
can prove to be too hard of a task, even for powerful workstations (decoding
and rendering 4K videos easily saturates desktop-class CPUs). Also, videos
that span many Display Clients require many transfers of the same �le,
causing more load on the network. This however is offset by the fact that
�les are sent in their compressed format2.
5.1.3.B Push streaming
This streaming method has been added in recent updates to SAGE2, leading
up to the 1.0 version. While more complex in many ways, this scheme
brings SAGE’s original approach of raw pixel streaming back to SAGE2.
In this case, depicted in Figure 5.3, applications create a simple drawing
surface on the web browser’s DOM. Through the Web Socket interface,
the application requests the streaming of a �le. Instead of delivering the
compressed data to the Display Client, the original �le is decompressed
directly on the Server, split up into blocks, and then sent through a Web
Socket to the Display Clients that need the pixel data. Pixel blocks are then
presented using the browser’s drawing surface.
Figure 5.3: The Server decodes and splits up the multimedia �le, servingpixel blocks to the applications.
As shown, the Server reads the media source from disk or from the
2Data-rates of compressed �les vary dramatically, depending on several factors. How-ever, a compression rate of at least 100x can be expected when using H.264 compression.That is, even sending the same �le 100 times will still cause less bandwidth occupation thansending it once uncompressed.
120 CHAPTER 5. HARDWARE ACCELERATION
network and feeds the data into an external FFMpeg process, that performs
the actual decoding of the compressed �le. The uncompressed data is fed
back to the Node.js process, raw frame by raw frame. An internal block-
splitting routine takes care of separating the decoded frame into many
128 × 128 pixel blocks (assuming a full 32 bit color encoding, each block
will take up 64 KB of memory). The Server determines which blocks need
to be sent to each Display Client and performs the transfer. Clients receive
the data and render the full frame once all blocks have been received.
The main advantage of this method is that the decoding process runs
only once per multimedia �le, leaving only the task of receiving incoming
blocks and presenting them on screen to the Display Clients. In some cases,
the decoding step can take advantage of hardware acceleration through
FFMpeg, just like the browser in the “pull” scheme. Moreover, video syn-
chronization is not an issue, since all Clients are automatically synchronized
to the latest frame decoded by the Server, using a mechanism that is similar
to the one used by SAGE (see Section 3.4.3).
On the other hand, as is the case for SAGE, the required bandwidth on
the network is far higher than in the previous scheme. If many high resolu-
tion videos are decoded and streamed at the same time, the computational
capacities of the Server and the network’s bandwidth capacity can quickly
be exceeded. Furthermore, Javascript and the web browser runtime can
be inef�cient when working with large buffers of data, when compared to
native code. Both splitting the decoded frames up into blocks and copying
them from network to the browser’s drawing surface can limit the system’s
performance.
5.2 Renderer acceleration
When using a “pull” streaming model in delivering video to the output dis-
play, described in Section 5.1.3.A, the bulk of the work is actually performed
by the Display Clients and their web browsers. In fact, the browser instance
on each Client must perform the data download through HTTP, demux the
�le, decode the video stream and then present it on screen, for every video
present on the Client’s tile.
Particularly because the full �le must be transmitted and decoded, no
matter how little of the decoded �le is really needed, reducing the decoding
cost can improve the load on the Client considerably.
Since Google Chrome is the suggested web browser for using SAGE2,
5.2. RENDERER ACCELERATION 121
in the following sections hardware acceleration will be discussed taking
Chromium, the open-source web browser on which Chrome is based, as a
reference.
5.2.1 Chromium architecture
The Chromium project is an open-source, cross-platform web browser,
initially released in 2008 and currently developed by a large community.
It is arguably one of the most feature-rich web browsers available, and is
currently released in several proprietary variants, including Google Chrome,
CEF (Chromium Embedded Framework) or Opera.
Chromium is based on a multi-process architecture. The main shell
offers the web browser experience, while individual tabs and windows con-
tain the core web renderer provided by Chromium, hosted inside external
processes for security and stability.
Video decoding in Chromium relies on third party decoders, which
are built into the web browser at build. Support for the main encoding
formats is provided by FFMpeg and LibVPX. The �rst library is one of the
most popular multimedia encoding and decoding libraries, also released
as open-source software. The second library was developed at Google,
as the main reference encoder and decoder for VP8 and VP9. These two
formats are Google’s custom video encoding schemes, that were created
as a patent-unencumbered alternative to H.264.
When required to render a media �le, the decoder will attempt to detect
the �le’s type—either by guessing from the extension, the source’s media
type as speci�ed by the HTTP headers3, or by demuxing the initial parts of
the �le. If a compatible video stream is found, the best matching decoder
is loaded and used by the web browser.
Chromium makes use of a very abstract interface to the decoding pro-
cess, since it relies on different decoders in the back-end. In essence only
three operations are provided: passing data into the decoder, waiting for a
frame to be decoded, and receiving back raw frames. These operations are
repeated continuously in order to present video on screen, until playback
is stopped or the stream ends.
Internally, decoding libraries can adopt a very different decoding model,
or interface with another layer of decoding components. FFMpeg may in
3A media type or MIME type, is a two part identi�er for �le formats used when trans-mitting content through the Internet. It is notably used by HTTP, in its “Content-Type”header.
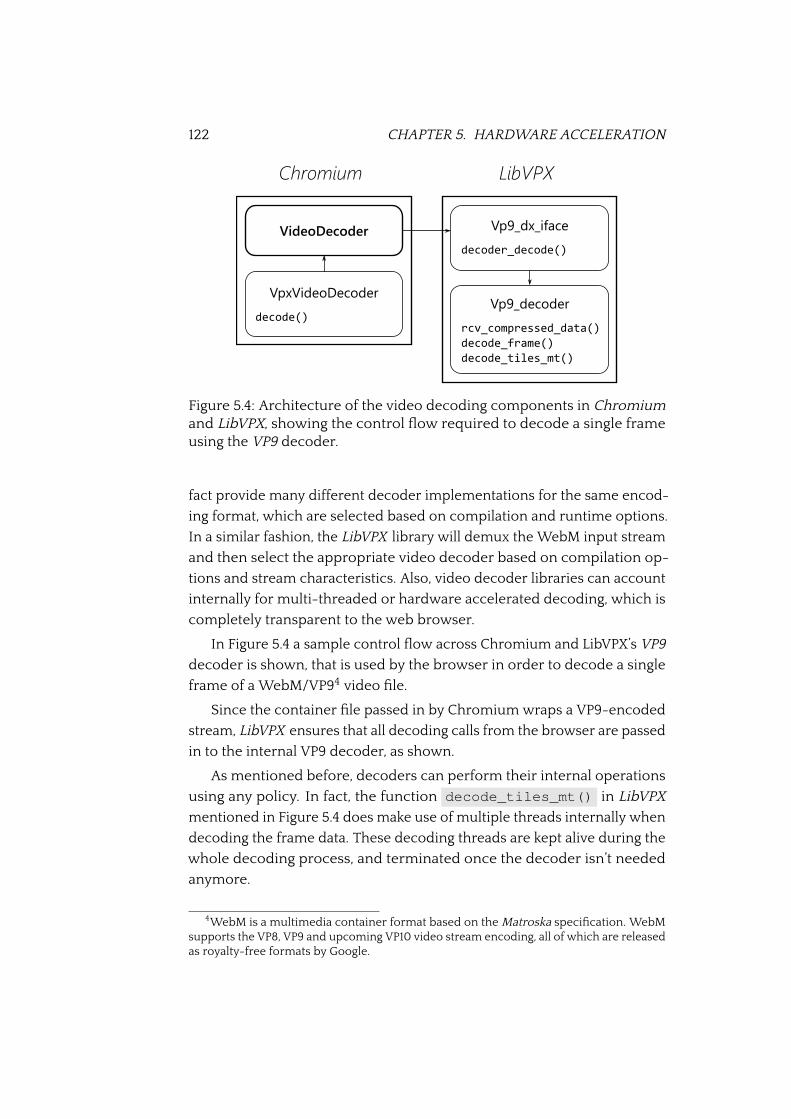
122 CHAPTER 5. HARDWARE ACCELERATION
Figure 5.4: Architecture of the video decoding components in Chromiumand LibVPX, showing the control �ow required to decode a single frameusing the VP9 decoder.
fact provide many different decoder implementations for the same encod-
ing format, which are selected based on compilation and runtime options.
In a similar fashion, the LibVPX library will demux the WebM input stream
and then select the appropriate video decoder based on compilation op-
tions and stream characteristics. Also, video decoder libraries can account
internally for multi-threaded or hardware accelerated decoding, which is
completely transparent to the web browser.
In Figure 5.4 a sample control �ow across Chromium and LibVPX’s VP9
decoder is shown, that is used by the browser in order to decode a single
frame of a WebM/VP94 video �le.
Since the container �le passed in by Chromium wraps a VP9-encoded
stream, LibVPX ensures that all decoding calls from the browser are passed
in to the internal VP9 decoder, as shown.
As mentioned before, decoders can perform their internal operations
using any policy. In fact, the function decode_tiles_mt() in LibVPX
mentioned in Figure 5.4 does make use of multiple threads internally when
decoding the frame data. These decoding threads are kept alive during the
whole decoding process, and terminated once the decoder isn’t needed
anymore.
4WebM is a multimedia container format based on the Matroska speci�cation. WebMsupports the VP8, VP9 and upcoming VP10 video stream encoding, all of which are releasedas royalty-free formats by Google.
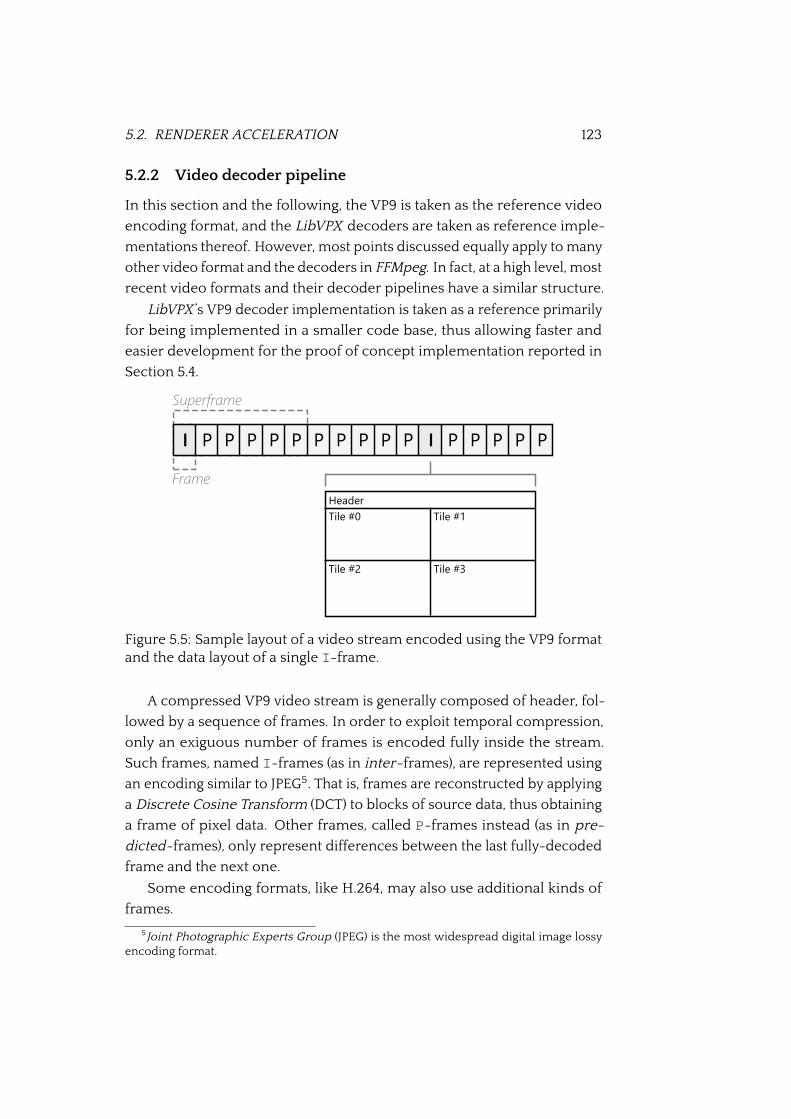
5.2. RENDERER ACCELERATION 123
5.2.2 Video decoder pipeline
In this section and the following, the VP9 is taken as the reference video
encoding format, and the LibVPX decoders are taken as reference imple-
mentations thereof. However, most points discussed equally apply to many
other video format and the decoders in FFMpeg. In fact, at a high level, most
recent video formats and their decoder pipelines have a similar structure.
LibVPX ’s VP9 decoder implementation is taken as a reference primarily
for being implemented in a smaller code base, thus allowing faster and
easier development for the proof of concept implementation reported in
Section 5.4.
Figure 5.5: Sample layout of a video stream encoded using the VP9 formatand the data layout of a single I-frame.
A compressed VP9 video stream is generally composed of header, fol-
lowed by a sequence of frames. In order to exploit temporal compression,
only an exiguous number of frames is encoded fully inside the stream.
Such frames, named I-frames (as in inter-frames), are represented using
an encoding similar to JPEG5. That is, frames are reconstructed by applying
a Discrete Cosine Transform (DCT) to blocks of source data, thus obtaining
a frame of pixel data. Other frames, called P-frames instead (as in pre-
dicted-frames), only represent differences between the last fully-decoded
frame and the next one.
Some encoding formats, like H.264, may also use additional kinds of
frames.
5Joint Photographic Experts Group (JPEG) is the most widespread digital image lossyencoding format.
124 CHAPTER 5. HARDWARE ACCELERATION
Groups of frames can be grouped into larger chunks of the byte stream,
called “superframes”. Each superframe may contain up to 8 frames, allowing
the encoder to save some bytes by reducing the frame header.
As shown in the sample VP9 byte stream layout in Figure 5.5, each
frame is structured into a header and into multiple tiles. The number of
tiles usually varies from 1 (for low resolution �les) to 8 (for 4K resolutions or
higher). Each tile does share the header information with other tiles, but has
no data dependency on any other tile in the case of I-frames. Conversely,
P-frames clearly have a data dependency on previously decoded frames.
The VP9 decoder adopts a multi-threaded approach in which, after
decoding the format of a frame and its header, each tile is assigned to a
worker thread for decoding.
5.2.3 Decoder acceleration
Real performance gains obtained through hardware acceleration are hard
to estimate and often are hindered by counter-intuitive factors or depen-
dencies that are not evident in sequential code. In particular, adapting
a video decoder to fruitfully making use of the hardware available is not
an easy task because of the large amount of memory transfers involved.
Even if the computational aspect of video decoding is an ideal task for
many dedicated processors, time spent copying video data can—in some
cases—negate any time gain. In fact, for instance when decoding lower
video resolutions, far better performance can be obtained by doing all work
in CPU.
Moreover, implementing a whole video decoder, for any modern encod-
ing format, capable of making use of hardware acceleration, is a daunting
task because of its inherent complexity.
In order to perform an evaluation of the achievable gains, focus was
put on a single part of the entire decoding pipeline. Intuitively, following
Amdahl’s law, the decoder segment with the largest expected data paral-
lelism should be able to bring most performance gains when executed on
multi-core hardware [2].
An evaluation of the different parts of the VP9 decoder was done, timing
each individual segment of code and accumulating the ratio of time spent
in strictly sequential code parts against time spent in code that can be
parallelized.
Results in Table 5.1 show the ratio between inherently sequential and
parallel code section.
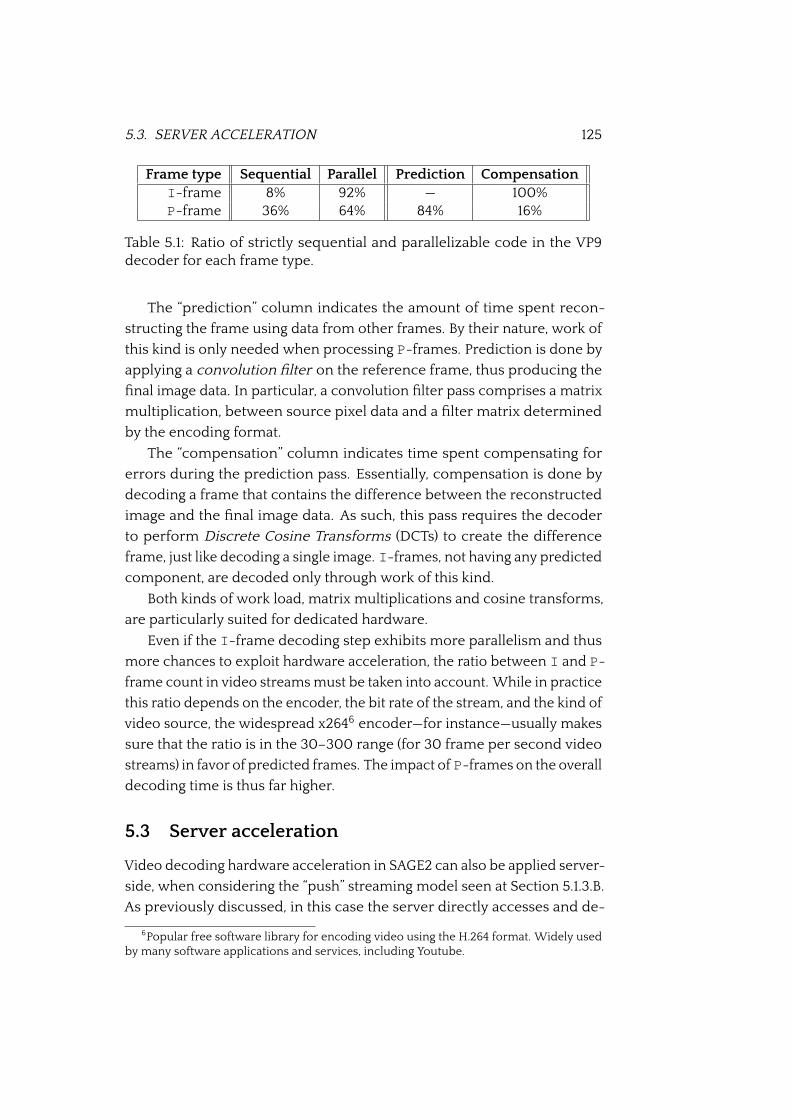
5.3. SERVER ACCELERATION 125
Frame type Sequential Parallel Prediction CompensationI-frame 8% 92% — 100%P-frame 36% 64% 84% 16%
Table 5.1: Ratio of strictly sequential and parallelizable code in the VP9decoder for each frame type.
The “prediction” column indicates the amount of time spent recon-
structing the frame using data from other frames. By their nature, work of
this kind is only needed when processing P-frames. Prediction is done by
applying a convolution �lter on the reference frame, thus producing the
�nal image data. In particular, a convolution �lter pass comprises a matrix
multiplication, between source pixel data and a �lter matrix determined
by the encoding format.
The “compensation” column indicates time spent compensating for
errors during the prediction pass. Essentially, compensation is done by
decoding a frame that contains the difference between the reconstructed
image and the �nal image data. As such, this pass requires the decoder
to perform Discrete Cosine Transforms (DCTs) to create the difference
frame, just like decoding a single image. I-frames, not having any predicted
component, are decoded only through work of this kind.
Both kinds of work load, matrix multiplications and cosine transforms,
are particularly suited for dedicated hardware.
Even if the I-frame decoding step exhibits more parallelism and thus
more chances to exploit hardware acceleration, the ratio between I and P-
frame count in video streams must be taken into account. While in practice
this ratio depends on the encoder, the bit rate of the stream, and the kind of
video source, the widespread x2646 encoder—for instance—usually makes
sure that the ratio is in the 30–300 range (for 30 frame per second video
streams) in favor of predicted frames. The impact of P-frames on the overall
decoding time is thus far higher.
5.3 Server acceleration
Video decoding hardware acceleration in SAGE2 can also be applied server-
side, when considering the “push” streaming model seen at Section 5.1.3.B.
As previously discussed, in this case the server directly accesses and de-
6Popular free software library for encoding video using the H.264 format. Widely usedby many software applications and services, including Youtube.
126 CHAPTER 5. HARDWARE ACCELERATION
codes the video stream for each �le played back on the system.
The process of decoding the compressed stream and splitting it up into
blocks is a good candidate for harnessing advanced hardware capabilities.
In fact, the FFMpeg library SAGE2 makes use of—just like the Chromium
web browser does as well—already offers hardware acceleration on some
speci�c platform and runtime combinations. Thus, the same acceleration
considerations that apply to the web browser can equally be applied server-
side.
Unfortunately, the “push” streaming model had not been added to the
SAGE2 project at the time when hardware acceleration was being explored,
and therefore the hardware acceleration proof of concept discussed in
Section 5.4 only references the web browser decoding process within the
“pull” streaming model.
5.4 Proof of concept implementation
In order to verify the impact of hardware acceleration on SAGE2’s perfor-
mance in rendering high resolution video, a proof of concept acceleration
test bench was built. The hardware acceleration design adopted derives
from the “pull” streaming model discussed previously in Section 5.2.
In this model, the compressed video stream is entirely delivered to the
Display Client web browser instance. The browser passes the data on to
the selected decoder, based on the stream’s data type, and receives raw
frames back.
5.4.1 Hardware
For the proof of concept, a multi-core System on Chip (SoC) evaluation
board has been used: the Texas Instruments Keystone II 66AK2H12 (Fig-
ure 5.6), equipped with a quad-core ARM Cortex-A15 processor and with
8 TMS320C66x high-performance Digital Signal Processors (DSPs). Both
processing units work at a nominal frequency of 1.2 GHz. They have access
to 2 GB of RAM, through a shared memory access model.
The Keystone II board’s DSPs can be programmed using two alternative
frameworks.
The Open Computing Language (OpenCL) is speci�cally targeted for pro-
grams executing on heterogeneous platforms, that is, computing platforms
composed by multiple kinds of processor, just like the Keystone II.
Open Multi-Processing (OpenMP) instead is an open speci�cation for
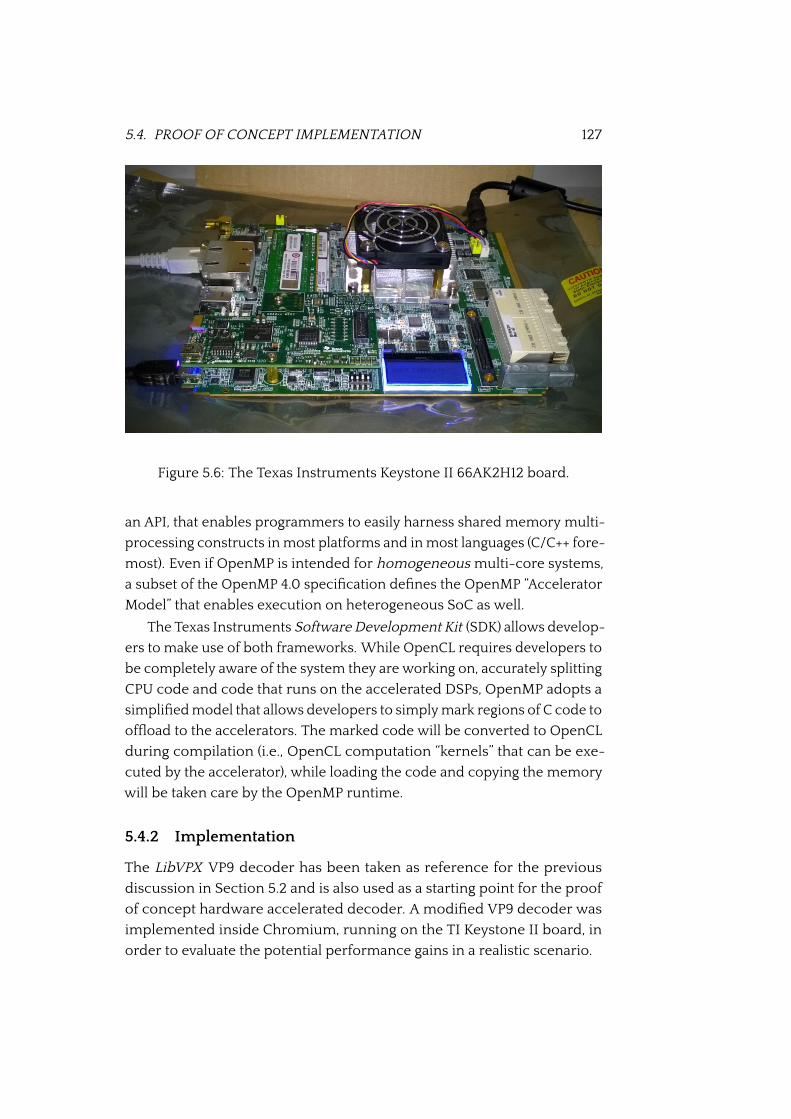
5.4. PROOF OF CONCEPT IMPLEMENTATION 127
Figure 5.6: The Texas Instruments Keystone II 66AK2H12 board.
an API, that enables programmers to easily harness shared memory multi-
processing constructs in most platforms and in most languages (C/C++ fore-
most). Even if OpenMP is intended for homogeneous multi-core systems,
a subset of the OpenMP 4.0 speci�cation de�nes the OpenMP “Accelerator
Model” that enables execution on heterogeneous SoC as well.
The Texas Instruments Software Development Kit (SDK) allows develop-
ers to make use of both frameworks. While OpenCL requires developers to
be completely aware of the system they are working on, accurately splitting
CPU code and code that runs on the accelerated DSPs, OpenMP adopts a
simpli�ed model that allows developers to simply mark regions of C code to
of�oad to the accelerators. The marked code will be converted to OpenCL
during compilation (i.e., OpenCL computation “kernels” that can be exe-
cuted by the accelerator), while loading the code and copying the memory
will be taken care by the OpenMP runtime.
5.4.2 Implementation
The LibVPX VP9 decoder has been taken as reference for the previous
discussion in Section 5.2 and is also used as a starting point for the proof
of concept hardware accelerated decoder. A modi�ed VP9 decoder was
implemented inside Chromium, running on the TI Keystone II board, in
order to evaluate the potential performance gains in a realistic scenario.
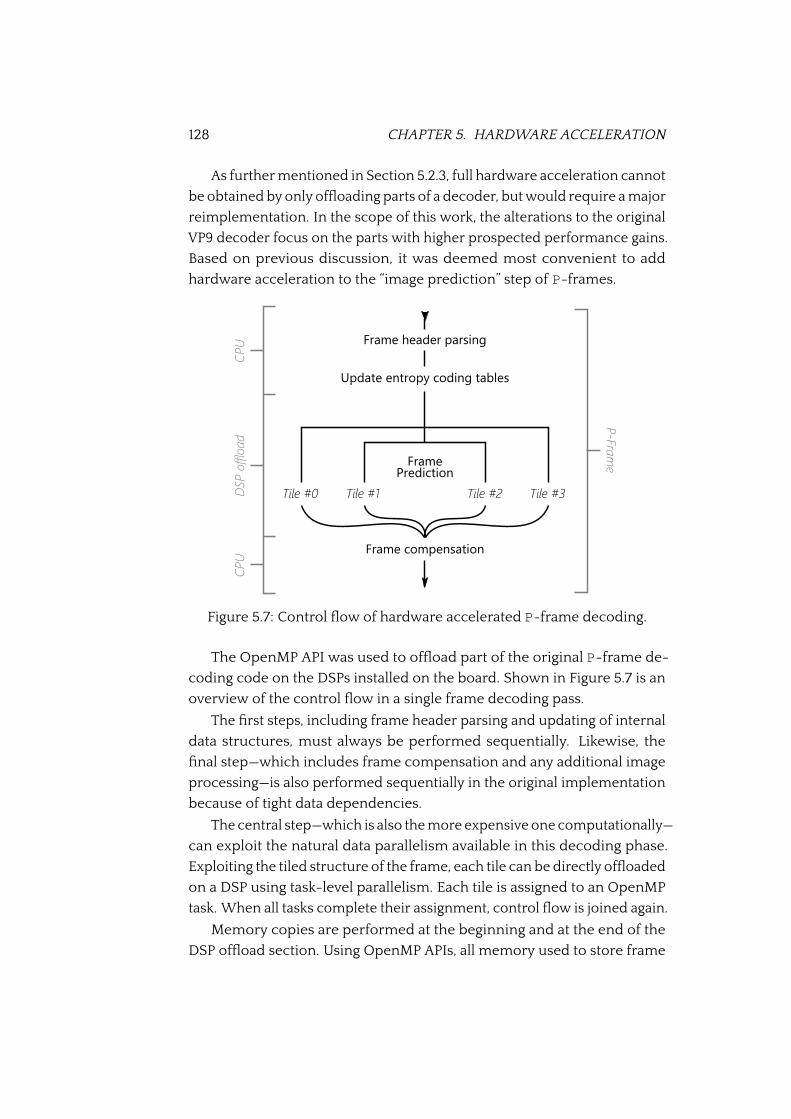
128 CHAPTER 5. HARDWARE ACCELERATION
As further mentioned in Section 5.2.3, full hardware acceleration cannot
be obtained by only of�oading parts of a decoder, but would require a major
reimplementation. In the scope of this work, the alterations to the original
VP9 decoder focus on the parts with higher prospected performance gains.
Based on previous discussion, it was deemed most convenient to add
hardware acceleration to the “image prediction” step of P-frames.
Figure 5.7: Control �ow of hardware accelerated P-frame decoding.
The OpenMP API was used to of�oad part of the original P-frame de-
coding code on the DSPs installed on the board. Shown in Figure 5.7 is an
overview of the control �ow in a single frame decoding pass.
The �rst steps, including frame header parsing and updating of internal
data structures, must always be performed sequentially. Likewise, the
�nal step—which includes frame compensation and any additional image
processing—is also performed sequentially in the original implementation
because of tight data dependencies.
The central step—which is also the more expensive one computationally—
can exploit the natural data parallelism available in this decoding phase.
Exploiting the tiled structure of the frame, each tile can be directly of�oaded
on a DSP using task-level parallelism. Each tile is assigned to an OpenMP
task. When all tasks complete their assignment, control �ow is joined again.
Memory copies are performed at the beginning and at the end of the
DSP of�oad section. Using OpenMP APIs, all memory used to store frame
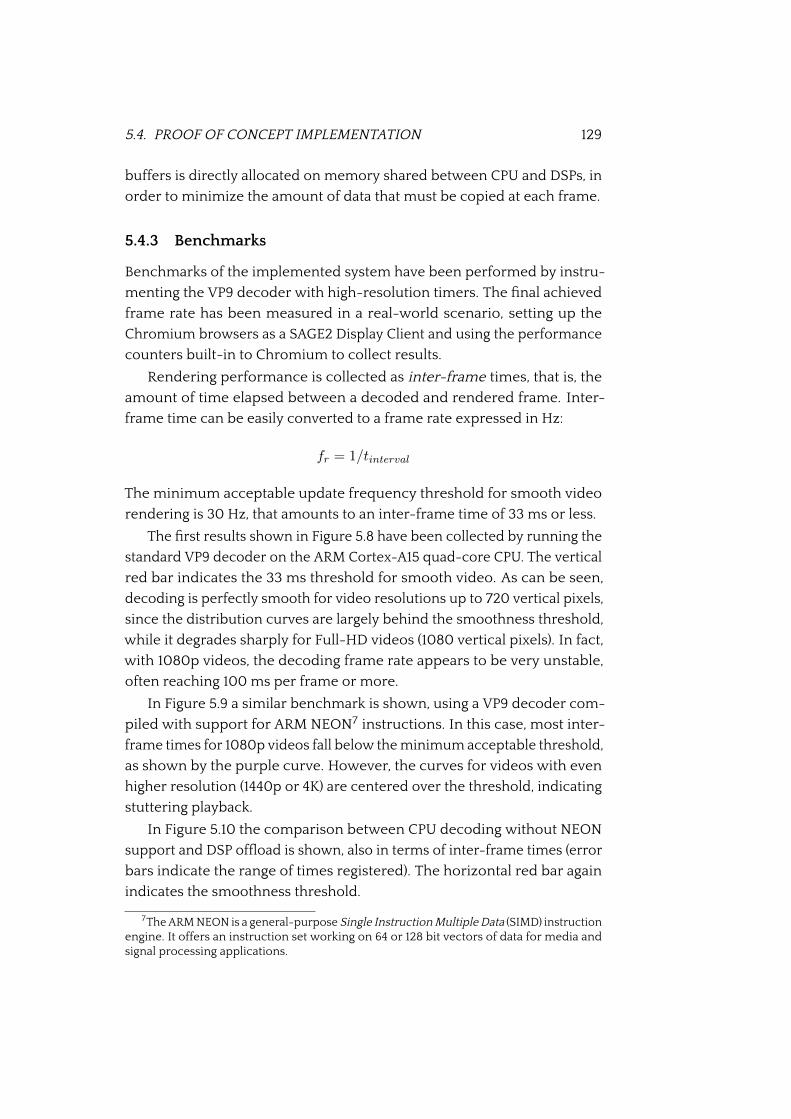
5.4. PROOF OF CONCEPT IMPLEMENTATION 129
buffers is directly allocated on memory shared between CPU and DSPs, in
order to minimize the amount of data that must be copied at each frame.
5.4.3 Benchmarks
Benchmarks of the implemented system have been performed by instru-
menting the VP9 decoder with high-resolution timers. The �nal achieved
frame rate has been measured in a real-world scenario, setting up the
Chromium browsers as a SAGE2 Display Client and using the performance
counters built-in to Chromium to collect results.
Rendering performance is collected as inter-frame times, that is, the
amount of time elapsed between a decoded and rendered frame. Inter-
frame time can be easily converted to a frame rate expressed in Hz:
fr = 1/tinterval
The minimum acceptable update frequency threshold for smooth video
rendering is 30 Hz, that amounts to an inter-frame time of 33 ms or less.
The �rst results shown in Figure 5.8 have been collected by running the
standard VP9 decoder on the ARM Cortex-A15 quad-core CPU. The vertical
red bar indicates the 33 ms threshold for smooth video. As can be seen,
decoding is perfectly smooth for video resolutions up to 720 vertical pixels,
since the distribution curves are largely behind the smoothness threshold,
while it degrades sharply for Full-HD videos (1080 vertical pixels). In fact,
with 1080p videos, the decoding frame rate appears to be very unstable,
often reaching 100 ms per frame or more.
In Figure 5.9 a similar benchmark is shown, using a VP9 decoder com-
piled with support for ARM NEON7 instructions. In this case, most inter-
frame times for 1080p videos fall below the minimum acceptable threshold,
as shown by the purple curve. However, the curves for videos with even
higher resolution (1440p or 4K) are centered over the threshold, indicating
stuttering playback.
In Figure 5.10 the comparison between CPU decoding without NEON
support and DSP of�oad is shown, also in terms of inter-frame times (error
bars indicate the range of times registered). The horizontal red bar again
indicates the smoothness threshold.
7The ARM NEON is a general-purpose Single Instruction Multiple Data (SIMD) instructionengine. It offers an instruction set working on 64 or 128 bit vectors of data for media andsignal processing applications.
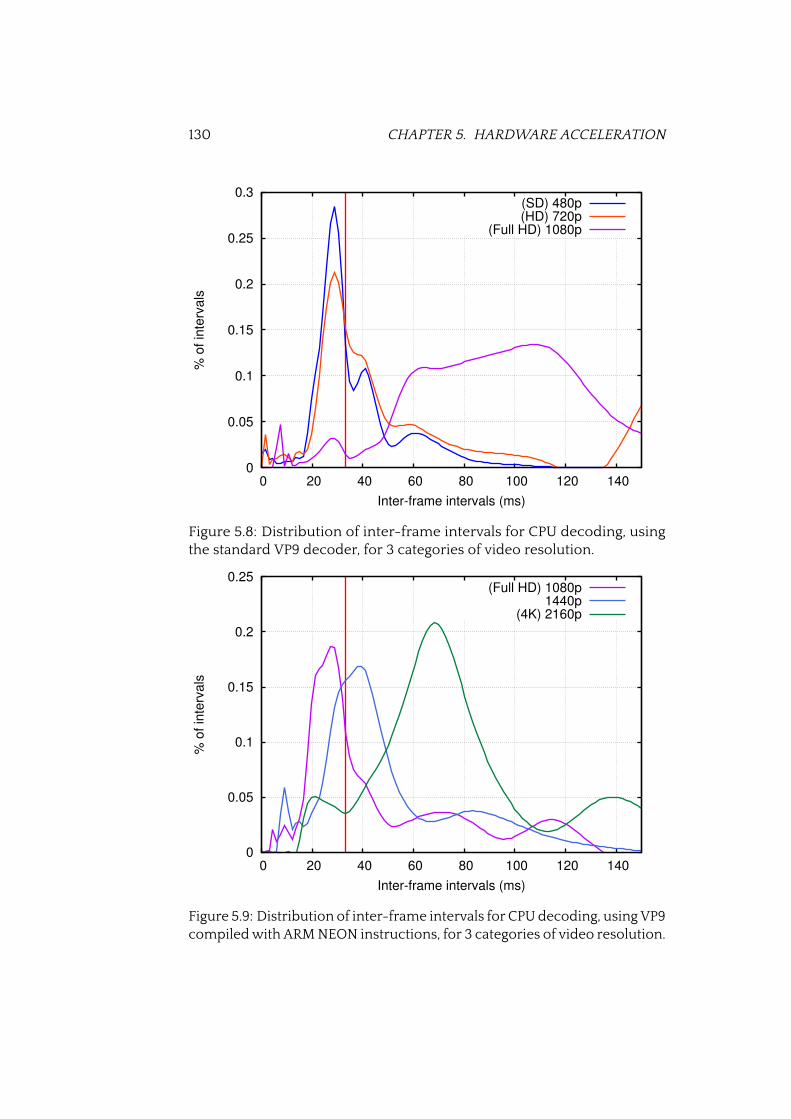
130 CHAPTER 5. HARDWARE ACCELERATION
0
0.05
0.1
0.15
0.2
0.25
0.3
0 20 40 60 80 100 120 140
% o
f in
terv
als
Inter-frame intervals (ms)
(SD) 480p(HD) 720p
(Full HD) 1080p
Figure 5.8: Distribution of inter-frame intervals for CPU decoding, usingthe standard VP9 decoder, for 3 categories of video resolution.
0
0.05
0.1
0.15
0.2
0.25
0 20 40 60 80 100 120 140
% o
f in
terv
als
Inter-frame intervals (ms)
(Full HD) 1080p1440p
(4K) 2160p
Figure 5.9: Distribution of inter-frame intervals for CPU decoding, using VP9compiled with ARM NEON instructions, for 3 categories of video resolution.
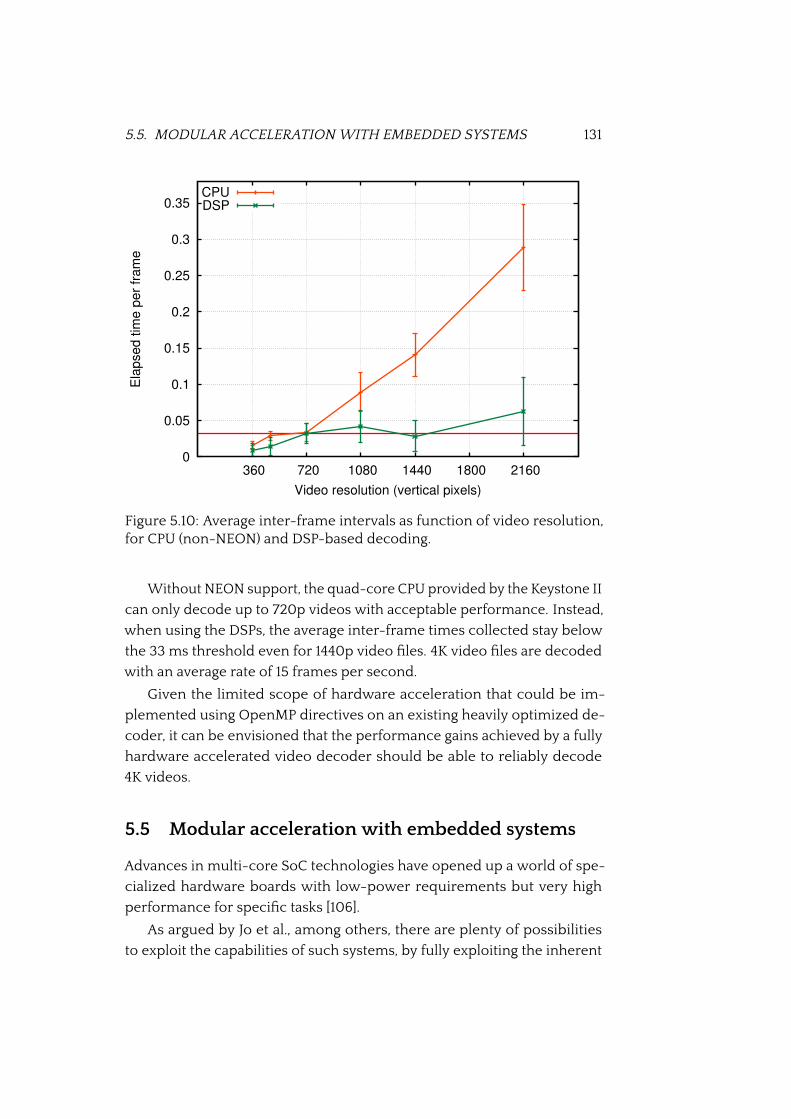
5.5. MODULAR ACCELERATION WITH EMBEDDED SYSTEMS 131
0
0.05
0.1
0.15
0.2
0.25
0.3
0.35
360 720 1080 1440 1800 2160
Ela
pse
d t
ime
pe
r fr
am
e
Video resolution (vertical pixels)
CPUDSP
Figure 5.10: Average inter-frame intervals as function of video resolution,for CPU (non-NEON) and DSP-based decoding.
Without NEON support, the quad-core CPU provided by the Keystone II
can only decode up to 720p videos with acceptable performance. Instead,
when using the DSPs, the average inter-frame times collected stay below
the 33 ms threshold even for 1440p video �les. 4K video �les are decoded
with an average rate of 15 frames per second.
Given the limited scope of hardware acceleration that could be im-
plemented using OpenMP directives on an existing heavily optimized de-
coder, it can be envisioned that the performance gains achieved by a fully
hardware accelerated video decoder should be able to reliably decode
4K videos.
5.5 Modular acceleration with embedded systems
Advances in multi-core SoC technologies have opened up a world of spe-
cialized hardware boards with low-power requirements but very high
performance for speci�c tasks [106].
As argued by Jo et al., among others, there are plenty of possibilities
to exploit the capabilities of such systems, by fully exploiting the inherent
132 CHAPTER 5. HARDWARE ACCELERATION
parallelism of video decoders [52, 67]. As demonstrated in the previous
section, performance improvements through hardware acceleration can be
harnessed through OpenMP and are fully applicable to a decoder running
inside the Chromium web browser, on an embedded SoC system with
heterogeneous hardware accelerators. This can greatly improve SAGE2’s
capability of decoding and presenting high resolution video sources on
large displays.
It can be envisioned that, paired together with SAGE2’s “push” streaming
model described in Section 5.1.3.B, multi-core embedded systems with
high-performance accelerators could be used as dedicated decoding nodes
on a distributed large display system. Instead of performing decoding and
block-splitting on the Server, these tasks could be dynamically assigned
to dedicated embedded systems. These embedded processing modules
could be added to a SAGE2 system when needed, augmenting its �exibility
and scalability, and automatically power off when no video decoding is
needed.
In fact, considering the low computational needs of SAGE2’s Server,
it too can be handled by a low-power board. One processing decoding
module can be user for each streamed video, thus also making the process
of designing and provisioning resources for a VR system easier.
Managing the system is a task that can be taken over by a high level
controller, much alike IVE discussed in Chapter 4, that would be able to
dynamically recon�gure the system and allocate resources based on the
experience to achieve. Scaling the VR environment in order to support
more or larger videos could be as easy as adding a small-scale module to
the network.
Chapter 6
Conclusions
In the �rst chapters of this thesis, a review of large-scale visualization
systems has been outlined, discussing the rationale and purpose of these
technologies. Target applications are many and diverse, including usage
as visual analysis tools, as cognitive aids for research, as immersive art
experiences, and of course as entertainment systems.
Three different, albeit interconnected, technologies for the manage-
ment of large scale displays have been presented. Each of these techno-
logies presents a glimpse on a different approach to the issue, and offers
different features to system integrators, developers, and end-users.
SAGE has been described in depth as a complete and �exible graphics
streaming system. Its features and its serviceability have been discussed at
length, substantiated by the number of running installations worldwide.
However, the lack of a common usable control interface, both for users
and third-party applications, and its notable performance requirements
have also been detailed.
The IVE system has been presented as a high level management over-
lay to one or more SAGE installations, in order to overcome some of the
aforementioned limitations. It offers additional usability and �exibility in
con�guration, and allows better control for end-users. By design, it has
a deeper knowledge of the system’s topology and its state, and it has the
means of interpreting user commands in the context of a peculiar scenario.
This additional information gives IVE the ability to improve on the SAGE
experience, allowing better control, con�guration and load balancing.
SAGE2, as a direct evolution of SAGE’s original concept, presents several
innovations in terms of adopted technologies and in terms of vision. Far
higher ease of con�guration, installation, and development make it a very
133
134 CHAPTER 6. CONCLUSIONS
alluring choice both for academic research and production deployments.
This notwithstanding, it arguably represents more of a re�nement than
a dramatic reformation. Many friction points concerning management,
control and performance bottlenecks stand unchanged.
As discussed in the previous chapter, SAGE2 architecturally appears
to be well-suited for large display virtual environment composed of sev-
eral low-power embedded systems, managed by a high level controller.
Much alike IVE, the controller would be able to supervise the system with
higher awareness of its context. This would allow it to present a coherent
programmable interface, while performing accurate load balancing and
resource allocation. Also, as previously demonstrated, the system also
presents large opportunities to exploit hardware acceleration, potentially
allowing it to bene�t from higher performance and lower power consump-
tion using �ne-tuned hardware and software solutions.
Immersive large scale displays present a set of very challenging and
interesting problems. Not only in terms of distributed system architec-
ture and design, but foremost as examples of performance and scalability
issues—network and memory capacity, computational load, graphical �ll-
rate, and synchronization are only few of the topics that come to mind.
As mentioned before, such systems present an interesting test-case and
benchmark for high-performance embedded systems. On the other hand,
they also constitute stimulating and forward-looking scenarios for user
interface development and usability studies.
Many solutions discussed in this thesis merely cover a limited spectrum
of the variety of challenges mentioned here. Even if the inherent bottle-
necks and issues of a large display system cannot be addressed completely,
of course, full understanding of the fundamental problems at hand make
any of the presented solutions a workable basis for real-life installations.
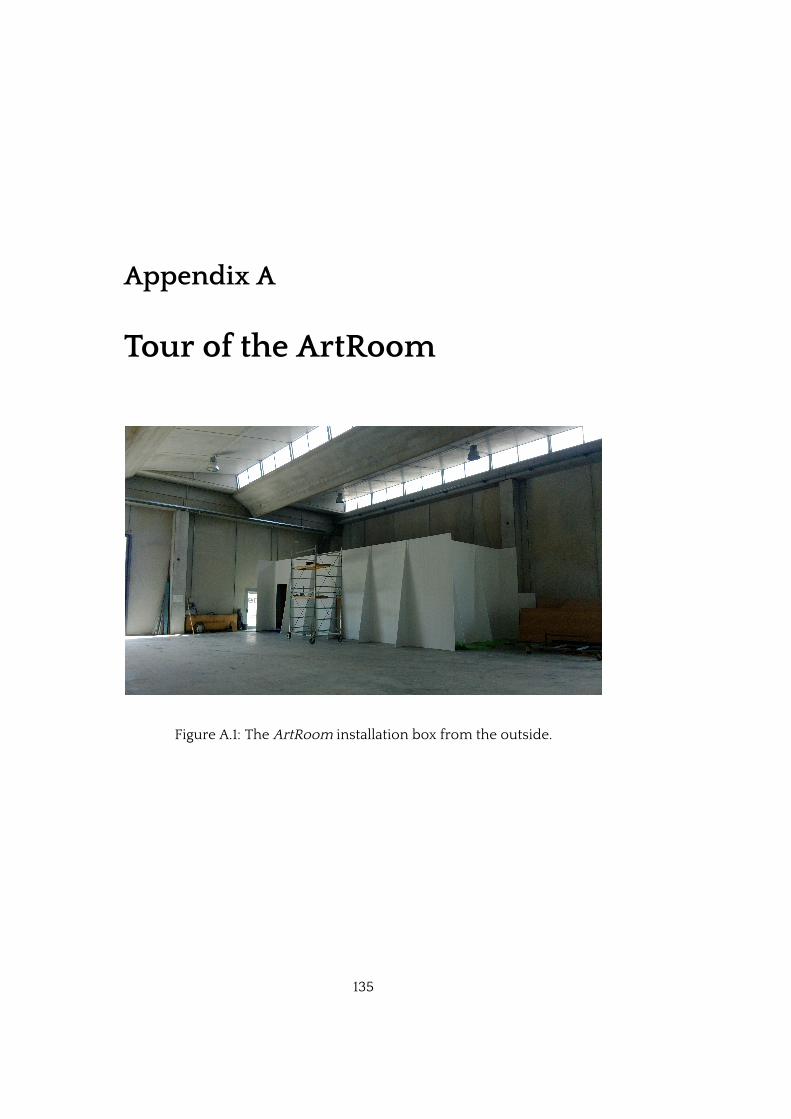
Appendix A
Tour of the ArtRoom
Figure A.1: The ArtRoom installation box from the outside.
135

136 APPENDIX A. TOUR OF THE ARTROOM
Figure A.2: The empty location where the ArtRoom is installed.
Figure A.3: One of the BenQ LW61ST projectors running the ArtRoom.
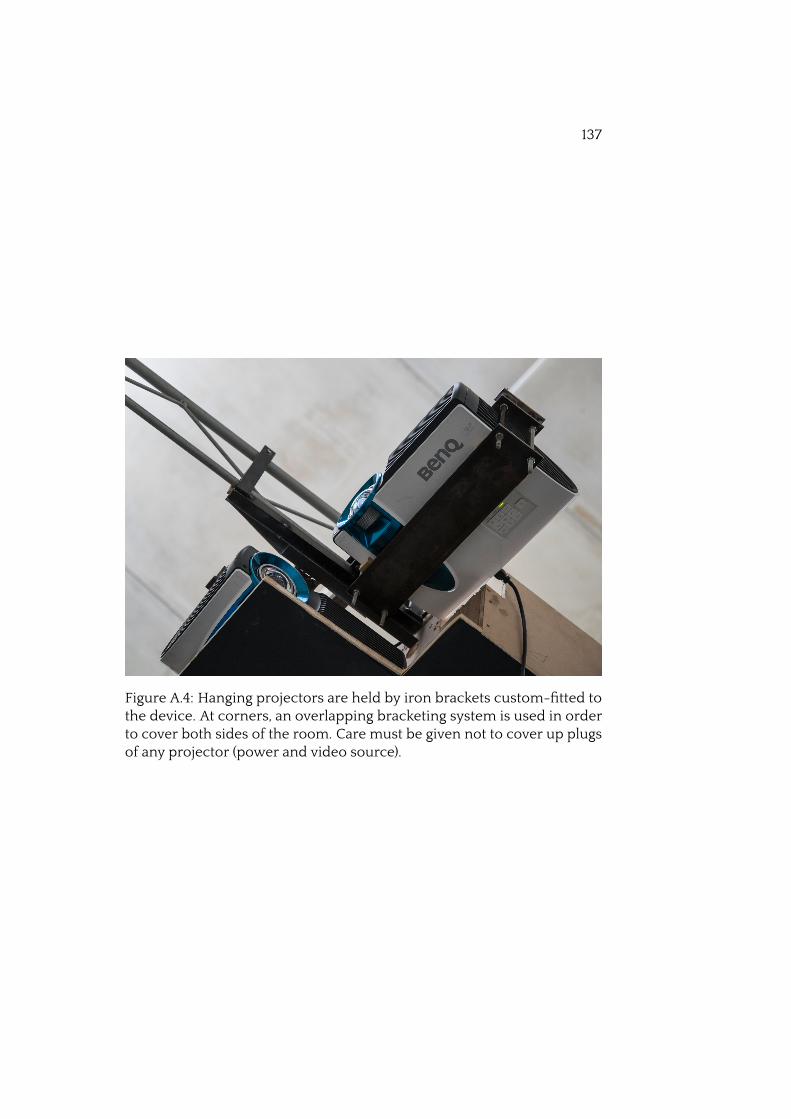
137
Figure A.4: Hanging projectors are held by iron brackets custom-�tted tothe device. At corners, an overlapping bracketing system is used in orderto cover both sides of the room. Care must be given not to cover up plugsof any projector (power and video source).
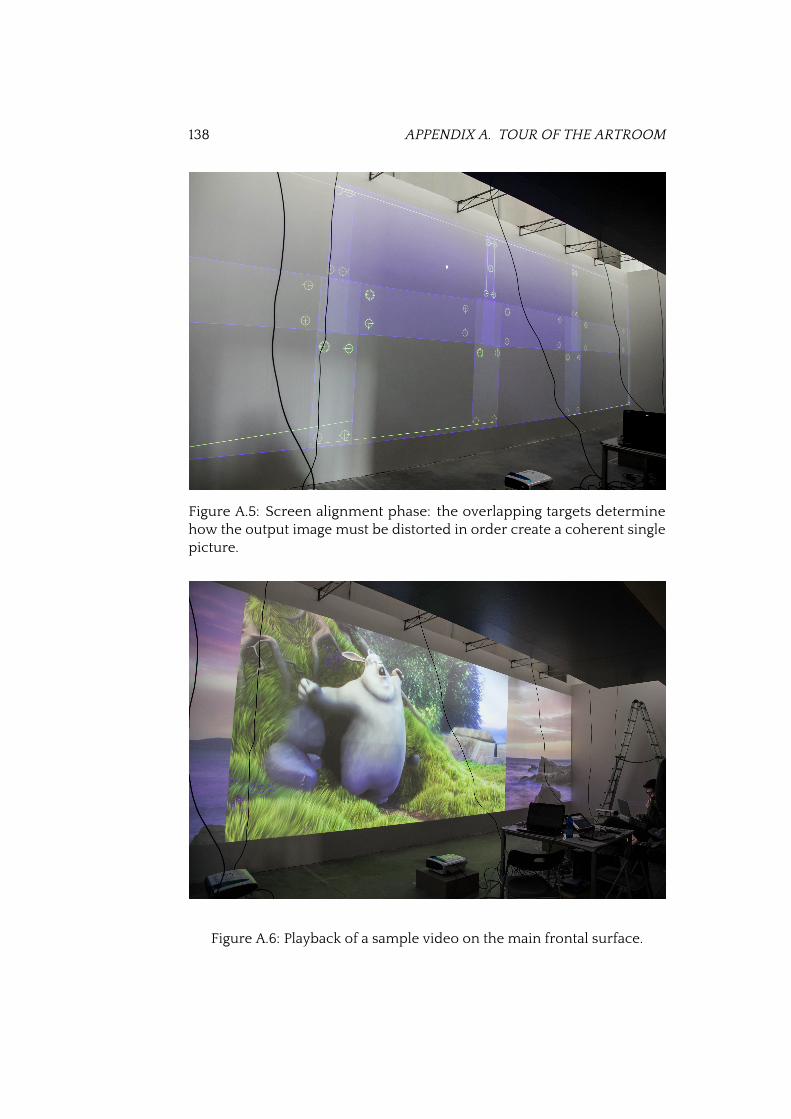
138 APPENDIX A. TOUR OF THE ARTROOM
Figure A.5: Screen alignment phase: the overlapping targets determinehow the output image must be distorted in order create a coherent singlepicture.
Figure A.6: Playback of a sample video on the main frontal surface.
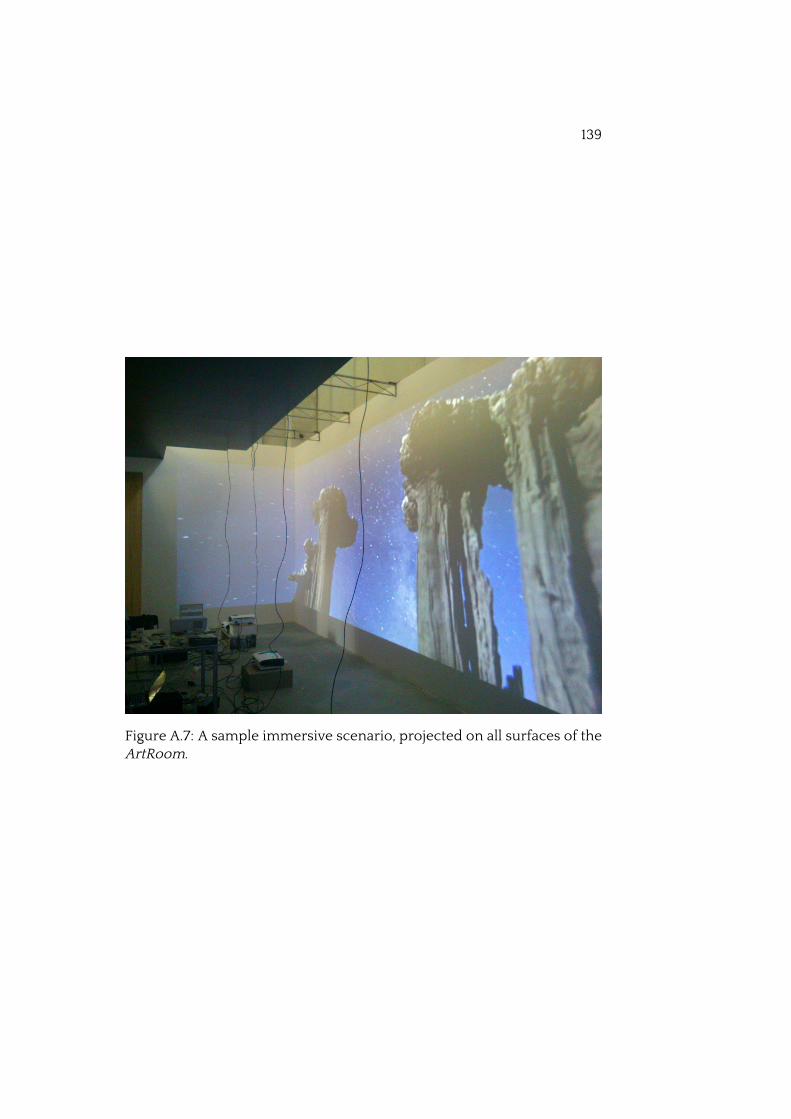
139
Figure A.7: A sample immersive scenario, projected on all surfaces of theArtRoom.

140 APPENDIX A. TOUR OF THE ARTROOM
Acknowledgments
First and foremost, thanks to Prof. Alessandro Bogliolo, Maurizio Rosettani,
and Roberto Di Giacomo. Big, big thanks to Gioele Luchetti and Brendan D.
Paolini, who did all the (real) work, including climbing on ladders.
Thanks to Prof. Luca Benini.
Thanks to Valentina for letting making me write and for being there, always.
Gratefulness for everything to Serena, Clemens and Lukas.
Amazement to the fellows that had to endure the horror delight of sharing
the laboratory with me. Thanks to Silvia, Sara, Andrea, and Matteo.
Admiration to Saverio for being the best �atmate—ever—out of a set of one.
Appreciation to Monia, for being outspoken always, blunt when necessary.
Resounding cheers over the Alps to Elena, Giovanni, Daniele, the Andreas,
Antonio, Roberto, and Michele.
The text of this thesis is set using the “Quattrocento” font by Pablo Impallari.
As usual, thanks to Nescafé. What else?
“Padulo!” (He’ll know.)
141

142

Bibliography
[1] Bill Allcock, Joe Bester, John Bresnahan, Ann L Chervenak, Ian Foster, Carl Kesselman,
Sam Meder, Veronika Nefedova, Darcy Quesnel, and Steven Tuecke. Data manage-
ment and transfer in high-performance computational grid environments. Parallel
Computing, 28(5):749–771, 2002.
[2] Gene M Amdahl. Validity of the single processor approach to achieving large scale
computing capabilities. In Proceedings of the April 18-20, 1967, spring joint computer
conference, pages 483–485. ACM, 1967.
[3] TK Amell and S Kumar. Cumulative trauma disorders and keyboarding work. Inter-
national Journal of Industrial Ergonomics, 25(1):69–78, 2000.
[4] Damon Baker, Sascha Becker, Robert Coover, Ilya Kreymer, and Nicholas Musurca.
CaveWriting 2006: a hypertext authoring system in virtual reality. In ACM SIGGRAPH
2006 Research posters, page 35. ACM, 2006.
[5] Robert Ball and Chris North. Analysis of user behavior on high-resolution tiled
displays. In Human-Computer Interaction-INTERACT 2005, pages 350–363. Springer,
2005.
[6] Michael Benedickt. Cyberspace: �rst steps. MIT Press, 1991.
[7] Ivan Berger. The virtues of a second screen. New York Times, Apr 2006. URL
http://www.nytimes.com/2006/04/20/technology/20basics.html. Ac-
cessed: 2015-11-06.
[8] Chidansh Amitkumar Bhatt and Mohan S Kankanhalli. Multimedia data mining: state
of the art and challenges. Multimedia Tools and Applications, 51(1):35–76, 2011.
[9] Frank Biocca. The cyborg’s dilemma: Progressive embodiment in virtual environ-
ments. Human Factors in Information Technology, 13:113–144, 1999.
[10] Gary Bishop and Greg Welch. Working in the of�ce of “real soon now”. Computer
Graphics and Applications, IEEE, 20(4):76–78, 2000.
[11] William Blanke, Chandrajit Bajaj, Donald Fussell, and Xiaoyu Zhang. The metabuffer:
A scalable multiresolution multidisplay 3-d graphics system using commodity ren-
dering engines. Tr2000-16, University of Texas at Austin, 2000.
143

144 BIBLIOGRAPHY
[12] Jay David Bolter and Diane Gromala. Windows and Mirrors: Interaction design, digital
art, and the myth of transparency. MIT press, 2003.
[13] Erik Brynjolfsson and Andrew McAfee. Race against the machine: How the digital rev-
olution is accelerating innovation, driving productivity, and irreversibly transforming
employment and the economy. Brynjolfsson and McAfee, 2012.
[14] Robin Burgess-Limerick, J Shemmell, R Scadden, and A Plooy. Wrist posture during
computer pointing device use. Clinical Biomechanics, 14(4):280–286, 1999.
[15] William Buxton, George Fitzmaurice, Ravin Balakrishnan, and Gordon Kurtenbach.
Large displays in automotive design. Computer Graphics and Applications, IEEE, 20
(4):68–75, 2000.
[16] Joshua J Carroll, Robert Coover, Shawn Greenlee, Andrew McClain, and Noah Wardrip-
Fruin. Screen: bodily interaction with text in immersive VR. In ACM SIGGRAPH 2003
Sketches & Applications, pages 1–1. ACM, 2003.
[17] Xavier Cavin, Christophe Mion, and Alain Filbois. COTS cluster-based sort-last ren-
dering: Performance evaluation and pipelined implementation. In Visualization,
2005. VIS 05. IEEE, pages 111–118. IEEE, 2005.
[18] Yuqun Chen, Douglas W Clark, Adam Finkelstein, Timothy C Housel, and Kai Li. Auto-
matic alignment of high-resolution multi-projector display using an un-calibrated
camera. In Proceedings of the conference on Visualization’00, pages 125–130. IEEE
Computer Society Press, 2000.
[19] Yuqun Chen, Han Chen, Douglas W Clark, Zhiyan Liu, Grant Wallace, and Kai Li.
Software environments for cluster-based display systems. In Cluster Computing
and the Grid, 2001. Proceedings. First IEEE/ACM International Symposium on, pages
202–210. IEEE, 2001.
[20] Computer History Museum. Timeline of computer history: Memory & storage. URL
http://www.computerhistory.org/timeline/memory-storage/, 2015. Ac-
cessed: 2015-10-24.
[21] Carolina Cruz-Neira, Daniel J Sandin, Thomas A DeFanti, Robert V Kenyon, and
John C Hart. The CAVE: audio visual experience automatic virtual environment.
Communications of the ACM, 35(6):64–72, 1992.
[22] Carolina Cruz-Neira, Daniel J Sandin, and Thomas A DeFanti. Surround-screen
projection-based virtual reality: the design and implementation of the CAVE. In
Proceedings of the 20th annual conference on Computer graphics and interactive
techniques, pages 135–142. ACM, 1993.
[23] Mary Czerwinski, Greg Smith, Tim Regan, Brian Meyers, George Robertson, and Gary
Starkweather. Toward characterizing the productivity bene�ts of very large displays.
In Proceedings of INTERACT, volume 3, pages 9–16, 2003.
BIBLIOGRAPHY 145
[24] Mary Czerwinski, George Robertson, Brian Meyers, Greg Smith, Daniel Robbins,
and Desney Tan. Large display research overview. In CHI’06 extended abstracts
on Human factors in computing systems, pages 69–74. ACM, January 2006. URL
http://research.microsoft.com/apps/pubs/default.aspx?id=64308.
[25] Thomas A DeFanti, Jason Leigh, Luc Renambot, Byungil Jeong, Alan Verlo, Lance Long,
Maxine Brown, Daniel J Sandin, Venkatram Vishwanath, Qian Liu, et al. The OptIPortal,
a scalable visualization, storage, and computing interface device for the OptiPuter.
Future Generation Computer Systems, 25(2):114–123, 2009.
[26] Thomas A DeFanti, Daniel Acevedo, Richard A Ainsworth, Maxine D Brown, Steven
Cutchin, Gregory Dawe, Kai-Uwe Doerr, Andrew Johnson, Chris Knox, Robert Kooima,
et al. The future of the CAVE. Central European Journal of Engineering, 1(1):16–37, 2011.
[27] Stephan Diehl. Software visualization: visualizing the structure, behaviour, and
evolution of software. Springer Science & Business Media, 2007.
[28] Stefan Eilemann, Maxim Makhinya, and Renato Pajarola. Equalizer: A scalable parallel
rendering framework. Visualization and Computer Graphics, IEEE Transactions on,
15(3):436–452, 2009.
[29] Electrosonic. Suzhou sky screen. URL http://www.electrosonic.com/
middle-east/projects/suzhou-sky-screen, 2004. Accessed: 2015-11-04.
[30] Ericsson. Sub-saharan africa: Ericsson mobility report appendix. Technical report,
Ericsson, Jun 2014.
[31] Benedict Evans. How mobile is enabling tech to outgrow the tech industry. URL
https://vimeo.com/110428014, 2014. Talk delivered at a16z’s 2014 Tech Summit.
[32] George Fitzmaurice and Gordon Kurtenbach. Guest editors’ introduction: Applica-
tions of large displays. IEEE Computer Graphics and Applications, 25(4):0022–23,
2005.
[33] Borko Fuhrt. Multimedia systems: An overview. IEEE MultiMedia, (1):47–59, 1994.
[34] Yuki Fujiwara, Kohei Ichikawa, Haruo Takemura, et al. A multi-application controller
for SAGE-enabled tiled display wall in wide-area distributed computing environ-
ments. Journal of Information Processing Systems, 7(4):581–594, 2011.
[35] Thomas Funkhouser and Kai Li. Guest editors’ introduction: Large-format displays.
IEEE Computer Graphics and Applications, (4):20–21, 2000.
[36] Nahum Gershon and Stephen G Eick. Information visualization. IEEE Computer
Graphics and Applications, (4):29–31, 1997.
[37] Nahum Gershon and Ward Page. What storytelling can do for information visualiza-
tion. Communications of the ACM, 44(8):31–37, 2001.
[38] Richard Gess. Magister macintosh: Shuf�ed notes on hypertext writing. TDR, pages
38–44, 1993.
146 BIBLIOGRAPHY
[39] Oliver Grau. Virtual Art: from illusion to immersion. MIT press, 2004.
[40] Jonathan Grudin. Partitioning digital worlds: focal and peripheral awareness in
multiple monitor use. In Proceedings of the SIGCHI conference on Human factors in
computing systems, pages 458–465. ACM, 2001.
[41] Stephen Lawrence Guynup. From GUI to gallery: A study of online virtual environ-
ments. 2003.
[42] Eric He, Jason Leigh, Oliver Yu, Thomas DeFanti, et al. Reliable blast UDP: Predictable
high performance bulk data transfer. In Cluster Computing, 2002. Proceedings. 2002
IEEE International Conference on, pages 317–324. IEEE, 2002.
[43] Eric He, Javid Alimohideen, Josh Eliason, O Yu, Jason Leigh, and T DeFanti. QUANTA:
a toolkit for high performance data delivery. Journal of FGCS, 1005:1–15, 2003.
[44] Mark Hereld, Ivan R Judson, and Rick L Stevens. Introduction to building projection-
based tiled display systems. Computer Graphics and Applications, IEEE, 20(4):22–28,
2000.
[45] Mark Hereld, Ivan R Judson, and Rick Stevens. Dottytoto: a measurement engine for
aligning multiprojector display systems. In Electronic Imaging 2003, pages 73–86.
International Society for Optics and Photonics, 2003.
[46] D Hutchings, Mary Czerwinski, Brian Meyers, and John Stasko. Exploring the use and
affordances of multiple display environments. In Workshop on Ubiquitous Display
Environments at UbiComp, pages 1–6, 2004.
[47] Dugald Ralph Hutchings, Greg Smith, Brian Meyers, Mary Czerwinski, and George
Robertson. Display space usage and window management operation comparisons
between single monitor and multiple monitor users. In Proceedings of the working
conference on Advanced visual interfaces, pages 32–39. ACM, 2004.
[48] Johan Ihrén and Kicki J Frisch. The fully immersive CAVE. In In H.-J. Bullinger & O.
Riedel, Eds,3. International Immersive Projection Technology Workshop, 10./11. May
1999, Center of the Fraunhofer Society Stuttgart IZS. Citeseer, 1999.
[49] Ratko Jagodic, Luc Renambot, Andrew Johnson, Jason Leigh, and Sachin Deshpande.
Enabling multi-user interaction in large high-resolution distributed environments.
Future Generation Computer Systems, 27(7):914–923, 2011.
[50] Byungil Jeong, Ratko Jagodic, Allan Spale, Luc Renambot, Julieta Aguilera, and Gideon
Goldman. SAGE Documentation, 2005. Accessed: 2015-09-28.
[51] Byungil Jeong, Luc Renambot, Ratko Jagodic, Rajvikram Singh, Julieta Aguilera, An-
drew Johnson, and Jason Leigh. High-performance dynamic graphics streaming for
scalable adaptive graphics environment. In SC 2006 Conference, Proceedings of the
ACM/IEEE, pages 24–24. IEEE, 2006.
[52] Seongmin Jo, Song Hyun Jo, and Yong Ho Song. Exploring parallelization techniques
based on OpenMP in H.264/AVC encoder for embedded multi-core processor. Journal
of Systems Architecture, 58(9):339–353, 2012.
BIBLIOGRAPHY 147
[53] Cuno Lorenz Klopfenstein, Brendan D. Paolini, Gioele Luchetti, and Alessandro Bogli-
olo. Extensible immersive virtual environments for large tiled video walls. In Pro-
ceedings of the 11th International Conference on Computer Graphics Theory and
Applications, 2016. To appear.
[54] Ed Lantz. A survey of large-scale immersive displays. In Proceedings of the 2007
workshop on Emerging displays technologies: images and beyond: the future of
displays and interacton, page 1. ACM, 2007.
[55] Dave Lee. CES 2016: Hands-on with LG’s roll-up �exible screen. URL http://www.
bbc.com/news/technology-35230043, 2016. Accessed: 2016-01-14.
[56] Jason Leigh, Luc Renambot, Andrew Johnson, Byungil Jeong, Ratko Jagodic, Nicholas
Schwarz, Dmitry Svistula, Rajvikram Singh, Julieta Aguilera, Xi Wang, et al. The
global lambda visualization facility: an international ultra-high-de�nition wide-area
visualization collaboratory. Future Generation Computer Systems, 22(8):964–971,
2006.
[57] Jason Leigh, Andrew Johnson, Luc Renambot, Tom Peterka, Byungil Jeong, Daniel J
Sandin, Jonas Talandis, Ratko Jagodic, Sungwon Nam, Hyejung Hur, et al. Scalable
resolution display walls. Proceedings of the IEEE, 101(1):115–129, 2013.
[58] H Liao, M Iwahara, N Hata, I Sakuma, T Dohi, T Koike, Y Momoi, T Minakawa, M Ya-
masaki, F Tajima, et al. High-resolution integral videography autostereoscopic display
using multi-projector. In Proceedings of the Ninth International Display Workshop,
pages 1229–1232, 2002.
[59] Yihua Lou, Wenjun Wu, and Hui Zhang. Magic input: A multi-user interaction system
for SAGE based large tiled-display environment. In Multimedia and Expo Workshops
(ICMEW), 2012 IEEE International Conference on, pages 157–162. IEEE, 2012.
[60] Clifford Lynch. Big data: How do your data grow? Nature, 455(7209):28–29, 2008.
[61] Jock D Mackinlay and Jeffrey Heer. Wideband displays: mitigating multiple monitor
seams. In CHI’04 extended abstracts on Human factors in computing systems, pages
1521–1524. ACM, 2004.
[62] Aditi Majumder and Rick Stevens. LAM: Luminance attenuation map for photometric
uniformity in projection based displays. In Proceedings of the ACM symposium on
Virtual reality software and technology, pages 147–154. ACM, 2002.
[63] Thomas Marrinan, Jillian Aurisano, Arthur Nishimoto, Krishna Bharadwaj, Victor
Mateevitsi, Luc Renambot, Lance Long, Andrew Johnson, and Jason Leigh. SAGE2:
A new approach for data intensive collaboration using scalable resolution shared
displays. In Collaborative Computing: Networking, Applications and Worksharing
(CollaborateCom), 2014 International Conference on, pages 177–186. IEEE, 2014.
[64] Victor Mateevitsi, Tushar Patel, Jason Leigh, and Bruce Levy. Reimagining the micro-
scope in the 21st century using the scalable adaptive graphics environment. Journal
of pathology informatics, 6, 2015.
148 BIBLIOGRAPHY
[65] Theo Mayer. New options and considerations for creating enhanced viewing experi-
ences. ACM SIGGRAPH Computer Graphics, 31(2):32–34, 1997.
[66] Javid M Alimohideen Meerasa. Design and Implementation of SAGE Display Con-
troller. PhD thesis, University of Illinois at Chicago, 2007.
[67] Mauricio Alvarez Mesa, Adrian Ramirez, Arnaldo Azevedo, Cor Meenderinck, Ben
Juurlink, and Mateo Valero. Scalability of macroblock-level parallelism for H.264
decoding. In Parallel and Distributed Systems (ICPADS), 2009 15th International
Conference on, pages 236–243. IEEE, 2009.
[68] Microsoft Corporation. Remote desktop protocol. URL https://msdn.microsoft.
com/en-us/library/aa383015.aspx, 2015. Accessed: 2015-12-30.
[69] Microsoft Corporation. Microsoft surface hub. URL http://www.microsoft.com/
microsoft-surface-hub, Nov 2015. Accessed: 2015-11-04.
[70] Steven Molnar, John Eyles, and John Poulton. PixelFlow: high-speed rendering using
image composition. In ACM SIGGRAPH Computer Graphics, volume 26, pages 231–
240. ACM, 1992.
[71] Steven Molnar, Michael Cox, David Ellsworth, and Henry Fuchs. A sorting classi�cation
of parallel rendering. Computer Graphics and Applications, IEEE, 14(4):23–32, 1994.
[72] Kenneth Moreland, Brian Wylie, and Constantine Pavlakos. Sort-last parallel rendering
for viewing extremely large data sets on tile displays. In Proceedings of the IEEE 2001
symposium on parallel and large-data visualization and graphics, pages 85–92. IEEE
Press, 2001.
[73] Gerald D Morrison. A camera-based input device for large interactive displays.
Computer Graphics and Applications, IEEE, 25(4):52–57, 2005.
[74] Ken Nakayama, Gerald H Silverman, et al. Serial and parallel processing of visual
feature conjunctions. Nature, 320(6059):264–265, 1986.
[75] Tao Ni, Greg S Schmidt, Oliver G Staadt, Mark Livingston, Robert Ball, Richard May, et al.
A survey of large high-resolution display technologies, techniques, and applications.
In Virtual Reality Conference, 2006, pages 223–236. IEEE, 2006.
[76] Anjul Patney, Stanley Tzeng, Kerry A Seitz Jr, and John D Owens. Piko: A framework
for authoring programmable graphics pipelines. ACM Transactions on Graphics, 34
(4), 2015.
[77] Christiane Paul. Renderings of digital art. Leonardo, 35(5):471–484, 2002.
[78] Christiane Paul and Christian Werner. Digital Art. Thames & Hudson London, 2003.
[79] Luc Renambot, Arun Rao, Rajvikram Singh, Byungil Jeong, Naveen Krishnaprasad,
Venkatram Vishwanath, Vaidya Chandrasekhar, Nicholas Schwarz, Allan Spale,
Charles Zhang, et al. SAGE: the scalable adaptive graphics environment. In Pro-
ceedings of WACE, volume 9, pages 2004–09. Citeseer, 2004.
BIBLIOGRAPHY 149
[80] Luc Renambot, Andrew Johnson, and Jason Leigh. LambdaVision: Building a 100
megapixel display. In NSF CISE/CNS Infrastructure Experience Workshop, Cham-
paign, IL, 2005.
[81] Luc Renambot, Thomas Marrinan, Jillian Aurisano, Arthur Nishimoto, Victor Matee-
vitsi, Krishna Bharadwaj, Lance Long, Andy Johnson, Maxine Brown, and Jason Leigh.
SAGE2: a collaboration portal for scalable resolution displays. Future Generation
Computer Systems, 54:296–305, 2016.
[82] George Robertson, Mary Czerwinski, Patrick Baudisch, Brian Meyers, Daniel Robbins,
Greg Smith, and Desney Tan. The large-display user experience. Computer Graphics
and Applications, IEEE, 25(4):44–51, 2005.
[83] M Robinson, J Laurence, A Hogue, JE Zacher, A German, and M Jenkin. IVY: Basic
design and construction details. In Proc. ICAT, volume 2002, 2002.
[84] Suzanne Ross. Two screens are better than one. URL http://research.
microsoft.com/en-us/news/features/vibe.aspx, 2003. Accessed: 2015-11-
06.
[85] Rudrajit Samanta, Thomas Funkhouser, Kai Li, and Jaswinder Pal Singh. Hybrid sort-
�rst and sort-last parallel rendering with a cluster of PCs. In Proceedings of the ACM
SIGGRAPH/EUROGRAPHICS workshop on Graphics hardware, pages 97–108. ACM,
2000.
[86] Daniel J Sandin, Todd Margolis, Jinghua Ge, Javier Girado, Tom Peterka, and Thomas A
DeFanti. The varrierTM autostereoscopic virtual reality display. ACM Transactions on
Graphics (TOG), 24(3):894–903, 2005.
[87] Timothy Sandstrom, Chris Henze, Creon Levit, et al. The hyperwall. In Coordinated
and Multiple Views in Exploratory Visualization, 2003. Proceedings. International
Conference on, pages 124–133. IEEE, 2003.
[88] Martijn J Schuemie, Peter Van Der Straaten, Merel Krijn, and Charles APG Van Der Mast.
Research on presence in virtual reality: A survey. CyberPsychology & Behavior, 4(2):
183–201, 2001.
[89] Andrea Seraghiti, Cuno Lorenz Klopfenstein, Stefano Bonino, Andrea Tarasconi, and
Alessandro Bogliolo. Multicast TV channels over wireless neutral access networks.
In Evolving Internet (INTERNET), 2010 Second International Conference on, pages
153–158. IEEE, 2010.
[90] Rajvikram Singh, Byungil Jeong, Luc Renambot, Andrew Johnson, and Jason Leigh.
TeraVision: a distributed, scalable, high resolution graphics streaming system. In
Cluster Computing, 2004 IEEE International Conference on, pages 391–400. IEEE,
2004.
[91] Mel Slater and Sylvia Wilbur. A framework for immersive virtual environments (FIVE):
Speculations on the role of presence in virtual environments. Presence: Teleoperators
and virtual environments, 6(6):603–616, 1997.
150 BIBLIOGRAPHY
[92] Mel Slater, Martin Usoh, and Anthony Steed. Depth of presence in virtual environ-
ments. Presence, 3(2):130–144, 1994.
[93] Larry L Smarr, Andrew A Chien, Tom DeFanti, Jason Leigh, and Philip M Papadopoulos.
The OptIPuter. Communications of the ACM, 46(11):58–67, 2003.
[94] Gary K Starkweather. DSHARP–a wide-screen multi-projector display. Journal of
Optics A: Pure and Applied Optics, 5(5):S136, 2003.
[95] Gordon Stoll, Matthew Eldridge, Dan Patterson, Art Webb, Steven Berman, Richard
Levy, Chris Caywood, Milton Taveira, Stephen Hunt, and Pat Hanrahan. Lightning-2:
a high-performance display subsystem for PC clusters. In Proceedings of the 28th
annual conference on Computer graphics and interactive techniques, pages 141–148.
ACM, 2001.
[96] Maureen C Stone. Color and brightness appearance issues in tiled displays. Computer
Graphics and Applications, IEEE, 21(5):58–66, 2001.
[97] Ivan E Sutherland, Robert F Sproull, and Robert A Schumacker. A characterization of
ten hidden-surface algorithms. ACM Computing Surveys (CSUR), 6(1):1–55, 1974.
[98] Desney S Tan and Mary Czerwinski. Effects of visual separation and physical discon-
tinuities when distributing information across multiple displays. In Proc. Interact,
volume 3, pages 252–255, 2003.
[99] Desney S Tan, Mary Czerwinski, and George Robertson. Women go with the (optical)
�ow. In Proceedings of the SIGCHI conference on Human factors in computing
systems, pages 209–215. ACM, 2003.
[100] YC Tay. A comparison of pixel complexity in composition techniques for sort-last
rendering. Journal of Parallel and Distributed Computing, 62(1):152–171, 2002.
[101] DM Traill, JD Bowshill, and PJ Lawrence. Interactive collaborative media environments.
BT Technology Journal, 15(4):130–140, 1997.
[102] Grant Wallace, Han Chen, and Kai Li. Color gamut matching for tiled display walls. In
Proceedings of the workshop on Virtual environments 2003, pages 293–302. ACM,
2003.
[103] Grant Wallace, Otto J Anshus, Peng Bi, Han Chen, Yuqun Chen, Douglas Clark, Perry
Cook, Adam Finkelstein, Thomas Funkhouser, Anoop Gupta, et al. Tools and applica-
tions for large-scale display walls. Computer Graphics and Applications, IEEE, 25(4):
24–33, 2005.
[104] Noah Wardrip-Fruin. Screen. Leonardo, 39(2):103–103, 2006.
[105] Colin Ware and Glenn Franck. Viewing a graph in a virtual reality display is three times
as good as a 2d diagram. In Visual Languages, 1994. Proceedings., IEEE Symposium
on, pages 182–183. IEEE, 1994.
[106] Wayne Wolf. The future of multiprocessor systems-on-chips. In Design Automation
Conference, 2004. Proceedings. 41st, pages 681–685. IEEE, 2004.

BIBLIOGRAPHY 151
[107] Dapeng Wu, Yiwei Thomas Hou, Wenwu Zhu, Ya-Qin Zhang, and Jon M Peha. Stream-
ing video over the internet: approaches and directions. Circuits and Systems for
Video Technology, IEEE Transactions on, 11(3):282–300, 2001.
[108] Toshio Yamada. Development of complete immersive display: COSMOS. Proc. of
VSMM98, pages 522–527, 1998.
[109] Jamie B Zigelbaum. Mending fractured spaces: external legibility and seamlessness
in interface design. PhD thesis, Massachusetts Institute of Technology, 2008.


