Determining the drivers of long-term aridity variability: a southern African case study MANUEL CHEVALIER* and BRIAN M. CHASE Centre National de la Recherche Scientifique, UMR 5554, Institut des Sciences de l’Evolution de Montpellier, Universite de Montpellier, Bat 22, CC061, Place Eugene Bataillon, Montpellier CEDEX 5, 34095, France Received 23 October 2015; Revised 16 February 2016; Accepted 3 March 2016 ABSTRACT: This paper highlights the importance of differentiating between precipitation amount and moisture availability (‘humidity’/‘aridity’) when considering proxy records of climate change. While the terms are sometimes used interchangeably, moisture availability is determined by both (i) precipitation amount and (ii) temperature, through its influence on potential evapotranspiration. As many palaeoenvironmental proxies reflect changes in this water balance rather than purely precipitation amount, it is important to distinguish between the potential relative influences of precipitation and temperature if those records are to be interpreted in terms of climate mechanisms and/or compared with model outputs. As a case study, we explore how precipitation and temperature have determined moisture availability in South Africa’s summer rainfall zone over the last 45 000 years. Using quantitative reconstructions of mean annual temperature, summer rainfall amount and an aridity index, our analysis reveals strong spatiotemporal variability in the relative influences of precipitation and temperature on aridity. Temperature is shown to have exerted a considerable and even dominant influence on moisture availability, resulting in elevated humidity during the last glacial period, despite significant reductions in precipitation amount. Copyright # 2016 John Wiley & Sons, Ltd. KEYWORDS: aridity; climate; Late Quaternary; quantitative reconstructions; southern Africa. Introduction Palaeoclimatological studies are often limited by the nature of the proxies available and the information that can be extracted from them. Aridity, defined by environmental water balance (precipitation minus potential evapotranspiration), is one of the most common indicators of past environments that can be derived from terrestrial archives. Considering southern Africa as a case study, aridity is the dominant control on the majority of palaeoenvironmental records, derived from diverse proxies such as pollen (e.g. Scott, 1982a, 1999; Gasse and van Campo, 2001; Scott et al., 2003, 2012; Vincens et al., 2005, 2007; Scott and Woodborne, 2007; Neumann et al., 2008, 2010, 2011, 2014; Norstr€ om et al., 2009, 2014; Quick et al., 2011, 2015a,b; Valsecchi et al., 2013; Metwally et al., 2014; Lim et al., 2016), d 13 C (e.g. Holmgren et al., 2003; Casta~ neda et al., 2007, 2009; Chase et al., 2013, 2015a,b; Woodborne et al., 2015), d 15 N (e.g. Chase et al., 2009, 2010, 2011, 2012, 2013, 2015a,b) and lake level indicators (e.g. Butzer et al., 1973; Burrough et al., 2007, 2009a,b; Garcin et al., 2009, 2012; Thomas et al., 2009). In southeastern Africa, these indicators of aridity are often interpreted in terms of precipitation via the commonly invoked migration of the Intertropical Convergence Zone (Casta~ neda et al., 2007; Vincens et al., 2007; Gasse et al., 2008; Burrough et al., 2009b; Norstr€ om et al., 2009; Burrough and Thomas, 2013; Metwally et al., 2014) and have been compared with model outputs (Joussaume et al., 1999; Pinot et al., 1999; Peyron et al., 2006; Wu et al., 2007; Braconnot et al., 2012; Singarayer and Burrough, 2015). Aridity, however, is a composite variable that reflects changes in multiple climate parameters (temperature, precipitation, seasonality of both), and interpretations of such palaeorecords are complicated by that multifactorial nature. In this study, we highlight the complex relationship between rainfall amount, temperature and aridity in southern Africa. We first focus on calibrating a model that explains aridity as a function of temperature and rainfall amount using modern climate conditions. We then present two regional aridity reconstructions derived from multi-site, pollen-based climate quantifications, which, compared with separate reconstructions of mean annual temperature (TmeanAnn) and summer rainfall (precipitation of the wettest quarter, PWetQ; Chevalier and Chase, 2015), shed light on the spatial and temporal complexity of rainfall amount and temperature as determinants of aridity. Combined, these results indicate that the relationship of aridity with these specific aspects of climate is highly non-linear, being strongly dependent on both global and regional boundary conditions. Regional setting Spanning the subtropics, southern African climates are diverse, with warm mesic conditions dominating the east, semi- to hyperarid climates across the interior and west, and a narrow zone of Mediterranean climate in the extreme south-west (Figs 1and 2; Tyson, 1986; Tyson and Preston- White, 2000). Temperatures are primarily defined by a combination of latitude, elevation and proximity to the bordering Indian and Atlantic oceans (Fig. 2A). Across much of southern Africa, hydroclimate is characterized by strongly seasonal rainfall, with summer rainfall being the dominant mode as moisture is advected inland from the tropical Indian and Atlantic Oceans as part of the South African monsoon region (sensu Wang and Ding, 2008). In the extreme south- west, a mediterranean climate prevails with most rain falling in winter as frontal systems associated with the Southern Hemisphere westerly storm track shift equatorward (Fig. 1; Tyson, 1986; Tyson and Preston-White, 2000). This results in strong moisture gradients across the continent, with rainfall diminishing with distance from the source (Fig. 2B). The seasonal contrast in precipitation has led to a regional classification of discrete summer and winter rainfall zones based on the 66 and 33% of summer rainfall isohyets (SRZ and WRZ, respectively; sensu Chase and Meadows, 2007). It should be kept in mind, however, that these tropical and temperate moisture-bearing systems, while distinct, do not act entirely in isolation. Interactions between the two, most Correspondence to: M. Chevalier as above. E-mail: [email protected]Copyright # 2016 John Wiley & Sons, Ltd. JOURNAL OF QUATERNARY SCIENCE (2016) 31(2) 143–151 ISSN 0267-8179. DOI: 10.1002/jqs.2850
Transcript
Determining the drivers of long-term aridityvariability: a southern African case study
MANUEL CHEVALIER* and BRIAN M. CHASECentre National de la Recherche Scientifique, UMR 5554, Institut des Sciences de l’Evolution de Montpellier, Universit�e deMontpellier, Bat 22, CC061, Place Eug�ene Bataillon, Montpellier CEDEX 5, 34095, France
Received 23 October 2015; Revised 16 February 2016; Accepted 3 March 2016
ABSTRACT: This paper highlights the importance of differentiating between precipitation amount and moistureavailability (‘humidity’/‘aridity’) when considering proxy records of climate change. While the terms are sometimesused interchangeably, moisture availability is determined by both (i) precipitation amount and (ii) temperature,through its influence on potential evapotranspiration. As many palaeoenvironmental proxies reflect changes in thiswater balance rather than purely precipitation amount, it is important to distinguish between the potential relativeinfluences of precipitation and temperature if those records are to be interpreted in terms of climate mechanismsand/or compared with model outputs. As a case study, we explore how precipitation and temperature havedetermined moisture availability in South Africa’s summer rainfall zone over the last 45 000 years. Usingquantitative reconstructions of mean annual temperature, summer rainfall amount and an aridity index, ouranalysis reveals strong spatiotemporal variability in the relative influences of precipitation and temperature onaridity. Temperature is shown to have exerted a considerable and even dominant influence on moistureavailability, resulting in elevated humidity during the last glacial period, despite significant reductions inprecipitation amount. Copyright # 2016 John Wiley & Sons, Ltd.
KEYWORDS: aridity; climate; Late Quaternary; quantitative reconstructions; southern Africa.
Introduction
Palaeoclimatological studies are often limited by the natureof the proxies available and the information that can beextracted from them. Aridity, defined by environmental waterbalance (precipitation minus potential evapotranspiration), isone of the most common indicators of past environments thatcan be derived from terrestrial archives. Considering southernAfrica as a case study, aridity is the dominant controlon the majority of palaeoenvironmental records, derivedfrom diverse proxies such as pollen (e.g. Scott, 1982a, 1999;Gasse and van Campo, 2001; Scott et al., 2003, 2012;Vincens et al., 2005, 2007; Scott and Woodborne, 2007;Neumann et al., 2008, 2010, 2011, 2014; Norstr€om et al.,2009, 2014; Quick et al., 2011, 2015a,b; Valsecchi et al.,2013; Metwally et al., 2014; Lim et al., 2016), d13C (e.g.Holmgren et al., 2003; Casta~neda et al., 2007, 2009; Chaseet al., 2013, 2015a,b; Woodborne et al., 2015), d15N (e.g.Chase et al., 2009, 2010, 2011, 2012, 2013, 2015a,b) andlake level indicators (e.g. Butzer et al., 1973; Burrough et al.,2007, 2009a,b; Garcin et al., 2009, 2012; Thomas et al.,2009). In southeastern Africa, these indicators of aridity areoften interpreted in terms of precipitation via the commonlyinvoked migration of the Intertropical Convergence Zone(Casta~neda et al., 2007; Vincens et al., 2007; Gasse et al.,2008; Burrough et al., 2009b; Norstr€om et al., 2009;Burrough and Thomas, 2013; Metwally et al., 2014) and havebeen compared with model outputs (Joussaume et al., 1999;Pinot et al., 1999; Peyron et al., 2006; Wu et al., 2007;Braconnot et al., 2012; Singarayer and Burrough, 2015).Aridity, however, is a composite variable that reflects changesin multiple climate parameters (temperature, precipitation,seasonality of both), and interpretations of such palaeorecordsare complicated by that multifactorial nature.In this study, we highlight the complex relationship
between rainfall amount, temperature and aridity in southernAfrica. We first focus on calibrating a model that explainsaridity as a function of temperature and rainfall amount using
modern climate conditions. We then present two regionalaridity reconstructions derived from multi-site, pollen-basedclimate quantifications, which, compared with separatereconstructions of mean annual temperature (TmeanAnn) andsummer rainfall (precipitation of the wettest quarter, PWetQ;Chevalier and Chase, 2015), shed light on the spatial andtemporal complexity of rainfall amount and temperature asdeterminants of aridity. Combined, these results indicate thatthe relationship of aridity with these specific aspects ofclimate is highly non-linear, being strongly dependent onboth global and regional boundary conditions.
Regional setting
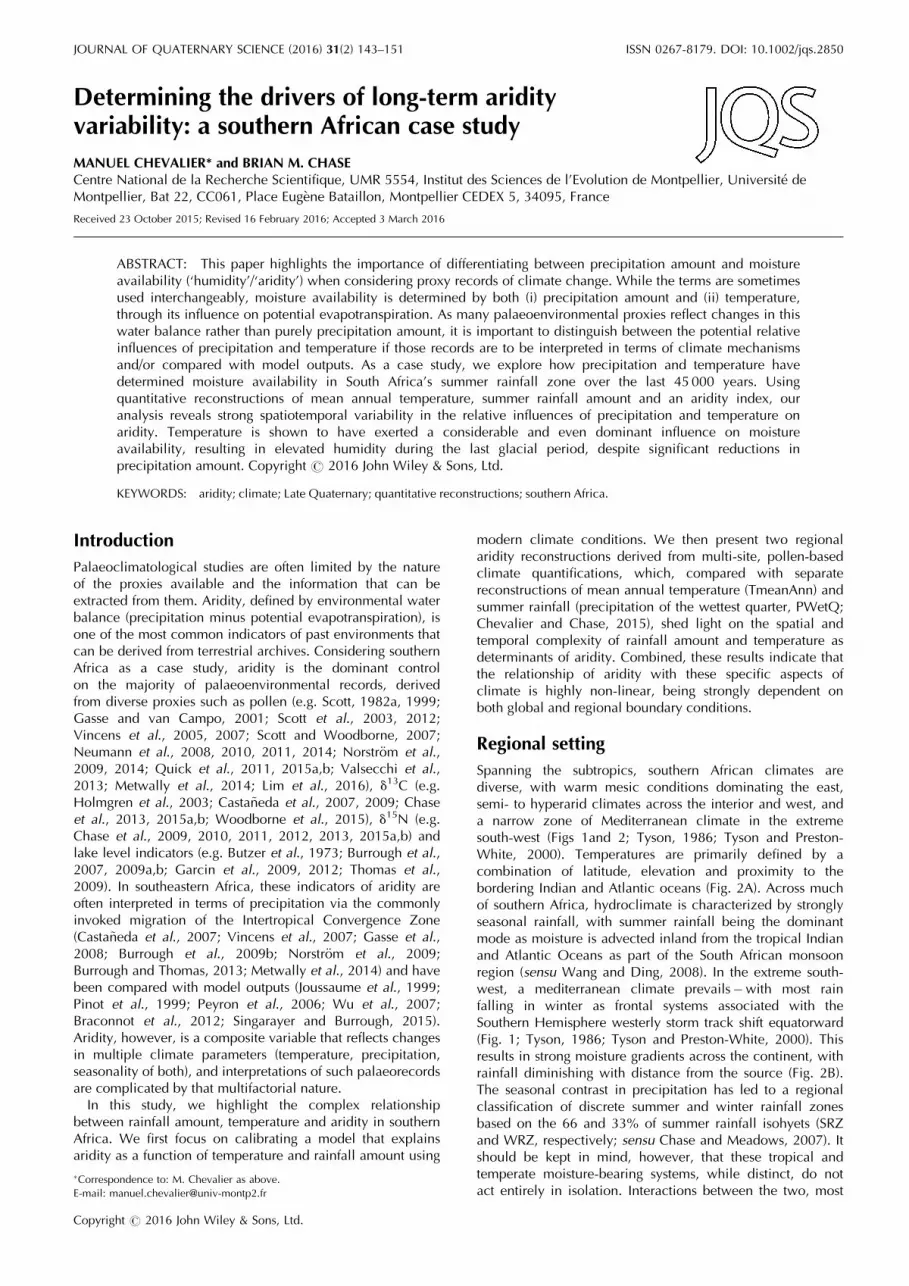
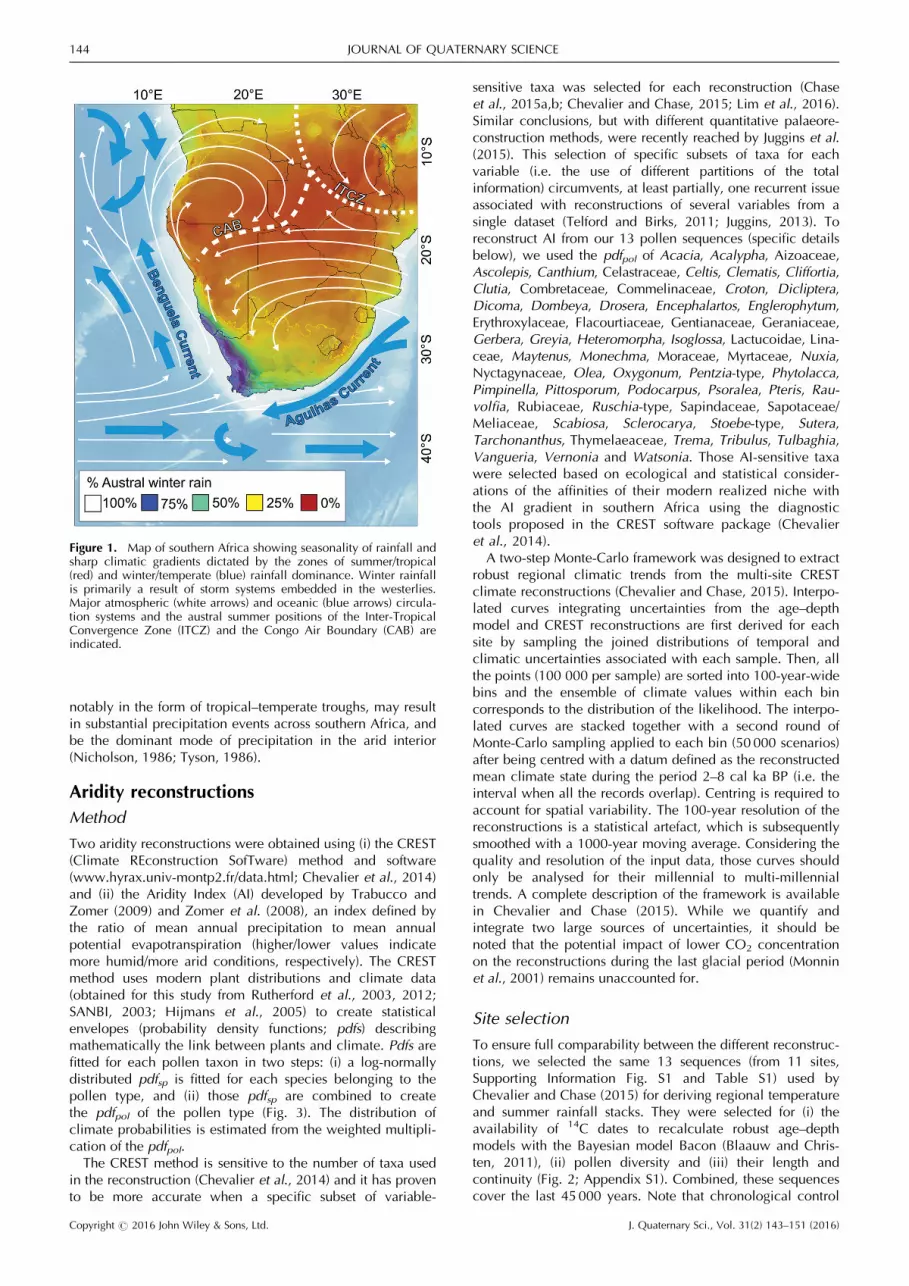
Spanning the subtropics, southern African climates arediverse, with warm mesic conditions dominating the east,semi- to hyperarid climates across the interior and west, anda narrow zone of Mediterranean climate in the extremesouth-west (Figs 1and 2; Tyson, 1986; Tyson and Preston-White, 2000). Temperatures are primarily defined by acombination of latitude, elevation and proximity to thebordering Indian and Atlantic oceans (Fig. 2A). Across muchof southern Africa, hydroclimate is characterized by stronglyseasonal rainfall, with summer rainfall being the dominantmode as moisture is advected inland from the tropical Indianand Atlantic Oceans as part of the South African monsoonregion (sensu Wang and Ding, 2008). In the extreme south-west, a mediterranean climate prevails�with most rainfalling in winter as frontal systems associated with theSouthern Hemisphere westerly storm track shift equatorward(Fig. 1; Tyson, 1986; Tyson and Preston-White, 2000). Thisresults in strong moisture gradients across the continent, withrainfall diminishing with distance from the source (Fig. 2B).The seasonal contrast in precipitation has led to a regionalclassification of discrete summer and winter rainfall zonesbased on the 66 and 33% of summer rainfall isohyets (SRZand WRZ, respectively; sensu Chase and Meadows, 2007). Itshould be kept in mind, however, that these tropical andtemperate moisture-bearing systems, while distinct, do notact entirely in isolation. Interactions between the two, most
notably in the form of tropical–temperate troughs, may resultin substantial precipitation events across southern Africa, andbe the dominant mode of precipitation in the arid interior(Nicholson, 1986; Tyson, 1986).
Aridity reconstructions
Method
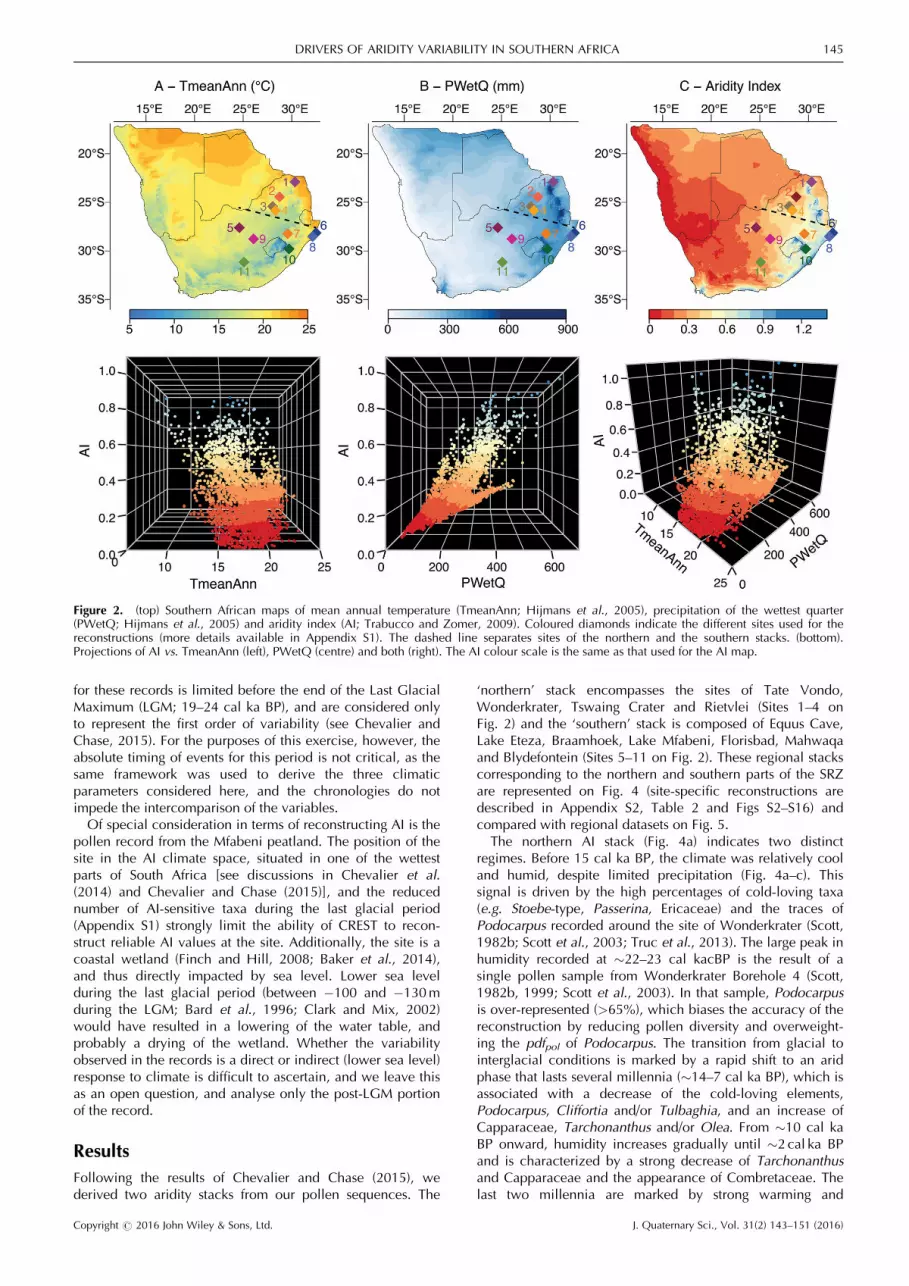
Two aridity reconstructions were obtained using (i) the CREST(Climate REconstruction SofTware) method and software(www.hyrax.univ-montp2.fr/data.html; Chevalier et al., 2014)and (ii) the Aridity Index (AI) developed by Trabucco andZomer (2009) and Zomer et al. (2008), an index defined bythe ratio of mean annual precipitation to mean annualpotential evapotranspiration (higher/lower values indicatemore humid/more arid conditions, respectively). The CRESTmethod uses modern plant distributions and climate data(obtained for this study from Rutherford et al., 2003, 2012;SANBI, 2003; Hijmans et al., 2005) to create statisticalenvelopes (probability density functions; pdfs) describingmathematically the link between plants and climate. Pdfs arefitted for each pollen taxon in two steps: (i) a log-normallydistributed pdfsp is fitted for each species belonging to thepollen type, and (ii) those pdfsp are combined to createthe pdfpol of the pollen type (Fig. 3). The distribution ofclimate probabilities is estimated from the weighted multipli-cation of the pdfpol.The CREST method is sensitive to the number of taxa used
in the reconstruction (Chevalier et al., 2014) and it has provento be more accurate when a specific subset of variable-
sensitive taxa was selected for each reconstruction (Chaseet al., 2015a,b; Chevalier and Chase, 2015; Lim et al., 2016).Similar conclusions, but with different quantitative palaeore-construction methods, were recently reached by Juggins et al.(2015). This selection of specific subsets of taxa for eachvariable (i.e. the use of different partitions of the totalinformation) circumvents, at least partially, one recurrent issueassociated with reconstructions of several variables from asingle dataset (Telford and Birks, 2011; Juggins, 2013). Toreconstruct AI from our 13 pollen sequences (specific detailsbelow), we used the pdfpol of Acacia, Acalypha, Aizoaceae,Ascolepis, Canthium, Celastraceae, Celtis, Clematis, Cliffortia,Clutia, Combretaceae, Commelinaceae, Croton, Dicliptera,Dicoma, Dombeya, Drosera, Encephalartos, Englerophytum,Erythroxylaceae, Flacourtiaceae, Gentianaceae, Geraniaceae,Gerbera, Greyia, Heteromorpha, Isoglossa, Lactucoidae, Lina-ceae, Maytenus, Monechma, Moraceae, Myrtaceae, Nuxia,Nyctagynaceae, Olea, Oxygonum, Pentzia-type, Phytolacca,Pimpinella, Pittosporum, Podocarpus, Psoralea, Pteris, Rau-volfia, Rubiaceae, Ruschia-type, Sapindaceae, Sapotaceae/Meliaceae, Scabiosa, Sclerocarya, Stoebe-type, Sutera,Tarchonanthus, Thymelaeaceae, Trema, Tribulus, Tulbaghia,Vangueria, Vernonia and Watsonia. Those AI-sensitive taxawere selected based on ecological and statistical consider-ations of the affinities of their modern realized niche withthe AI gradient in southern Africa using the diagnostictools proposed in the CREST software package (Chevalieret al., 2014).A two-step Monte-Carlo framework was designed to extract
robust regional climatic trends from the multi-site CRESTclimate reconstructions (Chevalier and Chase, 2015). Interpo-lated curves integrating uncertainties from the age–depthmodel and CREST reconstructions are first derived for eachsite by sampling the joined distributions of temporal andclimatic uncertainties associated with each sample. Then, allthe points (100 000 per sample) are sorted into 100-year-widebins and the ensemble of climate values within each bincorresponds to the distribution of the likelihood. The interpo-lated curves are stacked together with a second round ofMonte-Carlo sampling applied to each bin (50 000 scenarios)after being centred with a datum defined as the reconstructedmean climate state during the period 2–8 cal ka BP (i.e. theinterval when all the records overlap). Centring is required toaccount for spatial variability. The 100-year resolution of thereconstructions is a statistical artefact, which is subsequentlysmoothed with a 1000-year moving average. Considering thequality and resolution of the input data, those curves shouldonly be analysed for their millennial to multi-millennialtrends. A complete description of the framework is availablein Chevalier and Chase (2015). While we quantify andintegrate two large sources of uncertainties, it should benoted that the potential impact of lower CO2 concentrationon the reconstructions during the last glacial period (Monninet al., 2001) remains unaccounted for.
Site selection
To ensure full comparability between the different reconstruc-tions, we selected the same 13 sequences (from 11 sites,Supporting Information Fig. S1 and Table S1) used byChevalier and Chase (2015) for deriving regional temperatureand summer rainfall stacks. They were selected for (i) theavailability of 14C dates to recalculate robust age–depthmodels with the Bayesian model Bacon (Blaauw and Chris-ten, 2011), (ii) pollen diversity and (iii) their length andcontinuity (Fig. 2; Appendix S1). Combined, these sequencescover the last 45 000 years. Note that chronological control
Figure 1. Map of southern Africa showing seasonality of rainfall andsharp climatic gradients dictated by the zones of summer/tropical(red) and winter/temperate (blue) rainfall dominance. Winter rainfallis primarily a result of storm systems embedded in the westerlies.Major atmospheric (white arrows) and oceanic (blue arrows) circula-tion systems and the austral summer positions of the Inter-TropicalConvergence Zone (ITCZ) and the Congo Air Boundary (CAB) areindicated.
Copyright # 2016 John Wiley & Sons, Ltd. J. Quaternary Sci., Vol. 31(2) 143–151 (2016)
for these records is limited before the end of the Last GlacialMaximum (LGM; 19–24 cal ka BP), and are considered onlyto represent the first order of variability (see Chevalier andChase, 2015). For the purposes of this exercise, however, theabsolute timing of events for this period is not critical, as thesame framework was used to derive the three climaticparameters considered here, and the chronologies do notimpede the intercomparison of the variables.Of special consideration in terms of reconstructing AI is the
pollen record from the Mfabeni peatland. The position of thesite in the AI climate space, situated in one of the wettestparts of South Africa [see discussions in Chevalier et al.(2014) and Chevalier and Chase (2015)], and the reducednumber of AI-sensitive taxa during the last glacial period(Appendix S1) strongly limit the ability of CREST to recon-struct reliable AI values at the site. Additionally, the site is acoastal wetland (Finch and Hill, 2008; Baker et al., 2014),and thus directly impacted by sea level. Lower sea levelduring the last glacial period (between �100 and �130mduring the LGM; Bard et al., 1996; Clark and Mix, 2002)would have resulted in a lowering of the water table, andprobably a drying of the wetland. Whether the variabilityobserved in the records is a direct or indirect (lower sea level)response to climate is difficult to ascertain, and we leave thisas an open question, and analyse only the post-LGM portionof the record.
Results
Following the results of Chevalier and Chase (2015), wederived two aridity stacks from our pollen sequences. The
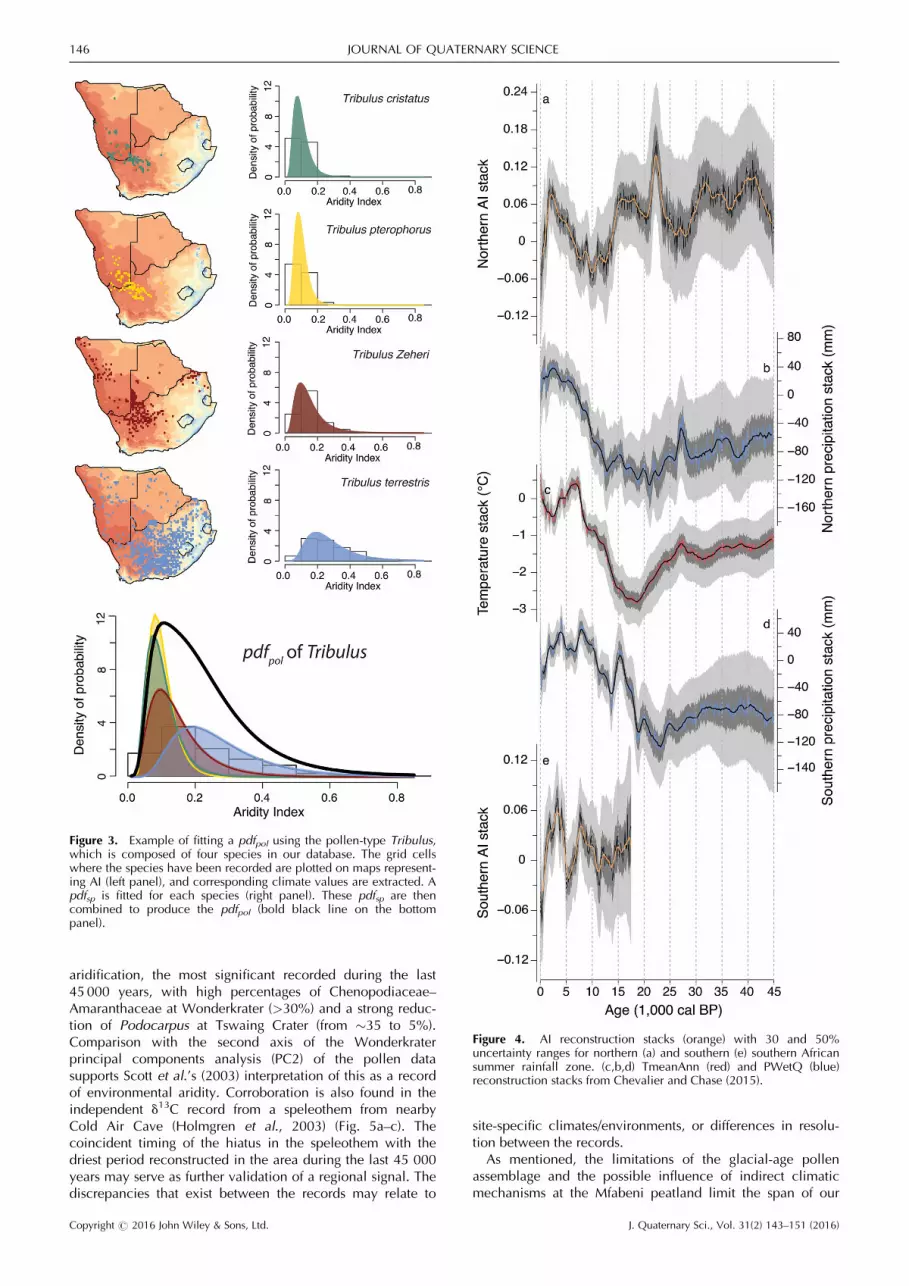
‘northern’ stack encompasses the sites of Tate Vondo,Wonderkrater, Tswaing Crater and Rietvlei (Sites 1–4 onFig. 2) and the ‘southern’ stack is composed of Equus Cave,Lake Eteza, Braamhoek, Lake Mfabeni, Florisbad, Mahwaqaand Blydefontein (Sites 5–11 on Fig. 2). These regional stackscorresponding to the northern and southern parts of the SRZare represented on Fig. 4 (site-specific reconstructions aredescribed in Appendix S2, Table 2 and Figs S2–S16) andcompared with regional datasets on Fig. 5.The northern AI stack (Fig. 4a) indicates two distinct
regimes. Before 15 cal ka BP, the climate was relatively cooland humid, despite limited precipitation (Fig. 4a–c). Thissignal is driven by the high percentages of cold-loving taxa(e.g. Stoebe-type, Passerina, Ericaceae) and the traces ofPodocarpus recorded around the site of Wonderkrater (Scott,1982b; Scott et al., 2003; Truc et al., 2013). The large peak inhumidity recorded at �22–23 cal kacBP is the result of asingle pollen sample from Wonderkrater Borehole 4 (Scott,1982b, 1999; Scott et al., 2003). In that sample, Podocarpusis over-represented (>65%), which biases the accuracy of thereconstruction by reducing pollen diversity and overweight-ing the pdfpol of Podocarpus. The transition from glacial tointerglacial conditions is marked by a rapid shift to an aridphase that lasts several millennia (�14–7 cal ka BP), which isassociated with a decrease of the cold-loving elements,Podocarpus, Cliffortia and/or Tulbaghia, and an increase ofCapparaceae, Tarchonanthus and/or Olea. From �10 cal kaBP onward, humidity increases gradually until �2 cal ka BPand is characterized by a strong decrease of Tarchonanthusand Capparaceae and the appearance of Combretaceae. Thelast two millennia are marked by strong warming and
Figure 2. (top) Southern African maps of mean annual temperature (TmeanAnn; Hijmans et al., 2005), precipitation of the wettest quarter(PWetQ; Hijmans et al., 2005) and aridity index (AI; Trabucco and Zomer, 2009). Coloured diamonds indicate the different sites used for thereconstructions (more details available in Appendix S1). The dashed line separates sites of the northern and the southern stacks. (bottom).Projections of AI vs. TmeanAnn (left), PWetQ (centre) and both (right). The AI colour scale is the same as that used for the AI map.
Copyright # 2016 John Wiley & Sons, Ltd. J. Quaternary Sci., Vol. 31(2) 143–151 (2016)
DRIVERS OF ARIDITY VARIABILITY IN SOUTHERN AFRICA 145
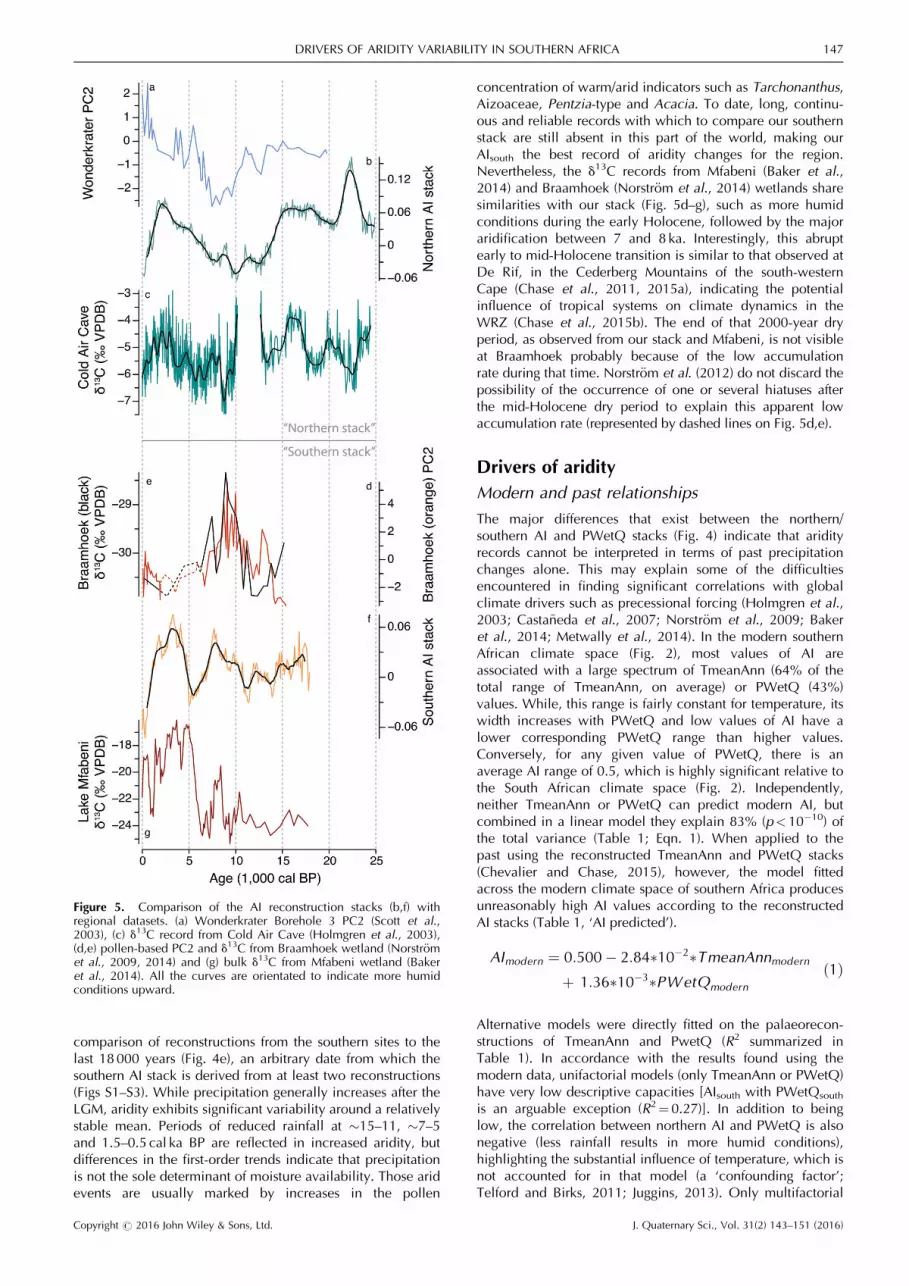
aridification, the most significant recorded during the last45 000 years, with high percentages of Chenopodiaceae–Amaranthaceae at Wonderkrater (>30%) and a strong reduc-tion of Podocarpus at Tswaing Crater (from �35 to 5%).Comparison with the second axis of the Wonderkraterprincipal components analysis (PC2) of the pollen datasupports Scott et al.’s (2003) interpretation of this as a recordof environmental aridity. Corroboration is also found in theindependent d13C record from a speleothem from nearbyCold Air Cave (Holmgren et al., 2003) (Fig. 5a–c). Thecoincident timing of the hiatus in the speleothem with thedriest period reconstructed in the area during the last 45 000years may serve as further validation of a regional signal. Thediscrepancies that exist between the records may relate to
site-specific climates/environments, or differences in resolu-tion between the records.As mentioned, the limitations of the glacial-age pollen
assemblage and the possible influence of indirect climaticmechanisms at the Mfabeni peatland limit the span of our
Figure 3. Example of fitting a pdfpol using the pollen-type Tribulus,which is composed of four species in our database. The grid cellswhere the species have been recorded are plotted on maps represent-ing AI (left panel), and corresponding climate values are extracted. Apdfsp is fitted for each species (right panel). These pdfsp are thencombined to produce the pdfpol (bold black line on the bottompanel).
Figure 4. AI reconstruction stacks (orange) with 30 and 50%uncertainty ranges for northern (a) and southern (e) southern Africansummer rainfall zone. (c,b,d) TmeanAnn (red) and PWetQ (blue)reconstruction stacks from Chevalier and Chase (2015).
Copyright # 2016 John Wiley & Sons, Ltd. J. Quaternary Sci., Vol. 31(2) 143–151 (2016)
146 JOURNAL OF QUATERNARY SCIENCE
comparison of reconstructions from the southern sites to thelast 18 000 years (Fig. 4e), an arbitrary date from which thesouthern AI stack is derived from at least two reconstructions(Figs S1–S3). While precipitation generally increases after theLGM, aridity exhibits significant variability around a relativelystable mean. Periods of reduced rainfall at �15–11, �7–5and 1.5–0.5 cal ka BP are reflected in increased aridity, butdifferences in the first-order trends indicate that precipitationis not the sole determinant of moisture availability. Those aridevents are usually marked by increases in the pollen
concentration of warm/arid indicators such as Tarchonanthus,Aizoaceae, Pentzia-type and Acacia. To date, long, continu-ous and reliable records with which to compare our southernstack are still absent in this part of the world, making ourAIsouth the best record of aridity changes for the region.Nevertheless, the d13C records from Mfabeni (Baker et al.,2014) and Braamhoek (Norstr€om et al., 2014) wetlands sharesimilarities with our stack (Fig. 5d–g), such as more humidconditions during the early Holocene, followed by the majoraridification between 7 and 8 ka. Interestingly, this abruptearly to mid-Holocene transition is similar to that observed atDe Rif, in the Cederberg Mountains of the south-westernCape (Chase et al., 2011, 2015a), indicating the potentialinfluence of tropical systems on climate dynamics in theWRZ (Chase et al., 2015b). The end of that 2000-year dryperiod, as observed from our stack and Mfabeni, is not visibleat Braamhoek probably because of the low accumulationrate during that time. Norstr€om et al. (2012) do not discard thepossibility of the occurrence of one or several hiatuses afterthe mid-Holocene dry period to explain this apparent lowaccumulation rate (represented by dashed lines on Fig. 5d,e).
Drivers of aridity
Modern and past relationships
The major differences that exist between the northern/southern AI and PWetQ stacks (Fig. 4) indicate that aridityrecords cannot be interpreted in terms of past precipitationchanges alone. This may explain some of the difficultiesencountered in finding significant correlations with globalclimate drivers such as precessional forcing (Holmgren et al.,2003; Casta~neda et al., 2007; Norstr€om et al., 2009; Bakeret al., 2014; Metwally et al., 2014). In the modern southernAfrican climate space (Fig. 2), most values of AI areassociated with a large spectrum of TmeanAnn (64% of thetotal range of TmeanAnn, on average) or PWetQ (43%)values. While, this range is fairly constant for temperature, itswidth increases with PWetQ and low values of AI have alower corresponding PWetQ range than higher values.Conversely, for any given value of PWetQ, there is anaverage AI range of 0.5, which is highly significant relative tothe South African climate space (Fig. 2). Independently,neither TmeanAnn or PWetQ can predict modern AI, butcombined in a linear model they explain 83% (p< 10�10) ofthe total variance (Table 1; Eqn. 1). When applied to thepast using the reconstructed TmeanAnn and PWetQ stacks(Chevalier and Chase, 2015), however, the model fittedacross the modern climate space of southern Africa producesunreasonably high AI values according to the reconstructedAI stacks (Table 1, ‘AI predicted’).
AImodern ¼ 0:500� 2:84�10�2�TmeanAnnmodern
þ 1:36�10�3�PWetQmodern
ð1Þ
Alternative models were directly fitted on the palaeorecon-structions of TmeanAnn and PwetQ (R2 summarized inTable 1). In accordance with the results found using themodern data, unifactorial models (only TmeanAnn or PWetQ)have very low descriptive capacities [AIsouth with PWetQsouth
is an arguable exception (R2¼ 0.27)]. In addition to beinglow, the correlation between northern AI and PWetQ is alsonegative (less rainfall results in more humid conditions),highlighting the substantial influence of temperature, which isnot accounted for in that model (a ‘confounding factor’;Telford and Birks, 2011; Juggins, 2013). Only multifactorial
Figure 5. Comparison of the AI reconstruction stacks (b,f) withregional datasets. (a) Wonderkrater Borehole 3 PC2 (Scott et al.,2003), (c) d13C record from Cold Air Cave (Holmgren et al., 2003),(d,e) pollen-based PC2 and d13C from Braamhoek wetland (Norstr€omet al., 2009, 2014) and (g) bulk d13C from Mfabeni wetland (Bakeret al., 2014). All the curves are orientated to indicate more humidconditions upward.
Copyright # 2016 John Wiley & Sons, Ltd. J. Quaternary Sci., Vol. 31(2) 143–151 (2016)
DRIVERS OF ARIDITY VARIABILITY IN SOUTHERN AFRICA 147
models provide the intuitive positive correlation betweenprecipitation and humidity. To account for the two apparentAI regimes reconstructed from the northern stack, we haveadded a two-level qualitative variable to differentiate betweenthe ‘glacial’ and the ‘interglacial’ (before and after anempirically determined switch at �15 cal ka BP, respectively,Eqn. 2). This two-level qualitative variable is only meant tohighlight the existence of a non-linear response of AI to thereconstructed variability of TmeanAnn and PWetQ. Identifyingthe nature of this non-linearity is, however, beyond thescope of this paper. This model reaches a very high R2 (0.80,p < 10�10, Eqn. 2). As the southern stack is limited to the last18 000 years, such a model with the glacial/interglacialindicator was not fitted. The bifactorial model with PWetQand TmeanAnn has an R2 of 0.62 (p < 10�10, Eqn. 3).
The terms of rainfall amount and humidity are clearly notinterchangeable (Fig. 4) and reflect two different aspects ofthe regional climate. As a direct consequence, only multifac-torial models are capable of describing the variability of AIwith efficiency (R2¼ 0.83 for AImodern, R2¼0.80 for AInorthand R2¼0.62 for AIsouth, Table 1). If the PWetQ parametersof the models defined for the past have the same order ofmagnitude � albeit with some relative differences (Eqns 2and 3) � they differ from modern PWetQ by one order ofmagnitude (Eqn. 1). Such a diversity of responses between thethree situations tested precludes the definition of a synoptictime-transgressive relationship. In fact, they are purely de-scriptive, and none of the models described is meant to beused to reconstruct AI from a set of precipitation andtemperature variables. Their only purpose is to highlight thevariability of the relationship of aridity with temperature andprecipitation across our three case studies.The temporal variability of the relationship, deduced from
the two different regimes observed from the northern stack(Fig. 4; Eqn. 2), can be explained by two non-mutuallyexclusive mechanisms. First, it could be caused by a changein the distribution of rainfall throughout the year. However,this seems unlikely as (i) less summer rainfall is reconstructedduring glacial times (Fig. 4b; Truc et al., 2013; Chevalier andChase, 2015), suggesting no significant southward shift of theAfrican rainbelt over the region, and (ii) regional datasets donot clearly indicate a migration of the temperate wintersystems that far north (cf. Chase and Meadows, 2007).Alternatively, the glacial and interglacial AI modes could becaused by a temperature effect, as the transition at �15 cal kaBP is contemporaneous with a strong temperature increase
(Fig. 4a,c). The exponential relationship between temperatureand evapotranspiration (AI is linearly related to evapotranspi-ration; Trabucco and Zomer, 2009) results in a highersensitivity of AI to temperature at higher temperatures. In aglacial climate, lower temperature reduces evapotranspira-tion, resulting in ‘more effective precipitation’, and morehumid conditions despite reduced rainfall amounts (Fig. 4).The spatial variability has two expressions. The first is the
difference between the modern and the past calibrations. Pastcalibrations are based on the wettest part of southern Africawhile the modern calibration encompasses all of southernAfrica and includes the arid to hyperarid Namib Desert. Theparameter associated with modern PWetQ is one order ofmagnitude higher because at the western margin of thesubcontinent, environmental conditions are much drier,where even small changes in rainfall amount have a moresignificant influence on aridity (cf. the tighter link between AIand PWetQ for low values of both, Fig. 2). The secondexpression comes from the difference in the absolute valuesof the parameters of past models (Eqns 2 and 3). Theyhighlight that, relatively speaking, temperature seems moreimportant in northeastern South Africa while precipitationdominates the signal in more arid regions. This is consistentwith the first expression as the area represented by thesouthern stack is more arid than its northern counterpart.Identifying the exact causes and thresholds underlying thisprocess is beyond the scope of this paper, but it does presentinteresting questions regarding the interaction of these factors,and the evolution of the region’s primary climate systemsduring the late Quaternary.
Conclusion
This study demonstrates that aridity is determined by acomplex function of temperature and precipitation thatexhibits significant spatiotemporal variability. Notably, de-spite significantly less rainfall in South Africa’s northernsummer rainfall zone during the last glacial period, condi-tions were relatively humid in the region compared withmuch of the Holocene because of lower temperatures,reducing potential evapotranspiration. It also indicates thatthe influence of temperature on aridity is variable as afunction of climate space, with AI in drier regions being moresensitive to changes in precipitation than in wetter regions.These results do not diminish the value of any specific proxyor palaeorecord that primarily reflects either aridity or rainfallamount, but they do indicate the need to distinguish betweenthe two, and to apply data appropriate to the researchquestions being asked.
Supporting Information
Additional supporting information may be found in the onlineversion of this article.
Figure S1. Map of South Africa with the 11 sites considered inthis study, and the 13 pollen sequences with each segmentrepresenting a pollen sample.
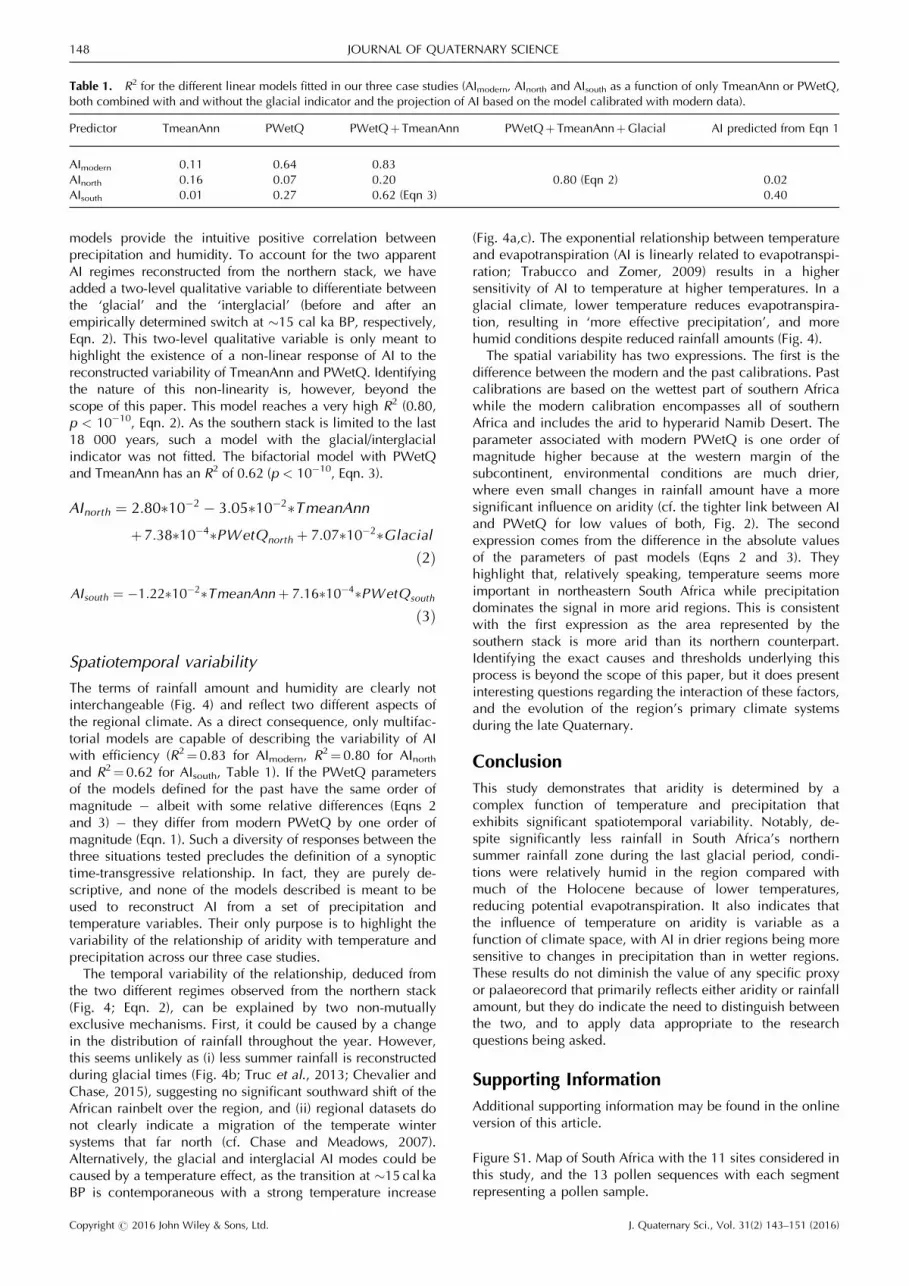
Table 1. R2 for the different linear models fitted in our three case studies (AImodern, AInorth and AIsouth as a function of only TmeanAnn or PWetQ,both combined with and without the glacial indicator and the projection of AI based on the model calibrated with modern data).
Predictor TmeanAnn PWetQ PWetQþTmeanAnn PWetQþTmeanAnnþGlacial AI predicted from Eqn 1
Copyright # 2016 John Wiley & Sons, Ltd. J. Quaternary Sci., Vol. 31(2) 143–151 (2016)
148 JOURNAL OF QUATERNARY SCIENCE
Figure S2. AI reconstructions for the 13 pollen sequences.
Figure S3. Northern AI stack and southern AI stack.
Figure S4. Results of the leave-one-out cross-validationanalysis of the Blydefontein pollen sequence.
Figure S5. Results of the leave-one-out cross-validationanalysis of the Braamhoek pollen sequence.
Figure S6. Results of the leave-one-out cross-validationanalysis of the Equus Cave pollen sequence.
Figure S7. Results of the leave-one-out cross-validationanalysis of the Lake Eteza pollen sequence.
Figure S8. Results of the leave-one-out cross-validationanalysis of the Florisbad pollen sequence.
Figure S9. Results of the leave-one-out cross-validationanalysis of the Mahwaqa pollen sequence.
Figure S10. Results of the leave-one-out cross-validationanalysis of the Lake Mfabeni pollen sequence.
Figure S11. Results of the leave-one-out cross-validationanalysis of the Rietvlei pollen sequence.
Figure S12. Results of the leave-one-out cross-validationanalysis of the Tate Vondo pollen sequence.
Figure S13. Results of the leave-one-out cross-validationanalysis of the Tswaing Crater-1 pollen sequence.
Figure S14. Results of the leave-one-out cross-validationanalysis of the Tswaing Crater-2 pollen sequence.
Figure S15. Results of the leave-one-out cross-validationanalysis of the Wonderkrater Borehole-3 pollen sequence.
Figure S16. Results of the leave-one-out cross-validationanalysis of the Wonderkrater Borehole-4 pollen sequence.
Table S1. List of the different sites used in this study.
Table S2. Summary of the parameters used in CREST forreconstructing climate.
Acknowledgments. This work was funded by the European ResearchCouncil (ERC) under the European Union’s Seventh FrameworkProgramme (FP7/2007e2013)/ERC Starting Grant ‘HYRAX’, grant agree-ment No. 258657. The authors also acknowledge the support ofthe South African National Botanical Institute (SANBI) in sharingtheir botanical data. This is an Institut des Sciences de l’Evolution�Montpellier, University Montpellier contribution, No. ISEM 2016-053.
Abbreviations. AI, aridity index; LGM, Last Glacial Maximum.
References
Baker A, Routh J, Blaauw M et al. 2014. Geochemical records ofpalaeoenvironmental controls on peat forming processes in theMfabeni peatland, KwaZulu Natal, South Africa since the LatePleistocene. Palaeogeography Palaeoclimatology Palaeoecology395: 95–106 [DOI: 10.1016/j.palaeo.2013.12.019].
Bard E, Hamelin B, Arnold M et al. 1996. Deglacial sea-level recordfrom Tahiti corals and the timing of global meltwater discharge.Nature 382: 241–244 [DOI: 10.1038/382241a0].
Blaauw M, Christen JA. 2011. Flexible paleoclimate age–depthmodels using an autoregressive gamma process. Bayesian Analysis6: 457–474 [DOI: 10.1214/ba/1339616472].
Braconnot P, Harrison SP, Kageyama M et al. 2012. Evaluation ofclimate models using palaeoclimatic data. Nature Climate Change2: 417–424 [DOI: 10.1038/nclimate1456].
Burrough SL, Thomas DSG. 2013. Central southern Africa at the time ofthe African Humid Period: a new analysis of Holocene palaeo-environmental and palaeoclimate data. Quaternary Science Reviews80: 29–46 [DOI: 10.1016/j.quascirev.2013.08.001].
Burrough SL, Thomas DSG, Bailey RM. 2009a. Mega-Lake in theKalahari: a Late Pleistocene record of the Palaeolake Makgadikgadisystem. Quaternary Science Reviews 28: 1392–1411 [DOI:10.1016/j.quascirev.2009.02.007].
Burrough SL, Thomas DSG, Shaw PA et al. 2007. MultiphaseQuaternary highstands at Lake Ngami, Kalahari, northern Bot-swana. Palaeogeography Palaeoclimatology Palaeoecology 253:280–299 [DOI: 10.1016/j.palaeo.2007.06.010].
Burrough SL, Thomas DSG, Singarayer JS. 2009b. Late Quaternaryhydrological dynamics in the Middle Kalahari: forcing and feed-backs. Earth Science Reviews 96: 313–326 [DOI: 10.1016/j.earscirev.2009.07.001].
Butzer KW, Fock GJ, Stuckenrath R et al. 1973. Palaeohydrology ofLate Pleistocene lake, Alexandersfontein, Kimberley, South Africa.Nature 243: 328–330 [DOI: 10.1038/243328a0].
Casta~neda IS, Werne JP, Johnson TC et al. 2009. Late Quaternaryvegetation history of southeast Africa: the molecular isotopic recordfrom Lake Malawi. Palaeogeography Palaeoclimatology Palaeoe-cology 275: 100–112 [DOI: 10.1016/j.palaeo.2009.02.008].
Casta~neda IS, Werne JP, Johnson TC. 2007. Wet and arid phases inthe southeast African tropics since the Last Glacial Maximum.Geology 35: 823–826 [DOI: 10.1130/G23916A.1].
Chase BM, Boom A, Carr AS et al. 2013. Holocene climate change insouthernmost South Africa: rock hyrax middens record shifts in thesouthern Westerlies. Quaternary Science Reviews 82: 199–205[DOI: 10.1016/j.quascirev.2013.10.018].
Chase BM, Boom A, Carr AS et al. 2015a. Evolving southwest Africanresponse to abrupt deglacial North Atlantic climate change events.Quaternary Science Reviews 121: 132–136 [DOI: 10.1016/j.quascirev.2015.05.023].
Chase BM, Lim S, Chevalier M et al. 2015b. Influence of tropicaleasterlies in the southwestern Cape of Africa during the Holocene.Quaternary Science Reviews 107: 138–148.
Chase BM, Meadows ME, Carr AS et al. 2010. Evidence forprogressive Holocene aridification in southern Africa recorded inNamibian hyrax middens: implications for African Monsoondynamics and the ‘African Humid Period’. Quaternary Research74: 36–45 [DOI: 10.1016/j.yqres.2010.04.006].
Chase BM, Meadows ME, Scott L et al. 2009. A record of rapidHolocene climate change preserved in hyrax middens from south-western Africa. Geology 37: 703–706 [DOI: 10.1130/G30053A.1].
Chase BM, Quick LJ, Meadows ME et al. 2011. Late glacialinterhemispheric climate dynamics revealed in South African hyraxmiddens. Geology 39: 19–22 [DOI: 10.1130/G31129.1].
Chase BM, Scott L, Meadows ME et al. 2012. Rock hyrax middens: apalaeoenvironmental archive for southern African drylands. Qua-ternary Science Reviews 56: 107–125 [DOI: 10.1016/j.quascirev.2012.08.018].
Chevalier M, Chase BM. 2015. Southeast African records reveal acoherent shift from high- to low-latitude forcing mechanisms alongthe East African margin across last glacial–interglacial transition.Quaternary Science Reviews 125: 117–130 [DOI: 10.1016/j.quascirev.2015.07.009].
Chevalier M, Cheddadi R, Chase BM. 2014. CREST (ClimateREconstruction SofTware): a probability density function (PDF)-based quantitative climate reconstruction method. Climate of thePast 10: 2081–2098 [DOI: 10.5194/cp-10-2081-2014].
Copyright # 2016 John Wiley & Sons, Ltd. J. Quaternary Sci., Vol. 31(2) 143–151 (2016)
DRIVERS OF ARIDITY VARIABILITY IN SOUTHERN AFRICA 149
Clark PU, Mix AC. 2002. Ice sheets and sea level of the Last GlacialMaximum. Quaternary Science Reviews 21: 1–7 [DOI: 10.1016/S0277-3791(01)00118-4].
Finch JM, Hill TR. 2008. A late Quaternary pollen sequence fromMfabeni Patland, South Africa: reconstructing forest history inMaputaland. Quaternary Research 70: 442–450 [DOI: 10.1016/j.yqres.2008.07.003].
Garcin Y, Junginger A, Melnick D et al. 2009. Late Pleistocene–Holocene rise and collapse of Lake Suguta, northern Kenya Rift.Quaternary Science Reviews 28: 911–925 [DOI: 10.1016/j.quascirev.2008.12.006].
Garcin Y, Melnick D, Strecker MR et al. 2012. East African mid-Holocene wet–dry transition recorded in palaeo-shorelines of LakeTurkana, northern Kenya Rift. Earth and Planetary Sciences Letters331–332: 322–334 [DOI: 10.1016/j.epsl.2012.03.016].
Gasse F, Chali�e F, Vincens A et al. 2008. Climatic patterns inequatorial and southern Africa from 30,000 to 10,000 years agoreconstructed from terrestrial and near-shore proxy data. Quater-nary Science Reviews 27: 2316–2340 [DOI: 10.1016/j.quascirev.2008.08.027].
Gasse F, van Campo E. 2001. Late Quaternary environmentalchanges from a pollen and diatom record in the southern tropics(Lake Tritrivakely, Madagascar). Palaeogeography Palaeoclimatol-ogy Palaeoecology 167: 287–308 [DOI: 10.1016/S0031-0182(00)00242-X].
Hijmans RJ, Cameron SE, Parra JL et al. 2005. Very high resolutioninterpolated climate surfaces for global land areas. InternationalJournal of Climatology 25: 1965–1978 [DOI: 10.1002/joc.1276].
Holmgren K, Lee-Thorp JA, Cooper GRJ et al. 2003. Persistentmillennial-scale climatic variability over the past 25,000 years inSouthern Africa. Quaternary Science Reviews 22: 2311–2326[DOI: 10.1016/S0277-3791(03)00204-X].
Joussaume S, Taylor KE, Braconnot P et al. 1999. Monsoon changesfor 6000 years ago: results of 18 simulations from the PaleoclimateModeling Intercomparison Project (PMIP). Geophysical ResearchLetters 26: 859–862 [DOI: 10.1029/1999GL900126].
Juggins S. 2013. Quantitative reconstructions in palaeolimnology:new paradigm or sick science? Quaternary Science Reviews 64:20–32 [DOI: 10.1016/j.quascirev.2012.12.014].
Juggins S, Simpson GL, Telford RJ. 2015. Taxon selection usingstatistical learning techniques to improve transfer function predic-tion. Holocene 25: 130–136 [DOI: 10.1177/0959683614556388].
Lim S, Chase BM, Chevalier M, et al. (2016) 50,000 years of climatein the Namib Desert, Pella, South Africa. Palaeogeography Palae-oclimatology Palaeoecology (in press).
Metwally AASAH, Scott L, Neumann FH et al. 2014. Holocenepalynology and palaeoenvironments in the Savanna Biome atTswaing Crater, central South Africa. Palaeogeography Palaeocli-matology Palaeoecology 402: 125–135 [DOI: 10.1016/j.palaeo.2014.03.019].
Monnin E, Inderm€uhle A, D€allenbach A. 2001. Atmospheric CO2
concentrations over the Last Glacial Termination. Science 291:112–114.
Neumann FH, Botha GA, Scott L. 2014. 18,000 years of grasslandevolution in the summer rainfall region of South Africa: evidencefrom Mahwaqa Mountain, KwaZulu-Natal. Vegetation Historyand Archaeobotany 23: 665–681 [DOI: 10.1007/s00334-014-0445-3].
Neumann FH, Scott L, Bamford MK. 2011. Climate change andhuman disturbance of Fnbos vegetation during the late Holocene atPrincess Vlei, Western Cape, South Africa. Holocene 21:1137–1149 [DOI: 10.1177/0959683611400461].
Neumann FH, Scott L, Bousman CB et al. 2010. A Holocenesequence of vegetation change at Lake Eteza, coastal KwaZulu-Natal, South Africa. Review of Palaeobotany and Palynology 162:39–53 [DOI: 10.1016/j.revpalbo.2010.05.001].
Neumann FH, Stager JC, Scott L et al. 2008. Holocene vegetation andclimate records from lake Sibaya, KwaZulu-Natal (South Africa).Review of Palaeobotany and Palynology 152: 113–128 [DOI:10.1016/j.revpalbo.2008.04.006].
Nicholson SE. 1986. The nature of rainfall variability in Africa Southof the equator. Journal of Climatology 6: 515–530 [DOI: 10.1002/joc.3370060506].
Norstr€om E, Neumann FH, Scott L et al. 2014. Late Quaternaryvegetation dynamics and hydro-climate in the Drakensberg, SouthAfrica. Quaternary Science Reviews 105: 48–65 [DOI: 10.1016/j.quascirev.2014.09.016].
Norstr€om E, Risberg J, Gr€ondahl H et al. 2012. Coastal paleo-environment and sea-level change at Macassa Bay, southernMozambique, since c 6600 cal BP. Quaternary International 260:153–163 [DOI: 10.1016/j.quaint.2011.11.032].
Norstr€om E, Scott L, Partridge TC et al. 2009. Reconstruction ofenvironmental and climate changes at Braamhoek wetland, easternescarpment South Africa, during the last 16,000 years withemphasis on the Pleistocene–Holocene transition. PalaeogeographyPalaeoclimatology Palaeoecology 271: 240–258 [DOI: 10.1016/j.palaeo.2008.10.018].
Peyron O, Jolly D, Braconnot P et al. 2006. Quantitative reconstruc-tions of annual rainfall in Africa 6000 years ago: model-datacomparison. Journal of Geophysical Research 111: 1–9 [DOI:10.1029/2006JD007396].
Pinot S, Ramstein G, Harrison SP et al. 1999. Tropical paleoclimatesat the Last Glacial Maximum: comparison of Paleoclimate Model-ing Intercomparison Project (PMIP) simulations and paleodata.Climate Dynamics 15: 857–874 [DOI: 10.1007/s003820050318].
Quick LJ, Carr AS, Meadows ME et al. 2015a. A late Pleistocene–Holocene multi-proxy record of palaeoenvironmental change fromStill Bay, southern Cape Coast, South Africa. Journal of QuaternaryScience 30: 870–885 [DOI: 10.1002/jqs.2825].
Quick LJ, Chase BM, Meadows ME et al. 2011. A 19.5kyr vegetationhistory from the central Cederberg Mountains, South Africa:palynological evidence from rock hyrax middens. PalaeogeographyPalaeoclimatology Palaeoecology 309: 253–270 [DOI: 10.1016/j.palaeo.2011.06.008].
Quick LJ, Meadows ME, Bateman MD et al. 2015b. Vegetation andclimate dynamics during the last glacial period in the fynbos-afrotemperate forest ecotone, southern Cape, South Africa. Quater-nary International [DOI: 10.1016/j.quaint.2015.08.027].
Rutherford MC, Mucina L, Powrie LW. 2012. The South AfricanNational Vegetation Database: History, development, applications,problems and future. South African Journal of Science 108: 1–8[DOI: 10.4102/sajs.v108i1/2.629].
Rutherford MC, Powrie LW, Midgley GF et al. 2003. ACKDAT: adigital spatial database of distributions of South African plantspecies and species assemblages. South African Journal of Botany69: 99–104 [DOI: 10.1016/S0254-6299(15)30364-1].
Scott L. 1982a. Late Quaternary fossil pollen grains from theTransvaal, South Africa. Review of Palaeobotany and Palynology36: 241–278 [DOI: 10.1016/0034-6667(82)90022-7].
Scott L. 1982b. Pollen record from the Transvaal Bushveld, SouthAfrica. Quaternary Research 370: 339–370.
Scott L. 1999. Vegetation history and climate in the Savanna biomeSouth Africa since 190,000 ka: a comparison of pollen data fromthe Tswaing Crater (the Pretoria Saltpan) and Wonderkrater.Quaternary International 57–58: 215–223 [DOI: 10.1016/S1040-6182(98)00062-7].
Scott L, Holmgren K, Talma AS. 2003. Age interpretation of theWonderkrater spring sediments and vegetation change in theSavanna Biome, Limpopo province, South Africa. South AfricanJournal of Science 99: 484–488.
Scott L, Neumann FH, Brook GA et al. 2012. Terrestrial fossil-pollenevidence of climate change during the last 26 thousand years inSouthern Africa. Quaternary Science Reviews 32: 100–118 [DOI:10.1016/j.quascirev.2011.11.010].
Scott L, Woodborne S. 2007. Vegetation history inferred from pollenin Late Quaternary faecal deposits (hyraceum) in the Cape winter-rain region and its bearing on past climates in South Africa.Quaternary Science Reviews 26: 941–953 [DOI: 10.1016/j.quascirev.2006.12.012].
Singarayer JS, Burrough SL. 2015. Interhemispheric dynamics of theAfrican rainbelt during the late Quaternary. Quaternary ScienceReviews 124: 48–67 [DOI: 10.1016/j.quascirev.2015.06.021].
Telford RJ, Birks HJB. 2011. A novel method for assessing thestatistical significance of quantitative reconstructions inferred from
Copyright # 2016 John Wiley & Sons, Ltd. J. Quaternary Sci., Vol. 31(2) 143–151 (2016)
Thomas DSG, Bailey RM, Shaw PA et al. 2009. Late Quaternaryhighstands at Lake Chilwa, Malawi: frequency, timing and possibleforcing mechanisms in the last 44kas. Quaternary Science Reviews28: 526–539 [DOI: 10.1016/j.quascirev.2008.10.023].
Trabucco A, Zomer RJ. 2009. Global Aridity Index (Global-Aridity)and Global Potential Evapo-Transpiration (Global-PET) GeospatialDatabase. CGIAR Consortium for Spatial Information. Publishedonline, available from the CGIAR-CSI GeoPortal at http://www.cgiar-csi.org/.
Truc L, Chevalier M, Favier C et al. 2013. Quantification of climatechange for the last 20,000 years from Wonderkrater, South Africa:implications for the long-term dynamics of the IntertropicalConvergence Zone. Palaeogeography Palaeoclimatology Palaeoe-cology 386: 575–587 [DOI: 10.1016/j.palaeo.2013.06.024].
Tyson PD. 1986. Climatic Change and Variability in Southern Africa.Oxford University Press: Cape Town.
Tyson PD, Preston-White RA. 2000. The Weather and Climate ofSouthern Africa. Oxford University Press Southern Africa: CapeTown.
Valsecchi V, Chase BM, Slingsby JA et al. 2013. A high resolution15,600-year pollen and microcharcoal record from the CederbergMountains, South Africa. Palaeogeography Palaeoclimatology Pa-laeoecology 387: 6–16 [DOI: 10.1016/j.palaeo.2013.07.009].
Vincens A, Buchet G, Williamson D et al. 2005. A 23,000 yr pollenrecord from Lake Rukwa (8˚S, SW Tanzania): new data onvegetation dynamics and climate in Central Eastern Africa. Reviewof Palaeobotany and Palynology 137: 147–162 [DOI: 10.1016/j.revpalbo.2005.06.001].
Vincens A, Garcin Y, Buchet G. 2007. Influence of rainfall seasonal-ity on African lowland vegetation during the Late Quaternary:pollen evidence from Lake Masoko, Tanzania. Journal of Biogeog-raphy 34: 1274–1288 [DOI: 10.1111/j.1365-2699.2007.01698.x].
Wang B, Ding Q. 2008. Global monsoon: dominant mode of annualvariation in the tropics. Dynamics of Atmospheres and Oceans 44:165–183 [DOI: 10.1016/j.dynatmoce.2007.05.002].
Woodborne S, Hall G, Robertson I et al. 2015. A 1000-year carbonisotope rainfall proxy record from South African baobab trees(Adansonia digitata L.). PLOS ONE 10: e0124202 [DOI: 10.1371/journal.pone.0124202] [PubMed: 25970402].
Wu H, Guiot J, Brewer S et al. 2007. Climatic changes in Eurasia andAfrica at the last glacial maximum and mid-Holocene: reconstruc-tion from pollen data using inverse vegetation modelling. ClimateDynamics 29: 211–229 [DOI: 10.1007/s00382-007-0231-3].
Zomer RJ, Trabucco A, Bossio DA et al. 2008. Climate changemitigation: a spatial analysis of global land suitability for cleandevelopment mechanism afforestation and reforestation. Agricul-ture, Ecosystems and Environment 126: 67–80 [DOI: 10.1016/j.agee.2008.01.014].
Copyright # 2016 John Wiley & Sons, Ltd. J. Quaternary Sci., Vol. 31(2) 143–151 (2016)
DRIVERS OF ARIDITY VARIABILITY IN SOUTHERN AFRICA 151