This article was originally published in a journal published by Elsevier, and the attached copy is provided by Elsevier for the author’s benefit and for the benefit of the author’s institution, for non-commercial research and educational use including without limitation use in instruction at your institution, sending it to specific colleagues that you know, and providing a copy to your institution’s administrator. All other uses, reproduction and distribution, including without limitation commercial reprints, selling or licensing copies or access, or posting on open internet sites, your personal or institution’s website or repository, are prohibited. For exceptions, permission may be sought for such use through Elsevier’s permissions site at: http://www.elsevier.com/locate/permissionusematerial
Transcript
This article was originally published in a journal published byElsevier, and the attached copy is provided by Elsevier for the
author’s benefit and for the benefit of the author’s institution, fornon-commercial research and educational use including without
limitation use in instruction at your institution, sending it to specificcolleagues that you know, and providing a copy to your institution’s
administrator.
All other uses, reproduction and distribution, including withoutlimitation commercial reprints, selling or licensing copies or access,
or posting on open internet sites, your personal or institution’swebsite or repository, are prohibited. For exceptions, permission
may be sought for such use through Elsevier’s permissions site at:
Devonian paleomagnetism of the North Tien Shan:Implications for the middle-Late Paleozoic
paleogeography of Eurasia
Natalia M. Levashova a,⁎, Alexander V. Mikolaichuk b, Philip J.A. McCausland c,1,Mikhail L. Bazhenov a,c, Rob Van der Voo c
a Geological Institute, Academy of Sciences of Russia, Pyzhevsky Lane, 7, Moscow, 109017, Russiab Geological Institute, National Academy of Sciences, Erkendyk av., 30, Bishkek, Kyrgyzstan
c Department of Geological Sciences, University of Michigan, Ann Arbor, Michigan 48109-1005, USA
Received 15 June 2006; received in revised form 2 February 2007; accepted 14 February 2007
Editor: R.D. van der Hilst
Available online 21 February 2007
Abstract
The Ural–Mongol belt (UMB), between Siberia, Baltica and Tarim, is widely recognized as the locus of Asia's main growthduring the Paleozoic, but its evolution remains highly controversial, as illustrated by the disparate paleogeographic modelspublished in the last decade. One of the largest tectonic units of the UMB is the Kokchetav–North Tien Shan Domain (KNTD) thatstretches from Tarim in the south nearly to the West Siberian Basin. The KNTD comprises several Precambrian microcontinentsand numerous remnants of Early Paleozoic island arcs, marginal basins and accretionary complexes. In Late Ordovician time, allthese structures had amalgamated into a single contiguous domain. Its paleogeographic position is of crucial importance forelucidating the Paleozoic evolution of the UMB in general and of the Urals in particular. The Aral Formation, located inKyrgyzstan in the southern part of the KNTD, consists of a thick Upper Devonian (Frasnian) basalt–andesite sequence.Paleomagnetic data show a dual-polarity characteristic component (Dec/Inc=286° /+56°, α95=9°, k=21, N=15 sites). Theprimary origin of this magnetization is confirmed by a positive test on intraformational conglomerates. We combine this result withother Paleozoic data from the KNTD and show its latitudinal motion from the Late Ordovician to the end of the Paleozoic. Theobserved paleolatitudes are found to agree well with the values extrapolated from Baltica to a common reference point (42.5°N,73°E) in our sampling area for the entire interval; hence coherent motion of the KNTD and Baltica is strongly indicated for most ofthe Paleozoic. This finding contradicts most published models of the UMB evolution, where the KNTD is separated from Balticaby a rather wide Ural Ocean containing one or more major plate boundaries. An exception is the model of Şengör and Natal'in [A.M.C. Şengör, B.A. Natal'in, Paleotectonics of Asia: fragments of a synthesis, in: A. Yin and M. Harrison (eds.), The tectonicevolution of Asia, Cambridge University Press, Cambridge (1996) 486–640], in which coherent paleolatitudinal motion of Balticaand the KNTD is hypothesized — the latter as part of the Kipchak Arc. We suggest a parallel hypothesis, which explains coherentmotion of the KNTD and Baltica. In particular, we argue that if a basin with oceanic crust ever existed between the KNTD andBaltica, it was a narrow one without (significant) active spreading in Middle to Late Paleozoic time. Notably, the paleogeographicposition of Siberia during the Middle Paleozoic and hence, the width of the Khanty–Mansi Ocean between Siberia, on the one
Earth and Planetary Science Letters 257 (2007) 104–120www.elsevier.com/locate/epsl
Keywords: Ural–Mongol belt; Kazakhstan; paleomagnetism; paleolatitudes; Late Paleozoic; Ural Ocean
1. Introduction
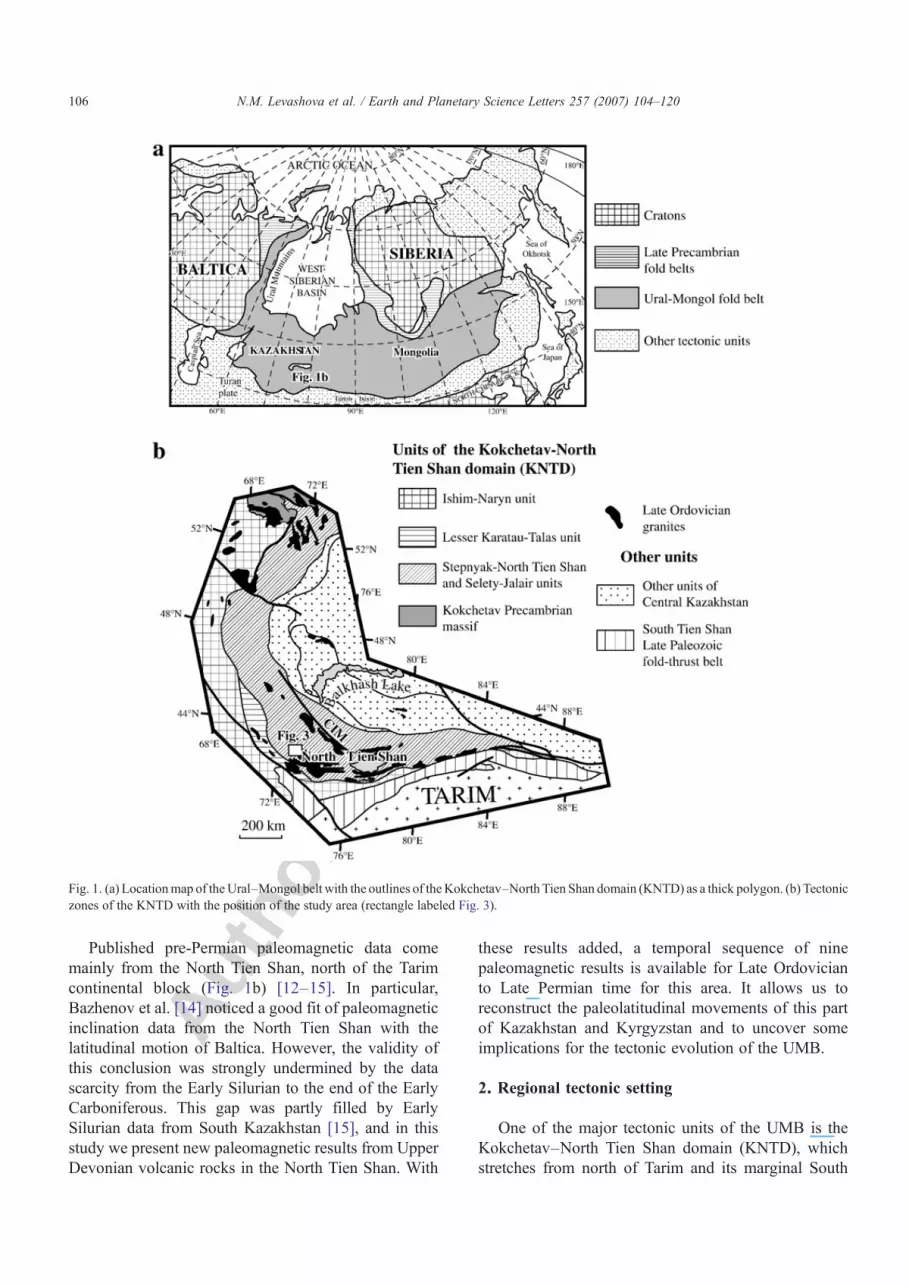
The Ural–Mongol mobile belt (UMB) stretches fornearly 10,000 km from the Arctic Ocean along the UralMountains between Europe and Asia and then onwardthroughCentralAsia to almost the Pacific (Fig. 1a). It is oneof the largest and most complex mobile belts on the Earth;moreover, its various parts differ considerably from eachother in their structural make-up. The Urals, an orogenicbelt of more than 2000 km in length (Fig. 1a), display alinear structural pattern, with long narrow sets of folded andimbricated thrusts (e.g., [2]), comparable to the larger-scaleaspects of other orogenic belts such as the RockyMountains, the Andes, or the Himalayas. The Uralscommonly containMiddle Paleozoic island-arc complexes,flysch sequences deposited in marginal seas, and ophiolitesas features of relevance to plate-tectonic interpretations.
In contrast to the Urals, the central part of the UMB,that is Kazakhstan, the Altai, and northwestern Mon-golia, has a mosaic structure (Fig. 1a). No prevailingstructural trend can be observed here. Microcontinentswith Precambrian basement are tectonically juxtaposedwith Early Paleozoic subduction-related volcanic com-plexes, accretionary wedges and flysch sequences; shorttectonic units often form T- or Y-like junctions. From theend of the Ordovician through the Permian, many strike-slip faults were active and caused the horizontalimbrication of the amalgamated island-arc segments,microcontinents and accretionary wedges. The LatePaleozoic South Tien Shan and Junggar–South Mongollinear fold-thrust belts bound this region to the south.
A number of publications have presented models forthe tectonic evolution of the UMB [1–11], and many ofthem are very dissimilar. Some authors advocate that thebelt was formed by the closure of a Paleoasian Ocean, inwhich an archipelago of scattered Precambrian micro-continents, oceanic basins and island arc segmentsexisted in the Paleozoic (Fig. 2a). The most importantrole in the amalgamation of the UMB is ascribed to thediachronous opening and closing of the interveningoceans and, therefore, to diachronous collisions ofmicrocontinents and island arcs. The mosaic structureof the central part of the UMB is assumed to have existed
early on and has therefore been called “primary” in thisset of models [3–6,10,11]. The basic concepts of suchmodels are similar, but they vary markedly in theirdetails. For instance, some models assume that mostmicrocontinents and island arcs docked to Siberia andformed a composite Siberian–Kazakhstanian continentalready in the Ordovician or Silurian [4,5,11], whereas inother models several of these units are thought to collidewith each other first, thereby forming an independentlymoving mid-Paleozoic Kazakhstanian continent [6,10].
A completely different group of models advocatesthe existence of a continuous volcanic arc system[1,2,7–9]. For instance, Şengör and Natal'in [1]assumed that there was a long continuous KipchakArc connecting the Siberian and Baltica cratons in theEarly Paleozoic (Fig. 2b). The kinematics of the arc aretherefore linked to the motions of Siberia and Baltica.Oceanic crust was subducting westward under theKipchak arc during most of the Early Paleozoic, andlarge accretionary wedges were formed. By theCarboniferous, the fragments of the ancient structurehad amalgamated into a continent-sized domain, whichfrom that time on can be called the Kazakhstaniancontinent. The other models of this group differ fromthat of Şengör and Natal'in [1] in several ways.Yakubchuk et al. [7,8] assume the existence of twoparallel island arcs, while giving a leading role to strike-slip motion and imbrications of island-arc segments.Puchkov [2] and Stampfli and Borel [9] suggest that inthe Early Paleozoic the island arc had a rathercomplicated configuration, but they do not ascribe animportant role to strike-slip motions.
The fact that so many dissimilar models can co-existmeans that we lack major knowledge about thepaleogeography and kinematics of the UMB constitu-ents. Thus, our views on the formation of the Eurasiansupercontinent are very preliminary at best. Such asituation is largely due to the scarcity and often poorquality of paleomagnetic data from the region. Were aframework of abundant paleomagnetic results fromrocks of different ages and different tectonic units of theUMB available, more stringent constraints on thetectonic evolution of the whole belt could be imposed.
105N.M. Levashova et al. / Earth and Planetary Science Letters 257 (2007) 104–120
Published pre-Permian paleomagnetic data comemainly from the North Tien Shan, north of the Tarimcontinental block (Fig. 1b) [12–15]. In particular,Bazhenov et al. [14] noticed a good fit of paleomagneticinclination data from the North Tien Shan with thelatitudinal motion of Baltica. However, the validity ofthis conclusion was strongly undermined by the datascarcity from the Early Silurian to the end of the EarlyCarboniferous. This gap was partly filled by EarlySilurian data from South Kazakhstan [15], and in thisstudy we present new paleomagnetic results from UpperDevonian volcanic rocks in the North Tien Shan. With
these results added, a temporal sequence of ninepaleomagnetic results is available for Late Ordovicianto Late Permian time for this area. It allows us toreconstruct the paleolatitudinal movements of this partof Kazakhstan and Kyrgyzstan and to uncover someimplications for the tectonic evolution of the UMB.
2. Regional tectonic setting
One of the major tectonic units of the UMB is theKokchetav–North Tien Shan domain (KNTD), whichstretches from north of Tarim and its marginal South
Fig. 1. (a) Locationmap of the Ural–Mongol belt with the outlines of the Kokchetav–North Tien Shan domain (KNTD) as a thick polygon. (b) Tectoniczones of the KNTD with the position of the study area (rectangle labeled Fig. 3).
106 N.M. Levashova et al. / Earth and Planetary Science Letters 257 (2007) 104–120
Tien Shan fold belt to the Kokchetav massif in the north(Fig. 1). This domain is located in the central part ofKazakhstan and in the north of Kyrgyzstan, and has aboomerang-like shape, with a nearly N–S trendingnorthern arm and an E–W trending southern one. TheKNTD comprises Precambrian microcontinentsand Early Paleozoic island-arc volcanic rocks, flysch
sequences, and marine sedimentary basins that hadassembled and were intruded by numerous graniteplutons by the end of Ordovician time.
Four more or less parallel tectonic zones (called“units” in Fig. 1b) can be recognized in the KNTD ([16],and references therein). The westernmost Ishim–Naryn zone extends over nearly 2000 km from North
Fig. 2. Palinspastic reconstructions of the Ural–Mongol belt: (a) after Didenko et al. [5], depicting Early Ordovician time; (b) after Şengör andNatal'in [1], depicting Middle Ordovician time. Both reconstructions are simplified.
107N.M. Levashova et al. / Earth and Planetary Science Letters 257 (2007) 104–120
Kazakhstan to the central Tien Shan. Neoproterozoic(upper Riphean) rhyolites and bimodal rhyolite–basaltseries at the section's base are overlain by Cryogenian–Ediacaran (=Vendian) to Cambrian sediments, mainlyblack shale. One or two members of glaciomarinediamictites are often present in the Vendian part of thesection, and some limestone horizons and lenses top theCambrian section. The early-Middle Ordovician part ofthe section is mainly terrigenous, whereas the LateOrdovician is represented by flysch and, locally,volcanic rocks of island-arc affinity. On the whole, thePrecambrian–Early Paleozoic sections are very similaralong the entire zone ([16], and references therein)testifying to its continuity at least since the Vendian.
In the Lesser Karatau–Talas zone (Fig. 1b), theNeoproterozoic (Upper Riphean) carbonates and clasticsare overlain by Cryogenian–Ediacaran redbeds withsilicic tuffs and Cambrian to Middle Ordoviciancarbonates. Diamictite horizons are also known fromthe Cryogenian of this zone.
Farther to the east there are the Stepnyak–North TienShan and Selety–Jalair zones (Fig. 1b). Precambrianblocks of various size, covered by relatively thinEdiacaran–Cambrian sediments, are tectonically juxta-posed with Cambrian–Ordovician island-arc com-plexes, ophiolites and flysch. In the Stepnyak–NorthTien Shan zone, subduction-related Llandeilian to
Middle Caradocian volcanic rocks are replaced byupper Caradocian–Ashgillian mostly terrigenous rocks.To the east, in the Selety–Jalair zone, the middle-LateOrdovician section is represented by flysch and coarse-grained terrigenous rocks.
Most of the KNTD was deformed at the end of theLate Ordovician ([16], and references therein), at thesame time that numerous granites were intrudedthroughout the domain (black patches in Fig. 1b).These intrusions stitch different zones; hence, at leastsince that time, this domain can be regarded as a singletectonic unit. From the Silurian until the end of thePaleozoic, Early Paleozoic complexes of this domainconstituted the basement for Andean-type convergent-plate boundary activity ([16], and references therein).Subduction-related volcano-sedimentary complexes ofSilurian–Permian age are also deformed. Moreover,different parts of the KNTD may have been displacedwith respect to each other along strike-slip faults. Post-Ordovician displacements, however, did not disrupt theoverall integrity of this domain. Therefore, since theLate Ordovician, the KNTD can be considered as asingle block, although not necessarily a rigid one.
The North Tien Shan (NTS) sensu stricto is located inthe south of the Stepnyak–North Tien Shan zone (Fig. 1b).It trends E–Wparallel to the present range for about 500 kmin North Kyrgyzstan and South Kazakhstan. In the NTS,
Fig. 3. Geological map of the Aral area on the southern slope of the Kyrgyz Range, North Tien Shan (Kyrgyzstan) with the position of the samplinglocality of the Upper Devonian Aral Formation (star).
108 N.M. Levashova et al. / Earth and Planetary Science Letters 257 (2007) 104–120
shelf and continental slope complexes of Precambrian agecrop out as disrupted blocks and their original relationshipsare unclear. Cambrian to Lower Arenigian rocks includesubduction-related volcanic rocks, marginal basin deposits,rift-related sediments, and passive margin sedimentarywedges, which are regarded as the remnants of a basin withoceanic crust [17]. The closing of this basin by early-MiddleArenigian time resulted in thrusting and deformation of allolder complexes and intrusion of granites.
Middle Arenigian conglomerate and olistostromesoverlap the Cambrian to Early Arenigian complexeswith a major angular unconformity [17]. A thick pile ofdifferentiated volcanic rocks of Late Arenigian to EarlyCaradocian age accumulated in the northern and central
parts of the NTS; this series is considered an equivalentof modern active continental margins [18]. Along thesouthern boundary of the NTS, volcanic rocks arereplaced by terrigenous and volcano-clastic rocks ofsimilar ages, which are conformably covered by UpperOrdovician red sandstones and siltstones with limestoneinterbeds. The sequence is intruded by numerous largegranite plutons during the Late Ordovician, and smallerbodies of granite were emplaced in the Silurian [17].Due to the lack of Silurian rocks in most of the NTS, theage of deformation here cannot be defined better than aspre-Early Devonian.
Devonian mafic and felsic subaerial volcanic rocksreside with a major unconformity on lower Paleozoic
Fig. 4. Representative thermal demagnetization plots of the Upper Devonian volcanic rocks in stratigraphic coordinates. Full (open) dots representvector endpoints projected onto the horizontal (N–S vertical) plane. Temperature steps are in degrees Celsius. Magnetization intensities are in mA/m.For clarity, NRM points are omitted from some plots.
109N.M. Levashova et al. / Earth and Planetary Science Letters 257 (2007) 104–120
rocks and are themselves overlain conformably or withslight unconformity by upper Visean to lower Bashkir-ian (i.e., mostly Lower Carboniferous) redbeds in theNorth Tien Shan [17]. All the pre-Permian complexesare overlain by Early Permian volcanic rocks either withan unconformity or with disconformity and basalconglomerates. A prominent angular unconformitybetween Permian and Lower Jurassic rocks indicatesstrong deformation in the latest Paleozoic and/orTriassic. Finally, the entire Tien Shan was affected byLate Cenozoic deformation. It should be stressed thatthe intensities of deformation events vary laterally, and itis often difficult to evaluate the relative magnitude ofeach separate deformation at a given locality.
3. Geologic description of the study area and sampling
Our study concentrated on the southern slope of theKyrgyz range, where a thick volcano-sedimentarysequence is exposed (Fig. 3). These volcanic rocks aregently dipping in the west and south but more intensefault-related deformation is observed farther to the east
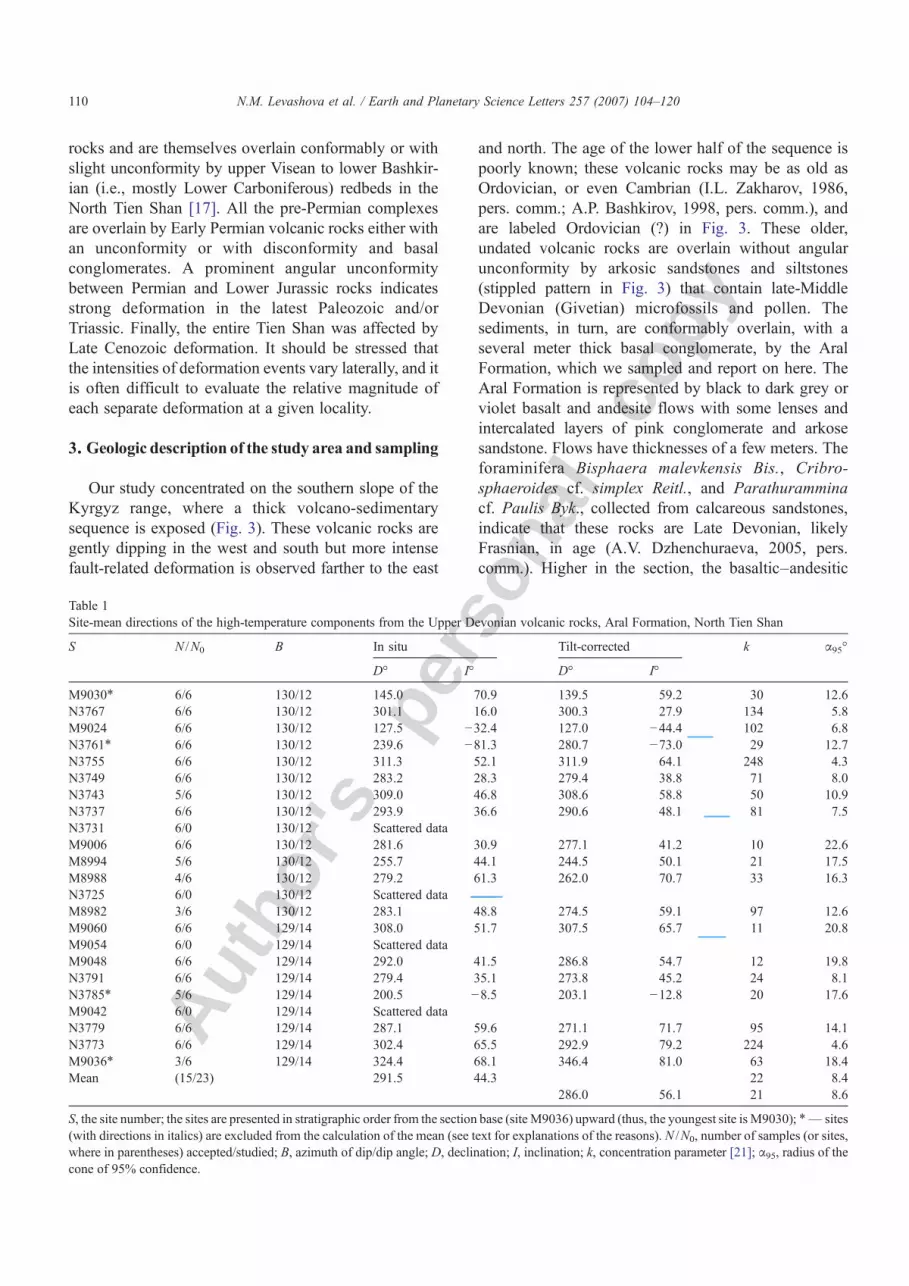
and north. The age of the lower half of the sequence ispoorly known; these volcanic rocks may be as old asOrdovician, or even Cambrian (I.L. Zakharov, 1986,pers. comm.; A.P. Bashkirov, 1998, pers. comm.), andare labeled Ordovician (?) in Fig. 3. These older,undated volcanic rocks are overlain without angularunconformity by arkosic sandstones and siltstones(stippled pattern in Fig. 3) that contain late-MiddleDevonian (Givetian) microfossils and pollen. Thesediments, in turn, are conformably overlain, with aseveral meter thick basal conglomerate, by the AralFormation, which we sampled and report on here. TheAral Formation is represented by black to dark grey orviolet basalt and andesite flows with some lenses andintercalated layers of pink conglomerate and arkosesandstone. Flows have thicknesses of a few meters. Theforaminifera Bisphaera malevkensis Bis., Cribro-sphaeroides cf. simplex Reitl., and Parathuramminacf. Paulis Byk., collected from calcareous sandstones,indicate that these rocks are Late Devonian, likelyFrasnian, in age (A.V. Dzhenchuraeva, 2005, pers.comm.). Higher in the section, the basaltic–andesitic
Table 1Site-mean directions of the high-temperature components from the Upper Devonian volcanic rocks, Aral Formation, North Tien Shan
S, the site number; the sites are presented in stratigraphic order from the section base (siteM9036) upward (thus, the youngest site is M9030); ⁎— sites(with directions in italics) are excluded from the calculation of the mean (see text for explanations of the reasons). N /N0, number of samples (or sites,where in parentheses) accepted/studied; B, azimuth of dip/dip angle; D, declination; I, inclination; k, concentration parameter [21]; α95, radius of thecone of 95% confidence.
110 N.M. Levashova et al. / Earth and Planetary Science Letters 257 (2007) 104–120
Aral Formation is capped by Upper Devonian silicicvolcanic rocks (not sampled). No younger rocks overlieDevonian rocks in this area.
The total thickness of the Aral Formation section isabout 1100–1200 m; however, the upper two-thirds ofthe section crop out on steep slopes and are difficult toaccess. The lower 400 m thick interval that was studiedstarts from the contact with underlying arkoses andcomprises numerous basalt and andesite flows withseveral thin sedimentary intercalations and two up to10 m thick conglomerate beds. We sampled 23 flows(sites) that are spread approximately uniformly acrossthe studied interval; more than ten cooling units from thesame interval were skipped because of fracturing, strongweathering, or poor quality of exposure. Six handsamples oriented with a magnetic compass were takenfrom each flow. The studied section is a gentlemonocline dipping to the ESE at 10 to 12°. The age ofthe tilting of this section, or of other sections in the area(Fig. 3), is not known and may be as young as LateCenozoic. This invalidates a fold test. We could not findbasaltic or andesite pebbles, so sampled 16 rhyoliticclasts from two intraformational conglomerate horizonsin the upper third of the sampled interval.
4. Paleomagnetic study
4.1. Methods
The collection was studied in the paleomagneticlaboratory of the Geological Institute of the Rus-sian Academy of Science in Moscow. Cubic specimens
of 8-cm3 volume were sawed from hand blocks. Onespecimen from each hand-sample was stepwise demag-netized in 15–20 increments up to 685 °C in a home-made oven with internal residual fields of approximately10 nT and measured with a JR-4 spinner magnetometerwith a noise level of 0.05 mA/m−1. Demagnetizationresults were plotted on orthogonal vector diagrams [19],and linear trajectories were used to determine directionsof magnetic components by a least-squares fit compris-ing three or more measurements [20]. The characteristicremanent magnetization, ChRM, was determined with-out anchoring the final linear segments to the origin ofthe vector diagrams. Components isolated from sampleswere used to calculate site-means [21]. In some cases,when identification of remagnetization circles was morereliable than that of component directions, these circleswere combined with direct observations as suggested by[22]. Paleomagnetic software written by Randy Enkinand Stanislav V. Shipunov for the IBM PC and by Jean-Pascal Cogné for the Macintosh [23] was used in theanalysis.
4.2. Paleomagnetic results
The intensity of natural remanent magnetization(NRM) ranges from 0.01 to 6 A/m in the Aral Formationvolcanic rocks. The NRM intensity does not varysignificantly within a flow but may differ by one or twoorders of magnitude between flows.
A low-temperature component, LTC, is usually re-moved below 300 °C in most samples, after which a singlecharacteristic component (ChRM) could be isolated
Fig. 5. Stereoplots of ChRM site-mean directions from the main cluster with associated 95% confidence circles (thin lines) of the Upper Devonianvolcanic rocks of the Aral Formation from the North Tien Shan in (a) geographic (IS = in situ) and (b) stratigraphic (TC = tilt-corrected) coordinates.The star with its associated 95% confidence circle (thick line) is the overall mean direction of the ChRM and the inverted triangle is the in-situ mean ofthe low-temperature component. (a–b) Only the directions used to calculate the paleopole have been plotted. Solid (open) symbols and solid (dashed)lines are projected onto the lower (upper) hemisphere.
111N.M. Levashova et al. / Earth and Planetary Science Letters 257 (2007) 104–120
Autho
r's
pers
onal
co
py
(Fig. 4a–c). In other samples, the low-temperaturecomponent, LTC, is more dominant and, sometimes, mayaccount for more than 90% of the total NRM intensity(Fig. 4d). LTC directions are reasonably grouped at all sitesbut one, and its overall mean direction (D=2°, I=61°,α95=3°) is close to the present-day dipole field (D=0°,I=62°) in the area. Despite the presence of this strong LTC,the ChRM could still be isolated in most cases.
In four flows out of 23 sampled, the ChRM is veryscattered at the within-site level; these sites with α95N25°were excluded from consideration. For sites M9030,N3761, and N3785, the ChRM's are reasonably wellclustered at the site level, but the corresponding site-meandirections deviate significantly from the overall mean(italicized in Table 1). The demagnetization character-istics of these sites (Fig. 4f, g) are similar to those of the
main cluster (Fig. 4a–e). We hypothesize that theanomalous site-mean directions are due to the behaviorof the geomagnetic field and not, for instance, tounresolved overprinting. The mean at site M9036 isbased only on component directions from two samplesand one remagnetization circle; in addition, thecorresponding confidence circle overlaps the LTC overallmean direction. We doubt the reliability of M9036 site-mean and exclude it from analysis.
The remaining downward site-mean directions ofnormal polarity form a cluster (Fig. 5), with one additionalsite-mean direction of opposite polarity (Figs. 4e and 5).The studied section is monoclinal, so a fold test could notbe applied (Fig. 5a, b; Table 1).
After removal of a weak low-temperature remanence aChRM that decayed to the origin was isolated from all
Fig. 6. (a–c) Representative thermal demagnetization plots of volcanic cobbles in intercalated conglomerates within the Upper Devonian volcanicsequence, in stratigraphic coordinates. (d) Stereoplot of ChRM directions of the same in stratigraphic coordinates. Other explanations as in Figs. 4 and 5.
112 N.M. Levashova et al. / Earth and Planetary Science Letters 257 (2007) 104–120
volcanic clasts from the intraformational conglomerates(Fig. 6a–c). The ChRM directions are randomly distrib-uted (Fig. 6d), and the normalized vector-resultantR=0.17 is much less than the critical value of 0.40 [24].Therefore, the conglomerate test is positive.
As stated above, the section examined is comprised ofandesite and basalt flows, whereas the intraformationalconglomerates contain well-rounded cobbles of mostlysilicic volcanic rocks. This means that despite accumu-lation of the conglomerates during hiatuses betweeneruptions of basic lava flows, the latter have not beeneroding, and the cobbles were derived from other nearbycomplexes. Demagnetization properties of mafic volcanicrocks (Fig. 4) and acidic flows (Fig. 6a–c) are similar, andno common directional component can be isolated fromthe cobbles. Thus it is unlikely that all host rocks wereremagnetized, while the cobbles in the conglomerateswere not even slightly affected. It is more likely that thecobbles in the conglomerates preserved a primarymagnetization, and that the ChRM of host rocks is alsoof primary origin.
The ChRM in host volcanics (Fig. 4b,e) and cobbles(Fig. 6a,c) resides in both magnetite and hematite invarying proportions, but its directions do not depend onmagnetic mineralogy. Such a pattern is likely to be due tohigh-temperature oxidation during emplacement ofvolcanic units and before conglomerate accumulation,indicating a primary nature of magnetizations [25].
Fifteen accepted sites span the studied part of thesection of about 400m in thickness (Table 1) that includesmore than thirty flows with some layers of fine-grained
sediments and conglomerate and most probably wasaccumulating long enough for secular variation to beadequately averaged. The conglomerate test is positive,and the magnetization of opposite polarity in one site isantipodal to that of the fourteen other sites either above orbelow it. We can conclude that the studied magnetizationis of primary origin, and argue that the overall meandirection in the studied rocks is an accurate estimate of theancient Late Devonian geomagnetic field.
4.3. Other paleomagnetic data from the KNTD
The tectonic evolution of the North Tien Shan zoneand, on a broader scale, of the entire KNTD is verycomplicated and poorly understood prior to the LateOrdovician [17]. As mentioned above, the KNTD can beregarded as a coherent unit only since that time. Thus, welimit our analysis to the interval from the Late Ordovicianto the Late Permian. Three paleomagnetic studies,previously published since the early 1990's, report resultsfor Paleozoic rocks from the North Tien Shan (8 useablepoles, Table 2).
Red beds from the western part of this area yield LateOrdovician (Middle Caradocian, Late Caradocian andAshgillian) and early-Middle Carboniferous (Visean–Serpukhovian and Bashkirian) primary magnetizations[14]; in addition, prefolding secondary components, ofpresumably Late Permian age, could be isolated (Fig. 7,Table 2).
Paleomagnetic data from Lower Silurian and UpperSilurian–Lower Devonian redbeds from the Chu–IliMountains (CIM in Fig. 1b) were published by Alexyutinet al. [15]. As seven sites out of eight studied are fromLower Silurian rocks and only one is from the youngerstrata, we excluded the latter and calculated an EarlySilurian direction (Table 2).
A result from Early Devonian redbeds [12] is based onstepwise thermal demagnetization; however, the finalcomponent was not always well-isolated judging by theorthogonal plots presented in the paper. The fold test ispositive on a regional scale, but the authors had to combineseveral small collections (about 10 samples each) fromdifferent parts of the North Tien Shan. On the other hand,two clusters of normal and reversed polarity are antipodaland yield a positive reversal test. This could be taken toindicate a primary origin of the magnetization. Withreservation, we included this result in our analysis.
Burtman et al. [13] published a study of UpperDevonian redbeds from the North Tien Shan. Theyregarded an intermediate temperature component, whichclearlymisses the origin, as the primary one and used it fortectonic interpretations. This intermediate component is
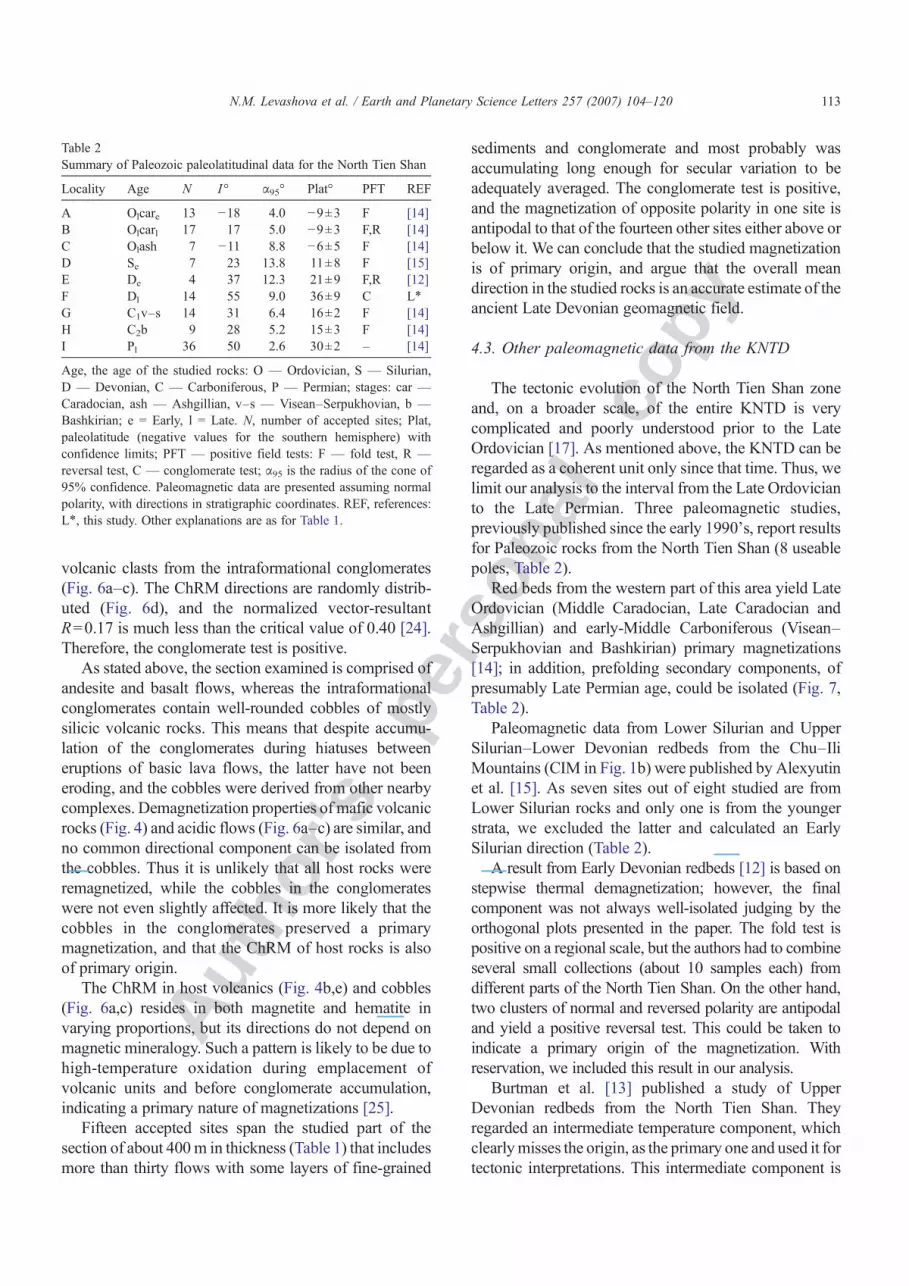
Table 2Summary of Paleozoic paleolatitudinal data for the North Tien Shan
Locality Age N I ° α95° Plat° PFT REF
A Olcare 13 −18 4.0 −9±3 F [14]B Olcarl 17 17 5.0 −9±3 F,R [14]C Olash 7 −11 8.8 −6±5 F [14]D Se 7 23 13.8 11±8 F [15]E De 4 37 12.3 21±9 F,R [12]F Dl 14 55 9.0 36±9 C L⁎
G C1v–s 14 31 6.4 16±2 F [14]H C2b 9 28 5.2 15±3 F [14]I Pl 36 50 2.6 30±2 – [14]
Age, the age of the studied rocks: O — Ordovician, S — Silurian,D — Devonian, C — Carboniferous, P — Permian; stages: car —Caradocian, ash — Ashgillian, v–s — Visean–Serpukhovian, b —Bashkirian; e = Early, l = Late. N, number of accepted sites; Plat,paleolatitude (negative values for the southern hemisphere) withconfidence limits; PFT — positive field tests: F — fold test, R —reversal test, C — conglomerate test; α95 is the radius of the cone of95% confidence. Paleomagnetic data are presented assuming normalpolarity, with directions in stratigraphic coordinates. REF, references:L⁎, this study. Other explanations are as for Table 1.
113N.M. Levashova et al. / Earth and Planetary Science Letters 257 (2007) 104–120
prefolding, but this is not decisive in this particular case asseveral folding events affected the study area. Because nohigh temperature component was isolated and discussed,we did not use this result.
Reported thus far only in abstract form [26] is aMiddle Devonian result from the Kurgasholak Forma-tion in the North Tien Shan, about 300 km to the ESEfrom our Aral Formation locality. We have not includedthis result in Table 2, because it is not yet peer reviewed.However, we note that the directions from the twoformations are rather similar. The Kurgasholak Forma-tion yields a dual-polarity magnetization Dec/Inc=286° /+46°, α95=7.8°, k=29, N=13 sites, com-
pared to the Aral Formation result with Dec/Inc=286° /+56°, α95=9°, k=21, N=15 sites.
There are no Late Ordovician to Permian paleomag-netic results based on adequate demagnetization andcomponent analysis from the central and northern partsof the KNTD. Nevertheless, many geologic features canbe traced all the way along this domain; as discussedabove, there is geologic evidence that all four KNTDunits shown in Fig. 1b were amalgamated by the endof the Ordovician. It seems permissible to apply thepaleogeographic implications from our new Devo-nian paleopole to the entire KNTD, but we also notethat if this assumption is wrong, it does not alter our
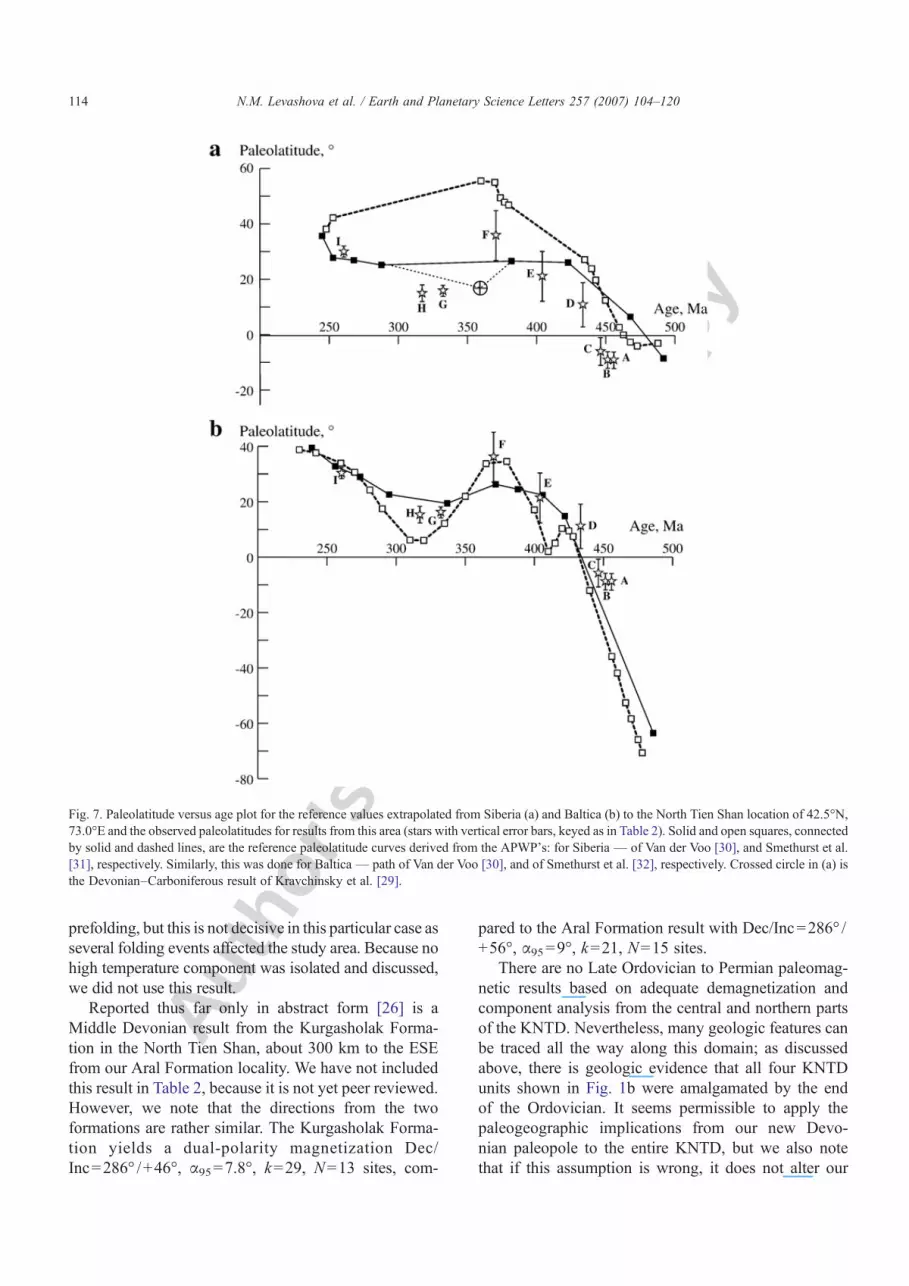
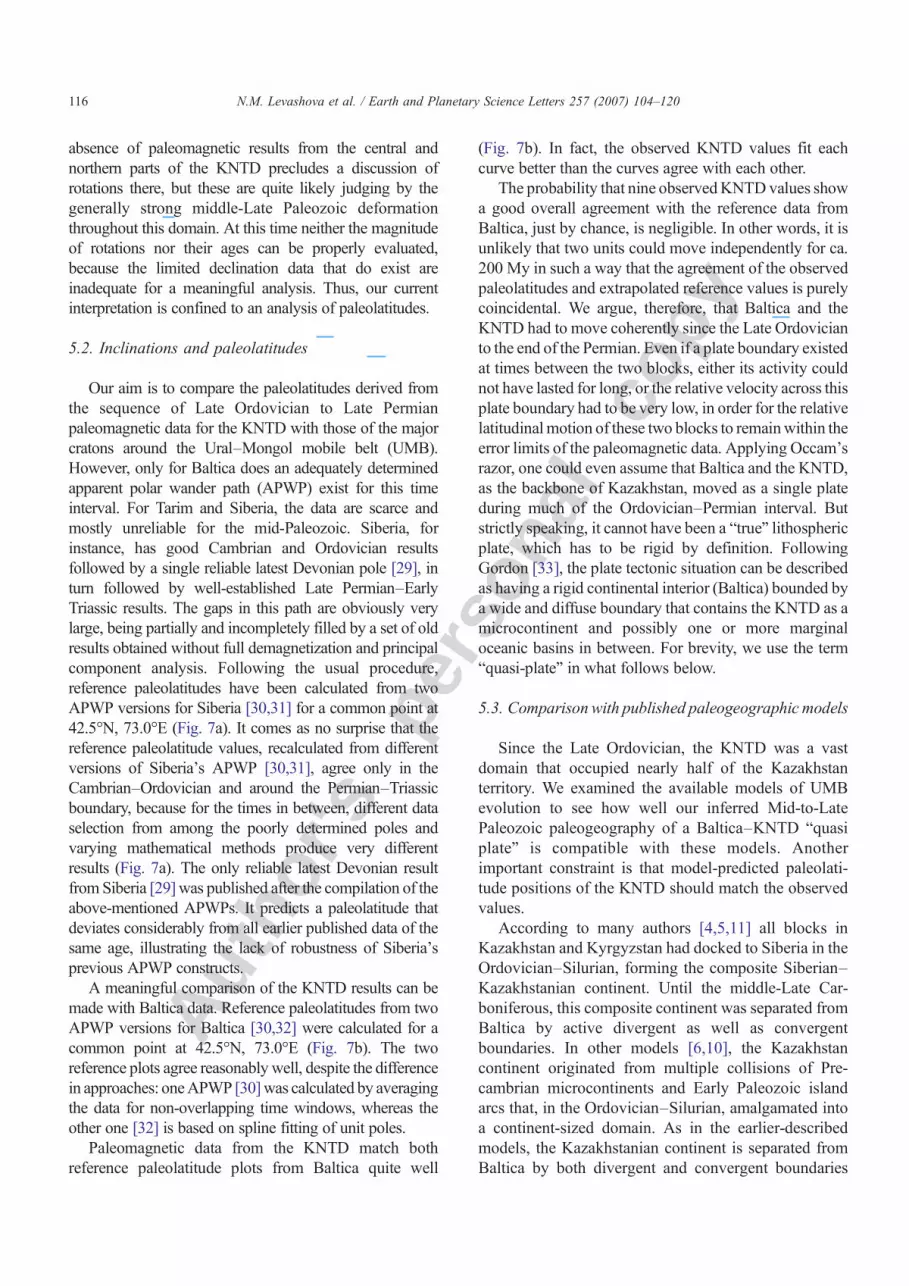
Fig. 7. Paleolatitude versus age plot for the reference values extrapolated from Siberia (a) and Baltica (b) to the North Tien Shan location of 42.5°N,73.0°E and the observed paleolatitudes for results from this area (stars with vertical error bars, keyed as in Table 2). Solid and open squares, connectedby solid and dashed lines, are the reference paleolatitude curves derived from the APWP's: for Siberia — of Van der Voo [30], and Smethurst et al.[31], respectively. Similarly, this was done for Baltica — path of Van der Voo [30], and of Smethurst et al. [32], respectively. Crossed circle in (a) isthe Devonian–Carboniferous result of Kravchinsky et al. [29].
114 N.M. Levashova et al. / Earth and Planetary Science Letters 257 (2007) 104–120
conclusions for the sampling areas of the North TienShan sensu stricto.
5. Interpretation and discussion
5.1. Declinations and rotations
All paleomagnetic data (Table 2) are from the southernpart of the boomerang-shapedKNTD (Fig. 1b). This area inthe North Tien Shan has suffered several deformationevents, the latest of which was in the Late Permian to Early
Triassic and involved significant but variable counterclock-wise rotations [27]. These rotations sometimes occurred ona local scale and are best interpreted as having been causedby major strike-slip faults crossing the region. Earlierphases of clockwise as well as counterclockwise rotationshave been documented [28], and paleomagnetic data ofsimilar age showmuch larger variations in declination thanin inclination, resulting in banana-type or girdle distribu-tions of directions. For instance, Late Ordovician declina-tions from three different formations in the western part oftheNorth Tien Shan zone differ by asmuch as 60° [14]. The
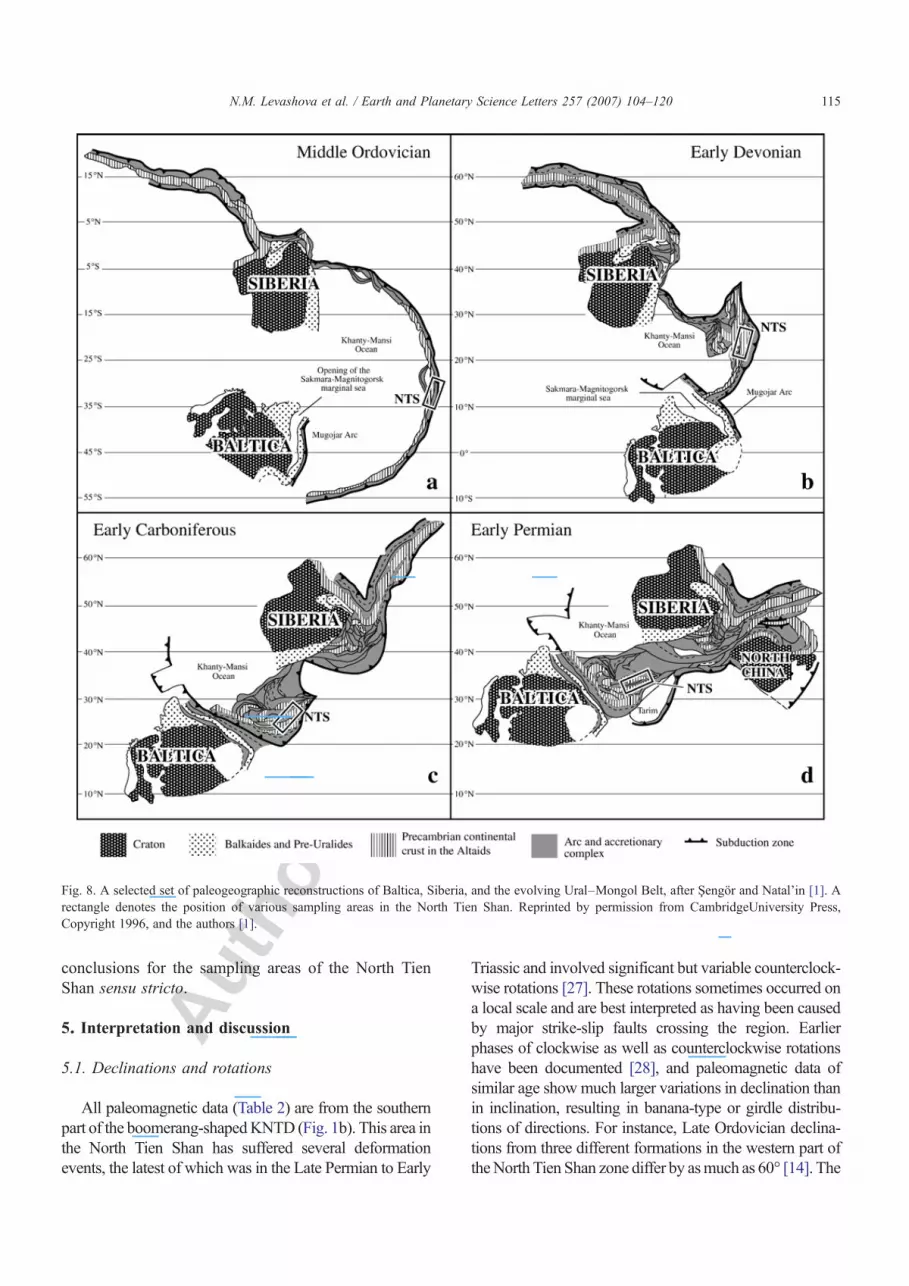
Fig. 8. A selected set of paleogeographic reconstructions of Baltica, Siberia, and the evolving Ural–Mongol Belt, after Şengör and Natal'in [1]. Arectangle denotes the position of various sampling areas in the North Tien Shan. Reprinted by permission from CambridgeUniversity Press,Copyright 1996, and the authors [1].
115N.M. Levashova et al. / Earth and Planetary Science Letters 257 (2007) 104–120
absence of paleomagnetic results from the central andnorthern parts of the KNTD precludes a discussion ofrotations there, but these are quite likely judging by thegenerally strong middle-Late Paleozoic deformationthroughout this domain. At this time neither the magnitudeof rotations nor their ages can be properly evaluated,because the limited declination data that do exist areinadequate for a meaningful analysis. Thus, our currentinterpretation is confined to an analysis of paleolatitudes.
5.2. Inclinations and paleolatitudes
Our aim is to compare the paleolatitudes derived fromthe sequence of Late Ordovician to Late Permianpaleomagnetic data for the KNTD with those of the majorcratons around the Ural–Mongol mobile belt (UMB).However, only for Baltica does an adequately determinedapparent polar wander path (APWP) exist for this timeinterval. For Tarim and Siberia, the data are scarce andmostly unreliable for the mid-Paleozoic. Siberia, forinstance, has good Cambrian and Ordovician resultsfollowed by a single reliable latest Devonian pole [29], inturn followed by well-established Late Permian–EarlyTriassic results. The gaps in this path are obviously verylarge, being partially and incompletely filled by a set of oldresults obtained without full demagnetization and principalcomponent analysis. Following the usual procedure,reference paleolatitudes have been calculated from twoAPWP versions for Siberia [30,31] for a common point at42.5°N, 73.0°E (Fig. 7a). It comes as no surprise that thereference paleolatitude values, recalculated from differentversions of Siberia's APWP [30,31], agree only in theCambrian–Ordovician and around the Permian–Triassicboundary, because for the times in between, different dataselection from among the poorly determined poles andvarying mathematical methods produce very differentresults (Fig. 7a). The only reliable latest Devonian resultfrom Siberia [29]was published after the compilation of theabove-mentioned APWPs. It predicts a paleolatitude thatdeviates considerably from all earlier published data of thesame age, illustrating the lack of robustness of Siberia'sprevious APWP constructs.
A meaningful comparison of the KNTD results can bemade with Baltica data. Reference paleolatitudes from twoAPWP versions for Baltica [30,32] were calculated for acommon point at 42.5°N, 73.0°E (Fig. 7b). The tworeference plots agree reasonably well, despite the differencein approaches: oneAPWP [30]was calculated by averagingthe data for non-overlapping time windows, whereas theother one [32] is based on spline fitting of unit poles.
Paleomagnetic data from the KNTD match bothreference paleolatitude plots from Baltica quite well
(Fig. 7b). In fact, the observed KNTD values fit eachcurve better than the curves agree with each other.
The probability that nine observedKNTDvalues showa good overall agreement with the reference data fromBaltica, just by chance, is negligible. In other words, it isunlikely that two units could move independently for ca.200 My in such a way that the agreement of the observedpaleolatitudes and extrapolated reference values is purelycoincidental. We argue, therefore, that Baltica and theKNTD had to move coherently since the Late Ordovicianto the end of the Permian. Even if a plate boundary existedat times between the two blocks, either its activity couldnot have lasted for long, or the relative velocity across thisplate boundary had to be very low, in order for the relativelatitudinalmotion of these two blocks to remainwithin theerror limits of the paleomagnetic data. Applying Occam'srazor, one could even assume that Baltica and the KNTD,as the backbone of Kazakhstan, moved as a single plateduring much of the Ordovician–Permian interval. Butstrictly speaking, it cannot have been a “true” lithosphericplate, which has to be rigid by definition. FollowingGordon [33], the plate tectonic situation can be describedas having a rigid continental interior (Baltica) bounded bya wide and diffuse boundary that contains the KNTD as amicrocontinent and possibly one or more marginaloceanic basins in between. For brevity, we use the term“quasi-plate” in what follows below.
5.3. Comparisonwith published paleogeographic models
Since the Late Ordovician, the KNTD was a vastdomain that occupied nearly half of the Kazakhstanterritory. We examined the available models of UMBevolution to see how well our inferred Mid-to-LatePaleozoic paleogeography of a Baltica–KNTD “quasiplate” is compatible with these models. Anotherimportant constraint is that model-predicted paleolati-tude positions of the KNTD should match the observedvalues.
According to many authors [4,5,11] all blocks inKazakhstan and Kyrgyzstan had docked to Siberia in theOrdovician–Silurian, forming the composite Siberian–Kazakhstanian continent. Until the middle-Late Car-boniferous, this composite continent was separated fromBaltica by active divergent as well as convergentboundaries. In other models [6,10], the Kazakhstancontinent originated from multiple collisions of Pre-cambrian microcontinents and Early Paleozoic islandarcs that, in the Ordovician–Silurian, amalgamated intoa continent-sized domain. As in the earlier-describedmodels, the Kazakhstanian continent is separated fromBaltica by both divergent and convergent boundaries
116 N.M. Levashova et al. / Earth and Planetary Science Letters 257 (2007) 104–120
until the middle-Late Carboniferous and was movingindependently from all other plates. Other authors alsoregard Kazakhstan as an independently moving conti-nental plate [2,9]. As examples of the paleogeographicimplications of these scenarios, we note that the distancebetween the North Tien Shan and the southern Urals'margin of Baltica changes from about 4000 km in theEarly Devonian to about 2400 km in the MiddleDevonian to about 1700 km in the Late Devonian inthe reconstructions of Filippova et al. [6]. For the samethree times, the maps of Stampfli and Borel [9] locateKazakhstan about 6000 km, then 5300 km, and then3600 km removed from the southern Uralian margin ofBaltica, where eventually Kazakhstanian elements willcollide. Clearly, the above models do not agree with ourobservations, neither in terms of predicted paleolatitudesnor in their coherency with the values extrapolated from
Baltica, which suggest a more or less constantseparation for much of the Paleozoic.
Only one model [1] is approximately compatiblewith the observed data. The paleolatitudes for the NorthTien Shan (NTS in Fig. 8), as read from the palinspasticmaps by these authors, generally agree with thereference paleolatitudes for Baltica, as well as with theobserved paleomagnetic data (compare Figs. 7b and 8).It is interesting to note that another scenario [7], whichalso envisages complex deformation of an island arcsystem between Baltica and Siberia, does not fit theobserved paleolatitudes.
However, the reasons for such a good fit betweenmodel-based and observed values in the model ofŞengör and Natal'in [1] are not self-evident. In theirmaps, one significant plate boundary is shown betweenthe KNTD and Baltica for the entire Silurian and
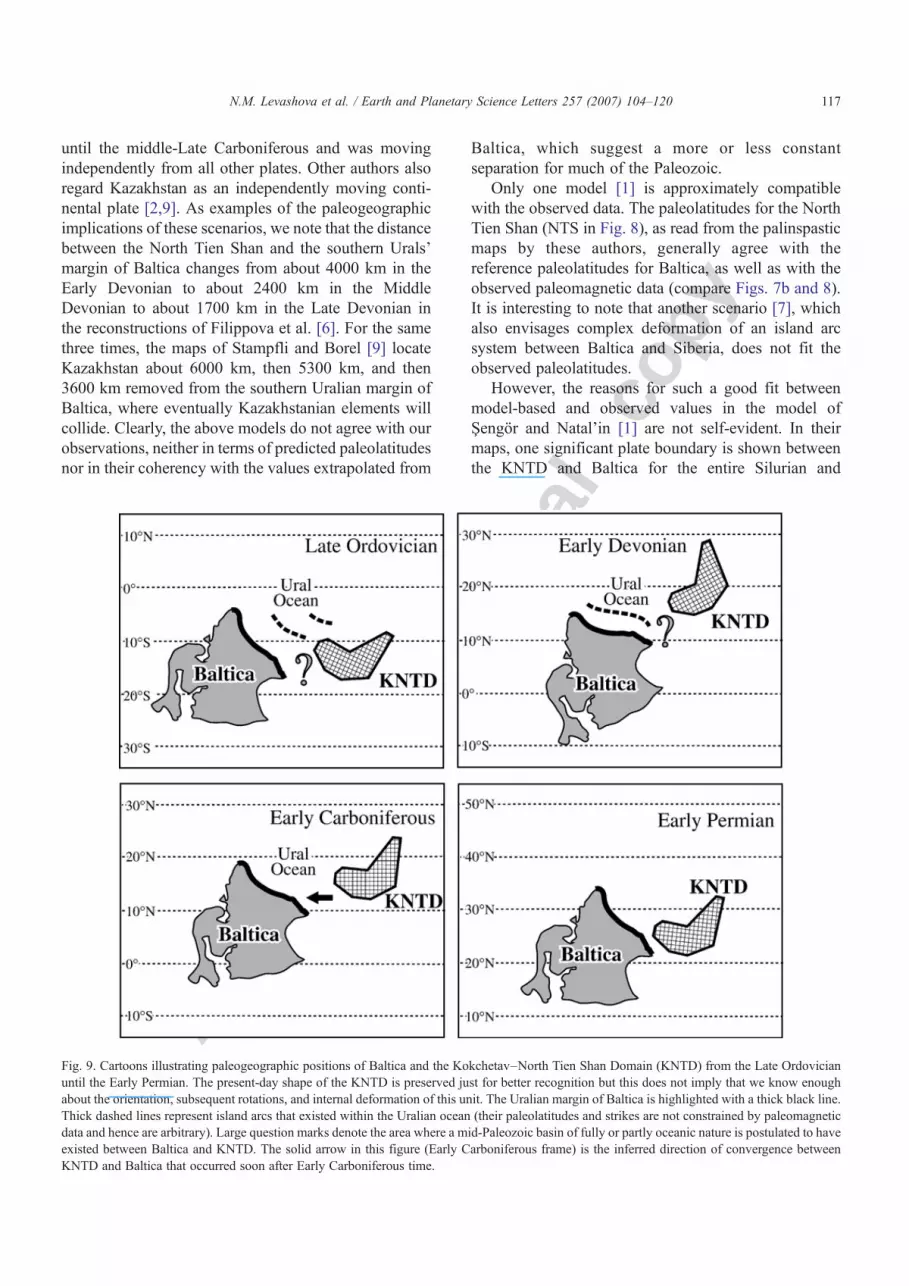
Fig. 9. Cartoons illustrating paleogeographic positions of Baltica and the Kokchetav–North Tien Shan Domain (KNTD) from the Late Ordovicianuntil the Early Permian. The present-day shape of the KNTD is preserved just for better recognition but this does not imply that we know enoughabout the orientation, subsequent rotations, and internal deformation of this unit. The Uralian margin of Baltica is highlighted with a thick black line.Thick dashed lines represent island arcs that existed within the Uralian ocean (their paleolatitudes and strikes are not constrained by paleomagneticdata and hence are arbitrary). Large question marks denote the area where a mid-Paleozoic basin of fully or partly oceanic nature is postulated to haveexisted between Baltica and KNTD. The solid arrow in this figure (Early Carboniferous frame) is the inferred direction of convergence betweenKNTD and Baltica that occurred soon after Early Carboniferous time.
117N.M. Levashova et al. / Earth and Planetary Science Letters 257 (2007) 104–120
Devonian (see Fig. 8, showing the Mugojar (=alsoMugodzhar) Arc and Sakmara–Magnitogorsk marginalsea). Şengör and Natal'in [1] suggested that the Mugojarisland arc was located above a southwest-dippingsubduction zone and formed, along with the Sakmara–Magnitogorsk back arc basin, the Uralian boundary ofBaltica throughout the Silurian and Devonian. Theconvergence between the North Tien Shan part of theKNTD and SE Baltica appears to have been very largein their model: from their maps we estimate about3000 km or more of subduction beneath the MugojarArc between the Late Ordovician and the LateDevonian. Also, the evidence that the KNTD wasalready assembled by the end of the Late Ordoviciandoes not easily fit into the scenario of Şengör andNatal'in [1]. It seems that the Kipchak Arc model needssome refinement to remedy these discrepancies.
None of the other models for the Mid-to-LatePaleozoic evolution of the Ural Ocean [2,4–7,9–11]agrees with the paleomagnetic data; the main discrep-ancy seems to be that nearly all envisage a very widemid-Paleozoic ocean on the order of several thousandsof kilometers as well as long-lived and vigorous mid-Paleozoic plate boundaries between the KNTD andBaltica, which would, if true, render our “quasi-plate”story unlikely.
5.4. Constraints on the KNTD–Baltica paleogeography
We argue that a plausible scenario for the westernpart of the UMB should simultaneously satisfy severallines of evidence, the most important of which are:
A. In the Eastern Urals, various rocks of oceanicorigin, including ophiolites of various ages,numerous island-arc complexes, and deep-seasediments [34–39,41] indisputably indicate thatan oceanic basin existed to the east of Baltica (inpresent-day coordinates) from the Early Ordovi-cian to the Middle Carboniferous.
B. Although the number of island arcs, let alone theirpolarities and docking times, are still disputable[39–41], it is clear that these units marked activeconvergent plate margins to the east of Balticafrom the Middle Ordovician to the Carboniferous.The presence of ophiolites indicates that spread-ing centers existed to the east of Baltica too[2,34,38].
C. Baltica and the KNTDmoved coherently since theLate Ordovician in such a way as not to impedethe “free” evolution of the components in the UralOcean.
The set of cartoons (Fig. 9) illustrates the inferredrelative positions of the KNTD and Baltica in a simple,albeit definitely not unique scheme that satisfies thethree conditions listed above. We add four comments:
1. The Baltica–KNTD connection may have been abasin with oceanic crust, or an isthmus resemblingthe Malacca Isthmus of today. What is needed is alack of vigorously active plate margins throughoutmost of the Late Ordovician–Permian interval.
2. In its present-day position, the KNTD clearlyobstructs any subduction in the South Urals (seeFig. 1a). At the same time, the emplacement of theophiolites and relicts of island arcs and marginal seasas a consequence of subduction of the Ural Oceanhad taken place before mid-Carboniferous time[37,41]. Hence the domain had to arrive in itspresent-day position after subduction was completedin this area, i.e., in the Late Carboniferous–EarlyPermian. It is reasonable to assume that bothBaltica–KNTD convergence and the cessation ofsubduction were broadly contemporaneous and maysomehow have been related. As the result of thisconvergence, ophiolite remnants of the Ural Oceanand the relicts of island arcs and marginal seasbecame placed between Baltica and the KNTD.
3. In order to avoid disrupting the observed coherencyin paleolatitudes, Late Paleozoic motion of theKNTD relative to Baltica has to occur nearly alongthe latitude line at the time of convergence. Naturally,we cannot directly determine the magnitude ofconvergence with the aid of paleomagnetic data.Regardless, we can constrain it, as a large magnitudewould have implied too high velocities and, evenmore importantly, would disrupt the coherency ofolder paleolatitudes. It is difficult to give anyquantitative estimates, but any Late Paleozoic motionin large excess of 1000 km would be perceptible.This rough estimate stems from the plain fact that theAPWP of Baltica was recalculated to the study areain the Tien Shan in its present-day coordinates, andlatitude-parallel motion in the Late Carboniferous isnot latitude-parallel for older data.
4. Although the clearly recognizable KNTD boomerangis shown in its present-day shape (Figs. 1b and 9), weare not yet sufficiently knowledgeable about theorientation, subsequent rotations, and inner defor-mation of this unit. It is our hope that many adequatepaleomagnetic data will accumulate in the continuingstudies of Kazakhstan and Kyrgyzstan, so thatrotations can be adequately discussed at some futurestage.
118 N.M. Levashova et al. / Earth and Planetary Science Letters 257 (2007) 104–120
Our paleomagnetic study of Upper Devonian andes-ite and basalt flows from the Aral Formation in theNorth Tien Shan of Kyrgyzstan yields a characteristicand likely primary magnetization. When combined withother reliable paleomagnetic results from the North TienShan, a good fit of the observed paleolatitudes with thereference values for Baltica is obvious. Geologicevidence indicates that a large area in Kazakhstan, theKokchetav–North Tien Shan Domain (KNTD) wasconsolidated by Late Ordovician time, and we inferthat the observed paleolatitudinal agreement can beextrapolated to this entire KNTD. This good fit of theobserved and predicted paleolatitudes indicates thatBaltica and the KNTD moved coherently duringmuch of the time from the Late Ordovician until theMiddle Carboniferous.
Based on this indication, a simple paleogeographicmodel involving just two main constituents, Baltica andtheKNTD, shows that Baltica and theKNTD stayedmoreor less in the same relative position for some 150 My(Fig. 9a–c). TheUral Ocean closed bymid-Carboniferoustime (e.g., [37]). We assume that the KNTD moved to itspresent-day position relative to Baltica along lines oflatitude in Late Carboniferous–Early Permian time. As aresult, ophiolite remnants of the Ural Ocean and the relictsof island arcs and marginal seas came to their positionbetweenBaltica and theKNTD.The orientation ofBalticain the Carboniferous indicates that the convergence ofthese two blocks was oblique (Fig. 9c, d).
Thus the main message of our paper is to demonstrate,primarily with the aid of paleomagnetic data, thatKazakhstan units could not constitute the other side ofthe Ural Ocean. This scenario is, at best, just a skeleton ofa full-body model. To further substantiate or refute it, aregional-scale analysis of geological data is required, butthis is outside the scope of this paper.
Acknowledgments
We thankmany people from the Scientific Station of theRussian Academy of Sciences in Bishkek (Kyrgyzstan) forlogistic support of the fieldwork, Nina Dvorova forpaleomagnetic measurements and Kirill Degtyarev forhelpful comments. Thorough and constructive reviews ofJohn Geissman, Stuart Gilder and an anonymous reviewerare gratefully appreciated. This study was supported by theDivision of Earth Sciences and the Office of InternationalScience and Engineering's Eastern and Central EuropeProgram of the U.S. National Science Foundation, grantEAR 0335882. Support was also derived from the Russian
Foundation of Basic Research, grants 04-05-64050 and 05-05-65105, Program No. 10 of the Earth Science Division,Russian Academy of Sciences and Swiss NationalScientific Foundation Project No. IB7320-110694.
References
[1] A.M.C. Şengör, B.A. Natal'in, Paleotectonics of Asia: fragments of asynthesis, in: A. Yin, M. Harrison (Eds.), The Tectonic Evolution ofAsia, Cambridge University Press, Cambridge, 1996, pp. 486–640.
[2] V.N. Puchkov, Paleogeodynamics of the Southern and MiddleUrals, Dauria, Ufa, 2000 146 pp. (in Russian).
[3] L.P. Zonenshain, M.I. Kuzmin, L.M. Natapov, Geology of theUSSR: a plate-tectonic synthesis, Geodynamics Series, vol. 21,Amer. Geophys. Union, Washington, D.C., 1990 242 pp.
[4] A.A. Mossakovsky, S.V. Ruzhentsev, S.G. Samygin, T.N.Kheraskova, Central Asian fold belt: geodynamic evolution andformation, Geotectonics 27 (6) (1993) 3–32.
[5] A.N. Didenko, A.A. Mossakovsky, D.M. Pechersky, S.V.Ruzhentsev, S.G. Samyugin, T.N. Kheraskova, The geodynamicsof the Central Asian Paleozoic oceans, Russ. Geol. Geophys. 35(7-8) (1994) 48–61.
[6] I.B. Filippova, V.A. Bush, A.N. Didenko, Middle Paleozoicsubduction belts: the leading factor in the formation of the CentralAsian fold-and-thrust belt, Russ. J. Earth Sci. 3 (6) (2001) 405–426.
[7] A.S. Yakubchuk, R. Seltmann, V.V. Shatov, A. Cole, The Altaids:tectonic evolution and metallogeny, Soc. Econ. Geol. Newlett. 46(2001) 7–14.
[8] A.S. Yakubchuk, A. Cole, R. Seltmann, V. Shatov, Tectonicsetting, characteristics, and regional exploration criteria for goldmineralization in the Altaid tectonic collage: the Tien Shanprovince as a key example, Soc. Econ. Geol., Spec. Publ. 9(2002) 177–201.
[9] G.M. Stampfli, G.D. Borel, A plate tectonic model for thePaleozoic and Mesozoic constrained by dynamic plate bound-aries and restored synthetic oceanic isochrons, Earth Planet. Sci.Lett. 196 (2002) 17–33.
[10] T.N. Kheraskova, A.N. Didenko, V.A. Bush, Yu.A. Volozh, TheVendian–early Paleozoic history of the continental margin ofeastern Paleogondwana, Paleoasian Ocean, and Central Asianfold belt, Russ. J. Earth Sci. 5 (3) (2003) 165–184.
[11] S.A. Kurenkov, A.N. Didenko, V.A. Simonov, N.V. Lubnina,Geodynamic setting of the Ural–Mongol belt paleospreadingcomplexes, in: S.V. Ruzhentsev, K.E. Degtyarev (Eds.), Essays onRegional Tectonics, Book 2, Kazakhstan, Tien Shan, Polar Urals,Moscow, Nauka, 2005, pp. 201–247, (in Russian).
[12] V.L. Klishevich, A.N. Khramov, Reconstruction of the TurkestanOcean (South Tien Shan) in the Early Devonian, Geotectonics 27(4) (1993) 66–75.
[13] V.S. Burtman, G.Z. Gurary, A.V. Belenky, A.V. Ignatiev, M.Audibert, The Turkestan ocean in the middle Paleozoic: areconstruction based on paleomagnetic data from the Tien Shan,Geotectonics 32 (1) (1998) 15–26.
[14] M.L. Bazhenov, A.Q. Collins, K.E. Degtyarev, N.M. Levashova,A.V. Mikolaichuk, V.E. Pavlov, R. Van der Voo, Paleozoicnorthward drift of the North Tien Shan (Central Asia) as revealedbyOrdovician andCarboniferous paleomagnetism, Tectonophysics366 (2003) 113–141.
[15] M.V. Alexyutin, V. Bachtadse, D.V. Alexeiev, O.I. Nikitina,Paleomagnetism of Ordovician and Silurian rocks from the Chu–
119N.M. Levashova et al. / Earth and Planetary Science Letters 257 (2007) 104–120
Yili and Kendyktas mountains, South Kazakhstan, Geophys. J. Int.162 (2005) 321–331.
[16] K.E. Degtyarev, The position of the Aktau–Junggar microconti-nent in the Paleozoides of Central Kazakhstan, Geotectonics 37(4) (2003) 14–34.
[17] A.V. Mikolaichuk, S.A. Kurenkov, K.E. Degtyarev, V.I. Rubtsov,Main stages of geodynamic evolution of the North Tien Shan inthe late Precambrian and early Paleozoic, Geotectonics 31 (6)(1997) 16–34.
[19] J.D.A. Zijderveld, AC demagnetization of rocks: analysis ofresults, in: D.W. Collinson, K.M. Creer (Eds.), Methods inPaleomagnetism, Elsevier, Amsterdam, 1967, pp. 254–286.
[20] J.L. Kirschvink, The least-square line and plane and the analysisof palaeomagnetic data, Geophys. J. R. Astron. Soc. 62 (1980)699–718.
[21] R.A. Fisher, Dispersion on a sphere, Proc. R. Soc. Lond., Ser. A217 (1953) 295–305.
[22] P.L. McFadden, M.W. McElhinny, The combined analysis ofremagnetization circles and direct observations in palaeomagnet-ism, Earth Planet. Sci. Lett. 87 (1988) 161–172.
[23] J.P. Cogné, PaleoMac: a Macintosh application for treatingpaleomagnetic data and making plate reconstructions, Geochem.Geophys. Geosyst. 4 (1) (2003) 1007, doi:10.1029/2001GC000227.
[24] K.V. Mardia, Statistics of Directional Data, Academic Press,London, (1972) 357 pp.
[25] J.W. Geissman, R. Van der Voo, Thermochemical remanentmagnetization in Jurassic silicic volcanics from Nevada (USA),Earth Planet. Sci. Lett. 48 (1980) 385–396.
[26] A. Abrajevitch, P.J.A. McCausland, R. Van der Voo, M.L. Bazhenov,K.E. Degtyarev, N.M. Levashova, A cautionary tale about vertical-axis rotations, or How to recognize an orocline when you see one(abstract), Eos Trans. AGU86 (52) (2005) (FallMeet. Suppl. AbstractGP11A-0003).
[27] R. Van der Voo, N.M. Levashova, L.S. Skrinnik, T.V. Kara, M.L.Bazhenov, Late orogenic, large-scale rotations in the Tien Shan andadjacent mobile belts in Kyrgyzstan and Kazakhstan, Tectonophy-sics 426 (2006) 335–360.
[28] N.M.Levashova, K.E.Degtyarev,M.L.Bazhenov,A.Q.Collins,R.Van der Voo, Middle Paleozoic paleomagnetism of east Kazakh-stan: post-MiddleDevonian rotations in a large-scale orocline in thecentral Ural–Mongol belt, Tectonophysics 377 (2003) 249–268.
[29] V.A. Kravchinsky, K.M. Konstantinov, V. Courtillot, J.I. Savrasov,J.-P. Valet, S.D. Cherniy, S.G. Mishenin, B.S. Parasotka,Palaeomagnetism of East Siberian traps and kimberlites: two newpoles and palaeogeographic reconstructions at about 360 and250 Ma, Geophys. J. Int. 148 (2002) 1–33.
[30] R.Van derVoo, Paleomagnetismof theAtlantic, Tethys and IapetusOceans, Cambridge University Press, Cambridge, 1993 411 pp.
[31] M.A. Smethurst, A.N. Khramov, T.H. Torsvik, The Neoproterozoicand Paleozoic paleomagnetic data for the Siberian platform: fromRodinia to Pangea, Earth-Sci. Rev. 43 (1998) 1–24.
[32] M.A. Smethurst, A.N. Khramov, S. Pisarevsky, Palaeomagnetismof the lower OrdovicianOrthoceras limestone, St. Petersburg, and arevised drift history for Baltica in the early Palaeozoic, Geophys. J.Int. 133 (1998) 44–56.
[33] R.G. Gordon, Plate motions, crustal and lithospheric mobility,and paleomagnetism: Prospective viewpoint, J. Geophys. Res.100 (1995) 24,367–24,392.
[34] G.N. Savelieva, R.W. Nesbitt, A synthesis of the stratigraphicand tectonic setting of the Uralian ophiolites, J. Geol. Soc. 153(1996) 525–537.
[35] R.G. Yazeva, V.V. Bochkarev, Silurian island arc of the Urals:structure, evolution and geodynamics, Geotectonics 29 (1996)478–489.
[36] P. Spadea, L.Y. Kabanova, J.H. Scarrow, Petrology, geochemistryand geodynamic significance of Mid-Devonian boninitic rocksfrom the Baimak–Buribai area (Magnitogorsk Zone, southernUrals), Ofioliti 23 (1998) 17–36.
[37] V. Puchkov, Paleozoic evolution of the East European continentalmargin involved in the Uralide orogeny, in: D. Brown, C. Juhlin,V. Puchkov (Eds.), Mountain Building in the Uralides: Pangea toPresent, American Geophysical Union, Geophysical Monograph,vol. 132, 2002, pp. 9–32.
[38] G.N. Savelieva, A.Y. Sharaskin, A.A. Saveliev, P. Spadea, A.N.Pertsev, I.I. Babarina, Ophiolites and zoned mafic–ultramaficmassifs of the Urals: a comparative analysis and some tectonicimplications, in: D. Brown, C. Juhlin, V. Puchkov (Eds.),Mountain Building in the Uralides: Pangea to Present, AmericanGeophysical Union, Geophysical Monograph, vol. 132, 2002,pp. 135–154.
[39] A.V. Riazantsev, D.V. Borisenok, S.V. Dubinina, E.A. Kalinina,N.B. Kuznetsov, E.A. Matveeva, A.V. Aristov, General structureof the Sakmara zone of the South Urals in the Mednogorsk orefield area, in: S.V. Ruzhentsev, K.E. Degtyarev (Eds.), Essays onRegional Tectonics, Book 1, South Urals, Moscow, Nauka, 2005,pp. 84–134, (in Russian).
[40] V.A. Aristov, D.V. Borisenok, S.V. Ruzhentsev, Conodontstratigraphy of Devonian deposits on the western slope of theSouth Urals, in: S.V. Ruzhentsev, K.E. Degtyarev (Eds.), Essayson Regional Tectonics, Book 1, South Urals, Moscow, Nauka,2005, pp. 36–55, (in Russian).
[41] D. Brown, P. Spadea, V. Puchkov, J. Alvarez-Marron, R. Herrington,A.P. Willner, R. Hetzel, Y. Gorozhanina, C. Juhlin, Arc-continentcollision in the Southern Urals, Earth-Sci. Rev. 79 (2006) 261–287.
120 N.M. Levashova et al. / Earth and Planetary Science Letters 257 (2007) 104–120