Page 1
Herding around the world: Do cultural
differences influence investors’ behavior?
Joana Maria Pereira de Almeida Ferreira Maio
Master Dissertation in Economics
Supervisor: Professor Júlio Fernando Seara Sequeira da Mota Lobão
2014
Page 2
ii
Biographic Note
Joana Maria Pereira de Almeida Ferreira Maio, born in 5th of August 1991 in
the city of Porto.
Between 2009 and 2012, attended the bachelor degree in Economics at FEP –
School of Economics and Management, University of Porto. In September 2012,
entered the Master in Economics, also at FEP.
Since the beginning of September 2014, is working at Sonae Indústria as an
Internal Auditor.
Page 3
iii
Acknowledgements
I would like to give a word of deep gratitude to Professor Júlio Lobão, for his
guidance, patience, encouragement and support. He definitely has a huge knowledge
about Behavioral Finance and was the one responsible for having me interested in such
a fascinate subject.
I would also like to thank Professor Mário Ferreira and Professor Raquel
Meneses, for the suggestions and motivation given throughout the year.
I am also very grateful to Paula Carvalho (FEP) and Martina Favaretto
(Thomson Reuteurs), for all the help provided regarding data collection.
Finally, I want to thank all my friends and family: my parents and brother, for
the motivation and incentive given in times of need; my master colleagues that always
accompanied me, especially Octávio Correia, Anabela Queirós, João Aguiar and
Ricardo Peixoto; my AIESEC and Choir friends, that showed their support and
friendship every time, especially Inês Teixeira, Márcio Barros, Cláudia Leal, Vânia
Fonseca, Guilherme Dominguez and Sónia Araújo; and a special thanks to Ricardo
Biscaia, for his help.
Page 4
iv
Table of Contents
Biographic Note ...............................................................................................................ii
Aknowledgements ......................................................................................................... iii
Abstract ..........................................................................................................................vii
Resumo ......................................................................................................................... viii
1. Introduction ................................................................................................................. 1
2. Literature Review ....................................................................................................... 4
2.1.Herding ................................................................................................................... 4
2.2.Prior empirical studies of herding ........................................................................... 8
2.3.Culture and Hofstede’s cultural dimensions ......................................................... 12
2.3.1. Hofstede’s cultural dimensions ................................................................. 14
2.4. Criticisms to Hofstede’s dimensions and comparison with other dimensions .... 15
2.4.1. Criticisms to Hofstede’s cultural dimensions ........................................... 16
2.4.2. Comparison with other cultural dimensions ............................................. 18
2.5. Prior empirical studies of cultural finance ........................................................... 20
3. Hypothesis, Data and Methodology ........................................................................ 22
3.1.Hypothesis ............................................................................................................ 22
3.2.Data ....................................................................................................................... 27
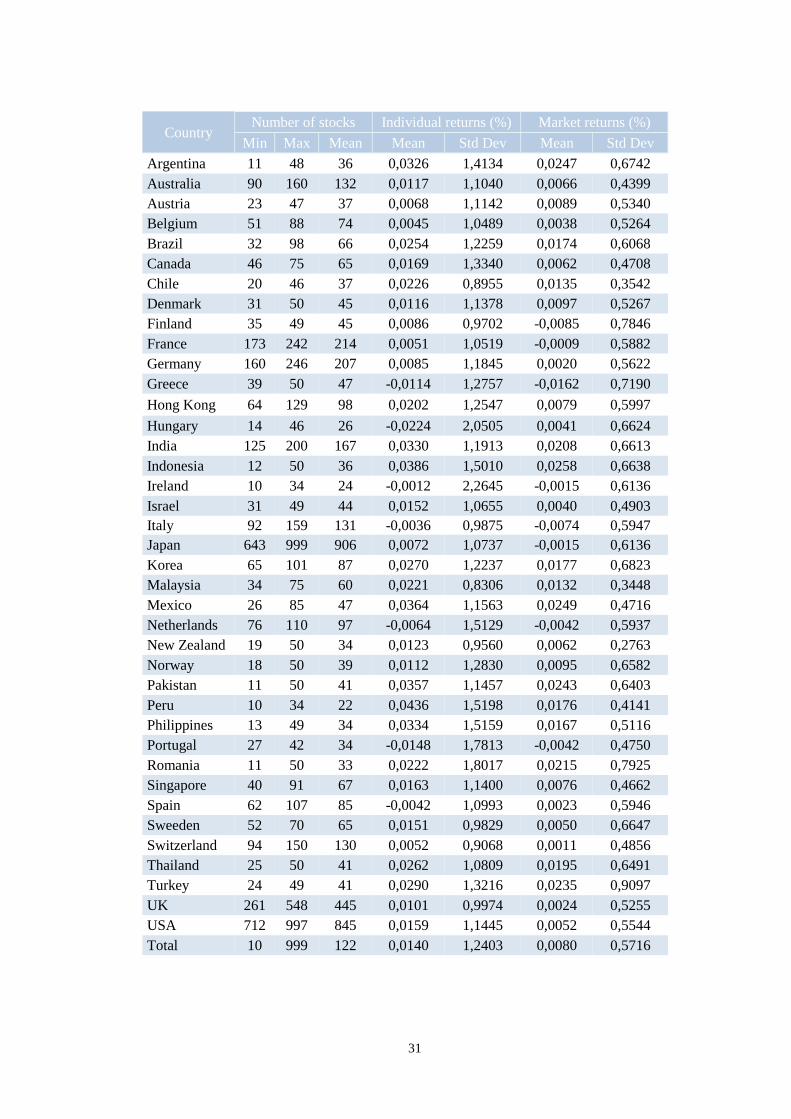
3.2.1. Stock market data ...................................................................................... 28
3.2.2. Cultural dimensions .................................................................................. 32
3.2.3. Determinants of herding ........................................................................... 35
3.3. Methodology ........................................................................................................ 43
3.3.1. Herding approach ...................................................................................... 43
3.3.2. Measure of herding ................................................................................... 44
3.3.3. Model specification ................................................................................... 47
4. Results and Implications .......................................................................................... 50
4.1. Results .................................................................................................................. 51
Page 5
v
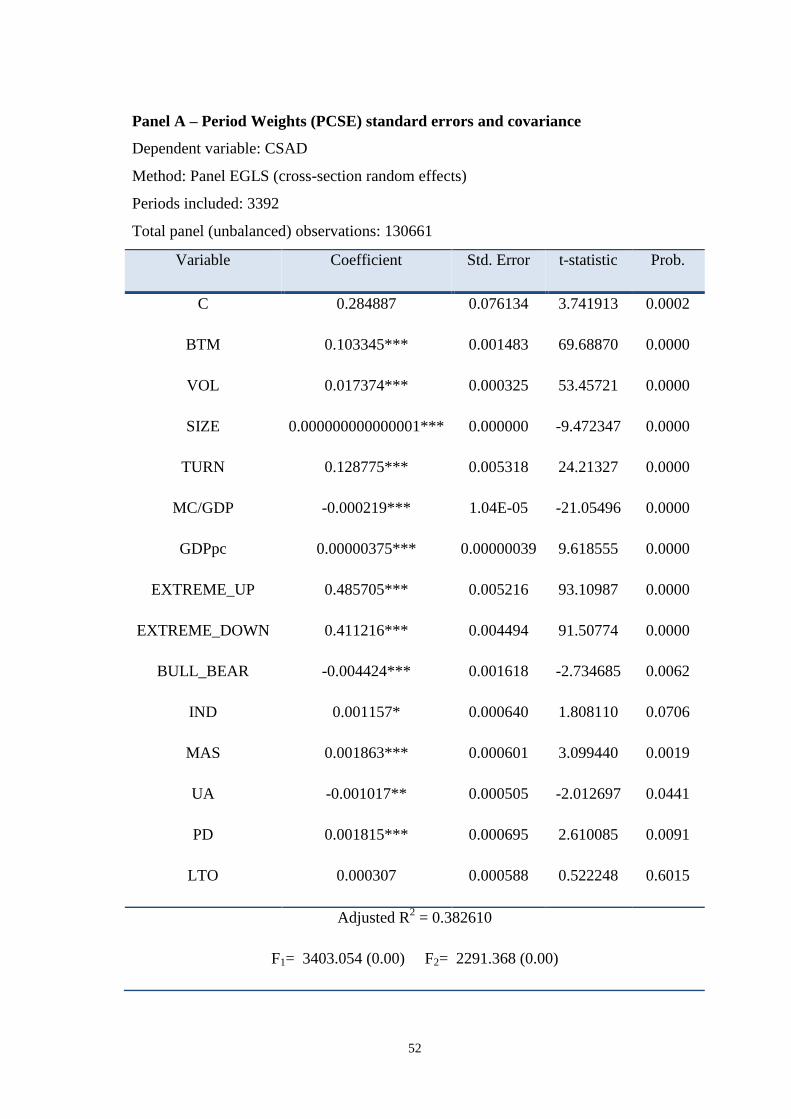
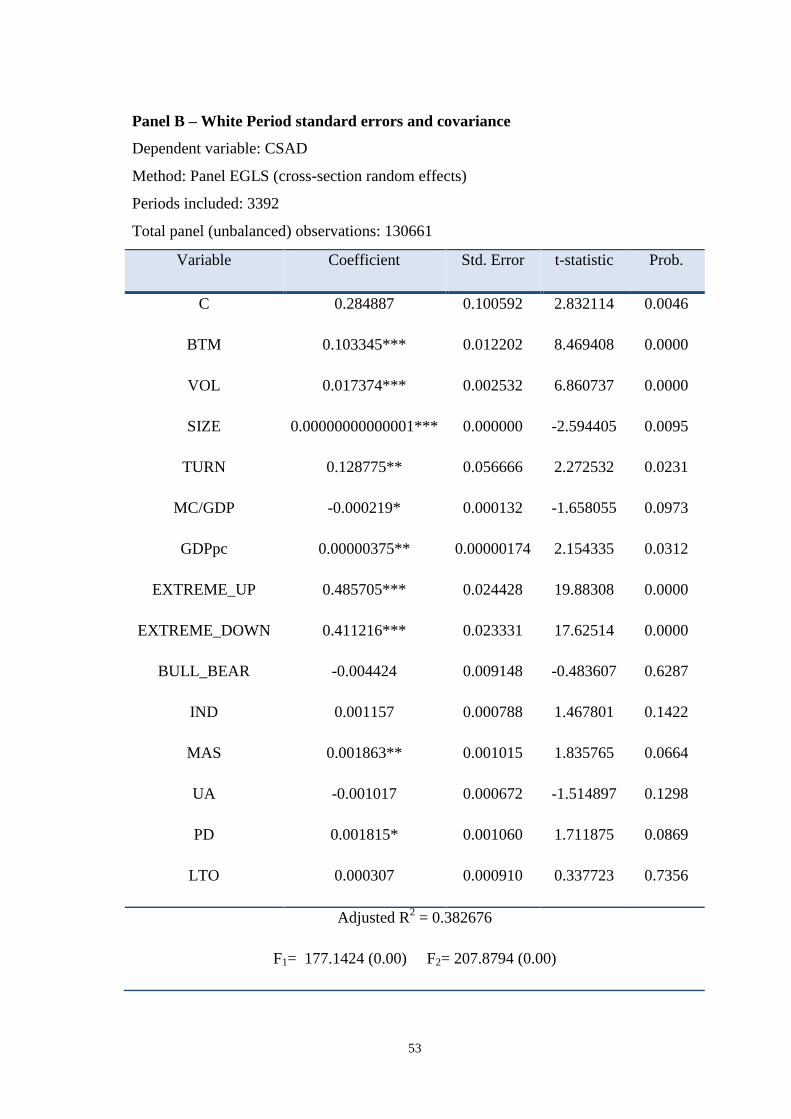
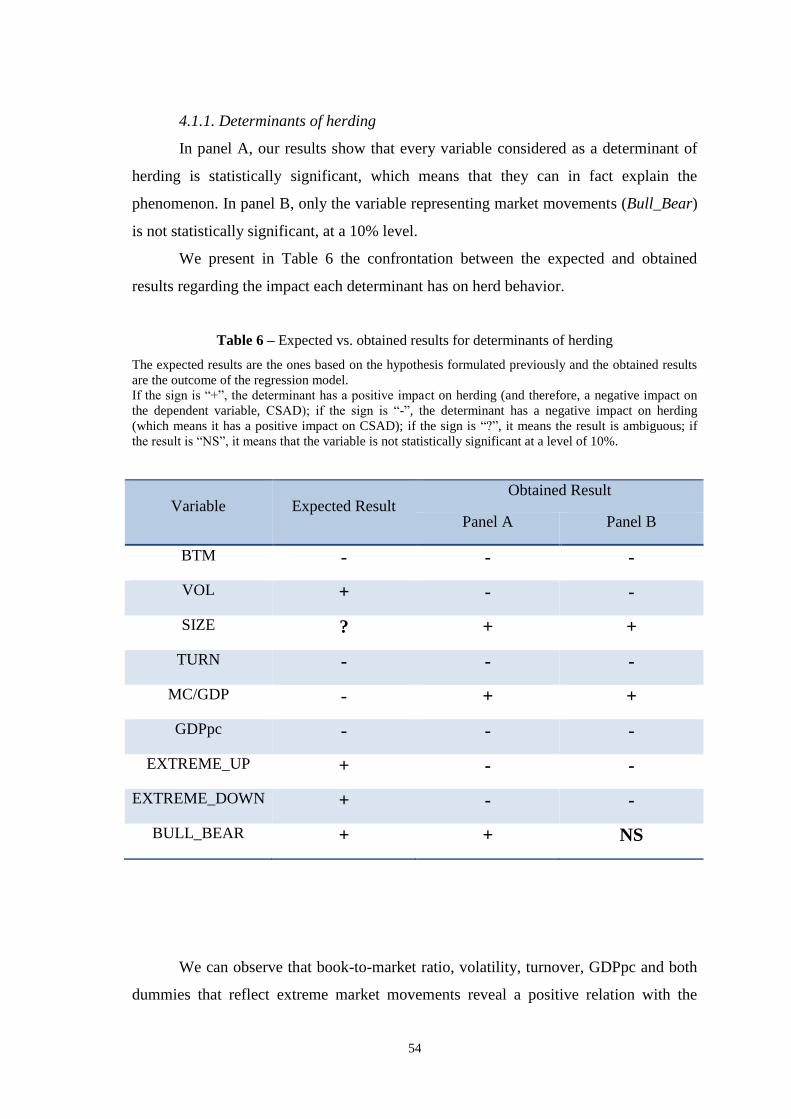
4.1.1. Determinants of herding ........................................................................... 54
4.1.2. Cultural dimensions .................................................................................. 58
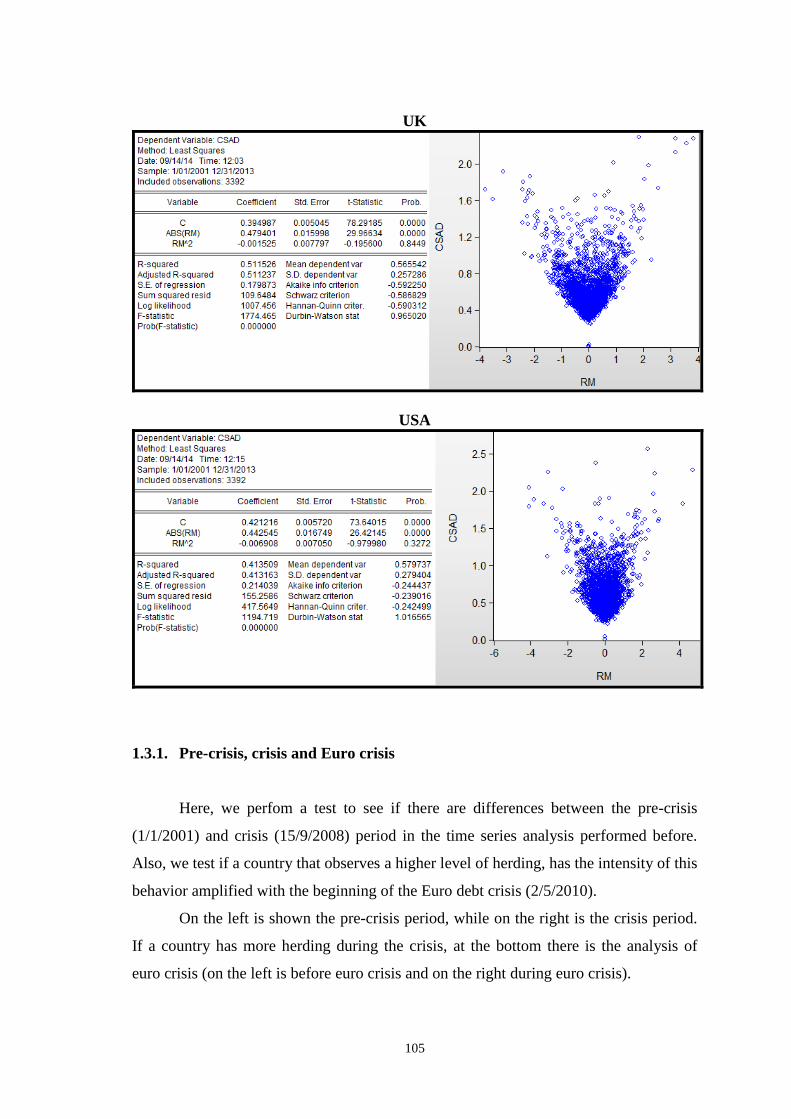
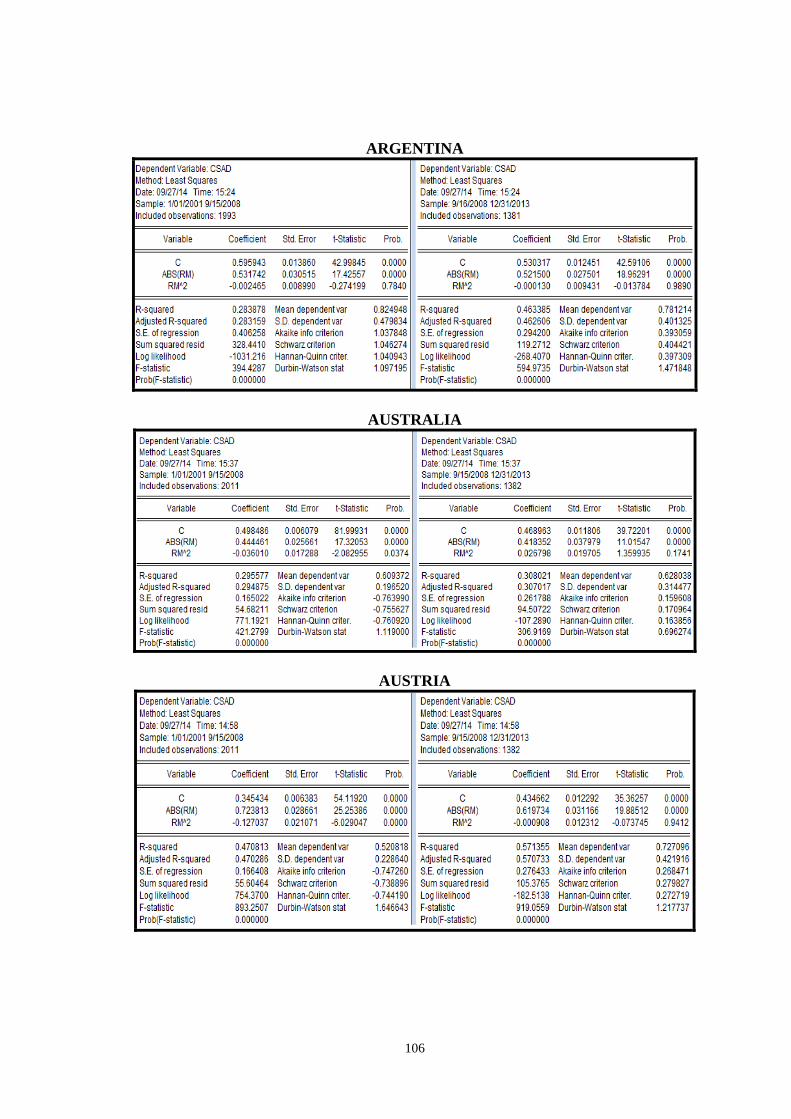
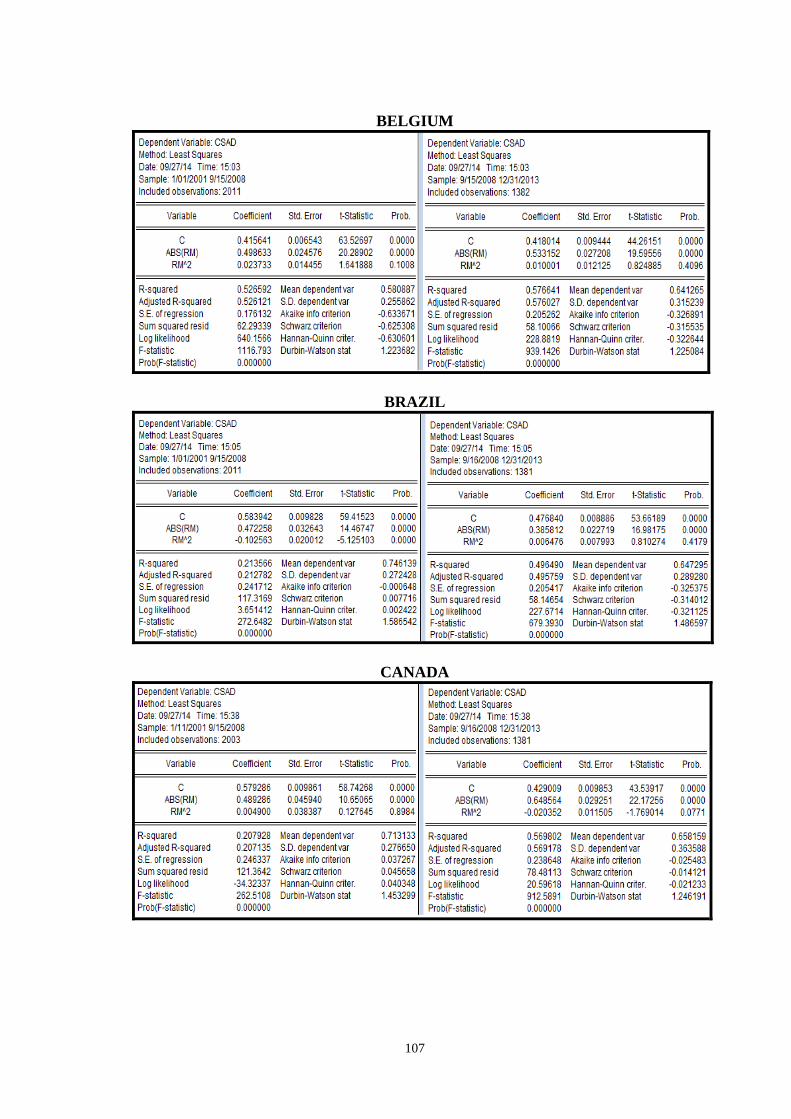
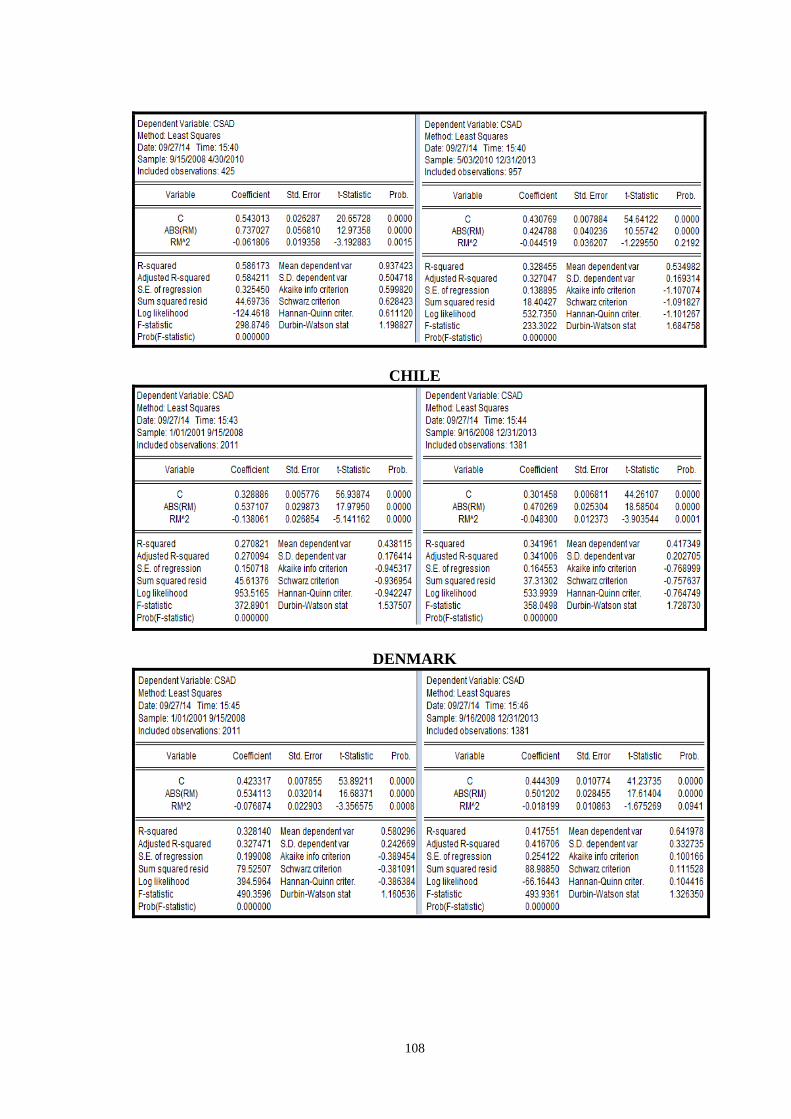
4.1.3. Pre-crisis and crisis period ........................................................................ 61
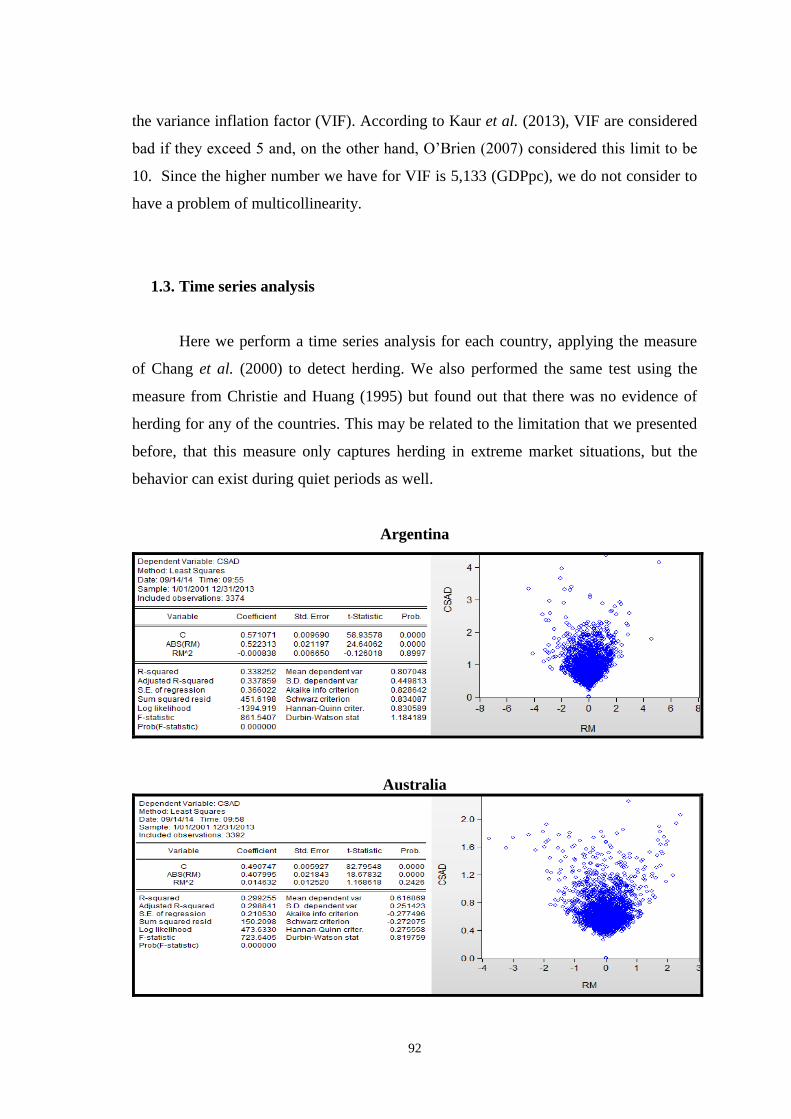
4.2. Time series analysis ............................................................................................. 63
4.3. Implications ......................................................................................................... 67
5. Conclusion ................................................................................................................. 70
References ...................................................................................................................... 74
Appendix ........................................................................................................................ 85
Page 6
vi
Figures Index
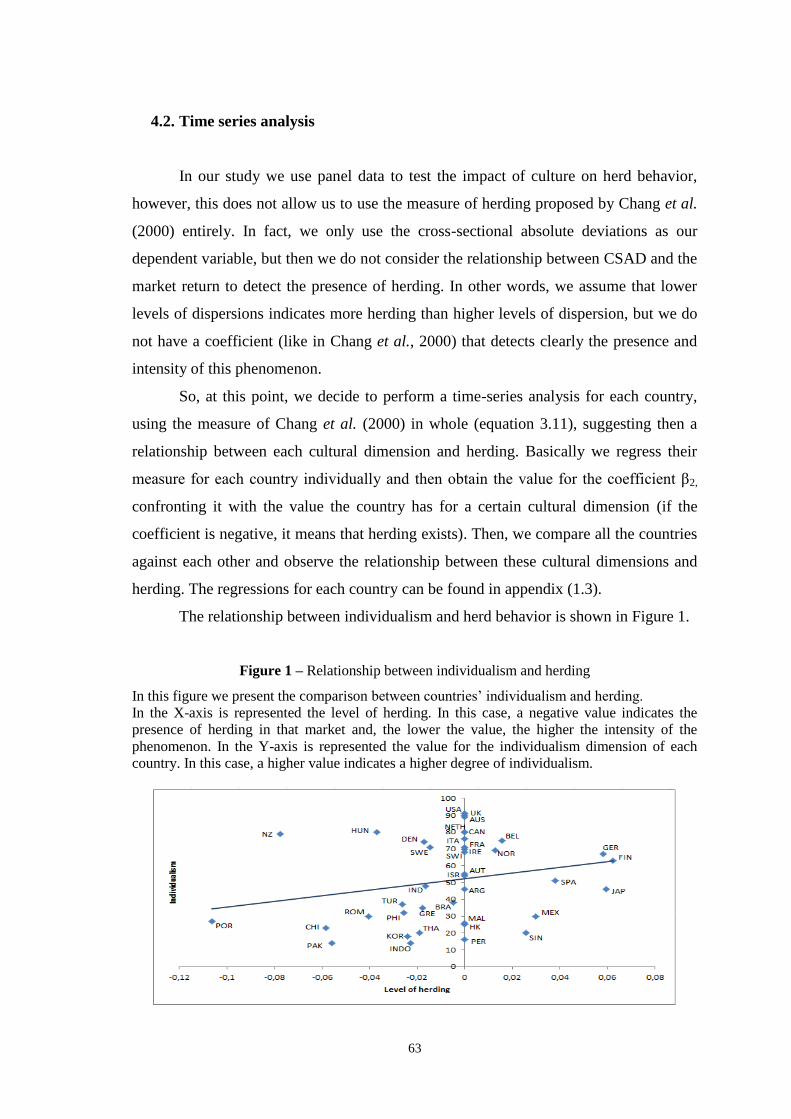
Figure 1. Relationship between individualism and herding ........................................... 63
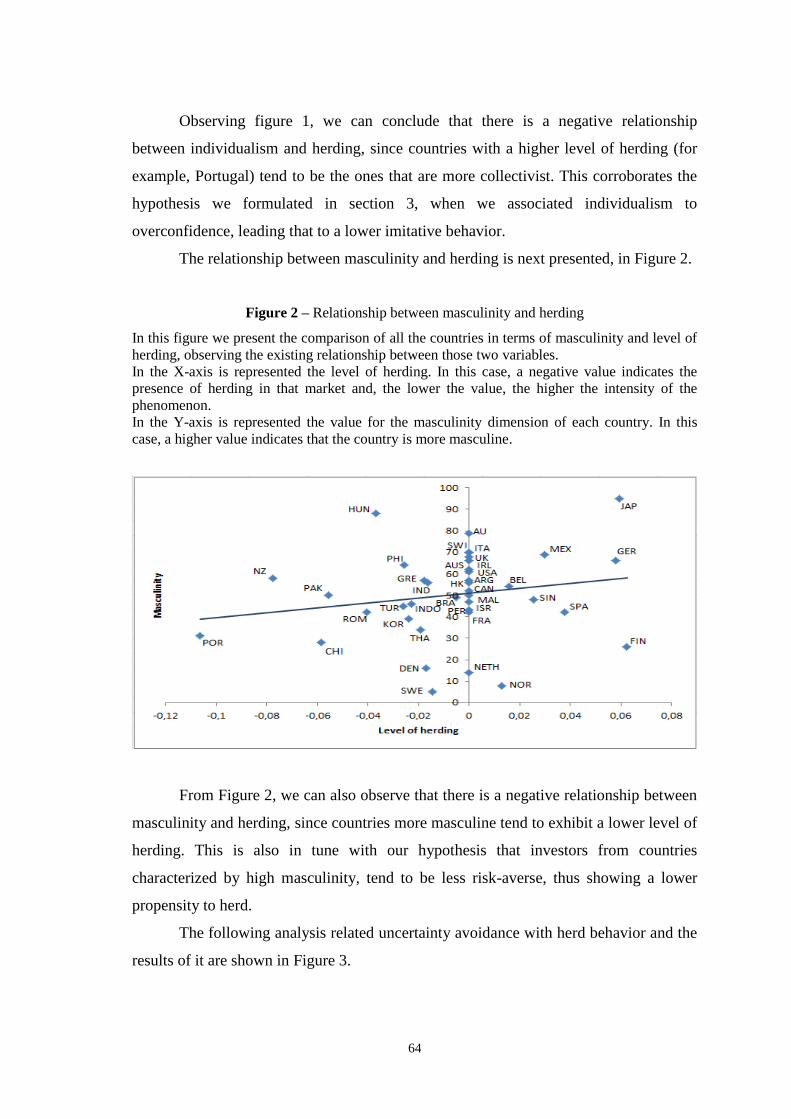
Figure 2. Relationship between masculinity and herding ............................................... 64
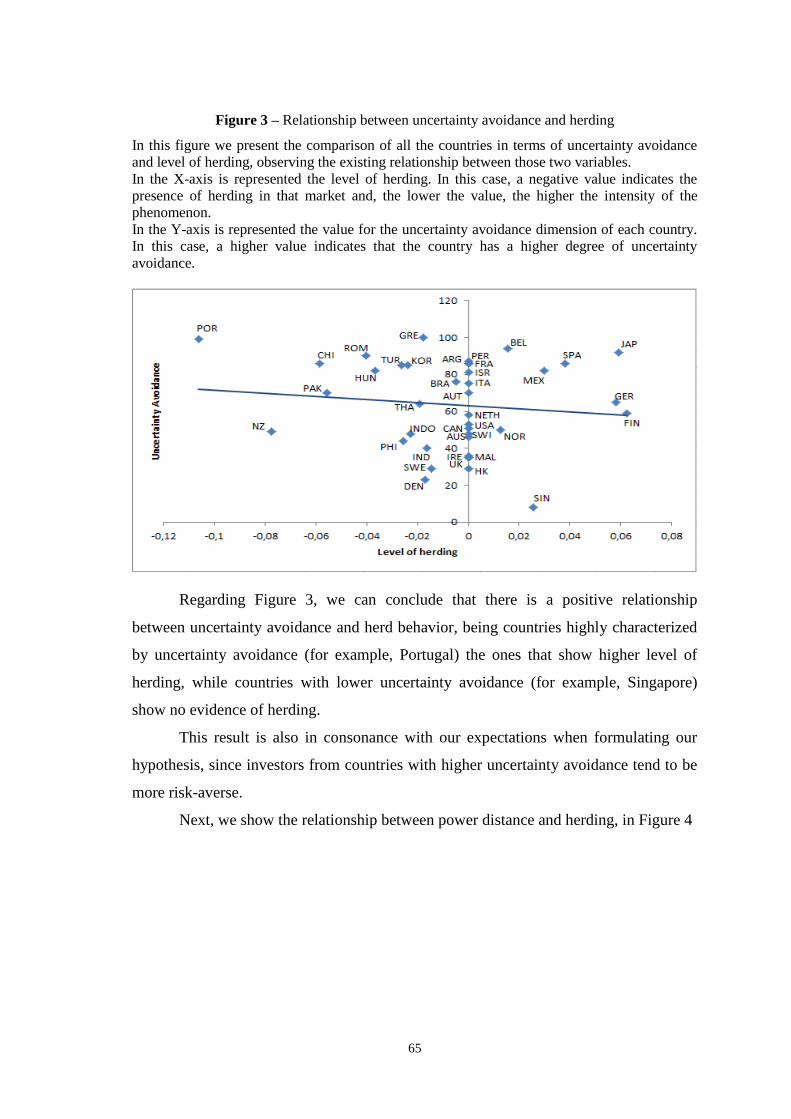
Figure 3. Relationship between uncertainty avoidance .................................................. 65
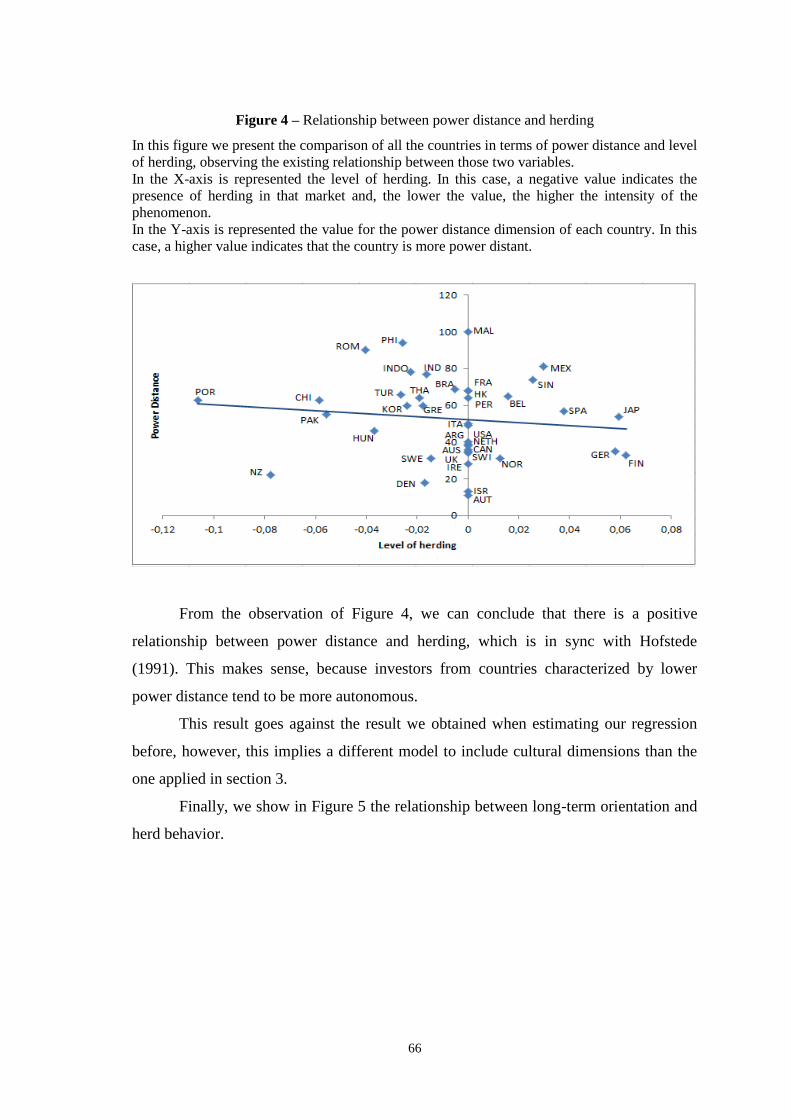
Figure 4. Relationship between power distance and herding ......................................... 66
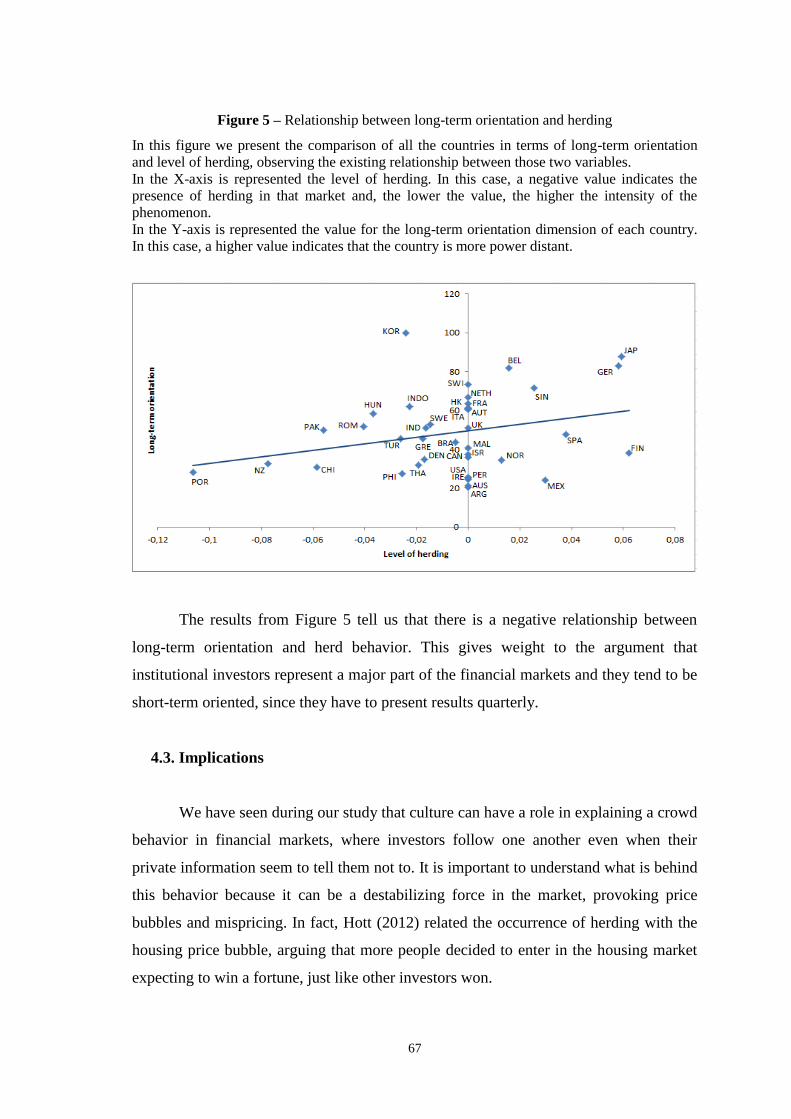
Figure 5. Relationship between long-term orientation and herding ............................... 67
Tables Index
Table 1. Summary of empirical studies on herding ........................................................ 11
Table 2. Descriptive statistics for the stock market data ................................................ 30
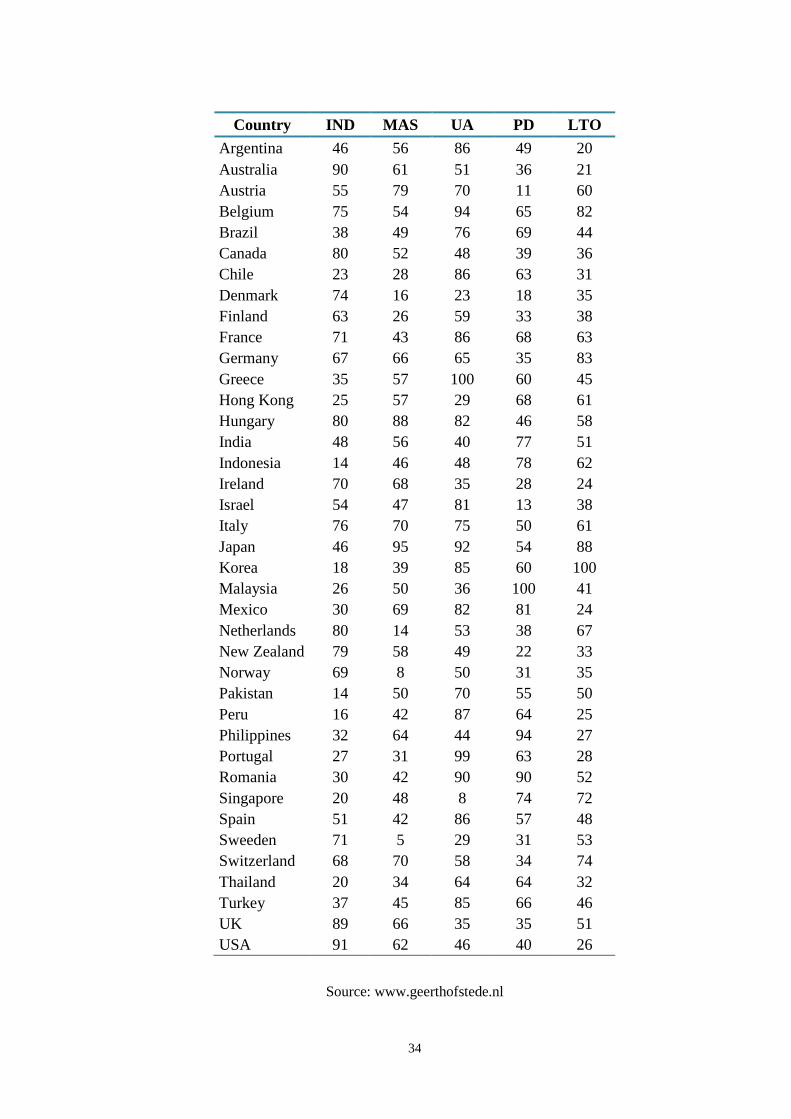
Table 3. Values for each country’s cultural dimensions ................................................. 33
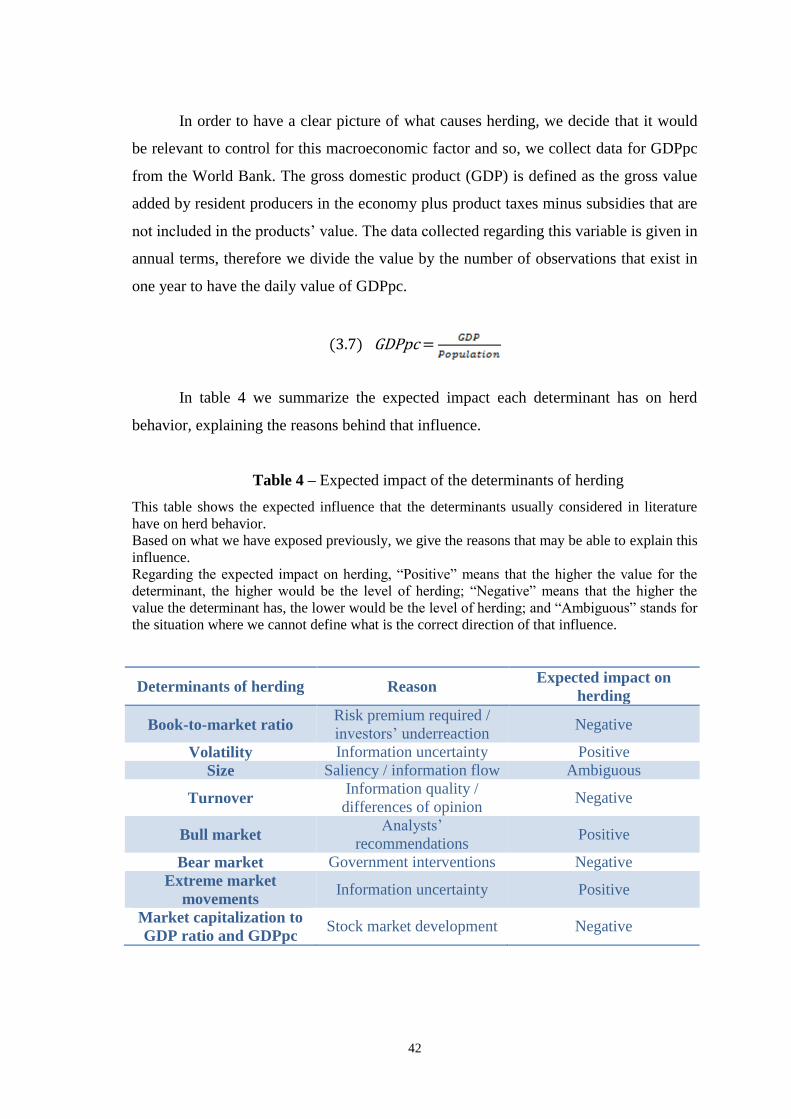
Table 4. Expected impact of the determinants of herding .............................................. 42
Table 5. Results for the determinants of herding and cultural dimensions ..................... 51
Table 6. Expected vs. obtained results for determinants of herding ............................... 54
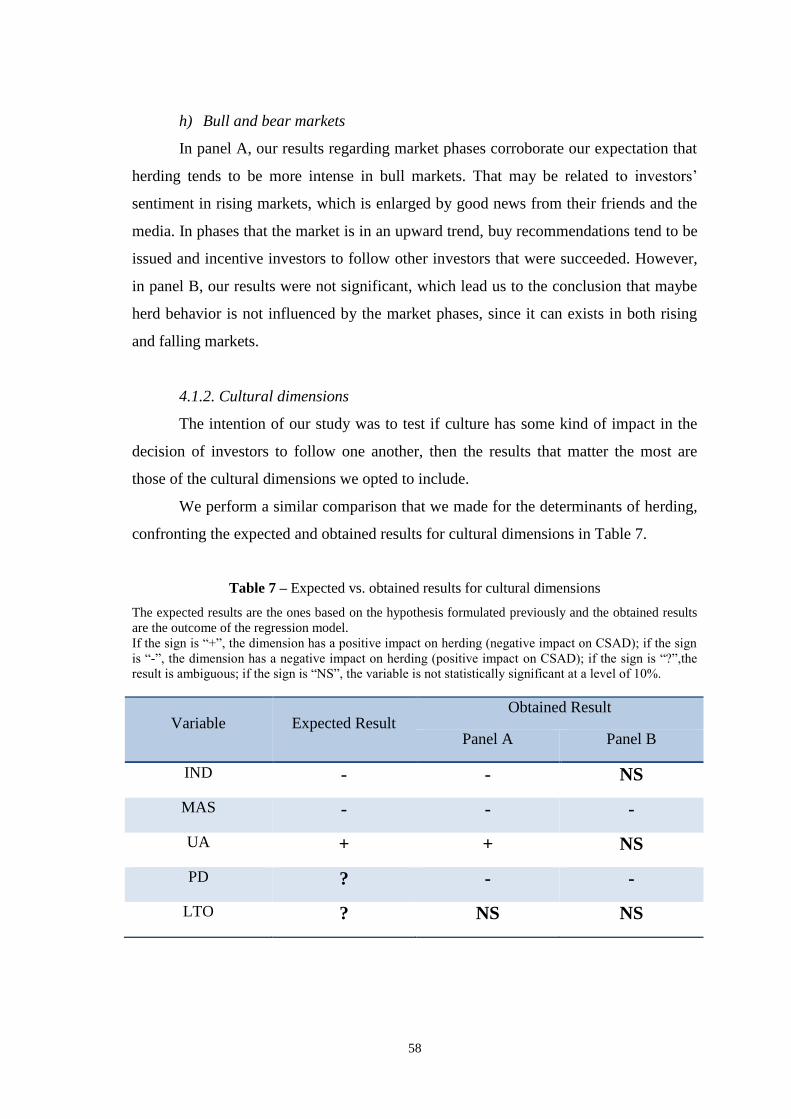
Table 7. Expected vs. obtained results for cultural dimensions ...................................... 58
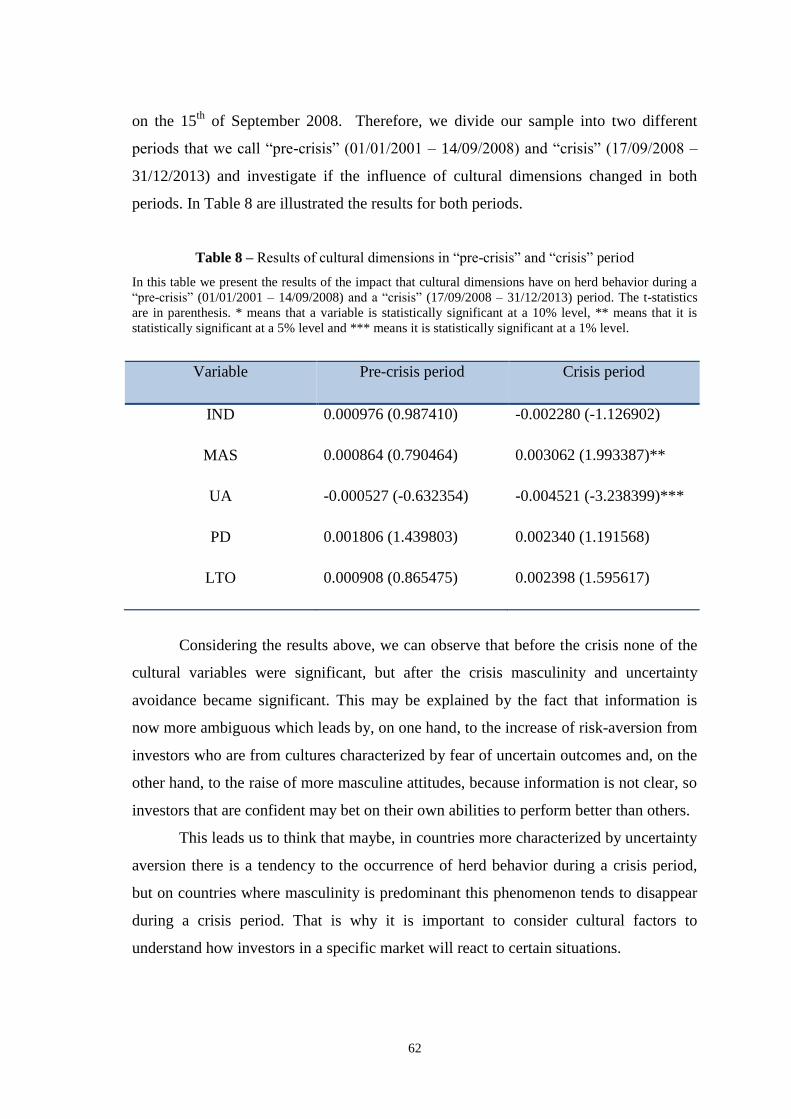
Table 8. Results of cultural dimensions in “pre-crisis” and “crisis” period ................... 62
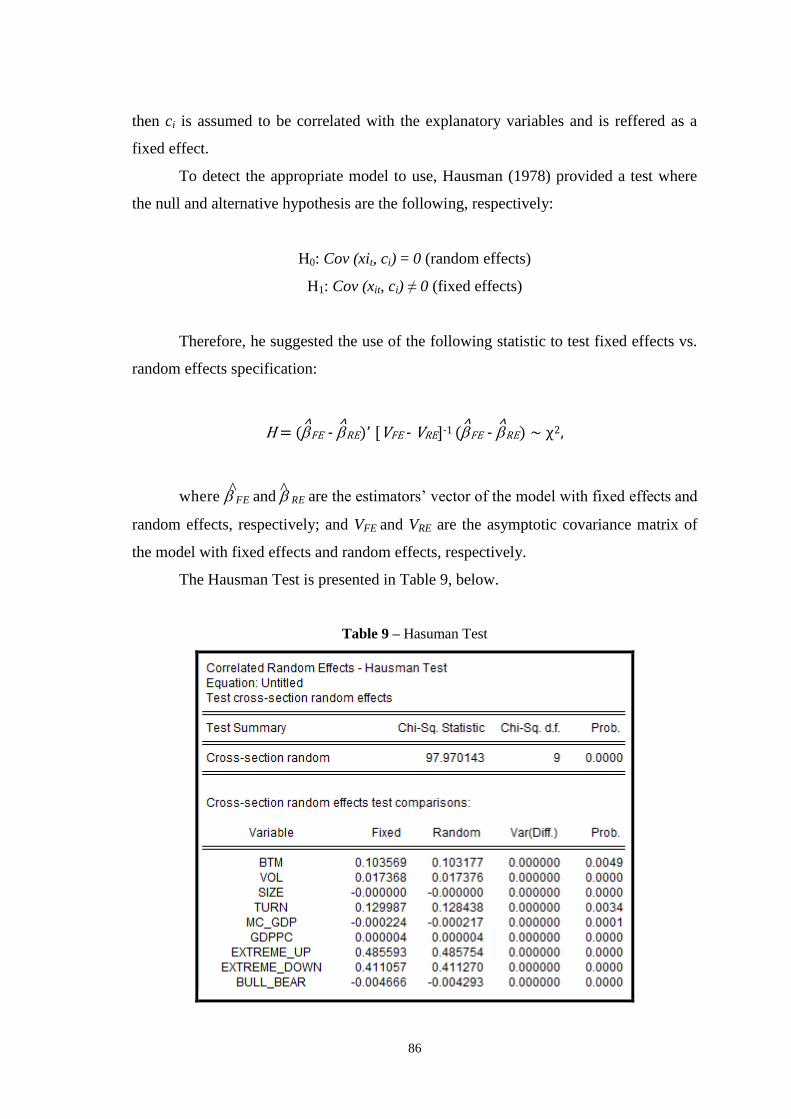
Table 9. Hausman Test ................................................................................................... 86
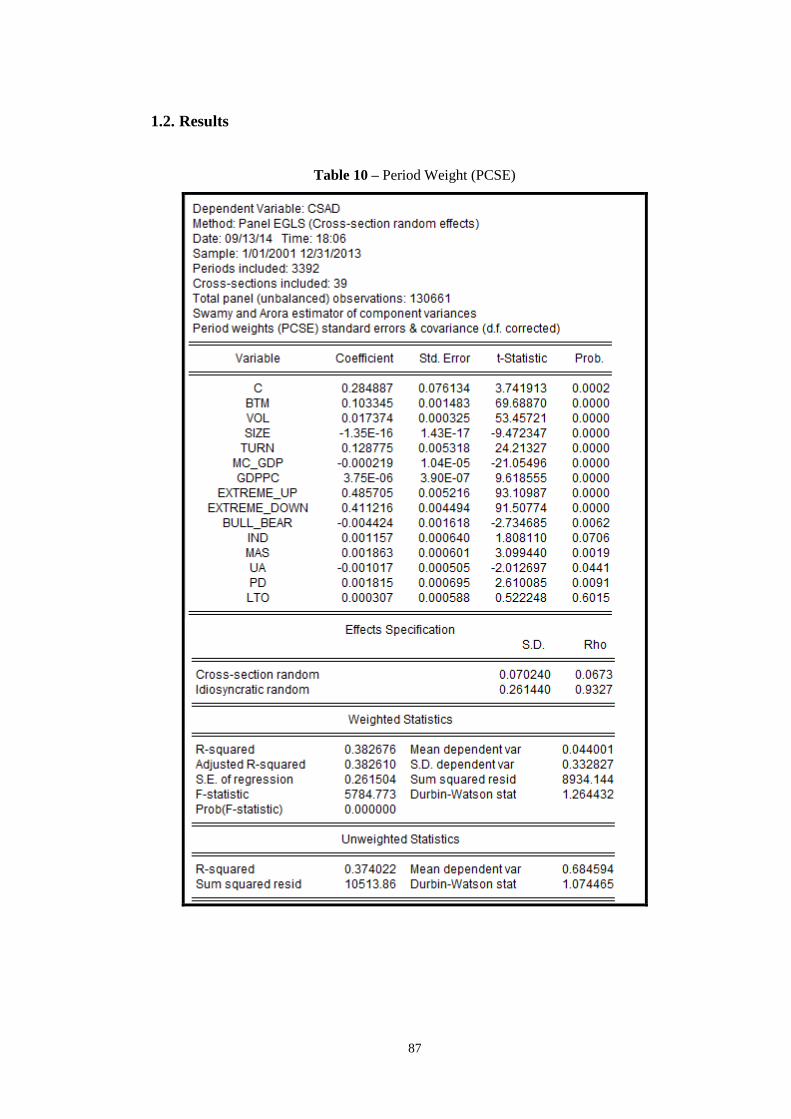
Table 10. Period Weight (PCSE) .................................................................................... 87
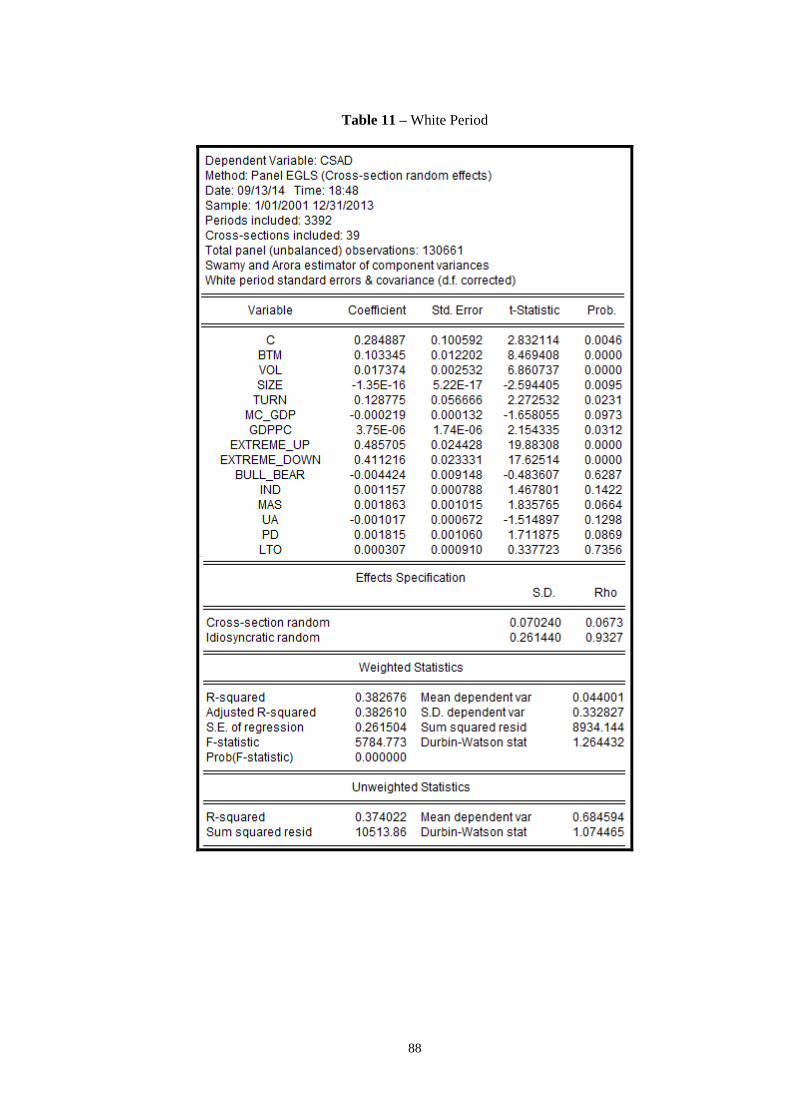
Table 11. White Period ................................................................................................... 88
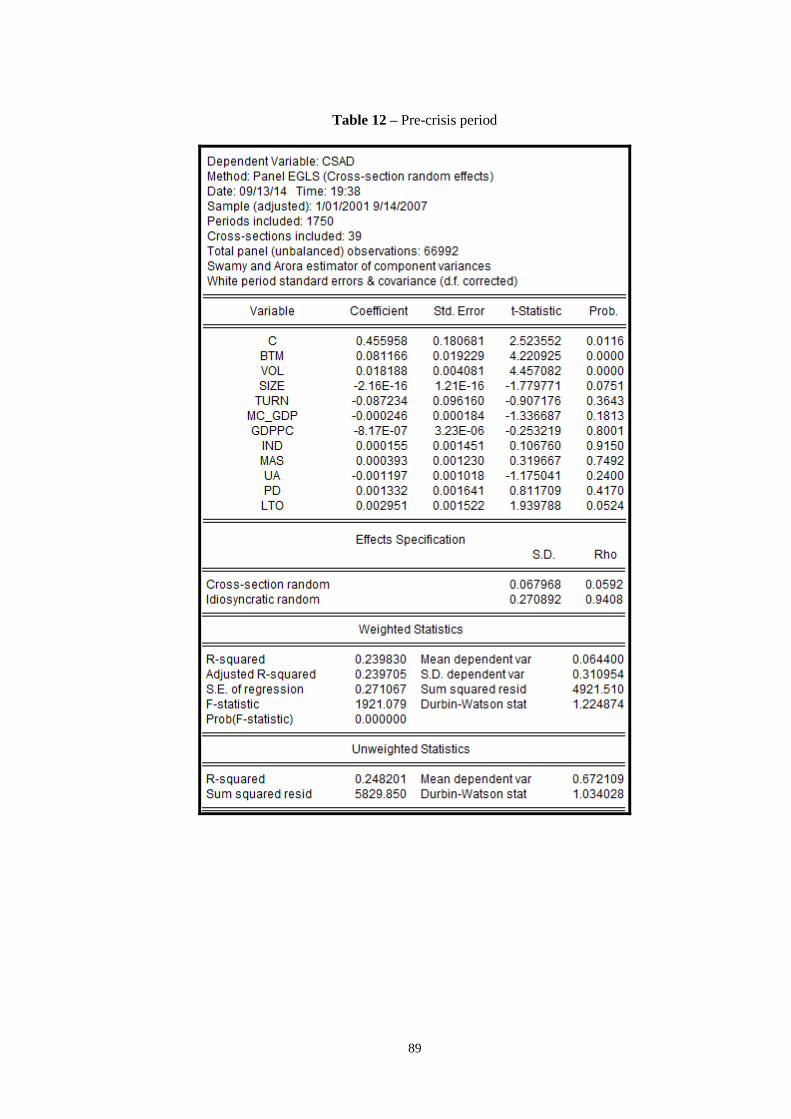
Table 12. Pre-crisis period .............................................................................................. 89
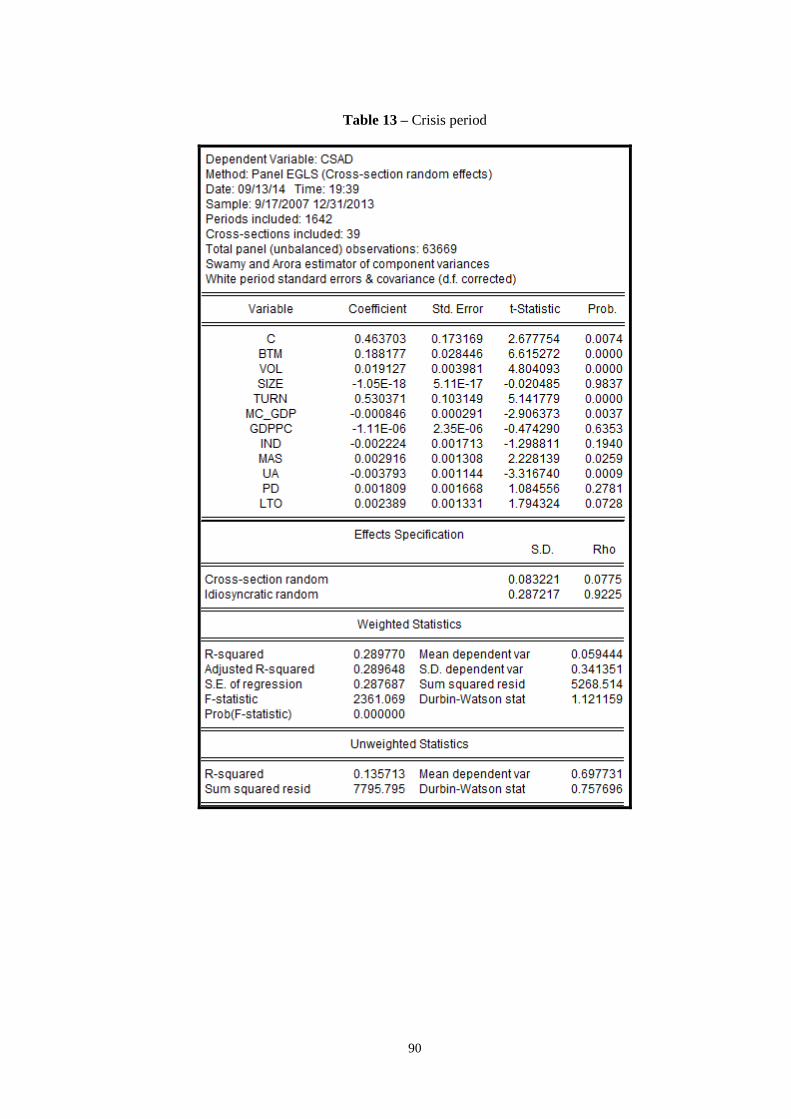
Table 13. Crisis period .................................................................................................... 90
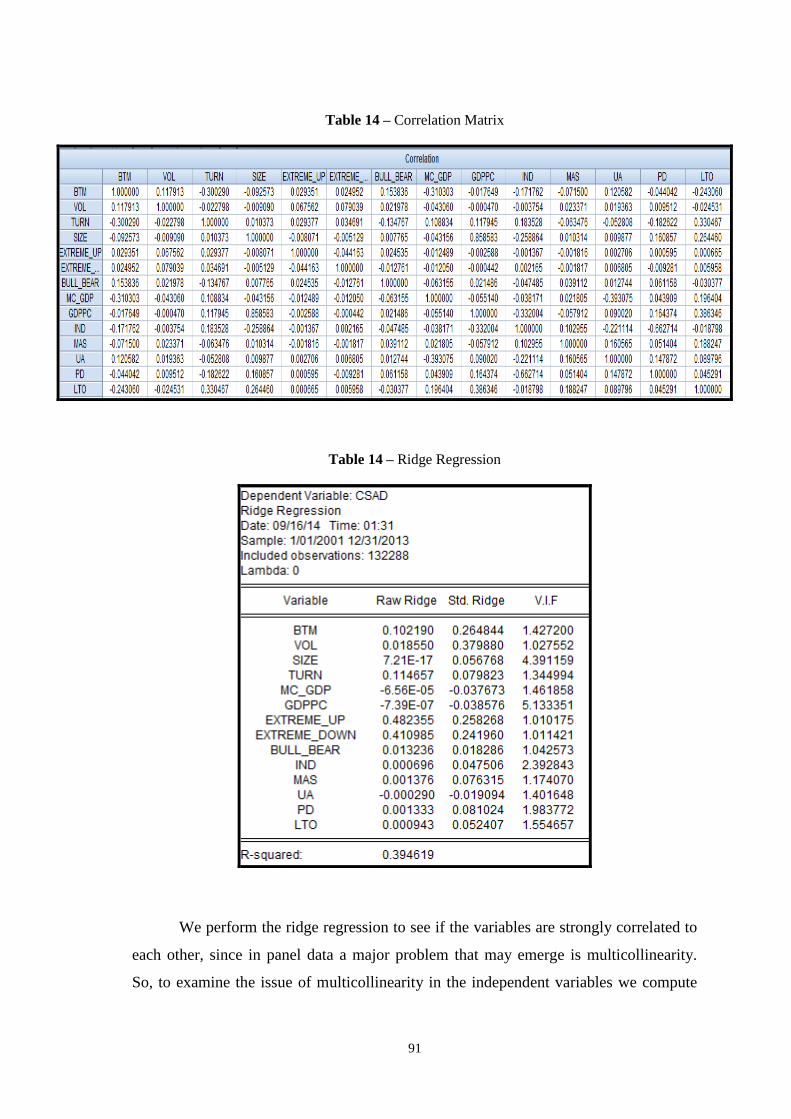
Table 14. Correlation Matrix .......................................................................................... 91
Table 15. Ridge Regression ............................................................................................ 91
Page 7
vii
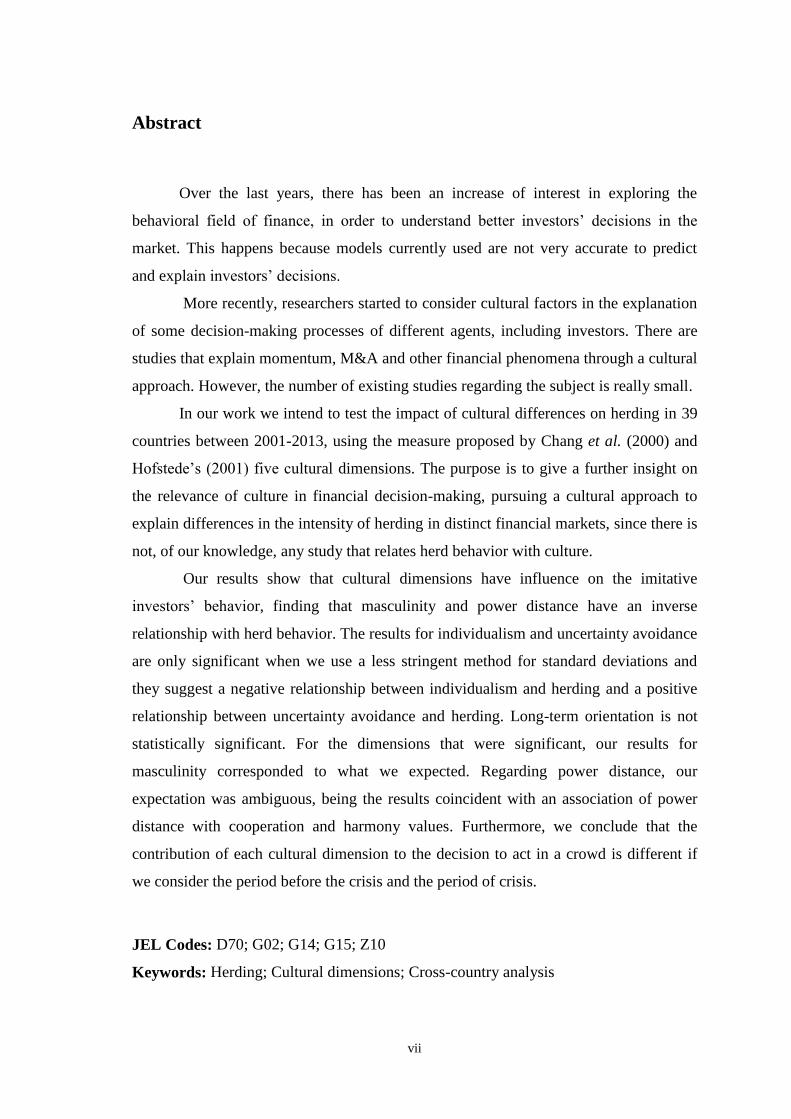
Abstract
Over the last years, there has been an increase of interest in exploring the
behavioral field of finance, in order to understand better investors’ decisions in the
market. This happens because models currently used are not very accurate to predict
and explain investors’ decisions.
More recently, researchers started to consider cultural factors in the explanation
of some decision-making processes of different agents, including investors. There are
studies that explain momentum, M&A and other financial phenomena through a cultural
approach. However, the number of existing studies regarding the subject is really small.
In our work we intend to test the impact of cultural differences on herding in 39
countries between 2001-2013, using the measure proposed by Chang et al. (2000) and
Hofstede’s (2001) five cultural dimensions. The purpose is to give a further insight on
the relevance of culture in financial decision-making, pursuing a cultural approach to
explain differences in the intensity of herding in distinct financial markets, since there is
not, of our knowledge, any study that relates herd behavior with culture.
Our results show that cultural dimensions have influence on the imitative
investors’ behavior, finding that masculinity and power distance have an inverse
relationship with herd behavior. The results for individualism and uncertainty avoidance
are only significant when we use a less stringent method for standard deviations and
they suggest a negative relationship between individualism and herding and a positive
relationship between uncertainty avoidance and herding. Long-term orientation is not
statistically significant. For the dimensions that were significant, our results for
masculinity corresponded to what we expected. Regarding power distance, our
expectation was ambiguous, being the results coincident with an association of power
distance with cooperation and harmony values. Furthermore, we conclude that the
contribution of each cultural dimension to the decision to act in a crowd is different if
we consider the period before the crisis and the period of crisis.
JEL Codes: D70; G02; G14; G15; Z10
Keywords: Herding; Cultural dimensions; Cross-country analysis
Page 8
viii
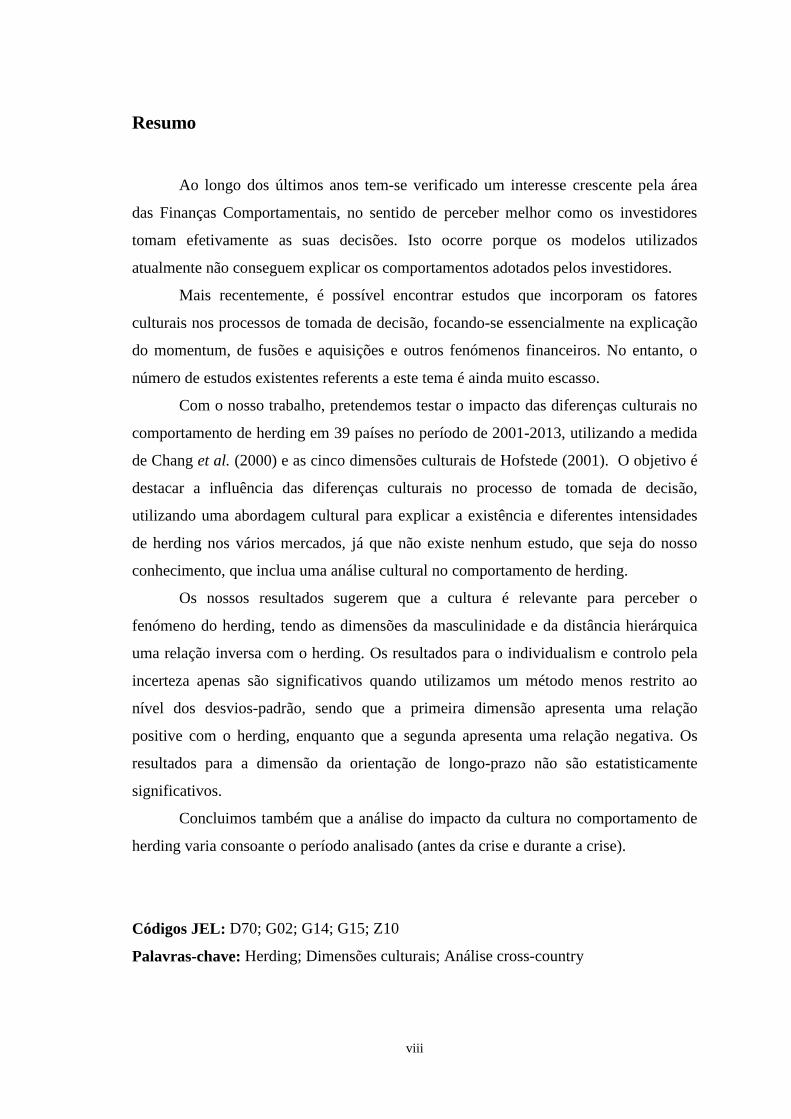
Resumo
Ao longo dos últimos anos tem-se verificado um interesse crescente pela área
das Finanças Comportamentais, no sentido de perceber melhor como os investidores
tomam efetivamente as suas decisões. Isto ocorre porque os modelos utilizados
atualmente não conseguem explicar os comportamentos adotados pelos investidores.
Mais recentemente, é possível encontrar estudos que incorporam os fatores
culturais nos processos de tomada de decisão, focando-se essencialmente na explicação
do momentum, de fusões e aquisições e outros fenómenos financeiros. No entanto, o
número de estudos existentes referents a este tema é ainda muito escasso.
Com o nosso trabalho, pretendemos testar o impacto das diferenças culturais no
comportamento de herding em 39 países no período de 2001-2013, utilizando a medida
de Chang et al. (2000) e as cinco dimensões culturais de Hofstede (2001). O objetivo é
destacar a influência das diferenças culturais no processo de tomada de decisão,
utilizando uma abordagem cultural para explicar a existência e diferentes intensidades
de herding nos vários mercados, já que não existe nenhum estudo, que seja do nosso
conhecimento, que inclua uma análise cultural no comportamento de herding.
Os nossos resultados sugerem que a cultura é relevante para perceber o
fenómeno do herding, tendo as dimensões da masculinidade e da distância hierárquica
uma relação inversa com o herding. Os resultados para o individualism e controlo pela
incerteza apenas são significativos quando utilizamos um método menos restrito ao
nível dos desvios-padrão, sendo que a primeira dimensão apresenta uma relação
positive com o herding, enquanto que a segunda apresenta uma relação negativa. Os
resultados para a dimensão da orientação de longo-prazo não são estatisticamente
significativos.
Concluimos também que a análise do impacto da cultura no comportamento de
herding varia consoante o período analisado (antes da crise e durante a crise).
Códigos JEL: D70; G02; G14; G15; Z10
Palavras-chave: Herding; Dimensões culturais; Análise cross-country
Page 9
1
1. Introduction
The relevance of studying investors’ behavior has increased over the last few
decades, concerning especially the when and how behavioral patterns impact stock
prices (Blasco et al., 2012). This happens because sometimes the models currently used
fail to explain some phenomena in financial markets (e.g. bubbles), leading us to the
need of considering the contributions of behavioral finance to try to understand how
investors really make their decisions and the impact of those decisions on stock prices.
In fact, the 90’s were marked by several financial crises worldwide that warned
economists for the fragility of the financial system and the behavioral component that
may be associated with such episodes. Empirical studies argue that, although
fundamentals help to predict the occurrence of crises, the fact is that it is possible for a
country with solid macroeconomic indicators to be hit by a crisis or for a country with
weak fundamentals never to suffer from a crisis (Cipriani and Guarino, 2008). This idea
was also explored by Fenz and Pelzman (2012), highlighting that traditional theories are
not able to fully explain or predict trends in financial markets and, since economy is a
social science, we have to consider both social and psychological forces underlying
investors’ behavior. This clearly prompts the question if financial decisions are made in
accordance with traditional models, or if investors suffer from psychological biases and
are prone to social interactions that make behavioral considerations relevant.
The behavioral component of decision-making process is easily understandable
if we think of our daily life. Every day we make decisions that we can hardly classify as
entirely of our own. For example, when we want to choose a restaurant, we are probably
influenced by others’ opinion (e.g. through friends that already visited the restaurant or
customer reviews) or tend to choose the restaurant that everybody goes. Indeed, we are
prone to psychological biases and social interactions that may lead us to adopt a
different choice from what is deemed “rational”. In the same way, we can say that an
investor does not make decisions based on his information exclusively and what would
be his optimal choice, but also considers what other investors are doing in the market.
In fact, according to Fenz and Pelzmann (2012), we can see that investors buy
and sell stocks in reaction to the buy and sell decisions made by other investors and
Page 10
2
their recommendations. This is reinforced in the studies of Shiller and Pound (1989),
Hong et al. (2004) and Hong et al. (2005) that conclude investors find a market to be
more attractive if their peers also participate. The idea that social interaction influences
investors’ decisions is shown in Hong et al. (2004), who concluded that market
participation is related to the word-of-mouth phenomenon and the enjoyment people get
from conversations with friends about market movements. Also, Hong et al. (2005)
realized that investors from the same city tend to trade the same stocks rather than those
traded by managers from a different city, since they are more prone to direct contact
with one another, leading them to exchange ideas among them. Finally, Shiller and
Pound (1989) analysed individual and institutional investors through a survey and
reached the conclusion that both of them get interested in a stock because they are
stimulated by another person and not by reading about the stock alone.
Since individuals take into account others’ opinion, it is important to analyse a
collective behavior, called herding, that may emerge in financial markets. The relevance
of this phenomenon, where people act in a crowd, is related to the ability it has to
explain variability in the returns, due to price alterations that imply prices to deviate
from fundamentals (Christie and Huang, 1995).
On the other hand, it is important to notice that investors’ behavior and their
social interactions are also dependent on the country they live in, because they have
different cultural backgrounds that impact their view of the reality. In that sense, Stulz
and Williamson (2003) alerted that if individuals are prone to psychological biases that
influence their financial decisions, it is almost inevitable that their views of the world,
as determined by culture, play a role in how they act in financial markets. Chang and
Noorbaksh (2009) noted as well that recent literature has been paying more attention to
social and cultural environments to study effectively economic phenomena.
Consequently, although investors’ decisions should reflect capital market
theories and optimal portfolio allocation that are globally uniform, we have to consider
country-specific differences that may be related with cultural influences on individuals’
behavior (Beckmann et al., 2008).
Even with the recognition that culture can potentially impact investors’ decisions
we cannot find many studies incorporating culture in finance and, there is not any of our
knowledge that explains herding through cultural differences among countries. So, we
Page 11
3
try to fill this gap in literature, testing if the herd behavior observed in financial markets
varies with cultural dimensions.
Hence, our main purpose is to understand the behavioral differences in financial
markets across the globe, focusing on the influence of culture on herd behavior,
analysing this phenomenon in 39 countries. For that we use the measure of herding
proposed by Chang et al. (2000), perceiving that way how investors really make their
decisions in financial markets and not focusing on what they should ideally do. Also,
we confront the existence and intensity of herding with cultural differences, applying
Hofstede’s five cultural dimensions (2001) to observe if national culture affects
investors’ behavior and in what way. We will essentially focus on the cultural approach
since there is already a vast literature regarding herd behavior.
The dissertation is structured as follows. In section 2 we have a brief literature
review concerning herding and culture, where we summarize the main previous
empirical studies on herd behavior, capturing different countries, periods and measures
of herding, and present the cultural dimensions we use, as well as its criticisms. Also,
we expose some of the empirical studies made so far that relate financial phenomena
with cultural differences. We proceed in section 3 with the formulation of hypothesis
regarding the impact cultural dimensions may have on herd behavior, as well as data
concerning stock market, cultural dimensions and determinants of herding. We also
present in this section the methodology employed to measure herding and to test the
influence of the cultural dimensions on herding. The results are shown in section 4,
where we discuss the impact that the determinants of herding and, most importantly,
cultural dimensions have on herd behavior. Also, we give some insight of the
consequences the results obtained can have in management, political decisions and
financial markets. In section 5 we conclude, pointing some limitations of our study and
suggesting further research on the subject.
Page 12
4
2. Literature Review
Nowadays, the capital market theory about risk and return studied by Fama
(1970) and the theory of having a diversified portfolio studied by Markowitz (1952) are
worldwide taught, however, if we look at the anomalies that occur in financial markets,
we can observe that their magnitude and frequency are too significant to be ignored. For
instance, Jegadeesh and Titman (1993, 2001) realized that momentum profits are around
12% a year in the United States and Rouwenhorst (1998) reached the same conclusion
when analysed 12 European countries. Also, De Bondt and Thaler (1985) noticed that
on the long-run tends to exist a mean-reversion effect, concluding that a losing portfolio
outperforms a winner portfolio by approximately 8% per year. Both momentum and
mean-reversion effects (as well as other phenomena observable in financial markets) are
unlikely to be explained only by traditional risk-based theories.
In fact, we can recently observe an increase in behavioral finance literature
concerning the anomalies that happen in financial markets and the reasons behind them,
focusing on psychological forces that make individuals to act differently from what
traditional models predict. This makes sense because, like Baruch (1957) (cfr Mohacsy
and Lefer, 2007) referred, “above all...stock market is people. It is people trying to read
the future”, so we have to consider in our studies about financial markets the human
component that reflects conflicting judgments made by investors.
In particular, in this behavioral literature we can find several studies related to
herd behavior, which is the phenomenon we want to analyse, since it may explain
bubbles and similar extreme situations. However, available literature focus more in the
existence of herding in one particular market (e.g. Christie and Huang, 1995; Lobão and
Serra, 2006; Goodfellow et al., 2009; Tessaromatis and Thomas, 2009; Patro and
Kanagaraj, 2012) or, in a fewer number, even in the comparison between markets
around the world (e.g. Chang et al., 2000; Chiang and Zheng, 2010; Economou et al.,
2011; Lindhe, 2012), but without a cross-country analysis focusing on country-specific
factors, like culture, that can impact investors’ decision-making.
We begin our literature review with the definition of herding and the possible causes
for that phenomenon (both rational and irrational). Then, we present some existing
empirical studies on herd behavior covering different markets, methodologies and
Page 13
5
periods. We proceed with the definition of culture and explanation of the cultural
dimensions to be employed in this study, as well as the main criticisms around them.
We finish our literature review with the empirical studies made so far that include
culture in financial decision-making.
2.1 Herding
During a crisis, “herd behavior” has a negative connotation in financial lexicon,
being associated with a type of behavior that exacerbates volatility, destabilizes markets
and increases the fragility of the financial system (Bikhchandani and Sharma, 2001).
Considering this, we should first of all clarify the meaning of herding. Herd
behavior consists in investors’ mutual imitation and, according to Christie and Huang
(1995), implies individuals to suppress their own beliefs and follow what others are
doing, basing their investment decisions on collective actions of the market, even when
they disagree with its predictions. This suggests that investors are attracted to market
consensus and individual returns tend to approach market return. In the words of
Banerjee (1992), herding simply consists in “everybody doing what everyone else is
doing even when their private information suggests doing something else”, which leads
to a convergence of action in the market.
One of the most claimed examples of herding is given by Keynes (1936), that
compared investors’ behavior in financial markets to the behavior of judges in a beauty
contest, where the decision of a judge is based on what he expects others will choose
and not on who he actually thinks is the most beautiful. Shiller (2005) stated that the
explanation for people to act in the same way is partly related with their reaction to the
same public available information, but he also admitted that this cannot be the only
reason. Taking this into account, we may be led to think of herding as an irrational
behavior where an investor simply follows the others in the market blindly. However, as
mentioned by Tversky and Kahnemann (1986), reactions induced by psychological and
behavioral traits can also be consistent with rational decision-making. Thus, it is
important to understand the reasons behind such behavior.
According to Devenow and Welch (1996), there are two polar views of herding:
irrational and rational. The irrational view is related to psychology, implying investors
Page 14
6
to follow one another blindly and the rational view is related to optimal decision-
making being distorted by information difficulties or incentive issues.
Considering the rational view, one of the explanations is the information-based
herding, which was initially developed by Banerjee (1992), Bikhchandani et al. (1992)
and Welch (1992). According to this explanation, the decisions are made sequentially,
so an investor observes the actions made by other investors and infer that they have
relevant information, thus incorporating that information in his decision-making. This is
more prone to happen when costs of acquiring information in the market are high,
because in this case people tend to not incur in such costs and trust other’s decisions,
assuming that they have more information. Bikhchandani and Sharma (2001)
demonstrated this situation through a sequential game, where the investor that is
currently deciding has access to his own information and he is able to observe the
actions that the other investors in the market made before. Although he is not able to see
the private information that other investors have, he believes that their actions reflect
some relevant information. So, if the number of predecessors who made a certain
decision is higher by two or more than the number of predecessors that made the
opposite one, he will ignore his private information and decide according to his
predecessors. This will cause a formation of what is called an informational cascade,
where the actions observed do not reflect private information anymore, leading all
investors that decide after to act in accordance with their predecessors. Consequently, if
the number of investors choosing the same action is high, the following investors will
not reflect their private information in their decisions and will imitate their
predecessors.
Another explanation for this phenomenon has to do with principal-agent
relationship. Usually the manager and the owner of a fund are different people, so the
manager has an incentive to gain or maintain his reputation in order to have a good
evaluation. According to Bikhchandani and Sharma (2001), if the manager is not sure
about his ability, he prefers to follow what others are doing in the market in order to
maintain his reputation. The authors argued that is safer for the manager to have this
behavior because if their decision turns out to be the right one, he will be seen as a good
manager, and if their decision proves to be the wrong one, he will not lose his reputation
since that outcome is attributed to bad luck (and not to the fact of being a bad manager,
Page 15
7
because it is almost impossible that nobody got the right information). Keynes (1936)
summarized reputational incentives to herd affirming that “it is better for reputation to
fail conventionally than to succeed unconventionally”. Ohlson (2010) also followed the
same idea referring that investors have an incentive to stand out from the crowd doing
the opposite thing that others are doing, however the benefit they will obtain for being
the only ones to be right is not as great as the risk of being the only ones to be wrong.
The first reputational model of herding was developed by Scharfstein and Stein
(1990). In their model they considered two different kinds of managers (the “smart”
ones that receive informative signals and the “dumb” ones that only receive noise
signals), where the manager with lower aptitude (“dumb”) mimics the manager with
higher aptitude (“smart”), regardless of his own signal, in order to be seen as a high
ability manager. But their results predicted that even “smart” managers would have
incentive to herd. That happens because a bad investment decision only reveals the
manager’s poor quality if the rest of the managers make a different investment (if
everyone made the same bad decision it is suggested that it was due to a poor
investment climate). Then, if enough “dumb” managers herd on a bad decision, even
“smart” managers would prefer to herd instead of taking the risk with an investment
they believe to be superior.
The last cause of rational herding is related to the compensation that the investor
will get. If his compensation is related to the comparison made between his
performance and the performance of the market, he will have incentives to imitate other
investors (Bikhchandani and Sharma, 2001).
Although we can find theoretical grounding to justify the existence of herding, to
prove it empirically is a difficult task because it consists in correlations in investors’
behavior. Since we cannot access their private information, when we observe investors
trading in the same direction, we do not know if they are imitating others or if they just
had access to the same information (this is known as “spurious herding”) However, if
the decision that everyone made in the market turned out to be the wrong one, we can
say that investors imitated each other, because it does not seem very plausible that no
one received the correct signal (Effinger and Polborn, 2001).
Page 16
8
2.2. Prior empirical studies of herding
Empirically, we can find several studies concerning herd behavior that span
different periods and markets from diverse geographical areas and with different
development levels. The authors that analysed this phenomenon opted to employ
different measures of herding, being the measures of Lakonishok et al. (1992), of
Christie and Huang (1995) and of Chang et al. (2000) the most used ones.
The measure of Lakonishok et al. (1992) explores whether managers tend to end
up trading in the same side of the market in a given stock, observing if there is a
disproportionate number of managers buying or selling a specific stock. The measure of
Christie and Huang (1995) consists on the cross-sectional standard deviation of returns
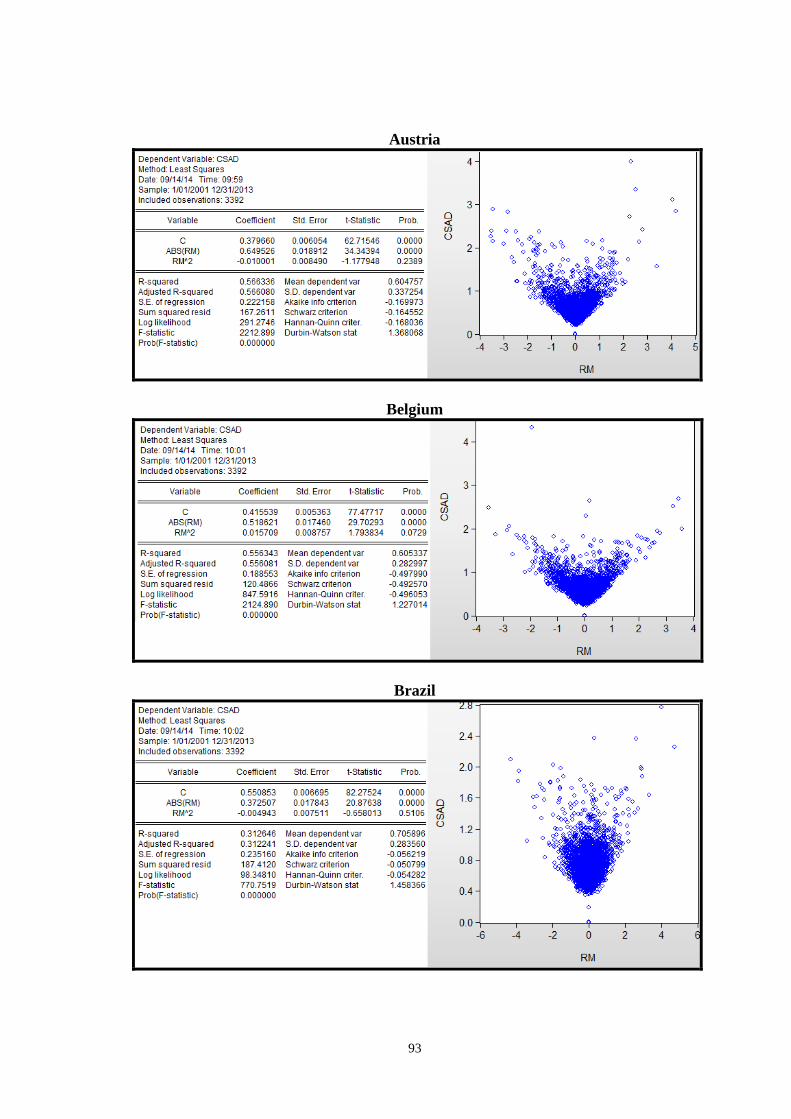
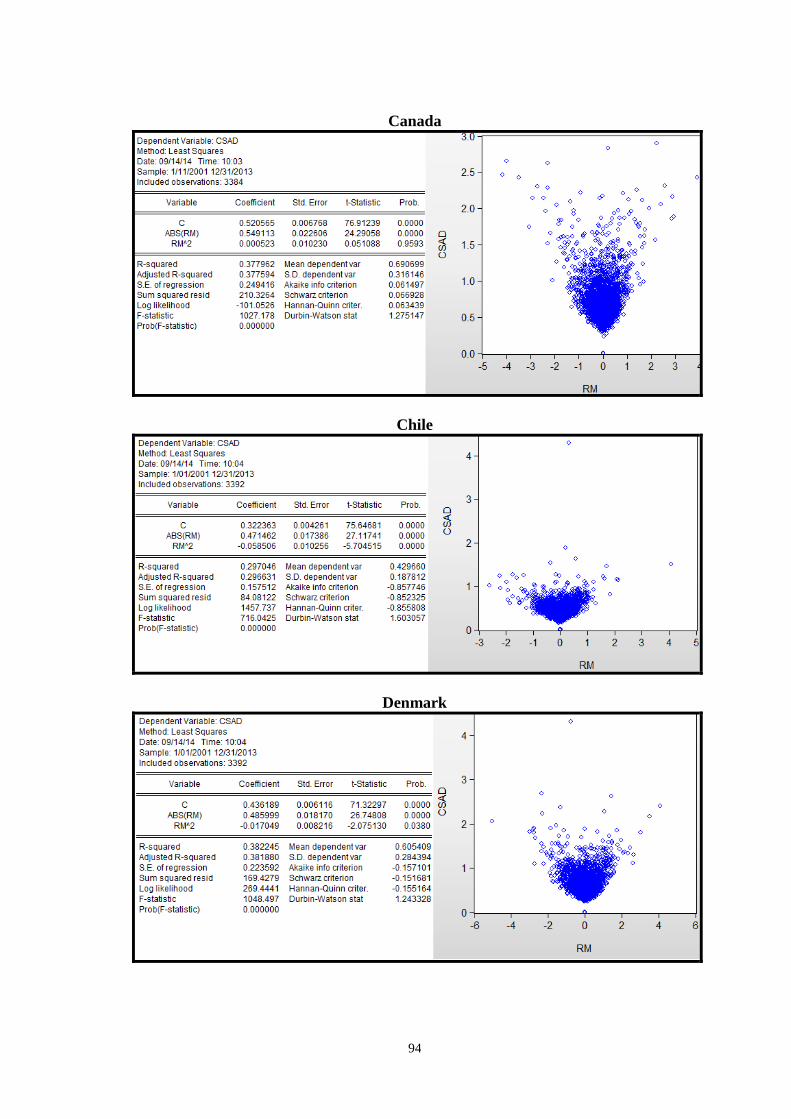
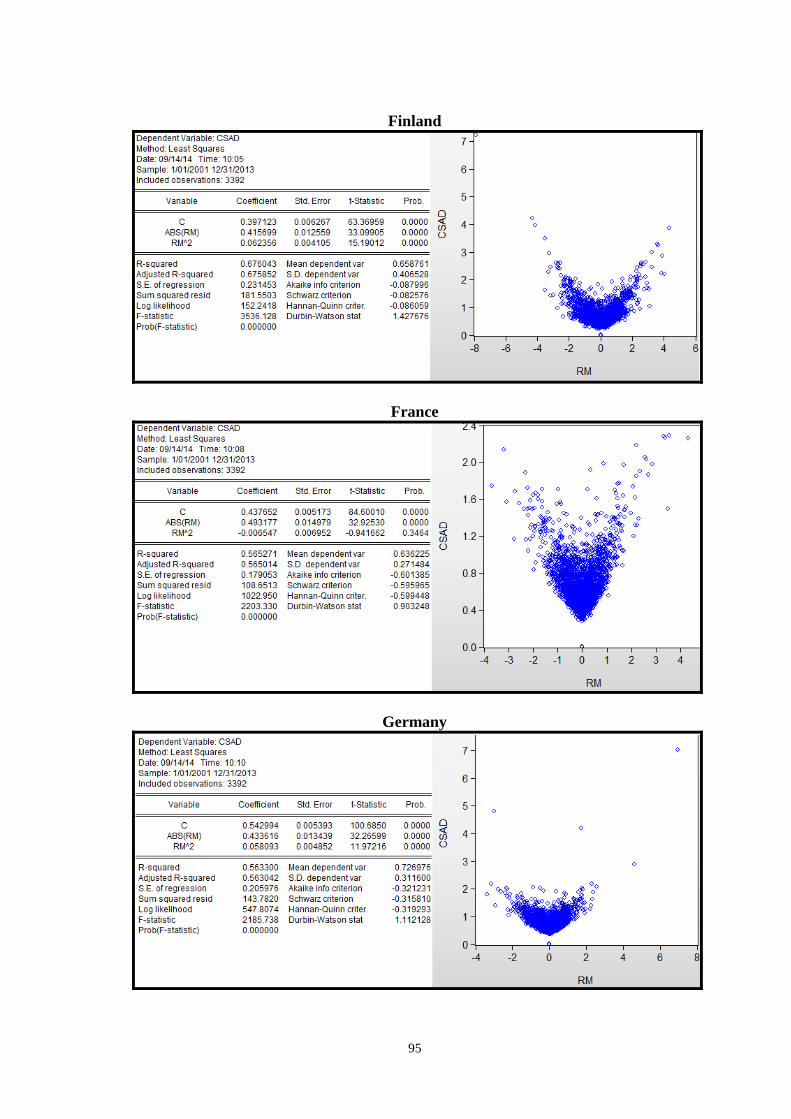
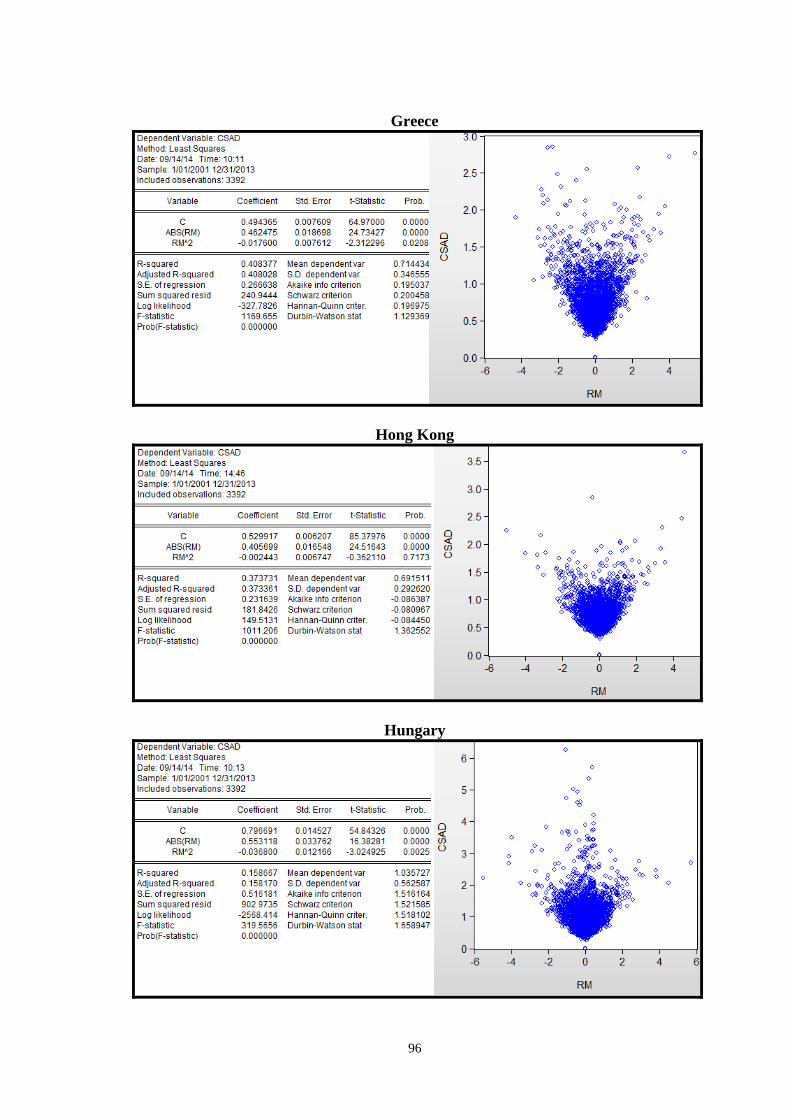
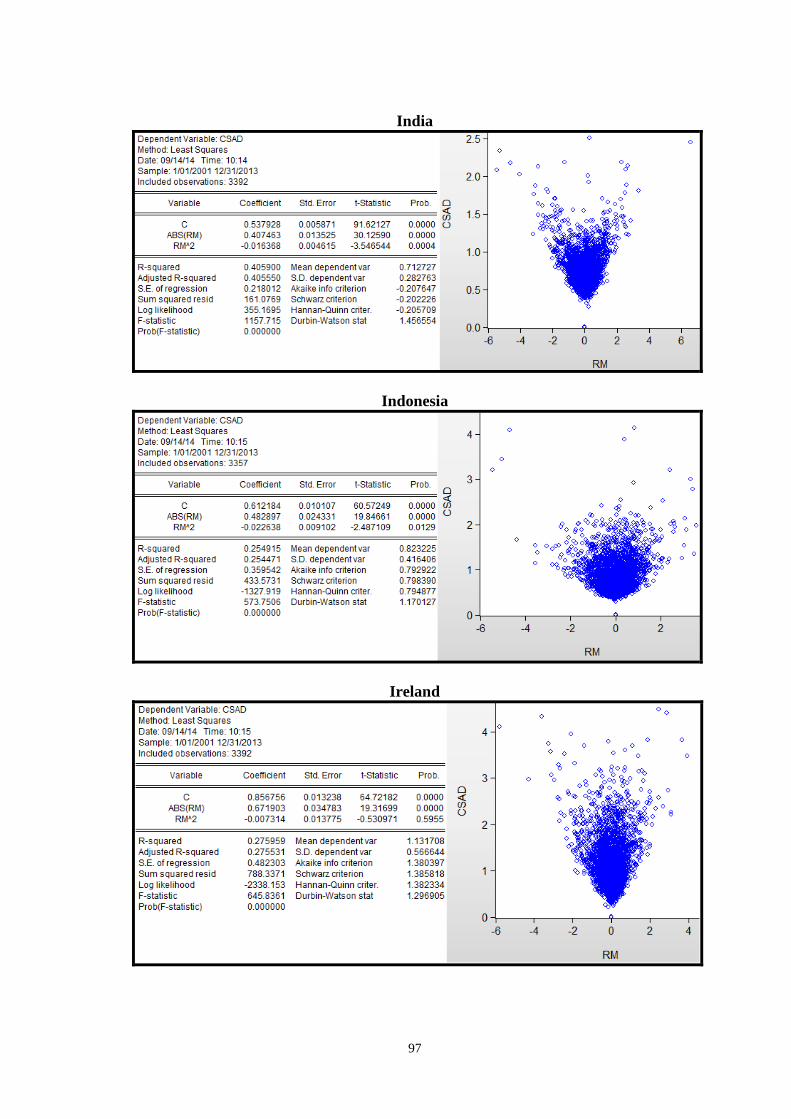
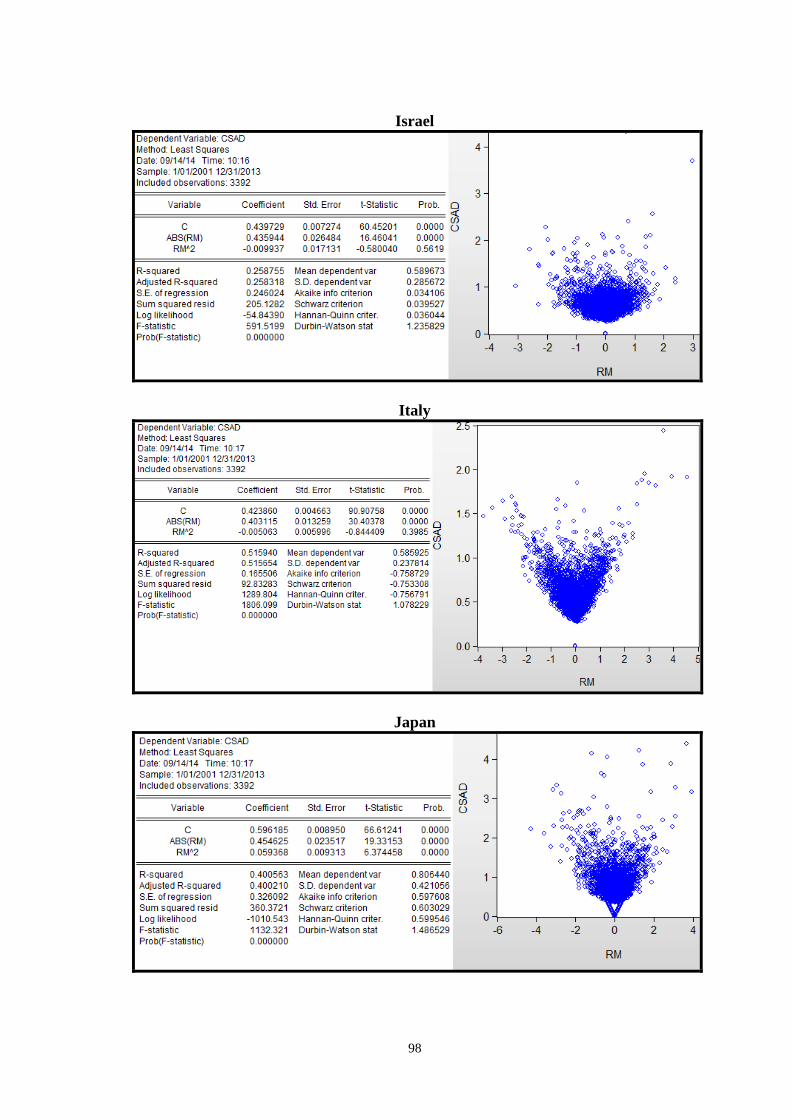
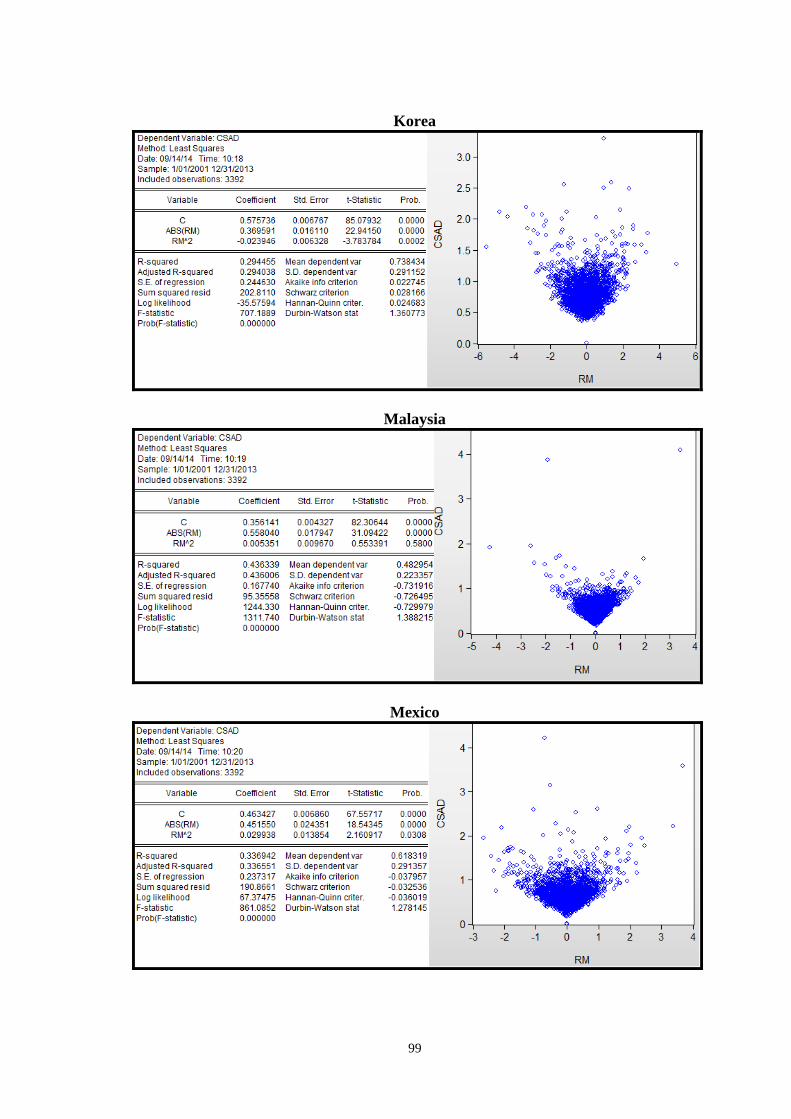
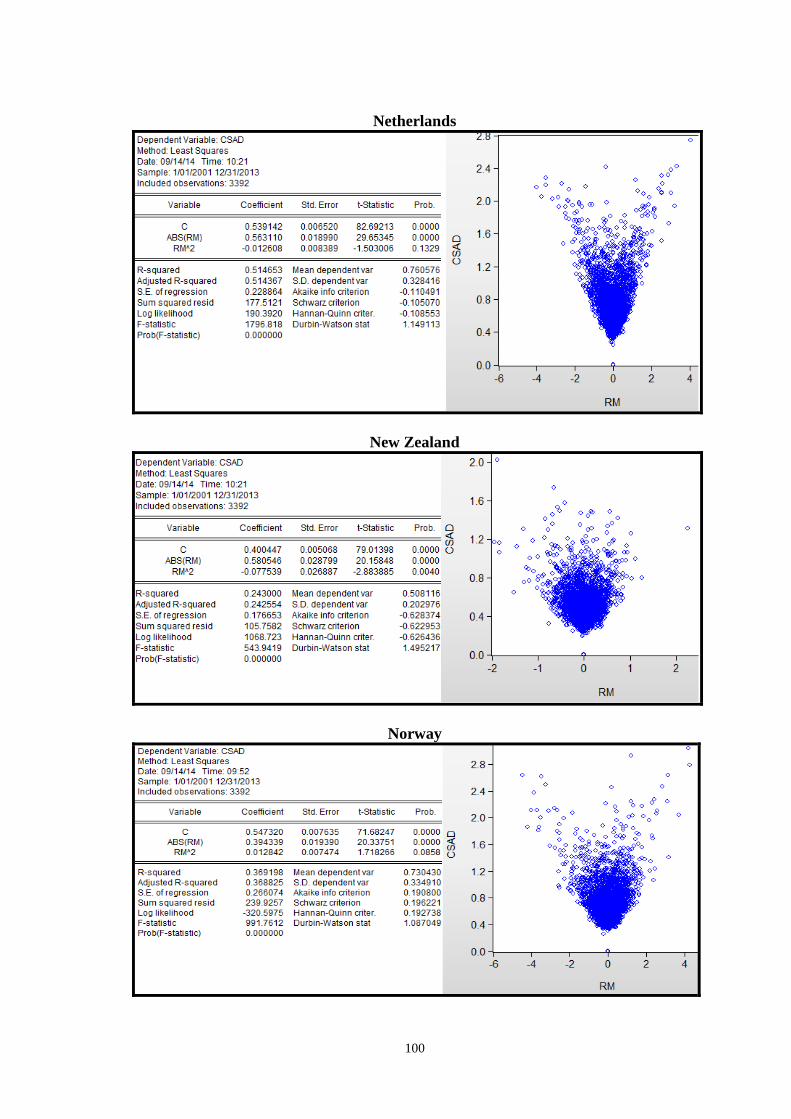
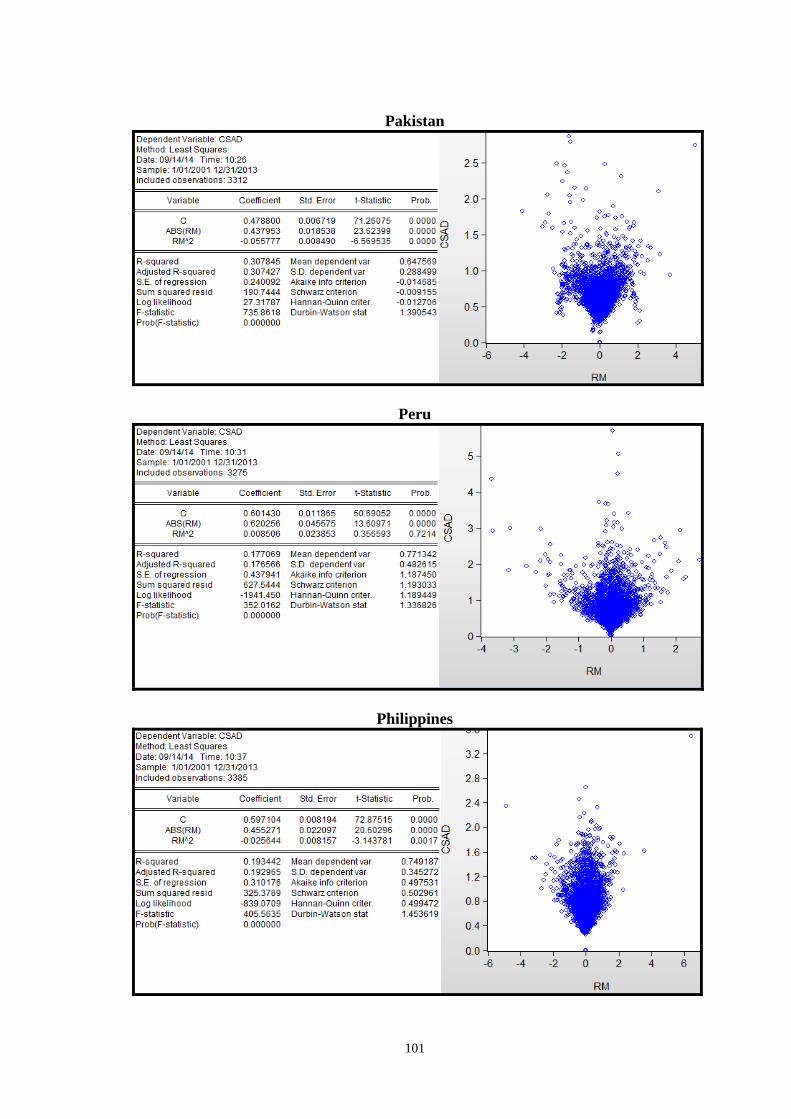
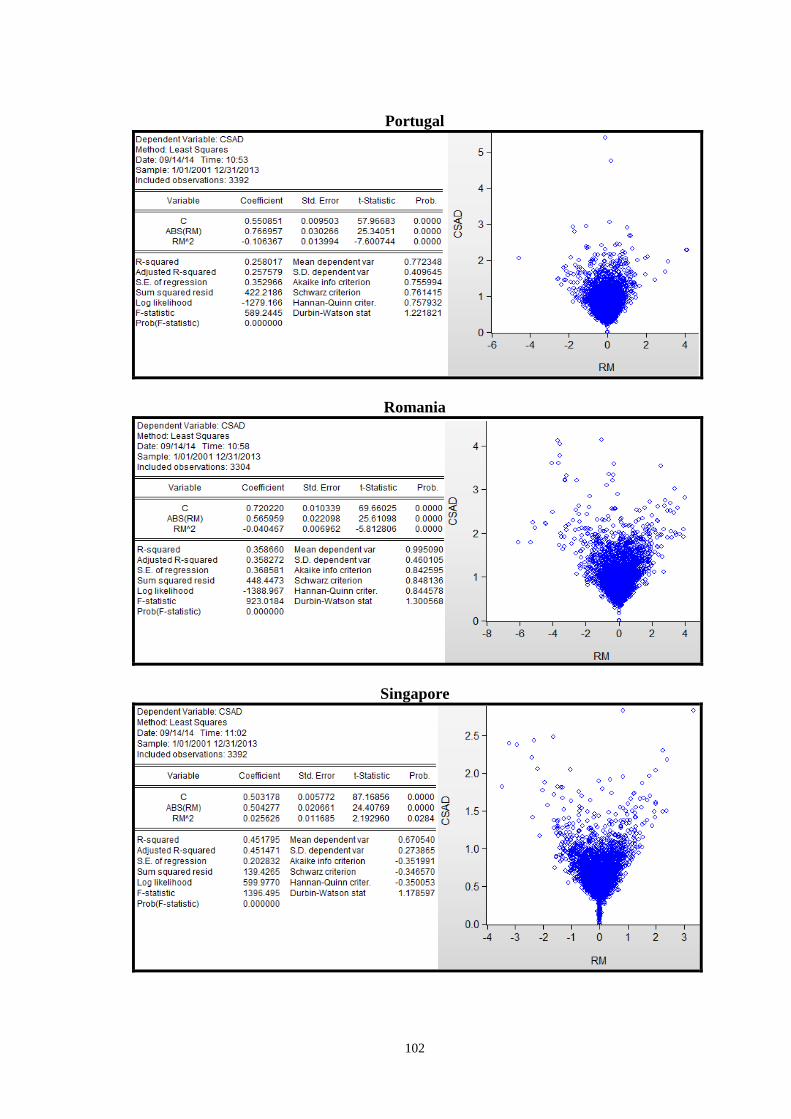
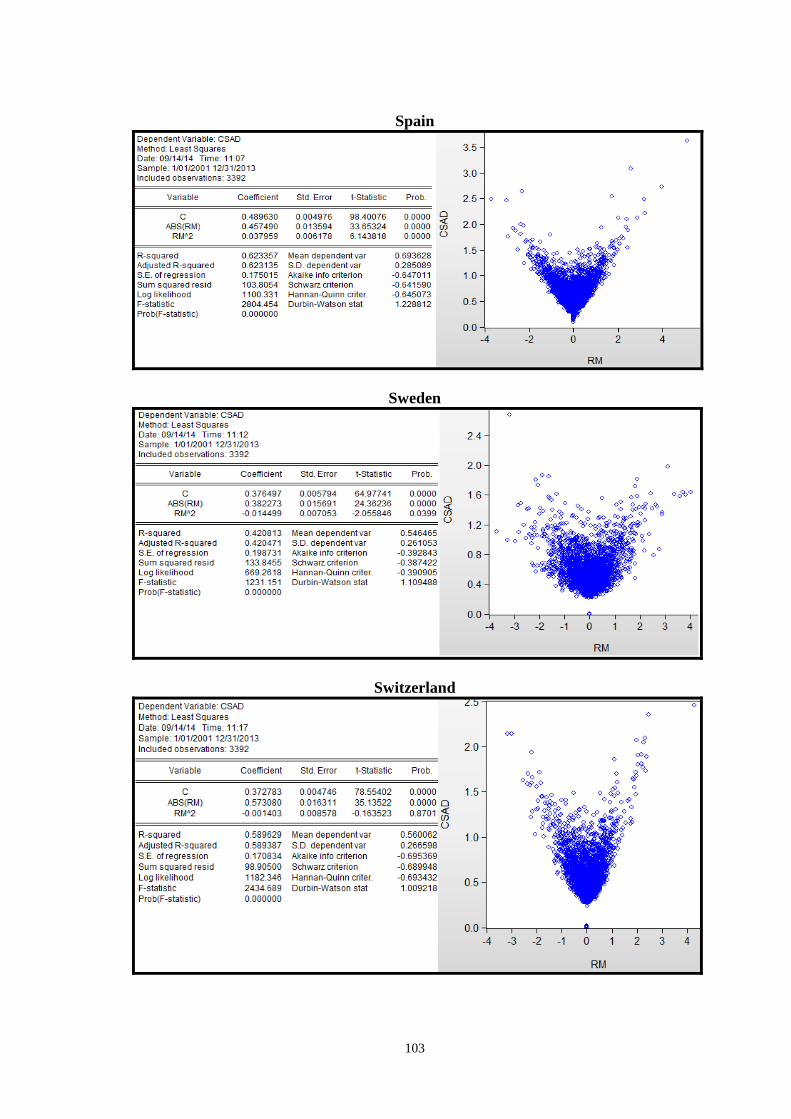
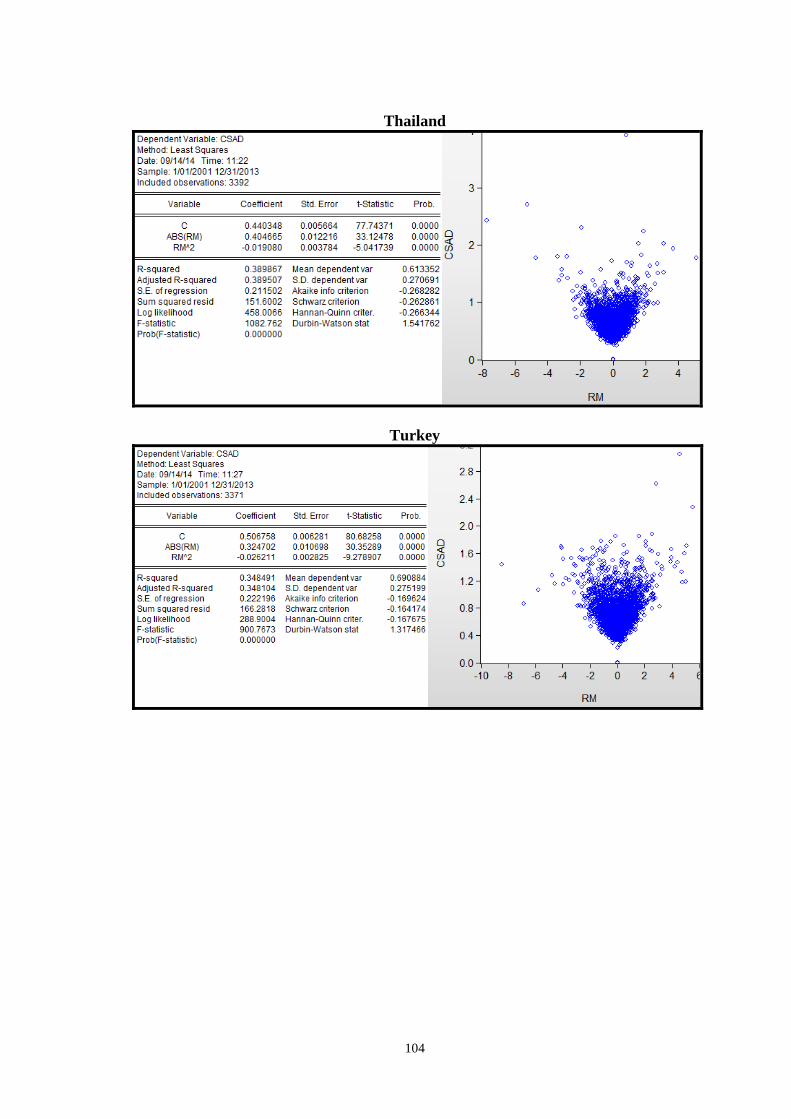
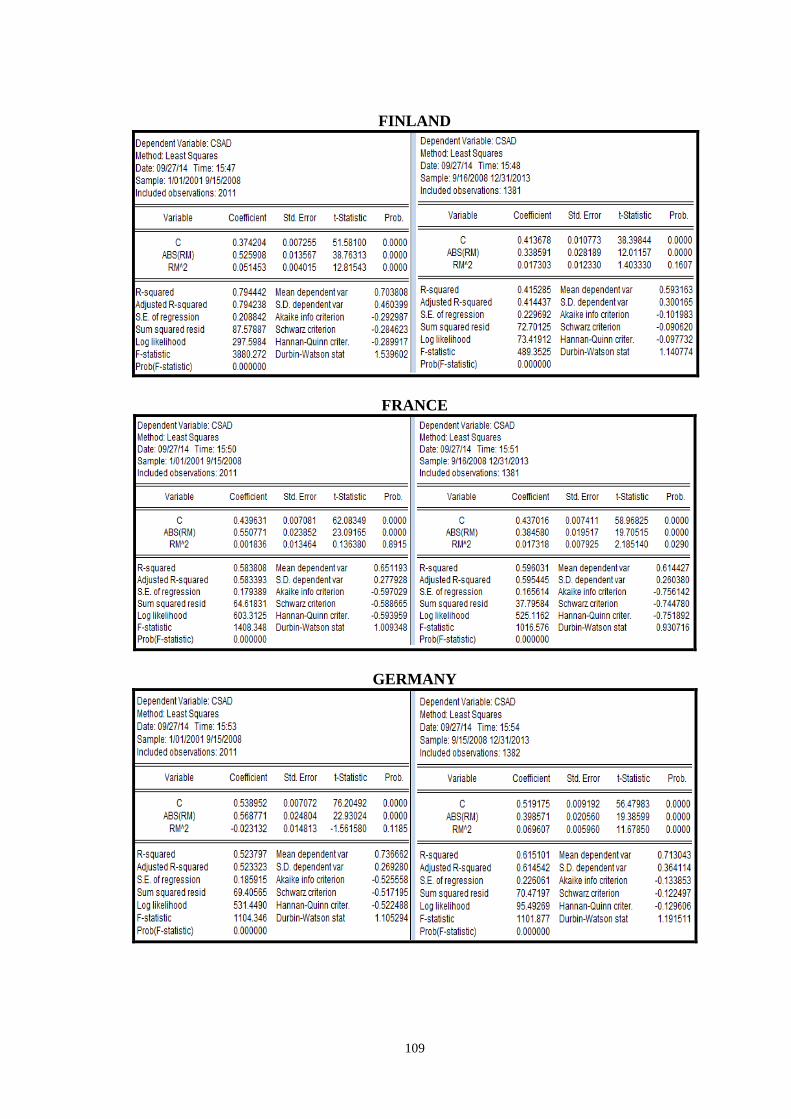
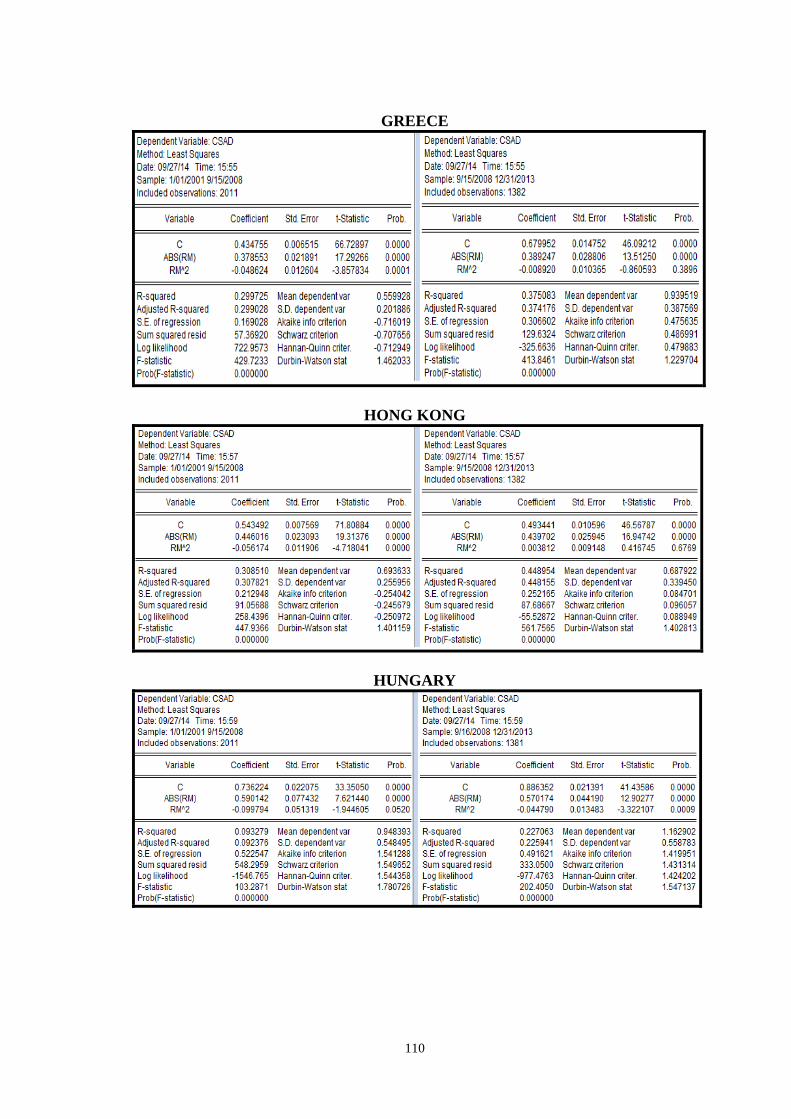
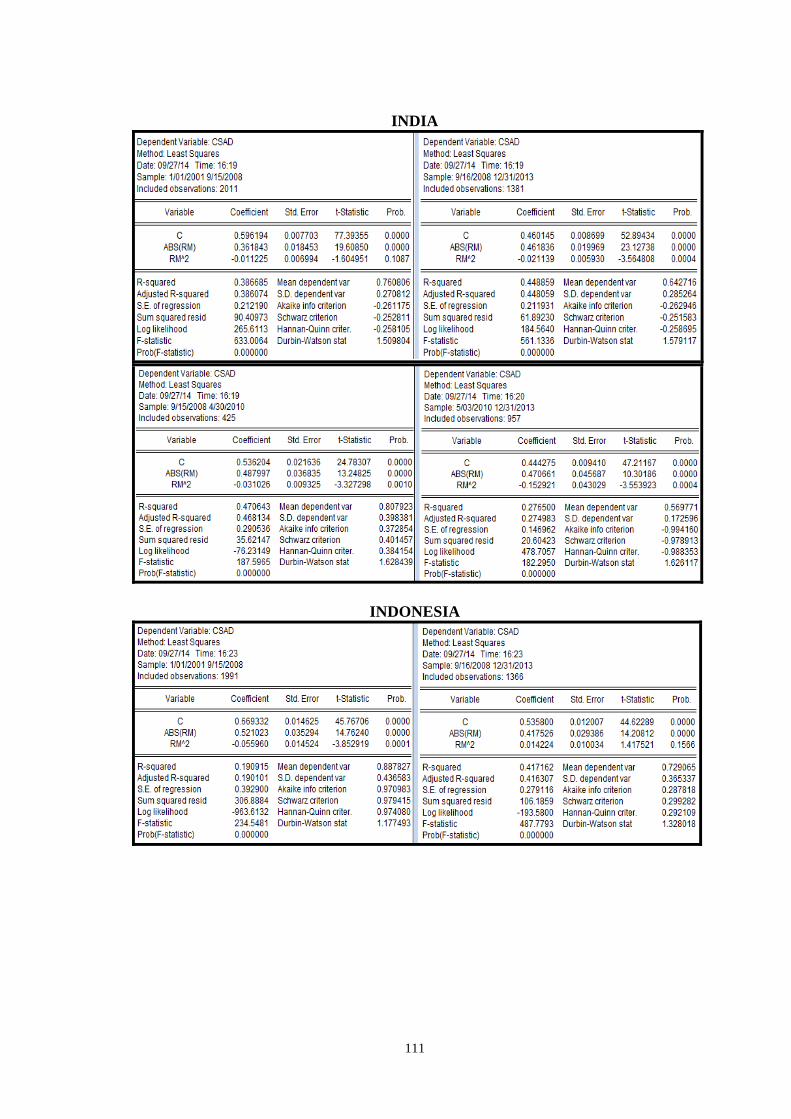
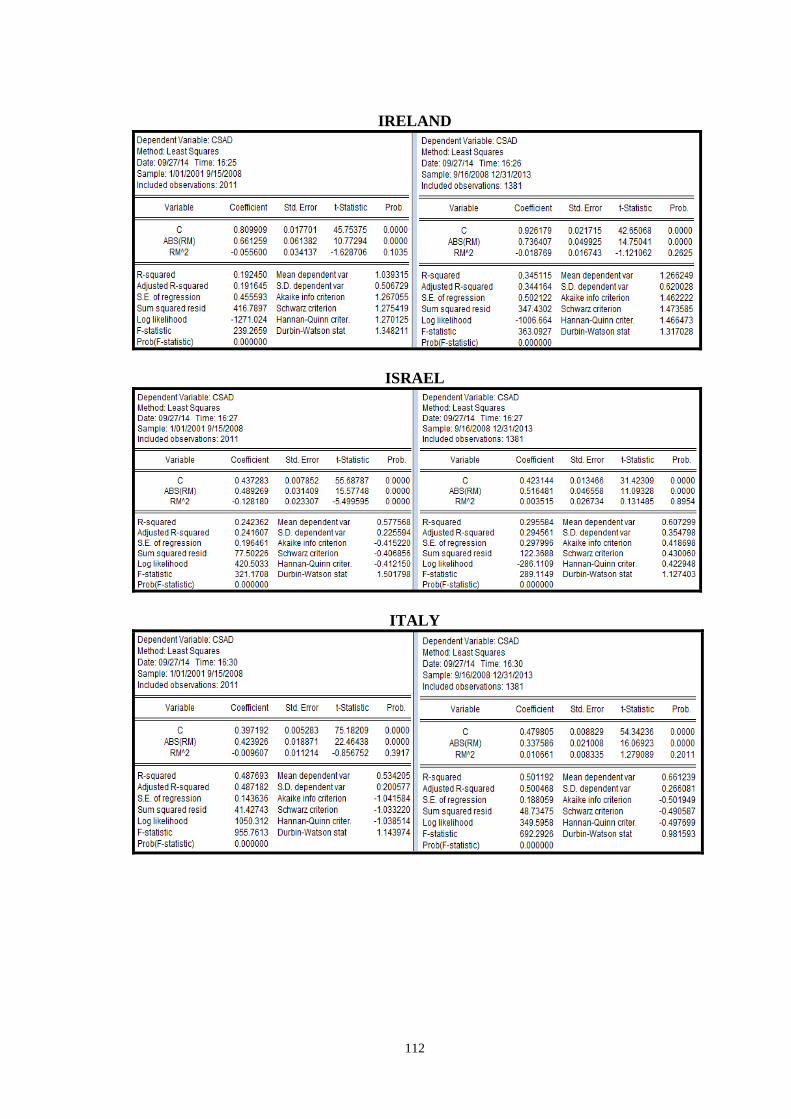
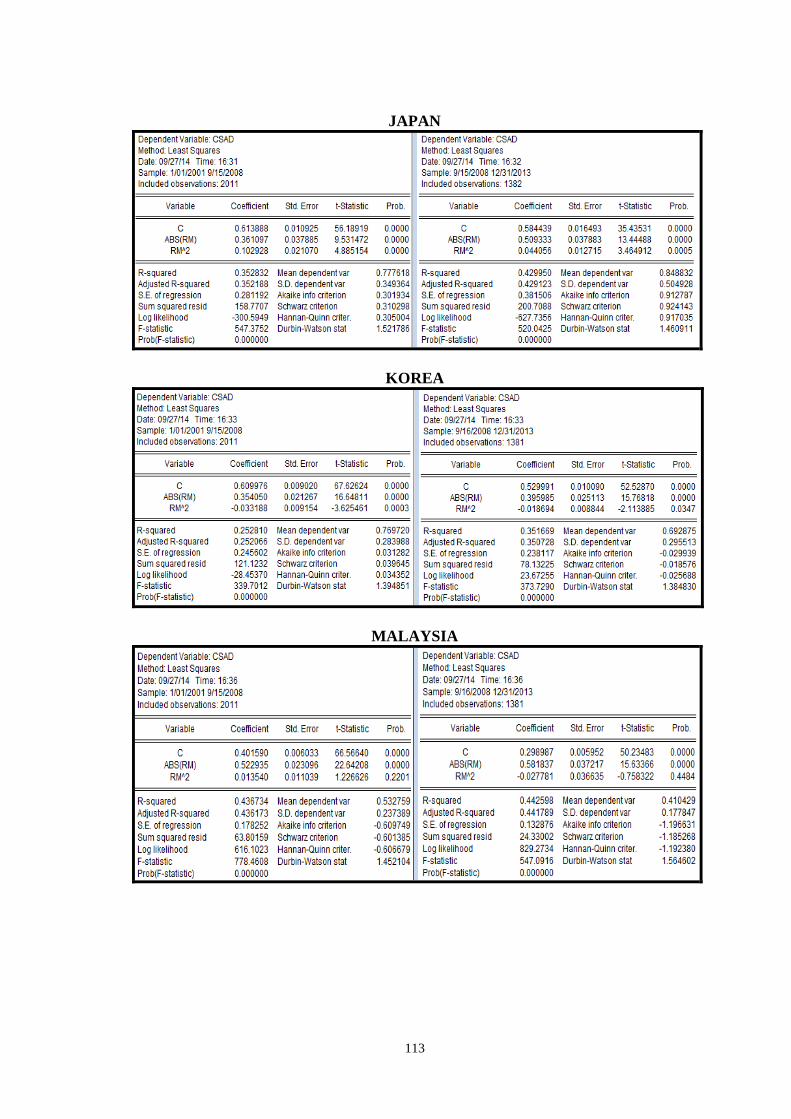
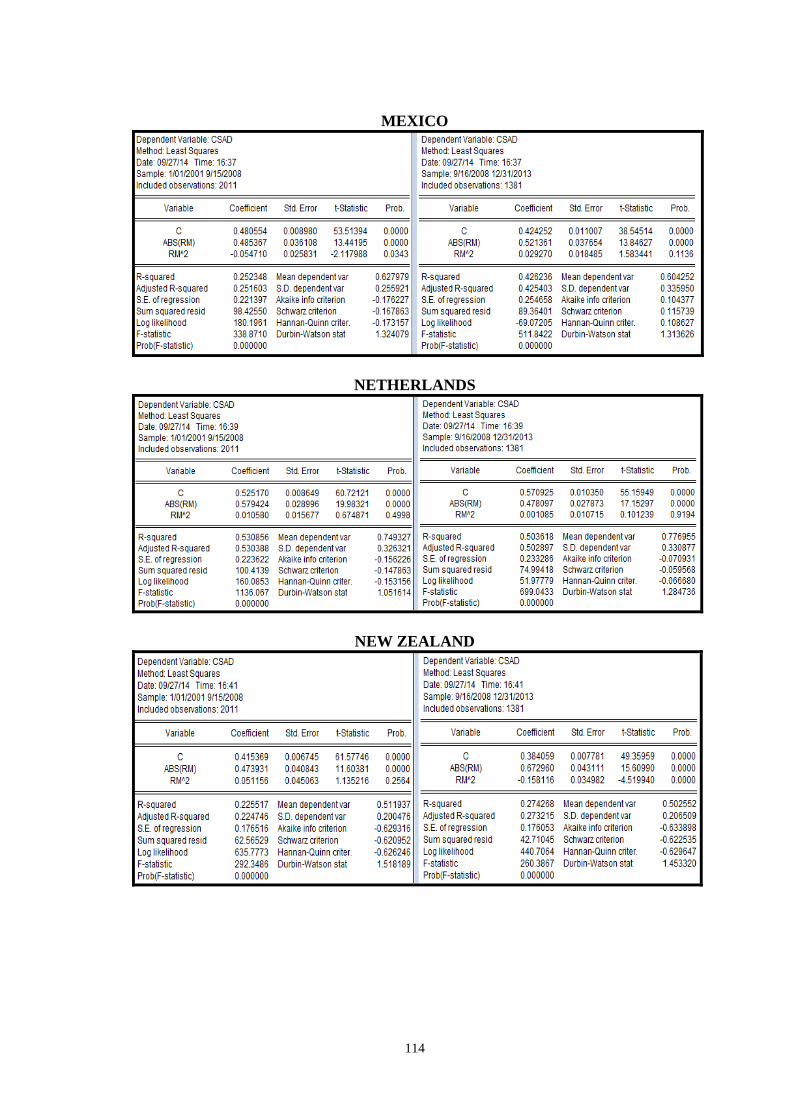
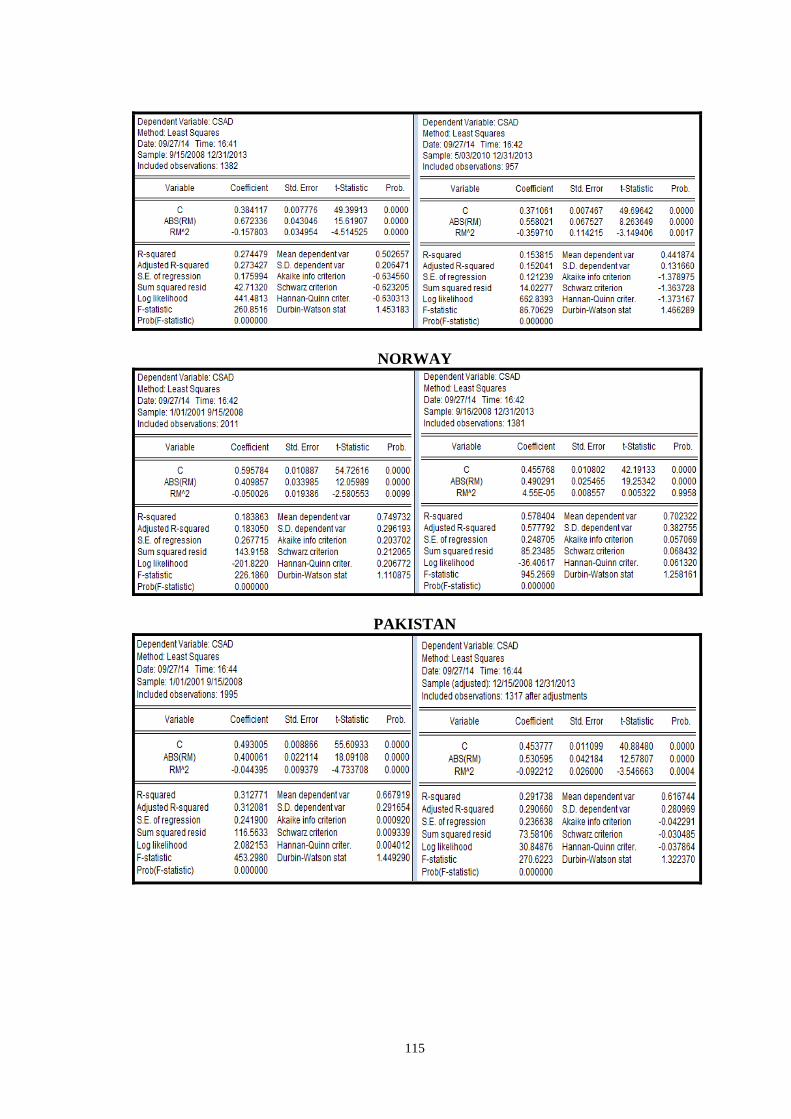
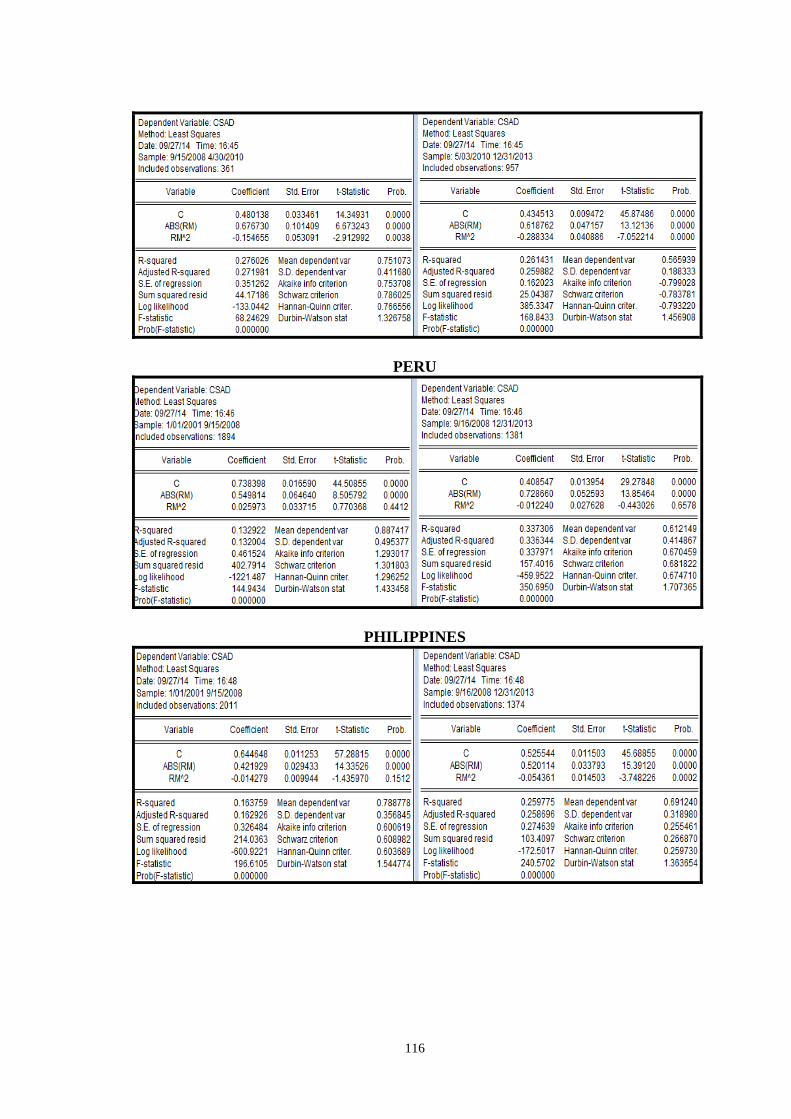
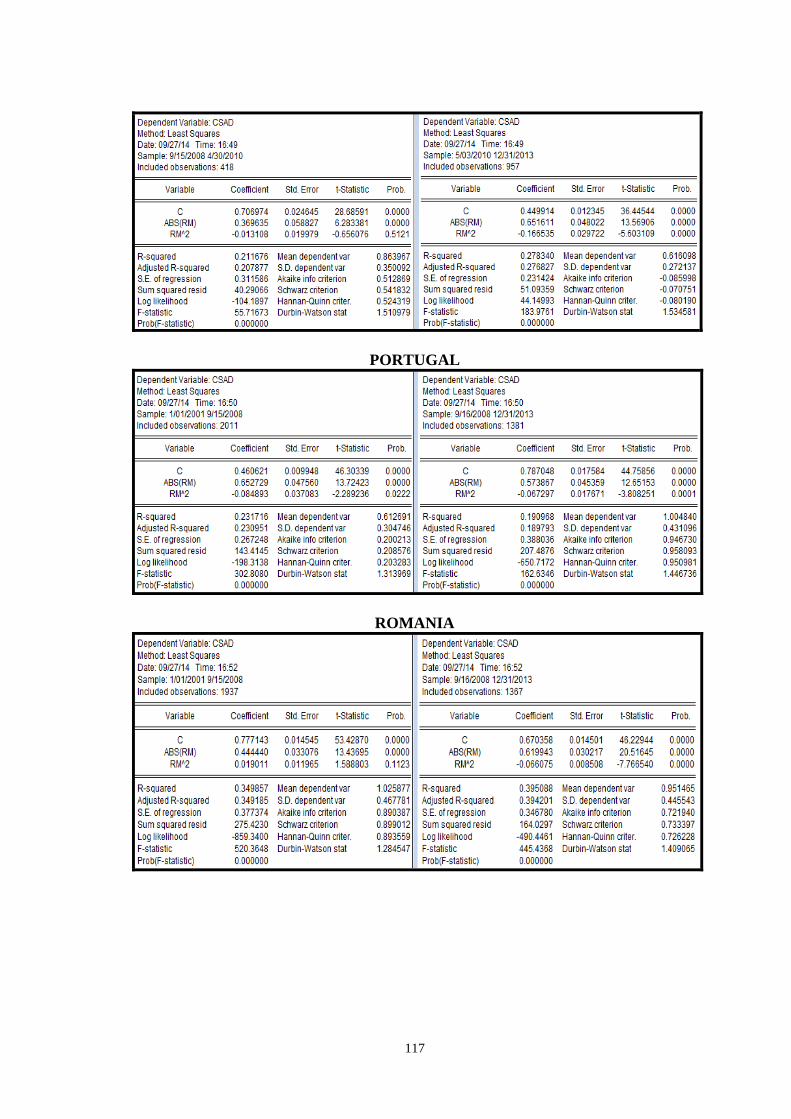
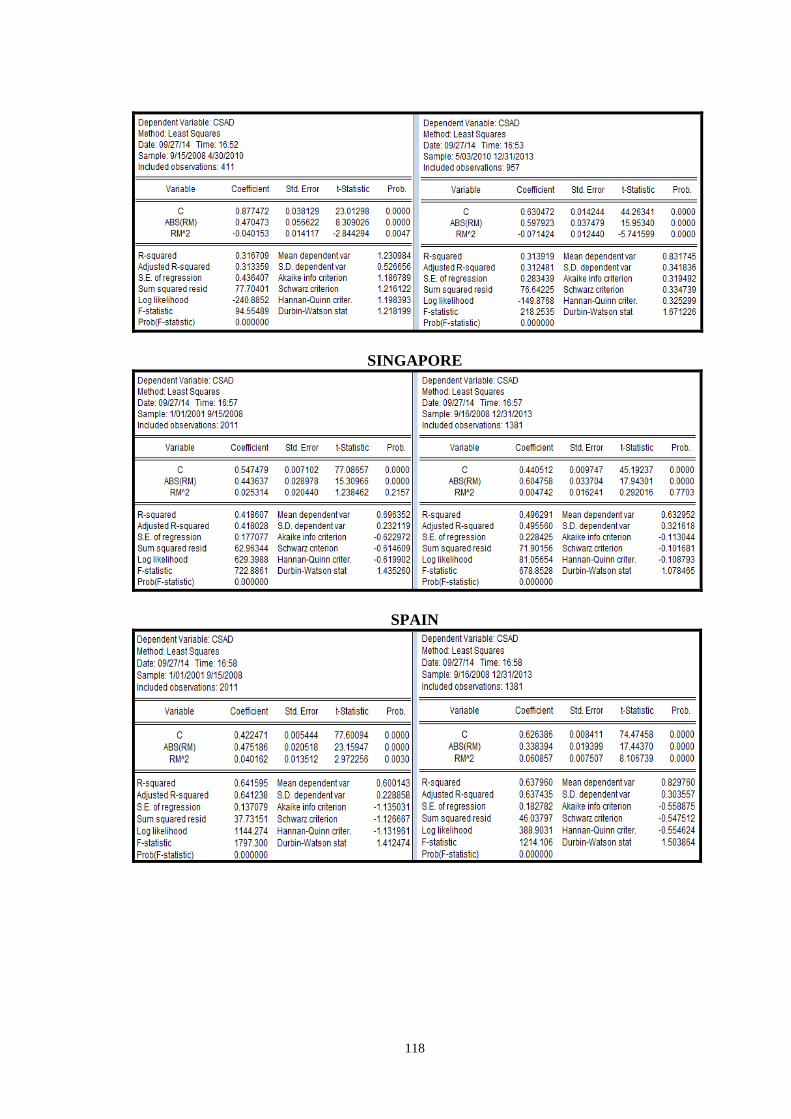
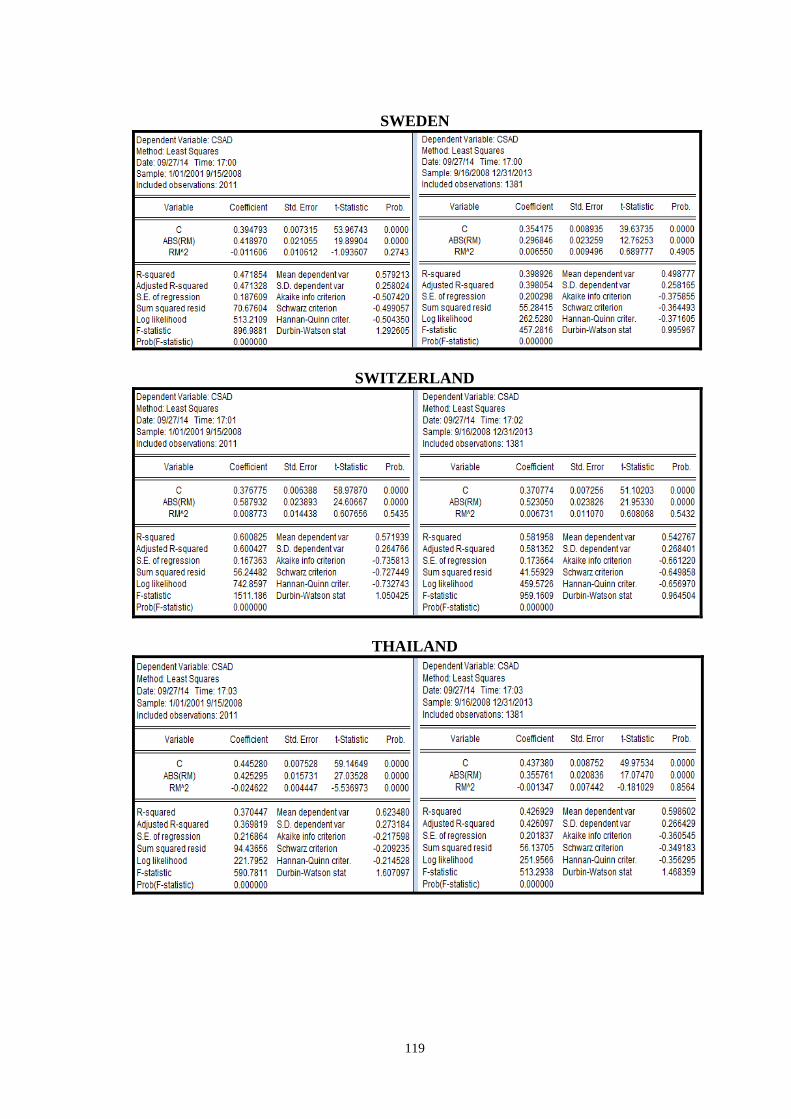
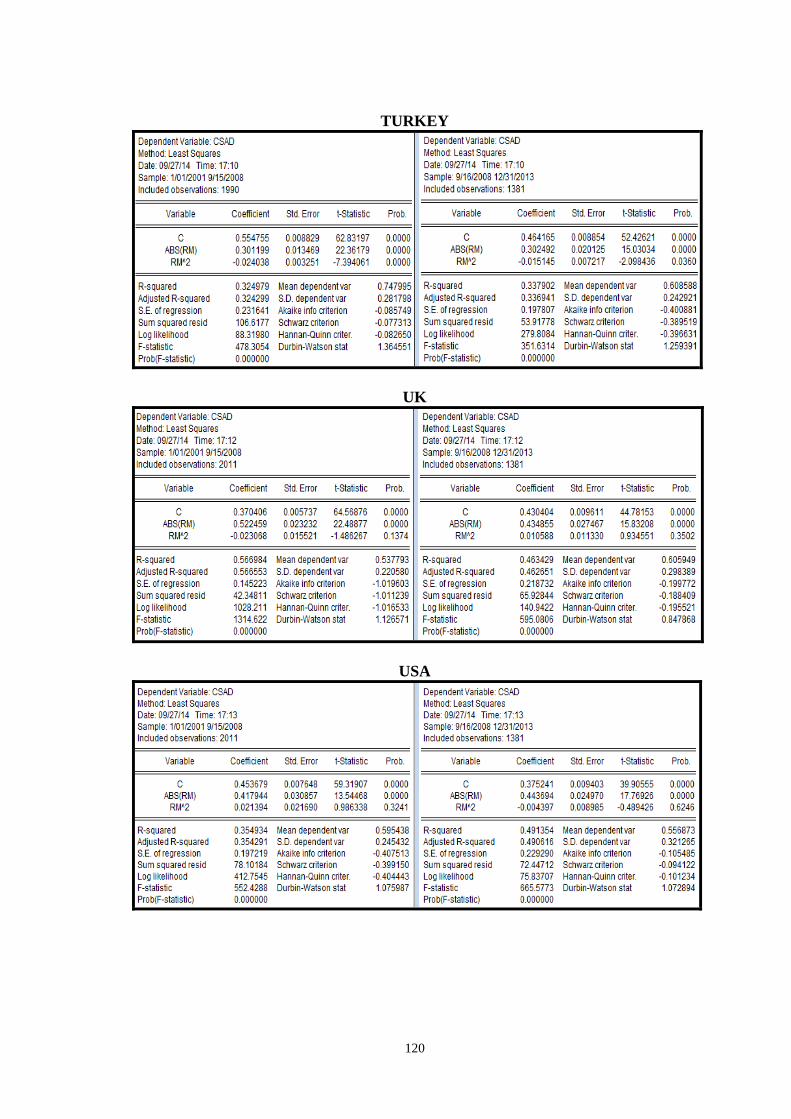
(CSSD). The measure of Chang et al. (2000) is a variant of Christie and Huang’s (1995)
measure, but instead it considers the cross-sectional absolute deviation of returns
(CSAD).
We expose the empirical studies presenting, in first place, the studies that
consider a single market and, in second place, the studies that cover multiple markets. In
each division, the studies are shown chronologically.
Among the authors that studied a single market are Lakonishok et al. (1992),
who analysed the institutional investors in the United States from 1985 to 1989, but did
not find any evidence of herding. Grinblatt et al. (1995), on the other hand, studied the
existence of herd behavior in mutual funds in the United States from 1975 to 1984,
using the measure proposed by Lakonishok et al. (1992), and found evidence of
herding. Another authors that analysed the United States market were Christie and
Huang (1995), that tested the existence of the phenomenon from 1925 to 1988 and
found that there was no evidence of herding, being the empirical results consistent with
the predictions from rational models. Also, Nofsinger and Sias (1999) found evidence
of herding in the United States between 1977 and 1996, using a measure that captures
the relation between changes in institutional ownership and returns over the herding
interval (period of time where a group of investors buy or sell the same stock).
Although the US market is the most analysed one, we can find examples of
studies from other countries around the world. For instance, Caparelli et al. (2004)
found evidence of herding in Italian market from 1988 to 2001, using the measure
Page 17
9
proposed by Christie and Huang (1995). Also, Lobão and Serra (2006) tested the
presence of herd behavior in Portuguese mutual funds from 1998 to 2000 and used the
measure from Lakonishok et al. (1992). They found a strong evidence of herding that is
4 or 5 times higher than the evidence found in more mature markets. Kallinterakis and
Ferreira (2006) studied Portuguese market as well but did not focus on mutual funds.
They used the data available from PSI-20 and the measure proposed by Hwang and
Salmon (2004) to test the existence of herding in the period 1993-2005 and found
higher evidence from 1996 to 1999.
Besides the works already mentioned, we can also refer to the one of Demirer
and Kutan (2006), that tested the existence of herding in the Chinese market, applying
the measure of Christie and Huang (1995) to the data from individual firms (1999-
2002), Shangai Stock Exchange (1993-2001) and Shenze Stock Exchange (1994-2001).
They did not find evidence of herding, suggesting that the Chinese investors make
rational decisions. Also, Manganaro and Von Martens (2007) studied herding for
mutual funds in Sweden between 2000 and 2007, using the measure from Lakonishok et
al. (1992). They found that there was a strong evidence of herd behavior when
compared to more mature markets (e.g. United States and United Kingdom) but less
evidence than that of we could verify in emerging markets. In their empirical results, if
100 funds trade a given stock, approximately 7 more funds trade on the same side of the
market than what should be expected if their choice was made independently.
Furthermore, Goodfellow et al. (2009) studied the existence of herding in Poland
during the period from 1996 and 2000 and found evidence of this behavior only for
individual investors (and not for institutional investors). Tessaromatis and Thomas
(2009) tested if herding was present in the Greek market between 1985 and 2004. For
that they relied on the measure from Christie and Huang (1995), but did not find
evidence of this behavior when they considered the period as a whole. However, when
they considered the sub period from 1998 to 2003 the existence of herding began to gain
relevance. Ohlson (2010) studied the herd behavior in Swedish market using the
measures proposed by Christie and Huang (1995) and Chang et al. (2000). He found
evidence of herding from 1998 to 2009, being this behavior more intense during the
bullish market of 2005 and 2007. He concluded that there is a tendency of increasing
levels of herding over the measured period, which can be attributed to the increase of
Page 18
10
institutional investors that tend to be less experienced and are thus more prone to herd.
Finally, Patro and Kanagaraj (2012) proved the existence of herd behavior in Indian
mutual funds between 2009 and 2011, applying the measure proposed by Lakonishok et
al. (1992).
Despite the existing studies focus more in a single market, we can find some
studies that test this phenomenon for more than one market. For example, Chang et al.
(2000) verified if herding was observable in the United States, Hong Kong, Japan,
South Korea and Taiwan from 1963 to 1997. They found evidence of herd behavior for
South Korea and Taiwan, partial evidence for Japan and no evidence for the United
States and Hong Kong. Furthermore, Economou et al. (2011) used daily data from 1998
to 2008 to analyse if herding was observable in Portugal, Italy, Greece and Spain,
employing the measure proposed by Chang et al. (2000). Their results showed evidence
of herding for Greece and Italy, being this behavior stronger in bull markets. As for
Portugal, they were able to find some evidence of herd behavior only for bear markets
and the results obtained for Spain showed that Spanish investors behave consistently
with the predictions from rational models. When the authors analysed only the period of
the financial crisis (2008), they could find herding in Portugal exclusively. Also, Khan
et al. (2011) tested the presence of herding in four European markets (France, Germany,
Italy and United Kingdom) from 2003 to 2008. They resorted to the measure proposed
by Hwang and Salmon (2004) and found evidence of herd behavior for all of them.
Finally, Lindhe (2012) studied herd behavior in four Nordic countries (Denmark,
Finland, Norway and Sweden) during the period 2001-2012, using the measure of
Chiang and Zheng (2010), which is based on the measure of Chang et al. (2000). She
only found evidence of herding in Finland. Although she was not able to find evidence
of herding in the other countries in their own market, she showed that Finland and
Sweden herd around the US market and all of them herd around the European market
and around each other.
We can observe that, empirically, there is mixed evidence whether herding is
detected in financial markets or not. Some authors found evidence (some of them a
strong evidence) of herding and some authors did not find evidence at all. In sum, there
is no consensus regarding the presence of herding in financial markets around the world
since we can find evidence that supports its existence and evidence that contradicts it.
Page 19
11
However, it seems to be observable that less mature markets tend to exhibit more
herding than mature markets and, according to Ohlson (2010), this may be due to the
increase of mutual funds in those countries being pretty recent when compared to more
developed markets, which implies the managers of those funds to be more
inexperienced and thus, have more tendency to follow the actions of other market
participants (they are more afraid of being the only ones making the wrong investment
decision than they value outperforming others).
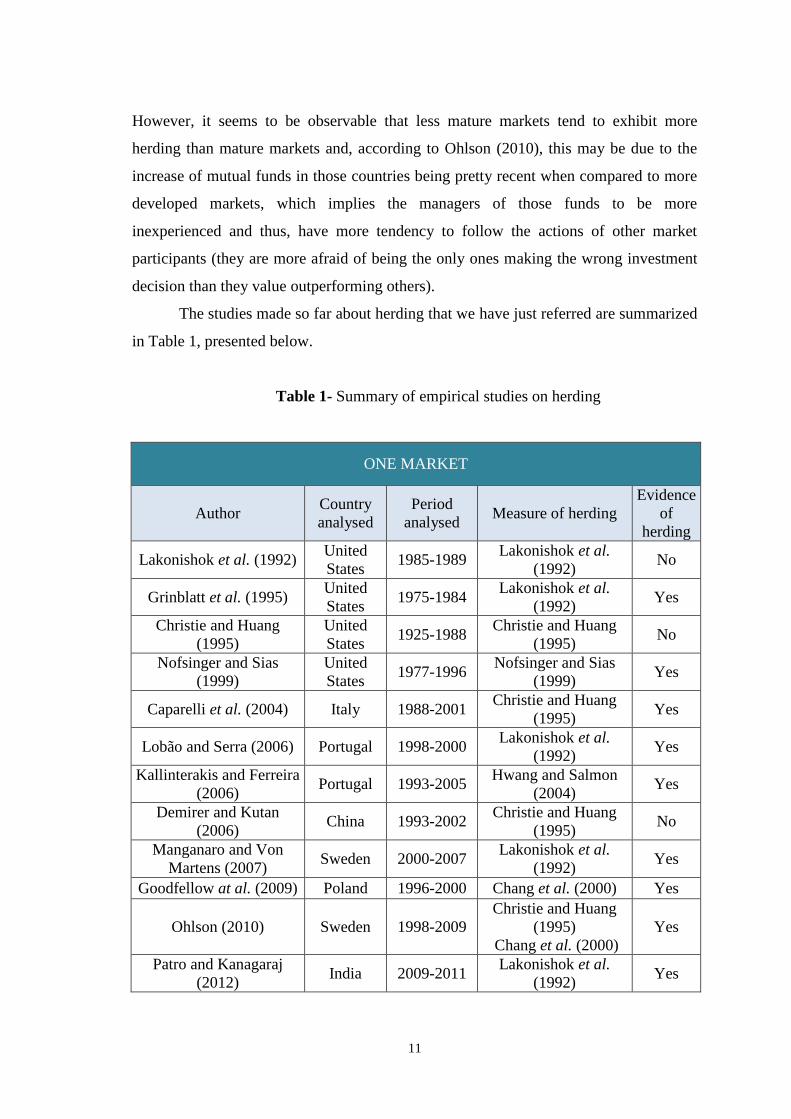
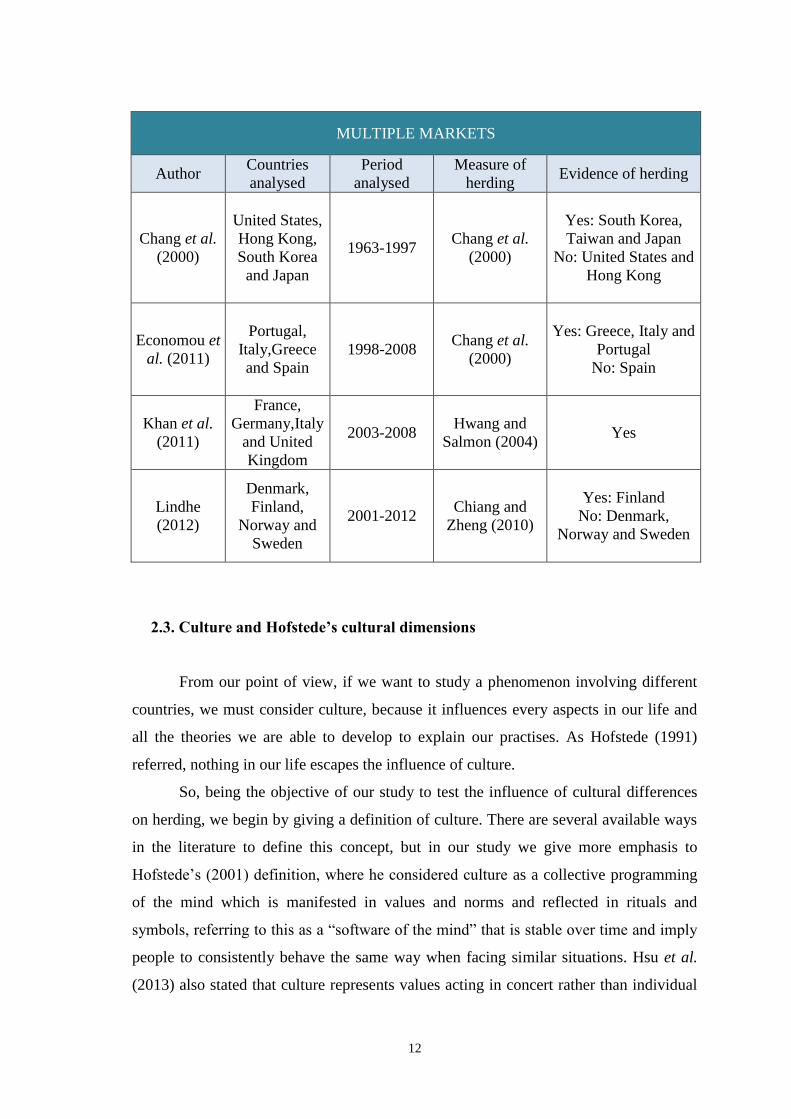
The studies made so far about herding that we have just referred are summarized
in Table 1, presented below.
Table 1- Summary of empirical studies on herding
ONE MARKET
Author Country
analysed
Period
analysed Measure of herding
Evidence
of
herding
Lakonishok et al. (1992) United
States 1985-1989
Lakonishok et al.
(1992) No
Grinblatt et al. (1995) United
States 1975-1984
Lakonishok et al.
(1992) Yes
Christie and Huang
(1995)
United
States 1925-1988
Christie and Huang
(1995) No
Nofsinger and Sias
(1999)
United
States 1977-1996
Nofsinger and Sias
(1999) Yes
Caparelli et al. (2004) Italy 1988-2001 Christie and Huang
(1995) Yes
Lobão and Serra (2006) Portugal 1998-2000 Lakonishok et al.
(1992) Yes
Kallinterakis and Ferreira
(2006) Portugal 1993-2005
Hwang and Salmon
(2004) Yes
Demirer and Kutan
(2006) China 1993-2002
Christie and Huang
(1995) No
Manganaro and Von
Martens (2007) Sweden 2000-2007
Lakonishok et al.
(1992) Yes
Goodfellow at al. (2009) Poland 1996-2000 Chang et al. (2000) Yes
Ohlson (2010) Sweden 1998-2009
Christie and Huang
(1995)
Chang et al. (2000)
Yes
Patro and Kanagaraj
(2012) India 2009-2011
Lakonishok et al.
(1992) Yes
Page 20
12
MULTIPLE MARKETS
Author Countries
analysed
Period
analysed
Measure of
herding Evidence of herding
Chang et al.
(2000)
United States,
Hong Kong,
South Korea
and Japan
1963-1997 Chang et al.
(2000)
Yes: South Korea,
Taiwan and Japan
No: United States and
Hong Kong
Economou et
al. (2011)
Portugal,
Italy,Greece
and Spain
1998-2008 Chang et al.
(2000)
Yes: Greece, Italy and
Portugal
No: Spain
Khan et al.
(2011)
France,
Germany,Italy
and United
Kingdom
2003-2008 Hwang and
Salmon (2004) Yes
Lindhe
(2012)
Denmark,
Finland,
Norway and
Sweden
2001-2012 Chiang and
Zheng (2010)
Yes: Finland
No: Denmark,
Norway and Sweden
2.3. Culture and Hofstede’s cultural dimensions
From our point of view, if we want to study a phenomenon involving different
countries, we must consider culture, because it influences every aspects in our life and
all the theories we are able to develop to explain our practises. As Hofstede (1991)
referred, nothing in our life escapes the influence of culture.
So, being the objective of our study to test the influence of cultural differences
on herding, we begin by giving a definition of culture. There are several available ways
in the literature to define this concept, but in our study we give more emphasis to
Hofstede’s (2001) definition, where he considered culture as a collective programming
of the mind which is manifested in values and norms and reflected in rituals and
symbols, referring to this as a “software of the mind” that is stable over time and imply
people to consistently behave the same way when facing similar situations. Hsu et al.
(2013) also stated that culture represents values acting in concert rather than individual
Page 21
13
factors that affect behavior. In fact, interactions with individuals in society determine
cultural values more than value differences attributed to personal characteristics,
existing a societal value system shared by the dominant groups that allows the
perseverance of institutions with persistent structures (e.g. family, school and law).
These institutions reinforce this value system in a way that a member that not follows it
will be rejected by society (Hofstede, 2001). Indeed, culture may not just impose
constraints, but has the ability to structure and encourage certain behaviors (Di Maggio,
1997).
Considering the definition of culture, it seems to be an abstract concept difficult
to quantify. However, over the years we can find some attempts to measure culture
through a dimensionalist approach, where numerical scales and dimensions are
developed to distinguish nations’ cultures. They consist in large-scale surveys
containing value-statements collected from individuals, being then averaged by country
and formed quantitative cultural characteristics (Reuter, 2011).
The main dimensionalist approaches on culture are the ones of Schwartz (1994),
Inglehart (1997), Hofstede (2001) and House et al. (2004), being Schwartz’s and
Hofstede’s dimensions the most widely used in empirical studies. We will explain
briefly each one of them.
Schwartz (1994) conducted a survey to students and teachers, in 38 countries,
from 1988 to 1992. He reached three dimensions: mastery vs. harmony, egalitarism vs.
hierarchy and conservatism vs. autonomy. Inglehart (1997) used data from World
Values Survey to study 43 countries from 1989 to 1991 and reached the conclusion that
the major two dimensions capable of explaining cross-cultural variation were survival
vs. self-expression and traditional vs. secular-rational. House et al. (2004) created the
worldwide known Project GLOBE and their surveys were made to 17300 managers
from 931 different organizations, in 62 countries, from 1994 to 1997. They reached the
following nine dimensions: future orientation, gender equality, assertiveness, human
orientation, in-group collectivism, institutional collectivism, performance orientation,
power distance and uncertainty avoidance.
We next refer to Hofstede’s (2001) dimensions in more detail, since these are the
ones to employ in our study.
Page 22
14
2.3.1. Hofstede’s cultural dimensions
In our study we use the dimensions proposed by Hofstede (2001). He worked as
a psychologist for IBM, where he inquired employees in 50 different countries from
1965 to 1971, reaching five cultural dimensions.
The first dimension opposes individualism to collectivism, reflecting the degree
to which a society emphasizes the role of the individual as opposed to that of the group.
He argued that in individualistic societies the bonds between individuals are weak,
while in collectivistic societies individuals tend to be integrated in strong and cohesive
groups. So, he observed that people from countries characterized by individualism tend
to be more autonomous and independent, usually give more weight to their individual
opinion compared to the opinion of the group and value differences of opinion.
According to Hirshleifer and Thakor (1992), in this kind of societies the priority of the
agents is to care of their own interests, focusing on their own attributes and abilities to
differentiate themselves from others. On the contrary, people from countries
characterized by collectivism tend to be more dependent on the group and group
opinions prevail to personal opinions. As Markus and Kitayama (1991, p. 227) noted, in
collectivistic cultures individuals tend to view themselves “not as separate from the
social context but as more connected and less differentiated from others”. In conclusion,
the dichotomy on this dimension focuses on the degree of reinforcement of individual or
collective achievements and interpersonal relationships.
The second dimension confronts masculinity and feminity and is linked to the
social role that is attributed to each gender in a certain culture. The author realized that
men are usually associated with values such as firmness, competitiveness and
toughness, so they tend to be more ambitious, self-confident and like to be recognized
by their own merit. On the other hand, women are normally associated with tender roles
and values such as protection, generosity and concern with human relations, so they
tend be more cooperative and solidary.
The third dimension contrasts countries with high and low uncertainty
avoidance, referring to the extent to which people are uncomfortable with uncertain and
unknown situations. In order not to feel threatened by ambiguous situations, cultures
characterized with high uncertainty avoidance try to minimize their occurrence having
strict rules and safety measures, thus increasing predictability. On the contrary,
Page 23
15
according to Park and Lemaire (2011), in countries scoring low on uncertainty
avoidance, individuals tend to feel naturally secure, tolerate different behaviors and
opinions more easily and avoid excessive regulation.
The fourth dimension compares countries with high and low power distance.
This has to do with the acceptance degree of an unequal power distribution within a
society, by those who have less power. The author argued that countries with high
power distance tend to be more obedient and respectful for an authority, so in these
societies independence is not encouraged and own initiative is not supported. On the
opposite side, in countries with low power distance, he observed that individuals tend to
have control of their own actions, make decisions by themselves, they are independent
and are encouraged to have own initiative.
The fifth dimension confronts long-term orientation with short-term orientation.
Countries long-term oriented value thrift, perseverance and adapting to changing
circumstances, since they give more importance to future outcomes. That way, countries
with long-term orientation promote stability (discourage initiative, risk-seeking and
change) and perseverance towards late outcomes, while countries short-term oriented
give more weight to immediate results, valuing more the past and present, such as
traditions and fulfilling social obligations. According to Fernandez et al. (1997) this
dimension appeared after Hofstede’s work with Michael Bond (1988) and was created
to overcome the need of having a new dimension that emanated from oriental culture
rather than being a measure developed in occidental countries and applied elsewhere.
2.4. Criticisms to Hofstede’s dimensions and comparison with other dimensions
In this subsection we present briefly the main cultural dimensions used in
empirical studies, as well as the major criticisms pointed to Hofstede’s dimensions. We
also establish the parallel between Hofstede’s cultural dimensions and other existing
dimensions, then justifying the advantage of choosing the first ones.
Page 24
16
2.4.1. Criticisms to Hofstede’s cultural dimensions
Everything in life has its pros and cons, so Hofstede’s (2001) dimensions also
have their supporters and their opponents. In that sense, before we apply his dimensions
we have to be aware of the criticisms made to them.
Kirkman et al. (2006) considered, in the first place, that it is impossible to
reduce something as complex as culture only to five dimensions. Besides that, they
argued that a sample of a single multinational company is not representative of a whole
nation, so the study is a bit limitative in that issue. McSweeny (2002) also focused on
the unrepresentativeness of the sample, arguing that IBM workers face a selective
recruitment by the company and cannot be illustrative of a national culture.
Kirkman et al. (2006) continued their criticisms affirming that Hofstede does not
take into account heterogeneity within a country, not giving relevance to subcultures
that may exist. In fact, his dimensions attempt to reflect the culture of a nation as if the
individuals of a particular country were homogeneous and shared the same values.
Another criticism has to do with the way Hofstede’s dimensions are derived.
House et al. (2004) affirmed that the dimensions are empirically-driven, in which scales
are determined only after the results of the survey. This technique has the problem of
being biased by the influence of empirical results. On the other hand, the dimensions
developed by these authors are theoretically-driven, thus not suffering from biases
related to the person that interprets the results.
Finally, the authors criticized the fact that the study was made in 1960’s and
1970’s and does not consider cultural changes that may have occurred over the years,
due to globalization, economic growth or migration. This criticism gained
preponderance with McSweeny (2002) and Craig and Douglas (2006), who emphasized
that the original culture of a nation changes as a result of globalization and the advance
in communication technologies, since people travel to countries with different cultural
backgrounds and interact with individuals that live in those countries, “contaminating”
and modifying their culture. This phenomenon is known as acculturation (interactions
between different cultures lead a society to absorb some cultural aspects from another
society) and it seems very plausible to make some alterations in cultural variables.
McDonagh (1999) also claimed that modernisation makes people more individualistic
and Ralston et al. (1999) exemplified cultural change with Chinese managers, observing
Page 25
17
that the new generation tends to be more individualistic and to work more
independently.
Despite the criticism, Kirkman et al. (2006) and McSweeny (2002) recognized
that Hofstede’s dimensions continue to be the most used ones due to its clarity,
simplicity and applicability. Also, Steenkamp (2001) acknowledged that, although there
is no consensus upon the choice of the most appropriate dimensions to conceptualize
and operationalize culture, Hofstede’s framework is the most widely used in several
fields of study (e.g. sociology, marketing and management). This is reinforced by Lynn
and Gelb (1996), who argued that his dimensions have received extensive support
because they are effectively able to capture cross-country differences.
Regarding cultural change that may occur over time, Kirkman et al. (2006) also
admitted it is a slow process, so it is not very likely that drastic changes were observed
since Hofstede’s study. That happens because, according to Becker (1996) (cfr Guiso et
al., 2006) individuals do not have much control over their culture, so it is considered
has “given” to them, which leads to a great difficulty in changing culture. In fact, since
the original study by Hofstede, there were other authors that tried to replicate his study
in other contexts and in more recent years (e.g. Merrit, 2000) and supported Hofstede’s
results, indicating that his conclusions are still relevant nowadays. Hofstede (2011)
affirmed that there were six major attempts of replicating and updating his dimensions
(using at least 14 countries) from 1990 to 2002, in which were used managers and
workers from other organizations besides IBM, pilots and consumers, and the results
showed no weakening of the correlations. That does not mean that there were no
cultural changes throughout the years, but these studies reveal that in case that
happened, the countries suffered alterations in the same direction, so their relative
position did not change (Hofstede, 2011).
As an example, we can consider Beugelsdijk and Frijns’ (2010) study related to
international asset allocation, in which they performed a robustness test where they tried
to update Hofstede’s dimensions through the proposal of Tang and Koveos (2008),
reaching the conclusion that this update did not have any impact on their results.
Regarding the plausibility of the acculturation phenomenon, Hsu et al. (2013)
argued that there is no empirical evidence capable of confirming this issue.
Page 26
18
As for the criticism concerning the representativeness of the sample, Hofstede
(2001) noted that there are more 140 studies using non-IBM data that validated his
cultural indexes. Hofstede himself, after his IBM study, decided to survey 400 managers
(non-IBM workers) from 30 different countries and concluded that there were high
correlations between the answers of those workers and the ones given by IBM-workers,
so it is possible to extrapolate the results obtained in the IBM study to other contexts
(Hofstede, 2011). Also, studying a single organization allows him to isolate the cultural
effect, being the only variable that differs from country to country.
Furthermore, considering the criticism related to Hofstede’s dimensions being
empirically-driven, House et al. (2004) argued that this kind of studies are only possible
with a large sample and Hofstede’s study (2001) actually fulfilled this request.
Finally, Arosa et al. (2014) observed that, even subject to criticism, Hofstede’s
cultural dimensions are widely used and accepted and no other existing study was able
to develop a model that equals or exceeds the one of Hofstede in terms of sample size,
methodology or degree of acceptance among academics.
In conclusion, although there are some criticisms around Hofstede’s dimensions
that we must take into account, our choice for his dimensions are justified by the widely
acceptance and maintenance of countries’ relative position proved in recent studies.
Also, according to Soares et al. (2007), they are useful when we want to formulate
hypothesis for comparative cross-cultural studies.
2.4.2. Comparison with other cultural dimensions
As we already mentioned, Hofstede’s dimensions are not the only existing ones,
but alongside with Schwartz’s (1994) cultural dimensions, they are the most known. In
our study we decided to use Hofstede’s dimensions (choice that was already justified),
however we still have to consider that there may be some similarities between
Hofstede’s dimensions and other cultural dimensions, so we need to make a comparison
between them and evaluate if in fact, these are preferable or not.
According to Hsu et al. (2013) we can find some resemblances between
Hofstede’s dimensions and Schwartz’s dimensions. First, power distance is similar to
egalitarism/hierarchy since both of them relate to authority orientation. Second,
individualism/collectivism coincides with autonomy/conservatism because both of them
Page 27
19
focus on the relationship between the individual and the group. Third,
masculinity/feminity overlaps harmony/mastery in that it concerns the relationship
between people and the social environment. Li et al. (2013) also highlight the existing
high degree of correlations between Hofstede’s and Schwartz’s measures and Schwartz
(2004) agreed that such similarities exist, but they only verify at some extent. In
Steenkamp’s (2001) opinion, there also appears to be some overlap between Hofstede’s
and Schwartz’s values, however the ones from the last author include elements of
culture that are not captured by Hofstede, being thus able to explain greater cultural
variation. On the other hand, Ng et al. (2007) affirmed that the dimensions proposed by
Hofstede and Schwartz are not coincident and it is preferable to use Schwartz’s
dimensions when we are considering international trade.
Although the dimensions developed by the two aforementioned authors are the
most widely used, there are also other dimensions available and we will also establish a
comparison with those dimensions.
Regarding Inglehart’s (1997) dimensions, Hsu et al. (2013) noted that power
distance is similar to traditional/secular and individualism/collectivism is coincident
with survival/self-expression. House et al. (2004) also compared their own dimensions
from Project GLOBE with Hofstede’s dimensions and found some correlations in power
distance, uncertainty avoidance and individualism (there were also some similarities
between masculinity and assertiveness). Nevertheless, they considered that these
correlations only have small importance, not being completely equal. Hofstede (2011)
disagreed, stating that despite the different approach, GLOBE data reflect the structure
of his model.
Considering the similarities aforementioned, we may be tempted to say that we
could choose any of them to apply in our study, however Hsu et al. (2013) defended the
use of Hofstede’s dimensions, because after comparing the major cultural dimensions
they concluded that Inglehart and Schwzart cover a relatively small number of cultural
dimensions when compared to Hofstede’s research. Soares et al. (2007) also supported
the use of Hofstede’s dimensions after concluding that there is a great convergence
between the dimensions proposed by other authors and Hofstede’s dimensions. On the
other hand, Ng et al. (2007) stated that Schwartz’s model overcomes some difficulties
Page 28
20
of Hofstede’s dimensions because it is derived theoretically, it uses a more
comprehensive set of value dimensions and it is done with more recent data.
Consequently, despite the pitfalls mentioned, we think that Hofstede’s cultural
dimensions are the most appropriate for this study because they can isolate the cultural
effect, cover a wide number of countries and are still valid nowadays.
2.5. Prior empirical studies of cultural finance
In our study we want to test if culture has the ability to influence investors’
behavior, so we need to know if, in fact, it matters for finance. According to Stulz and
Williamson (2003) culture may affect finance in three different ways: first, economic
values in a country depend on its culture (e.g. charging interest in a country can be
considered normal while in other is viewed as a wrong thing); second, culture affects
institutions (e.g. legal systems vary from country to country according to its values);
third, culture influences the way economic resources are allocated (e.g. some countries
spend more money in infrastructures while other prefer to spend more in guns). The
idea of culture being able to impact institutions, playing a major role in the way laws
and rules are developed, is also corroborated by Anderson et al. (2011), however they
added that it is not just through legal and regulatory environments that culture impacts
investors’ behavior, it also impacts their behavior directly.
Considering this we should expect culture to be relevant for financial decision-
making and so, it should be taken into account when we want to study financial
phenomena. However, as Guiso et al. (2006) noted, culture has been ignored in the past
in financial literature due to its ambiguity and difficulty to measure.
In fact, including culture in financial decision-making is a very recent field of
investigation, however we can find some studies concerning this issue. For instance,
Chui et al. (2010) studied the impact of individualism on momentum profits, concluding
that in individualistic countries investors tend to be more overconfident, which leads
them to trade more, generating momentum profits. Also, Ferris et al. (2013) associated
Hofstede’s dimensions with CEO overconfidence, concluding that overconfidence is
positively related with individualism and negatively related to uncertainty avoidance
and long-term orientation. So, CEOs in individualistic countries tend to underestimate
Page 29
21
the risks underlying a merger or overestimate the possible synergy gains, which
encourage them to engage in diversifying acquisitions.
Other examples focus on the cultural impact on risk-taking decisions. For
example, Li et al. (2013) analysed the impact of culture on the level of risk managers
are willing to take in 35 countries, using individualism, uncertainty avoidance and
harmony (the first two belong to Hofstede’s dimensions and the last one to Schwartz’s
dimensions). Their results showed that individualism is positively associated with risk-
taking, while uncertainty avoidance and harmony are negatively related to risk- taking.
Additionally, Mihet (2012) investigated the impact of culture on firm risk-taking in 51
countries and concluded that companies tend to assume a higher level of risk in
societies characterized by low uncertainty avoidance, low power distance and high
individualism. Furthermore, Chang and Noorbakhsh (2009) analysed corporate
managers’ cash holdings in 45 countries during 1995-2004, showing that Hofstede’s
cultural dimensions had an impact on their decisions, since corporate managers tend to
hold larger cash and liquid balances in countries characterized with higher uncertainty
avoidance, masculinity and long-term orientation.
Finally, there are also studies concerning international asset allocation, as the
one made by Beugelsdijk and Frijns (2010) that provided a cultural explanation for the
foreign bias through Hofstede’s dimensions, examining the holdings of mutual funds
from 26 countries between 1999 and 2000. The results demonstrated that investors from
countries with high uncertainty avoidance tend to invest in the domestic market,
because they are more risk-averse, and investors from individualistic countries tend to
prefer foreign investment, because they expect a higher return. Anderson et al. (2011)
also reached the same conclusion but they added that long-term oriented cultures have
less home bias and more diversification.
Page 30
22
3. Hypothesis, Data and Methodology
In this section we begin by presenting the hypothesis we intend to test regarding
the impact of each cultural dimension on herd behavior, basing our formulations both
conceptually, and in studies that relate cultural dimensions with psychological biases
and behaviors verified in financial decision-making. Then we present the data used in
our study and the methodology we followed.
3.1. Hypothesis
In the existing literature, individualism seems to be always abreast with
overconfidence (the tendency of individuals to consider themselves as “above average”
on positive characteristics) and self-attribution bias (individuals attribute positive
outcomes to their own merit and negative outcomes to bad luck).
In fact, there are several studies that conclude that cultures with a higher degree
of individualism tend to be more overconfident, which leads them to overestimate the
precision of their predictions and be more tolerant to risk (e.g. Mihet, 2012; Ferris et al.,
2013). For example, Heine et al. (1999) demonstrated the relationship between
individualism and overconfidence through the observation of children’s behavior,
noting that in individualistic countries they are encouraged to think of themselves as
superior to others, which leads them to overestimate their abilities. Also, Ferris et al.
(2013) stated that individualism praises individual freedom and personal challenge,
which leads CEOs to be more confident of their own abilities, and Li et al. (2013)
affirmed that individualism leads to overconfidence because independent action and
individual choice is encouraged. In studies concerning investment decisions, Barber and
Odean (2001) claimed that overconfident individuals tend to overestimate their
evaluations on stock prices related to those of others and so, they value more their own
predictions, while Goodfellow et al. (2009) concluded that when investors’ degree of
overconfidence is high, they tend to rely less on others’ behavior when making
investment decisions, preferring to trust their own beliefs. Finally, Anderson et al.
(2011) found that individualism leads to less home bias and more diversification
Page 31
23
because investors are overconfident and think they possess more information related to
other countries than the rest of the investors.
On the contrary, in collectivistic cultures investors give less importance to their
private information and attribute more weight to others’ opinion (Chui et al., 2010).
Lastly, Beckmann et al. (2008) and Schmeling (2009) argued that collectivism leads to
herding, since managers tend to follow more the market trend.
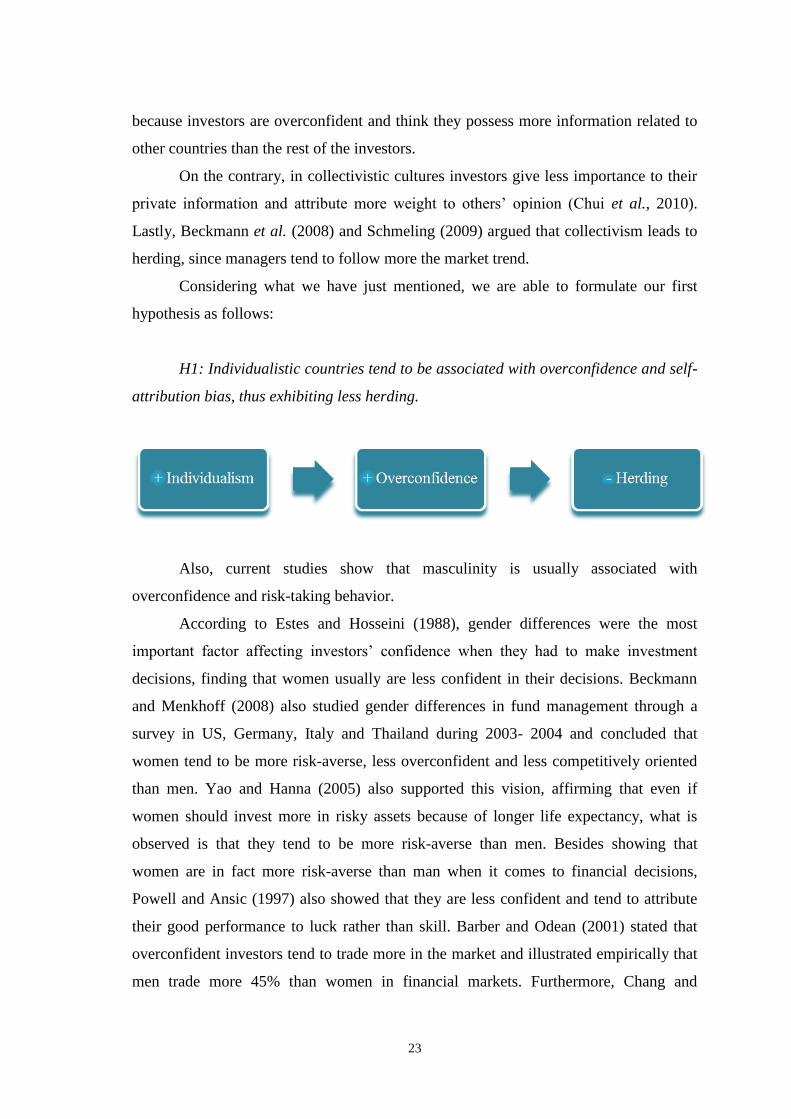
Considering what we have just mentioned, we are able to formulate our first
hypothesis as follows:
H1: Individualistic countries tend to be associated with overconfidence and self-
attribution bias, thus exhibiting less herding.
Also, current studies show that masculinity is usually associated with
overconfidence and risk-taking behavior.
According to Estes and Hosseini (1988), gender differences were the most
important factor affecting investors’ confidence when they had to make investment
decisions, finding that women usually are less confident in their decisions. Beckmann
and Menkhoff (2008) also studied gender differences in fund management through a
survey in US, Germany, Italy and Thailand during 2003- 2004 and concluded that
women tend to be more risk-averse, less overconfident and less competitively oriented
than men. Yao and Hanna (2005) also supported this vision, affirming that even if
women should invest more in risky assets because of longer life expectancy, what is
observed is that they tend to be more risk-averse than men. Besides showing that
women are in fact more risk-averse than man when it comes to financial decisions,
Powell and Ansic (1997) also showed that they are less confident and tend to attribute
their good performance to luck rather than skill. Barber and Odean (2001) stated that
overconfident investors tend to trade more in the market and illustrated empirically that
men trade more 45% than women in financial markets. Furthermore, Chang and
Page 32
24
Noorbakhsh (2009) concluded that in masculine societies men tend to hold a larger
amount of cash in order to exploit faster strategic opportunities and be able to get higher
returns. Finally, Anderson et al. (2011) also tested gender differences in home bias and
their results showed that masculinity leads to less home bias, because investors are
overconfident and think that they possess superior information than others.
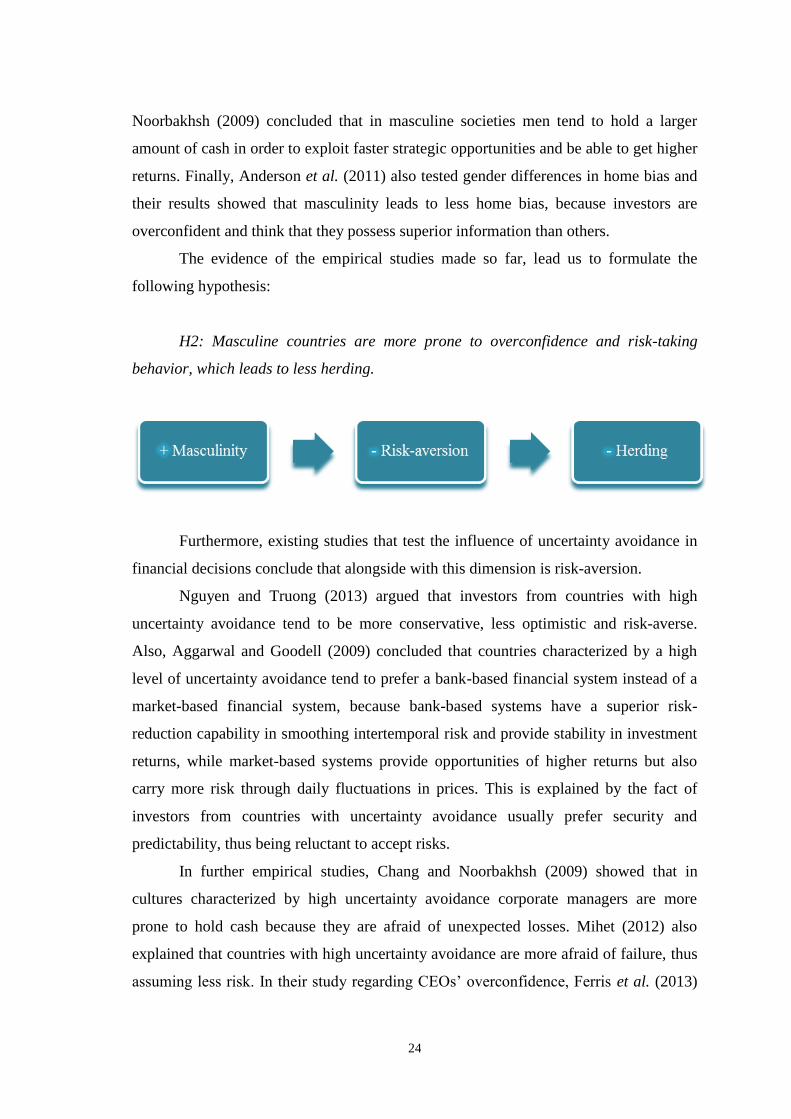
The evidence of the empirical studies made so far, lead us to formulate the
following hypothesis:
H2: Masculine countries are more prone to overconfidence and risk-taking
behavior, which leads to less herding.
Furthermore, existing studies that test the influence of uncertainty avoidance in
financial decisions conclude that alongside with this dimension is risk-aversion.
Nguyen and Truong (2013) argued that investors from countries with high
uncertainty avoidance tend to be more conservative, less optimistic and risk-averse.
Also, Aggarwal and Goodell (2009) concluded that countries characterized by a high
level of uncertainty avoidance tend to prefer a bank-based financial system instead of a
market-based financial system, because bank-based systems have a superior risk-
reduction capability in smoothing intertemporal risk and provide stability in investment
returns, while market-based systems provide opportunities of higher returns but also
carry more risk through daily fluctuations in prices. This is explained by the fact of
investors from countries with uncertainty avoidance usually prefer security and
predictability, thus being reluctant to accept risks.
In further empirical studies, Chang and Noorbakhsh (2009) showed that in
cultures characterized by high uncertainty avoidance corporate managers are more
prone to hold cash because they are afraid of unexpected losses. Mihet (2012) also
explained that countries with high uncertainty avoidance are more afraid of failure, thus
assuming less risk. In their study regarding CEOs’ overconfidence, Ferris et al. (2013)
Page 33
25
found that uncertainty avoidance is inversely related to overconfidence because in these
countries investors are less willing to take risk. Finally, Beugelsdijk and Frinjs (2010)
and Anderson et al. (2011) demonstrated that countries with high uncertainty avoidance
exhibit more home bias because they are more risk-averse and prefer safer and familiar
investments.
Concerning herding, Hofsede (2001) stated that uncertainty avoidance captures a
propensity people have to follow the same set of rules, behaving thus in the same
manner (because they view conflicts in a negative way, preferring a group-decision),
which led Sinke (2012) to conclude that a higher value in this cultural dimension
indicates a tendency to herd behavior.
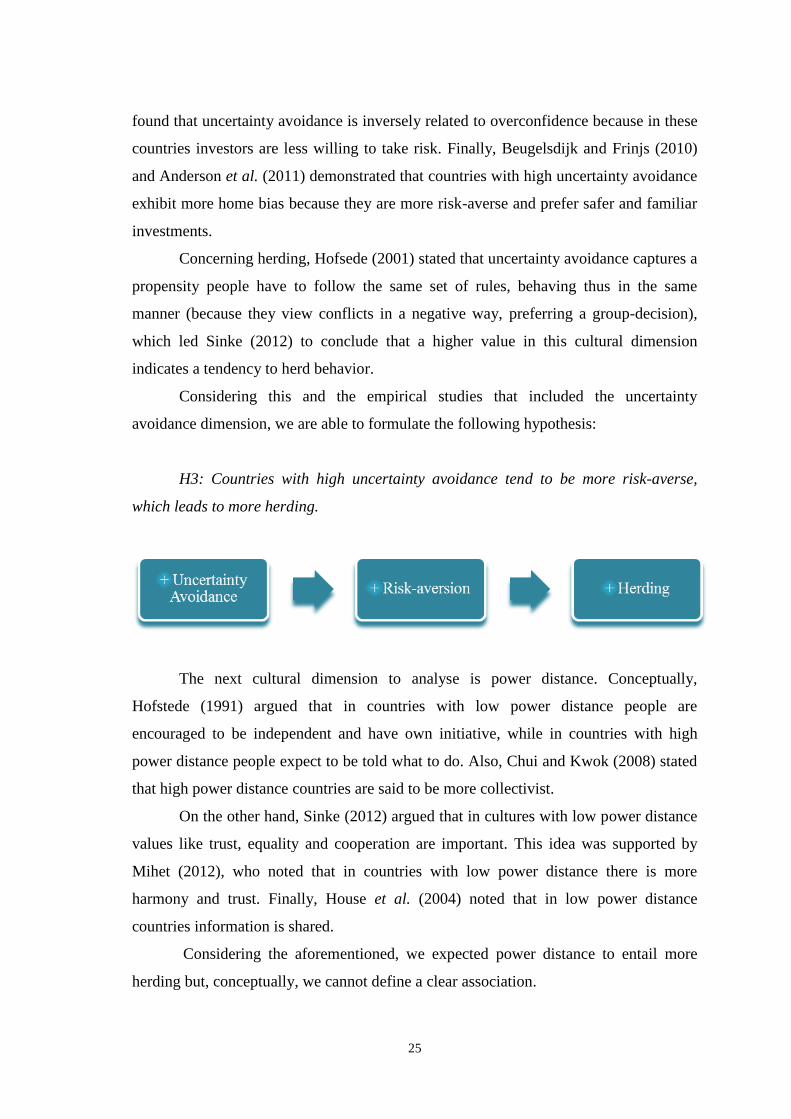
Considering this and the empirical studies that included the uncertainty
avoidance dimension, we are able to formulate the following hypothesis:
H3: Countries with high uncertainty avoidance tend to be more risk-averse,
which leads to more herding.
The next cultural dimension to analyse is power distance. Conceptually,
Hofstede (1991) argued that in countries with low power distance people are
encouraged to be independent and have own initiative, while in countries with high
power distance people expect to be told what to do. Also, Chui and Kwok (2008) stated
that high power distance countries are said to be more collectivist.
On the other hand, Sinke (2012) argued that in cultures with low power distance
values like trust, equality and cooperation are important. This idea was supported by
Mihet (2012), who noted that in countries with low power distance there is more
harmony and trust. Finally, House et al. (2004) noted that in low power distance
countries information is shared.
Considering the aforementioned, we expected power distance to entail more
herding but, conceptually, we cannot define a clear association.
Page 34
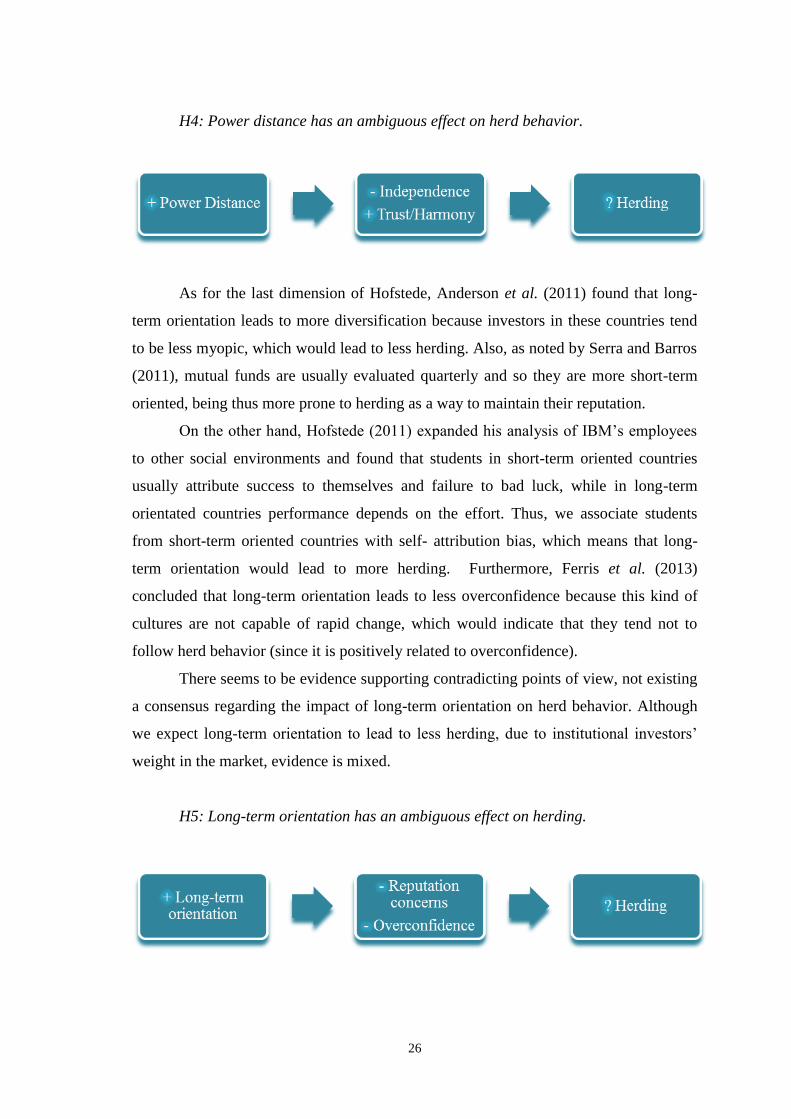
26
H4: Power distance has an ambiguous effect on herd behavior.
As for the last dimension of Hofstede, Anderson et al. (2011) found that long-
term orientation leads to more diversification because investors in these countries tend
to be less myopic, which would lead to less herding. Also, as noted by Serra and Barros
(2011), mutual funds are usually evaluated quarterly and so they are more short-term
oriented, being thus more prone to herding as a way to maintain their reputation.
On the other hand, Hofstede (2011) expanded his analysis of IBM’s employees
to other social environments and found that students in short-term oriented countries
usually attribute success to themselves and failure to bad luck, while in long-term
orientated countries performance depends on the effort. Thus, we associate students
from short-term oriented countries with self- attribution bias, which means that long-
term orientation would lead to more herding. Furthermore, Ferris et al. (2013)
concluded that long-term orientation leads to less overconfidence because this kind of
cultures are not capable of rapid change, which would indicate that they tend not to
follow herd behavior (since it is positively related to overconfidence).
There seems to be evidence supporting contradicting points of view, not existing
a consensus regarding the impact of long-term orientation on herd behavior. Although
we expect long-term orientation to lead to less herding, due to institutional investors’
weight in the market, evidence is mixed.
H5: Long-term orientation has an ambiguous effect on herding.
Page 35
27
3.2. Data
In our study we use daily data for 39 countries between 2001-2013, collecting
data from Datastream Global Equity Indices and the World Bank. All of our variables
are measured in local currency, but according to Chui et al. (2010) we would reach the
same conclusions if they were measured in US dollars.
Most of cross-country studies made so far use a small sample, composed by two
or three countries, however, according to Fernandez et al. (1997), we should use a
sample that would ideally include all the countries analysed by Hofstede, having in
mind that it should contain different levels of economic development. To satisfy this
requirement we tried to include as much countries as we could when forming the
sample and reached the number referred previously. Our selection was restricted to
those countries that had available information for all five Hofstede’s cultural
dimensions and for stock prices. Consequently, the countries under observation in this
study are the following: Argentina, Australia, Austria, Belgium, Brazil, Canada, Chile,
Denmark, Finland, France, Germany, Greece, Hong Kong, Hungary, India, Indonesia,
Ireland, Israel, Italy, Japan, Korea, Malaysia, Mexico, Netherlands, New Zealand,
Norway, Pakistan, Peru, Philippines, Portugal, Romania, Singapore, Spain, Sweden,
Switzerland, Thailand, Turkey, United Kingdom and United States of America.
At first we also considered to include China in the sample. However, as was
already mentioned, one of the downsides of using Hofstede’s cultural dimensions had to
do with the time at which he created them, since he did not take into account the
changes that might had occurred through time. We already argued that culture does not
tend to suffer a lot of changes as time goes by and there are studies that verify that the
relative position of the countries did not alter considerably, notwithstanding China is a
rare case that passed from a period of high isolation to an unprecedented economic
development followed, at the same time, with global exposure and integration. This may
have caused considerable changes especially in younger generations (Hofstede, 2011)
and so, we decided to take China out of the sample.
The chosen period is related to stock data availability for each country and to the
need of having, according to Christie and Huang (1995), a comparison between a
tranquil period and a crisis period. This is based on the assumption, made by these
Page 36
28
authors, that investors tend to act in accordance with traditional models during tranquil
periods, but herd during phases of extreme market movements.
Combining simultaneously the wish to have a sample able to contemplate
several countries and the need to fulfill the requirement concerning the comparison
between both tranquil and crisis periods, our decision is to examine 13 years from
1/1/2001 to 31/12/2013.
As for data frequency, Orleán (1995) stated that to test herd behavior in a market
the ideal would be to use intradaily data, because at that level, when news are disclosed,
investors may not have the amount of time required to apply complex analytical models
to interpret those news and predict the future direction of prices. Thus, their decisions
may not be coherent with rationality and investors will have the tendency to trust the
decisions of other participants in the market.
Although intradaily data would be the most suitable, the truth is that it would be
extremely complicated to obtain this kind of data for such a long period of time.
Nevertheless, there seems to be a consensus that herding is a short-term phenomenon
and that the use of frequencies that do not consider its short-term nature would weaken
the evidence of the phenomenon. For example, Lakonishok et al. (1992) affirmed that
herd behavior would only be visible in daily or weekly data, idea that was corroborated
by Radalj and McAleer (1993) who realized that the use of quarterly and annual
frequencies undermine the detection of herding and so, in order to study this behavior,
we should use a shorter time interval (monthly, weekly, daily or intradaily). More
recently, Economou et al. (2011) stated that from the existing empirical studies, those
that resorted to daily data were the ones that found a stronger evidence of herding.
Considering this, we decide that the preferable frequency to use is daily data.
In the following subsections regarding data, we give detailed information about
the stock market data, data concerning the cultural dimensions and the determinants of
herding we decided to include in our regression.
3.2.1. Stock market data
Stock market data is taken from Datastream Global Equity Indices. We choose
this database because, according to Data and Application Support from Thomson
Reuteurs, it has a larger universe of stocks and the methodology is consistent across
Page 37
29
markets (allowing comparisons between them), so for those looking at several markets
Datastream Global Equity Indices provide more data and history than national market
indices. For example, if we look at Argentina’s market, we can observe that Merval
only contains information regarding 13 of its stocks, while Datastream Global Equity
Index for Argentina provides information for 50 stocks.
Also, their indices cover at least 75% of the market (by market value) and in
most cases this coverage is around 90% of the market, having each market a number of
stocks defined on a pro rata basis according to their size and importance down to a
minimum of 50 stocks (in some cases this minimum is breached due to lack of domestic
stocks in the market). Finally, according to Datastream Global Equity Indices User
Guide No.5, indices are updated daily and are quarterly reviewed to ensure that they
continue to represent the top stocks by market capitalization.
For all these reasons, we think that the use of this particular database allows us
to have a good representation of the market and, at the same time, to be able to compare
several countries consistently.
As previously mentioned, the criteria we use to include a particular country in
our sample is related to the availability of information concerning stock prices. In this
sense, in accordance with Chui et al. (2010) that set up a minimum number of 30 stocks
to form a portfolio to analyse the momentum phenomenon, we also establish that we
should have a reasonable number of stocks in order to detect if herding occurs. Thus, we
decide that in the beginning of the sample period (1/1/2001) the market has to have at
least 20 stocks and not have, at any time during the rest of the period analysed, less than
10 stocks.
To compute the returns’ value we apply the formula used by Chiang and Zheng
(2010), that is defined as follows:
(3.1) Rt = 100 x (log(Pt) – log(Pt-1))
where Rt represents the return of a stock at time t, Pt represents the price of a
stock at time t and Pt-1 represents the price of a stock at time t-1.
Page 38
30
In what concerns to stock returns, we exclude the individual returns that have
value equal to zero for five days in a row, because this would indicate that the price
remains the same for a week, what may be illustrative of those stocks not being traded
at all. This decision is made in accordance with Kallinterakis et al. (2010), who
admitted that, in presence of thin trading, stock prices remain unchanged because stocks
are not traded every day, which implies returns to be equal to zero. This obviously does
not reflect the investors’ action in the market and so, if we consider those returns, that
reflect non trading, our estimates would be biased. Consequently, our study is based on
stocks that were actually traded.
We next present, in Table 2, the descriptive statistics for the stock market data,
regarding the number of stocks of each market, the individual returns and the market
returns.
Table 2 – Descriptive statistics for the stock market data of the 39 countries
considered in the sample between 2001-2013
This table reports stock market statistics regarding the number of individual stocks in each
country, the individual returns and the market returns for the 39 countries included in our
sample and for the period analysed (2001-2013). We set up a minimum number of stocks in order to analyse herd behavior in a financial market,
not including in the sample countries without a reasonable number of individual stocks. Thus,
we require each country to have at least 20 stocks in the beginning of the period analysed
(1/1/2001) and not have less than 10 stocks during any other day of the sample (between
2/2/2001 to 31/12/2013).
In order to try to include only stocks that were effectively traded, we exclude from individual
returns those returns that presented a value equal to zero for five days in a row, since it would
be representative of no trading activity. Both individual and market returns are expressed as a
percentage.
In the column “Total” we show the minimum and maximum number of stocks, individual and
market returns and the mean of the number of stocks, individual and market returns across
countries, as well as the mean of their standard deviations.
Page 39
31
Country Number of stocks Individual returns (%) Market returns (%)
Min Max Mean Mean Std Dev Mean Std Dev
Argentina 11 48 36 0,0326 1,4134 0,0247 0,6742
Australia 90 160 132 0,0117 1,1040 0,0066 0,4399
Austria 23 47 37 0,0068 1,1142 0,0089 0,5340
Belgium 51 88 74 0,0045 1,0489 0,0038 0,5264
Brazil 32 98 66 0,0254 1,2259 0,0174 0,6068
Canada 46 75 65 0,0169 1,3340 0,0062 0,4708
Chile 20 46 37 0,0226 0,8955 0,0135 0,3542
Denmark 31 50 45 0,0116 1,1378 0,0097 0,5267
Finland 35 49 45 0,0086 0,9702 -0,0085 0,7846
France 173 242 214 0,0051 1,0519 -0,0009 0,5882
Germany 160 246 207 0,0085 1,1845 0,0020 0,5622
Greece 39 50 47 -0,0114 1,2757 -0,0162 0,7190
Hong Kong 64 129 98 0,0202 1,2547 0,0079 0,5997
Hungary 14 46 26 -0,0224 2,0505 0,0041 0,6624
India 125 200 167 0,0330 1,1913 0,0208 0,6613
Indonesia 12 50 36 0,0386 1,5010 0,0258 0,6638
Ireland 10 34 24 -0,0012 2,2645 -0,0015 0,6136
Israel 31 49 44 0,0152 1,0655 0,0040 0,4903
Italy 92 159 131 -0,0036 0,9875 -0,0074 0,5947
Japan 643 999 906 0,0072 1,0737 -0,0015 0,6136
Korea 65 101 87 0,0270 1,2237 0,0177 0,6823
Malaysia 34 75 60 0,0221 0,8306 0,0132 0,3448
Mexico 26 85 47 0,0364 1,1563 0,0249 0,4716
Netherlands 76 110 97 -0,0064 1,5129 -0,0042 0,5937
New Zealand 19 50 34 0,0123 0,9560 0,0062 0,2763
Norway 18 50 39 0,0112 1,2830 0,0095 0,6582
Pakistan 11 50 41 0,0357 1,1457 0,0243 0,6403
Peru 10 34 22 0,0436 1,5198 0,0176 0,4141
Philippines 13 49 34 0,0334 1,5159 0,0167 0,5116
Portugal 27 42 34 -0,0148 1,7813 -0,0042 0,4750
Romania 11 50 33 0,0222 1,8017 0,0215 0,7925
Singapore 40 91 67 0,0163 1,1400 0,0076 0,4662
Spain 62 107 85 -0,0042 1,0993 0,0023 0,5946
Sweeden 52 70 65 0,0151 0,9829 0,0050 0,6647
Switzerland 94 150 130 0,0052 0,9068 0,0011 0,4856
Thailand 25 50 41 0,0262 1,0809 0,0195 0,6491
Turkey 24 49 41 0,0290 1,3216 0,0235 0,9097
UK 261 548 445 0,0101 0,9974 0,0024 0,5255
USA 712 997 845 0,0159 1,1445 0,0052 0,5544
Total 10 999 122 0,0140 1,2403 0,0080 0,5716
Page 40
32
From Table 2, we can conclude that there are nine countries that have at certain
time less than the 20 stocks requested in the beginning of the period to be included,
being Ireland and Peru the ones with the lowest minimum number of stocks. This has to
do with the exclusion of the stocks that were not traded in some days (so, even if these
countries have started with 20 stocks, in determined days some of the stocks were
excluded due to non trading activity).
The countries with the highest number of stocks are the Japan and the United
States, with almost 1000 stocks each. If we look at the total number of stocks, we would
say that, on average, we have 120 stocks per country.
If we pay attention to the comparison between the mean values of the individual
and market returns, we can observe that in some countries like Hungary, the United
States and Philippines, the distance of the mean individual returns to the mean market
returns is higher, and in some countries like Romania, Norway and Denmark, this
difference is lower. At first sight, this may denote the presence of herding in certain
markets and the absence of such behavior in others.
3.2.2. Cultural dimensions
Data regarding cultural dimensions is obtained from Hofstede’s book (1991)
“Cultures and organizations: software of the mind” and from Geert Hofstede’s website
(www.geerthofstede.nl). Although there are, as we have seen previously, some
criticisms around Hofstede’s dimensions, the fact is that they are currently used in
recent studies that reveal the maintenance of relative position of the countries, holding
the validity of his dimensions, and they are widely accepted because of their clarity and
applicability (Kirkman et al., 2006).
To measure culture we made the assumption, as in Sivakumar and Nakata
(2001), that country is a proxy for culture, because even if there are several different
cultural groups within a country (and this is more evident in countries with higher
immigration rates or that suffered political redefinitions), it is still possible to observe a
model set of values that is predominant. Inkeles and Levinson (1969) enhanced this idea
arguing that, although other values may co-exist, there is one set that is more common
and broadly descriptive of the whole society.
Page 41
33
In our study we use, as already mentioned, Hofstede’s (2001) five cultural
dimensions: individualism vs. collectivism (IND), masculinity vs. feminity (MAS),
uncertainty avoidance (UA), power distance (PD) and long-term orientation (LTO).
Each dimension is measured on a scale between 0 and 100 (constructed through a
factorial analysis based on the answers to the author’s survey), being the most important
not the value itself but the country’s position related to other countries (if it has a higher
or lower value when compared to others).
It is important to mention that the survey made by Hofstede generates a single
value for each country (for each dimension), not evolving through time. So, we consider
this value to be constant during the period analysed (for example, Argentina has a value
for individualism of 46 and that is the value to be considered in every year from 2001 to
2013).
In Hofstede’s view this makes sense, since he considers culture to be difficult to
change over time, being the position of a country when compared to another relatively
stable over time.
The values for each dimension of the countries that compose our sample are
expressed in the table below (Table 3):
Table 3 – Values for each country’s cultural dimensions
This table shows the values each country has for each of the five Hofstede’s cultural
dimensions.
Each dimension assumes a value between 0 and 100. When the value for a dimension is close to
0, the country scores low on that dimension and when the value for a dimension is close to 100,
the country scores high on that dimension. For example, the higher the value of a country on
individualism, the more individualistic the country is.
IND stands for individualism, MAS for masculinity, UA for uncertainty avoidance, PD for
power distance and LTO for long-term orientation.
The value a country obtains for each dimension is the one to be applicable during the entire
sample period, since the cultural dimensions are time-invariant.
Page 42
34
Country IND MAS UA PD LTO
Argentina 46 56 86 49 20
Australia 90 61 51 36 21
Austria 55 79 70 11 60
Belgium 75 54 94 65 82
Brazil 38 49 76 69 44
Canada 80 52 48 39 36
Chile 23 28 86 63 31
Denmark 74 16 23 18 35
Finland 63 26 59 33 38
France 71 43 86 68 63
Germany 67 66 65 35 83
Greece 35 57 100 60 45
Hong Kong 25 57 29 68 61
Hungary 80 88 82 46 58
India 48 56 40 77 51
Indonesia 14 46 48 78 62
Ireland 70 68 35 28 24
Israel 54 47 81 13 38
Italy 76 70 75 50 61
Japan 46 95 92 54 88
Korea 18 39 85 60 100
Malaysia 26 50 36 100 41
Mexico 30 69 82 81 24
Netherlands 80 14 53 38 67
New Zealand 79 58 49 22 33
Norway 69 8 50 31 35
Pakistan 14 50 70 55 50
Peru 16 42 87 64 25
Philippines 32 64 44 94 27
Portugal 27 31 99 63 28
Romania 30 42 90 90 52
Singapore 20 48 8 74 72
Spain 51 42 86 57 48
Sweeden 71 5 29 31 53
Switzerland 68 70 58 34 74
Thailand 20 34 64 64 32
Turkey 37 45 85 66 46
UK 89 66 35 35 51
USA 91 62 46 40 26
Source: www.geerthofstede.nl
Page 43
35
3.2.3. Determinants of herding
Our study is undertaken to test the additional power of culture in explaining
herding, so we also have to consider the main variables that are usually referred in the
literature to influence this behavior and then observe if, in fact, cultural dimensions are
able to impact herding.
Thus, in this subsection we present the determinants that are usually considered
in the literature to explain herd behavior. These are the book to market ratio, volatility,
size, turnover, market movements (extreme movements and bull/bear markets), market
capitalization to GDP ratio and gross domestic product per capita (GDPpc).
For each determinant we suggest in which way it can influence herd behavior.
a) Book-to-market ratio
One of the financial variables considered by Blasco et al. (2009) and Chui et
al.(2010) that may have influence on herd behavior was the book-to-market ratio
(BTM). As argued by Fama and French (1995), this ratio can be responsible for cross-
section return variability since it can be seen as a proxy for risk, observing that a higher
ratio value corresponded to a higher return explained by the risk premium that investors
required. Also, Lakonishok et al. (1994) noticed that a higher book-to-market ratio was
connected to investors’ underreaction, since they tend to lower their expectations by
extrapolating past prices to the future. Finally, Blasco et al. (2009) made an empirical
study to analyse herd behavior in the Spanish market and reached the conclusion that a
lower book-to-market ratio leads to a higher level of herding.
Considering the aforementioned, we collect data from Datastream Global Equity
Indices for the book-to-market ratio (BTM), defined as the balance sheet value of the
ordinary (common) equity in the company divided by the market value of the ordinary
(common) equity and expressed in local currency:
(3.2) BTM =
Page 44
36
b) Volatility
Another factor we should consider as being influent on herd behavior is
volatility since, on one hand, Chiang et al. (2011) found an association between
volatility and the characteristics of herding formation that occurs during periods of
market stress and, on the other hand, Chui et al. (2010) stated that volatility could be
used as a proxy of information uncertainty. In this sense, volatility would make
information more ambiguous and less reliable, leading to the formation of cascades,
since investors would seek information in other agents’ signals (even if they do not
reflect relevant information).
The first hypothesis has empirical support (Butler and Joaquin, 2002; Forbes and
Rigobon, 2002; Corsetti et al., 2005), showing that in periods characterized by high
volatility cross-market correlations tend to rise.
Although most theories predict a positive relationship between volatility and
herding, we should also note the empirical study made by Lobão and Serra (2006) in the
Portuguese market, where they found that the level of herding is lower when the market
is more volatile. According to the authors, higher volatility can also be considered a
proxy for new and unexpected information, reflecting instead more information, thus
resulting in a lower level of herding. The argument for this lies in the informational
cascades, that may predict a negative relationship between these two dimensions
(volatility and herding) when occurs the arrival of an investor that has a deviant
information or when unexpected public information arises, since investors are not
identical ex-ante.
Having this into account, we decide to include volatility as a determinant of
herding and, adopting the same approach of Chui et al. (2010) we define stock market
volatility (Vt) for each country as follows:
(3.3) Vt =
where Rit is the return on stock i in day t and n is number of stocks in the market.
Page 45
37
c) Size
Another important variable to include when we are analysing herd behavior is
the size of firms, since is associated with the information flows that companies produce.
According to Sias (2004) large companies are more susceptible to investors’
imitation, however this may happen because they are just following the same
information. Nevertheless, this imitative behavior can also be caused by uninformed
investors that tend to invest in large companies instead of small companies (Palomino,
1996), probably because they are widely known and are more salient.
On the other hand, Wermers (1999) claimed that herd behavior is more likely to
occur in smaller companies since they provide scarce information that is difficult to
evaluate, which forces people to decide in an ambiguous environment without being
fully aware of the risk involved. In this situation information seems to contain a large
amount of noise and is not easy to interpret, so investors tend to infer information
through other signals like the decisions made by other investors in the market.
Empirically there seems to be conflicting results, since Blasco et al. (2009)
found that there is a positive relationship between market capitalization and herd
behavior, whereas Lakonishok et al. (1994) showed that herding is more intense when
market capitalization is lower.
To figure out the impact this variable may have on herding, we collect from
Datastream Global Equity Indices the market value (also known as market
capitalization), which is defined as the share price multiplied by the number of ordinary
shares in issue and is displayed in local currency. In order to make a comparison based
on companies’ dimension, we divide the value by the number of existing firms in the
market, reaching thus the median size of companies in a particular market (as suggested
by Chui et al., 2010).
Thus, the size of firms (SIZE) is represented in the following way:
(3.4) Size =
d) Turnover
An additional factor we should take into account when referring to herding is the
turnover, since according to Campbell et al. (1993), it can be considered as a proxy of
Page 46
38
trading volume, being its use is preferable due to its relative character (because it is
normalized by the number of shares outstanding, we can be sure that this measure is not
only capturing larger firms).
Also, Chui et al. (2001) stated that turnover can be seen as a proxy for
information vagueness and Christoffersen and Tang (2010) supported this view
affirming that it can measure information precision and asymmetry. Besides that,
Bikhchandani et al. (1992) and Avery and Zemsky (1998) defended that herding
increases when the information quality is poor, which can be measure by turnover.
Furthermore, Suominem (2001), and Blume et al. (1994) suggested that a higher
level of trading volume is synonym of better quality information. On the other hand,
Harris and Raviv (1993) and Wang (1998) performed studies proving that turnover is a
good proxy for investors’ consensus in the market.
Empirically, Economou et al. (2011) did not find any specific relationship
between trading volume and herding when they analysed this behavior for four
Mediterranean countries. Indeed, their evidence was mixed, indicating that in Portugal
tends to be a higher level of herding when the trading volume is higher, in Italy, on the
other hand, this behavior is more evident when trading volume is low, in Greece
herding exists in both situations and in Spain never exists. Also, Christoffersen and
Tang (2009) tested herding in the United States market and concluded that, overall,
herding is higher when turnover is lower.
These reasons make us conclude that there is a potential relationship between
turnover and herding and so, we decide to include this variable, collecting data for
turnover ratio from World Bank. Turnover ratio is defined as the total value of shares
traded during the period divided by the average market capitalization and is expressed
in US dollars. Since the variable is measured in relative terms, there is no need to
convert it to local currency.
To measure turnover in a daily frequency, we have to divide the collected value
for the number of daily observations in the year. This happens because the data from the
World Bank, regarding turnover, is only available in annual terms.
Turnover ratio is thus calculated in the following way:
(3.5) Turnover ratio =
Page 47
39
e) Bull and bear markets
One more feature we have to consider has to do with different market
movements, since investors can react differently when facing a rising or a falling
market. That was already studied by Tan et al. (2008) and Chiang and Zheng (2010),
who showed evidence of asymmetric herd behavior under different market movements.
According to Chiang et al. (2011), one explanation for this asymmetry is related
to the flow of information. For instance, if analysts tend to recommend more actively on
the buy-side than on the sell-side and investors base their decisions on analysts’
recommendations, there will probably exist more herding in rising markets. On the
other hand, investors may think that the government always intervene when markets
decline significantly and so, in falling markets, there is less herding.
Empirically, Chang et al. (2000) analysed five different markets (US, Hong
Kong, Japan, South Korea and Taiwan) and suggested that investors react differently
under different market conditions, being the dispersions of returns higher in up markets
relatively to down markets, thus existing more herding in down markets. On the other
hand, Ohlson (2010) when analysing the Swedish market, found that herding was more
intense during the bullish phase.
For our analysis, we define bull and bear market as in Chauvert and Potter
(2000). Thus, bull and bear markets correspond to periods of generally increasing and
decreasing market prices, respectively. This definition implies that, in order to switch
from a bull to a bear state, prices have to decline for a considerable period since their
previous local peak, however, it does not exclude sequences of prices rises (falls) during
a bear (bull) market, existing restrictions on the extent to which these sequences of price
reversals can occur.
There are in the literature methods to classify stock returns into bull and bear
markets, called dating algorithms, that try to use a sequence of rules in order to isolate
patterns. An algorithm widely known is the one proposed by Bry and Boschan (1971) to
identify business cycles’ turning points, that was further adopted by Pagan and
Sossounov (2003) to characterize bull and bear phases in financial markets, using
monthly stock returns.
Page 48
40
The criteria used in this algorithm are the location of potential peaks and troughs
(points higher or lower than a window of surrounding points) and the length of each
phase and cycle. The Bry and Boschan (1971) algorithm can be summarized as follows:
1. Identify the peaks and troughs by using a window of 6 months;
2. Enforce alternation of phases by the higher of adjacent troughs and the lower
of adjacent peaks (removing irrelevant local extreme points);
3. Eliminate phases with duration less than 4 months;
4. Eliminate cycles with duration less than 15 months.
Therefore, we use RATS software to compute the Bry and Boschan (1971)
algorithm to identify relevant turning points and classify the resulting phases into bull
and bear market through a dummy variable. This dummy assumes the value 1 when we
face a bull market and a value 0 when we face a bear market.
f) Extreme market movements
We mentioned above that investors can make different decisions when they are
facing a rising or a falling market, but this asymmetric behavior may be intensified in
the presence of extreme market conditions.
According to Christie and Huang (1995) and Chang et al. (2000), investors tend
to act rational in periods of tranquil stock market phases, since they trade mostly basing
their decisions on their private information, but herd in periods of extreme market
movements. Also, Christie and Huang (1995) concluded that herding responds
asymmetrically to extreme market movements being the phenomenon more relevant on
the downside, idea also supported by Chiang et al. (2011) since mutual fund managers
have the need to sell securities in order to raise cash when they face significant
redemption requests, which are more likely to happen during market declines, being
thus more prone to herding in these situations.
To observe if herding is more pronounced during extreme market movements
(and also test the asymmetry between the upside and downside of these extreme
conditions), we use the 5% lower tail and 5% upper tail of the returns’ distribution to
create dummy variables reflecting both situations. The dummy reflecting extreme up
movements takes the value 1 if the return is located on the 5% upper tail of the returns’
distribution and 0 otherwise. The dummy reflecting extreme down movements has the
Page 49
41
value 1 if the returns is in the 5% lower tail of the returns’ distribution and the value 0
otherwise.
g) Market capitalization to GDP ratio
In previous literature the market capitalization to GDP ratio is viewed as a proxy
for economic and institutional development, being thus positively associated with stock
market development (De Jong et al., 2008; Beugelsdijk and Frijns, 2010; Nguyen and
Truong, 2013).
De Jong et al. (2008) defended that institutional development has influence on
the decision of a particular country to rely more on a market-based or a bank-based
system, while Beugelsdijk and Frijns (2010) stated that the ratio can be seen as a proxy
for a country’s liquidity, which would attract more investors to the market. In fact, in
their study, they concluded that a higher market capitalization to GDP ratio reflects a
higher stock market development, which in turn leads to an increase in foreign
investment and diversification.
For all the exposed reasons, we include market capitalization to GDP ratio in our
analysis. The data for the market capitalization is taken from Datastream Global Equity
Indices and the GDP is taken from the World Bank, as specified as follows:
(3.6) MC =
h) Gross domestic product per capita (GDPpc)
In the literature, just like market capitalization to GDP ratio, GDPpc tends to be
associated with economic and institutional development. Kwok and Tadesse (2006) and
La Porta et al. (1997) argued that GDPpc is closely related to institutional quality and
financial development and so, a country with a higher GDPpc will tend to exhibit a
lower level of herding.
Empirically, Anderson et al. (2011) found that a higher GDPpc was associated
with a higher diversification, which lead us to think that it tends to exist less herding in
countries characterized by high GDPpc. Another interesting result was discovered by Li
et al. (2013), who found GDPpc to be related to individualism, which tends to entail a
lower level of herding.
Page 50
42
In order to have a clear picture of what causes herding, we decide that it would
be relevant to control for this macroeconomic factor and so, we collect data for GDPpc
from the World Bank. The gross domestic product (GDP) is defined as the gross value
added by resident producers in the economy plus product taxes minus subsidies that are
not included in the products’ value. The data collected regarding this variable is given in
annual terms, therefore we divide the value by the number of observations that exist in
one year to have the daily value of GDPpc.
(3.7) GDPpc =
In table 4 we summarize the expected impact each determinant has on herd
behavior, explaining the reasons behind that influence.
Table 4 – Expected impact of the determinants of herding
This table shows the expected influence that the determinants usually considered in literature
have on herd behavior.
Based on what we have exposed previously, we give the reasons that may be able to explain this
influence.
Regarding the expected impact on herding, “Positive” means that the higher the value for the
determinant, the higher would be the level of herding; “Negative” means that the higher the
value the determinant has, the lower would be the level of herding; and “Ambiguous” stands for
the situation where we cannot define what is the correct direction of that influence.
Determinants of herding Reason Expected impact on
herding
Book-to-market ratio Risk premium required /
investors’ underreaction Negative
Volatility Information uncertainty Positive
Size Saliency / information flow Ambiguous
Turnover Information quality /
differences of opinion Negative
Bull market Analysts’
recommendations Positive
Bear market Government interventions Negative
Extreme market
movements Information uncertainty Positive
Market capitalization to
GDP ratio and GDPpc Stock market development Negative
Page 51
43
3.3. Methodology
Here we present the approach we follow in our study to detect herding and the
main measures of herding used in empirical studies, discussing the advantages and
disadvantages of utilizing each of the measures. We end this section with our model
specification.
3.3.1. Herding approach
There are two different ways to study herd behavior, depending on the focus of
the analysis intended to follow.
The first one is concerned with herding at a micro-level and focus on the
behavior of specific groups of investors or of individual investors, analysing for
example the capital allocation of mutual funds, the trading behavior of an investor or the
recommendations of stock analysts (Ohlsen, 2010).
The second one is the market wide approach, where the market aggregated data
is used and the focus is on the cross-sectional correlations of the entire stock market
(Ohlson, 2010). According to Henker et al. (2006), this approach concentrates on
tendencies that are observable in the market as a whole and the way to detect herding
has to do with the distance between the individual returns and the market returns. This
is based on the argument that, in case this phenomenon occurs, the returns of individual
stocks tend to cluster around the market return, thus indicating that investors suppress
their own opinions in favour of the market consensus.
The difference between the two methods is related to the purpose of the study,
since the market wide approach focus on measuring the quantity of herding, while the
micro-level herding approach allows us to identify the investors that are leading and
following the herd.
The majority of existing studies focus on the micro-level herding (Kallinterakis
and Ferreira, 2006) and, based on them, we can state that institutional investors are
more prone to rational herding (Kim and Wei, 2002), while individual investors are
more prone to irrational herding (Wermers, 1999). Nevertheless, in our study we intend
to verify the existence of herding in the market as a whole without concerns to the type
of investor that causes it, so our approach is to study market wide herding.
Page 52
44
3.3.2. Measure of herding
As for the herding measure to apply, the most used ones in empirical studies are
those proposed by Lakonishok et al. (1992), Christie and Huang (1995) and Chang et al.
(2000), but the first one is mostly used for studies concerning institutional investors
while the other two are used independently of investors’ type (individual or
institutional).
The measure proposed by Lakonishok et al. (1992) is widely used, which may
facilitate the comparison with previous studies, however, our purpose is to study the
market as a whole and not analyse only the institutional investors, so this measure
would not interest us. Besides that, it has a limitation regarding the fact that it only
considers the number of funds in the buy and sell side without concerning the funds’
trading volume, that is, the quantity they buy and sell (Bikhchandani and Sharma, 2001;
Xu, 2006).
On the other hand, the measure of Christie and Huang (1995) considers the
whole market without differentiating individual and institutional investors and is
expressed through a cross-sectional analysis of asset returns. In their model, a smaller
dispersion is viewed as a movement towards the market consensus, since it seems to
indicate a parallel movement between individual returns and market return.
This measure is calculated as follows:
(3.8) CSSDt = ,
where Ri,t is the stock return of firm i at time t and Rm,t is the cross-sectional average of
the N returns in the market portfolio at time t.
Therefore, we can observe herd behavior when the dispersions are relatively
low, since rational asset pricing models predict an increase in dispersion due to the
difference in individual assets’ sensitivity to market movements, which leads the
individual returns to be repelled away from the market return (Christie and Huang,
1995). However, even if when we have herding we have low dispersions, we cannot
conclude that low dispersions by themselves are synonym of herding, since there are
other factors capable of causing low dispersions. For example, the lack of new
information during a certain trading period would generate low dispersion without the
presence of herd behavior.
Page 53
45
Additionally, these authors argued that herding is more likely to occur during
periods of great instability, since there seems to be a conflict between rational asset
pricing models and herding as for the behavior of dispersions during periods of market
stress (Christie and Huang, 1995). To test the presence of herding in opposition to the
behavior in dispersions to be observed if asset pricing models is considered, during
periods of extreme price movements, they used a dummy method considering the
extreme tails of market returns’ distribution:
(3.9) CSSDt = α + β1 + β2 + εt ,
where = 1 if the market return on day t is in the extreme lower tail of the return
distribution ( = 0, otherwise) and = 1 if the market return on day t lies in the upper
tail of the return distribution ( = 0, otherwise).
Although the measure proposed by Christie and Huang (1995) seems very
intuitive to capture herding, the truth is that it can also be affected by outliers
(Economou et al., 2011). Also, according to Ohlson (2010), this measure tests the
existence of herding during periods of market stress, but for Hwang and Salmon (2004)
herding may be present during quiet periods (because during these times the role of the
market portfolio is replaced by different factors that may serve as herding objectives).
Having in mind all the criticisms around Christie and Huang’s (1995) measure,
in our study we decide to adopt the measure proposed by Chang et al. (2000). Their
measure is a variant of the one proposed by Christie and Huang (1995), that follows the
same logic of it, but with the advantages of mitigating the problem of outliers’ existence
and of being able to detect herding during normal conditions (Lindhe, 2012). The
measure of Chang et al. (2000) uses the cross-sectional absolute deviation as a better
measure of dispersion, since Granger and Ding (1995) stated that standard deviations
are inherently more sensitive to outliers than mean absolute deviations.
Chang et al. (2000) argued that herding can be captured through cross-sectional
dispersion of asset returns, concluding that when we observe a low dispersion, there
seems to be a movement towards the market consensus (which would indicate the
presence of herding). Thus, the measure we apply in our work is the cross-sectional
absolute deviation (CSAD) and is specified below:
Page 54
46
(3.10) CSADt = ,
where N represents the number of firms, Ri,t represents the observed return of firm i at
time t and Rm,t is the cross-sectional average stock of N returns in the portfolio at time t.
So, if there is evidence of herding, individual asset returns will not diverge
substantially from the overall market return, being CSAD close to zero when returns
move in unison with the market and increases as individual returns begin to deviate
from the market return (Chang et al., 2000).
To conduct a test for detecting herd behavior, Chang et al. (2000) established a
relationship between the dispersion of returns and market return as follows:
(3.11) CSADt = β0 + β1 |Rm,t| + β2 + εt ,
where CSADt is the cross-sectional stock return dispersion on day t and Rm,t is the
market return on day t.
Under normal conditions, a linear positive relationship between the dispersion of
returns and market return is predicted, however, in periods of large price swings,
investors may have the tendency to decide upon the market consensus, which reflects
into a nonlinear and negative relationship between CSAD and Rm (Chiang et al., 2011).
In fact, according to Belgacem and Lahiane (2013), the CSAD methodology assumes
that investors’ behavior suffers alterations depending on the market conditions, stating
that during calm periods investors tend to trade on the basis of their private information
(leading to an increase of dispersion around the cross-sectional market return), whereas
in periods characterized by large market movements they tend to suppress their own
beliefs in favour of market consensus, imitating other agents in the market. Thus, if we
are in the presence of herding, we should expect an increase at a decreasing rate or even
a decrease (in case of severe evidence of herding) in dispersion with an increase in the
market return, so a negative sign in 2 would indicate evidence of herd behavior (Chang
et al., 2000).
Albeit better than the measure proposed by Christie and Huang (1995), since it
surpasses the outliers’ problem, the measure proposed by Chang et al. (2000) is also
Page 55
47
subject to some criticisms, namely the non-consideration of other factors that might be
important to explain asset returns.
In our study, we try to detect the intensity of herding through CSAD (as
proposed by Chang et al. (2000)), interpreting a higher dispersion between individual
returns and market return as being indicative of less herding, not considering the
nonlinear relationship that measure has with the market return.
3.3.3. Model specification
In our model, our dependent variable is the cross-sectional absolute deviation
(CSAD), defined by Chang et al. (2000) as being a measure of returns’ dispersion. In
order to analyse the impact that some determinants may have on the dispersion of
individual returns around the market return, we develop a model using the
abovementioned controls (determinants of herding, control variables and cultural
dimensions). Although we have to control herding for some determinants that influence
the dispersion of returns, our main goal is to test the impact of culture on the propensity
for this behavior, so our focus will be the analysis of the cultural dimensions included in
the regression.
Therefore, our regression is specified as follows:
(3.12) CSADi,t = β1 + β2BTMi,t + β3VOLi,t + β4SIZEi,t + β5TURNi,t +
β6EXTREME_UP,t + β7EXTREME_DOWNi,t + β8BULL_BEARi,t + β9MC/GDPi,t +
β10GDPpc,t + β11INDi + β12MASi + β13UAi + β14PDi + β15LTOi + εi,t
where CSADi,t is de cross-sectional absolute deviation (that informs us about the
dispersion of individual returns to market returns) in country i at moment t;
BTMi,t is the book-to-market ratio in country i at moment t;
VOLi,t represents the daily volatility in country i at moment t;
SIZEi,t represents the average size of firms in a certain market, expressed by the
market capitalization, in country i at moment t;
TURNi,t is the turnover rate that reflects the trading activity of the market in
country i at moment t;
Page 56
48
EXTREME_UPi,t is a dummy variable that represents extreme rising movements
and assumes the value 1 when the returns fall into the 5% upper tail of the returns’
distribution, in country i at moment t, and 0 otherwise.
EXTREME_DOWNi,t is a dummy variable that shows extreme decline
movements and assumes the value 1 when the returns lie on the 5% lower tail of
returns’ distribution, in country i at moment t, and 0 otherwise.
BULL_BEARi,t is a dummy variable that reflects market movements, assuming
the value 1 when we face a bull market and 0 when we face a bear market, in country i
at moment t;
MC/GPDi,t represents the market capitalization relative to gross domestic
product, in country i at moment t;
GDPpci,t shows the value of gross domestic product per capita, in country i at
moment t;
INDi , MASi, UAi, PDi and LTOi are the cultural dimensions, which are constant
over time, that represent respectively the level of individualism, masculinity,
uncertainty avoidance, power distance and long-term orientation of a country i.
In order to decide the best approach to estimate a model, we have to consider the
objective of the study and the context of the data. So, to estimate our model we use
panel data, applying the EGLS method with cross-section random effects.
Although the performance of the Hausman (1978) test led to the use of fixed
effects (see appendix 1.1), we cannot follow that approach, since we have individual
time-invariant variables that are the same for a given cross-sectional unit through time,
but vary across cross-sectional units. According to Hsiao (2006), Greene (2012) and
Kaur et al. (2013) one of the major shortcomings of the fixed effects model is that it
does not allow the estimation of time-invariant coefficients, being the random effects
model able to include those time-invariant variables among the regressors. This
situation happens because, in fixed effects models, constant terms are perfectly collinear
with country, being unable to cause any change in the dependent variable (Kaur et al.,
2013) and thus, are absorbed from the regression (Greene, 2012).
These authors defended that one of the main advantages of random effects
models is the fact that it can accommodates time-invariant variables. So, when we have
constant terms in a regression, the random effects approach should be used. We do not
Page 57
49
incur in a risk of having an unbiased estimation because our time series data is large
when compared to cross-sectional data and, according to Gujarati (2003), when we face
this situation, there is little difference in the value of parameters estimated by fixed and
random effects.
Furthermore, a major problem that we can find in panel data analysis that we
have to take into account is heteroskedasticity. Therefore, to make our estimators
consistent we use the Period Weight (PCSE) correction to control for heteroskedasticity.
As this method seems to be less stringent regarding standard deviations than the
White period correction, we also perform the analysis using White period to control for
heteroskedasticity.
In order to get more information regarding panel data analysis, fixed and random
effects and the Hausman test, consult the appendix (1.1).
To estimate our model, we use Eviews 8. The results obtained from that
estimation are described in the next section.
Page 58
50
4. Results and Implications
In this section we present the results obtained from the regression model
exposed in the previous section. We divide the interpretation in two parts: the first one
concerns the results for the determinants of herding (4.1.1), while the second one
emphasizes the results we got for the cultural dimensions (4.1.2), since these are the
main focus of our study. Then, we analyse the pre-crisis and crisis period, to see if the
influence of the variables suffered any alterations in those situations (4.1.3).
We further perform a time series analysis with the original Chang et al. (2000)
measure for each country and analyse the relationship herding has with each cultural
dimension individually (4.2). In this case, we test too if there are differences between
the pre-crisis and crisis period (see appendix, 1.3.1). Here, we can observe that most of
the countries that exhibit herding are more likely to have this behavior in tranquil
periods, which represents a flight to fundamentals during periods of market stress (as
suggested by Hwang and Salmon, 2004). In fact, contrary to common belief, Hwang
and Salmon (2004) found evidence that herding would manifest strongly during quiet
periods rather than crisis periods. The authors reached that conclusion when they
studied the US and South Korean markets from 1993 to 2002 and observed that the
Asian crisis in 1997 and the Russian crisis in 1998 decreased the level of herding.
However, in this time series analysis, we can also observe that some countries
that did not exhibit herding before the crisis, started to have evidences of this behavior
during crisis, or even if it exhibited herding before, during the crisis the behavior
became more intense. For these countries, we also test if herd behavior increased even
more after the Euro crisis (2/5/2010). After the financial global crisis that was initiated
with the Lehman Brothers’ bankruptcy, we are now facing a sovereign debt crisis in the
Eurozone. Thus, we consider this date to be representative of the beginning of the Euro
crisis, since it is the time when the first bailout to Greece occurred, leading to the
realization of the destabilization of the Eurozone. In fact, we can consider the Greek
case as being the “Lehmann Brothers” of sovereign debt that led to the contagion to
other countries in the Eurozone. The results that are shown in the appendix (1.3.1),
suggest that for the countries that present herding (or a higher level of herding) during
the crisis period, the behavior is amplified with the Euro debt crisis.
Page 59
51
Finally, we discuss the implications these results may have in financial markets
and other fields, such as entrepreneurship and management decisions (4.3).
4.1. Results
As we mentioned previously, we use two different methods to correct for
heteroskedasticity, being one less stringent than the other when it comes to standard
deviations. The main purpose of this is to analyse what are the variables that can
effectively be considered to have an impact on herd behavior.
In Panel A we present the results obtained using the Period Weights (PCSE) to
correct for heteroskedasticity, while in Panel B we show the results we get through the
use of White Period correction for heteroskedasticity.
The results for both methods are presented in Table 5, below.
Table 5 – Results for the determinants of herding and cultural dimensions
Daily cross-sectional absolute dispersion of returns are regressed on Hofstede’s cultural dimensions,
(Individualism – IND, masculinity – MAS, uncertainty avoidance – UA, power distance – PD and long-
term orientation – LTO) and a set of explanatory variables that are usually mentioned in the literature as
being determinants of herd behavior (book-to-market ratio – BTM, volatility – VOL, size of the firms –
SIZE, turnover rate – TURN, market capitalization related toGDP – MC/GDP, gross domestic product
per capita – GDPpc and dummies expressing extreme up and down movements – EXTREME_UP and
EXTREME_DOWN – as well as market phases – BULL_BEAR).
Panel A is estimated using Panel EGLS with cross-section random effects and Period Weights (PCSE)
consistent estimates of standard errors and covariance are used to compute t-statistics.
Panel B is estimated using Panel EGLS with cross-country random effects and White Period (PCSE)
consistent estimates of standard errors and covariance are used to compute t-statistics.
F1 (F-statistic test) is used to test the hypothesis that all the estimated slope coefficients except the
coefficients of cultural dimensions are jointly equal to zero, while F2 (F-statistic test) is used to test the
hypothesis that all the estimated slope coefficients are jointly equal to zero. These two tests are made to
show the global significance of the regression with and without the cultural dimensions. The p-values are
in parenthesis.
A positive sign in the coefficient means that the variable has a positive impact in the dispersion of returns,
which means that it has a negative impact on herding.
* means that a variable is significant at a 10% level, ** means the variable is significant at a 5% level and
*** means that a variable is significant at a 1% level.
Page 60
52
Panel A – Period Weights (PCSE) standard errors and covariance
Dependent variable: CSAD
Method: Panel EGLS (cross-section random effects)
Periods included: 3392
Total panel (unbalanced) observations: 130661
Variable Coefficient Std. Error t-statistic Prob.
C 0.284887 0.076134 3.741913 0.0002
BTM 0.103345*** 0.001483 69.68870 0.0000
VOL 0.017374*** 0.000325 53.45721 0.0000
SIZE 0.000000000000001*** 0.000000 -9.472347 0.0000
TURN 0.128775*** 0.005318 24.21327 0.0000
MC/GDP -0.000219*** 1.04E-05 -21.05496 0.0000
GDPpc 0.00000375*** 0.00000039 9.618555 0.0000
EXTREME_UP 0.485705*** 0.005216 93.10987 0.0000
EXTREME_DOWN 0.411216*** 0.004494 91.50774 0.0000
BULL_BEAR -0.004424*** 0.001618 -2.734685 0.0062
IND 0.001157* 0.000640 1.808110 0.0706
MAS 0.001863*** 0.000601 3.099440 0.0019
UA -0.001017** 0.000505 -2.012697 0.0441
PD 0.001815*** 0.000695 2.610085 0.0091
LTO 0.000307 0.000588 0.522248 0.6015
Adjusted R2 = 0.382610
F1= 3403.054 (0.00) F2= 2291.368 (0.00)
Page 61
53
Panel B – White Period standard errors and covariance
Dependent variable: CSAD
Method: Panel EGLS (cross-section random effects)
Periods included: 3392
Total panel (unbalanced) observations: 130661
Variable Coefficient Std. Error t-statistic Prob.
C 0.284887 0.100592 2.832114 0.0046
BTM 0.103345*** 0.012202 8.469408 0.0000
VOL 0.017374*** 0.002532 6.860737 0.0000
SIZE 0.00000000000001*** 0.000000 -2.594405 0.0095
TURN 0.128775** 0.056666 2.272532 0.0231
MC/GDP -0.000219* 0.000132 -1.658055 0.0973
GDPpc 0.00000375** 0.00000174 2.154335 0.0312
EXTREME_UP 0.485705*** 0.024428 19.88308 0.0000
EXTREME_DOWN 0.411216*** 0.023331 17.62514 0.0000
BULL_BEAR -0.004424 0.009148 -0.483607 0.6287
IND 0.001157 0.000788 1.467801 0.1422
MAS 0.001863** 0.001015 1.835765 0.0664
UA -0.001017 0.000672 -1.514897 0.1298
PD 0.001815* 0.001060 1.711875 0.0869
LTO 0.000307 0.000910 0.337723 0.7356
Adjusted R2 = 0.382676
F1= 177.1424 (0.00) F2= 207.8794 (0.00)
Page 62
54
4.1.1. Determinants of herding
In panel A, our results show that every variable considered as a determinant of
herding is statistically significant, which means that they can in fact explain the
phenomenon. In panel B, only the variable representing market movements (Bull_Bear)
is not statistically significant, at a 10% level.
We present in Table 6 the confrontation between the expected and obtained
results regarding the impact each determinant has on herd behavior.
Table 6 – Expected vs. obtained results for determinants of herding
The expected results are the ones based on the hypothesis formulated previously and the obtained results
are the outcome of the regression model.
If the sign is “+”, the determinant has a positive impact on herding (and therefore, a negative impact on
the dependent variable, CSAD); if the sign is “-”, the determinant has a negative impact on herding
(which means it has a positive impact on CSAD); if the sign is “?”, it means the result is ambiguous; if
the result is “NS”, it means that the variable is not statistically significant at a level of 10%.
Variable Expected Result Obtained Result
Panel A Panel B
BTM - - -
VOL + - -
SIZE ? + +
TURN - - -
MC/GDP - + +
GDPpc - - -
EXTREME_UP + - -
EXTREME_DOWN + - -
BULL_BEAR + + NS
We can observe that book-to-market ratio, volatility, turnover, GDPpc and both
dummies that reflect extreme market movements reveal a positive relation with the
Page 63
55
dependent variable (CSAD), meaning that an increase in those variables (or in case of
the dummies, the evidence of the situation to which they respect) will cause a decrease
in the observed level of herding. On the contrary, size and market capitalization to GDP
seem to have a negative relation with the dependent variable, thus evidencing that an
increase in this variable leads to an increase in the level of herd behavior.
a) Book-to-market ratio
In what concerns the book-to-market ratio, the negative relationship with
herding is consistent with Lakonishok et al. (1994) and Blasco et al. (2009), supporting
the vision that investors are uninformed and so, they tend to underreact.
The explanation for this fact may be related to the degree of investors’
information, because companies that present a lower book-to-market ratio tend to have
higher expected returns, but offer lower current returns and show worse financial
indicators (for example, a low number of sales and high PER). So, uninformed investors
look at companies that currently show better financial indicators (and thus, that are
more salient) and invest on them, disregarding the fact that usually they have lower
returns in the future.
b) Volatility
Regarding volatility, we found a negative relationship with herding, which goes
against our expectation, since we anticipated that a higher volatility would be associated
to a higher degree of uncertainty, making the information more ambiguous and less
reliable, leading to a formation of cascades. Our results point in the same direction as
those found by, for example, Lobão and Serra (2006), showing that volatility is
probably associated with the arrival of unexpected public information.
c) Size
With respect to the size of the firms, they are in sync with the ones of Blasco et
al. (2009) and contradictory to Lakonishok et al. (1994), since we found a positive
relationship between size and herding, which means that firms with a higher dimension
tend to generate imitative behavior. The discrepancy with Lakonishok’s et al. (1994)
results may be related to the fact that their study focused only institutional investors
Page 64
56
whereas we analyse the market as a whole, so in their sample investors tend to be more
informed and not invest in companies just because they are more salient (what may
happen with individual investors that are usually less informed).
Hence, our outcome tend to show a little more support to Sias (2004) and
Palomino (1996) that defended size to be positively related to investors’ acting in the
same way. This may happen because they are effectively herding, investing in larger
companies because they are widely known and easily recognized, but it may also have
to do with the fact they are just following the same information, since larger companies
tend to release more information, turning the decision environment less ambiguous.
However, we can observe that the value of this particular coefficient is very
small, which lead us to think that, although size is statistically significant, it does not
have a considerable impact on determining herding. Then, even if the coefficient sign
points to larger firms be more prone to herding, the fact is that smaller firms may also
be susceptible to this kind of behavior due to their lack of information that causes
uncertainty.
d) Turnover
Regarding turnover, our findings show that a higher turnover leads to less
herding, which is in accordance with Christoffersen and Tang (2010). This may happen
because low turnover is associated with poorer information and a higher turnover
reflects higher differences of opinion among investors with respect to a stock’s intrinsic
value, as suggested by Harris and Raviv (1993) and Lee and Swaminathan (2000).
e) Extreme movements
In the results for both dummies (up and down) that reflect extreme market
movements we found, against our expectations, that they exhibit an inverse relationship
with herding, meaning that herding is less likely to happen during these extreme
situations.
As a matter of fact, we tend to associate market stress with noise trading or
ambiguous information and, since during these times uncertainty seems to be higher, it
is more likely that people supress their beliefs preferring to stick with the market
consensus. This is well illustrated in some models used to measure herding, for example
Page 65
57
the one of Christie and Huang (1995), that incorporates dummies referring to the up and
down extreme market movements, expecting that if herding exists, it has to be evident
during those periods of market stress.
Nevertheless, there are also some authors (for example, Hwang and Salmon) that
consider herding to be a behavior more intense in quiet periods than in extreme
situations, because in crisis periods investors tend to turn to fundamentals instead of
market movements.
f) Market capitalization to GDP
As opposed to our expectation, our results show that a higher ratio would lead to
more herding. The explanation for this may lie on the fact that a more developed stock
market is more liquid and attracts more investors to trade. Then, if there is more
opportunity to trade stocks in the market, investors are more able to pursue herding
strategies in that market.
On the other hand, the result we obtained may be capturing informational
herding instead of “pure” herd behavior that we want to analyse. In fact, in more
developed stock markets, information quality is better and investors may trade in the
same direction just because they all had access to the same information.
g) GDPpc
The results for GDPpc were in consonance with Anderson et al. (2011), leading
us to think that it tends to exist less herding in countries characterized by a higher
GDPpc.
This can be explained through the fact that countries with a higher GDPpc tend
to have more supervision, regulation and informational institutions, such as credit rating
agencies and analysts (De Jong et al., 2008), which would provide more information
and institutional quality, thus leading to less herding.
Page 66
58
h) Bull and bear markets
In panel A, our results regarding market phases corroborate our expectation that
herding tends to be more intense in bull markets. That may be related to investors’
sentiment in rising markets, which is enlarged by good news from their friends and the
media. In phases that the market is in an upward trend, buy recommendations tend to be
issued and incentive investors to follow other investors that were succeeded. However,
in panel B, our results were not significant, which lead us to the conclusion that maybe
herd behavior is not influenced by the market phases, since it can exists in both rising
and falling markets.
4.1.2. Cultural dimensions
The intention of our study was to test if culture has some kind of impact in the
decision of investors to follow one another, then the results that matter the most are
those of the cultural dimensions we opted to include.
We perform a similar comparison that we made for the determinants of herding,
confronting the expected and obtained results for cultural dimensions in Table 7.
Table 7 – Expected vs. obtained results for cultural dimensions
The expected results are the ones based on the hypothesis formulated previously and the obtained results
are the outcome of the regression model.
If the sign is “+”, the dimension has a positive impact on herding (negative impact on CSAD); if the sign
is “-”, the dimension has a negative impact on herding (positive impact on CSAD); if the sign is “?”,the
result is ambiguous; if the sign is “NS”, the variable is not statistically significant at a level of 10%.
Variable Expected Result Obtained Result
Panel A Panel B
IND - - NS
MAS - - -
UA + + NS
PD ? - -
LTO ? NS NS
Page 67
59
The results obtained allowed us to conclude that culture may in fact play a major
role in financial decision-making and, in particular, on herd behavior, since we found in
panel A individualism, masculinity, uncertainty avoidance and power distance to be
statistically significant and so, with explanation power for this phenomenon. In panel B,
only masculinity and power distance have explanation power for herd behavior.
We begin our analysis with the results we got from panel A and then we analyse
the results from panel B.
a) Individualism
Regarding individualism, we can observe that it has a negative impact on herd
behavior, noticing that an increase of one level of the scale in individualism would
cause an increase in dispersion by 0,001157. This denotes that herding is more likely to
occur in collectivistic countries, which is in consonance with what is predicted both
theoretically and empirically. People from countries with individualist values, tend to
think of themselves as above average and more capable of achieving success with their
own abilities. Thus, they tend to be overconfident and ignore some risks, acting more
autonomously, not depending on a group to make their decisions.
Empirically, our findings are in tune with the majority of studies concerning the
individualism dimension and its impact on financial decision-making. They all point to
a link between individualism and overconfidence, resulting in investors from
individualistic countries to make their investment decisions focusing more on the “I”
than on the “We”, being thus less susceptible to engage in herd behavior.
b) Masculinity
The results for the masculinity dimension are also in tune with the predictions
from previous literature and the hypothesis we formulated, presenting a negative
relation with herding, having an impact of 0,001863 on returns’ dispersion per every
unity increase in this dimension.
Our findings are theoretically consistent, showing that men tend to be self-
confident and ambitious, being driven by competition and success (Hofstede, 1991),
which leads them to trust their own abilities and have risk-taking behaviors.
Empirically, our evidence is consistent with Barber and Odean (2001) that establish a
Page 68
60
positive relationship between gender and trading, showing that men are usually
overconfident investors (thus trading too much) and with Yao and Hanna (2005) and
Beckmann and Menkhoff (2008) who concluded that women are less confident and
more risk-averse.
c) Uncertainty Avoidance
Considering uncertainty avoidance, there is a positive relationship between this
dimension and herd behavior, leading an increase on this dimension to a decrease in the
returns of about 0,001017. This is in accordance with the theory behind the definition of
this variable, which states that countries with high uncertainty avoidance want to avoid
unknown situation preferring predictability and countries with low uncertainty
avoidance are more prone to accept differences of opinion. Previous empirical studies
also support this outcome, in the sense that uncertainty avoidance is directly related to
risk-aversion (e.g. Aggarwall and Goodell, 2009; Beugelsdijk and Frijns, 2010;
Anderson et al., 2011; Nguyen and Truong, 2013) and inversely related to
overconfidence (e.g. Ferris et al., 2013).
d) Power Distance
Regarding power distance, our results seem to support the idea suggested by
Sinke (2012) and Mihet (2012) that low power distance is closely related to values such
as trust, equality and cooperation, thus being observable more harmony. We can
observe that an increase of one unit in power distance causes an increase in dispersions
by 0,001815.
The explanation for our result may lie on the link, suggested by Sinke (2012),
between power distance and institutions quality. The author argued that higher power
distant countries usually have institutions protecting the welfare, thus existing more
shareholder protection. Therefore, those countries tend to have higher institutional
quality that reflects better developed flow of information (Chui et al., 2010), which
entails less herding.
Page 69
61
e) Long-Term Orientation
In what comes to long-term orientation, the result is not statistically significant,
albeit the sign presents a negative relationship with herding.
The relationship considering the sign seems to go in the same direction on what
was found in prior empirical studies, instead of the association that, conceptually, this
dimension has with self-attribution bias (that would cause less evidence of herding).
However, it is not possible to conclude anything on this result, since it is statistically
insignificant to a 60% (Panel A) or 70% (Panel B) level, which means that the sign of
this relationship may not be accurate at all.
In panel B, masculinity and power distance are the only significant variables, at
a 10% level, both leading to a lower level of herding. These variables emphasize the
fact that, people from countries characterized by this cultural background are less risk-
averse and value less harmony and cooperation. Therefore, they tend to trade more and
overestimate their investment abilities. However, if we consider a 15% level, the
previous four dimensions that were significant in Panel A, would also be significant in
Panel B, being the interpretation of these results equal to the one presented before.
In sum, our finding suggest that cultural dimensions have an impact in investors’
decision-making and should be considered when we want to analyse the behavior of
investors in financial markets. Specifically, we reached the conclusion that masculinity
and power distance influence negatively the existence of herding in the market and that
individualism and uncertainty avoidance may also play a role in the sense that the first
one decreases the likelihood of the occurrence of herd behavior, whereas the second one
would imply more herding. Long-term orientation is not statistically significant.
4.1.3. Pre-crisis and crisis period
So far, we analysed the period between 2001 and 2013 as a whole. However, we
have to consider that this sample is not homogeneous in what concerns to financial
markets. In fact, 2008 is a year marked by great instability, where financial market
started to be extremely volatile and international contagion began. It is not easy to
define precisely when did the crisis begin, but we can say that a major event that
contributed for that instability in the markets was the bankruptcy of Lehman Brothers
Page 70
62
on the 15th
of September 2008. Therefore, we divide our sample into two different
periods that we call “pre-crisis” (01/01/2001 – 14/09/2008) and “crisis” (17/09/2008 –
31/12/2013) and investigate if the influence of cultural dimensions changed in both
periods. In Table 8 are illustrated the results for both periods.
Table 8 – Results of cultural dimensions in “pre-crisis” and “crisis” period
In this table we present the results of the impact that cultural dimensions have on herd behavior during a
“pre-crisis” (01/01/2001 – 14/09/2008) and a “crisis” (17/09/2008 – 31/12/2013) period. The t-statistics
are in parenthesis. * means that a variable is statistically significant at a 10% level, ** means that it is
statistically significant at a 5% level and *** means it is statistically significant at a 1% level.
Variable Pre-crisis period Crisis period
IND 0.000976 (0.987410) -0.002280 (-1.126902)
MAS 0.000864 (0.790464) 0.003062 (1.993387)**
UA -0.000527 (-0.632354) -0.004521 (-3.238399)***
PD 0.001806 (1.439803) 0.002340 (1.191568)
LTO 0.000908 (0.865475) 0.002398 (1.595617)
Considering the results above, we can observe that before the crisis none of the
cultural variables were significant, but after the crisis masculinity and uncertainty
avoidance became significant. This may be explained by the fact that information is
now more ambiguous which leads by, on one hand, to the increase of risk-aversion from
investors who are from cultures characterized by fear of uncertain outcomes and, on the
other hand, to the raise of more masculine attitudes, because information is not clear, so
investors that are confident may bet on their own abilities to perform better than others.
This leads us to think that maybe, in countries more characterized by uncertainty
aversion there is a tendency to the occurrence of herd behavior during a crisis period,
but on countries where masculinity is predominant this phenomenon tends to disappear
during a crisis period. That is why it is important to consider cultural factors to
understand how investors in a specific market will react to certain situations.
Page 71
63
4.2. Time series analysis
In our study we use panel data to test the impact of culture on herd behavior,
however, this does not allow us to use the measure of herding proposed by Chang et al.
(2000) entirely. In fact, we only use the cross-sectional absolute deviations as our
dependent variable, but then we do not consider the relationship between CSAD and the
market return to detect the presence of herding. In other words, we assume that lower
levels of dispersions indicates more herding than higher levels of dispersion, but we do
not have a coefficient (like in Chang et al., 2000) that detects clearly the presence and
intensity of this phenomenon.
So, at this point, we decide to perform a time-series analysis for each country,
using the measure of Chang et al. (2000) in whole (equation 3.11), suggesting then a
relationship between each cultural dimension and herding. Basically we regress their
measure for each country individually and then obtain the value for the coefficient β2,
confronting it with the value the country has for a certain cultural dimension (if the
coefficient is negative, it means that herding exists). Then, we compare all the countries
against each other and observe the relationship between these cultural dimensions and
herding. The regressions for each country can be found in appendix (1.3).
The relationship between individualism and herd behavior is shown in Figure 1.
Figure 1 – Relationship between individualism and herding
In this figure we present the comparison between countries’ individualism and herding.
In the X-axis is represented the level of herding. In this case, a negative value indicates the
presence of herding in that market and, the lower the value, the higher the intensity of the
phenomenon. In the Y-axis is represented the value for the individualism dimension of each
country. In this case, a higher value indicates a higher degree of individualism.
Page 72
64
Observing figure 1, we can conclude that there is a negative relationship
between individualism and herding, since countries with a higher level of herding (for
example, Portugal) tend to be the ones that are more collectivist. This corroborates the
hypothesis we formulated in section 3, when we associated individualism to
overconfidence, leading that to a lower imitative behavior.
The relationship between masculinity and herding is next presented, in Figure 2.
Figure 2 – Relationship between masculinity and herding
In this figure we present the comparison of all the countries in terms of masculinity and level of
herding, observing the existing relationship between those two variables.
In the X-axis is represented the level of herding. In this case, a negative value indicates the
presence of herding in that market and, the lower the value, the higher the intensity of the
phenomenon.
In the Y-axis is represented the value for the masculinity dimension of each country. In this
case, a higher value indicates that the country is more masculine.
From Figure 2, we can also observe that there is a negative relationship between
masculinity and herding, since countries more masculine tend to exhibit a lower level of
herding. This is also in tune with our hypothesis that investors from countries
characterized by high masculinity, tend to be less risk-averse, thus showing a lower
propensity to herd.
The following analysis related uncertainty avoidance with herd behavior and the
results of it are shown in Figure 3.
Page 73
65
Figure 3 – Relationship between uncertainty avoidance and herding
In this figure we present the comparison of all the countries in terms of uncertainty avoidance
and level of herding, observing the existing relationship between those two variables.
In the X-axis is represented the level of herding. In this case, a negative value indicates the
presence of herding in that market and, the lower the value, the higher the intensity of the
phenomenon.
In the Y-axis is represented the value for the uncertainty avoidance dimension of each country.
In this case, a higher value indicates that the country has a higher degree of uncertainty
avoidance.
Regarding Figure 3, we can conclude that there is a positive relationship
between uncertainty avoidance and herd behavior, being countries highly characterized
by uncertainty avoidance (for example, Portugal) the ones that show higher level of
herding, while countries with lower uncertainty avoidance (for example, Singapore)
show no evidence of herding.
This result is also in consonance with our expectations when formulating our
hypothesis, since investors from countries with higher uncertainty avoidance tend to be
more risk-averse.
Next, we show the relationship between power distance and herding, in Figure 4
Page 74
66
Figure 4 – Relationship between power distance and herding
In this figure we present the comparison of all the countries in terms of power distance and level
of herding, observing the existing relationship between those two variables.
In the X-axis is represented the level of herding. In this case, a negative value indicates the
presence of herding in that market and, the lower the value, the higher the intensity of the
phenomenon.
In the Y-axis is represented the value for the power distance dimension of each country. In this
case, a higher value indicates that the country is more power distant.
From the observation of Figure 4, we can conclude that there is a positive
relationship between power distance and herding, which is in sync with Hofstede
(1991). This makes sense, because investors from countries characterized by lower
power distance tend to be more autonomous.
This result goes against the result we obtained when estimating our regression
before, however, this implies a different model to include cultural dimensions than the
one applied in section 3.
Finally, we show in Figure 5 the relationship between long-term orientation and
herd behavior.
Page 75
67
Figure 5 – Relationship between long-term orientation and herding
In this figure we present the comparison of all the countries in terms of long-term orientation
and level of herding, observing the existing relationship between those two variables.
In the X-axis is represented the level of herding. In this case, a negative value indicates the
presence of herding in that market and, the lower the value, the higher the intensity of the
phenomenon.
In the Y-axis is represented the value for the long-term orientation dimension of each country.
In this case, a higher value indicates that the country is more power distant.
The results from Figure 5 tell us that there is a negative relationship between
long-term orientation and herd behavior. This gives weight to the argument that
institutional investors represent a major part of the financial markets and they tend to be
short-term oriented, since they have to present results quarterly.
4.3. Implications
We have seen during our study that culture can have a role in explaining a crowd
behavior in financial markets, where investors follow one another even when their
private information seem to tell them not to. It is important to understand what is behind
this behavior because it can be a destabilizing force in the market, provoking price
bubbles and mispricing. In fact, Hott (2012) related the occurrence of herding with the
housing price bubble, arguing that more people decided to enter in the housing market
expecting to win a fortune, just like other investors won.
Page 76
68
Also, Welch (1992) argued that herding can partly determine a success of an
IPO, since investors that are approached after some time tend to infer information from
previous investors. In our view, it is relevant to include cultural dimensions here, since
investors would put different weights on prior investors’ action depending on the values
that are predominant in their culture.
Furthermore, understanding the reasons that lead to herd behavior can help
investors to define better their portfolio decisions and policymakers to adequate their
policy setting to each market.
However, it is not only in investors and financial markets that culture can have
influence. In fact, we have seen before that psychological and cultural factors can have
impact in all of our decision-making processes. We next present some example of fields
where culture can have a role to play.
Let’s begin with entrepreneurship. We can see all around us people that want to
be entrepreneurs and, in fact, there are currently TV shows (for example, Shark Tank)
that promote their ideas and incentive people to follow that path. But we also know that
starting a new business is not an easy thing to do: the risk and initial investment
involved are huge. Sometimes is it needed to create a demand for the product or a brand
and that will necessarily consume a lot of financial resources. According to Hamilton
(2000) a person employed will win more 35% than a person that is self-employed over a
period of 10 years. So, there seems to be psychological and social factors that attract
people to pursue the path of starting a business on their own. Cultural factors may be
related to the decision of individuals to become entrepreneurs, since they have to have
characteristics such as overconfidence and risk-seeking profile to embark in a project of
their own, being entrepreneurship related to dimensions such as individualism and
masculinity.
Next, we explore the influence that culture can have in management decisions.
Lobão (2013) suggested in his book that managers’ decisions are influenced by
psychological factors. Indeed, we can observe that companies belonging to the same
activity sector, and facing similar situations, follow different paths and strategies,
regarding investments, the way to get financing, dividends policy and mergers and
acquisitions.
Page 77
69
Managers are the ones responsible for making those decisions that impact the
course of the company and their decisions are dependent on psychological factors and
social interactions that are partly inherent to their cultural background. For example,
when a manager needs financial resources, he can choose to get them internally or
externally. His decision may be related to the masculinity dimension, since a manager
belonging to a country where masculinity is deeply embedded, is more reluctant to use
external funds. Also, when a manager has to decide whether to invest or not in a project,
his risk profile may be dependent on cultural characteristics, such as individualism,
masculinity and uncertainty avoidance. In this sense, a manager from a culture with a
high degree of individualism and masculinity, and a low degree of uncertainty
avoidance, will tend to underestimate the risk and be more confident on the future
results of the investment.
Furthermore, M&A processes can be also related to cultural characteristics of
the managers. Ferris et al. (2013) reached the conclusion that overconfident managers
tend to be more prone to mergers and acquisitions because they underestimate the risk
involved, and are also more prone to acquire diversified businesses that are not related
to his core business, because they think they possess superior decision-making abilities
than their peers. So, M&A processes may be associated with dimensions such as
individualism and masculinity, which are directly related to overconfidence.
Finally, the dividend policy can be also influenced by culture, since he decision
to distribute dividends implies that the money to distribute will not be available to
invest in the company. Therefore, cultural dimensions such as long-term orientation
may help to understand this decision, because in long-term oriented countries maybe
people would prefer to save the money in order to invest and earn a higher return in the
future and short-term oriented countries may prefer to distribute dividends.
Page 78
70
5. Conclusion
Given the low correspondence between the predictions of theoretical models in
finance and what we observe empirically in financial markets, there has been over the
last years an increase in the relevance of studying investors’ behavior, since it may
create patterns capable of impacting stock prices. This helps us to understand how
investors act in reality and why they make certain decisions.
In fact, interveners in financial markets are human beings and then, when they
have to face some decision-making situations, they are susceptible to psychological
biases that would move them away from what should be the “rational” decision.
Besides, agents in financial markets are not isolated from other participants, they
interact with each other, and that social interaction can also lead them to adopt a
different decision from the one they would choose if they were not facing social
interaction.
Considering this, there has been some studies concerning the outcomes that may
result from those psychological and social forces underlying investors’ behavior,
especially the imitative behavior that may emerge. Our study also focused the herd
behavior, but our approach distinguished from all previous studies in the sense that we
were the first, as far as we know, to include a cultural view to this phenomenon. The
rationale for this analysis was that in our daily life, when interacting with people from
different cultural background, we can observe that we have different ways to see reality
and thus, think and act differently. If the decisions we face every day are influenced by
our culture, is expected that what occurs in financial markets are also influenced, since
it is based on the decisions its participants make (e.g. when to invest, which stock to sell
or buy, how much money to invest).
Therefore, our main goal with the present study was to test the influence cultural
factors could have in the existence and intensity of mimetic behavior. For that purpose
we used Hofstede’s (2001) five cultural dimensions and the measure of herding
proposed by Chang et al. (2000), as well as some determinants of herding and variables
related to institutional quality and economic development that are often explored in
literature to explain herd behavior (book-to-market ratio, volatility, turnover, size,
market capitalization to GDP ratio and GDPpc).
Page 79
71
Our analysis was made for 39 countries during the period from 01/01/2001 to
31/12/2013. We then divided the sample into two different periods, called “pre-crisis”
and “crisis”, because the financial crisis that began with the bankruptcy of Lehman
Brothers caused a great instability in the markets and that may lead to some changes in
investors’ behavior.
Our results suggested that culture has indeed the ability to influence the
dispersion of returns, impacting evidence of herding. Countries characterized by a
higher level of masculinity and power distance are less prone to herd behavior. The
results for individualism and uncertainty avoidance were only statistically significant
when we considered a less stringent approach on standard deviations. However, they
suggest that individualistic countries less prone to herd behavior and countries with high
uncertainty avoidance more likely to exhibit herding. Long-term orientation was not
statistically significant.
Nevertheless, we have to admit that our study presents some limitations. In first
place, there were issues regarding data availability that prevented us from analysing a
larger sample of countries and forced us to use daily values that may not correspond
exactly to its true daily value (some variables were only available annually and in order
to have its daily value we divided the annual value for the number of observations of the
year, assuming that they present the same value every day).
Secondly, the measure of herding we employed has two problems: on one hand,
it does not capture herding if this is only evident in a specific asset or group of assets,
for example, from a particular economic sector; on the other hand, it considers
“spurious” herding, since it does not have any mechanism able to distinguish changes in
returns’ dispersion driven by sentiment from those driven by adjusting to new
information.
One of the ways to attenuate this limitation is the use of Hwang and Salmon’s
(2004) measure, that assumes herding to be stronger during quiet periods, since in a
crisis periods there tends to be a flight to fundamentals.
Their measure presents some similarities with Christie and Huang’s (1995), in
the sense that they also exploit cross-sectional movement of the market. However, their
focus is more on the cross-sectional variability of factor sensitivities rather than returns,
which gives them the advantage of capturing convergence on market beliefs on a
Page 80
72
specific asset or asset classes. This is important because, according to Hwang and
Salmon (2004), market stress does not imply that the market as a whole has to show
large negative or positive returns, since even without the existence of a large movement
in the market as a whole we may be able to find a considerable reallocation towards
particular sectors. For instance, if we observe some euphoria in certain sectors (e.g.
technology), investors will start to sell the unattractive stocks and buy the hot stocks,
while new investors enter the market to invest in those appealing stocks. The outcome
of this is that dispersions to the market return increase because investors are only
investing in a specific group of stocks, but this is not captured by the measure we
employed.
On the other hand, the dummy method that we used to reflect extreme market
movements does not include any sort of device that enables us to control for movements
in fundamentals, which makes impossible to distinguish if it is herding or adjustment to
fundamentals. In other words, the measure of herding we used in our study is incapable
of separating “spurious” herding from herd behavior induced by investors’ sentiment.
The model proposed by Hwang and Salmon (2004) can overcome this problem at some
extent because it is based on observed deviations from equilibrium beliefs expressed in
CAPM.
Finally, we used daily data but literature suggests that the ideal time frequency is
intradaily, since in such a short period of time investors are more likely to “act by
feeling”, not having enough time to apply complex models to their decision.
Considering the aforementioned limitations, we suggest for further investigation
the use of a different herding measure (e.g. the measure proposed by Hwang and
Salmon (2004) that eliminates the evidence of “spurious” herding), a sectorial analysis
that is able to detect herding in a specific economic sector that is not showed in the
market as whole and the use of intradaily data to explore the short-term feature of herd
behavior. Also, the potential influence of culture in several financial should be explored,
since there are not currently many studies considering cultural aspects in finance and, as
it is suggested in our study, they have the ability to influence investors’ behavior in
financial markets.
Page 81
73
Furthermore, we showed that Hostede’s dimensions are prone to several
criticisms, so it would be important to have studies that include other cultural
dimensions, for example, the ones of Schwartz (1994) or Project GLOBE (2004).
Our study was undertaken to pose the question if different views, resulting in
different decisions, may be increased because investors have different cultural
background. Thus, we hope that our study helps to motivate future research on the
influence of cultural differences in stock returns, as well as in other financial,
economics and management fields, in order to have a clearer picture about certain
phenomena that occur and cannot be explained by the models currently used.
Page 82
74
References
Aggarwal, R. and Goodell, J. (2009), “Markets and institutions in financial
intermediation: National characteristics as determinants”, Journal of Banking
and Finance, Vol. 33, No. 10, pp. 1770-1780
Anderson, C., Fedenia, M., Hirschey, M. and Skiba, H. (2011), “Cultural influences on
home bias and international diversification”, Journal of Banking and Finance,
Vol. 35, No. 4, pp. 916-934
Arosa, C., Richie, N. and Schuhmann, P. (2014), “The impact of culture on market
timing in capital structure choices”, Research in International Business and
Finance, Vol. 31, pp. 178-192
Avery, C. and Zemsky, P. (1998), “Multidimensional Uncertainty and Herd Behavior n
Financial Markets”, American Economic Review, Vol. 88, No. 4, pp. 724-748
Banerjee, A. (1992), “A Simple Model of Herd Behavior”, The Quarterly Journal of
Economics, Vol. 107, No. 3, pp.797-817
Barber, B. and Odean T. (2001), “Boys Will Be Boys: Gender, Overconfidence and
Common Stock Investment”, Quarterly Journal of Economics, Vol. 116, No. 1,
pp. 261-292
Beckmann, D. and Menkhoff, L. (2008), “Will women be women? Analysing the
gender difference among financial experts”, Kyklos, Vol. 61, No. 3, pp. 364-384
Beckmann, D., Menkhoff, L. and Suto, M. (2008), “Does culture influence asset
managers’ views and behavior?” Journal of Behavior and Organizations, Vol.
67, No. 3-4, pp. 624-643
Belgacem, A. and Lahiani, A. (2013), “Herding Behavior Around US Macroeconomic
Announcements”, Journal of Applied Business Research, Vol. 29, No. 5, pp.
1401-1410
Beugelsdijk, S. and Frijns, B. (2010), “A cultural explannation of the foreign bias in
international asset allocation”, Journal of Banking and Finance, Vol. 34, No. 9,
pp. 2121-2131
Bikhchandani, S., Hirshleifer, D. and Welch, I. (1992), “A Theory of Fads, Fashion,
Custom and Cultural Change as Informational Cascades”, The Journal of
Political Economy, Vol. 100, No. 5, pp. 992-1026
Page 83
75
Bikhchandani, S., and Sharma, S. (2001), “Herd Behavior in Financial Markets”, Staff
Papers, International Monetary Fund, Vol. 47, No. 3,pp.279-310
Blasco, N., Corredor, P. and Ferreruela, S. (2009), “Generadores de comportamiento
imitador en el mercado de valores español”, Revista Española de Financiación y
Contabilidad, Vol. 38, No. 142, pp. 265-291
Blume, L., Easley, D. and O’Hara, M. (1994), “Market statistics and technical analysis:
The role of volume”, Journal of Finance, Vol. 49, No. 1, pp. 153 – 181
Bry, G. and Boschan, C. (1971), Cyclical Analysis of Time Series: Selected Procedures
and Computer Programs, NBER: New York
Butler, K. and Joaquin, D. (2002), “ Are the gains from international portfolio
diversification exaggerated? The influence of downside risk in bear markets”,
Journal of International Money and Finance, Vol. 21, No. 7, pp. 981-1011
Campbell, J., Grossman, S. and Wang, J. (1993), “Trading Volume and Serial
Correlation in Stock Returns”, The Quarterly Journal of Economics, Vol. 108,
No. 4, pp. 905-939
Caparelli, F., D’Arcangelis, A. and Cassuto, A. (2004), “Herding in the Italian Stock
Market: A Case of Behavioral Finance”, Journal of Behavioral Finance, Vol. 5,
No.4, pp.222-230
Chang, E., Cheng, J. and Khorana, A. (2000), “An examination of herd behavior in
equity markets: An international perspective” Journal of Banking and Finance,
Vol. 24, No. 10, pp. 1651-1679
Chang, K. and Noorbakhsh, A. (2009), “Does national culture affect international
corporate cash holdings?”, Journal of multinational financial managment, Vol.
19, No. 5, pp. 323-342
Chauvert, M. and Potter, S. (2000), “Coincident and leading indicators of the stock
market”, Journal of Empirical Finance, Vol. 7, No.1, pp. 87-111
Chiang, T. and Zheng, D. (2010), “An empirical analysis of herd behavior in global
stock markets”, Journal of Banking and Finance, Vol. 34, No. 8, pp. 1911-1921
Chiang, T., Li, J., Tan, L. and Nelling, E. (2011), “Dynamic herding behavior in
Pacific-Basin markets: Evidence and implications”, 3rd EMG Conference on
Emerging Markets Finance, London, UK
Page 84
76
Christie, W. and Huang, R. (1995),”Following the Pied Piper: Do Individual Returns
Herd around the Market?”, Financial Analysts Journal, Vol. 51, No, 4, pp.31-37
Christoffersen, S. and Tang, Y. (2010), “Institutional herding and information cascades:
evidence from daily trades”, Working Paper: McGill University
Chui, A. and C. Kwok (2008), “National Culture and Life Insurance Consumption”,
Journal of International Business Studies, Vol. 39, No. 1, pp. 88-101.
Chui, A., Titman, S. and Wei, J. (2010), “Individualism and Momentum around the
World”, Journal of Finance, Vol. 65, No. 1, pp. 361-392
Cipriani, M. and Guarino, A. (2008), “Herd Behavior and Contagion in Financial
Markets”, The B.E. Journal of Theoretical Economics, Vol. 8, No.1, Article 24
Corsetti, G., Pericoli, M. and Sbracia, M. (2005), “Some contagion, some
interdependence: More pitfalls in tests of financial contagion”, Journal of
International Money and Finance, Vol. 24, No. 8, pp. 1177-1199
Craig, C. and Douglas, S. (2006), “Beyond national culture: Implications of cultural
dynamics for consumer research”, International Marketing Review, Vol. 23, No.
3, pp. 322-342
Datastream Global Equity Indices, User guide, 2008, no. 5, pp. 1-70
De Bondt, W. and Thaler, R. (1985), “ Does the Stock Market Overreact?”, Journal of
Finance, Vol. 40, No. 3, pp. 793-805
De Jong, A., Kabir, R. and Nguyen, T. (2008), “Capital Structure around the World:
The Roles of Firm- and Country-specific Determinants”, Journal of Banking and
Finance, Vol. 32, No. 9, pp. 1954-1969
Demirer, R. and Kutan, A. (2006), “Does herding behavior exist in Chinese stock
markets?”, Journal of International Financial Markets, Institutions and Money,
Vol. 16, No. 2, pp. 123-142
Devenow, A. and Welch, I. (1996), “Rational herding in financial economics”,
European Economic Review, Vol. 40, No. 3-5, pp. 603-615
Di Maggio, P. (1997), “Culture and Cognition”, Annual Review of Sociology, Vol. 23,
pp. 263-287
Economou, F., Kostakis, A. and Philippas, N. (2011), “Cross-country effects in herding
behavior: Evidence from four south European markets”, Journal of International
Financial Markets, Institutions and Money, Vol. 21, No. 3, pp. 443-460
Page 85
77
Effinger, M. and Polborn,M. (2001), “Herding and anti-herding: a model of reputational
differentiation”, European Economic Review, Vol. 45,No. 3, pp. 385-403
Estes, R., and Hosseini, J. (1988), “The gender gap on Wall Street: an empirical
analysis of confidence in investment decision making”, The Journal of
Psychology: Interdisciplinary and Applied , Vol. 122, No. 6, pp. 577-590
Fama, E. (1970), “Efficient capital markets: a review of theory and empirical work”,
The Journal of Finance, Vol. 25, No. 2, pp. 383-417
Fama, E. and French, K. (1995), “Size and Book-to-Market Factors in Earnings and
Returns”, The Journal of Finance, Vol. 50, No. 1, pp. 131-155
Fenzl, T. and Pelzmann, L. (2012), “Psychological and social forces behind aggregate
financial market behavior”, Journal of Behavioral Finance, Vol.13, No. 1,
pp.56-65
Fernandez, D., Carlson, D. Stepina, L. and Nicholson, J. (1997), “Hofstede’s country
classification 25 years later”, The Journal of Social Psychology, Vol. 137, No. 1,
pp. 43-54
Ferris, S., Jayaraman, N. and Sabherwal, S. (2013), “CEO overconfidence and
International Merger and Acquisition Activity”, Journal of Financial and
Quantitative Analysis, Vol. 48, No. 1, pp. 137-164
Forbes, K. and Rigobon, R. (2002), “No Contagion, Only Interdependence: Measuring
Stock Market Comovements”, The Journal of Finance, Vol. 57, No. 5, pp. 2223-
2261
Geert Hofstede’s website: http://www.geerthofstede.nl/dimension-data-matrix (acessed
20th
February 2014)
Goodfellow, C., Bohl, M. and Gebka, B. (2009), “Together we invest? Individual and
institutional investors: Trading behavior in Poland”, International Review of
Financial Analysis, Vol. 18, No. 4, pp. 212-221
Granger, C. and Ding, Z. (1995), “Some properties of Absolute Return: An Alternative
Measure of Risk”, Annales d'Économie et de Statistique, No. 40, pp. 67-91
Greene, W. (2012), Econometric Analysis, Pearson Education Limited
Grinblatt, M., Titman, S. and Wermers, R. (1995), “Momentum Investment
Strategies,Portfolio Performance and Herding: A Study of Mutual Fund
Behavior”, American Economic Review, Vol. 85, No.5, pp. 1088-1105
Page 86
78
Guiso, L., Sapienza, P. and Zingales, L. (2006), “Does Culture Affect Economic
Outcomes?”, Journal of Economic Perspectives, Vol. 20, No. 2, pp. 23-48
Gujarati, D. (2003), Basic Econometrics, New York: McGraw-Hill
Hamilton, B. (2000), “Does Entrepreuneurship Pay? An Empirical Analysis of the
Returns of the Self-Employed”, The Journal of Political Economy, Vol. 108,
No. 3, pp. 604-631
Harris, M. and Raviv, A. (1993), “Differences of Opinion Make a Horse Race”, Review
of Financial Studies, Vol. 6, No. 3, pp. 473-506
Hausman, J. (1978), “Specification Tests in Econometrics”; Econometrica, Vol. 48, pp.
1251-1271
Heine, S., Lehman, D., Markus, H. and Kitayama, S. (1999), “Is There a Universal
Need for Positive Self-Regard?”, Psychological Review, Vol. 106, No. 4, pp.
766-794
Henker, J., Henker T. and Mitsios A. (2006) “Do Investors Herd Intraday in Australian
Equities?” International Journal of Managerial Finance, Vol.2, No. 3, pp.196-
219
Hirshleifer, D. and Thakor, A. (1992), “Managerial conservatism, project choice, and
debt”, Review for Financial Studies, Vol. 5, No. 3, pp-437-470
Hofstede, G. and Bond, M. (1988), “The Confucius connection: from cultural roots to
Economic growth, Organizational Dynamics, Vol. 16, No. 4, pp.5-21
Hofstede, G. (1991), Culturas e Organizações: Compreender a nossa programação
mental, Lisboa: Edições Sílabo, Lda
Hofstede, G. (2001), Culture’s consequences: comparing values, behaviors, institutions
and organizations across nations, New York: Sage publications
Hofstede, G. (2011), “Dimensionalizing cultures: The Hofstede model in context”,
Online readings in psychology and culture, http://dx.doi.org/10.9707/2307-
0919.1014, (accessed 28th
December 2013)
Hong, H., Kubik, J. and Stein, J. (2004), “Social Interaction and Stock market
Participation”, Journal of Finance, Vol. 59, No. 1, pp. 137-163
Hong, H., Kubik, J. and Stein, J. (2005), “Thy Neighbor’s Portfolio: Word-of-Mouth
Effects in the Holdings and Trades of Money Managers”, Journal of Finance,
Vol. 60, No.1 , pp. 2801-2824
Page 87
79
Hott, C. (2012), “The influence of herding behavior on house prices”, Journal of
European Real Estate Research, Vol. 5, No. 3, pp. 177-198
House, R., Hanges, P., Javidan, M. Dorfman, P. and Gupta, V. (2004), Culture,
Leadership and Organizations: The GLOBE study of 62 societies, Thousand
Oaks: SAGE
Hsiao, C. (2006), “Panel Data Analysis – Advantages and Challenges”, Working Paper:
Institute of Economic Policy Research
Hsu, S., Woodside, A. and Marshall, R. (2013), “Critical Tests of Multiple Theories of
Culture’s Consequences: Comparing the Usefulness of Models by Hofstede,
Inglehart and Baker, Schwartz, Steenkamp, as well as GDP and Distance for
Explaining Overseas Tourism Behavior, Journal of Travel Research, Vol. 52,
No. 6, pp. 679-704
Hwang, S. and Salmon, M. (2004), "Market Stress and Herding", Journal of Empirical
Finance, Vol. 11, No. 4, pp.585-616
Inglehart, R. (1997), Modernization and postmodernization: cultural, economic and
political change in 43 societies, Princeton: Princeton University Press
Inkeles, A. and Levinson, D. (1969) “National character: The study of modal
personality and sociocultural systems”, in Lindzey, G.and Aronson, E. (Eds.),
The Handbook of Social Psychology IV, pp. 418-506. New York: McGraw-Hill
Jegadeesh, N. and Titman, S. (1993), “Returns to Buying Winners and Selling Losers:
Implications for Stock Market Efficiency”, Journal of Finance, Vol. 48, No. 1,
pp. 65-91
Jegadeesh, N. and Titman, S. (2001), “Profitability of Momentum Strategies: An
Evaluation of Alternative Explanations”, Journal of Finance, Vol. 61, No. 2, pp.
699-720
Kaur, M., Yadav, S. and Gautam, V. (2013), “Financial System Development and
Foreign Direct Investment: A Panel Data Study for BRIC Countries”, Global
Business Review, Vol. 14, No. 4, pp. 729-742
Khan, H., Hassairi, S. and Viviani, J. (2011), “Herd Behavior and Market Stress: The
Case of Four European Countries”, International Business Reasearch, Vol. 4,
No. 3, pp. 53-67
Page 88
80
Kallinterakis, V. and Ferreira, M. (2006), “Herding and Positive Feedback Trading in
the Portuguese Stock Exchange: An Exploratory Investigation”, Unpublished
paper presented at 4th
Edition The Portuguese Financial Network (PFN)
Conference, Porto, Portugal
Kallinterakis, V., Munir, N. and Radovic-Markovic, M. (2010), “Herd Behavior,
Illiquidity and Extreme Market States: Evidence from Banja Luka”, Journal of
Emerging Market Finance, Vol. 9, No. 3, pp. 305-324
Keynes, J.M. (1936), The General Theory of Employment, Interest and Money, London:
Macmillan
Kim, W. and Wei, S. (2002), “Foreign portfolio investors before and during a crisis”,
Journal of International Economics, Vol. 56, No. 1, pp. 77-96
Kirkman, B., Lowe, K. and Gibson, C. (2006), “A quarter century of Culture’s
Consequences: a review of empirical research incorporating Hofstede’s cultural
values framework”, Journal of International Business Studies, Vol. 37, No. 3,
pp. 285-320
Kwok, C., and Tadesse, S. (2006), “National culture and financial systems”, Journal of
International Business Studies, Vol. 37, pp. 227-247
La Porta, R., Lopez-de-Silanes, F., Shleifer, A. and Vishny, R. (1997), “Legal
Determinants of External Finance”, Journal of Finance, Vol. 52, No. 3, pp.
1131-1150
Lakonishok, J., Shleifer, A. and Vishny, R. (1992), “The impact of institutional trading
on stock prices”, Journal of Financial Economics, Vol. 32, No. 1, pp. 23-43
Lakonishok, J, Shleifer, A. and Vishny, W. (1994), “Contrarian investment,
extrapolation and risk”, Journal of Finance, Vol. 49, No.5, pp. 1541-1578
Lee, C. and Swaminathan, B. (2000), “Price Momentum and Trading Volume”, Journal
of Finance, Vol. 55, No. 5, pp. 2017-2069
Li, K., Griffin, D, Yue, H. and Zhao, L. (2013), “How does culture influence corporate
risk-taking?”, Journal of Corporate Finance, Vol. 23, pp. 1-22
Lindhe, E. (2012), “Herd Behavior in Stock Markets: A Nordic Study”, Master Thesis
in Economics, Lunds Universitet
Page 89
81
Lobão, J. and Serra, A. (2006), “Herding Behavior: Evidence from Portuguese Mutual
Funds”, in Greg N. Gregoriou (ed.), Diversification and Portfolio Management
of Mutual Funds, pp. 167–197. Palgrave-MacMillan
Lobão, J. (2013), O factor humano na decisão empresarial, Conjuntura Actual Editora
Lynn, M. and Gelb, B. (1996), “Identifying innovative national markets for technical
consumer goods”, International Marketing Review, Vol. 13, No. 6, pp. 43-57
Manganaro, A. and Von Martens, D. (2007), “Herding Behavior in the Swedish Mutual
Fund Industry”, Master Thesis in Finance, Stockholm School of Economics
Markowitz, H. (1952), “Portfolio Selection”, The Journal of Finance, Vol. 7, No.1, pp.
77-91
Markus, H. and Kitayama, S. (1991), “Culture and the self: Implications for cognition,
emotion and motivation”, Psychological review, Vol. 98, No. 2, pp. 224-253
McDonagh, E.. (1999), “Assimilated leaders”, Harvard International Review, Vol. 21,
No. 4, pp. 64-69
McSweeney, B. (2002), “Hofstede’s model of national cultural differences and their
consequences: A triumph of faith – a failure of analysis”, Human Relations, Vol.
55, No. 1, pp. 89-118
Merrit, A. (2000), “Culture in the Cockpit: Do Hofstede’s Dimensions Replicate?”,
Journal of Cross-Cultural Psychology, Vol. 31, No. 3, pp. 283-301
Mihet, R. (2012), “Effects of Culture on Firm Risk-Taking: A Cross-Country and
Cross-Industry Analysis”, IMF Working Papers
Mohacsy, I. and Lefer, H. (2007), “Money and Sentiment: A Psychodynamic Approach
to Behavioral Finance, Journal of American Academy of Psychoanalysis, Vol.
35, No. 3, pp. 455-475
Nofsinger, J. and Sias, R. (1999), “Herding and Feedback Trading by Institutional and
Individual investors”, The Journal of Finance, Vol. 54, No. 6, pp. 2263-2295
Ng, S., Lee, A. and Soutar, G. (2007), “Are Hofstede’s and Schwartz’s Frameworks
congruent?”, International Marketing Review, Vol. 24, No. 2, pp. 164-180
Nguyen, N. and Truong, C. (2013), “The information content of stock markets around
the world: A cultural explanation”, Journal of International Financial Markets,
Institutions and Money, Vol. 26, pp. 1-29
Page 90
82
O’Brien, R. (2007), “A caution regarding rules of thumb for Variance Inflation Factor”,
Quality and Quantity, Vol. 41, pp. 673-690
Ohlson, P. (2010); “Herd Behavior in the Swedish Stock Exchange”, Master Thesis in
Finance, Jönköping International Business School
Orléan, A. (1995), “Bayesian interactions and collective dynamics of opinion”, Journal
of Economic Behavior and Organisation, Vol. 28, pp. 257-274
Pagan, A. and Sossounov, K. (2003), “A simple framework for analysing bull and bear
markets”, Journal of Applied Econometrics, Vol. 18, No.1, pp. 23-46
Palomino, F. (1996), “Noise trading in small Markets”, Journal of Finance, Vol. 51,
No. 4, pp. 1537-1550
Park, S. and Lemaire, J. (2011), “Culture Matters: Long-Term Orientation and the
Demand for Life Insurance”, Asia-Pacific Journal of Risk and Insurance, Vol. 5,
No. 2, pp. 2153-3792
Patro, A. and Kanagaraj, A. (2012), “Exploring The Herding Behavior in Indian Mutual
Funds Industry, Asian Journal of Finance and Accounting, Vol. 4, No. 1, pp.
189-204
Power, M. and Ansic, D. (1997), “Gender differences in risk behavior in financial
decision-making: An experimental analysis”, Journal of Economic Psychology,
Vol. 18, No. 6, pp. 605-628
Radalj, M. and McAleer, M. (1993). “Herding, information cascades and volatility
spillovers in futures markets,” Working Paper, University of Western Australia,
Perth
Ralston, D., Egri, C., Steward, S., Terpstra, R. and Yu, K. (1999), “Doing business in
the 21st Century with the New Generation of Chinese Managers: A Study of
Generational Shifts in Work Values in China”; Journal of International Business
Studies, Vol. 30, No. 2, pp. 415-428
Reuter, C. (2011), “A survey of culture and finance”, Finance, Vol. 32, No. 1, pp. 75-
152
Rouwenhorst, G. (1998), “International momentum startegies”; Journal of Finance,
Vol. 53, No.1 , pp. 267-284
Scharfstein, D. and Stein, J. (1990), “Herd behavior and investment”, American
Economic Review, Vol. 80, No. 3, pp. 465-479
Page 91
83
Schmeling, M. (2009), “Investor sentiment and stock returns: Some international
evidence”, Journal of Empirical Finance, Vol. 16, No, 3, pp. 394-408
Schwartz, S. (1994), “Beyond individualism-collectivism: new dimensions of values”.
In: Kim, U., Triandis, H., Kagitcibasi, C., Choi, S. and Yoon, G.(Eds),
“Individualism and Collectivism: Theory, Method and Application”, Sage,
Newbury Park, CA
Serra, A. and Barros, A. (2011), “Comportamento dos fundos de acções nas revisões do
PSI-20”, Cadernos do Mercado de Valores Mobiliários, Nº38
Siller, R. and Pound, J. (1989), “ Survey evidence on diffusion of interest and
information among investors”, Journal of Economic Behavior and Organization,
Vol. 12, No. 1, pp. 47-66
Shiller, R. (2005), Irrational Exuberance, New York: Broadway Books
Sinke, J. (2012), “Investor Sentiment and Stock Returns: A Cultural and International
View”, Master Thesis in Finance, Tilburg University
Sias, R. (2004), “Institutional Herding”, Review of Financial Studies, Vol. 17, No. 1, pp.
165-206
Sivakumar, K. and Nakata, C. (2001), “The Stampede toward Hofstede’s Framework:
Avoiding the Sample Design Pit in Cross-Cultural Research”, Journal of
International Business Studies, Vol. 32, No.3, pp. 555-574
Soares, A., Farhangmehr, M. and Shoham, A. (2007), “Hofstede’s dimensions of culture
in international marketing studies”, Journal of Business Research, Vol. 60, pp.
277-284
Steenkamp, J. (2001), “The role of national culture in international marketing research”,
International Marketing Review, Vol. 18, No. 1, pp. 30-44
Stulz, R. and Williamson, R. (2003), “Culture, Openess and Finance”, Journal of
Financial Economics, Vol. 70, No. 3, pp. 313-349
Suominem, M. (2001), “Trading volume and information revelation in stock markets”,
Journal of Financial and Quantitative Analysis, Vol. 36, No. 4, pp. 545–565
Tan, L., Chiang, T., Mason, J. and Nelling, E. (2008), “Herding behavior in Chinese
stock markets: An examination of A and B shares”, Pacific-Basin Finance
Journal, Vol. 16, No. 1-2, pp. 61–77
Page 92
84
Tang, L. and Koveos, P. (2008), “A framework to update Hofstede’s cultural value
indices: economic dynamics and institutional stability”, Journal of International
Business Studies, Vol. 39, No. 1, pp. 1045-1063
Tessaromatis, N. And Thomas, V. (2009), “Herding Behavior in the Athens Stock
Exchange”, Investment Managment and Financial Innovation, Vol.6, No.3, pp.
156-164
Tversky, A. and Kahneman, D. (1986), “Rational Choice and the Framing of
Decisions”, The Journal of Business, Vol. 59, No. 4, pp. S251-S278
Wang, A. (1998), “Strategic trading, asymmetric information and heterogeneous prior
beliefs”, Journal of Financial Markets, Vol. 1, No. 3-4, pp. 321-352
Welch, I. (1992), “Sequential Sales, Learning and Cascades”, The Journal of Finance,
Vol. 47, No. 2, pp. 695-732
Wermers, R. (1999), “Mutual Fund Herding and the Impact on Stock Prices”, Journal of
Finance, Vol. 54, No. 2, pp. 581-622
World Bank Database: http://data.worldbank.org/ (accessed 10th
April 2014)
Yao, R. and Hanna, S. (2005), “The effects of gender and marital status on financial risk
tolerance, Journal of Personal Finance, Vol. 4, No. 1, pp. 66-85
Xu, Y.(2006), “Examing the herding behavior in Chinese Stock Market”, Master Thesis
in Finance and Investment, University of Nottingham, UK
Page 93
85
Appendix:
1.1. Fixed and Random Effects
Panel data or longitudinal data is a data set that combines time series and cross-
sections, allowing an analysis that captures the heterogeneity across individuals, firms
or countries, and the dynamic effects invisible in cross-sections.
According to Hsiao (2006), a panel data analysis offers a set of advantages over
time series or cross-section data, namely the accuracy regarding inference of model
parameters. The author suggested that a panel data provides a larger number of
observations (increasing the degrees of freedom) and contains less multicollinearity,
which improves the efficiency of econometric estimates. Also, he argued that this data
set has a higher capacity for capturing the complexity of human behavior, because it is
possible to construct and test more complicated behavioral hypothesis and the impact of
omitted variables is controlled.
The general model of panel data is presented as follows:
yit = xitβ + ci + uit , t = 1,2,..,T; i = 1,2,...,n
where t is the time period and i represents different individuals.
yit is the independent variable, xit is a 1xK vector containing the explanatory
variables, β is a 1xK vector of parameters to be estimated, ci is the unobserved
heterogeneity and ui are the random errors.
A panel data is called balanced, when for each individual we have the same
number of time periods, and is called unbalanced, when we do not have the same time
period for all the individuals. Although there is a distinction between them, the
estimation methods are the same regardless of the model is with balanced or unbalanced
data (Greene, 2012).
Fixed and Random effects models:
In panel data models, the question we have to have in mind is whether ci is
correlated or not with xit, because that is the answer we need to know if we should use
fixed effects or random effects when estimating our model. If Cov (xit, ci) = 0 for t =
1,2,...,T, then ci is assumed to be uncorrelated with the explanatory variables and is
referred as an individual random effect. Otherwise, if Cov (xit, ci) ≠ 0 for t = 1,2,...,T,
Page 94
86
then ci is assumed to be correlated with the explanatory variables and is reffered as a
fixed effect.
To detect the appropriate model to use, Hausman (1978) provided a test where
the null and alternative hypothesis are the following, respectively:
H0: Cov (xit, ci) = 0 (random effects)
H1: Cov (xit, ci) ≠ 0 (fixed effects)
Therefore, he suggested the use of the following statistic to test fixed effects vs.
random effects specification:
H = (̂FE - ̂RE)’ [VFE - VRE]-1 (̂FE - ̂RE) ~ χ2,
where ^
FE and ^ RE are the estimators’ vector of the model with fixed effects and
random effects, respectively; and VFE and VRE are the asymptotic covariance matrix of
the model with fixed effects and random effects, respectively.
The Hausman Test is presented in Table 9, below.
Table 9 – Hasuman Test
Page 95
87
1.2. Results
Table 10 – Period Weight (PCSE)
Page 96
88
Table 11 – White Period
Page 97
89
Table 12 – Pre-crisis period
Page 98
90
Table 13 – Crisis period
Page 99
91
Table 14 – Correlation Matrix
Table 14 – Ridge Regression
We perform the ridge regression to see if the variables are strongly correlated to
each other, since in panel data a major problem that may emerge is multicollinearity.
So, to examine the issue of multicollinearity in the independent variables we compute
Page 100
92
the variance inflation factor (VIF). According to Kaur et al. (2013), VIF are considered
bad if they exceed 5 and, on the other hand, O’Brien (2007) considered this limit to be
10. Since the higher number we have for VIF is 5,133 (GDPpc), we do not consider to
have a problem of multicollinearity.
1.3. Time series analysis
Here we perform a time series analysis for each country, applying the measure
of Chang et al. (2000) to detect herding. We also performed the same test using the
measure from Christie and Huang (1995) but found out that there was no evidence of
herding for any of the countries. This may be related to the limitation that we presented
before, that this measure only captures herding in extreme market situations, but the
behavior can exist during quiet periods as well.
Argentina
Australia
Page 101
93
Austria
Belgium
Brazil
Page 102
94
Canada
Chile
Denmark
Page 103
95
Finland
France
Germany
Page 104
96
Greece
Hong Kong
Hungary
Page 105
97
India
Indonesia
Ireland
Page 106
98
Israel
Italy
Japan
Page 107
99
Korea
Malaysia
Mexico
Page 108
100
Netherlands
New Zealand
Norway
Page 109
101
Pakistan
Peru
Philippines
Page 110
102
Portugal
Romania
Singapore
Page 111
103
Spain
Sweden
Switzerland
Page 112
104
Thailand
Turkey
Page 113
105
UK
USA
1.3.1. Pre-crisis, crisis and Euro crisis
Here, we perfom a test to see if there are differences between the pre-crisis
(1/1/2001) and crisis (15/9/2008) period in the time series analysis performed before.
Also, we test if a country that observes a higher level of herding, has the intensity of this
behavior amplified with the beginning of the Euro debt crisis (2/5/2010).
On the left is shown the pre-crisis period, while on the right is the crisis period.
If a country has more herding during the crisis, at the bottom there is the analysis of
euro crisis (on the left is before euro crisis and on the right during euro crisis).
Page 114
106
ARGENTINA
AUSTRALIA
AUSTRIA
Page 115
107
BELGIUM
BRAZIL
CANADA
Page 116
108
CHILE
DENMARK
Page 117
109
FINLAND
FRANCE
GERMANY
Page 118
110
GREECE
HONG KONG
HUNGARY
Page 119
111
INDIA
INDONESIA
Page 120
112
IRELAND
ISRAEL
ITALY
Page 121
113
JAPAN
KOREA
MALAYSIA
Page 122
114
MEXICO
NETHERLANDS
NEW ZEALAND
Page 123
115
NORWAY
PAKISTAN
Page 124
116
PERU
PHILIPPINES
Page 125
117
PORTUGAL
ROMANIA
Page 126
118
SINGAPORE
SPAIN
Page 127
119
SWEDEN
SWITZERLAND
THAILAND
Page 128
120
TURKEY
UK
USA