Expanding Horizons in the Validation of GMO Analytical Methods: Fuzzy-based Expert Systems Gianni Bellocchi & Marco Acutis & Claudia Paoletti & Roberto Confalonieri & Patrizia Trevisiol & Emanuele Grazioli & Chrystele Delobel & Cristian Savini & Marco Mazzara & Guy Van den Eede Received: 20 December 2007 / Accepted: 5 February 2008 # Springer Science + Business Media, LLC 2008 Abstract Validation is the process establishing the suitability of an analytical method for a particular purpose. Various guidelines defining statistical procedures for validation of chemical, bio-chemical, pharmaceutical, and molecular methods have been developed, and ad hoc validation metrics (indices and test statistics) are available and routinely used, for in-house and interlaboratory testing and decision making. However, there is no universally accepted practice for assay validation, and often, subjectivity plays an important role in the interpretation of validation studies’ results. Instead, the key to rational validation studies relies upon the formalization and harmonization of procedures for their design and interpretation of results. Fuzzy-based techniques can be helpful in such respect. Fuzzy logic allows summarizing the information obtained by classic independent validation statistics into one synthetic index of overall method performance. The possibility of having a comprehensive indicator of method performance has the advantage of permitting direct method comparison, facilitating the evaluation of many individual, possibly contra- dictory metrics. The objectives of this paper are to illustrate the advantages that a fuzzy-based aggregation method could bring into the validation of analytical methods and to propose its application for the evaluation of methods’ performance. Validation metrics are compared for practical examples of assessment of method performance in collaborative studies. Fuzzy logic-based rules are shown to be applicable to improve insights into method quality and interpretation of results. Keywords Fuzzy Logic . Genetically Modified Organisms (GMO) . Method Validation . Performance Indicator . Ring Trial Introduction There is a continuous and increasing need for reliable analytical methods to assess compliance with national and international requirements in all areas of analysis (Thompson and Wood 1993, 1995; Horwitz 1995; Thompson et al. 1999). The reliability of a method is determined by some form of validation, i.e., the procedure providing evidence of suitability of an analytical method for its intended purpose (Balls and Fentem 1997; Green 1996). Based on the results of a validation study, a method is considered or not as fit for the intended purposes. In most cases, formal validation requires the assessment of the performance of the proposed method by means of an interlaboratory study (but alternatives are possible; Thompson Food Anal. Methods DOI 10.1007/s12161-008-9021-8 G. Bellocchi (*) : E. Grazioli : C. Delobel : C. Savini : M. Mazzara : G. Van den Eede Institute for Health and Consumer Protection, Biotechnology and GMOs Unit, European Commission Directorate General Joint Research Centre, via E. Fermi 2749, 21027 Ispra, VA, Italy e-mail: [email protected]M. Acutis : P. Trevisiol Department of Crop Science, University of Milan, via Celoria 2, 20133 Milan, Italy C. Paoletti GMO Unit, European Food Safety Authority, largo N. Palli 5/A, 43100 Parma, Italy R. Confalonieri Institute for the Protection and Security of the Citizen, Agriculture and Fisheries Unit, European Commission Directorate General Joint Research Centre, via E. Fermi 2749, 21027 Ispra, VA, Italy
Transcript
Expanding Horizons in the Validation of GMO AnalyticalMethods: Fuzzy-based Expert Systems
Gianni Bellocchi & Marco Acutis & Claudia Paoletti &Roberto Confalonieri & Patrizia Trevisiol &Emanuele Grazioli & Chrystele Delobel &Cristian Savini & Marco Mazzara & Guy Van den Eede
Received: 20 December 2007 /Accepted: 5 February 2008# Springer Science + Business Media, LLC 2008
Abstract Validation is the process establishing the suitabilityof an analytical method for a particular purpose. Variousguidelines defining statistical procedures for validation ofchemical, bio-chemical, pharmaceutical, and molecularmethods have been developed, and ad hoc validation metrics(indices and test statistics) are available and routinely used, forin-house and interlaboratory testing and decision making.However, there is no universally accepted practice for assayvalidation, and often, subjectivity plays an important role in theinterpretation of validation studies’ results. Instead, the key torational validation studies relies upon the formalization andharmonization of procedures for their design and interpretationof results. Fuzzy-based techniques can be helpful in such
respect. Fuzzy logic allows summarizing the informationobtained by classic independent validation statistics into onesynthetic index of overall method performance. The possibilityof having a comprehensive indicator of method performancehas the advantage of permitting direct method comparison,facilitating the evaluation of many individual, possibly contra-dictory metrics. The objectives of this paper are to illustrate theadvantages that a fuzzy-based aggregation method could bringinto the validation of analytical methods and to propose itsapplication for the evaluation of methods’ performance.Validation metrics are compared for practical examples ofassessment of method performance in collaborative studies.Fuzzy logic-based rules are shown to be applicable to improveinsights into method quality and interpretation of results.
Keywords Fuzzy Logic .
Genetically Modified Organisms (GMO) .
Method Validation . Performance Indicator . Ring Trial
Introduction
There is a continuous and increasing need for reliableanalytical methods to assess compliance with national andinternational requirements in all areas of analysis (Thompsonand Wood 1993, 1995; Horwitz 1995; Thompson et al.1999). The reliability of a method is determined by someform of validation, i.e., the procedure providing evidence ofsuitability of an analytical method for its intended purpose(Balls and Fentem 1997; Green 1996). Based on the resultsof a validation study, a method is considered or not as fit forthe intended purposes.
In most cases, formal validation requires the assessmentof the performance of the proposed method by means of aninterlaboratory study (but alternatives are possible; Thompson
Food Anal. MethodsDOI 10.1007/s12161-008-9021-8
G. Bellocchi (*) : E. Grazioli :C. Delobel : C. Savini :M. Mazzara :G. Van den EedeInstitute for Health and Consumer Protection,Biotechnology and GMOs Unit, European CommissionDirectorate General Joint Research Centre,via E. Fermi 2749,21027 Ispra, VA, Italye-mail: [email protected]
M. Acutis : P. TrevisiolDepartment of Crop Science, University of Milan,via Celoria 2,20133 Milan, Italy
C. PaolettiGMO Unit, European Food Safety Authority,largo N. Palli 5/A,43100 Parma, Italy
R. ConfalonieriInstitute for the Protection and Security of the Citizen,Agriculture and Fisheries Unit, European Commission DirectorateGeneral Joint Research Centre,via E. Fermi 2749,21027 Ispra, VA, Italy
et al. 2002), also known as collaborative study or ring trial.Many national and international protocols defining criteriafor the organization of these collaborative studies andinterpretation of their results are available and routinelyadopted. The International Standard Organization (ISO 57251994) and the International Union for Pure and AppliedChemistry (IUPAC 1988, 1995) provide comprehensivestandards describing statistical procedures to assess analyticalmethods performance. The World Health Organization (WHO1980) provides a detailed description regarding acceptance/rejection criteria for immunoassay kits and other protein-binding systems. The Association of Official AnalyticalChemists International (AOAC International, http://www.aoac.org) is a recognized worldwide authority on methodvalidation and quality analytical measurements. In the area offood quality and safety, the Codex Alimentarius Commission(FAO–WHO 2005) requires the availability of specificperformance information to include a method in the Codexcommodity standard. Guidelines for the evaluation of methodsof analysis of genetically modified organisms are madeavailable by the European Network of GMO Laboratories(ENGL, through the website of the Community ReferenceLaboratory for GM Food and Feed of the EuropeanCommission, http://gmo-crl.jrc.it). In pharmacopoeia, theInternational Conference on Harmonisation (ICH 1995,1997) and the US Pharmacopoeia (USP) documents (USP2003) are basic guidance for validation studies.
According to available internationally standardized pro-cedures, of which the examples mentioned above are only anextract, formal validation studies should provide detailedinformation regarding the conditions of method’s applicabil-ity and estimates for a series of validation measures, bothnecessary to assess overall method performance.
The objectives of this paper are first to provide a criticalreview of the interpretive results coming out of analyticalmethods validation studies and, second, to propose a newprocedure to summarize the information provided byindividual validation indices and test statistics into com-prehensive indicators of method performance. Through theapplication of fuzzy logic (Hall and Kandel 1991), wepropose aggregated indicators as suitable tools for globalevaluation of analytical methods, allowing also objectivecomparison across different methods.
In agreement with international guidelines and protocols(ISO 5725 1994; IUPAC 1988, 1995; WHO 1980; FAO–
WHO 2005; ICH 1995, 1997; USP 2003; ISO 2007), acollection of test statistics (values derived from sampleinformation with an associated probability, like the Student’st or Fisher’s F statistic) and numerical indices (quantities thatrepresent some properties of sampled data, e.g., departurefrom expected values), from hereafter “validation metrics,”are routinely used to assess methods’ performance. Datacheck is commonly used to verify features such as normalityof distributions, homogeneity of variances, and presence ofanomalous data (stragglers, outliers). Some statistical tests(e.g., analysis of variance, linear regression analysis) arenormally applied when one or more factors (or one or moreregressors) are expected to affect the analytical response.Instead, validation indices are used to provide informationregarding a series of features that are internationallyrecognized as crucial for the overall evaluation of anyanalytical method performance, e.g., trueness, precision,specificity, detection limit, quantification limit, linearity,and range. A brief description of the most relevant onesfollows, provided that an abundance of detailed documentationexists (ISO 5725 1994; WHO 1980; ISO 2007).
Trueness is defined as the departure of the average resultof a method from a reference value. Precision is defined asthe closeness of agreement between independent resultsobtained under stipulated conditions (i.e., precision) that isalso evaluated and expressed in terms of standard deviation(or derived measures). Depending upon which factors(laboratory, analyst, instrument, time frame) are consideredas possible sources of variation, three types of precision canbe estimated: repeatability (all the factors are held constant),which provides information on the minimum variationintrinsic in a method, intermediate precision (one or moreof the factors analyst, instrument, or time frame are kept notconstant), and reproducibility (the factor laboratory is alsonot kept constant), which provides information on themaximum variation that can be expected for a method. Anassessment of methods by analyzing quantitatively theeffects of deliberate and known variations in the operatingconditions is known as robustness (or ruggedness).Quantification limit is defined as the smallest measuredcontent above which a determination of the analyte ispossible. In general, the limit of quantification of amethod is associated with its limit of detection: thelowest concentration of analyte that can be detected butnot necessarily quantified, by the analytical method.Linearity is defined as a method that is required to elicitresults that are directly equal to or, by some mathematicaltransformation, proportional to the analyte concentrationwithin a given range of application of the method. This isassessed via statistical analysis on correlation coefficient,y-intercept, slope, mean square error, and lack of fit.Finally, specificity is the capacity of a method to respondexclusively to the analyte of interest.
A full validation study requires an extensive collaborativestudy to obtain the necessary data to assess the performanceof a method and its transferability among laboratories.However, according to Muire-Sluis (2004), analysts oftenpoint out that “validated methods may not be valid.” Thequestion often arises: What exactly makes a validatedmethod valid? According to the Center for BiologicsEvaluation and Research (CBER 2000), “the acceptabilityof analytical data corresponds directly to the criteria used tovalidate the method.” This is a challenging issue becauseonce a method is validated and estimates of the variousvalidation metrics are available, it is then up to the analystto define an acceptance criterion on the basis of priorknowledge of the measurements as well as its intendedapplication. For example, if an acceptance criterion forprecision is a repeatability relative standard deviation(RSDr) of 30%, all the methods showing RSDr lower thanor equal to this threshold are acceptable. The acceptancecriterion of a given validation statistic may not be easilydefined by one threshold only, whereas two thresholdsdelimiting a “fuzzy” area may be more suitable. As anexample, the first threshold for variability measures such asrepeatability (within laboratory) or reproducibility (amonglaboratories) is the upper limit beyond which the methodresponse is considered unacceptable; the second thresholdis the lower limit below which the method is unquestion-ably good. Given the variability inherent to most laboratoryinstrument systems, the question whether a validationstatistic is “good” or “bad” can be difficult to answer. Insome cases, intuition, experience, and knowledge of thepractical context of the analytical data can be used toinspect or “eyeball” the data to assess a validation response.Most analysts would agree that very small or very largevalues of a validation metric determine a clear acceptance/rejection judgment. This issue was exemplified as follows(Limentani et al. 2005): A difference of 100% in ameasurement typically exhibiting a precision of 1% is a realdifference, and a difference of 0.01% is irrelevant for thesame measurement. However, less clear-cut cases, which arevery common in real-life situations, may be much moreproblematic for objective judgment and decision making.Another difficulty is linked to the fact that in some instances,a method’s reliability is assessed by means of one or a fewmetrics, whether in other cases a more in-depth validationstudy may be required. When multiple metrics are used toassess methods’ performance (which is the most commoncase), organizing the data, processing the results, and usingthem for an overall judgment might not be a trivial issue. Insummary, validation studies as currently carried out have anintrinsic subjectivity linked to the interpretation of thevarious metrics used, which are difficult to manage unless
specific procedures improving objectiveness are introducedand adopted.
Fuzzy-based Expert Systems: A Novel Approach
Each feature assessed via method validation (e.g., trueness,repeatability, and reproducibility) allows only a partial insightinto the assessment of the overall method performance. Toprovide a solid and comprehensive quality judgment of ananalytical method, the simultaneous joint evaluation of all themetrics is necessary. This is especially relevant when eithersome metrics are contradictory, that is, when the performanceof a method is satisfactory with respect to some features butnot with respect to others. In this respect, combining multiplemetrics into aggregated measures is useful to achieve acomprehensive assessment of the method’s response, toevaluate its performance under a variety of conditions(robustness/ruggedness testing), and to select the best methodamong several available with respect to specific needs.
Despite the potential advantages, up to date, there is noclear objective strategy to combine results from differentmetrics without being strongly affected by subjectivity.Indeed, personal preferences and specific needs mayinfluence the interpretation of validation studies’ results.A strategy to improve objectivity is to weigh the differentmetrics according to the intended use of the analyticalprocedure and to summarize the information via aggrega-tion of the weighted metrics. However, the strategy toaggregate them cannot merely rely upon summation,multiplication, or a combination of both (Keeney andRaiffa 1993). An effective approach to aggregate basicstatistics can rely, instead, in setting up a fuzzy expertsystem using decision rules (Hall and Kandel 1991). Thistechnique is robust on uncertain and imprecise data such assubjective judgments and allows the aggregation ofdissimilar metrics in a consistent and reproducible way(Bouchon-Meunier 1995). For these reasons, here, wepropose to summarize all the information collected duringthe validation study (independent metrics) via fuzzy logic,following a fully described methodology (Bellocchi et al.2002). Fuzzy logic is derived from fuzzy group theory,dealing with reasoning that is approximate rather thanprecisely deduced from classical or “crisp” logic (Klir et al.1997). Fuzzy logic uses predicates such as “good”–“bad,”“high”–“low,” or similar. Attaching a quality judgment toanalytical methods, such as “accurate’–“inaccurate” or“precise”–“imprecise,” follows as a consequence of valida-tion (Holden et al. 2005). According to “crisp” groupassumption, an element can only be in a group or not: If, forinstance, a subgroup consists of the methods with at least30% of precision (maximum acceptable standard deviationover the mean), a particular method can be classified as amember or not of the subgroup. If, however, a method is
Food Anal. Methods
defined to be the subgroup of “precise” methods, then it ismore difficult to determine if a specific method is in thesubgroup. If one decides that only methods with aminimum precision of RSDr=30% are in the subgroup,then a method with RSDr=30.1% cannot easily beclassified as “imprecise” even though it is “almostimprecise.” The use of the fuzzy group theory is compellingbecause available threshold values for precision and otherrelevant validation metrics are often vague and/or uncertain.Thus, classification based on an abrupt transition betweengroups is doubtful. The fuzzy group theory addresses thistype of problem by allowing one to define the “degree ofmembership” of an element in a group by means of amembership function. For “crisp” groups, the membershipfunction only takes two values: 0 (nonmembership) and 1(membership). In fuzzy groups, the membership functioncan take any value from the interval [0, 1]. The value 0represents complete nonmembership, the value 1 representscomplete membership, and values in between (transitioninterval) are used to represent partial membership.
Materials and Methods
For this study, the data from the validation carried out ontwo analytical methods for genetic modification (GM)detection, TC1507 (Mazzara et al. 2005) and DAS59122(Mazzara et al. 2006; simplified as 59122 hereafter), wereused. The validation was performed by an interlaboratorystudy under coordination of the European CommissionCommunity Reference Laboratory for Genetically ModifiedFood and Feed (CRL-GMFF, Ispra, Italy). These studiescomplied with European requirements for authorization ofGM food or feed product (Regulation (EC) no. 1829/20032003 and Regulation (EC) no. 641/2004 2004), and theoutcome of the validation trials fulfilled the methodperformance requirements established by the ENGL. There-fore, the two event-specific quantitative detection methodswere declared fit for the purpose of regulatory compliance(http://gmo-crl.jrc.it/summaries/TC1507-report_mm.pdf,http://gmo-crl.jrc.it/summaries/59122_val_report.pdf). Afuzzy logic-based indicator was developed for the purposeof evaluating both methods when used to quantify differentconcentrations (levels) of the GM analyte. For the fuzzyindicator, the values computed on each level were averagedto attach a synthetic judgment to the method results.
Experimental Design
Participating laboratories were provided with the method,materials, and reagents necessary to perform the validation
study of the event-specific method for the quantification ofGM maize line TC1507 (Mazzara et al. 2005) and of theevent-specific method for the quantification of GM maizeline 59122 (Mazzara et al. 2006).
The deoxyribonucleic acid (DNA) control sample submittedby the applicant and method developer (Pioneer Hi-bredInternational) at 100% GM (TC1507 and 59122) and DNAfrom a conventional variety were mixed to prepare standardand blind samples at different GM percentages (from 0% to5%; Mazzara et al. 2005, 2006).
For the validation of the event-specific method for thequantification of TC1507, 12 unknown samples, representingsix GM levels, were used in the validation study. On eachpolymerase chain reaction (PCR) plate, six samples wereanalyzed in parallel with both the TC1507- and hmg-specificsystem (Krech 1999). Two plates in total were run, with tworeplicates for each GM level analyzed on the same run. Eachsample was analyzed in three PCR repetitions, i.e., loaded inthree parallel plate wells.
For the validation of the event-specific method for thequantification of 59122, 20 unknown samples, representingfive GM levels, were used in the validation study. On each PCRplate, ten samples were analyzed in parallel with both the59122- and hmg-specific system (Krech 1999). Two plates intotal were run, with two replicates for each GM level analyzedon each run. Each sample was analyzed in triplicate.
The quantification of unknown samples was carried outby quantifying the GM event relatively to the total maizequantity by using separate calibration curves analyzed inthe same PCR run, i.e., one calibration curve for the GMevent (TC1507 or 59122, respectively) and one calibrationcurve for total maize DNA. The relative amount of GMevent DNA in total maize DNA of blind samples wasobtained by dividing the GM copy number (TC1507 or59122, respectively) by the maize copy number for eachblind sample. The copy number measured for blind sampleswere obtained by interpolation from the calibration curvesobtained by plotting threshold cycle (Ct) values against thelogarithm of the copy number of the standard samples(determined by dividing the sample DNA weight in nano-grams by the published average 1C value for maizegenomes; Arumuganathan and Earle 1991). Detailed resultsof the validation studies as well as the related protocols areavailable on the CRL-GMFF website at http://gmo-crl.jrc.it/statusofdoss.htm (Mazzara et al. 2005, 2006).
Fuzzy Logic-based Validation
The fuzzy logic-based procedure based on the multivaluedfuzzy group introduced by Zadeh (1965) and following theSugeno method of fuzzy inference (Sugeno 1985) was used
to design an expert system for validation of GMO analyticalmethods. The computational details of fuzzy-based systemsfor use in validation are supplied with a previous publication(Bellocchi et al. 2002) and are only briefly reported hereafter.
Each metric used in the validation work, according to anexpert judgment, has a membership value for two possibleclasses, i.e., the favorable (F) and the unfavorable (U)classes. Validation metrics such as percent mean bias orpercent repeatability standard deviation range from F to U astheir values increase. For such metrics, the value ofmembership to a U class is defined using the following,monotonously increasing, S-shaped curve:
S x; a; bð Þ ¼0 x � a2 � x�a
b�a
� �2a � x � c
1� 2 � x�bb�a
� �2c � x � b
1 x � b
8>><
>>:ð1Þ
where: x=the value of the basic validation metric, a=thelower threshold (values of x lower than a have membership tothe U class equal to 0 and to the F class equal to 1), b=theupper threshold (values of x greater than b have membershipto the U class equal to 1 and to the F class equal to 0), andc=(a+b)/2. Its complement, 1−S(x; a; b), gives the degree ofmembership of the metric value x to the set F. For a metriclike reverse transcriptase (RT)-PCR efficiency, the transitionfrom F to U occurs with decreasing values. Therefore, forthis type of metric, Eq. 1 defines a membership to F, whileits complement gives membership to U.
The rules for aggregating the metrics in a unique modulevalue are based on two factors: their membership to F andU classes and on expert weights. For each combination ofthe two input memberships, an expert weight is assigned.Thus, since each metric has a membership to F and U, fortwo metrics, four expert weights are needed, eight expertweights are needed for the aggregation of three metrics, andso on. As an example, the case of two metrics is outlined toshow the relationship between inputs and outputs inlinguistic terms by “if–then” statements:
Premise Conclusion
If x1 is F and x2 is F Then y1 is w1
If x1 is F and x2 is U Then y2 is w2
If x1 is U and x2 is F Then y3 is w3
If x1 is U and x2 is U Then y4 is w4
where xi is an input variable, yi is an output variable, and ewi
is an expert weight. The value of each conjunction (... and ...),called “truth value” (vi), is the minimum of the membership toa class (F or U), which are obtained from the S-shaped curves.
The two inputs of the above example can be translated intometrics used for method validation, e.g., RSDr and RSDR:
If RSDr is F and RSDR is F Then p1 is 0.0If RSDr is F and RSDR is U Then p2 is 0.5If RSDr is U and RSDR is F Then p3 is 0.5If RSDr is U and RSDR is U Then p4 is 0.0
where pi (i=1, ..., 4) indicates a generic output reflectingmethod precision.
The application of the rules generates a single fuzzygroup that includes several output values (four whencombining two inputs) and is defuzzified to resolve asingle crisp output value from the group (i.e., a valuebetween 0 and 1). This approach uses the centroid methodto obtain the representative nonfuzzy value for the output,as commonly adopted in the Sugeno-type systems (Sugeno1985). This approach consists in a summation of vi · wi
values generated from each combination, divided by thesum of all truth values. The expert reasoning runs asfollows: If all input variables are F, the value of the module is0 (good response from the analytical method according to allmetrics used); if all metrics are U, the value of the module is1 (bad response from the analytical method according to allmetrics used), while all the other combinations assumeintermediate values. Limits F and U may come fromexperience, may be extracted from literature, or may be setby law. Under the general criteria that a higher weight isassigned to the preposition that the expert judges far fromgood performance, the weights can be chosen based on theanalyst own experience in handling each validation metric. Itderives that weights equal to 0 and 1 are set to prepositionscontaining only F or U values, respectively; intermediate,expert values are assigned to other combinations.
Results
Fuzzy Logic-based Expert System for GMO MethodValidation
Figure 1 illustrates the implementation of fuzzy logic formethod validation: First, six metrics computed in GMOmethods validation (percent repeatability standard deviation,percent reproducibility standard deviation, percent meanabsolute bias, number of reagents required for a RT-PCRanalyte quantification, and percent efficiency of RT-PCR forboth the GM-specific system and the taxon-specific referencesystem) are transformed into fuzzy modules (accuracy,practicability, efficiency), and second, the three modules are
Food Anal. Methods
aggregated into a synthetic indicator. In this context, the termmodule is used to indicate a validation measure calculatedvia a fuzzy-based procedure from one or more basic metrics.For each module, a dimensionless value between 0 (bestresponse) and 1 (worst response) is calculated. A two-stagedesign of a “fuzzy-based rules”-inferring system is appliedwhere firstly metrics with similar characteristics are aggre-gated into modules, and then, using the same procedure, themodules can be aggregated into a second-level-integratedindex (again, ranging from 0 to 1), called indicator. Themodules in Fig. 1 cover criteria that the performanceassessment of GMO analytical methods should consider(Table 1): (1) the closeness of the analytical response to thetrue value (expressed in terms of percent bias, B) and theextent to which it varies within a laboratory (percentrepeatability standard deviation, RSDr) and across laborato-ries (percent reproducibility standard deviation, RSDR), (2)the complexity of the method (interpreted by the number ofreagents required), and (3) the efficiency of the analyticalprocedure (RT-PCR) in the amplification rate (expressed bythe two efficiency measures).
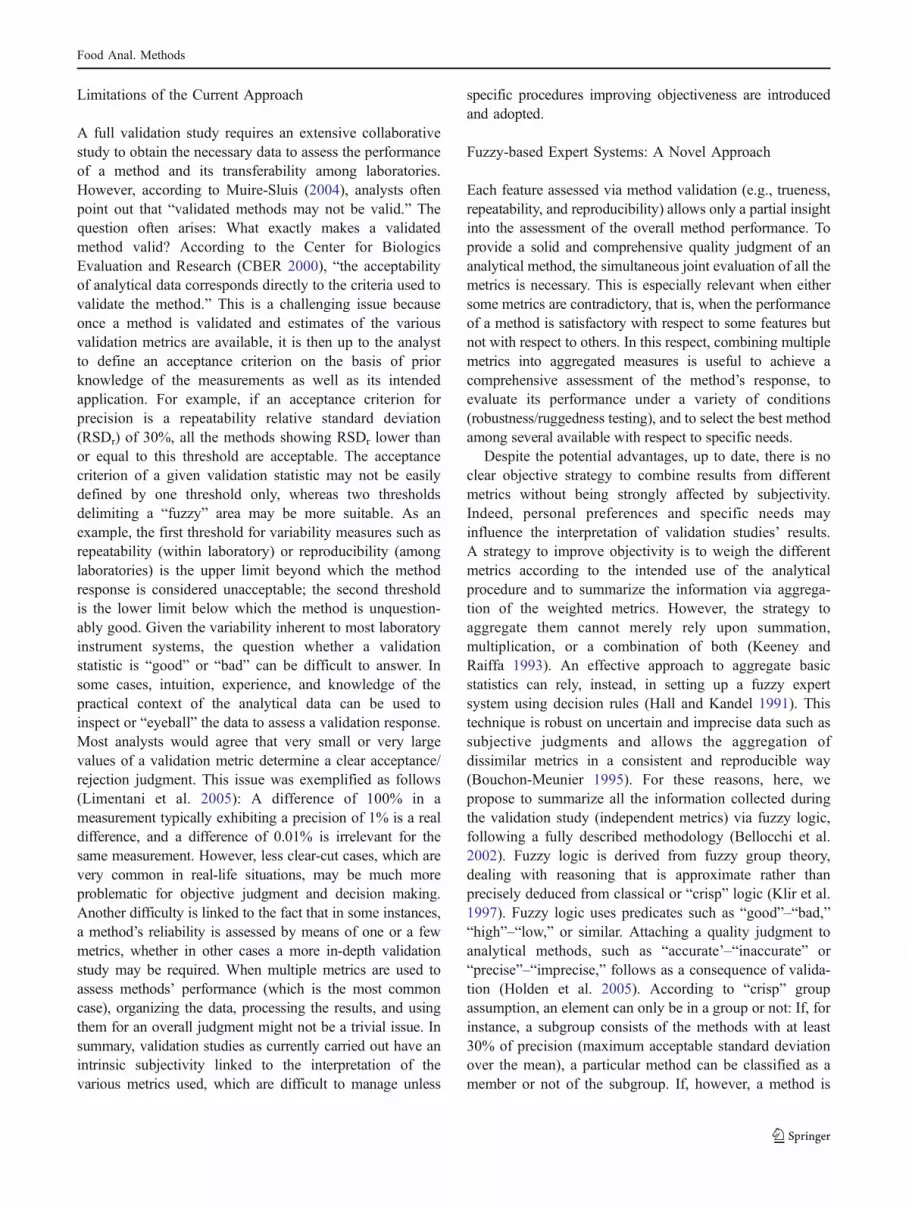
As an example, Fig. 2 shows the S-shaped curves forefficiency rate (E). The S functions are flat at values of 0and 1 for E≤0.90 (U limit) and E≥0.98 (F limit). An
intermediate response is associated with values of theefficiency rate falling within a transition interval in whichthe membership value for F increases from 0 (at E=0.90) to1 (at E=0.98), and the membership value for U decreasesfrom 1 (at E=0.90) to 0 (at E=0.98). Figure 2 showsmembership values to F and U for E=0.91. The weightsimplemented in the framework of Fig. 1 are only exemplaryand refer to the various combinations of F and U (e.g., 0.40refers to FFU in module linearity). The relative incidence ofeach validation metric on the indicator can be deduced bycombining the weights of the validation metrics into theirown module with the ones of the modules into the indicator(Table 1). For instance, relative incidence equal to 0.30 forRSDR reflects the highest impact of this metric on the finalindicator. According to the weights set in the fuzzy system,efficiency measures are instead considered as least impacting(relative incidence equal to 0.10). This means that for a method,poor reproducibility easily turns into low performance, whilepoor efficiency might not be a big issue.
Weights and thresholds of the validation metrics indi-cated in Table 1 were attributed by the authors based on thecurrent understanding of satisfactory method performancecharacteristics as set forth by the European Network ofGMO Laboratories (in particular as for the attribution of the
membership
function
S [x; a = min
(F, U); b
=max (F, U)]
Score (%)
F Partial U
≤ 6 ↔ ≥ 12
F
U
E1
F Partial U
≥ 0.98 ↔ ≤ 0.90
validation indicator
membership
function
S[x; a = 0; b = 1]
accuracy
F Partial U
0 ↔ 1
practicability
F Partial U
0 ↔ 1
Expert
weight
F F F
F F U
F U F
F U U
U F F
U F U
U U F
U U U
efficiency
F Partial U
0 ↔ 1
validation modules
E2
F Partial U
≥ 0.98 ↔ ≤ 0.90
F F
F U
U F
U U
0.00
1.00
0.00
0.50
0.50
1.00
0.00
0.60
0.20
0.80
0.20
0.80
0.40
1.00
RSDr (%)
F Partial U
≤ 15 ↔ ≥ 25
RSDR (%)
F Partial U
≤ 20 ↔ ≥ 35
Bias (%)
F Partial U
≤ 15 ↔ ≥ 25
F F F
F F U
F U F
F U U
U F F
U F U
U U F
U U U
0.00
0.25
0.50
0.75
0.25
0.75
0.50
1.00
expert
weight
validation metrics
Fig. 1 Structure of the fuzzy-based method validation system, where:RSDr (%) repeatability standard deviation; RSDR (%) reproducibilitystandard deviation, Bias (%) mean absolute bias, Score number of RT-PCR reagents, E1 (%) GM test efficiency rate, E2 (%) reference gene
efficiency rate, F favorable threshold, U unfavorable threshold, S S-shaped membership function, x value of metric, a minimum valuebetween F and U, b maximum value between F and U
Food Anal. Methods
U membership values) and on the expertise of the CRL-GMFF, established by Regulation (EC) no. 1892/2003 ofthe European Parliament and of the Council as responsiblefor the validation of methods of detection of GMOs in foodand feed (Regulation (EC) no. 1892/2003 2003).
In the fuzzy module “accuracy,” three metrics wereconsidered. For the percent repeatability standard deviation(RSDr), membership values set to 25 (U) and 15 (F) indicatethat RSDr values are considered beyond the limit ofacceptable performance when they assume figures exceeding25% and optimal when they are below 15%. The samemembership values were attributed to the percent meanabsolute bias, while a less strict transition area (20 and 35 forF and U, respectively) was defined for the percentreproducibility standard deviation (RSDR). The three valida-tion metrics were subsequently combined in the module.Their specific contributions were weighed to privilege therelevance of the variability in terms of RSDR and RSDr—respective contributions are 0.50 and 0.35—rather than thebias whose weight was set to 0.15. Given the current state ofthe art in the GMOs’ testing field where the presence of
GMOs in food or feed commodities is best detected andquantified by means of applications stemming from PCR(Holst-Jansen et al. 2003), the “practicability” module waselaborated in such a way to take into account the easiness ofthe protocol that the operator has to follow to set up a real-time PCR assay. In particular, the number of differentcomponents that have to be added separately and in differentamounts to a reaction tube may have consequences on thefinal results due to increased risk of errors, e.g., pipetting.For this reason, a F membership value of 6 and a Umembership value of 12 were assigned to the practicabilitymodule based on the number of reaction components asindicated in the protocols of methods validated by the CRL-GMFF. The module “efficiency” was given by the combina-tion of the efficiencies of the GM- and of the taxon-specificreference system whose U membership value was set to 90%and F membership to 98%. The efficiency of the two systemswas determined by the slope of the respective standardcalibration curves using the formula: [(10−1/slope)−1]×100.The two values of efficiency contribute to the same extent tothe overall indicator. Finally, the three modules “accuracy,”
0.0
0.2
0.4
0.6
0.8
1.0
0.50 0.60 0.70 0.80 0.90 1.00
efficiency rate
mem
ber
ship
no efficiency
e
f
f
i
c
i
e
n
c
y
0.03
0.97
transition
interval
Fig. 2 Membership to the fuzzysets favorable (efficiency) andunfavorable (no efficiency) for ahypothetical method responsein terms of efficiency (E);example with the membershipvalues for E=0.91
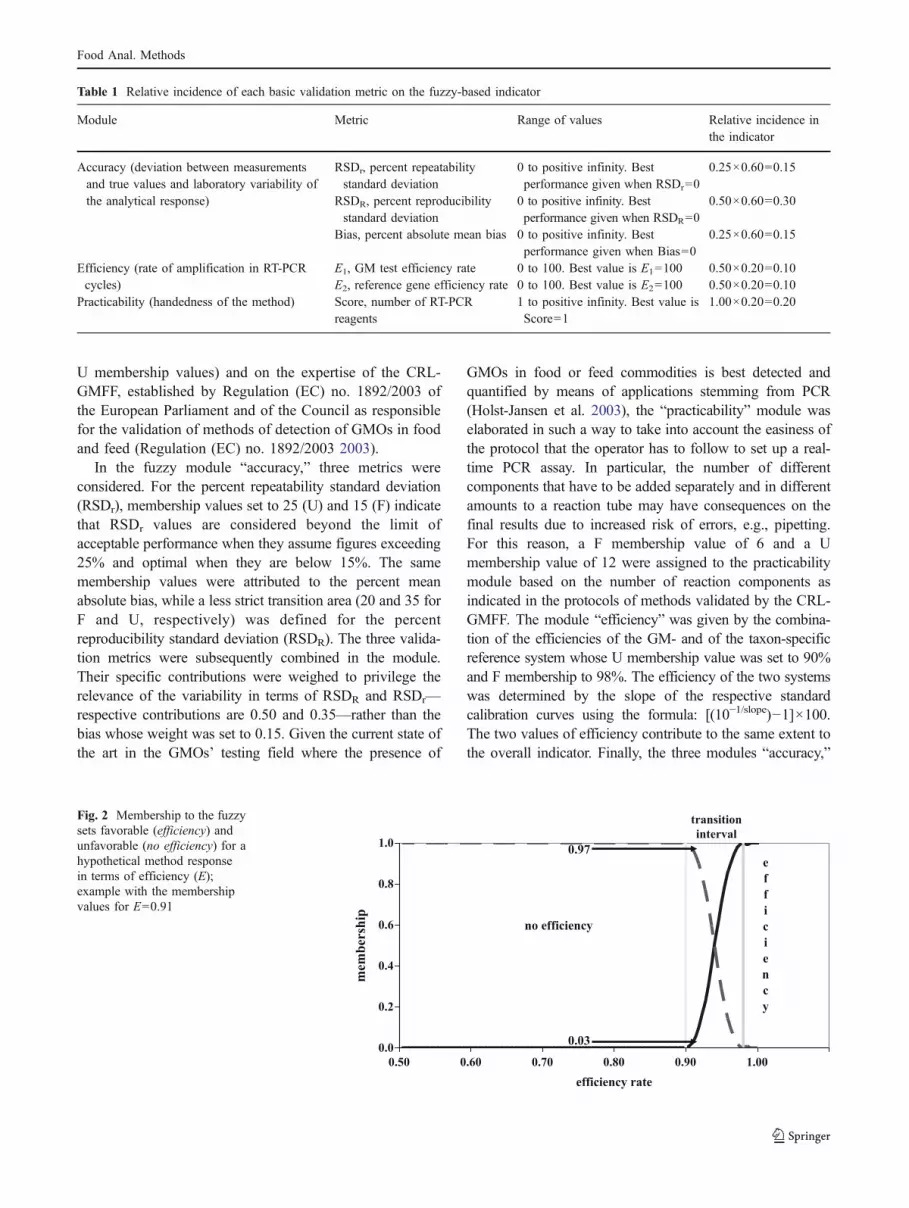
Table 1 Relative incidence of each basic validation metric on the fuzzy-based indicator
Module Metric Range of values Relative incidence inthe indicator
Accuracy (deviation between measurementsand true values and laboratory variability ofthe analytical response)
RSDr, percent repeatabilitystandard deviation
0 to positive infinity. Bestperformance given when RSDr=0
0.25×0.60=0.15
RSDR, percent reproducibilitystandard deviation
0 to positive infinity. Bestperformance given when RSDR=0
0.50×0.60=0.30
Bias, percent absolute mean bias 0 to positive infinity. Bestperformance given when Bias=0
0.25×0.60=0.15
Efficiency (rate of amplification in RT-PCRcycles)
E1, GM test efficiency rate 0 to 100. Best value is E1=100 0.50×0.20=0.10E2, reference gene efficiency rate 0 to 100. Best value is E2=100 0.50×0.20=0.10
Practicability (handedness of the method) Score, number of RT-PCRreagents
1 to positive infinity. Best value isScore=1
1.00×0.20=0.20
Food Anal. Methods
“practicability,” and “efficiency” were aggregated in thesynthetic indicator where their respective contribution wasset at 0.60, 0.20, and 0.20.
Functioning of the fuzzy-based expert system for GMOmethod validation
For the purpose of illustrating the functioning of the fuzzy-based expert system, basic metrics, modules, and the finalindicator were computed over the validation analysis ofmethods of detection of GM maize lines TC1507 and59122 (Table 2). These values are used here as exemplaryof the type of outputs gained from fuzzy-supportedvalidation analysis, out of an interlaboratory study. Thisexample shows that method TC1507 is globally wellperforming according to the overall indicator for all analytelevels (in average equal to 0.1305). However, a goodmethod does not have to show necessarily a perfectaccuracy at all GM levels. For example, the “accuracy”module is equal to 0.00961 at the 0.1% and 0.0000 at 0.5%,0.9%, and 2.0% GM levels. The relative strength of methodTC1507 also resides in the technical modules (efficiencyand practicability), whose values approach the optimumthresholds. The method 59122 (whose average indicator isequal to 0.4396), is characterized by optimal values for the“accuracy” module at the highest GM levels namely, 2.0%and 4.5%, although it is less performing at the lowest levelof the analyte (module equal to 0.4580 at the 0.1% level),along with general poor values of practicability (moduleequal to 1.0000) and efficiency (module equal to 0.8400).
These results are the consequence of the choices maderegarding the selection of input measures, the definition oftransition intervals, and the values given to the conclusions
of the decision rules. As such, the output of the fuzzy-supported exercise presented in this article has by no meansto be intended as a comparative analysis of the basic metrics,modules, or overall indicators of two validated methods forthe detection of two different GMOs, already declared fit forthe purpose of regulatory compliance. Rather, this is the firstattempt to describe, apply, and show how the fuzzy logicprinciple may be used to combine several performancestatistics of method validation in a synthetic numericalindicator. These illustrative results should be substantiatedby finer-tuned definition of weights and transition intervalsas more data will be processed. A sensitivity analysisconducted over a broad range of weights and transitionintervals can help identifying how the variability of suchsubjective elements affects the indicator, but this step isconsidered going beyond the scope of this paper.
Discussion
In the design of a process to assess the performance of ananalytical method, two major questions should be addressed:(1) which validation metrics should be taken into accountand (2) how the information from different validation metricsshould be combined and interpreted. Provided that an answerto the first question is given by the analysts according torecognized guidelines, the fuzzy-based inferential systemillustrated here proposes an answer to the second questionbecause it contains two key elements: the use of a fuzzy setand the use of decision rules. The use of a fuzzy groupprovides a well-designed solution to the problem of decidingcutoff values for basic validation metrics, e.g., the limitbetween F response, U response, and transition response.
Table 2 Validation response of two GMO analytical methods: basic metrics, modules, and overall indicator
Validation Analytical method
TC1507 59122
Levels
0.1 0.5 0.9 2.0 5.0 0.1 0.4 0.9 2.0 4.5
Basic validationmetrics
RSDr (%), repeatability standarddeviation
18.1 11.7 7.7 8.5 14.4 18.2 13.9 15.8 13.6 8.5
RSDR (%), reproducibility standarddeviation
19.9 14.8 10.2 21.2 21.7 24.6 21.8 21.8 14.9 13.2
B (%), mean absolute bias 6.0 4.0 3.7 1.7 8.4 29.0 15.0 9.0 7.0 1.0Score, number of RT-PCR reagents 9 15E1, GM test efficiency 95.0 91.3E2, reference gene efficiency 97.0 92.5
The use of decision rules provides a rational to aggregatevalidation metrics into modules. The combination of thesetwo concepts (limits in the response, mode of aggregation) ingroups of fuzzy-based rules is attractive because, althoughthe combinations of validation metrics are infinite, a singleset of fuzzy rules connect them all.
The system proposed is based on a compromise betweenoperational needs (i.e., validation of analytical methods) andflexibility (hierarchization of objectives and aggregation ofstatistics). The objective of an expert system is the simulationof human expertise. The expert system is substantiated if itdisplays, under a variety of conditions, the same responsesthat the human expertise would provide (Plant and Stone1991). Experts are therefore invited to comment on the setupand results of the fuzzy inferential system. If there is adisagreement between expert perception of method perfor-mance and the input of the expert system, the cause of thisdivergence will be examined in view of: (1) choice of basicvalidation metrics, (2) choice of limits on the transitioninterval, (3) formulation of the decision rules, and (4)formulation of the mode of aggregation of the modules. Allof these points may be modified according to expertconsensus, after an extensive testing of the methodology.
The fuzzy expert system proposed is able to reflect theanalyst expert judgment about the quality of the methodperformance. Such an approach provides a comprehensiveassessment, making it easier to identify the best performingmethods. It is also computationally efficient and well suitedfor mathematical analysis. Its utility was already proven inthe validation of agro-meteorological and soil models(Donatelli et al. 2004, Rivington et al. 2005), where itallowed gaining a fine level of details about model qualityand behavioral characteristics, but to the best of the authors’knowledge, the same approach has not been applied so farto validate analytical methods. The same approach can findapplicability within analytical method validation strategies,provided that a wide consensus about weights and limits isachieved. Its application in analytical method validation canbe valuable for a number of reasons:
1. It allows the analysts to express mathematically individ-ual or collective preferences (uncertainty factors).
2. It highlights the degree of method failure/goodnessassociated with each information (basic validationmetrics and aggregated modules).
3. It elucidates the degree of reliability of responseassociated with alternative methods.
4. It puts various components of the validation process(metrics, modules) in a formal structure.
5. It summarizes several sources and levels of informationinto a single value.
6. It allows the examination of possible compensationsamong different metrics and modules.
The modular structure of the fuzzy-based expert systemalso presents other advantages. First, users have access toboth a synthetic indicator, reflecting overall judgment, andto individual modules. This allows complete transparencyof each step, and consequently, it allows a better control ofthe process itself. Second, the mode of aggregation ofmodules can be changed, and new modules can be possiblyadded. The multivalue nature of a validation process isexplicitly stated, the rules are easy to read, and thenumerical scores used for their conclusion are easy to tuneto match expert opinions. The method illustrated is flexibleand can be extended to aggregate more validation metricsof different types. However, three groups of metrics andthree metrics per group appear from experience as valuableupper limits to facilitate interpretation of results.
The freeware Analytical Method Performance Evaluation(Acutis et al. 2007) supplies provisions for fuzzy-basedaggregation. It allows the creation of reusable modules andindicators for use in method validation, thus serving as aconvenient means to support collaborative work amongnetworks of scientists involved in fuzzy-based methodvalidation.
Acknowledgment The Authors acknowledge Pioneer Hi-BredInternational for having developed, optimized, and submitted to theCRL-GMFF—according to the requirements of Reg. (EC) No. 1829/2003 and Reg. (EC) No. 641/2004—the event-specific methods forquantitative detection of maize lines TC1507 and DAS59122.
References
Acutis M, Trevisiol P, Confalonieri R, Bellocchi G, Grazioli E, Vanden Eede G, Paoletti C (2007) J AOAC Int 90:1432
Arumuganathan K, Earle ED (1991) Plant Mol Biol Reporter 9:208Balls M, Fentem JH (1997) ATLA 25:33Bellocchi G, Acutis M, Fila G, Donatelli M (2002) Agron J 94:1222Bouchon-Meunier B (1995) La logique floue. Presses Universitaires
de France, Paris, p 128CBER (2000) Draft guidance for industry. Analytical procedures and
methods validation. FDA, Bethesda, MDDonatelli M, Acutis M, Nemes A, Wösten H (2004) In: Pachepsky
YA, Rawls WJ (eds) Development of pedotransfer functions insoil hydrology. Elsevier, Amsterdam, pp 363–390
FAO–WHO (2005) Codex Alimentarius Commission. Codex committeeof methods of analysis and sampling: consideration of the methodsfor the detection and identification of foods derived frombiotechnology. General approach and criteria for the methods.FAO, Rome, p 16
Green JM (1996) Anal Chem 68:305Hall LO, Kandel A (1991) In: Kandel A (ed) Fuzzy expert theory.
CRC, Boca Raton, FL, pp 3–21Holden JM et al (2005) J Food Comp Anal 18:829Holst-Jansen A, Ronning SB, Lovseth A, Berdal KG (2003) Anal
Bioanal Chem 375:985Horwitz W (1995) Pure Appl Chem 67:331
Food Anal. Methods
ICH (1995) Validation of analytical procedures; Q2A. ICH, Geneva(60 Federal Register 11259–11262)
ICH (1997) Validation of analytical procedures: methodology. Q2B.ICH, Geneva (62 Federal Register 27463–27467)
ISO 5725 (1994) Accuracy (trueness and precision) of measurementsmethods and results. International Organization for Standardization,Geneva (parts 1–6)
ISO (2007) International vocabulary of basic and general terms inmetrology (VIM), 3rd edn. International Organization forStandardization, Geneva
IUPAC (1988) Pure Appl Chem 60:856IUPAC (1995) Pure Appl Chem 67:331Keeney RL, Raiffa H (1993) Decision with multiple objectives:
preferences and value tradeoffs. Cambridge University Press,New York, p 569
Klir GJ, Clair UH St, Yuan B (1997) Fuzzy set theory: foundationsand applications. Prentice Hall, Upper Saddle River, NJ, p 574
Limentani GB, Ringo MC, Ye F, Bergquist ML, McSorley EO (2005)Anal Chem 77:221
Mazzara M, Foti N, Price S, Paoletti C, Van den Eede G (2005) Event-specific method for the quantitation of maize line TC1507 usingreal-time PCR-validation report and protocol-sampling and DNAextraction of M TC15O7. EUR 21828 EN, ISBN 92-79-00109-4,Catalogue no. LB-NA-21828-EN-C
Mazzara M, Grazioli E, Price S, Larcher S, Savini C, Van den Eede G(2006) Event-specific method for the quantitation of maize lineDAS-59122-7 using real-time PCR-Validation report and protocol.EUR 22133 EN, ISBN 92-79-01535-4, Catalogue no. LB-NA-22133-EN-C
Muire-Sluis A (2004) Update on regulatory and industry perspective onthe design and optimization of immunogenicity assays. Presentedat Biological Assay Development and Validation, San Diego, CA
Plant RE, Stone ND (1991) Knowledge-based systems in agriculture.McGraw-Hill, New York (pp 364)
Regulation (EC) no. 1829/2003 (2003) of the European Parliament andCouncil of 22 September 2003 on genetically modified food and feed.Official Journal of the European Union 18.10.2003 L268, 01-23
Regulation (EC) no. 641/2004 (2004) of 6 April 2004 on detailedrules for the implementation of Regulation (EC) no. 1829/2003of the European Parliament and of the Council as regards theapplication for the authorization of new genetically modifiedfood and feed, the notification of existing products andadventitious or technically unavoidable presence of geneticallymodified material which has benefited from a favourable riskevaluation. Official Journal of the European Union 07.04.2004L102:14–25
Rivington M, Bellocchi G, Matthews KB, Buchan K (2005) AgricForest Meteorol 135:228
Sugeno M (1985) Inf Sci 36:59Thompson M, Wood R (1993) Pure Appl Chem 65:2123Thompson M, Wood R (1995) Pure Appl Chem 67:49Thompson M, Ellison S, Fajgelj A, Willetts P, Wood R (1999) Pure
Appl Chem 71:337Thompson M, Ellison SLR, Wood R (2002) Pure Appl Chem 74:835USP (2003) Validation of compendial methods. USPharmacopoeia
Convention, Rockville, MD (pp 2149)WHO (1980) Requirements for kits for immunoassay and other
protein binding systems. Document number WHO/BS/80.1270/HRP/80.1. World Health Organization, Geneva