Fine-scale recognition and use of mesoscale fronts by foraging Cape gannets in the Benguela upwelling region Philippe S. Sabarros a,b,n , David Grémillet c,d , Hervé Demarcq b , Christina Moseley d , Lorien Pichegru d , Ralf H.E. Mullers c , Nils C. Stenseth a,e , Eric Machu a,f a Centre for Ecological and Evolutionary Synthesis, Department of Biology, University of Oslo, PO Box 1066 Blindern, 0316 Oslo, Norway b Institut de Recherche pour le Développement, Centre de Recherche Halieutique Méditerranéenneet Tropicale, UMR EME 212, Avenue Jean Monnet, BP 171, 34203 Sète Cedex, France c Centre National de la Recherche Scientifique, Centre d'Ecologie Fonctionnelle et Evolutive,1919 route de Mende, 34293 Montpellier, France d Percy FitzPatrick Institute of African Ornithology, DST/NRF Centre of Excellence, University of Cape Town, Rondebosch 7701, South Africa e Institute of Marine Research, Flødevigen Marine Research Station, 4817 His, Norway f Institut de Recherche pour le Développement, Laboratoire de Physique des Océans, Site IFREMER BP 70, 29280 Plouzané, France article info Available online 29 June 2013 Keywords: Seabird Environmental cue Behavioral shift Area-restricted search Feeding activity Fractal landscape Oceanographic fronts Morus capensis Southern Benguela South Africa abstract Oceanic structures such as mesoscale fronts may become hotspots of biological activity through concentration and enrichment processes. These fronts generally attract fish and may therefore be targeted by marine top-predators. In the southern Benguela upwelling system, such fronts might be used as environmental cues by foraging seabirds. In this study we analyzed high-frequency foraging tracks (GPS, 1 s sampling) of Cape gannets Morus capensis from two colonies located on the west and east coast of South Africa in relation to mesoscale fronts detected on daily high-resolution chlorophyll-a maps (MODIS, 1 km). We tested the association of (i) searching behavior and (ii) diving activity of foraging birds with mesoscale fronts. We found that Cape gannets shift from transiting to area-restricted search mode (ARS) at a distance from fronts ranging between 2 and 11 km (median is 6.7 km). This suggests that Cape gannets may be able to sense fronts (smell or vision) or other predators, and that such detection triggers an intensified investigation of their surroundings (i.e. ARS). Also we found that diving probability increases near fronts in 11 out of 20 tracks investigated (55%), suggesting that Cape gannets substantially use fronts for feeding; in the remaining cases (45%), birds may have used other cues for feeding including fishing vessels, particularly for gannets breeding on the west coast. We demonstrated in this study that oceanographic structures such as mesoscale fronts are important environmental cues used by a foraging seabird within the rich waters of an upwelling system. There is now need for further investigations on how Cape gannets actually detect these fronts. & 2013 Elsevier Ltd. All rights reserved. 1. Introduction Oceanic circulation and light availability play a key role in structuring ecosystems throughout the oceans. Oceanic circulation is crucial to supplying nutrients to the layer that light penetrates, and thereby sustaining and shaping primary productivity of marine food webs. Depending on the size, life span and diet of marine species, primary production may constrain the distribution of marine species across various spatiotemporal scales (Longhurst, 1998). Hydrody- namic features – from larger scales (several hundreds of kms) down to smaller scales (e.g. mesoscale, from 1–2 km to 100–200 km) – are known to drive the distribution and foraging patterns of top- predators because the predictability of prey is higher in and around these structures (Weimerskirch, 2007). It has been well documented that large convergence zones (e.g. polar front) correspond to foraging areas of marine birds and mammals (review by Bost et al. (2009)). At smaller scales, dynamic mesoscale structures such as eddies, vertically-structured fronts and filaments are essential to the enrich- ment, concentration and retention of nutrients and planktonic organisms in surface waters (Bakun's triad, cf. Bakun, 1996) which attract and shape the aggregation patterns of plankton-eaters such as small pelagic fish (Bakun, 2006; Bertrand et al., 2008; Sabarros et al., 2009). Mesoscale structures are considered as major attracting features for large predatory fish (Young et al., 2001; Seki et al., 2002), marine mammals (Campagna et al., 2006; Cotté et al., 2007) and seabirds (Nel et al., 2001; Weimerskirch et al., 2004, 2005; Ainley et al., 2005, 2009; Hyrenbach et al., 2006). How top-predators find these structures – notably fronts – still remains poorly understood. Nevitt (2000, 2008) showed that a range of seabirds (procellariiforms) track and capitalize on fronts Contents lists available at ScienceDirect journal homepage: www.elsevier.com/locate/dsr2 Deep-Sea Research II 0967-0645/$ - see front matter & 2013 Elsevier Ltd. All rights reserved. http://dx.doi.org/10.1016/j.dsr2.2013.06.023 n Corresponding author. Tel.: +47 228 54 400; fax: +47 228 54 001. E-mail address: [email protected] (P.S. Sabarros). Deep-Sea Research II 107 (2014) 77–84
Transcript
Deep-Sea Research II 107 (2014) 77–84
Contents lists available at ScienceDirect
Deep-Sea Research II
0967-06http://d
n CorrE-m
journal homepage: www.elsevier.com/locate/dsr2
Fine-scale recognition and use of mesoscale fronts by foragingCape gannets in the Benguela upwelling region
Philippe S. Sabarros a,b,n, David Grémillet c,d, Hervé Demarcq b, Christina Moseley d,Lorien Pichegru d, Ralf H.E. Mullers c, Nils C. Stenseth a,e, Eric Machu a,f
a Centre for Ecological and Evolutionary Synthesis, Department of Biology, University of Oslo, PO Box 1066 Blindern, 0316 Oslo, Norwayb Institut de Recherche pour le Développement, Centre de Recherche Halieutique Méditerranéenne et Tropicale, UMR EME 212, Avenue Jean Monnet, BP 171,34203 Sète Cedex, Francec Centre National de la Recherche Scientifique, Centre d'Ecologie Fonctionnelle et Evolutive, 1919 route de Mende, 34293 Montpellier, Franced Percy FitzPatrick Institute of African Ornithology, DST/NRF Centre of Excellence, University of Cape Town, Rondebosch 7701, South Africae Institute of Marine Research, Flødevigen Marine Research Station, 4817 His, Norwayf Institut de Recherche pour le Développement, Laboratoire de Physique des Océans, Site IFREMER BP 70, 29280 Plouzané, France
a r t i c l e i n f o
Available online 29 June 2013
Keywords:SeabirdEnvironmental cueBehavioral shiftArea-restricted searchFeeding activityFractal landscapeOceanographic frontsMorus capensisSouthern BenguelaSouth Africa
45/$ - see front matter & 2013 Elsevier Ltd. Ax.doi.org/10.1016/j.dsr2.2013.06.023
Oceanic structures such as mesoscale fronts may become hotspots of biological activity throughconcentration and enrichment processes. These fronts generally attract fish and may therefore betargeted by marine top-predators. In the southern Benguela upwelling system, such fronts might be usedas environmental cues by foraging seabirds. In this study we analyzed high-frequency foraging tracks(GPS, 1 s sampling) of Cape gannets Morus capensis from two colonies located on the west and east coastof South Africa in relation to mesoscale fronts detected on daily high-resolution chlorophyll-a maps(MODIS, 1 km). We tested the association of (i) searching behavior and (ii) diving activity of foragingbirds with mesoscale fronts. We found that Cape gannets shift from transiting to area-restricted searchmode (ARS) at a distance from fronts ranging between 2 and 11 km (median is 6.7 km). This suggests thatCape gannets may be able to sense fronts (smell or vision) or other predators, and that such detectiontriggers an intensified investigation of their surroundings (i.e. ARS). Also we found that diving probabilityincreases near fronts in 11 out of 20 tracks investigated (55%), suggesting that Cape gannets substantiallyuse fronts for feeding; in the remaining cases (45%), birds may have used other cues for feeding includingfishing vessels, particularly for gannets breeding on the west coast. We demonstrated in this study thatoceanographic structures such as mesoscale fronts are important environmental cues used by a foragingseabird within the rich waters of an upwelling system. There is now need for further investigationson how Cape gannets actually detect these fronts.
& 2013 Elsevier Ltd. All rights reserved.
1. Introduction
Oceanic circulation and light availability play a key role instructuring ecosystems throughout the oceans. Oceanic circulationis crucial to supplying nutrients to the layer that light penetrates, andthereby sustaining and shaping primary productivity of marine foodwebs. Depending on the size, life span and diet of marine species,primary production may constrain the distribution of marine speciesacross various spatiotemporal scales (Longhurst, 1998). Hydrody-namic features – from larger scales (several hundreds of kms) downto smaller scales (e.g. mesoscale, from 1–2 km to 100–200 km) – areknown to drive the distribution and foraging patterns of top-predators because the predictability of prey is higher in and around
ll rights reserved.
47 228 54 001.ros).
these structures (Weimerskirch, 2007). It has been well documentedthat large convergence zones (e.g. polar front) correspond to foragingareas of marine birds and mammals (review by Bost et al. (2009)). Atsmaller scales, dynamic mesoscale structures such as eddies,vertically-structured fronts and filaments are essential to the enrich-ment, concentration and retention of nutrients and planktonicorganisms in surface waters (Bakun's triad, cf. Bakun, 1996) whichattract and shape the aggregation patterns of plankton-eaters such assmall pelagic fish (Bakun, 2006; Bertrand et al., 2008; Sabarros et al.,2009). Mesoscale structures are considered as major attractingfeatures for large predatory fish (Young et al., 2001; Seki et al.,2002), marine mammals (Campagna et al., 2006; Cotté et al., 2007)and seabirds (Nel et al., 2001; Weimerskirch et al., 2004, 2005;Ainley et al., 2005, 2009; Hyrenbach et al., 2006).
How top-predators find these structures – notably fronts – stillremains poorly understood. Nevitt (2000, 2008) showed thata range of seabirds (procellariiforms) track and capitalize on fronts
P.S. Sabarros et al. / Deep-Sea Research II 107 (2014) 77–8478
across different scales using olfactory and visual cues. Procellarii-forms navigate at large scales by following odor compounds (e.g.dimethyl sulfide) that are released by plankton organisms thataccumulate at fronts. Once in the visual range of fronts, procellarii-forms may locate and dive onto fish patches. Only a limitednumber of studies investigated the association between particularforaging behavioral patterns in animal movements and environ-mental features. For example, Trathan et al. (2008) showed thatking penguins at South Georgia concentrate their foraging effort towater masses with a particular temperature range, and Tew Kaiet al. (2009) demonstrated that frigate birds feed at the edge ofmesoscale eddies in the Mozambique channel. There is a crucial needfor such insight to improve our understanding of the underlyingmechanisms of seabird foraging behavior (Tremblay et al., 2009).
Eastern boundary upwelling systems (EBUS) are subtropicalcoastal oceanic regions where an important atmospheric forcing(i.e. winds) induces an offshore transport of surface waters that arereplaced by nutrient-rich waters from subsurface layers (Capet et al.,2008). This newly upwelled water supports intense primary andsecondary production that sustains the world's highest fish biomassand fisheries (Pauly and Christensen, 1995). In EBUS, mesoscalefeatures such as eddies, vertically-structured fronts, and filaments,are generated by the instability of alongshore currents and theoffshore Ekman transport of surface waters (Capet et al., 2008)especially close to the shore (Pedlosky, 1978; Durski and Allen,2005). Local enrichment and concentration of nutrient in mesoscalefeatures promotes plankton production (Bakun, 2006) and maythereby attract schools and clusters of planktivorous fish (e.g. Ainleyet al., 2005; Sabarros et al., 2009). Surface mesoscale frontsassociated to eddies, filaments and vertically-structured fronts arecommon in the southern Benguela upwelling – one of the majorEBUS – located off the coast of South Africa. Such fronts may attractthe most abundant planktivorous fish in that region that are thesardine Sardinops sagax and the anchovy Engraulis encrasicolus (vander Lingen et al., 2006). These pelagic fish constitute the main preyitems of a medium-ranging seabird: the Cape gannetMorus capensisthat breeds at two colonies located on the west and the east coastsof South Africa (Hockey et al., 2005). Cape gannets forage within the
10°E 15°E 20°E
40°S
35°S
30°S
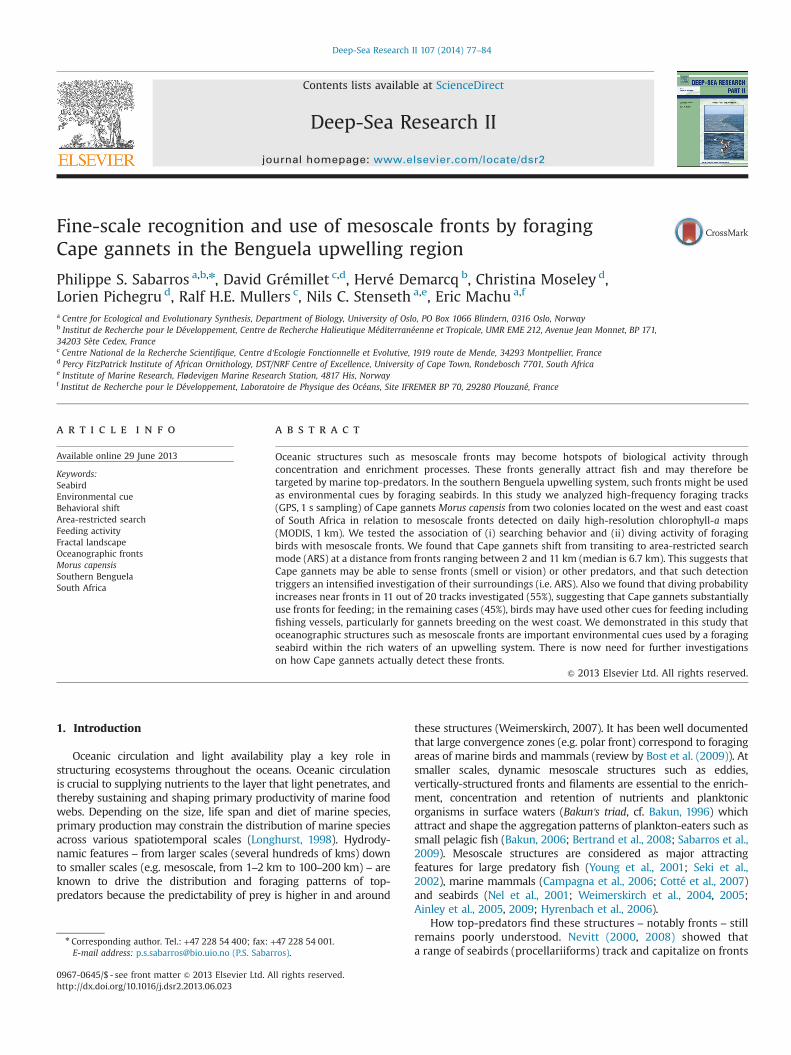
Fig. 1. Cape gannet tracks (N¼20) recorded in October–Nove
productive waters of the Benguela upwelling system on the con-tinental shelf (Pichegru et al., 2007) and might therefore use frontsas environmental cues when foraging. Foraging mechanisms andcues used by Cape gannets are poorly known apart from the factthat Cape gannets sometimes scavenge fishing boat discards on thewest coast of South Africa (Grémillet et al., 2008).
The influence of mesoscale oceanic structures of only a fewkilometers wide on the distribution and foraging patterns of toppredators has been little investigated due to the difficulty ofobserving properly these patterns by satellites (e.g. Tew Kaiet al., 2009) or field measurements (e.g. van Franeker et al.,2002). Thanks to technological advances in both satellite remotesensing (e.g. high-resolution chlorophyll-a measurements) andseabird biotelemetry (e.g. high-frequency GPS) we are now ableto study foraging patterns of marine predators in relation to theirenvironment at the lower mesoscale (few kms). In the presentstudy we use for the first time a combination of high-precisionindividual GPS tracks (1 s sampling) of Cape gannets and high-resolution daily maps of chlorophyll-a (1 km) provided by MODISon which we have identified mesoscale fronts (with edge detec-tion algorithm). We assume here that chlorophyll-a fronts are aproxy for the occurrence of seabirds' prey as shown in variousstudies (e.g. Ainley et al., 2005; Bakun, 2006; Sabarros et al., 2009).From GPS tracks we have extracted the bird's searching behavior (i.e. area-restricted search ARS) and feeding activity (i.e. dives). Weuse our datasets to test associations of (i) searching behavior and(ii) diving activity with the presence and location of mesoscale frontsin the Benguela upwelling system. We expect that the proximity offronts will induce intensified search patterns by Cape gannets andthat feeding activity will be concentrated around fronts.
2. Material and methods
2.1. Seabird tracks
Foraging movements of breeding Cape gannets were monitoredat two South African colonies during the reproductive season of 2009
25°E 30°E
mber 2009 on the west and east coasts of South Africa.
Table 1Cape gannet tracks, foraging parameters and corresponding date of the chlorophyll-a maps.
Track ID Track name Colony Date Trip duration (h) Path length (km) N dives chl-a map(s)
P.S. Sabarros et al. / Deep-Sea Research II 107 (2014) 77–84 79
(October–November). Adults raising 2–6 week-old chicks were fittedwith miniaturized high-precision GPS data-loggers (TechnoSmart,Rome, Italy) that were sealed in heat-shrinkable tubing (120�55�30 mm; 45 g including waterproof housing). The unit weightedapproximately 1.8% of the body mass of an adult gannet, which wasbelow the 3% limit recommended for deploying loggers on flyingbirds (Phillips et al., 2003). Loggers were attached to the base of thetail (below the preen gland) on three central tail feathers withwaterproof Tesa tape. This attachment method did little damage tothe plumage and the tape could be removed entirely upon recapture(Wilson et al., 1997). Handling lasted 4 to 10 min from capture torelease. Nests were then monitored regularly from 6AM to 7PM untilthe bird returned. The loggers recorded the position of the bird withan accuracy of 1–3 m, its speed, and additional precision parameters(e.g. number of satellite signals received, dilution of precision: DOP)every second. We selected the tracks that could be associated tochlorophyll-a maps of decent quality (see Section 2.3). We used atotal of 20 individual GPS tracks (no pseudo-replication) of which9 were recorded on the west coast of South Africa at Malgas Island,Saldanha Bay (33103′S, 17155′E) and 11 on the east coast at BirdIsland, Mandela Bay (33150′S, 26117′E). Tracks are shown in Fig. 1 anda summary of the track characteristics is provided in Table 1.
2.2. Seabird foraging activity.
2.2.1. Area-restricted search (ARS)ARS describes an intense search activity pattern performed by a
foraging animal that can be useful to study foraging activity andpreferential feeding grounds (Fauchald, 2009; Tremblay et al.,2009). ARS behavior can be inferred from animal movement datausing the fractal landscape (FL) method (Tremblay et al., 2007). FLis based on the computation of a fractal measure: the fractaldimension D. D measures the complexity and heterogeneity of aspatial or temporal object and considers both time and spacecoverage. The principle of FL is to compute D along the track insidea sliding time window as defined by Tremblay et al. (2007); herethe time window was approximately 1 h (Sabarros et al., inpreparation). The computation of D was performed using thedivider method, following Nams (1996). Straight pathways arecharacterized by a D that is close to 1. D increases with trackconvolutions and can readily detect intense foraging patternscharacterized by frequent turns and resultant tortuosity. In FL,
the peaks of D found along the path represent the ARS behavior(Tremblay et al., 2007; Sabarros et al., in preparation).
2.2.2. Feeding activityCape gannets generally plunge dive from the air to catch prey
underwater, and occasionally perform surface-dives when sittingat the sea surface (Ropert-Coudert et al., 2004). Dive durationsgenerally average 2–5 s but dives 45 s may occur (Ropert-Coudertet al., 2004; Pichegru et al., 2007). When a GPS receiver issubmerged it stops receiving information sent by the satellitessince the signal is lost. We used high-frequency tracks (1 s) to inferthe location and duration of dives from the interruptions in GPSsignal. Dives were defined as interruptions 41 s and r30 s.Interruptions 430 s are likely due to satellite signal receptionproblems or receiver malfunctioning since Cape gannet maximumdive duration is 22 s (Ropert-Coudert et al., 2004). Dive locationswere assigned to the location fix preceding the interruption of thesignal. We rechecked every dive profiles (including speed andsignal reception) and found out that 95% of the interruptionsin the signal 41 s and r30 s corresponded to either plunge dives(see details in Supplementary material, Fig. S1) or surface dives.
2.3. Chlorophyll-a data.
High-resolution satellite swaths (level 1 product, 1 km spatialresolution) of chlorophyll-a from Moderate Resolution ImagingSpectroradiometer (MODIS) satellite missions (Aqua and Terra)run by NASA (oceancolor.gsfc.nasa.gov) were used to compilegridded daily maps at 1 km spatial resolution. Wavelengths ofthe visible spectrum are used to monitored chlorophyll-a. Visiblewavelengths are sensitive to clouds, hence cloudy days lead tomaps with poor data coverage. For the purpose of our study, onlycloud-free chlorophyll-a maps could be associated to bird tracks.
2.4. Mesoscale chlorophyll-a fronts.
Fronts in upwelling areas were detected using an extension ofthe single-image edge detection (SIED) algorithm of Cayula andCornillon (1992) as described in Nieto (2009). The basic idea ofSIED method is to use overlapping windows to investigate thestatistical likelihood of an edge by detecting bimodality in histo-gram distribution and checking for cohesiveness of the potential
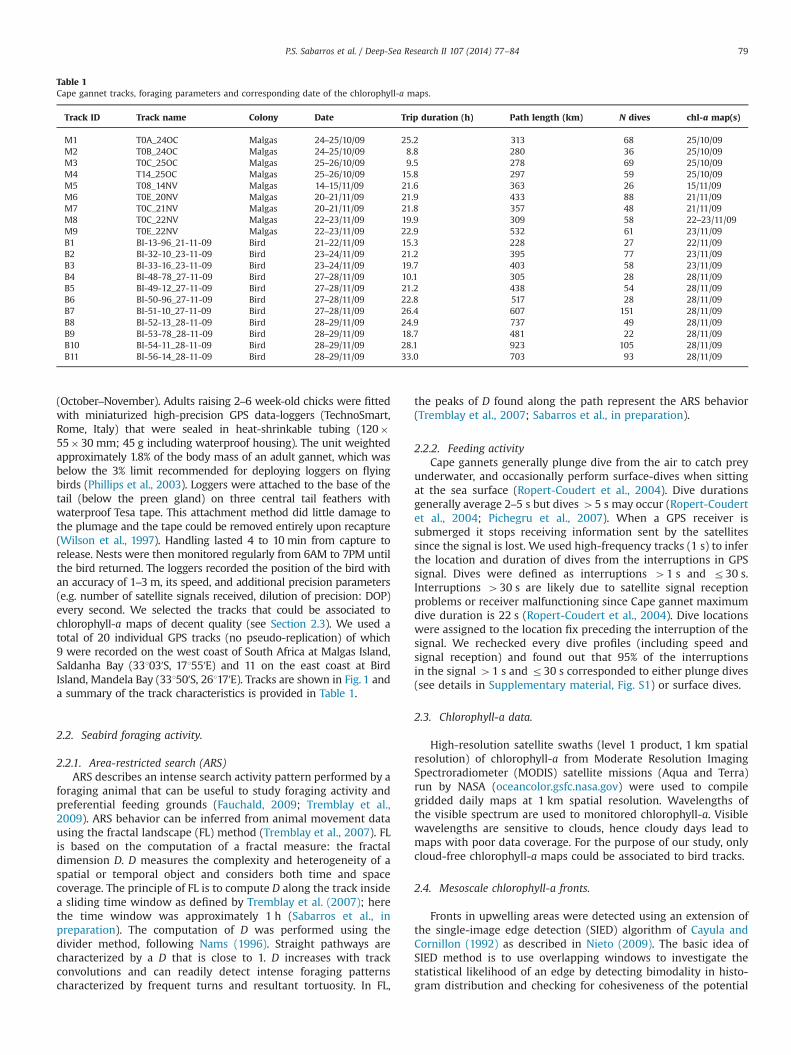
Fig. 3. Behavioral shift in track M2 (24–25/10/09, Malgas Island). Fractal dimensionD computed along the track is given as a function of distance to front d (N¼90,000observations). Vertical dotted line indicates the shift at d¼dshift. Horizontal solidlines are the means in the subsets ≤dshift and 4dshift and horizontal dashed linesshow the respective 95% confidence intervals.
MalgasIsland
mg m-3
50
20
10
5
1
0.1
0 10 30 50 km
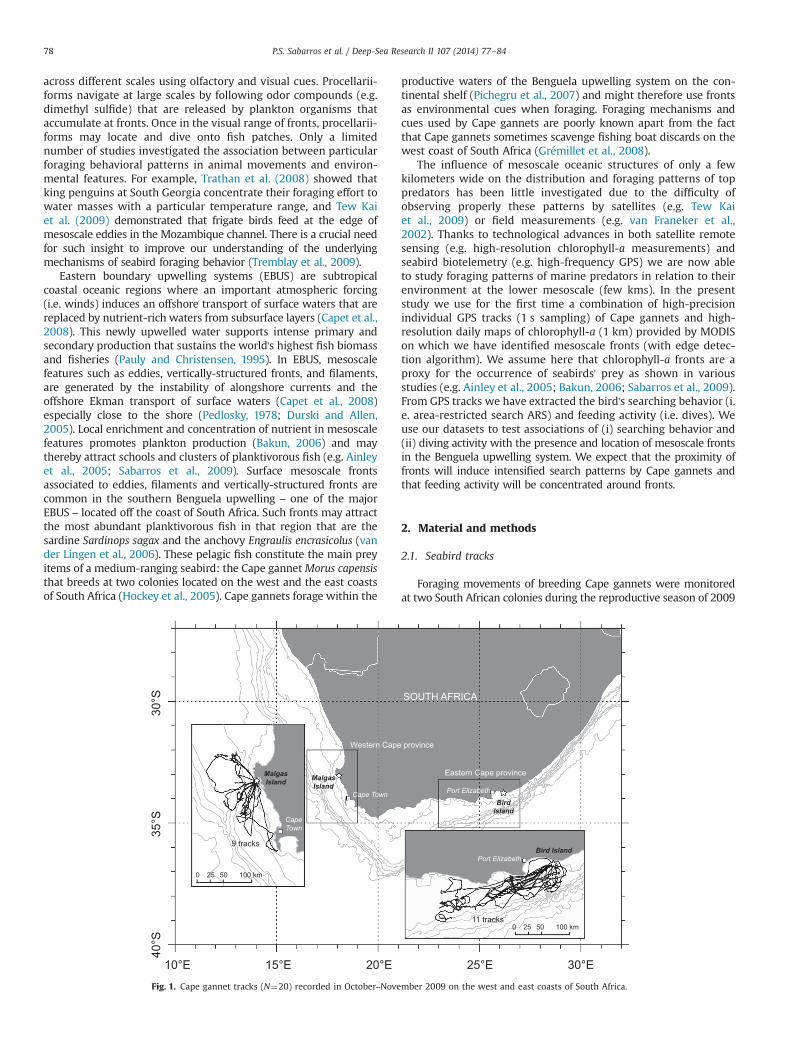
Fig. 2. Cape gannet track (M1) recorded on 24–25/10/2009 (white line) off the westcoast of South Africa superimposed onto the corresponding chlorophyll-a map(1 km spatial resolution; mg m�3, see color scale) with front locations (dark redlines). Dots indicates feeding spots. (For interpretation of the references to color inthis figure legend, the reader is referred to the web version of this article.)
0 5 10 15 20Distance to behavioural shift, dshift [km]
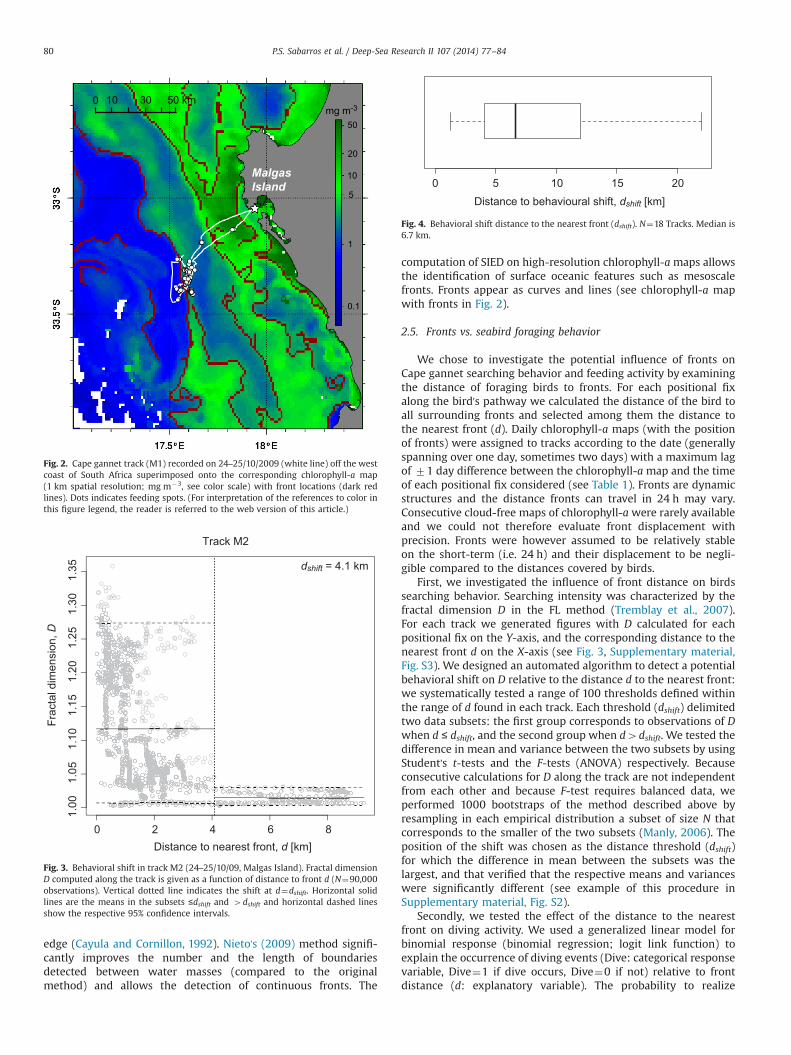
Fig. 4. Behavioral shift distance to the nearest front (dshift). N¼18 Tracks. Median is6.7 km.
P.S. Sabarros et al. / Deep-Sea Research II 107 (2014) 77–8480
edge (Cayula and Cornillon, 1992). Nieto's (2009) method signifi-cantly improves the number and the length of boundariesdetected between water masses (compared to the originalmethod) and allows the detection of continuous fronts. The
computation of SIED on high-resolution chlorophyll-amaps allowsthe identification of surface oceanic features such as mesoscalefronts. Fronts appear as curves and lines (see chlorophyll-a mapwith fronts in Fig. 2).
2.5. Fronts vs. seabird foraging behavior
We chose to investigate the potential influence of fronts onCape gannet searching behavior and feeding activity by examiningthe distance of foraging birds to fronts. For each positional fixalong the bird's pathway we calculated the distance of the bird toall surrounding fronts and selected among them the distance tothe nearest front (d). Daily chlorophyll-a maps (with the positionof fronts) were assigned to tracks according to the date (generallyspanning over one day, sometimes two days) with a maximum lagof 71 day difference between the chlorophyll-a map and the timeof each positional fix considered (see Table 1). Fronts are dynamicstructures and the distance fronts can travel in 24 h may vary.Consecutive cloud-free maps of chlorophyll-a were rarely availableand we could not therefore evaluate front displacement withprecision. Fronts were however assumed to be relatively stableon the short-term (i.e. 24 h) and their displacement to be negli-gible compared to the distances covered by birds.
First, we investigated the influence of front distance on birdssearching behavior. Searching intensity was characterized by thefractal dimension D in the FL method (Tremblay et al., 2007).For each track we generated figures with D calculated for eachpositional fix on the Y-axis, and the corresponding distance to thenearest front d on the X-axis (see Fig. 3, Supplementary material,Fig. S3). We designed an automated algorithm to detect a potentialbehavioral shift on D relative to the distance d to the nearest front:we systematically tested a range of 100 thresholds defined withinthe range of d found in each track. Each threshold (dshift) delimitedtwo data subsets: the first group corresponds to observations of Dwhen d ≤ dshift, and the second group when d4dshift. We tested thedifference in mean and variance between the two subsets by usingStudent's t-tests and the F-tests (ANOVA) respectively. Becauseconsecutive calculations for D along the track are not independentfrom each other and because F-test requires balanced data, weperformed 1000 bootstraps of the method described above byresampling in each empirical distribution a subset of size N thatcorresponds to the smaller of the two subsets (Manly, 2006). Theposition of the shift was chosen as the distance threshold (dshift)for which the difference in mean between the subsets was thelargest, and that verified that the respective means and varianceswere significantly different (see example of this procedure inSupplementary material, Fig. S2).
Secondly, we tested the effect of the distance to the nearestfront on diving activity. We used a generalized linear model forbinomial response (binomial regression; logit link function) toexplain the occurrence of diving events (Dive: categorical responsevariable, Dive¼1 if dive occurs, Dive¼0 if not) relative to frontdistance (d: explanatory variable). The probability to realize
Table 2Influence of fronts on ARS and diving activity. “n” Indicates that the 95% bootstrapped confidence interval of β does not overlap with 0 and that β is therefore significantlydifferent of 0. FL computation failed for M7 and M9 (indicated by “–”).
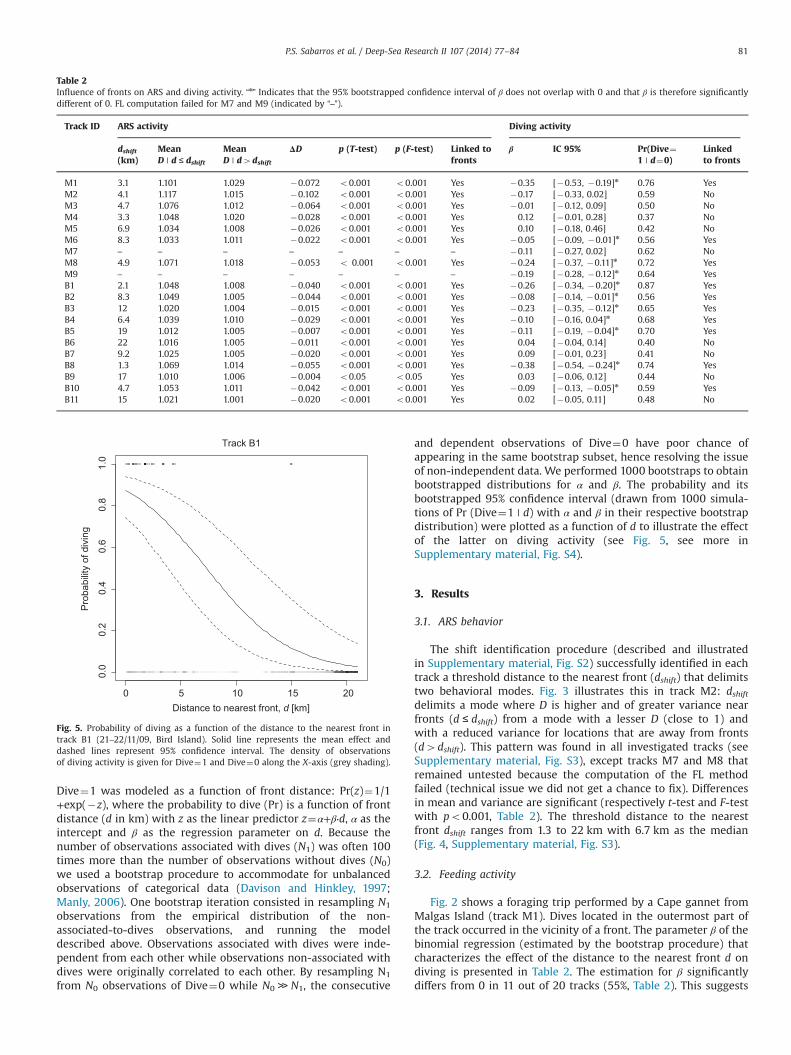
Fig. 5. Probability of diving as a function of the distance to the nearest front intrack B1 (21–22/11/09, Bird Island). Solid line represents the mean effect anddashed lines represent 95% confidence interval. The density of observationsof diving activity is given for Dive¼1 and Dive¼0 along the X-axis (grey shading).
P.S. Sabarros et al. / Deep-Sea Research II 107 (2014) 77–84 81
Dive¼1 was modeled as a function of front distance: Pr(z)¼1/1+exp(�z), where the probability to dive (Pr) is a function of frontdistance (d in km) with z as the linear predictor z¼α+β⋅d, α as theintercept and β as the regression parameter on d. Because thenumber of observations associated with dives (N1) was often 100times more than the number of observations without dives (N0)we used a bootstrap procedure to accommodate for unbalancedobservations of categorical data (Davison and Hinkley, 1997;Manly, 2006). One bootstrap iteration consisted in resampling N1
observations from the empirical distribution of the non-associated-to-dives observations, and running the modeldescribed above. Observations associated with dives were inde-pendent from each other while observations non-associated withdives were originally correlated to each other. By resampling N1
from N0 observations of Dive¼0 while N0 ≫ N1, the consecutive
and dependent observations of Dive¼0 have poor chance ofappearing in the same bootstrap subset, hence resolving the issueof non-independent data. We performed 1000 bootstraps to obtainbootstrapped distributions for α and β. The probability and itsbootstrapped 95% confidence interval (drawn from 1000 simula-tions of Pr (Dive¼1 | d) with α and β in their respective bootstrapdistribution) were plotted as a function of d to illustrate the effectof the latter on diving activity (see Fig. 5, see more inSupplementary material, Fig. S4).
3. Results
3.1. ARS behavior
The shift identification procedure (described and illustratedin Supplementary material, Fig. S2) successfully identified in eachtrack a threshold distance to the nearest front (dshift) that delimitstwo behavioral modes. Fig. 3 illustrates this in track M2: dshiftdelimits a mode where D is higher and of greater variance nearfronts (d ≤ dshift) from a mode with a lesser D (close to 1) andwith a reduced variance for locations that are away from fronts(d4dshift). This pattern was found in all investigated tracks (seeSupplementary material, Fig. S3), except tracks M7 and M8 thatremained untested because the computation of the FL methodfailed (technical issue we did not get a chance to fix). Differencesin mean and variance are significant (respectively t-test and F-testwith po0.001, Table 2). The threshold distance to the nearestfront dshift ranges from 1.3 to 22 km with 6.7 km as the median(Fig. 4, Supplementary material, Fig. S3).
3.2. Feeding activity
Fig. 2 shows a foraging trip performed by a Cape gannet fromMalgas Island (track M1). Dives located in the outermost part ofthe track occurred in the vicinity of a front. The parameter β of thebinomial regression (estimated by the bootstrap procedure) thatcharacterizes the effect of the distance to the nearest front d ondiving is presented in Table 2. The estimation for β significantlydiffers from 0 in 11 out of 20 tracks (55%, Table 2). This suggests
Association with fronts No association
0.0
0.2
0.4
0.6
0.8
1.0
Pro
babi
lity
of d
ivin
g at
fron
t (d
= 0)
N = 11 (55%)
N = 9 (45%)
0.5
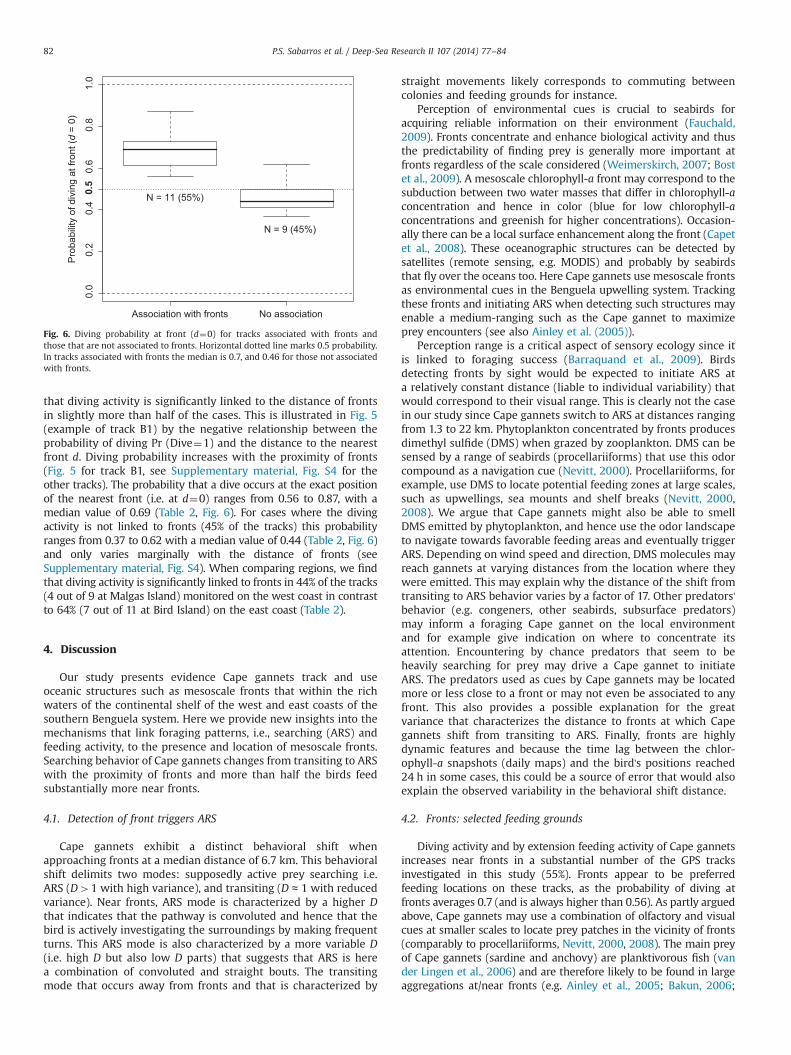
Fig. 6. Diving probability at front (d¼0) for tracks associated with fronts andthose that are not associated to fronts. Horizontal dotted line marks 0.5 probability.In tracks associated with fronts the median is 0.7, and 0.46 for those not associatedwith fronts.
P.S. Sabarros et al. / Deep-Sea Research II 107 (2014) 77–8482
that diving activity is significantly linked to the distance of frontsin slightly more than half of the cases. This is illustrated in Fig. 5(example of track B1) by the negative relationship between theprobability of diving Pr (Dive¼1) and the distance to the nearestfront d. Diving probability increases with the proximity of fronts(Fig. 5 for track B1, see Supplementary material, Fig. S4 for theother tracks). The probability that a dive occurs at the exact positionof the nearest front (i.e. at d¼0) ranges from 0.56 to 0.87, with amedian value of 0.69 (Table 2, Fig. 6). For cases where the divingactivity is not linked to fronts (45% of the tracks) this probabilityranges from 0.37 to 0.62 with a median value of 0.44 (Table 2, Fig. 6)and only varies marginally with the distance of fronts (seeSupplementary material, Fig. S4). When comparing regions, we findthat diving activity is significantly linked to fronts in 44% of the tracks(4 out of 9 at Malgas Island) monitored on the west coast in contrastto 64% (7 out of 11 at Bird Island) on the east coast (Table 2).
4. Discussion
Our study presents evidence Cape gannets track and useoceanic structures such as mesoscale fronts that within the richwaters of the continental shelf of the west and east coasts of thesouthern Benguela system. Here we provide new insights into themechanisms that link foraging patterns, i.e., searching (ARS) andfeeding activity, to the presence and location of mesoscale fronts.Searching behavior of Cape gannets changes from transiting to ARSwith the proximity of fronts and more than half the birds feedsubstantially more near fronts.
4.1. Detection of front triggers ARS
Cape gannets exhibit a distinct behavioral shift whenapproaching fronts at a median distance of 6.7 km. This behavioralshift delimits two modes: supposedly active prey searching i.e.ARS (D41 with high variance), and transiting (D ≈ 1 with reducedvariance). Near fronts, ARS mode is characterized by a higher Dthat indicates that the pathway is convoluted and hence that thebird is actively investigating the surroundings by making frequentturns. This ARS mode is also characterized by a more variable D(i.e. high D but also low D parts) that suggests that ARS is herea combination of convoluted and straight bouts. The transitingmode that occurs away from fronts and that is characterized by
straight movements likely corresponds to commuting betweencolonies and feeding grounds for instance.
Perception of environmental cues is crucial to seabirds foracquiring reliable information on their environment (Fauchald,2009). Fronts concentrate and enhance biological activity and thusthe predictability of finding prey is generally more important atfronts regardless of the scale considered (Weimerskirch, 2007; Bostet al., 2009). A mesoscale chlorophyll-a front may correspond to thesubduction between two water masses that differ in chlorophyll-aconcentration and hence in color (blue for low chlorophyll-aconcentrations and greenish for higher concentrations). Occasion-ally there can be a local surface enhancement along the front (Capetet al., 2008). These oceanographic structures can be detected bysatellites (remote sensing, e.g. MODIS) and probably by seabirdsthat fly over the oceans too. Here Cape gannets use mesoscale frontsas environmental cues in the Benguela upwelling system. Trackingthese fronts and initiating ARS when detecting such structures mayenable a medium-ranging such as the Cape gannet to maximizeprey encounters (see also Ainley et al. (2005)).
Perception range is a critical aspect of sensory ecology since itis linked to foraging success (Barraquand et al., 2009). Birdsdetecting fronts by sight would be expected to initiate ARS ata relatively constant distance (liable to individual variability) thatwould correspond to their visual range. This is clearly not the casein our study since Cape gannets switch to ARS at distances rangingfrom 1.3 to 22 km. Phytoplankton concentrated by fronts producesdimethyl sulfide (DMS) when grazed by zooplankton. DMS can besensed by a range of seabirds (procellariiforms) that use this odorcompound as a navigation cue (Nevitt, 2000). Procellariiforms, forexample, use DMS to locate potential feeding zones at large scales,such as upwellings, sea mounts and shelf breaks (Nevitt, 2000,2008). We argue that Cape gannets might also be able to smellDMS emitted by phytoplankton, and hence use the odor landscapeto navigate towards favorable feeding areas and eventually triggerARS. Depending on wind speed and direction, DMS molecules mayreach gannets at varying distances from the location where theywere emitted. This may explain why the distance of the shift fromtransiting to ARS behavior varies by a factor of 17. Other predators'behavior (e.g. congeners, other seabirds, subsurface predators)may inform a foraging Cape gannet on the local environmentand for example give indication on where to concentrate itsattention. Encountering by chance predators that seem to beheavily searching for prey may drive a Cape gannet to initiateARS. The predators used as cues by Cape gannets may be locatedmore or less close to a front or may not even be associated to anyfront. This also provides a possible explanation for the greatvariance that characterizes the distance to fronts at which Capegannets shift from transiting to ARS. Finally, fronts are highlydynamic features and because the time lag between the chlor-ophyll-a snapshots (daily maps) and the bird's positions reached24 h in some cases, this could be a source of error that would alsoexplain the observed variability in the behavioral shift distance.
4.2. Fronts: selected feeding grounds
Diving activity and by extension feeding activity of Cape gannetsincreases near fronts in a substantial number of the GPS tracksinvestigated in this study (55%). Fronts appear to be preferredfeeding locations on these tracks, as the probability of diving atfronts averages 0.7 (and is always higher than 0.56). As partly arguedabove, Cape gannets may use a combination of olfactory and visualcues at smaller scales to locate prey patches in the vicinity of fronts(comparably to procellariiforms, Nevitt, 2000, 2008). The main preyof Cape gannets (sardine and anchovy) are planktivorous fish (vander Lingen et al., 2006) and are therefore likely to be found in largeaggregations at/near fronts (e.g. Ainley et al., 2005; Bakun, 2006;
P.S. Sabarros et al. / Deep-Sea Research II 107 (2014) 77–84 83
Sabarros et al., 2009). Moreover, spotting prey in frontal zones maybe facilitated by the presence of subsurface predators (i.e. largepredatory fish, pinnipeds or cetaceans) that force fish schoolstowards the surface (Evans, 1982; Le Corre and Jaquemet, 2005).Fronts may thereby be useful oceanic structures to capitalize on for aforaging bird.
4.3. Use of other cues
In some cases, diving activity was not increased near frontscompared to other locations in 45% of the birds (N¼9/20) eventhough these birds exhibited a shift in searching behavior that wasrelated to fronts on larger scales. The probability of diving nearfronts ranged around 0.5 (0.37–0.62), indicating that diving wasnot linked to fronts. These birds may have initiated ARS whendetecting fronts but they probably used other cues for feeding.There are a few possible explanations to that. Feeding activity maynot be associated with fronts in that case because these birds mayhave encountered patches of prey in locations that are away fromfronts while transiting for example (Weimerskirch, 2007; Sabarroset al., in preparation). These Cape gannets may also have foundpatches by spotting successful foraging congeners or other species(e.g. other seabirds species, subsurface predators). Finally this maysuggest that birds have interacted with trawler boats like northerngannets in the UK (Votier et al., 2010). Bottom trawlers in thesouthern Benguela generally fish along the continental break shelfregardless of surface mesoscale fronts (see Fig. 1 in Grémillet et al.,2008). Vessel monitoring systems (VMS) data from fishing boatswould have been here useful to test if Cape gannets do follow andinteract with fishing boats (bottom trawlers and purse-seiners).
The stocks of the preferred prey of Cape gannets (sardines andanchovies) previously associated with the Western Cape provincehave shifted eastward in the late 1990s towards the Eastern Capeprovince (Crawford et al., 2008). Following the shortage of prey onthe west coast, the population of Cape gannets in this regiondecreased (Crawford et al., 2008). The eastward shift of prey hasresulted in Cape gannets of Malgas feeding extensively on fisherywastes (hake) discarded by trawlers (Grémillet et al., 2008). Thismay explain the weaker association between feeding activity andfronts on the west coast (44%) where gannets may follow fishingboats compared to the east coast (64%) where birds seem not tofeed on fishery wastes.
4.4. Further directions
Although the processes of concentration and enhancementof primary and secondary productions at fronts are rather wellknown, the mechanisms that drive the distribution and aggrega-tion patterns of fish at fronts are still poorly understood (expect forvery few studies e.g. Bertrand et al., 2008) and require particularattention, including observational and modeling studies. Focusingon top-predators (a medium-ranging seabird species here), weshowed that foraging patterns, i.e., searching and feeding, areassociated with external factors such as presence of mesoscalefronts. One may imagine that such patterns are tightly connectedto underlying physiological processes (involving energetic require-ments, expenditure and investment) so that the physiological stateof a bird would drive his behavioral response. The first step couldbe modeling the physiology of the bird using the dynamic energybudget theory (DEB, Kooijman, 2010). The second step could beincluding this to a state-space model formulation in a Bayesianframework that would manage the behavior aspect (e.g. Jonsenet al., 2005; Patterson et al., 2008) in the way that the physiolo-gical states would induce changes in behavior.
Acknowledgments
The authors thank their respective affiliations listed above.Field studies on Cape gannets were funded by the Percy FitzPatrickInstitute of African Ornithology, DST/NRF Center of Excellence atthe University of Cape Town, South Africa, and by the CEFE–CNRSin Montpellier, France. Permission to conduct research wasobtained from Cape Nature Conservation, West Coast NationalParks, and South African National Parks and we thank them fortheir extensive logistics support. Philippe S. Sabarros thanks MarieCurie actions under FP6 (MEST-CT-2005-020932) through theCEES-MCO training site, and Norwegian Research Council (NFR-179569/V70). Eric Machu thanks the MICO project (NFR-ES427093). We are grateful to Tristan Rouyer for guidance onstatistical analysis.
Appendix A. Supplementary material
Supplementary data associated with this article can be found in theonline version at http://dx.doi.org/10.1016/j.dsr2.2013.06.023.
References
Ainley, D.G., Dugger, K.D., Ford, R.G., Pierce, S.D., Reese, D.C., Brodeur, R.D., Tynan, C.T.,Barth, J.A., 2009. Association of predators and prey at frontal features in theCalifornia Current: competition, facilitation and co-occurrence. Mar. Ecol. Prog.Ser. 389, 271–294.
Ainley, D.G., Spear, L.B., Tynan, C.T., Barth, J.A., Pierce, S.D., Glenn Ford, R., Cowles, T.J.,2005. Physical and biological variables affecting seabird distributions during theupwelling season of the northern California Current. Deep-Sea Res. II 52,123–143.
Bakun, A., 2006. Fronts and eddies as key structures in the habitat of marine fishlarvae: opportunity, adaptive response and competitive advantage. Sci. Mar.70S2, 105–122.
Bakun, A., 1996. Patterns in the Ocean: Ocean Processes and Marine PopulationDynamics. University of California Sea Grant, San Diego, California, USA, inCooperation With Centro de Investigaciones Biologicas de Noroeste, La Paz, BajaCalifornia Sur, Mexico, 323 pp.
Barraquand, F., Inchausti, P., Bretagnolle, V., 2009. Cognitive abilities of a centralplace forager interact with prey spatial aggregation in their effect on intakerate. Anim. Behav. 78, 505–514.
Bertrand, A., Gerlotto, F., Bertrand, S., Gutiérrez, M., Alza, L., Chipollini, A., Díaz, E.,Espinoza, P., Ledesma, J., Quesquén, R., Peraltilla, S., Chavez, F., 2008. Schoolingbehaviour and environmental forcing in relation to anchoveta distribution: ananalysis across multiple spatial scales. Prog. Oceanogr. 79, 164–277.
Bost, C.A., Cotté, C., Bailleul, F., Cherel, Y., Charassin, J.-B., Guinet, C., Ainley, D.G.,Weimerskirch, H., 2009. The importance of oceanographic fronts to marinebirds and mammals of the southern oceans. J. Mar. Syst. 78, 363–376.
Cayula, J.F., Cornillon, P., 1992. Edge detection algorithm for SST images. J. Atmos.Oceanic Technol. 9, 67–80.
Campagna, C., Piola, A.R., Rosa Marin, M., Lewis, M., Fernández, T., 2006. Southernelephant seal trajectories, fronts and eddies in the Brazil/Malvinas Confluence.Deep-Sea Res. I 53, 1907–1924.
Capet, X., Colas, F., McWilliams, J.C., Penven, P., Marchesiello, P., 2008. Eddies ineastern boundary subtropical upwelling systems. In: Hecht, M.W., Hasumi, H.(Eds.), Ocean Modeling in an Eddying Regime. Geophysical Monograph Series,vol. 177, pp. 131–147, AGU, Washington, D.C., USA, http://dx.doi.org/10.1029/177GM10.
Cotté, C., Park, Y.H., Guinet, C., Bost, C.A., 2007. Movements of foraging kingpenguins through marine mesoscale eddies. Proc. R. Soc. B 274, 2385–2391.
Crawford, R.J.M., Sabarros, P.S., Fairweather, T., Underhill, L.G., Wolfaardt, A.C., 2008.Implications for seabirds of a long-term change in the distribution of sardine:a South African experience. Afr. J. Mar. Sci. 30 (1), 177–184.
Davison, A.C., Hinkley, D.V., 1997. Bootstrap Methods and Their Application.Cambridge University Press, Cambridge.
Durski, S.M., Allen, J.S., 2005. Finite-amplitude evolution of instabilities associatedwith the coastal upwelling front. J. Phys. Oceanogr. 35, 1606–1628.
Evans, P.G.H., 1982. Associations between seabirds and cetaceans: a review.Mammal Rev. 12 (4), 187–206.
Fauchald, P., 2009. Spatial interaction between seabirds and prey: review andsynthesis. Mar. Ecol. Prog. Ser. 391, 139–151.
van Franeker, J., van den Brink, N., Bathmann, U.V., Pollard, R.T., de Baar, H.J.W.,Wolff, W.J., 2002. Responses of seabirds, in particular prions (Pachyptila sp.), tosmall-scale processes in the Antartic Polar Front. Deep-Sea Res. II 49,3931–3950.
P.S. Sabarros et al. / Deep-Sea Research II 107 (2014) 77–8484
Grémillet, D., Pichegru, L., Kuntz, G., Woakes, A.G., Wilkinson, S., Crawford, R.J.M.,Ryan, P.G., 2008. A junk-food hypothesis for gannets feeding on fishery waste.Proc. R. Soc. B 275, 1149–1156.
Hockey, P., Dean, W.R.J., Ryan, P.G., 2005. Roberts Birds of Southern Africa. JohnVoelker Bird Book Fund, Cape Town, South Africa.
Hyrenbach, K.D., Veit, R.R., Weimerskirch, H., Hunt, G.L., 2006. Seabird associationswith mesoscale eddies: the subtropical Indian Ocean. Mar. Ecol. Prog. Ser. 324,271–279.
Kooijman, S.A.L.M., 2010. Dynamic Energy Budget Theory for Metabolic Organisa-tion. Cambridge University Press, Cambridge.
Le Corre, M., Jaquemet, S., 2005. Assessment of seabird community of theMozambique Channel and its potential use as indicator of tuna abundance.Estuarine, Coastal Shelf Sci. 63, 421–428.
van der Lingen, C., Hutchings, L., Field, J.G., 2006. Comparative trophodynamics ofanchovy Engraulis encrasicolus and sardine Sardinops sagax in the southernBenguela: are species alternations between small pelagic fish trophodynami-cally mediated? Afr. J. Mar. Sci. 28 (34), 465–477.
Longhurst, A.R., 1998. Ecological Geography of the Sea. Academic Press, Amsterdam,Holland.
Manly, B.F.J., 2006. Randomization, Bootstrap and Monte Carlo Methods in Biology,third edition. Chapman and Hall/CRC, Boca Raton, FL, USA.
Nams, V.O., 1996. The VFractal: a new estimator for fractal dimension of animalmovement paths. Landscape Ecol. 11 (5), 289–297.
Nel, D.C., Lutjeharms, J.R.E., Pakhomov, E.A., Ansorge, I.J., Ryan, P.G., Klages, N.T.W.,2001. Exploitation of mesoscale oceanographic features by grey-headed alba-tross Thalassarche chrysostoma in the southern Indian Ocean. Mar. Ecol. Prog.Ser. 217, 15–26.
Nevitt, G.A., 2008. Sensory ecology on the high seas: the odor world of theprocellariiform seabirds. J. Exp. Biol. 211, 1706–1713.
Nevitt, G.A., 2000. Olfactory foraging by Antartic procellariiform seabirds: life athigh Reynolds numbers. Biol. Bull. 198, 245–253.
Nieto, K., 2009. Variabilidad oceánica de mesoescala en los ecosistemas deafloramiento de Chile y Canarias: una comparación a partir de datos satelitales.University of Salamanca, Salamanca, Spain (Ph.D. thesis).
Pauly, D., Christensen, V., 1995. Primary production required to sustain globalfisheries. Nature 374, 255–257.
Pedlosky, J., 1978. A nonlinear model of the onset of upwelling. J. Phys. Oceanogr. 8,178–187.
Phillips, R.A., Xavier, J.C., Croxall, J.P., 2003. Effects of satellite transmitters onalbatrosses and petrels. Auk 120 (4), 1082–1090.
Pichegru, L., Ryan, P.G., der Lingen, C.D.V., Coetzee, J., Ropert-Coudert, Y., Gremilllet, D.,2007. Foraging behaviour and energetics of Cape gannets Morus capensis feeding
on live prey and fishery discards in the Benguela upwelling system. Mar. Ecol.Prog. Ser. 350, 127–136.
Ropert-Coudert, Y., Grémillet, D., Ryan, P., Kato, A., Naito, Y., Le Maho, Y., 2004. Betweenair and water: the plunge dive of the Cape GannetMorus capensis. Ibis 146, 281–290.
Sabarros, P.S., Grémillet, D., Stenseth, N.C., Ryan, P.G., Machu, E., A critical assess-ment of area-restricted search methods to identify feeding activity in seabirdforaging movements (in preparation).
Sabarros, P.S., Ménard, F., Lévénez, J.-J., Tew-Kai, E., Ternon, J.-F., 2009. Mesoscaleeddies influence distribution and aggregation patterns of micronekton in theMozambique Channel. Mar. Ecol. Prog. Ser. 395, 101–107.
Seki, M.P., Polovina, J.J., Kobayashi, D.R., Bidigare, R.R., Mitchum, G.T., 2002. Anoceanographic characterization of swordfish (Xiphias gladius) longline fishinggrounds in the springtime subtropical North Pacific. Fish. Oceanogr. 11 (5),251–266.
Tew Kai, E., Rossi, V., Sudre, J., Weimerskirch, H., Lopez, C., Hernandez-Garcia, E.,Marsac, F., Garcon, V., 2009. Top marine predators track Lagrangian coherentstructures. Proc. Natl. Acad. Sci. USA 106 (20), 8245–8250.
Trathan, P.N., Bishop, C., Maclean, G., Brown, P., Fleming, A., Collins, M.A., 2008.Linear tracks and restricted temperature ranges characterise penguin foragingpathways. Mar. Ecol. Prog. Ser. 370, 285–294.
Tremblay, Y., Bertrand, S., Henry, R.W., Kappes, M.A., Costa, D.P., Schaffer, S.A., 2009.A review of analytical approaches to investigate seabird-environment interac-tions. Mar. Ecol. Prog. Ser. 391, 153–163.
Tremblay, Y., Roberts, A.J., Costa, D.P., 2007. Fractal landscape method: an alternativeapproach to measuring area-restricted searching behavior. J. Exp. Biol. 210, 935–945.
Votier, S.C., Bearhop, S., Witt, M.J., Inger, R., Thompson, D., Newton, J., 2010.Individual responses of seabirds to commercial fisheries revealed using GPStracking, stable isotopes and vessel monitoring systems. J. Appl. Ecol. 47,487–497.
Weimerskirch, H., 2007. Are seabirds foraging for unpredictable resources?Deep-Sea Res. II 54, 211–223.
Weimerskirch, H., Le Corre, M., Jaquemet, S., Potier, M., Marsac, F., 2004. Foragingstrategy of a top predator in tropical waters: great frigatebirds in theMozambique Channel. Mar. Ecol. Prog. Ser. 275, 297–308.
Weimerskirch, H., Le Corre, M., Ropert-Coudert, Y., Kato, A., Marsac, F., 2005. Thethree-dimensional flight of red-footed boobies: adaptations to foraging ina tropical environment? Proc. R. Soc. London B 272 (1558), 53–61.
Wilson, R.P., Putz, K., Peters, G., Culik, B., Scolaro, J.A., Charrassin, J.-B., Ropert-Coudert, Y., 1997. Long-term attachment of transmitting and recording devicesto penguins and other seabirds. Wildl. Soc. Bull. 25, 101–106.
Young, J.W., Bradford, R., Lamb, T.D., Clementson, L.A., Kloser, R., Galea, H., 2001.Yellowfin tuna (Thunnus albacares) aggregations along the shelf break offsouth-eastern Australia: links between inshore and offshore processes. Mar.Freshwater Res. 52, 463–474.