MARKET ANALYSIS OF MAJOR FISH PRODUCT MARKETS IN THE BENGUELA CURRENT LARGE MARINE ECOSYSTEM BCLME PROJECT LMR/SE/03/02 PRESENTED TO: BCLME Activity Centre for Living Marine Resources PRESENTED BY: ON BEHALF OF: Completed: December 2004 Updated: August 2006
Transcript
MARKET ANALYSIS OF MAJOR FISH PRODUCT MARKETS IN THE BENGUELA CURRENT LARGE
MARINE ECOSYSTEM
BCLME PROJECT LMR/SE/03/02
PRESENTED TO:
BCLME Activity Centre for Living Marine Resources
PRESENTED BY:
ON BEHALF OF:
Completed: December 2004
Updated: August 2006
__________________________________________________________________________ i BCLME Project LMR/SE/03/02 Market Analysis of Major Fish Product Markets in the BCLME
EXECUTIVE SUMMARY
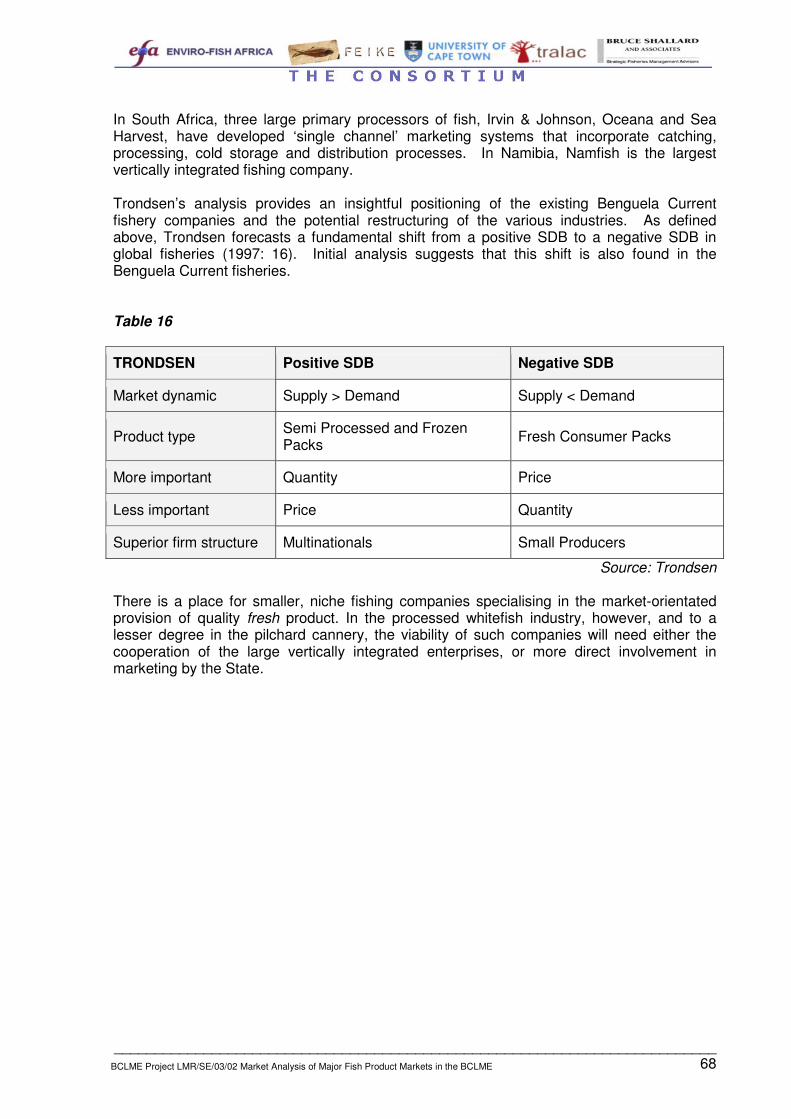
This report forms just one part of an integrated research effort on the BCLME fisheries being carried out by “The Consortium”. It is anticipated that, as the rest of the BCLME projects advance, new information relevant to this study will come to light. This is particularly true for project LMR/SE/03/03, for example. The Consortium wishes to reserve the right to update this marketing report if and when the relevant information becomes available. Most industries can increase the value of their turnover by increasing production. The fishing industry generally cannot; its sustainable annual harvest is limited and uncertain. This means that there are only three basic strategies available to increase total returns in the industry:
• Increase the sustainable harvest by letting depleted stocks recover,
• cut costs, or
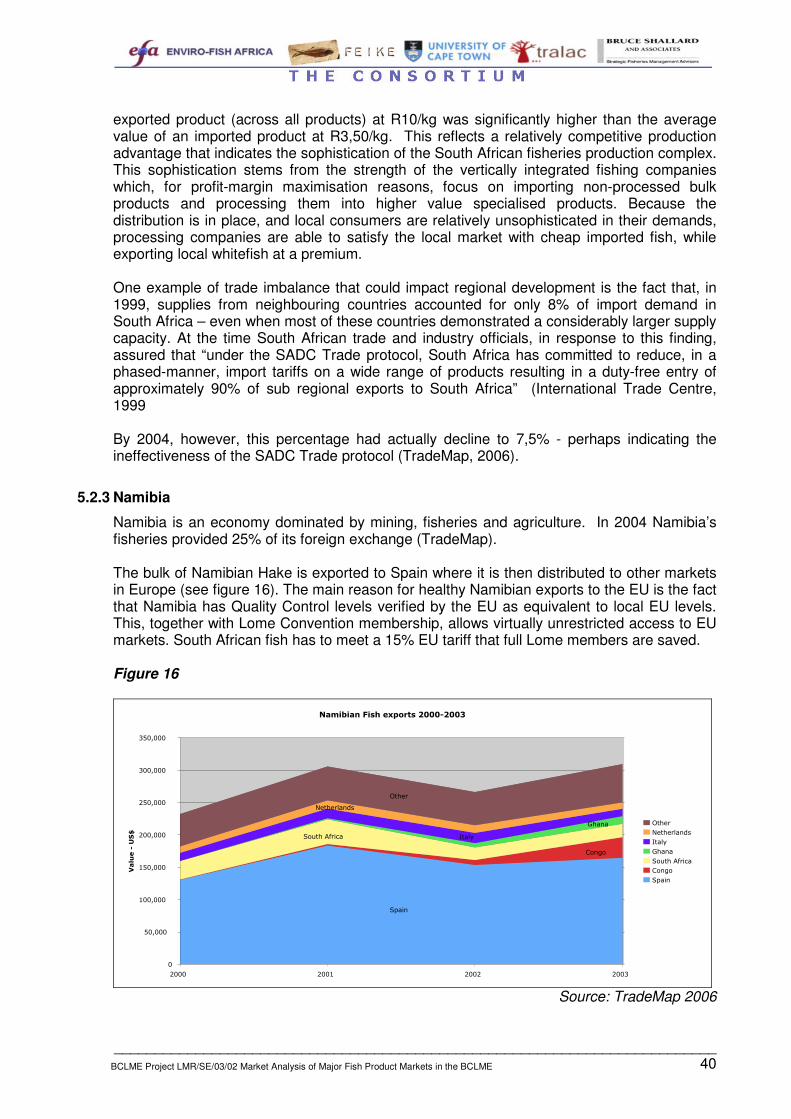
• add value. Some refinements can be added to these basic strategies:
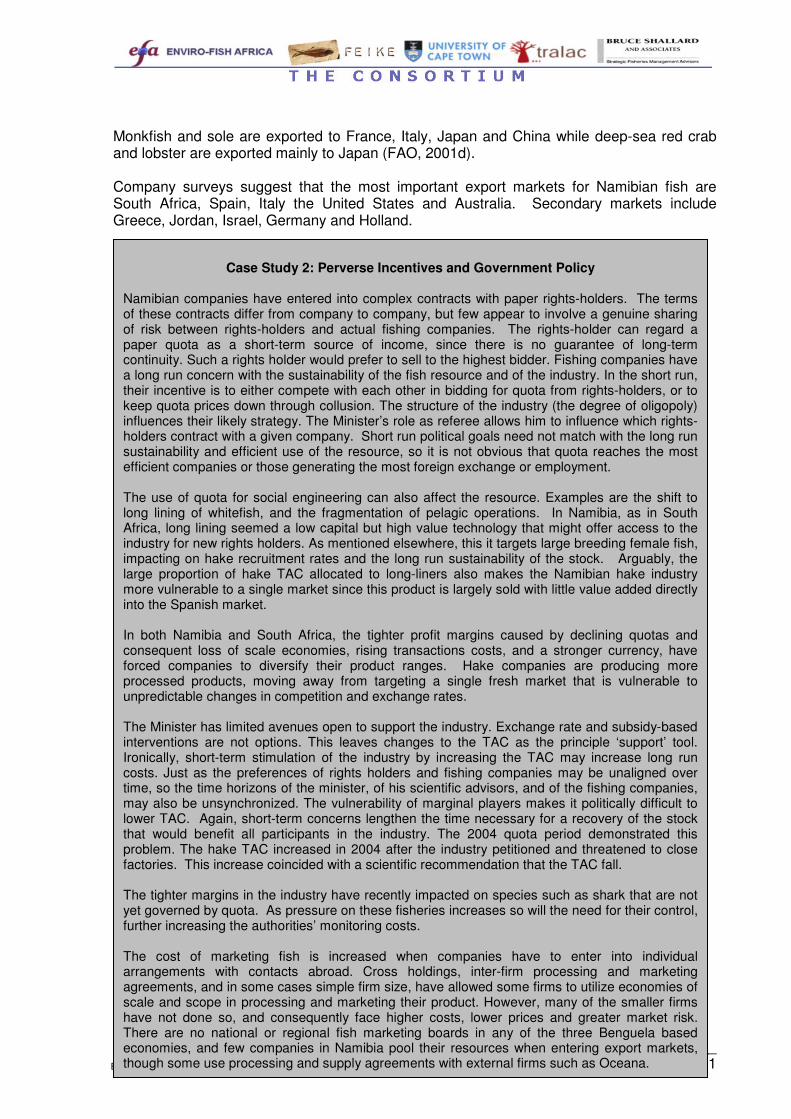
• the industry can lobby for improved international market access at preferential rates, or for tariff protection against imported substitutes,
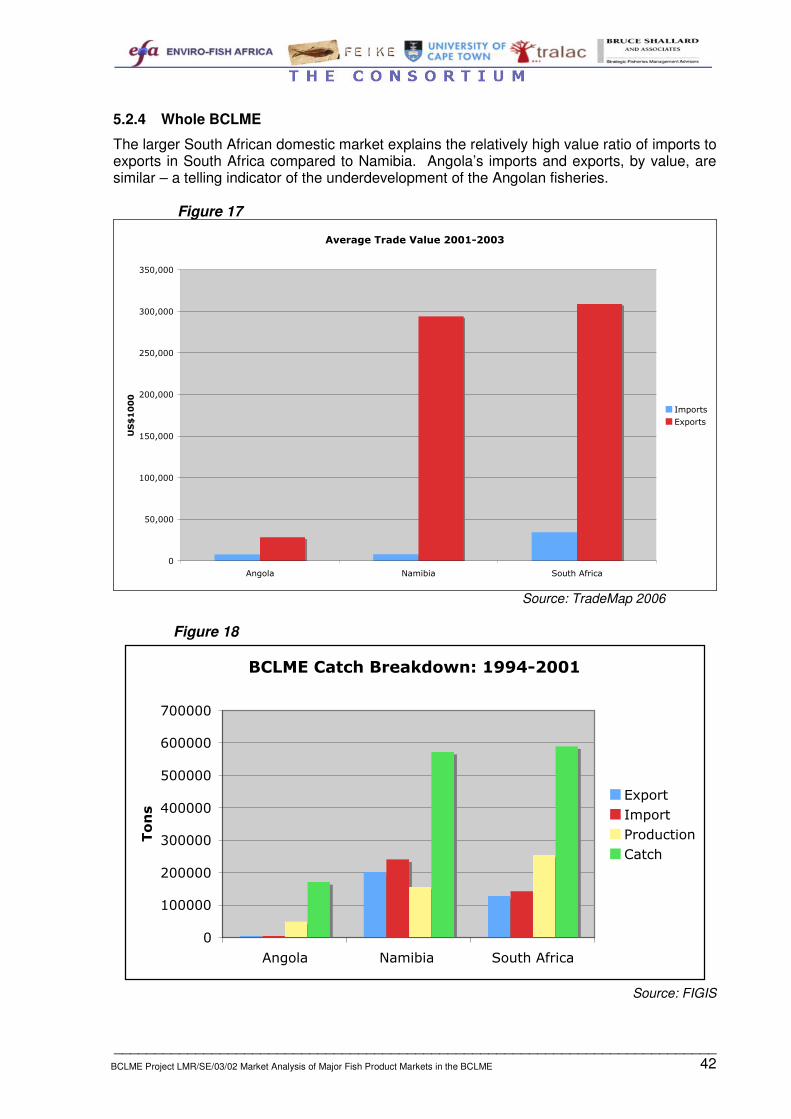
• TAC can be based of bio-economic models aimed at achieving optimal sustainable economic yield, or
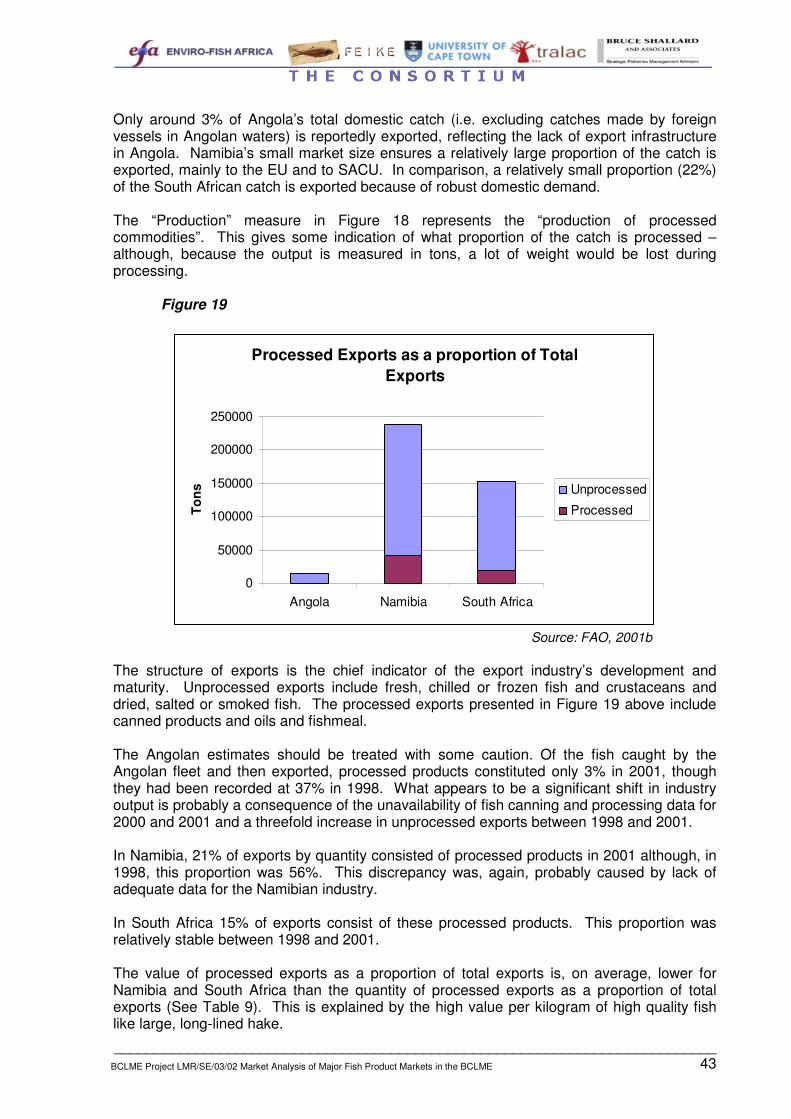
• quotas can be allocated for long periods and using Operational Management Procedures (OMPs).
Each of these strategies has implications for the marketing of fish products. The industry is a reciprocating system; infrastructure and quota constraints determine what value adding processes are most appropriate, and these in turn determine how the products should be marketed. Conversely, the market demand for specific products indicates the sort of processing needed and this in turn drives the effort directed at different branches of the industry. For this reason a marketing analysis has to appraise the fishing sector holistically. This report accordingly comments on the State interventions in areas such as such as infrastructure, labour, quota, interest rates and exchange rates. It also treats decision variables of the industry (gear, processing technology and branding) and market variables, particularly information on product quality and price. Successful marketing requires products tailored to meet the needs of consumers. Fish products are identified by their characteristics. Price is obviously one of these; others include species, size, quality, processing and additional content, food safety, ecological impact and packaging. These can be used to analyse the markets for the BCLME’s fish products. Some markets weight price above all else. The highly competitive African market for dried fish is an example. The product is largely dried horse mackerel, but includes a range of other species from shark to mullet. It not only competes against dried mackerel from West Africa but also against dried fish from Europe (Norway and Iceland are the world’s two largest producers of dried fish). This is a market in which firms from all three BCLME states participate, and in which small enterprises can use local knowledge and contacts to secure niche markets. At the other extreme, the world trade in hakes is an example of a market that involves a much broader set of product characteristics. Some act as barriers to entry (e.g. satisfying the
__________________________________________________________________________ ii BCLME Project LMR/SE/03/02 Market Analysis of Major Fish Product Markets in the BCLME
Hazard Analysis Critical Control Point System – HACCP, or the demands of the EU inspectorate). Quality aware commercial buyers also set detailed product specifications that can include minutiae of geographic origin, sub-species, catching technology and time taken before processing. How significant these are relative to price is not constant, but typically varies with the available supply of substitutes and the state of the global economy. Marketing such products is a skilled occupation and not one quickly learned. Nonetheless, it is the point at which firms either succeed or fail. This report concludes that traders with the skills and market experience needed to market high valued fish effectively are scarce. More importantly, their scarcity is an effective barrier to entry in the industry and is likely to remain so. It also found that there were only moderate scale economies in catching fish, but profound economies of scale and scope when processing and marketing them for ‘First World’ markets. In consequence the processing and marketing of these products is naturally oligopolistic. Small firms may catch fish, but joint processing and marketing arrangements would be necessary for them to participate more fully in the industry. The profits are at the higher levels of the value chain, and not in the actual fishing. If oligopoly control is not desired, the only feasible options are to establish a single channel marketing board, or for small firms to cooperate. An example of such cooperation, albeit in a much less sophisticated market, is the SA Inshore Fishing Association which was formed by fourteen fishmeal producers in South Africa and Namibia to coordinate and market their output. International standards associations help signal the characteristics of products intended for the world market. These standards include the US Department of Agriculture and the Food and Drug Administration, ISO ratings, HACCP, the EU inspectorate, and the South African Bureau of Standards. Sustainable harvesting and processing standards are increasingly recognised through eco-labelling which will be the subject of a separate report. Packaging is generally dictated by the demands of the buyer. Effectively, firms hoping to compete internationally must meet First World standards in harvesting and processing. Increasingly, such processing demands a smaller, more skilled and permanently contracted workforce, and is typically also more capital intensive. International standards are a particular problem in Angola. Although South African and Namibian firms have managed to satisfy international norms at their land-based processing plants, Angolan plants have had more difficulty. The country’s poor infrastructure and uncertainty of electricity supply partly explain the problem. The policy implications are complex and the recent abandonment of the E.U. – Angola fisheries agreement provide a pointer in this regard. Under the Law of the Sea, when a country lacks the domestic capacity to exploit its fisheries, its waters can be opened to foreign fleets. In the long run Angola’s oil wealth may be used to improve its infrastructure and train its labour force, allowing a greater measure of successful onshore whitefish processing. In the short-run, however, despite the country’s high level of unemployment, the successful marketing of Angolan hake is likely to depend on factory freezer-trawlers rather than land based processing. Catching, processing and marketing are interdependent functions, and State interference with any one of them will impact on the others. In South Africa and Namibia the authorities have tried to keep up employment in the industry. In particular they have used implicit and explicit incentives to keep land based processing of wet fish in place. It is clear, however, that the return on capital is greater when catch is processed at sea. This report argues that this intervention may have perverse outcomes, hindering recapitalisation and penalising small producers.
__________________________________________________________________________ iii BCLME Project LMR/SE/03/02 Market Analysis of Major Fish Product Markets in the BCLME
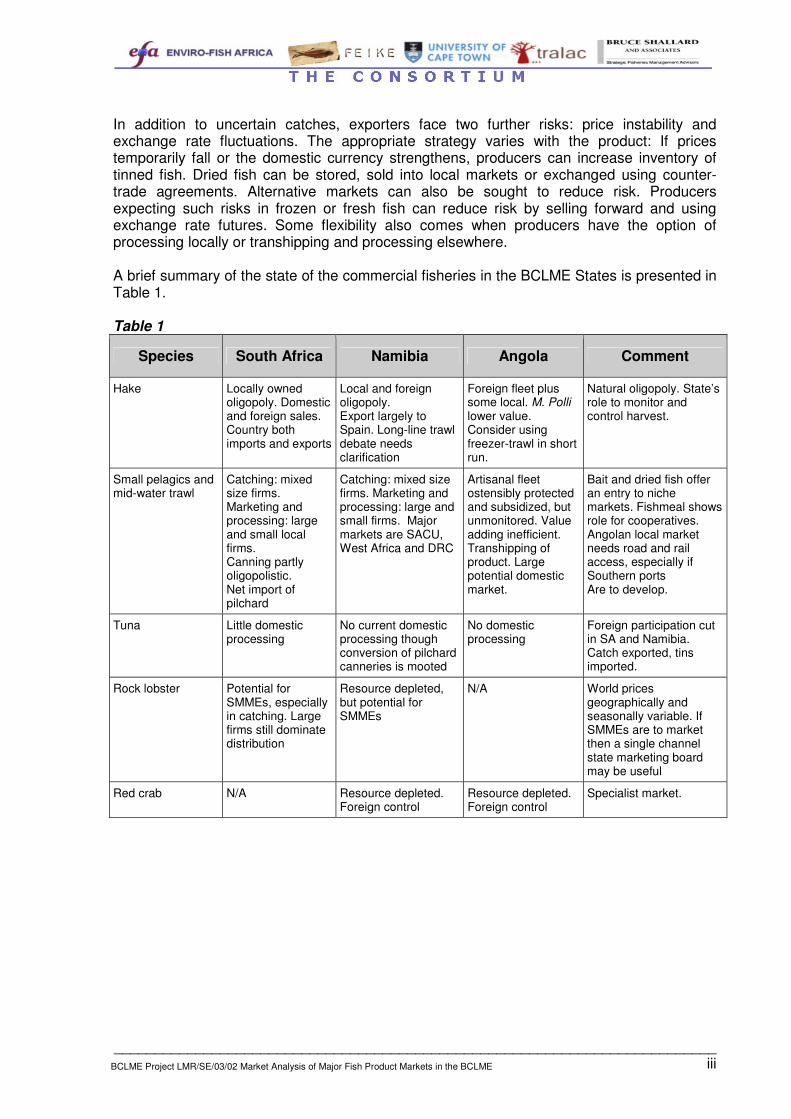
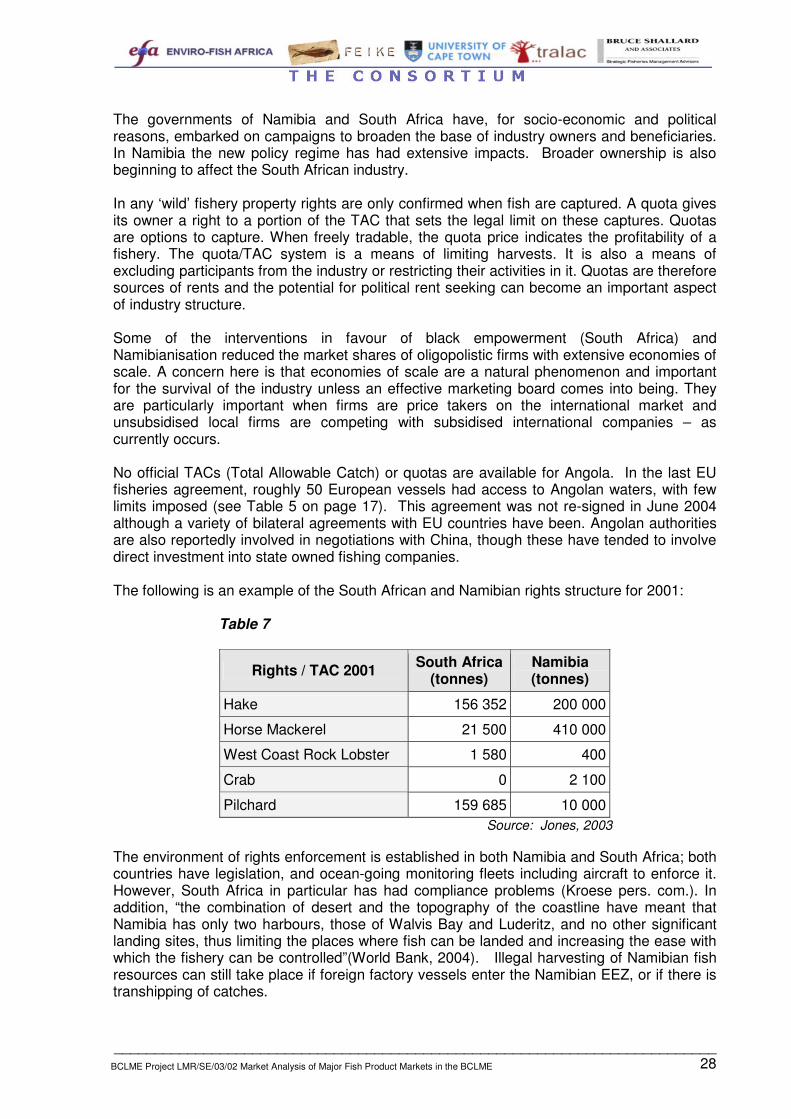
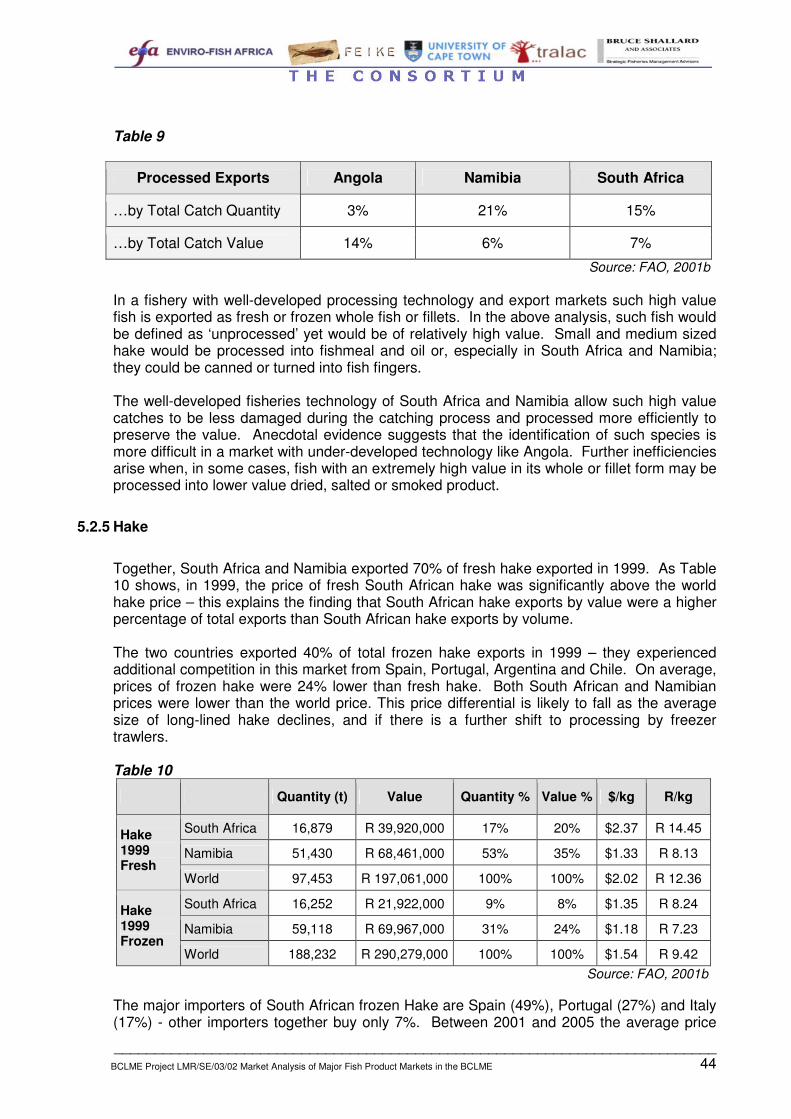
In addition to uncertain catches, exporters face two further risks: price instability and exchange rate fluctuations. The appropriate strategy varies with the product: If prices temporarily fall or the domestic currency strengthens, producers can increase inventory of tinned fish. Dried fish can be stored, sold into local markets or exchanged using counter-trade agreements. Alternative markets can also be sought to reduce risk. Producers expecting such risks in frozen or fresh fish can reduce risk by selling forward and using exchange rate futures. Some flexibility also comes when producers have the option of processing locally or transhipping and processing elsewhere. A brief summary of the state of the commercial fisheries in the BCLME States is presented in Table 1. Table 1
Species South Africa Namibia Angola Comment
Hake Locally owned oligopoly. Domestic and foreign sales. Country both imports and exports
Local and foreign oligopoly. Export largely to Spain. Long-line trawl debate needs clarification
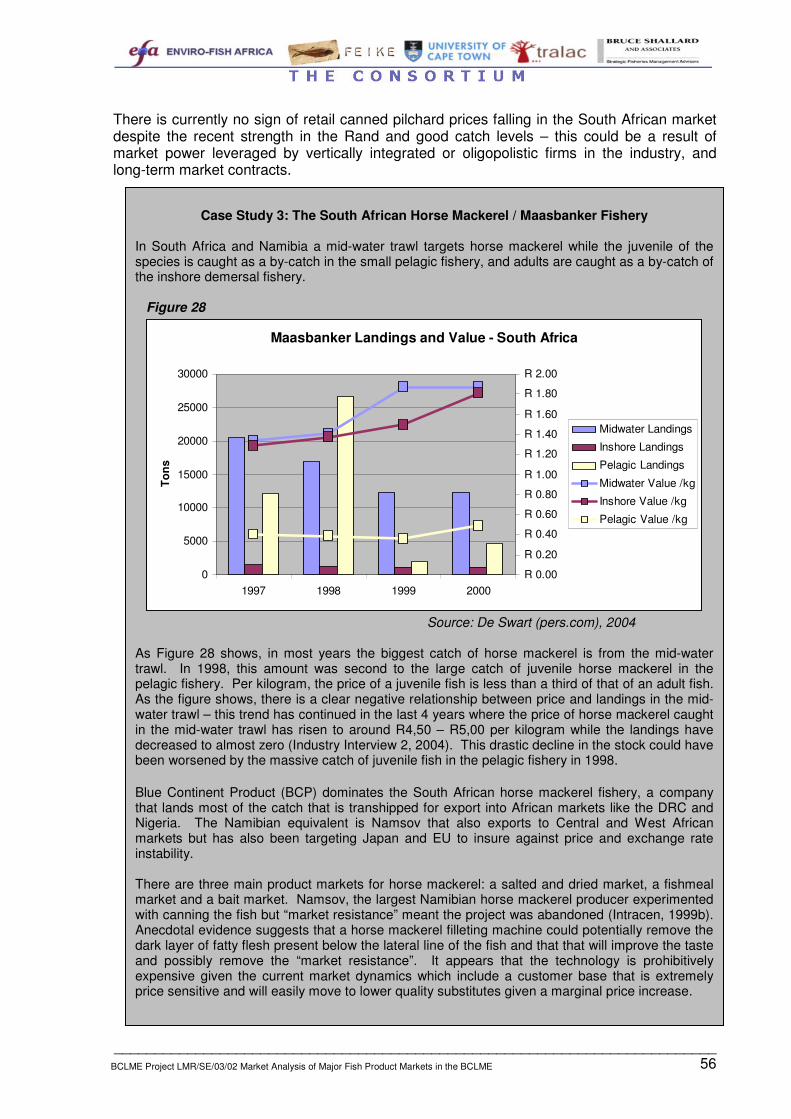
Foreign fleet plus some local. M. Polli lower value. Consider using freezer-trawl in short run.
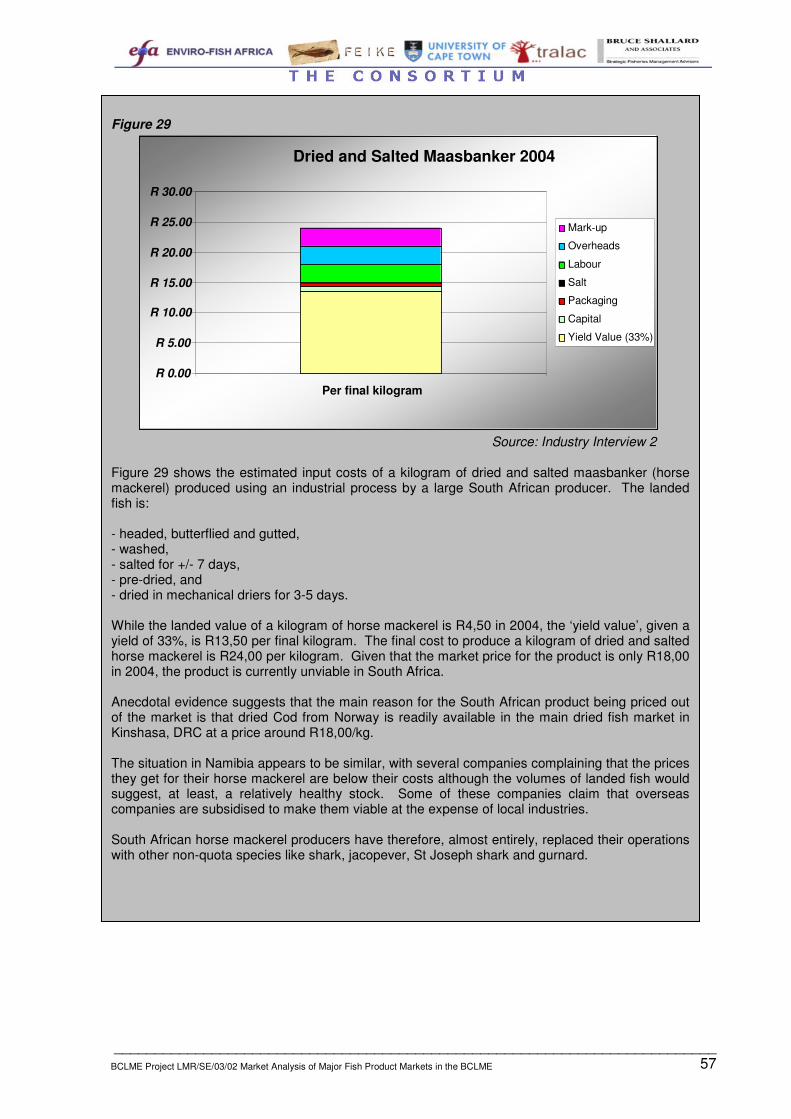
Natural oligopoly. State’s role to monitor and control harvest.
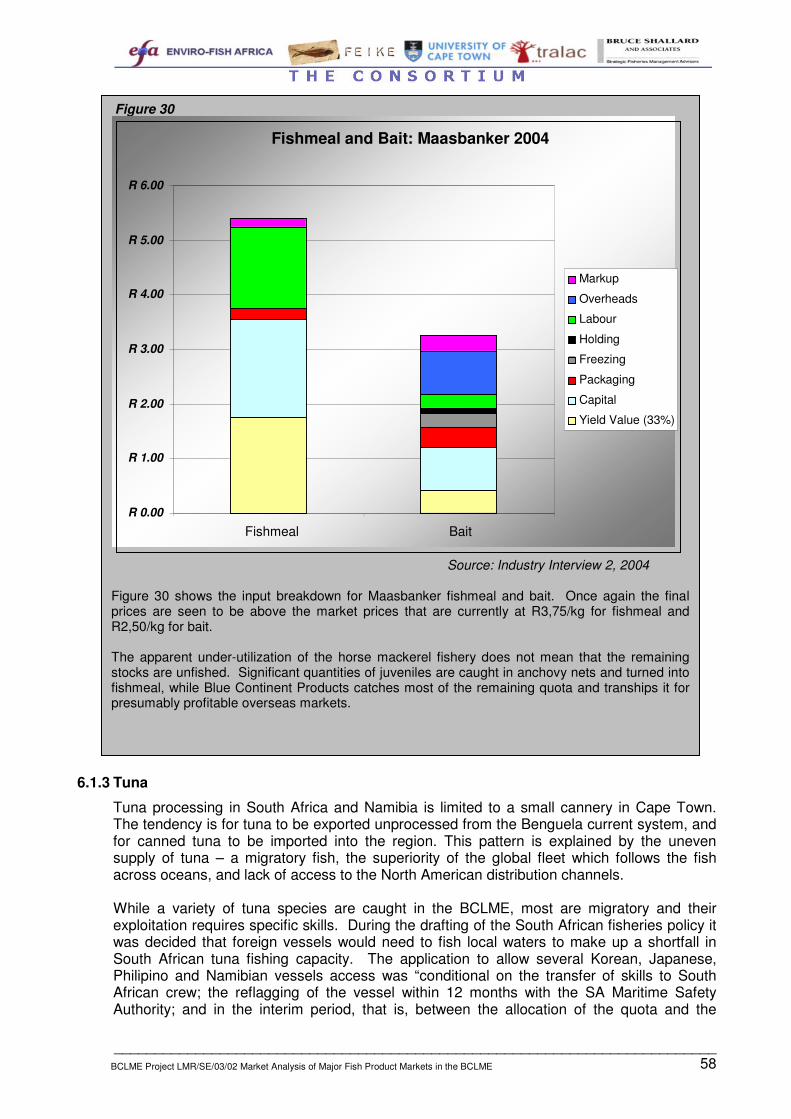
Small pelagics and mid-water trawl
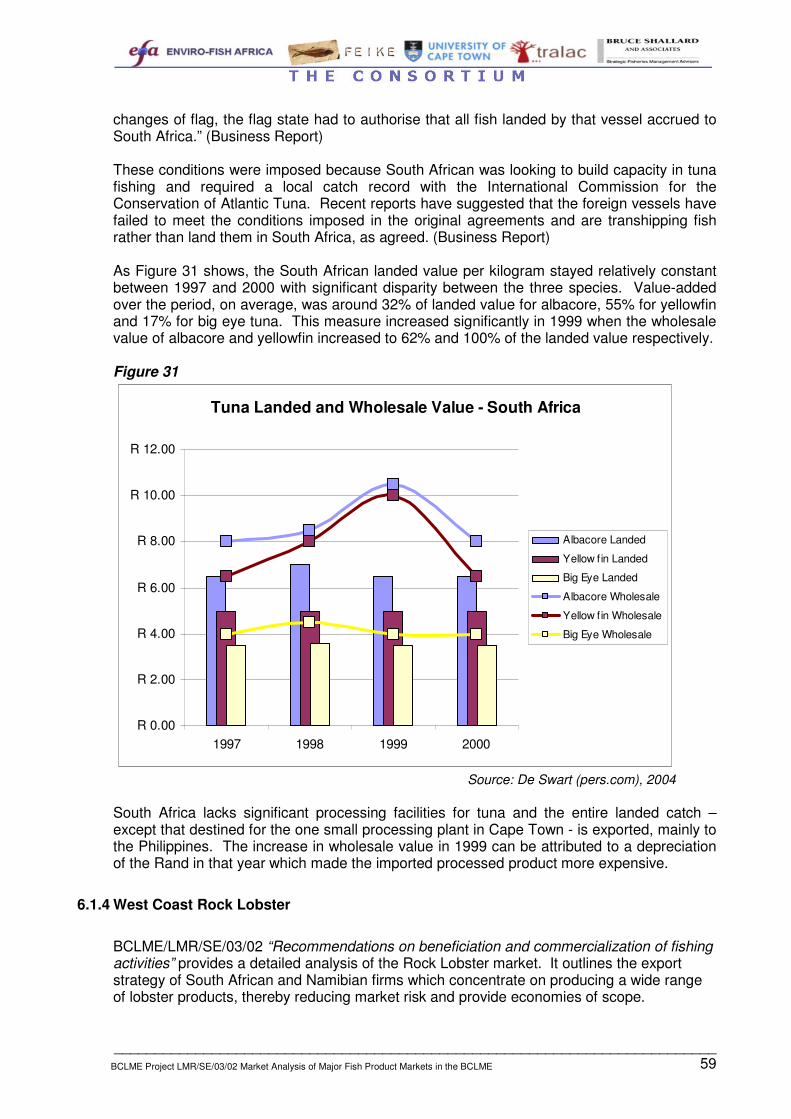
Catching: mixed size firms. Marketing and processing: large and small local firms. Canning partly oligopolistic. Net import of pilchard
Catching: mixed size firms. Marketing and processing: large and small firms. Major markets are SACU, West Africa and DRC
Artisanal fleet ostensibly protected and subsidized, but unmonitored. Value adding inefficient. Transhipping of product. Large potential domestic market.
Bait and dried fish offer an entry to niche markets. Fishmeal shows role for cooperatives. Angolan local market needs road and rail access, especially if Southern ports Are to develop.
Tuna Little domestic processing
No current domestic processing though conversion of pilchard canneries is mooted
No domestic processing
Foreign participation cut in SA and Namibia. Catch exported, tins imported.
Rock lobster Potential for SMMEs, especially in catching. Large firms still dominate distribution
Resource depleted, but potential for SMMEs
N/A World prices geographically and seasonally variable. If SMMEs are to market then a single channel state marketing board may be useful
3.3 Primary Sector Infrastructure: Vessels and Manpower................................... 13 3.3.1 South Africa .................................................................................................. 13
4 STRUCTURE........................................................................................................... 26 4.1 Industry Structure .............................................................................................. 26 4.2 Resource Rights Structure ................................................................................ 27 4.3 The Role of the State and its Effects................................................................. 29
5.3 Concentration and Market Power...................................................................... 46
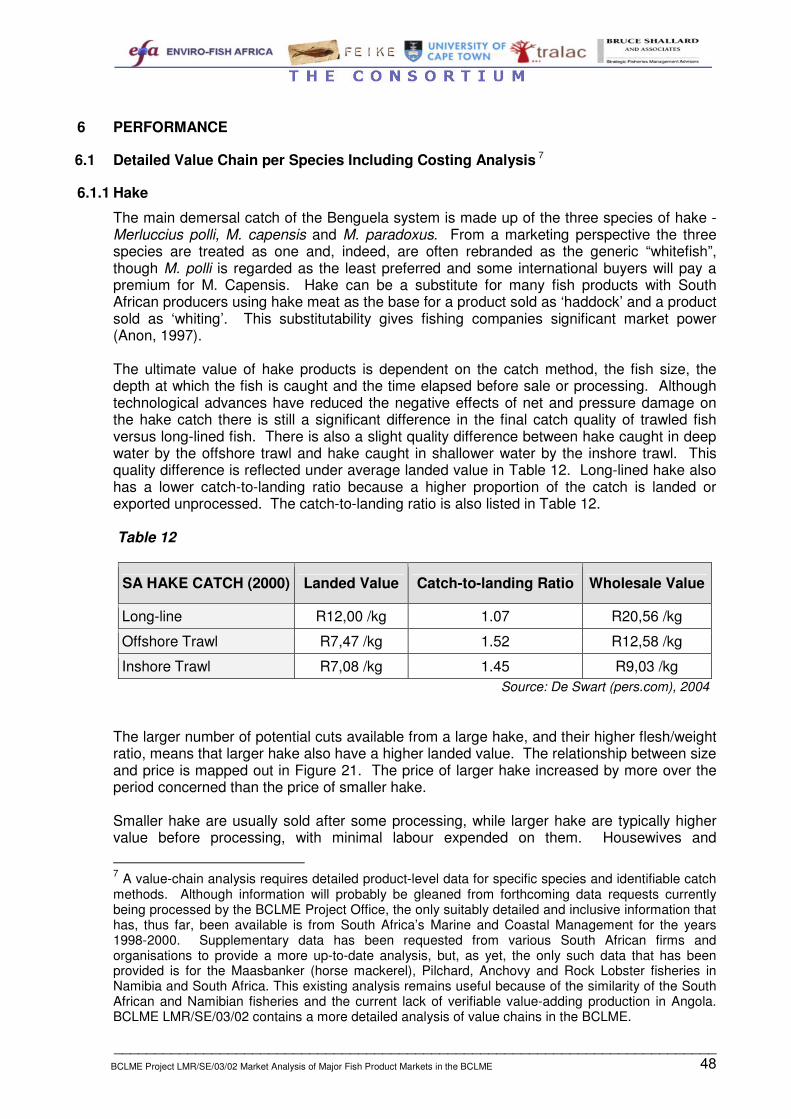
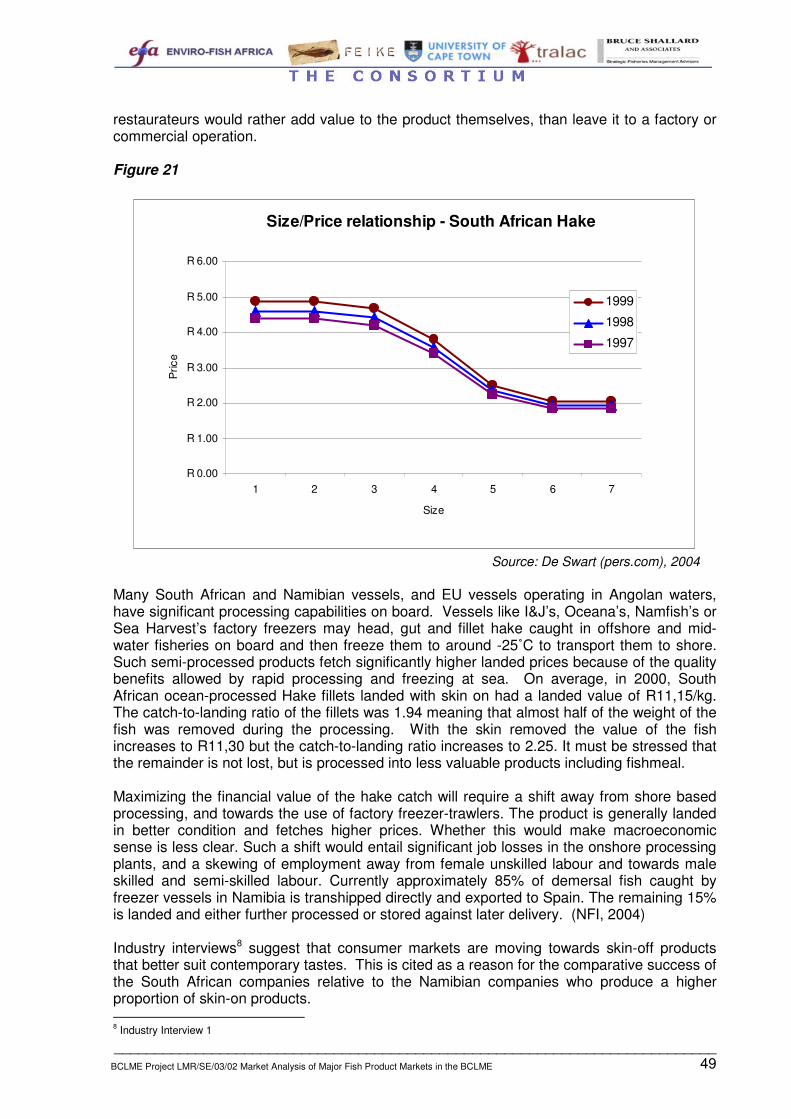
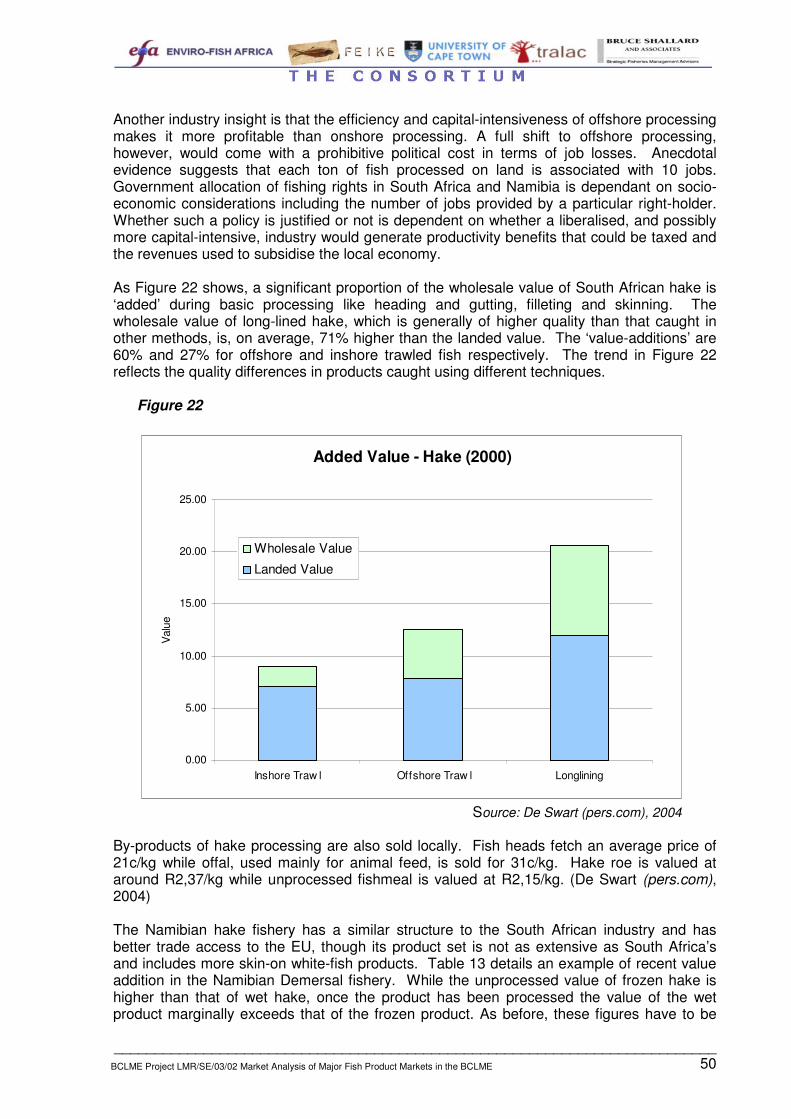
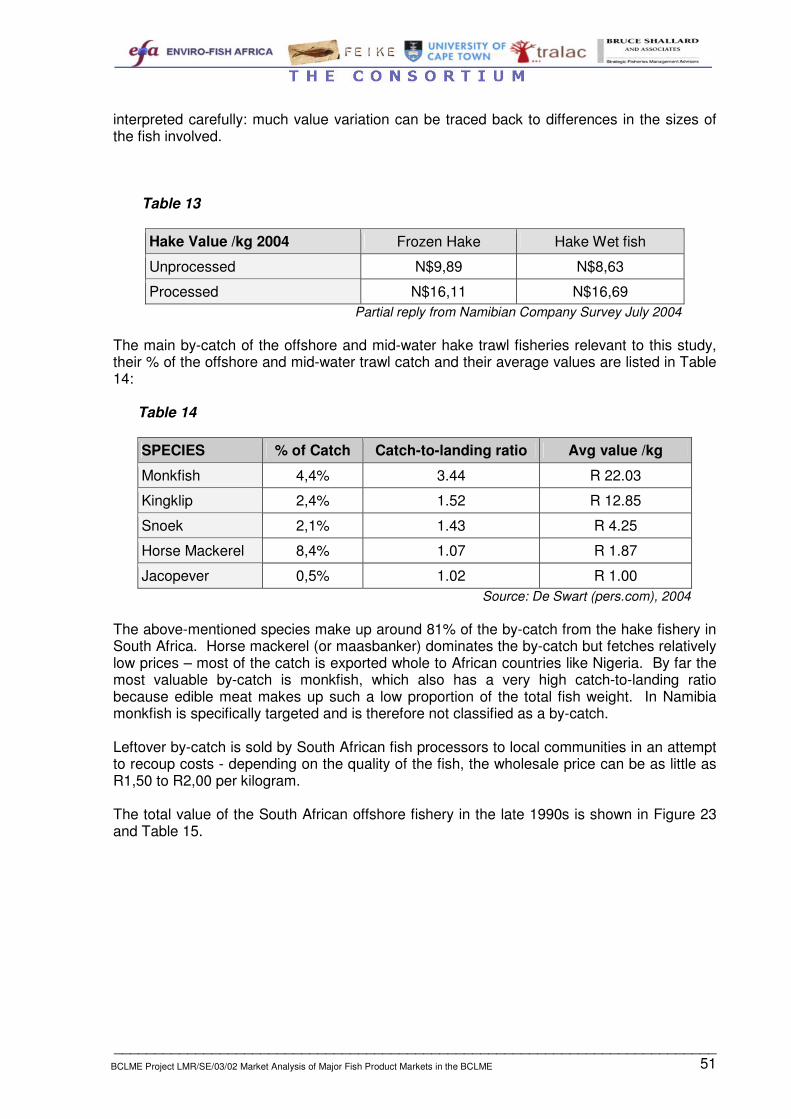
6 PERFORMANCE ..................................................................................................... 48 6.1 Detailed Value Chain per Species Including Costing Analysis ....................... 48
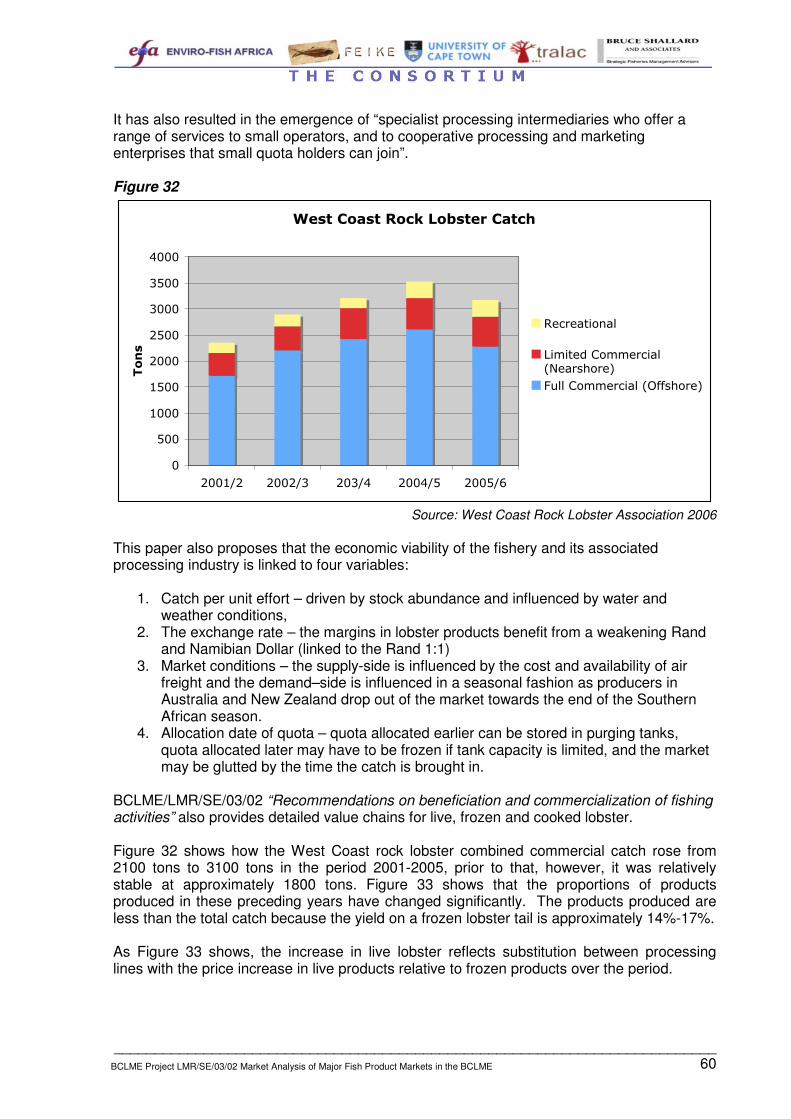
6.1.4 West Coast Rock Lobster ............................................................................. 59
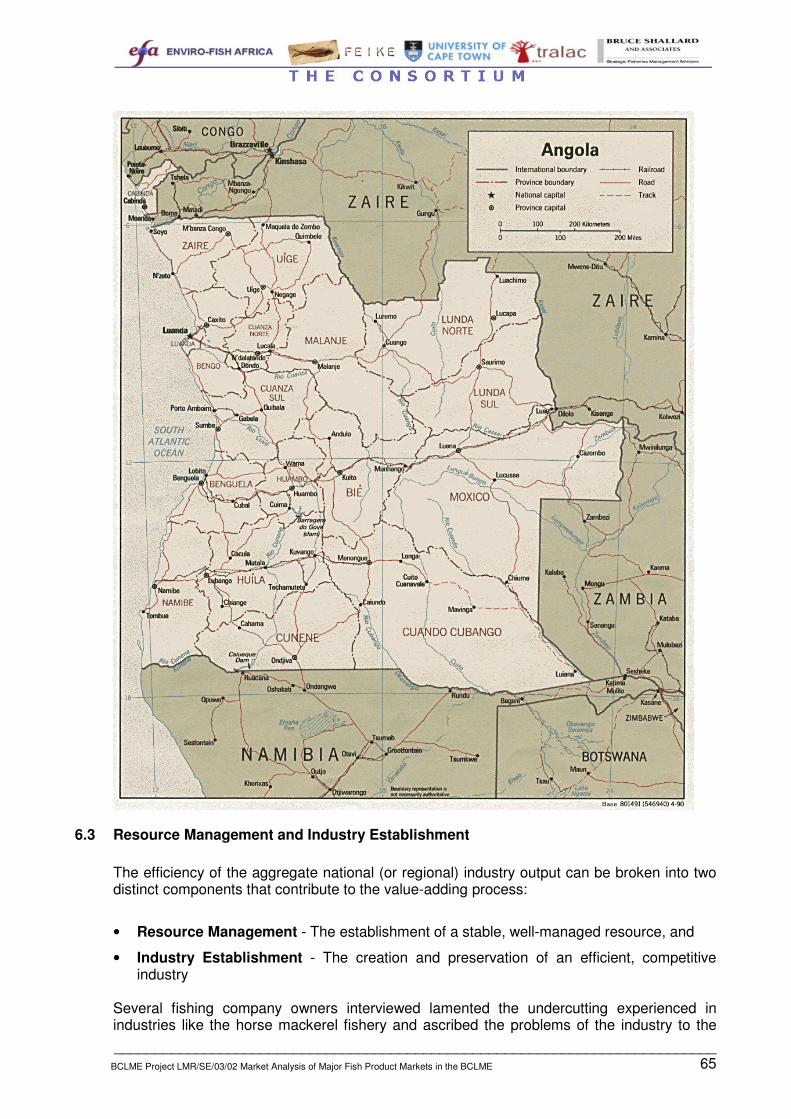
6.2 Fishing, Processing and Monitoring Capacity in Angola ................................ 63 6.3 Resource Management and Industry Establishment ....................................... 65 6.4 Marketing-orientated Value Adding and Supply-demand Balance ................. 66
__________________________________________________________________________1 BCLME Project LMR/SE/03/02 Market Analysis of Major Fish Product Markets in the BCLME
1 INTRODUCTION
The efficient utilisation of the resources of the Benguela Current requires established fish product markets with well-managed and reliable sources of supply, and stable demand. These are not sufficient in themselves. To maximise the returns from the resource the industry also needs cheap reliable access to these markets and sound infrastructural services. This report examines the current situation in Angola, Namibia and South Africa, and indicates where further efficiency gains exist. Despite strong global demand, and a relatively well-stocked source, the fish product markets of the Benguela Current have developed at different rates and their trade flows remain uneven. These asymmetries reflect current and historic inequalities in infrastructure, administration, market development and market access. The unstable political history in the region has raised the costs of doing business. This is especially true of the Angolan industry and, to lesser extent, of the industries in South Africa and Namibia. This situation has been worsened by the fishery being a shared resource, by inefficient market access and by the deterioration of processing facilities in Angola. Outside of South Africa, the internal market for fish and fish products in Southern and Central Africa is poorly developed and unsophisticated. Small domestic markets and a poor internal trade infrastructure have kept much of the Benguela fisheries driven by exports to Europe, West Africa and the DRC. Marketing is a complex activity, and one that enjoys substantial economies of scale. Nationally and regionally, local producers replicate information gathering costs - especially concerning overseas markets because there is no central marketing authority. The private sector’s response has been increasing oligopoly at the top of the processing and distribution system. The increased market concentration has occurred despite official attempts to introduce new participants into the fishing sector. Although new participants enter to catch the existing quota, the absence of an official single channel marketing system means that these small-scale operators are excluded from direct participation in lucrative foreign markets by information and marketing constraints. While fishing itself offers some scale economies, these are minimal when compared to those enjoyed by participants higher up the value chain. For this reason the market is likely to evolve into two distinct segments: at one extreme will be a small number of large, oligopolistic, vertically integrated, processing and marketing firms. These will attempt to maintain profits in a world market by cultivating strong brand identities. At the other extreme will be small processors providing basic and often undifferentiated (i.e. unbranded) products, for sale into competitive low-income African markets. In such markets price is the dominant factor, and profits can only be maintained by keeping costs down. The industry has been evolving steadily in response to market needs. Changes have also been driven by government interventions. Within the region these have often depended on the State’s political stance:
• A ‘market’ oriented administration aims to boost sustainable profitability in the industry by reducing uncertainty and lowering transactions costs. Strategies include: the use of operational management procedures (OMPs) to determine quota, a stable system of property rights and contract law to encourage rational investment strategies, minimal restrictions on firms with monopoly and monopsony powers, and a simple transparent tax regime.
__________________________________________________________________________2 BCLME Project LMR/SE/03/02 Market Analysis of Major Fish Product Markets in the BCLME
• An interventionist State would recognise the tendency for profits to accrue in the upper reaches of the value chain: i.e. marketing and distribution, rather than to the fishing community. Establishing an official single channel marketing system is a standard response; another is State involvement at the top of the value chain. This might maintain incomes among fishermen themselves, though this is far from certain (This approach was historically attempted in the South African rock lobster and fishmeal industries with conspicuous lack of success). Direct state participation in the industry - as currently occurs in Angola - is more problematic as it simply crowds out the private sector.
This paper stresses two key areas of intervention: in marketing, and in the technology used to harvest and process the catch. The implications of policy for narrowly defined economic efficiency on the one hand, and employment and income distribution on the other, are central to both. Each of the three States faces a choice – it can cultivate a lean efficient profitable fisheries sector, which can be taxed to yield revenues that provide employment and meet development objectives elsewhere in the system. Alternatively it can coerce the industry into a higher cost, less efficient, but more labour-using system. Despite these efficiency losses, this approach creates jobs directly and benefits those who have traditionally depended on the industry. In South Africa and Namibia certain firms, typically the largest and best established, have concentrated on developing broad product lines with strong and internationally recognised brand identities and standards. These firms have a consequent advantage over others in the industry. Steady supplies of stable quality fish and constant processing standards allow firms to deliver reliably. This reliability of quality and delivery is a prerequisite for marketing that maximises the value of fish harvested. Firms less well equipped to market their own product either have to utilise these companies as intermediaries (i.e. sell under another company’s label) or add less value when processing their catch, and sell it at lower prices in markets where product is differentiated more by price than by quality. Some of the larger firms have connections in Angola, but the conditions there are reportedly difficult for firms trying to process and market quality controlled product in a vertically integrated corporate structure. In order to capture some of the benefits of vertical integration some Angolan quota holders have effectively traded quota for a share in the revenues of joint ventures with European and Chinese firms. A point to stress is that foreign markets are not necessarily stable and profitable. The range of substitute products is greater, exchange rate risk is present, and consumer tastes fluctuate in the high value sector. These markets are also vulnerable to recession (when the premia paid for high quality products shrink). Large firms operating in the Southern African market, by contrast, are better able to influence local demand, and are more directly price makers with monopolistic powers in a more stable (if smaller) market. In terms of technology the debate covers two major areas: the first is the pros and cons of shore based processing of wet-fish as opposed to processing freshly caught fish on factory freezer-trawlers. The second is the economics of long lining as opposed to trawling. These are mentioned in this paper, but it must be stressed that detailed research on these issues has been published elsewhere (Japp, D. 1995 &1996, Japp and Steenkamp 2004). This issue also spills into management. Companies that convert all their fish into basic homogeneous products such as fishmeal or hake portions have limited incentive to manage the resource. By contrast, those that process their catch into a range of products are affected by the fish population’s age and geographic distribution. Such firms may accept lower catches per unit effort (CPUE) in order to achieve higher values. Conservation and
__________________________________________________________________________3 BCLME Project LMR/SE/03/02 Market Analysis of Major Fish Product Markets in the BCLME
management of the resource is certainly affected by the amount of quota issued, but also by the pattern of its allocation and the lifetime of the rights.
__________________________________________________________________________4 BCLME Project LMR/SE/03/02 Market Analysis of Major Fish Product Markets in the BCLME
2 APPROACH
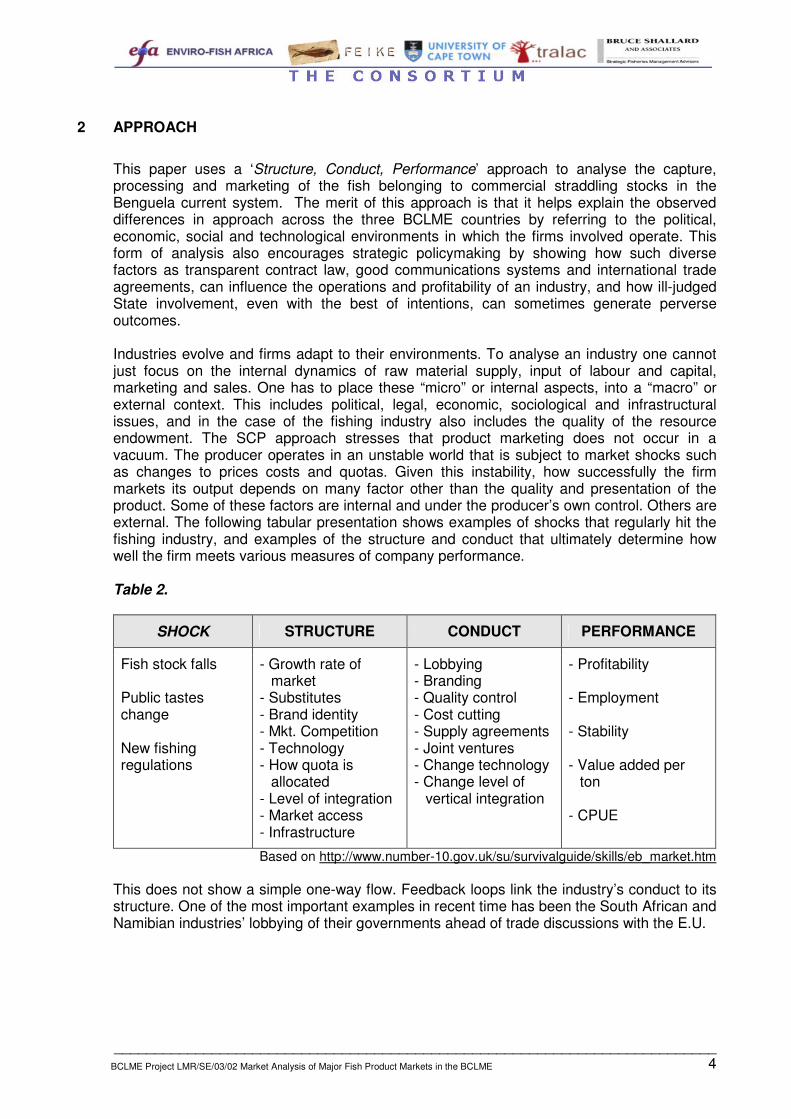
This paper uses a ‘Structure, Conduct, Performance’ approach to analyse the capture, processing and marketing of the fish belonging to commercial straddling stocks in the Benguela current system. The merit of this approach is that it helps explain the observed differences in approach across the three BCLME countries by referring to the political, economic, social and technological environments in which the firms involved operate. This form of analysis also encourages strategic policymaking by showing how such diverse factors as transparent contract law, good communications systems and international trade agreements, can influence the operations and profitability of an industry, and how ill-judged State involvement, even with the best of intentions, can sometimes generate perverse outcomes. Industries evolve and firms adapt to their environments. To analyse an industry one cannot just focus on the internal dynamics of raw material supply, input of labour and capital, marketing and sales. One has to place these “micro” or internal aspects, into a “macro” or external context. This includes political, legal, economic, sociological and infrastructural issues, and in the case of the fishing industry also includes the quality of the resource endowment. The SCP approach stresses that product marketing does not occur in a vacuum. The producer operates in an unstable world that is subject to market shocks such as changes to prices costs and quotas. Given this instability, how successfully the firm markets its output depends on many factor other than the quality and presentation of the product. Some of these factors are internal and under the producer’s own control. Others are external. The following tabular presentation shows examples of shocks that regularly hit the fishing industry, and examples of the structure and conduct that ultimately determine how well the firm meets various measures of company performance. Table 2.
SHOCK STRUCTURE CONDUCT PERFORMANCE
Fish stock falls Public tastes change New fishing regulations
- Growth rate of market
- Substitutes - Brand identity - Mkt. Competition - Technology - How quota is
allocated - Level of integration - Market access - Infrastructure
- Profitability - Employment - Stability - Value added per
ton - CPUE
Based on http://www.number-10.gov.uk/su/survivalguide/skills/eb_market.htm This does not show a simple one-way flow. Feedback loops link the industry’s conduct to its structure. One of the most important examples in recent time has been the South African and Namibian industries’ lobbying of their governments ahead of trade discussions with the E.U.
__________________________________________________________________________5 BCLME Project LMR/SE/03/02 Market Analysis of Major Fish Product Markets in the BCLME
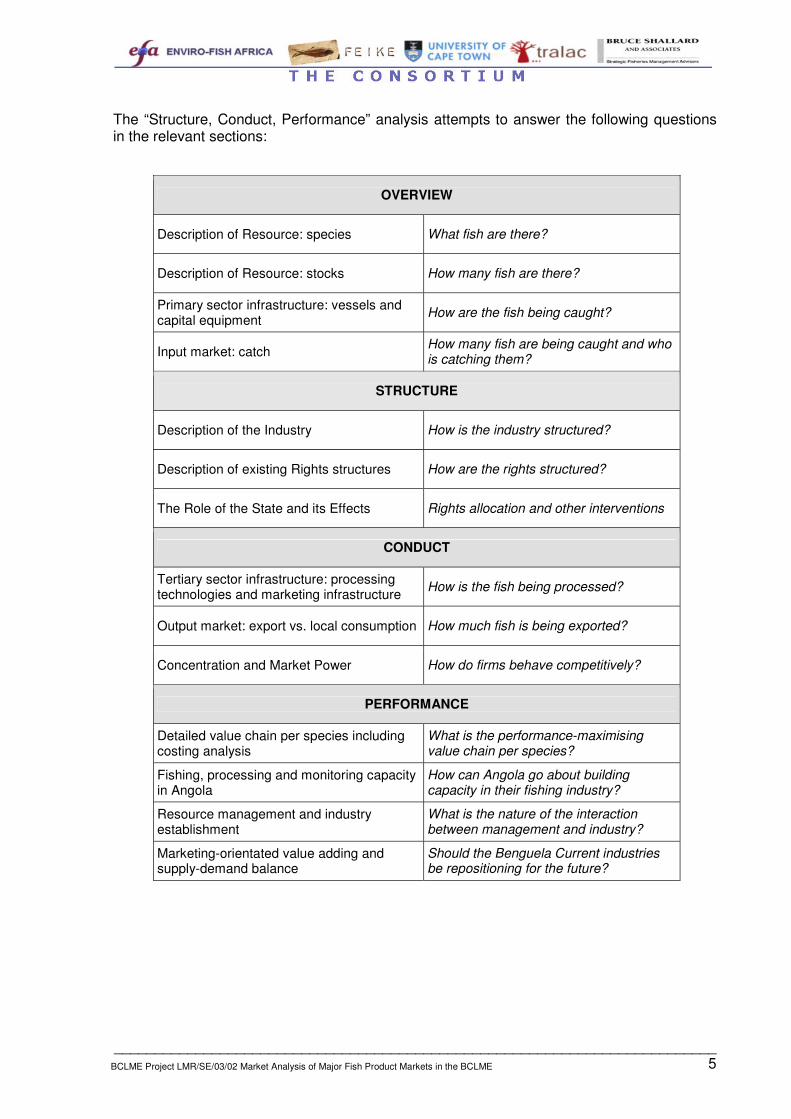
The “Structure, Conduct, Performance” analysis attempts to answer the following questions in the relevant sections:
OVERVIEW
Description of Resource: species What fish are there?
Description of Resource: stocks How many fish are there?
Primary sector infrastructure: vessels and capital equipment How are the fish being caught?
Input market: catch How many fish are being caught and who is catching them?
STRUCTURE
Description of the Industry How is the industry structured?
Description of existing Rights structures How are the rights structured?
The Role of the State and its Effects Rights allocation and other interventions
CONDUCT
Tertiary sector infrastructure: processing technologies and marketing infrastructure How is the fish being processed?
Output market: export vs. local consumption How much fish is being exported?
Concentration and Market Power How do firms behave competitively?
PERFORMANCE
Detailed value chain per species including costing analysis
What is the performance-maximising value chain per species?
Fishing, processing and monitoring capacity in Angola
How can Angola go about building capacity in their fishing industry?
Resource management and industry establishment
What is the nature of the interaction between management and industry?
Marketing-orientated value adding and supply-demand balance
Should the Benguela Current industries be repositioning for the future?
__________________________________________________________________________6 BCLME Project LMR/SE/03/02 Market Analysis of Major Fish Product Markets in the BCLME
3 OVERVIEW
3.1 Resource Description - Species1
The commercial contribution of the Benguela Current Large Marine Ecosystem rests on a few species - many of which are either straddling or fugitive stocks. This market analysis regards only those that are currently commercially viable. It breaks the fisheries of the BCLME into four sections: small pelagic, hake, crustacean and large pelagic (tuna). These make up the bulk of the commercial contribution from the Benguela Current fisheries.
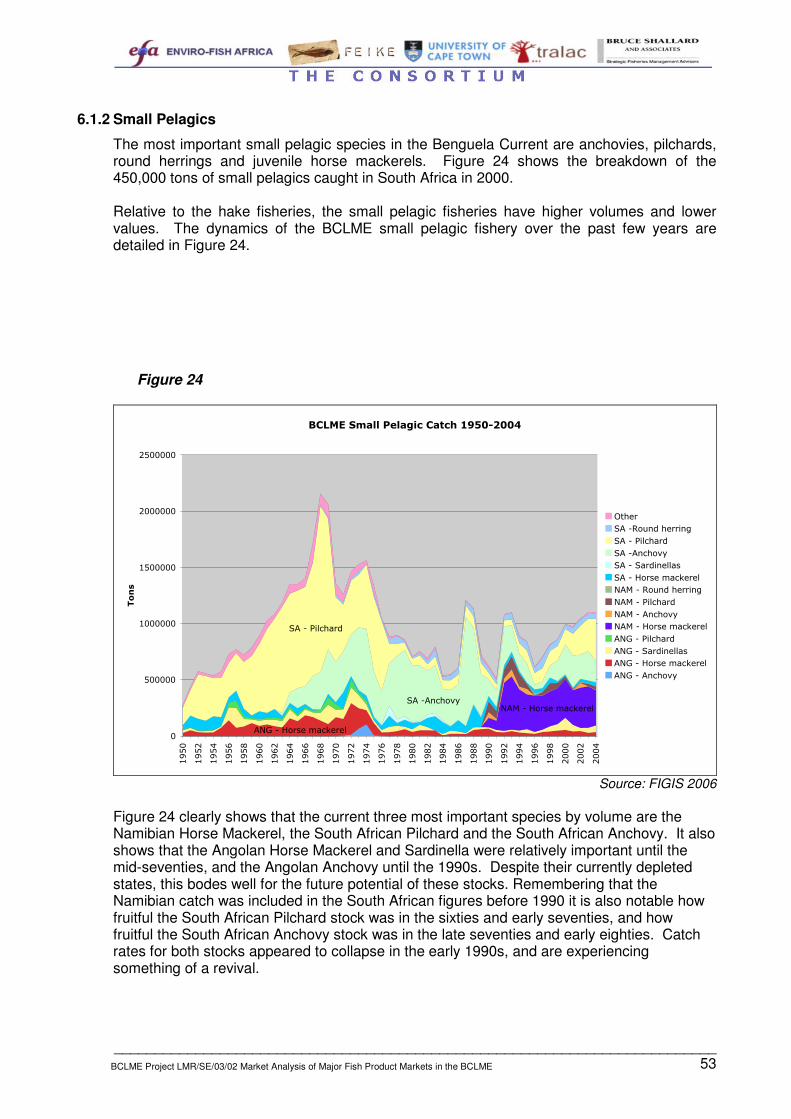
3.1.1 Small pelagic – Purse seine
Anchovies (Engraulis japonicus and Engraulis capensis) and pilchards (or sardines) (Sardinops sagax) in the BCLME are part of two distinct stocks, one off northern/central Namibia and the other off the Western Cape. Both species are mainly caught by purse seine. “Sardine tend to live within about 50 km of the coast, and are often found close inshore, both in South African and Namibian waters. Anchovy have a similar coastal distribution, but are commonly found more than 100 km offshore on the Agulhas Bank off the Cape South Coast in the spawning season.” (Hampton et al, 2000: 8) Round sardinella (Sardinella aurita) and flat sardinella (Sardinella maderensis) are shared by Namibia and Angola and are also caught by purse seine. “They are found along the entire Angolan coastline, with the juveniles inshore, predominantly in the north… (where) both species undertake extensive spawning migrations along the Angolan coast” (ibid. p8). Juvenile Cape (Trachurus capensis) and Cunene (Trachurus trecae) horse mackerel, up to twenty centimetres long, are also caught as part of the various ‘small pelagic’ fisheries. Both are found in Namibian and Angolan waters and the Cape horse mackerel is also found in South African waters. Round herring or redeye (Etrumeus whiteheadi) is a by-catch of the small pelagic fisheries in South Africa and Namibia.
3.1.2 Horse mackerel - Mid-water trawl
Cape (Trachurus capensis) and Cunene (Trachurus trecae) horse mackerel are targeted in a mid-water trawl. The former are mostly caught in mid-water trawls off Namibia, and as a by-catch in hake bottom trawls off South Africa (ibid. p9). Cape horse mackerel exist in two distinct stocks off northern Namibia/southern Angola, and off the Western Cape. Similarly, Cunene horse mackerel occurs in two separate stocks, one off the north, and the other off the south of Angola. The connections between these two pairs of stocks are still being researched.
3.1.3 Hake – Bottom trawl and long-line
There are three main hake species caught in the Benguela Current ecosystem. The Deepwater Cape hake (Merluccius paradoxus) and the Shallow-water Cape hake (Merluccius capensis) are found off the coast of all three countries. The Deepwater Benguela hake (Merluccius polli) is only caught off Namibia and Angola. Although the fishing grounds of Southern Namibia are shared with South Africa, it is not certain that the South African hakes and those in Namibia north of Luderitz form a true straddling stock.
1 Section 3.1 is informed, in its entirety, by Hampton et al, 2000.
__________________________________________________________________________7 BCLME Project LMR/SE/03/02 Market Analysis of Major Fish Product Markets in the BCLME
Many important species are caught as a by-catch of hake. Dentex (Dentex macrophthalmus) and jacopever (Helicolenus dactylopterus) are caught off all three countries while monkfish (Lophius spp), kingklip (Genypterus capensis), snoek (Thyrsites atun) and West Coast sole (Austroglossus microlepis) are mainly caught off South Africa and Namibia. A limited fishery in Namibia specifically targets monkfish.
3.1.4 Crustacean – Trawl / trap
Deep sea red crab (Chaceon maritae) is trapped or trawled off Namibia and Angola and West Coast rock lobster (Jasus lalandi) is trapped off South Africa and Namibia. “It has recently been shown from tagging studies that adult C. maritae females migrate from Namibia to Angola, suggesting a single stock in the region, which needs to be managed jointly by Namibia and Angola” (p11).
3.1.5 Tuna – Pole and line / long-line
Various offshore large pelagic species are caught in the Benguela Current ecosystem. These form large, highly migratory fugitive/straddling stocks that cross the borders of many countries, and even oceans. Of these the most important are the yellowfin tuna (Thunnus albacares) caught off all three countries, and the bigeye tuna (Thunnus obsesus) and albacore tuna (Thunnus alalunga), mainly caught off South Africa and Namibia. The Benguela tuna fisheries are managed in line with the International Commission for the Conservation of Atlantic Tunas (ICCAT).
3.2 Resource Description – Stocks In South African waters stocks have been assessed and managed, and catch and effort monitored for many years. The main stocks are in reasonable condition and the OMP system appears to be working well. Prior to independence the Namibian fishery was effectively uncontrolled - the country’s territorial waters only ran to the 3-mile limit set under the League of Nations mandate. Post independence the country followed world precedent and initiated a 200-mile EEZ, but stocks remain under pressure. Strict monitoring and control measures are in place. Fish stocks off Angola are only marginally monitored and relatively unmanaged. Foreign involvement remains a feature: bilateral agreements with EU governments (although the multilateral EU fishing agreement is now defunct) and joint management agreements with European (especially Spanish) firms are an increasing feature. China is also becoming a major participant in such agreements - in its drive to gain access to natural resources China has courted Angola, recent agreements have involved fish as well as oil and other minerals. Various mechanisms are used to assess the stock level of a particular fishery: Virtual Population Analysis, acoustic, trawls and aerial surveys and catch-based analytical methods can provide biomass estimates. Nonetheless, stock assessment is an imperfect art, and surveys are expensive. Where the interests of the industry and the managers are seen to be congruent, the industry itself becomes an instrument of stock estimation. Details of species, size, depth, location and catch per unit effort (CPUE) become even more important when official research funds are strained. If quotas are to be fine-tuned to maximise sustainable yields, there will be a growing need for responsible catch reporting. More importantly, these returns will need to be submitted and processed rapidly. The E.U. fleet off Angola made this particularly difficult, as did the foreign vessels off Namibia before it declared its 200-mile
__________________________________________________________________________8 BCLME Project LMR/SE/03/02 Market Analysis of Major Fish Product Markets in the BCLME
EEZ. Though E.U. vessels were obligated to keep and submit records, there are widespread anecdotal reservations about the quality of these records. There is scope for scientists working on the BCLME to pool data when estimating the size of straddling stocks. Currently the surveys in South Africa and Namibia are run independently, though they do use similar methodologies. More importantly, there are currently annual Benguela stock assessment workshops at which research and estimates are coordinated and debated. From an economic perspective, modelling inputs go beyond market factors such as fuel costs, exchange rates and product prices; estimates of future harvests and their opportunity costs are also required. For this reason, if modelling is to really add value, the current single species approach will have to be replaced by multi-species modelling. The total annual catch is a weak measure of stock size, though it may be an indicator of the remaining stock. For example, as Figure 7 shows, the aggregated total yield of the Benguela fishery peaked at over 3 million tons in the late Seventies, declining to a level of around 1 million tons in the early nineties, and recovering somewhat to around 1,5 million tons in the late nineties. Catch per unit effort (CPUE) is probably a better indicator, while the age distribution of the annual catch is a useful leading indicator for long-lived species. In the following section page references are to Hampton et al (2000), all other material is from the Fishing Industry Handbook (various years).
3.2.1 Small pelagic and mid-water trawl
Surface shoaling (i.e. pelagic) fish lend themselves to purse seine harvesting. The purse-seine fisheries in South Africa and Namibia predominately target sardine (pilchard), anchovy, and horse mackerel, but red-eye and lantern fish are also caught. Processing is done on-shore, and finished products for both the domestic and export markets include canned fish, frozen fish, fishmeal and fish body oil. The commercial pelagic industry in Southern Africa emerged in the 1940s when Rock Lobster canneries tried to diversify away from a collapsing French crawfish market. The companies were encouraged by the wartime demand for canned food, the high price of meat, and subsequently by financial support from the Fisheries Development Corporation (established in 1944). Factories were set up along the West Coast, particularly at St Helena Bay and Saldanha Bay, and reduction plants were imported from California. The first canning factory in Namibia was set up in Walvis Bay in 1947. The spectacular collapse of the Californian resource led South African authorities in 1950 to introduce closed seasons and place restrictions on the building of new reduction plants, and in 1953 restrictions were placed on the building of new canneries. Despite this, processing capacity increased (partly thanks to improved efficiency) and closed seasons were often overridden. By 1962 the pilchard stock in South Africa had collapsed, and the industry began targeting anchovy and increasingly fishing in Namibian (then South West Africa) waters. In South Africa the current seven canneries and freezing plants and ten reduction plants are all at least 40 years old – reflecting the continued over-capacity problems in the industry and its initial unsustainable expansion. The Namibian pilchard stock was severely exploited by foreign vessels (including South African factory ships), and has not recovered since independence, despite low (and sometimes zero) TACs. This collapse has occurred in both the Southern and Northern Benguela pilchard stocks. The South African sardine stock recovered in the 1990s, despite
__________________________________________________________________________9 BCLME Project LMR/SE/03/02 Market Analysis of Major Fish Product Markets in the BCLME
the industry’s targeting of anchovy (which have pilchard as by-catch) In recent years shoals seem to have shifted from the West to the South Coast and the resource has declined. The recovery of the South African pilchard stock has allowed broader access to the resource. Although a number of empowerment companies have entered the processing side of the industry, many new rights holders concentrate only on catching, and sell their catch to existing processors. The industry is vulnerable to the effects of a reduction in TAC, particularly because a number of operators are marginal concerns and increased attention is being paid to eliminating paper quota holders. The switch from anchovy back to sardine has increased the potential for extracting higher value-added oil, and focusing on quality rather than volumes. The current management procedure in South Africa is based on a joint pilchard and anchovy quota, the allocation being topped up mid-way through the season should the resource justify it. This is partly based on the difficulty of allocating quota to a species that is prone to large natural fluctuations. The Namibian government’s efforts to broaden access have been impeded by the perilous state of the sardine stock. The collapse of the Namibian sardine population provides a telling example of the instability resulting from fishing pressures interacting with natural population perturbations. Estimated stocks fell from 11 million tons in 1964 to only a few thousand tonnes in the summer of 1995/1996 and catches remain at historically low levels. Despite limited access to Angolan and South African fish, the pilchard canning industry in Namibia is now effectively mothballed. The South African experience is different: though the stock was historically badly depleted, acoustic surveys of South African waters showed increases in spawner biomass from “below 50,000 tonnes in 1984 to around 600,000 tonnes in (2000)” (ibid. p34). Surveys suggest that “sardinella biomass has increased from levels of around 200,000 tonnes in the 1980s to more than double this in the 1990s. (This increase was probably at least partly due to the withdrawal of a major part of the distant-water foreign fleet in the late 1980s)” (ibid. p36). In South Africa in 1989 there were 7 quota holders with rights to both anchovy and pilchard, 6 to only anchovy, and one to only pilchard. The total TAC for pilchard in 1989 was 27,000 tons plus a 3,000 ton bait quota, and for anchovy 350,000 tons. The largest pilchard allocation was 6,000 tons, and the largest anchovy allocation 46,570 tons. By 2003 approximately 82 quota holders had rights to pilchard and anchovy, and 18 to pilchard alone. The TAC for pilchard was approximately 250,000 tons, and for anchovy just over 200,000 tons. The largest pilchard quota holder had 23,850 tons, and the largest anchovy allocation was 13,680 tons. To put this into perspective, the Southern African Customs Union (SACU) market was estimated at 7,5 million cartons per annum in 1999. This would require a raw pilchard catch of roughly 140,000 tons (Intracen 1999b). Unfortunately the stock declined sharply in the period 2004-2006, and the TAC was cut by 47% in the 2006 season. In 2003 a levy of R42/ton was charged on edible pelagics, and R11/ton on industrial pelagics. Prior to Namibian independence there were 9 pilchard quota holders sharing a total TAC of 43,000 in 1989. The largest quota holder had an allocation of 7,892 tons, while the smallest allocation was of 1,000 tons. A decade later in 2000 22 rights-holders had access to a share of a TAC of 25,000 tons It was still set at this level in 2004 and 2005. The fishery closed in 2003 and it seems likely that it will be closed again for the 2006/7 season. The industry remains extremely depressed, processing capacity has been closed down, and operators have targeted non-quota species. This stock decline also impacts on state
__________________________________________________________________________10 BCLME Project LMR/SE/03/02 Market Analysis of Major Fish Product Markets in the BCLME
revenues. In addition to tax on profits operators pay a fund levy on edible pilchards on industrial pilchards (N$62.50/ton and N$25/ton respectively in 2003). In addition quota fees of N$110/ton on Namibian boats and N$165/ton on foreign boats are levied There is also a mid-water trawl industry that targets horse mackerel (maasbanker). Population measurements have fluctuated widely in the past twenty years. In Angola, Cape and Cunene horse mackerel populations alike were measured at around 250,000 tonnes in 1989. Surveys in 2000 showed that the former had almost doubled to around 400,000 tonnes and the latter had fallen to around 50,000. “The biomass of adults and juveniles combined off Namibia and southern Angola… generally fell between 1 and 2 million tonnes” (ibid. p39). The FAO report that the Namibian horse mackerel stock size is growing steadily. The total horse mackerel catch in 2000 was 344,314 tonnes In 2000 Namibia had Twenty-six mid-water trawlers in the 62-120 m length range, a large proportion of which were foreign flagged, though at least 8 of these were wholly owned by Namibian nationals, but kept eastern-bloc crews (FAO. 2002). Horse mackerel are targeted in South Africa’s mid-water trawl fishery. Currently (2004) there are 17 rights holders sharing a quota of 15,750 tons. Until recently a large Russian trawler catching for a number of quota holders dominated the fishery, but a large trawler has superseded this vessel owned by one of South Africa’s largest fishing companies. The size of the mid-water trawl fleet is variable, with some of the hake trawl catching capacity being used to catch horse mackerel when circumstances permit.
3.2.2 Hake
Survey estimates show that hake populations in Namibia and South Africa have been on a slight upward trend over the last 20 years – although anecdotal evidence suggests a decline in catch rate and increasing proportions of small fish in the population. Merluccius paradoxus biomass is estimated at around 200,000 tonnes in both countries while the Merluccius capensis biomass is around 600,000 tonnes for South Africa and around 300,000 tonnes for Namibia. The Namibian stock currently seems less healthy than the South African. Catch per unit effort has been falling in Namibia; long-line yields in 2003/2004 were down to roughly 50g per hook, as opposed to the 300g to 500g per hook being bought in by South African long-liners. (Japp D. Pers com Nov 2004) The combination of long-lining and trawling raises concerns in terms of current management systems. Hake in Angola, South Africa and Namibia is caught by bottom trawl, and to a lesser extent by long lining. Long-lined hake is landed wet (on ice) and sold whole or headed and gutted. Trawled hake can be sold headed and gutted, whole, filleted, made into value-added fish products, or white fishmeal. In addition hake by-catch can also be headed and gutted. Trawled hake can be landed wet (iced) or processed and frozen offshore. The optimal processing path depends on the size and quality of the fish, and on the technology used to catch it. There were 11 deep-sea hake quota holders in South Africa in 1989 sharing a TAC of 122,605 tons. The largest operator had a TAC of 53,386 tons and the smallest 240 tons. When the medium term allocations came out in 2003 there were 52 trawl right holders sharing a TAC of 126,687 tons and approximately 140 long-line rights holders entitled to 10,318 tons. The largest trawled TAC was 44,819 and the smallest 364 tons. All but three of the long-lining allocations were less than 100 tons. The largest allocation was 719 tons. There was a levy of R165/ton in 2003 on both trawled and long-lined hake. In addition a license fee per vessel is charged. This fee is a sliding scale, but all boats greater than 20m paid R1 260 in 2002.
__________________________________________________________________________11 BCLME Project LMR/SE/03/02 Market Analysis of Major Fish Product Markets in the BCLME
Overall the number of rights holders has increased from 43 in 1999 to 79 in 2006. The TAC for hake was introduced in 1978 at a level of around 140,000 tons. Since then it gradually increased to a level of around 160,000 in 2001. In 2004 the South African hake industry was awarded the Marine Stewardship Council (MSC) standard for sustainable fisheries – this reflected the perceived healthy state of the stock. Concerns about the above-mentioned declines in catch rate and average size, however, led to a cut in 2005’s TAC from 161,000 to 158,000 tons. In 2006 the TAC was further reduced to 150,000 tones and another 8000-ton reduction is expected in 2007. The Namibian hake quota in 1989 of 52,100 tons was shared between 15 operators. The largest had a quota of 20,000 tons and the smallest 500 tons. The total quota was initially cut after independence, and has increased with the recovery of the stock. In 1991 newcomers were allocated 9,000 tons out of a total of 60,000 tons. By 2001 the hake TAC had increased to 200,000 tons shared between 38 rights holders. The largest allocation was just under 26,000 tons, and the smallest just over 1,000 tons. In 2003 the TAC was reduced to 180,000 tons through to 2005. Earlier this year the 2006 quota for Namibian hake was set below 140 000 tons for the next two seasons and will be revised only if the average size of hake improves significantly. At the announcement of the new quotas, the fisheries and marine resources minister Abraham Lyambo announced that
the low and unpredictable nature of stock indicates that something had changed in the Benguela ecosystem and a reasonable level of pilchard must be detected before total allowable catches can be set.” He also said that too many foreign vessels were exploiting the mid-water trawl sector, and that "only one foreign chartered vessel will be licensed at any one time per right holder and greater management controls will be introduced for foreign chartered vessels. (Business Report)
The Namibian levy and quota system is designed to influence industry conduct. The system distinguishes between wet and frozen fish and provides an incentive to land and process wet fish, and to increase the Namibia composition of the fleet. The quota fee in 2003 for foreign freezer caught fish was N$1450 per ton landed and just N$550 per ton for a Namibian owned vessel. A Namibian owned vessel pays N$300 per ton if the fish is caught wet, and this is reduced by N$200 if the fish is processed in Namibia. At the margin, the market is willing to pay well above these amounts, especially for freezer vessel quota (see section 4.2 of this report). Vessels deemed Namibian owned also have a greater chance of getting a 10-year right (as opposed to a four or seven year right). Operators also pay a research levy on the amount of catch. In 2003 this ranged from N$45 for whole hake to N$112.50 for filleted hake. Finally, operators are liable to fines based on the by-catch they land. Further incentive to wetfish processing is provided by the by-catch allowance. Wetfish processors are allowed up to 4% monkfish and kingklip before being penalized, Freezer-trawlers, on the other hand, are penalized once by-catch exceeds 2%.
3.2.3 Crustaceans
Recent modelling estimates put the stock of West Coast Rock Lobster in Namibia at approximately 3,000 tonnes.
“Assessments of the South African rock lobster resource based on conventional size-based analyses have shown it to be seriously depleted,
__________________________________________________________________________12 BCLME Project LMR/SE/03/02 Market Analysis of Major Fish Product Markets in the BCLME
estimates of recruitment in recent decades being only some 35% of pristine” (p41).
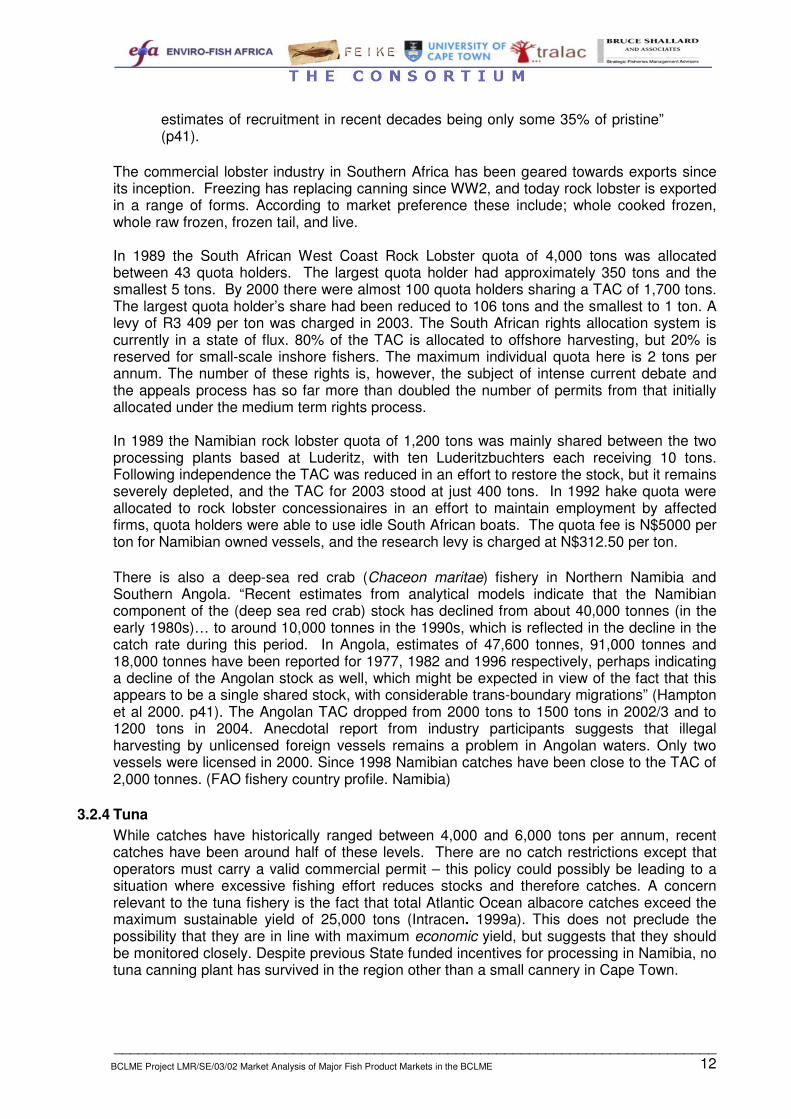
The commercial lobster industry in Southern Africa has been geared towards exports since its inception. Freezing has replacing canning since WW2, and today rock lobster is exported in a range of forms. According to market preference these include; whole cooked frozen, whole raw frozen, frozen tail, and live. In 1989 the South African West Coast Rock Lobster quota of 4,000 tons was allocated between 43 quota holders. The largest quota holder had approximately 350 tons and the smallest 5 tons. By 2000 there were almost 100 quota holders sharing a TAC of 1,700 tons. The largest quota holder’s share had been reduced to 106 tons and the smallest to 1 ton. A levy of R3 409 per ton was charged in 2003. The South African rights allocation system is currently in a state of flux. 80% of the TAC is allocated to offshore harvesting, but 20% is reserved for small-scale inshore fishers. The maximum individual quota here is 2 tons per annum. The number of these rights is, however, the subject of intense current debate and the appeals process has so far more than doubled the number of permits from that initially allocated under the medium term rights process. In 1989 the Namibian rock lobster quota of 1,200 tons was mainly shared between the two processing plants based at Luderitz, with ten Luderitzbuchters each receiving 10 tons. Following independence the TAC was reduced in an effort to restore the stock, but it remains severely depleted, and the TAC for 2003 stood at just 400 tons. In 1992 hake quota were allocated to rock lobster concessionaires in an effort to maintain employment by affected firms, quota holders were able to use idle South African boats. The quota fee is N$5000 per ton for Namibian owned vessels, and the research levy is charged at N$312.50 per ton.
There is also a deep-sea red crab (Chaceon maritae) fishery in Northern Namibia and Southern Angola. “Recent estimates from analytical models indicate that the Namibian component of the (deep sea red crab) stock has declined from about 40,000 tonnes (in the early 1980s)… to around 10,000 tonnes in the 1990s, which is reflected in the decline in the catch rate during this period. In Angola, estimates of 47,600 tonnes, 91,000 tonnes and 18,000 tonnes have been reported for 1977, 1982 and 1996 respectively, perhaps indicating a decline of the Angolan stock as well, which might be expected in view of the fact that this appears to be a single shared stock, with considerable trans-boundary migrations” (Hampton et al 2000. p41). The Angolan TAC dropped from 2000 tons to 1500 tons in 2002/3 and to 1200 tons in 2004. Anecdotal report from industry participants suggests that illegal harvesting by unlicensed foreign vessels remains a problem in Angolan waters. Only two vessels were licensed in 2000. Since 1998 Namibian catches have been close to the TAC of 2,000 tonnes. (FAO fishery country profile. Namibia)
3.2.4 Tuna While catches have historically ranged between 4,000 and 6,000 tons per annum, recent catches have been around half of these levels. There are no catch restrictions except that operators must carry a valid commercial permit – this policy could possibly be leading to a situation where excessive fishing effort reduces stocks and therefore catches. A concern relevant to the tuna fishery is the fact that total Atlantic Ocean albacore catches exceed the maximum sustainable yield of 25,000 tons (Intracen. 1999a). This does not preclude the possibility that they are in line with maximum economic yield, but suggests that they should be monitored closely. Despite previous State funded incentives for processing in Namibia, no tuna canning plant has survived in the region other than a small cannery in Cape Town.
__________________________________________________________________________13 BCLME Project LMR/SE/03/02 Market Analysis of Major Fish Product Markets in the BCLME
3.3 Primary Sector Infrastructure: Vessels and Manpower2
3.3.1 South Africa
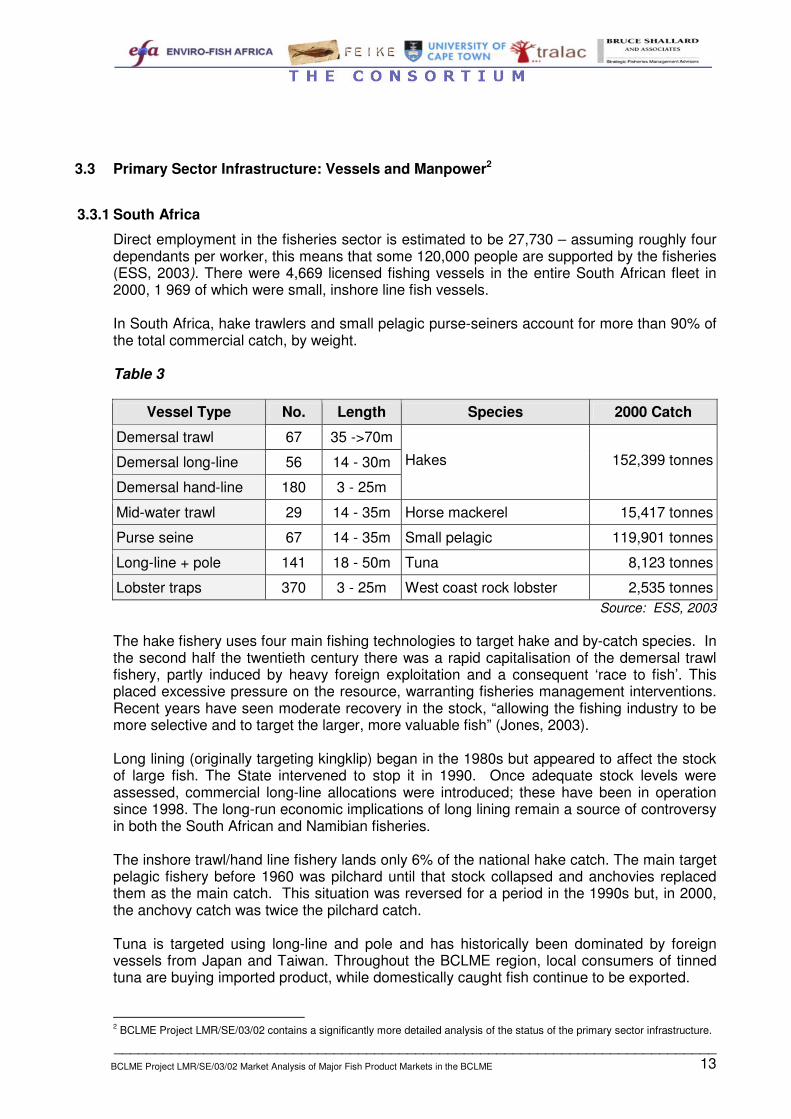
Direct employment in the fisheries sector is estimated to be 27,730 – assuming roughly four dependants per worker, this means that some 120,000 people are supported by the fisheries (ESS, 2003). There were 4,669 licensed fishing vessels in the entire South African fleet in 2000, 1 969 of which were small, inshore line fish vessels. In South Africa, hake trawlers and small pelagic purse-seiners account for more than 90% of the total commercial catch, by weight. Table 3
Purse seine 67 14 - 35m Small pelagic 119,901 tonnes
Long-line + pole 141 18 - 50m Tuna 8,123 tonnes
Lobster traps 370 3 - 25m West coast rock lobster 2,535 tonnes Source: ESS, 2003
The hake fishery uses four main fishing technologies to target hake and by-catch species. In the second half the twentieth century there was a rapid capitalisation of the demersal trawl fishery, partly induced by heavy foreign exploitation and a consequent ‘race to fish’. This placed excessive pressure on the resource, warranting fisheries management interventions. Recent years have seen moderate recovery in the stock, “allowing the fishing industry to be more selective and to target the larger, more valuable fish” (Jones, 2003). Long lining (originally targeting kingklip) began in the 1980s but appeared to affect the stock of large fish. The State intervened to stop it in 1990. Once adequate stock levels were assessed, commercial long-line allocations were introduced; these have been in operation since 1998. The long-run economic implications of long lining remain a source of controversy in both the South African and Namibian fisheries. The inshore trawl/hand line fishery lands only 6% of the national hake catch. The main target pelagic fishery before 1960 was pilchard until that stock collapsed and anchovies replaced them as the main catch. This situation was reversed for a period in the 1990s but, in 2000, the anchovy catch was twice the pilchard catch. Tuna is targeted using long-line and pole and has historically been dominated by foreign vessels from Japan and Taiwan. Throughout the BCLME region, local consumers of tinned tuna are buying imported product, while domestically caught fish continue to be exported. 2 BCLME Project LMR/SE/03/02 contains a significantly more detailed analysis of the status of the primary sector infrastructure.
__________________________________________________________________________14 BCLME Project LMR/SE/03/02 Market Analysis of Major Fish Product Markets in the BCLME
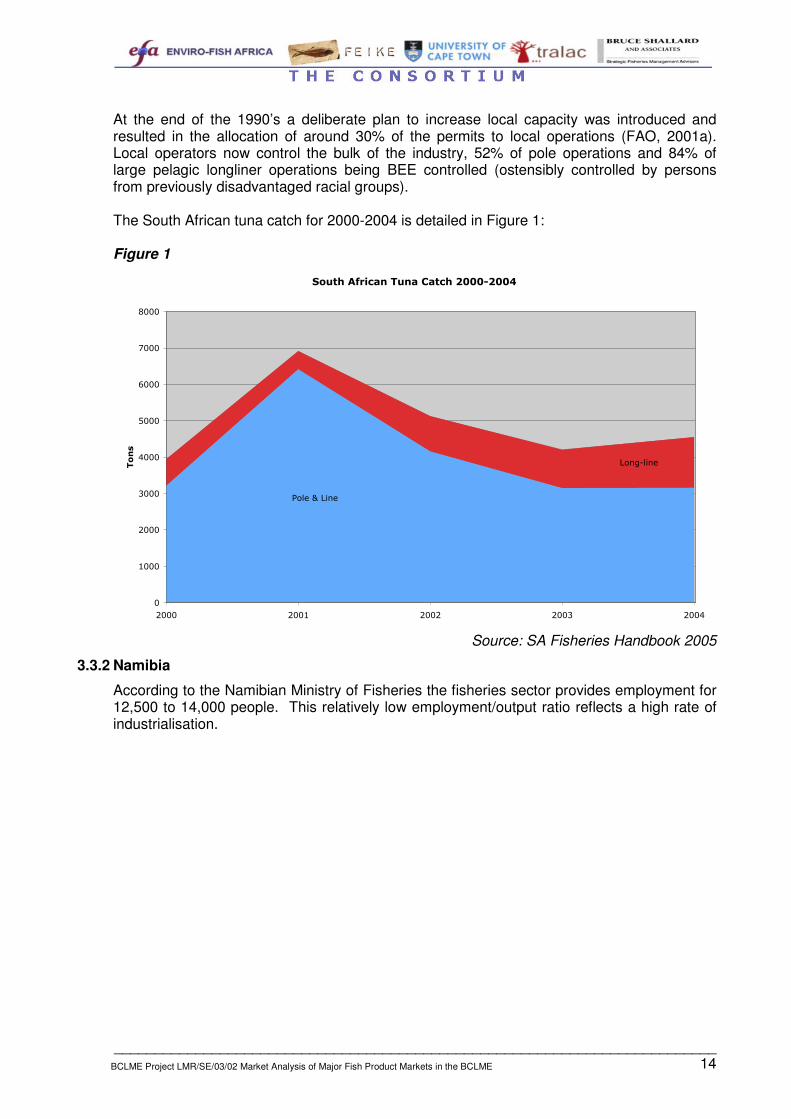
At the end of the 1990’s a deliberate plan to increase local capacity was introduced and resulted in the allocation of around 30% of the permits to local operations (FAO, 2001a). Local operators now control the bulk of the industry, 52% of pole operations and 84% of large pelagic longliner operations being BEE controlled (ostensibly controlled by persons from previously disadvantaged racial groups). The South African tuna catch for 2000-2004 is detailed in Figure 1: Figure 1
���������� ��� �����������������
����������
������
�
���
����
����
����
����
����
����
����
���� ��� ���� ���� ����
��
�
Source: SA Fisheries Handbook 2005
3.3.2 Namibia
According to the Namibian Ministry of Fisheries the fisheries sector provides employment for 12,500 to 14,000 people. This relatively low employment/output ratio reflects a high rate of industrialisation.
__________________________________________________________________________15 BCLME Project LMR/SE/03/02 Market Analysis of Major Fish Product Markets in the BCLME
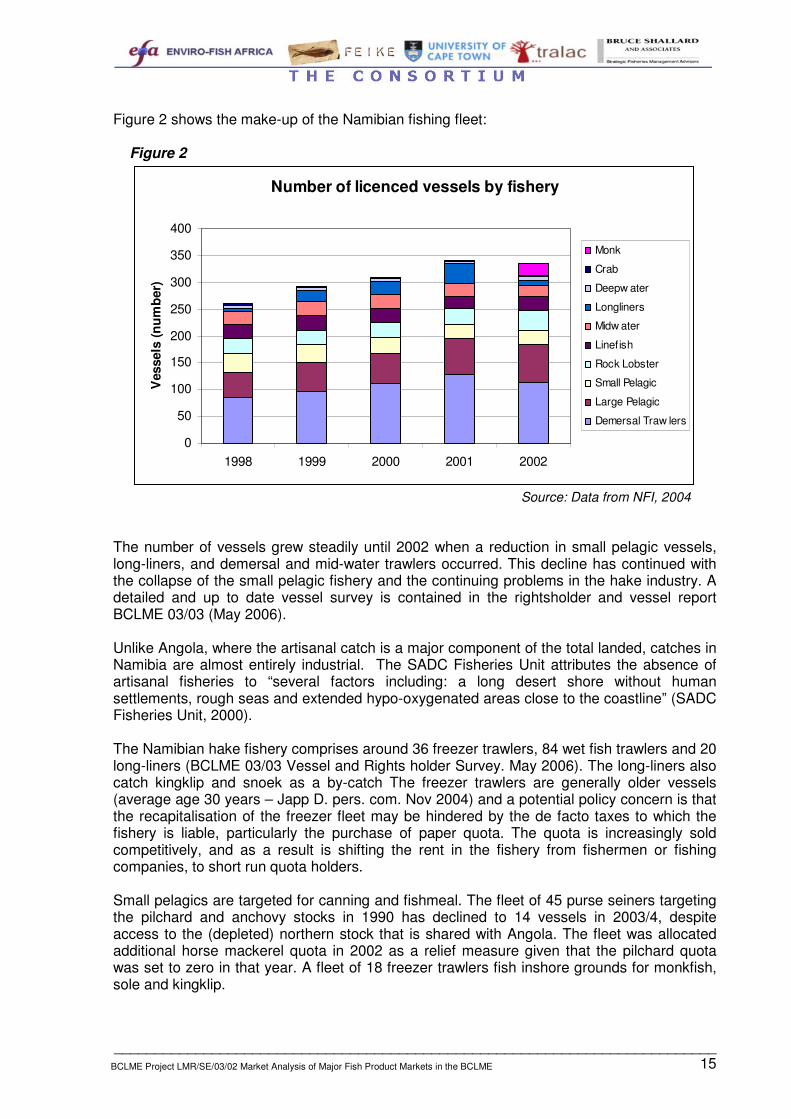
Figure 2 shows the make-up of the Namibian fishing fleet:
Figure 2
Number of licenced vessels by fishery
0
50
100
150
200
250
300
350
400
1998 1999 2000 2001 2002
Ves
sels
(num
ber)
Monk
Crab
Deepw ater
Longliners
Midw ater
Linefish
Rock Lobster
Small Pelagic
Large Pelagic
Demersal Traw lers
Source: Data from NFI, 2004
The number of vessels grew steadily until 2002 when a reduction in small pelagic vessels, long-liners, and demersal and mid-water trawlers occurred. This decline has continued with the collapse of the small pelagic fishery and the continuing problems in the hake industry. A detailed and up to date vessel survey is contained in the rightsholder and vessel report BCLME 03/03 (May 2006). Unlike Angola, where the artisanal catch is a major component of the total landed, catches in Namibia are almost entirely industrial. The SADC Fisheries Unit attributes the absence of artisanal fisheries to “several factors including: a long desert shore without human settlements, rough seas and extended hypo-oxygenated areas close to the coastline” (SADC Fisheries Unit, 2000). The Namibian hake fishery comprises around 36 freezer trawlers, 84 wet fish trawlers and 20 long-liners (BCLME 03/03 Vessel and Rights holder Survey. May 2006). The long-liners also catch kingklip and snoek as a by-catch The freezer trawlers are generally older vessels (average age 30 years – Japp D. pers. com. Nov 2004) and a potential policy concern is that the recapitalisation of the freezer fleet may be hindered by the de facto taxes to which the fishery is liable, particularly the purchase of paper quota. The quota is increasingly sold competitively, and as a result is shifting the rent in the fishery from fishermen or fishing companies, to short run quota holders. Small pelagics are targeted for canning and fishmeal. The fleet of 45 purse seiners targeting the pilchard and anchovy stocks in 1990 has declined to 14 vessels in 2003/4, despite access to the (depleted) northern stock that is shared with Angola. The fleet was allocated additional horse mackerel quota in 2002 as a relief measure given that the pilchard quota was set to zero in that year. A fleet of 18 freezer trawlers fish inshore grounds for monkfish, sole and kingklip.
__________________________________________________________________________16 BCLME Project LMR/SE/03/02 Market Analysis of Major Fish Product Markets in the BCLME
Mid-water trawling by factory vessels uses large nets to drag the catch up to the vessel where they are processed. The mid-water industry differs from the rest of the fishing industry in that it is still heavily reliant on chartered vessels (this was already recognised in the 1993 policy statement on quota allocation which set separate vessel ownership conditions for horse mackerel, crab and tuna). Those who possess fishing rights, the concession holders, generally charter registered mid-water trawlers using a “sharecropping” contract. Typically the concession holder keeps 15% of the catch, the remaining 85% going to the boat owner. Only a small number of quota holders actually own their boats. In 2000 there were 26 vessels and 12 rights holders in the fishery. Because so many vessels are leased there is some uncertainty about the number currently operating, but the latest report suggests between 21 and 27. (BCLME vessel and rights holder survey 03/03 May 2006). Tuna has been targeted in Namibian waters since 1991 using two fishing methods, pole and long lining. Poled tuna is used for canning, some of which has taken place in Walvis Bay, while long-lined tuna fish is used for sashimi. Tuna catches rose rapidly from 1991 to 1994 but then fell, starting to rise again only after 1997. Pelagic Long-lining, where fish are caught by dropping a long-line with bait held by floats, was giving way to fishing with poles or rods (NFI, 2004), but has subsequently returned with the rising in shark catches. Currently vessels include large far eastern factory vessels, and smaller local vessels, including approximately 20 South African flagged pole vessels. Two vessels are licensed to fish for Deep-sea Red Crab and twenty-nine small craft are licensed to use lobster-baiting traps.
3.3.3 Angola
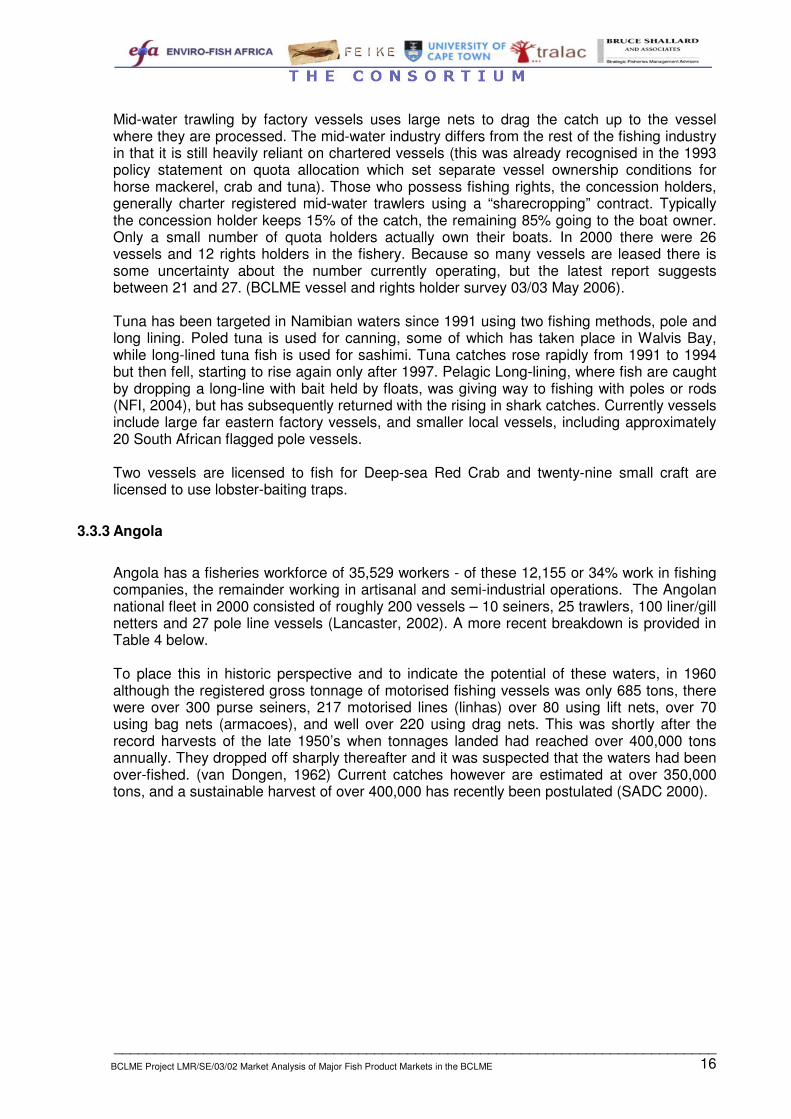
Angola has a fisheries workforce of 35,529 workers - of these 12,155 or 34% work in fishing companies, the remainder working in artisanal and semi-industrial operations. The Angolan national fleet in 2000 consisted of roughly 200 vessels – 10 seiners, 25 trawlers, 100 liner/gill netters and 27 pole line vessels (Lancaster, 2002). A more recent breakdown is provided in Table 4 below. To place this in historic perspective and to indicate the potential of these waters, in 1960 although the registered gross tonnage of motorised fishing vessels was only 685 tons, there were over 300 purse seiners, 217 motorised lines (linhas) over 80 using lift nets, over 70 using bag nets (armacoes), and well over 220 using drag nets. This was shortly after the record harvests of the late 1950’s when tonnages landed had reached over 400,000 tons annually. They dropped off sharply thereafter and it was suspected that the waters had been over-fished. (van Dongen, 1962) Current catches however are estimated at over 350,000 tons, and a sustainable harvest of over 400,000 has recently been postulated (SADC 2000).
__________________________________________________________________________17 BCLME Project LMR/SE/03/02 Market Analysis of Major Fish Product Markets in the BCLME
Table 4
Vessels Registered to Fish in Angolan Waters (2003). National Fleet Foreign Fleet
Gear or target stock Semi-industrial Industrial Total Industrial
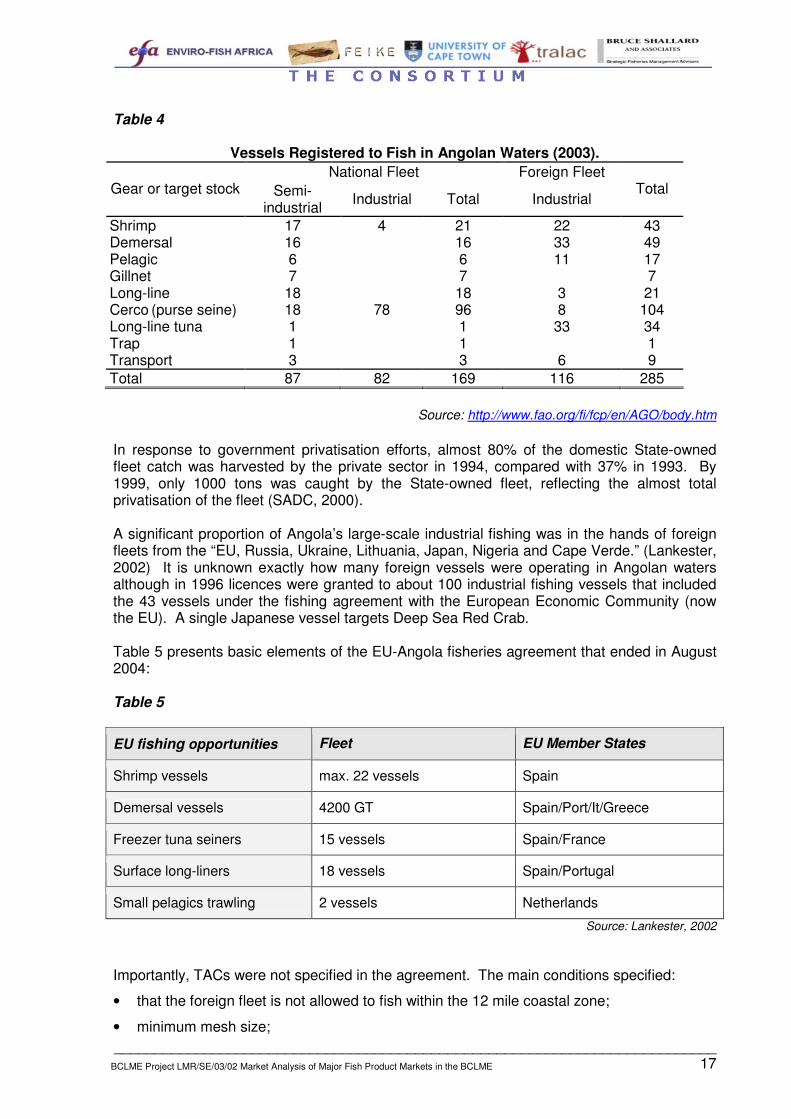
In response to government privatisation efforts, almost 80% of the domestic State-owned fleet catch was harvested by the private sector in 1994, compared with 37% in 1993. By 1999, only 1000 tons was caught by the State-owned fleet, reflecting the almost total privatisation of the fleet (SADC, 2000). A significant proportion of Angola’s large-scale industrial fishing was in the hands of foreign fleets from the “EU, Russia, Ukraine, Lithuania, Japan, Nigeria and Cape Verde.” (Lankester, 2002) It is unknown exactly how many foreign vessels were operating in Angolan waters although in 1996 licences were granted to about 100 industrial fishing vessels that included the 43 vessels under the fishing agreement with the European Economic Community (now the EU). A single Japanese vessel targets Deep Sea Red Crab. Table 5 presents basic elements of the EU-Angola fisheries agreement that ended in August 2004: Table 5
EU fishing opportunities Fleet EU Member States
Shrimp vessels max. 22 vessels Spain
Demersal vessels 4200 GT Spain/Port/It/Greece
Freezer tuna seiners 15 vessels Spain/France
Surface long-liners 18 vessels Spain/Portugal
Small pelagics trawling 2 vessels Netherlands Source: Lankester, 2002
Importantly, TACs were not specified in the agreement. The main conditions specified:
• that the foreign fleet is not allowed to fish within the 12 mile coastal zone;
• minimum mesh size;
__________________________________________________________________________18 BCLME Project LMR/SE/03/02 Market Analysis of Major Fish Product Markets in the BCLME
• species to be caught;
• amount of catches;
• the closed season;
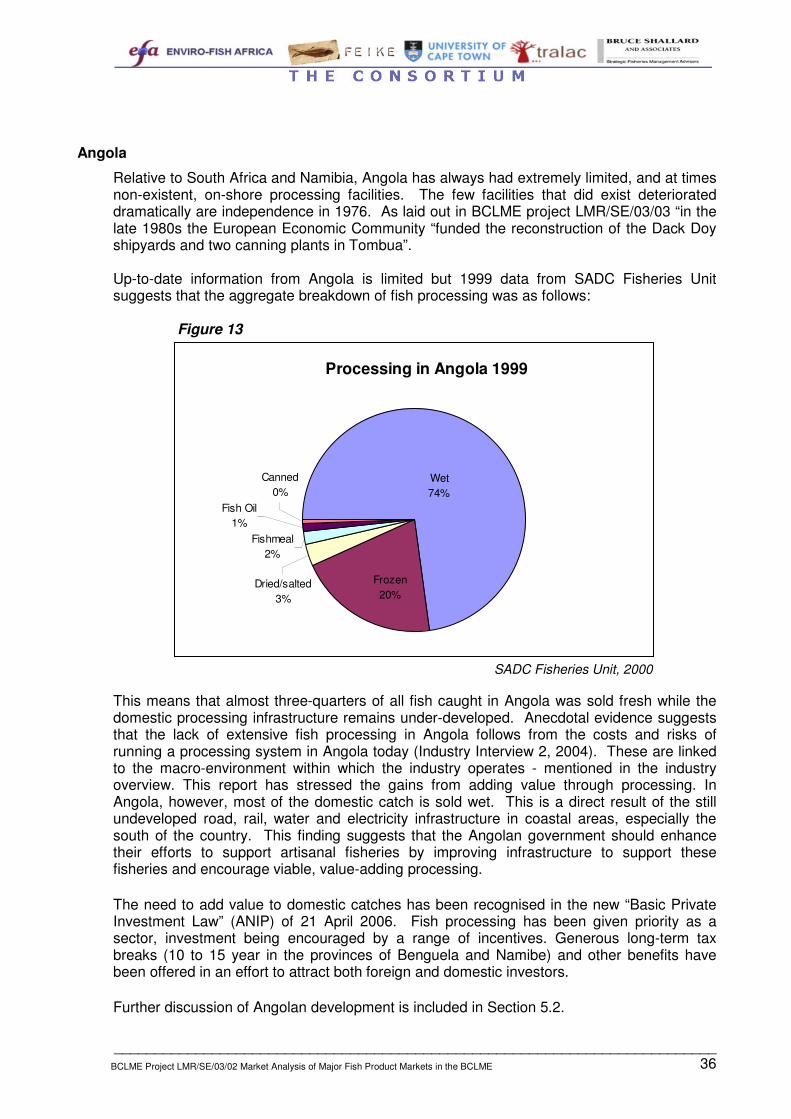
• that the licenses are not officially transferable. The first two, if enforced, would have limited conflict and competition between the commercial and artisanal fisheries, unfortunately monitoring has been weak. The agreement was not renewed. In its place a series of international bilateral agreements have emerged. The Angolan government has been pushing for increased local ownership of the resource, in particular for foreign direct investment into joint ventures between foreign and domestic firms. In 1996 the official recorded catch of the foreign fleet in Angola was 65,000 tons, 60% of which was landed in National ports (FAO, 1999). Unfortunately, even if the official catch statistics were correct, these gave little indication of fish mortality.
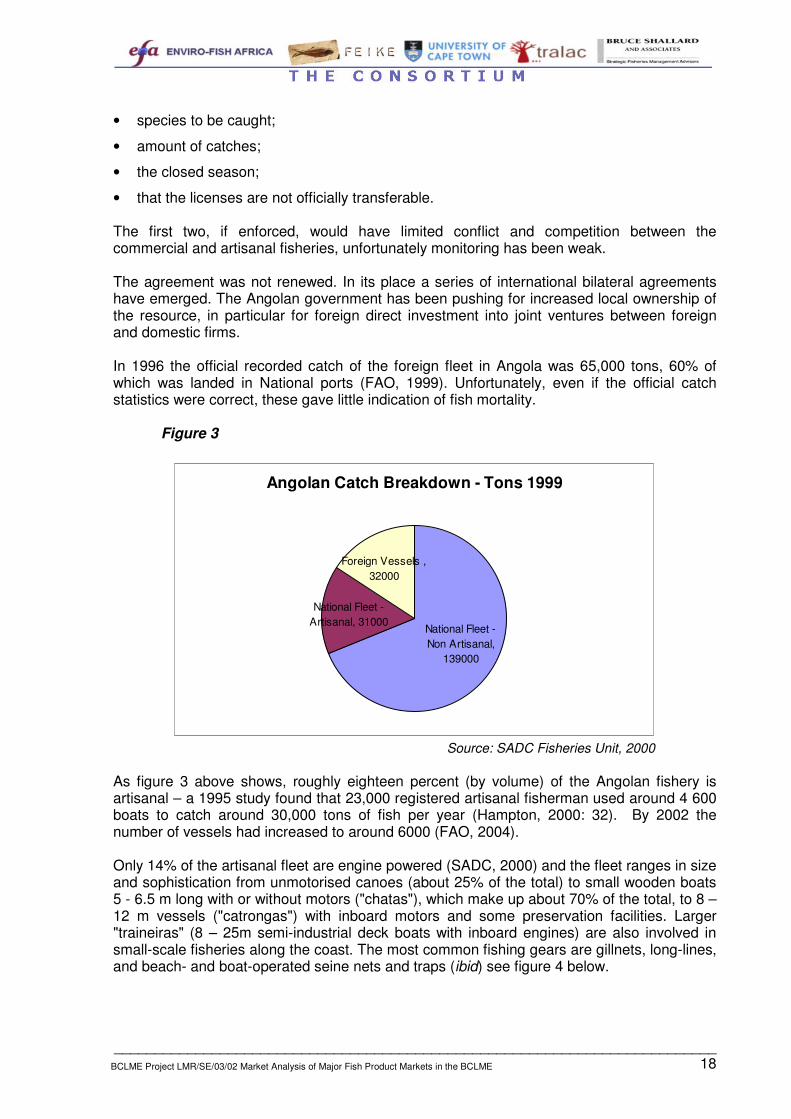
Figure 3
Angolan Catch Breakdown - Tons 1999
Foreign Vessels , 32000
National Fleet - Non Artisanal,
139000
National Fleet - Artisanal, 31000
Source: SADC Fisheries Unit, 2000
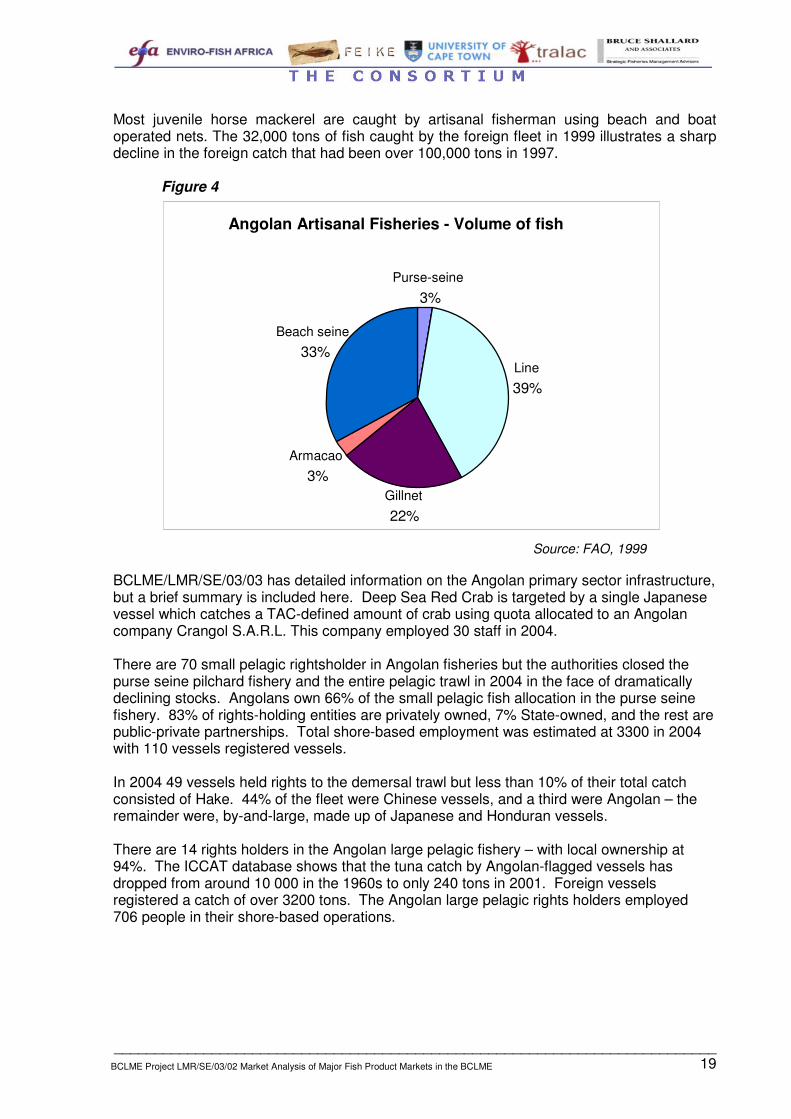
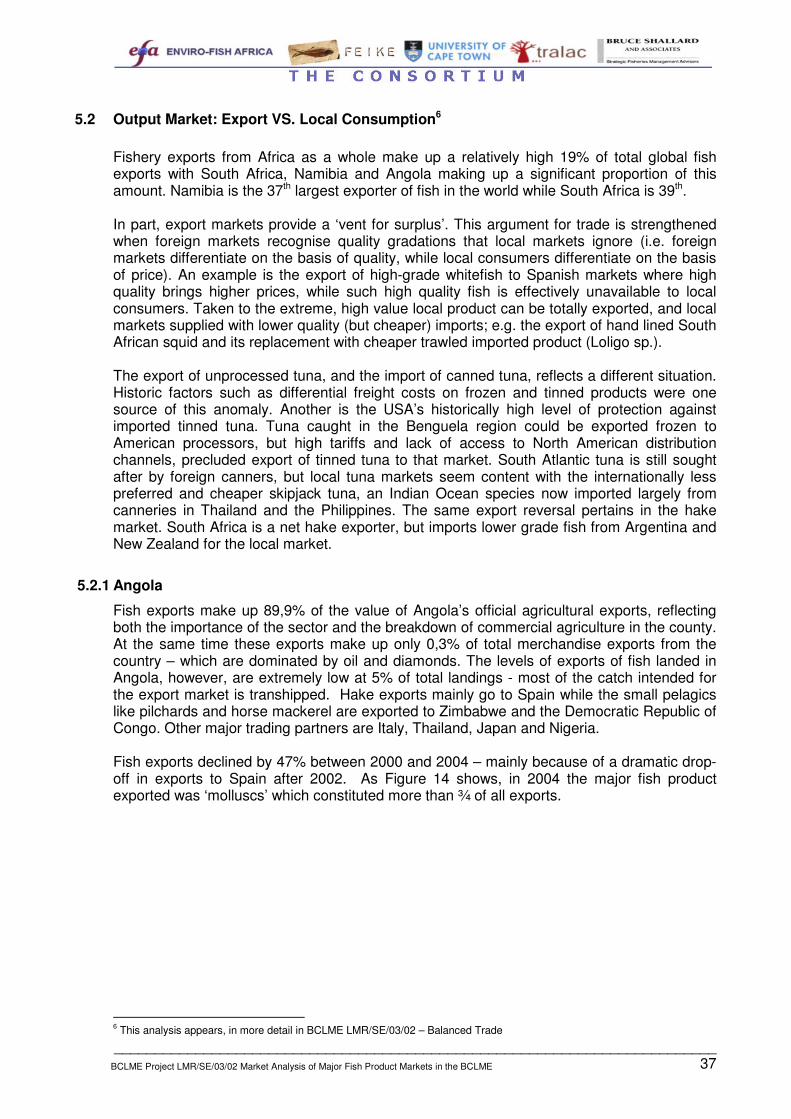
As figure 3 above shows, roughly eighteen percent (by volume) of the Angolan fishery is artisanal – a 1995 study found that 23,000 registered artisanal fisherman used around 4 600 boats to catch around 30,000 tons of fish per year (Hampton, 2000: 32). By 2002 the number of vessels had increased to around 6000 (FAO, 2004). Only 14% of the artisanal fleet are engine powered (SADC, 2000) and the fleet ranges in size and sophistication from unmotorised canoes (about 25% of the total) to small wooden boats 5 - 6.5 m long with or without motors ("chatas"), which make up about 70% of the total, to 8 – 12 m vessels ("catrongas") with inboard motors and some preservation facilities. Larger "traineiras" (8 – 25m semi-industrial deck boats with inboard engines) are also involved in small-scale fisheries along the coast. The most common fishing gears are gillnets, long-lines, and beach- and boat-operated seine nets and traps (ibid) see figure 4 below.
__________________________________________________________________________19 BCLME Project LMR/SE/03/02 Market Analysis of Major Fish Product Markets in the BCLME
Most juvenile horse mackerel are caught by artisanal fisherman using beach and boat operated nets. The 32,000 tons of fish caught by the foreign fleet in 1999 illustrates a sharp decline in the foreign catch that had been over 100,000 tons in 1997.
Figure 4
Source: FAO, 1999
BCLME/LMR/SE/03/03 has detailed information on the Angolan primary sector infrastructure, but a brief summary is included here. Deep Sea Red Crab is targeted by a single Japanese vessel which catches a TAC-defined amount of crab using quota allocated to an Angolan company Crangol S.A.R.L. This company employed 30 staff in 2004. There are 70 small pelagic rightsholder in Angolan fisheries but the authorities closed the purse seine pilchard fishery and the entire pelagic trawl in 2004 in the face of dramatically declining stocks. Angolans own 66% of the small pelagic fish allocation in the purse seine fishery. 83% of rights-holding entities are privately owned, 7% State-owned, and the rest are public-private partnerships. Total shore-based employment was estimated at 3300 in 2004 with 110 vessels registered vessels. In 2004 49 vessels held rights to the demersal trawl but less than 10% of their total catch consisted of Hake. 44% of the fleet were Chinese vessels, and a third were Angolan – the remainder were, by-and-large, made up of Japanese and Honduran vessels. There are 14 rights holders in the Angolan large pelagic fishery – with local ownership at 94%. The ICCAT database shows that the tuna catch by Angolan-flagged vessels has dropped from around 10 000 in the 1960s to only 240 tons in 2001. Foreign vessels registered a catch of over 3200 tons. The Angolan large pelagic rights holders employed 706 people in their shore-based operations.
Angolan Artisanal Fisheries - Volume of fish
Line
39%
Beach seine
33%
Purse-seine
3%
Gillnet
22%
Armacao
3%
__________________________________________________________________________20 BCLME Project LMR/SE/03/02 Market Analysis of Major Fish Product Markets in the BCLME
3.4 Input Market: Catch
3.4.1 Whole BCLME
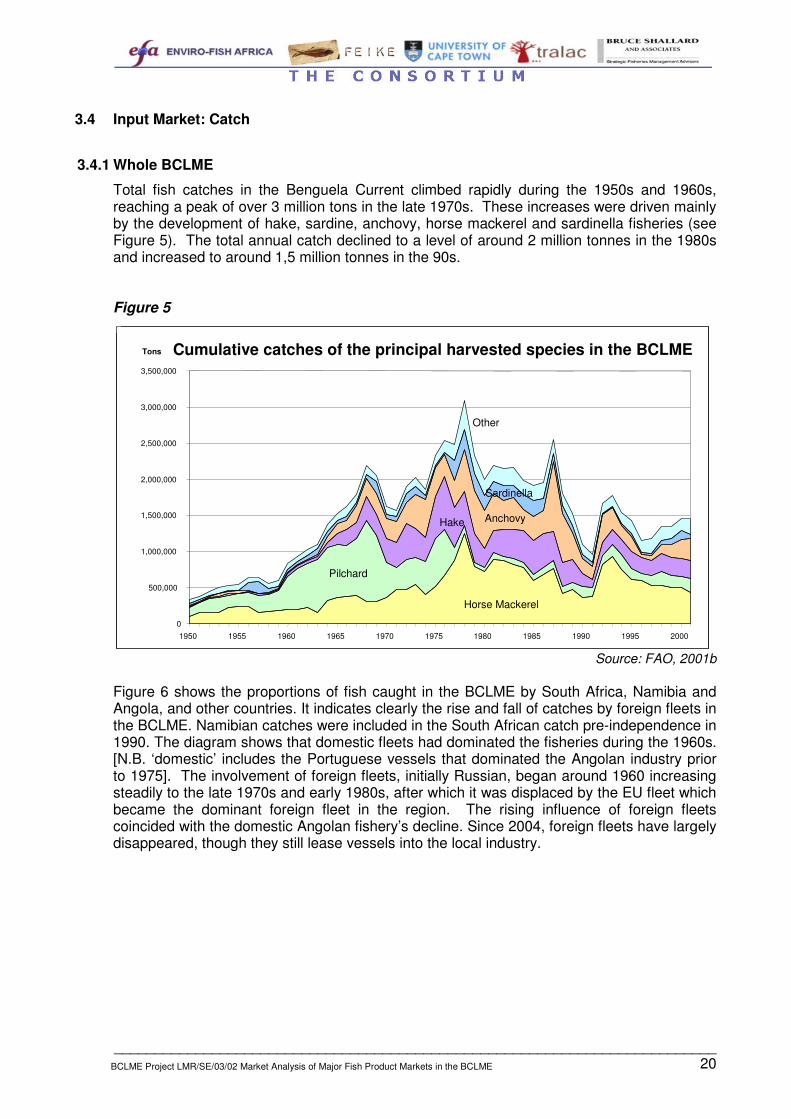
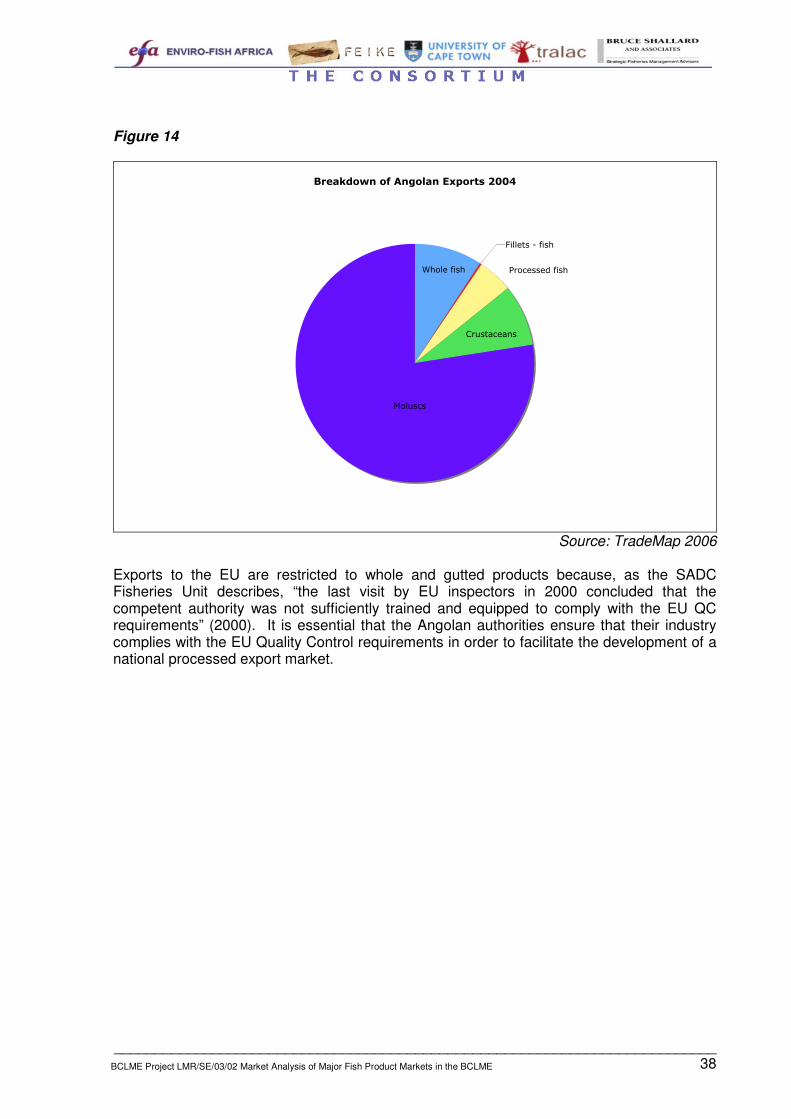
Total fish catches in the Benguela Current climbed rapidly during the 1950s and 1960s, reaching a peak of over 3 million tons in the late 1970s. These increases were driven mainly by the development of hake, sardine, anchovy, horse mackerel and sardinella fisheries (see Figure 5). The total annual catch declined to a level of around 2 million tonnes in the 1980s and increased to around 1,5 million tonnes in the 90s. Figure 5
Source: FAO, 2001b
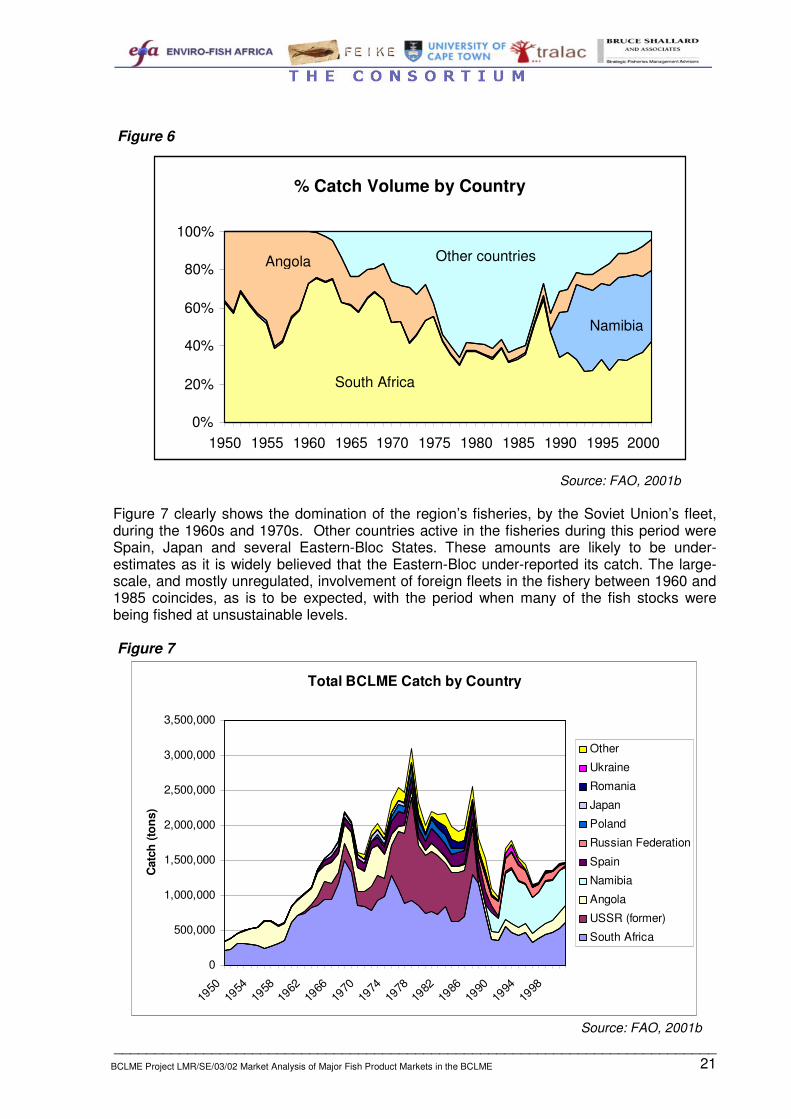
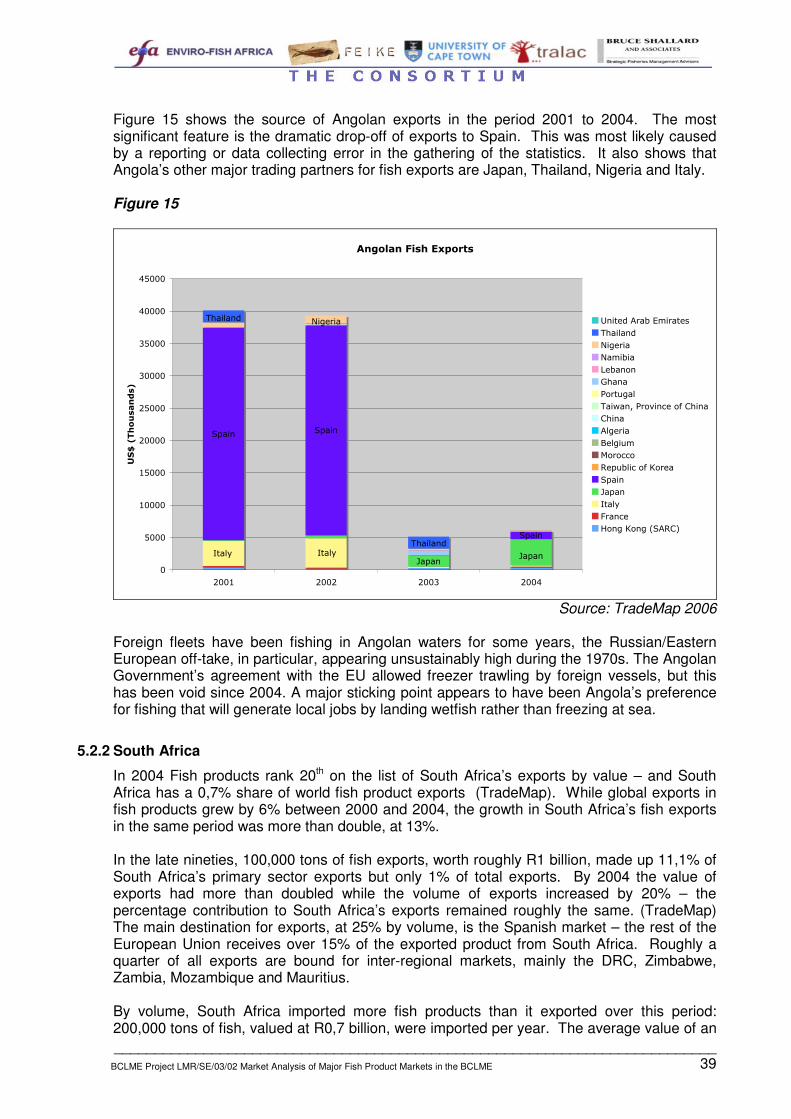
Figure 6 shows the proportions of fish caught in the BCLME by South Africa, Namibia and Angola, and other countries. It indicates clearly the rise and fall of catches by foreign fleets in the BCLME. Namibian catches were included in the South African catch pre-independence in 1990. The diagram shows that domestic fleets had dominated the fisheries during the 1960s. [N.B. ‘domestic’ includes the Portuguese vessels that dominated the Angolan industry prior to 1975]. The involvement of foreign fleets, initially Russian, began around 1960 increasing steadily to the late 1970s and early 1980s, after which it was displaced by the EU fleet which became the dominant foreign fleet in the region. The rising influence of foreign fleets coincided with the domestic Angolan fishery’s decline. Since 2004, foreign fleets have largely disappeared, though they still lease vessels into the local industry.
Cumulative catches of the principal harvested species in the BCLME
__________________________________________________________________________21 BCLME Project LMR/SE/03/02 Market Analysis of Major Fish Product Markets in the BCLME
Figure 6
Source: FAO, 2001b
Figure 7 clearly shows the domination of the region’s fisheries, by the Soviet Union’s fleet, during the 1960s and 1970s. Other countries active in the fisheries during this period were Spain, Japan and several Eastern-Bloc States. These amounts are likely to be under-estimates as it is widely believed that the Eastern-Bloc under-reported its catch. The large-scale, and mostly unregulated, involvement of foreign fleets in the fishery between 1960 and 1985 coincides, as is to be expected, with the period when many of the fish stocks were being fished at unsustainable levels. Figure 7
__________________________________________________________________________22 BCLME Project LMR/SE/03/02 Market Analysis of Major Fish Product Markets in the BCLME
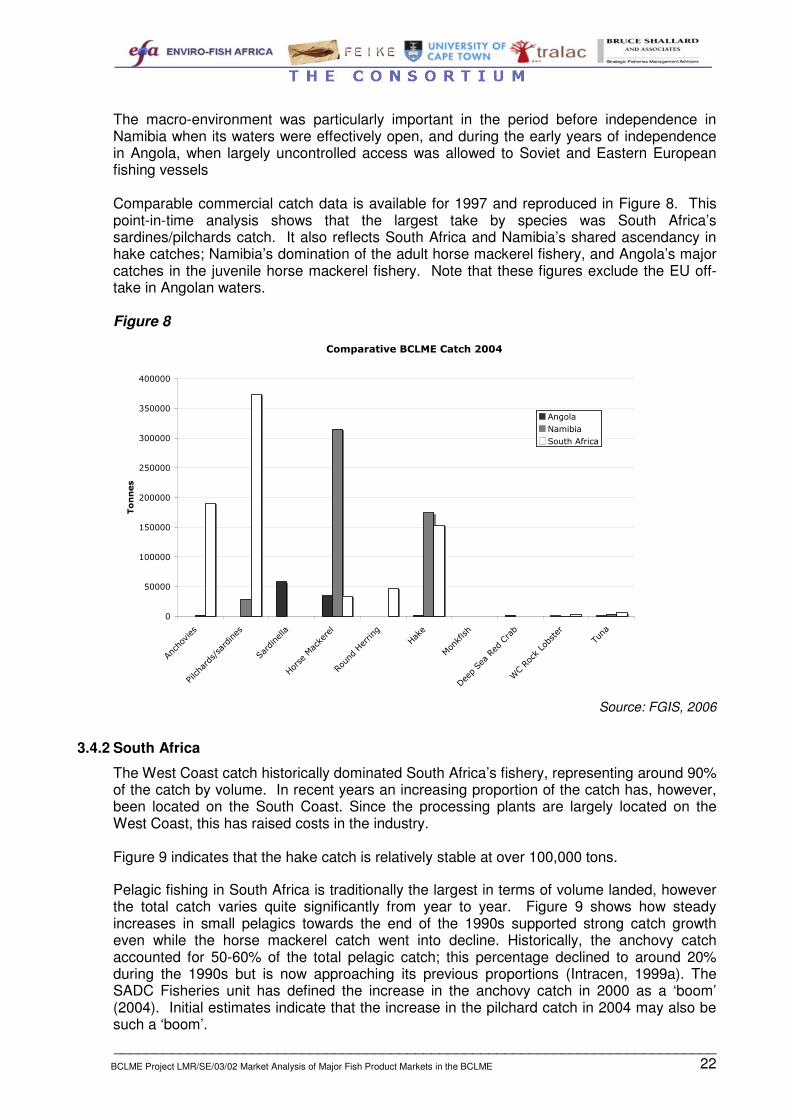
The macro-environment was particularly important in the period before independence in Namibia when its waters were effectively open, and during the early years of independence in Angola, when largely uncontrolled access was allowed to Soviet and Eastern European fishing vessels Comparable commercial catch data is available for 1997 and reproduced in Figure 8. This point-in-time analysis shows that the largest take by species was South Africa’s sardines/pilchards catch. It also reflects South Africa and Namibia’s shared ascendancy in hake catches; Namibia’s domination of the adult horse mackerel fishery, and Angola’s major catches in the juvenile horse mackerel fishery. Note that these figures exclude the EU off-take in Angolan waters. Figure 8
��������������������������
�
�����
�����
�����
������
������
������
������
������
��������
�����������������
���������
������ ��!����
"�#�������
��!�
�!$���
%��&�����"���'��(
)'�"��!���(�*��
+#�
��
��
����
,�-�(��
��#*���$����
Source: FGIS, 2006
3.4.2 South Africa
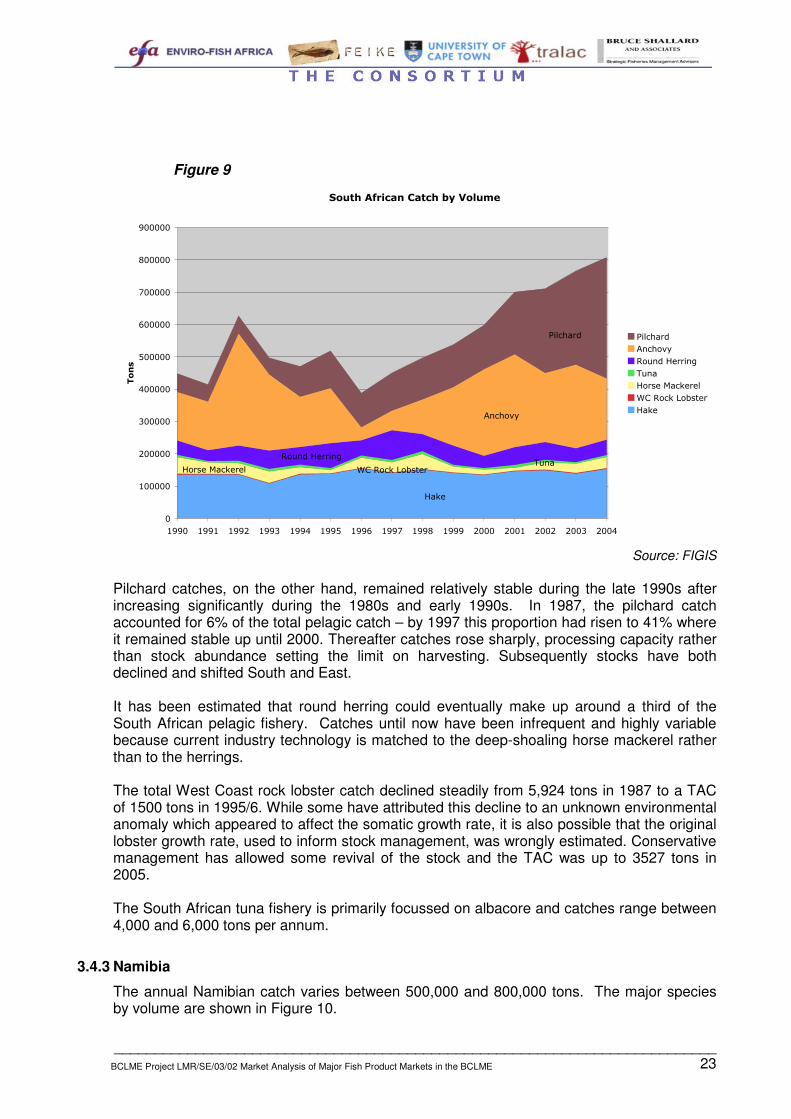
The West Coast catch historically dominated South Africa’s fishery, representing around 90% of the catch by volume. In recent years an increasing proportion of the catch has, however, been located on the South Coast. Since the processing plants are largely located on the West Coast, this has raised costs in the industry. Figure 9 indicates that the hake catch is relatively stable at over 100,000 tons.
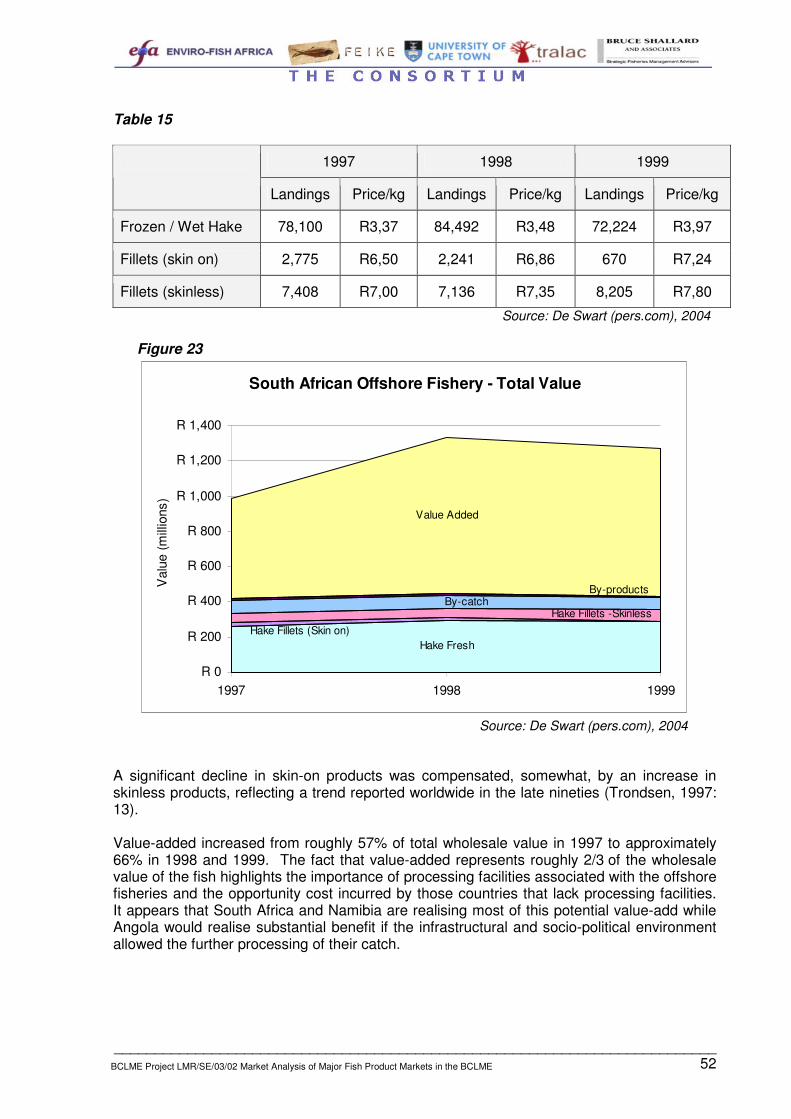
Pelagic fishing in South Africa is traditionally the largest in terms of volume landed, however the total catch varies quite significantly from year to year. Figure 9 shows how steady increases in small pelagics towards the end of the 1990s supported strong catch growth even while the horse mackerel catch went into decline. Historically, the anchovy catch accounted for 50-60% of the total pelagic catch; this percentage declined to around 20% during the 1990s but is now approaching its previous proportions (Intracen, 1999a). The SADC Fisheries unit has defined the increase in the anchovy catch in 2000 as a ‘boom’ (2004). Initial estimates indicate that the increase in the pilchard catch in 2004 may also be such a ‘boom’.
__________________________________________________________________________23 BCLME Project LMR/SE/03/02 Market Analysis of Major Fish Product Markets in the BCLME
Pilchard catches, on the other hand, remained relatively stable during the late 1990s after increasing significantly during the 1980s and early 1990s. In 1987, the pilchard catch accounted for 6% of the total pelagic catch – by 1997 this proportion had risen to 41% where it remained stable up until 2000. Thereafter catches rose sharply, processing capacity rather than stock abundance setting the limit on harvesting. Subsequently stocks have both declined and shifted South and East. It has been estimated that round herring could eventually make up around a third of the South African pelagic fishery. Catches until now have been infrequent and highly variable because current industry technology is matched to the deep-shoaling horse mackerel rather than to the herrings. The total West Coast rock lobster catch declined steadily from 5,924 tons in 1987 to a TAC of 1500 tons in 1995/6. While some have attributed this decline to an unknown environmental anomaly which appeared to affect the somatic growth rate, it is also possible that the original lobster growth rate, used to inform stock management, was wrongly estimated. Conservative management has allowed some revival of the stock and the TAC was up to 3527 tons in 2005. The South African tuna fishery is primarily focussed on albacore and catches range between 4,000 and 6,000 tons per annum.
3.4.3 Namibia
The annual Namibian catch varies between 500,000 and 800,000 tons. The major species by volume are shown in Figure 10.
__________________________________________________________________________24 BCLME Project LMR/SE/03/02 Market Analysis of Major Fish Product Markets in the BCLME
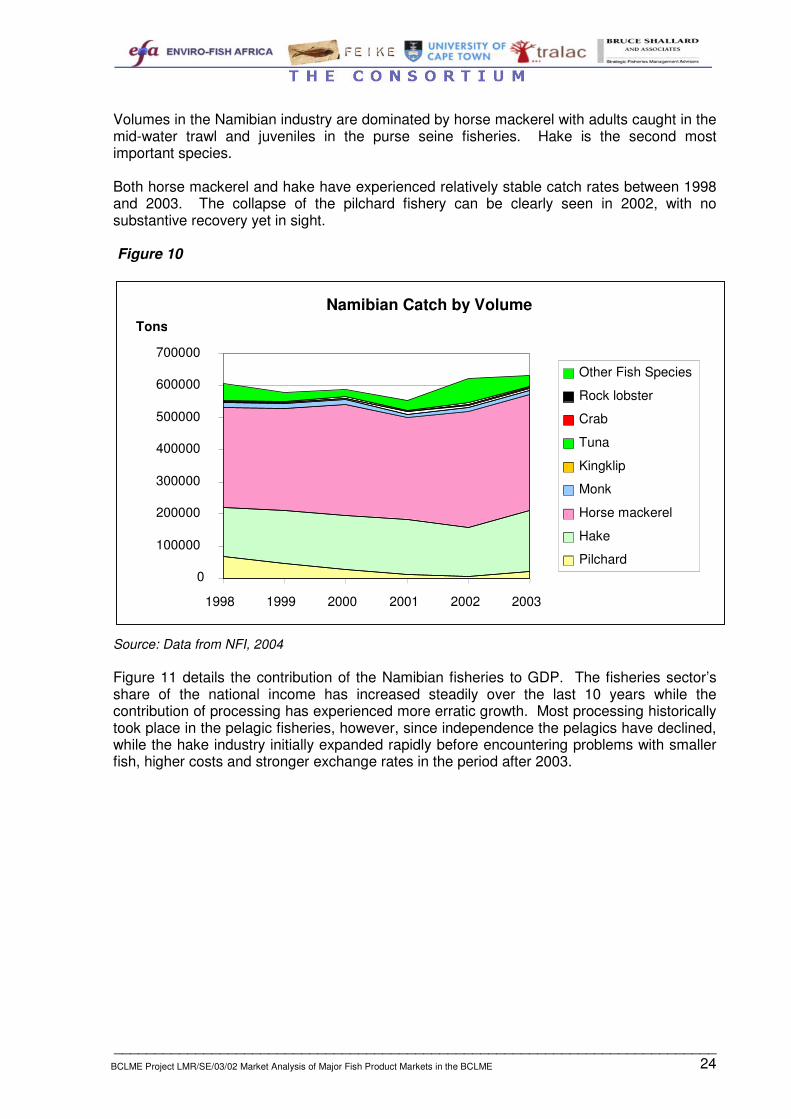
Volumes in the Namibian industry are dominated by horse mackerel with adults caught in the mid-water trawl and juveniles in the purse seine fisheries. Hake is the second most important species. Both horse mackerel and hake have experienced relatively stable catch rates between 1998 and 2003. The collapse of the pilchard fishery can be clearly seen in 2002, with no substantive recovery yet in sight. Figure 10
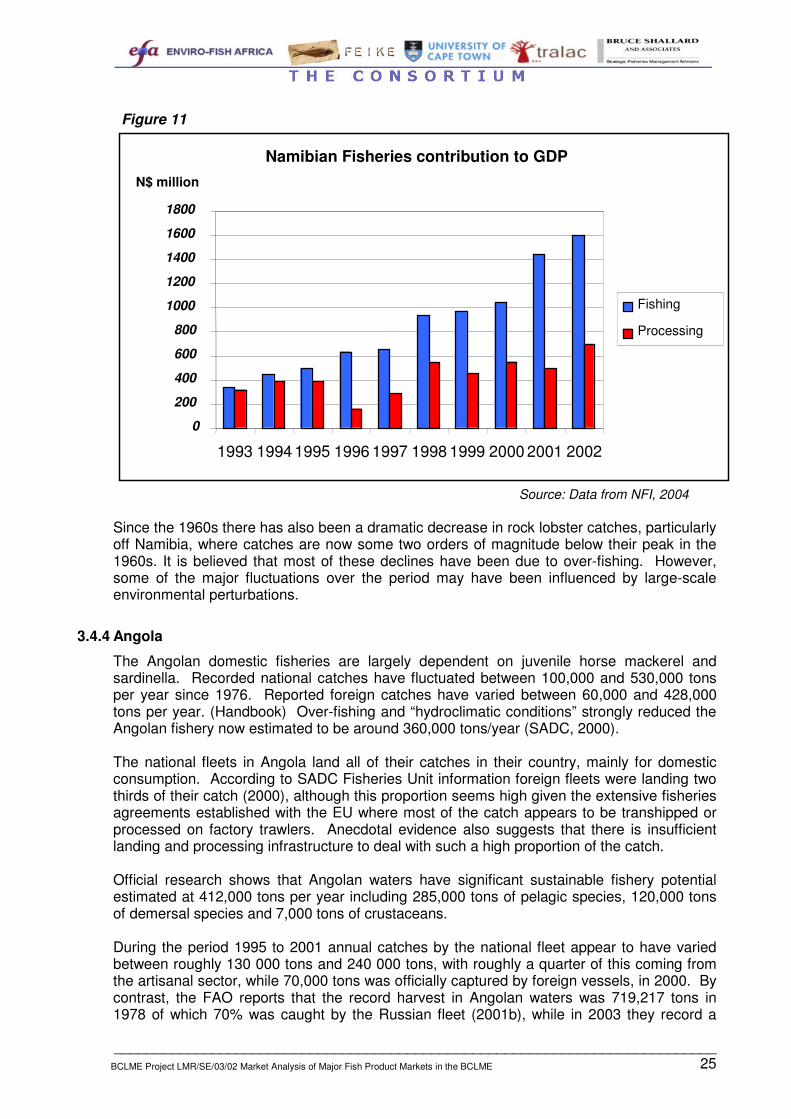
Source: Data from NFI, 2004 Figure 11 details the contribution of the Namibian fisheries to GDP. The fisheries sector’s share of the national income has increased steadily over the last 10 years while the contribution of processing has experienced more erratic growth. Most processing historically took place in the pelagic fisheries, however, since independence the pelagics have declined, while the hake industry initially expanded rapidly before encountering problems with smaller fish, higher costs and stronger exchange rates in the period after 2003.
Namibian Catch by Volume
0
100000
200000
300000
400000
500000
600000
700000
1998 1999 2000 2001 2002 2003
Tons
Other Fish Species
Rock lobster
Crab
Tuna
Kingklip
Monk
Horse mackerel
Hake
Pilchard
__________________________________________________________________________25 BCLME Project LMR/SE/03/02 Market Analysis of Major Fish Product Markets in the BCLME
Figure 11
Source: Data from NFI, 2004
Since the 1960s there has also been a dramatic decrease in rock lobster catches, particularly off Namibia, where catches are now some two orders of magnitude below their peak in the 1960s. It is believed that most of these declines have been due to over-fishing. However, some of the major fluctuations over the period may have been influenced by large-scale environmental perturbations.
3.4.4 Angola
The Angolan domestic fisheries are largely dependent on juvenile horse mackerel and sardinella. Recorded national catches have fluctuated between 100,000 and 530,000 tons per year since 1976. Reported foreign catches have varied between 60,000 and 428,000 tons per year. (Handbook) Over-fishing and “hydroclimatic conditions” strongly reduced the Angolan fishery now estimated to be around 360,000 tons/year (SADC, 2000). The national fleets in Angola land all of their catches in their country, mainly for domestic consumption. According to SADC Fisheries Unit information foreign fleets were landing two thirds of their catch (2000), although this proportion seems high given the extensive fisheries agreements established with the EU where most of the catch appears to be transhipped or processed on factory trawlers. Anecdotal evidence also suggests that there is insufficient landing and processing infrastructure to deal with such a high proportion of the catch. Official research shows that Angolan waters have significant sustainable fishery potential estimated at 412,000 tons per year including 285,000 tons of pelagic species, 120,000 tons of demersal species and 7,000 tons of crustaceans. During the period 1995 to 2001 annual catches by the national fleet appear to have varied between roughly 130 000 tons and 240 000 tons, with roughly a quarter of this coming from the artisanal sector, while 70,000 tons was officially captured by foreign vessels, in 2000. By contrast, the FAO reports that the record harvest in Angolan waters was 719,217 tons in 1978 of which 70% was caught by the Russian fleet (2001b), while in 2003 they record a
Namibian Fisheries contribution to GDP
0
200
400
600
800
1000
1200
1400
1600
1800
1993 1994 1995 1996 1997 1998 1999 2000 2001 2002
N$ million
Fishing
Processing
__________________________________________________________________________26 BCLME Project LMR/SE/03/02 Market Analysis of Major Fish Product Markets in the BCLME
total catch of 520 000 tons from artisanal, semi-industrial and commercial (including foreign) vessels (FAO, 2004b).
4 STRUCTURE In a ‘structure, conduct, performance’ (SCP) analysis, “structure” encompasses the form of the industry and the operations of the participants in it (including rent seekers and the State). Any market has two sides, supply (production) and demand (consumption). The industry structure provides the backdrop to the supply side. It may also determine which groups of consumers are targeted to provide the demand side of the market. In many markets the relative bargaining powers of consumers and producers is a key feature. A further important aspect of industry structure is information i.e. how well informed are buyers? The industry structure has been in a state of flux over the past twenty-five years. In particular the role of foreign companies and vessels changed markedly, as discussed in section 3.3.
4.1 Industry Structure In simple SCP analyses “structure” generally describes an industry in terms of corporate monopoly power or market concentration. To be effective in analyzing the Benguela Current fisheries, its ambit must be broadened to reflect the major sources of economic rents, and reasons for their dissipation. Basic fisheries models show that with free entry and exit to the industry, an open access fishery tends to dissipate its rents. Fishermen will keep entering till it no longer pays to do so, at which point they are earning no more than they could in their best alternative employment. This implies that in areas with high unemployment fishing will bring in virtually no true profit. The reality is often different. Two major reasons explain this: firstly the assumption of free entry to the industry is not sufficient in itself. Fishermen are not identical; even under open access individual fishing skills can be a source of income. Secondly, in small markets restricting supply can increase profits. Well-designed access controls (quota restrictions) should not impoverish an industry, but enrich it. The manner in which these access rights are assigned, however, can cause problems. If the system is transparent and rights are of long duration, restriction of access aids sustainable operations. If, however, the rights allocation system is opaque, if rights are of short duration and their allocation is subject to political whim, they merely become sources of short run rent seeking and increase uncertainty within the industry. Such simple models abstract from reality, but their lessons need to be borne in mind when describing the structure of the industry. The set of key variables encompassed by “structure” therefore includes issues of access to the resource and to markets, constraints of technology and information, the role of the State, industrial concentration and integration. More specifically: a) restrictions on access to the resource
• property rights regimes • role of the State • monitoring
b) openness of market access
• international - processed and chilled
__________________________________________________________________________27 BCLME Project LMR/SE/03/02 Market Analysis of Major Fish Product Markets in the BCLME
• domestic - processed and chilled
c) market form • monopoly and monopsony • vertical integration
d) technology • capital and skill as constraints • capital and skill as sources of short and long run rents
e) international and domestic fleet subsidies
• foreign fleets in domestic waters • foreign capital in domestic fleets • domestic subsidies/buybacks
The table below gives a broad-brush overview of the situations in the three BCLME States. Table 6
Whitefish Small Pelagic Crustacean
South Africa
Relatively Competitive catching, monopsony power and some oligopoly in processing: Increasingly fragmented fishery, excess processing capacity. Dry fish and fishmeal competitive, canning less so - small number of labels used by many firms. Effectively unsubsidised.
Namibia
Oligopolistic in both fishing and processing: Extensive vertical integration has enhanced the market power of the large fishing companies who control Catch, Processing and Marketing operations. With broader quota introduction in recent years the firms have leveraged these operations by buying up quota and adding value further along the value chain. Largely unsubsidised.
Less Competitive: Fragmentation increasing, Vertical integration more common, making industry behaviour less competitive. Common labelling. Largely unsubsidised.
Relatively Competitive: many smaller operators make up the catching operation and, while there are relatively fewer factories, product lines are very differentiated – diluting market power. Largely unsubsidised.
Angola Competitive Artisanal and Commercial: High transport costs restrict competition, but while firms may enjoy local monopolies they appear to be generally competitive. Some domestic subsidy. There is some conflict and competition between the artisanal and commercial fleets in inshore fishing grounds. Lack of infrastructure appears the major constraint on adding value in the domestic industry. It has also been cited as the reason for direct transhipping of catch by foreign vessels in Angolan waters.
4.2 Resource Rights Structure3
3 This section is covered in more detail in BCLME LMR/SE/03/03.
__________________________________________________________________________28 BCLME Project LMR/SE/03/02 Market Analysis of Major Fish Product Markets in the BCLME
The governments of Namibia and South Africa have, for socio-economic and political reasons, embarked on campaigns to broaden the base of industry owners and beneficiaries. In Namibia the new policy regime has had extensive impacts. Broader ownership is also beginning to affect the South African industry. In any ‘wild’ fishery property rights are only confirmed when fish are captured. A quota gives its owner a right to a portion of the TAC that sets the legal limit on these captures. Quotas are options to capture. When freely tradable, the quota price indicates the profitability of a fishery. The quota/TAC system is a means of limiting harvests. It is also a means of excluding participants from the industry or restricting their activities in it. Quotas are therefore sources of rents and the potential for political rent seeking can become an important aspect of industry structure. Some of the interventions in favour of black empowerment (South Africa) and Namibianisation reduced the market shares of oligopolistic firms with extensive economies of scale. A concern here is that economies of scale are a natural phenomenon and important for the survival of the industry unless an effective marketing board comes into being. They are particularly important when firms are price takers on the international market and unsubsidised local firms are competing with subsidised international companies – as currently occurs. No official TACs (Total Allowable Catch) or quotas are available for Angola. In the last EU fisheries agreement, roughly 50 European vessels had access to Angolan waters, with few limits imposed (see Table 5 on page 17). This agreement was not re-signed in June 2004 although a variety of bilateral agreements with EU countries have been. Angolan authorities are also reportedly involved in negotiations with China, though these have tended to involve direct investment into state owned fishing companies. The following is an example of the South African and Namibian rights structure for 2001: Table 7
Rights / TAC 2001 South Africa (tonnes)
Namibia (tonnes)
Hake 156 352 200 000
Horse Mackerel 21 500 410 000
West Coast Rock Lobster 1 580 400
Crab 0 2 100
Pilchard 159 685 10 000 Source: Jones, 2003
The environment of rights enforcement is established in both Namibia and South Africa; both countries have legislation, and ocean-going monitoring fleets including aircraft to enforce it. However, South Africa in particular has had compliance problems (Kroese pers. com.). In addition, “the combination of desert and the topography of the coastline have meant that Namibia has only two harbours, those of Walvis Bay and Luderitz, and no other significant landing sites, thus limiting the places where fish can be landed and increasing the ease with which the fishery can be controlled”(World Bank, 2004). Illegal harvesting of Namibian fish resources can still take place if foreign factory vessels enter the Namibian EEZ, or if there is transhipping of catches.
__________________________________________________________________________29 BCLME Project LMR/SE/03/02 Market Analysis of Major Fish Product Markets in the BCLME
Namibia has attempted to enforce fisheries laws and regulation. In response to a parliamentary question, a Spanish MEP revealed that “more than 173 of the European Union’s (EU’s) freezer fishing fleet” (ibid) were operating in Namibian waters at the time of independence. The Namibian government acted to curb such activities, despite being perceived as having very little capacity to do so. According to the SADC Fisheries Unit, South Africa’s Monitoring, Control and Surveillance system, once highly sophisticated, has lost some of its efficiency due to “administrative and funding problems in recent years… there is (now) a lack of control of foreign vessels active on large pelagics at sea” (2000). Several recent international operations in conjunction with Australian resource managers have resulted in the successful prosecution of foreign fleets poaching Patagonian toothfish, but doubts still remain about the effective enforcement of tuna and toothfish regulation. More problematically, the effectiveness of control of local vessels is disputable in waters close to the South African mainland too. Recent high profile cases have seen prosecution of large firms in the whitefish industry, and 22 vessels detected fishing in restricted areas. It is unclear whether these contraventions reflected a belief that monitoring was generally poor. The Namibian State’s position on quota use is unusual. It regards the fish stock as a national asset. Rights to harvest this are implicitly allocated for the benefits they will provide to the state. Failure to capture the allocated right is consequently seen as a problem and the fishing firm is penalised. Firms anticipating problems can return unused quota to the state during the season. The state levies a charge on fishing rights allocated rather than on actual landings in an attempt to capture rents from the fishery. The result is an incentive to fish intensively early in the season, and to target even small fish if mature fish are hard to find. In 2000 quota sales raised N$80m of the $97m collected in fisheries charges and taxes on a total landed catch worth N$2,852m. Saleable rights are sometimes allocated to individuals with no direct involvement in the industry. When resold these “paper quotas” present a number of problems. The Fisheries Act (Act 27 of 2000) uses Namibian citizenship as a primary criterion for rights allocation and although involvement in the industry is ostensibly a criterion, paper quota is a significant feature of the Namibian rights structure. In South Africa the requirement that rights holders be involved in the industry was stated, but the last round of allocations provided many paper quota holders. The administration has, however, undertaken to correct for this in future allocations. This leads to the following section.
4.3 The Role of the State and its Effects The South African and the Namibian fishing industries enjoy scale economies, but both have been increasingly fragmented by State intervention over the past decade. This fragmentation has proved especially problematic in Namibia, where the industry is almost exclusively geared towards export markets. Anecdotal reports suggest that recent quota policies have engendered perverse incentives in the industry. Other significant areas of State intervention, especially those affecting empowerment, trade, exchange rates and interest rates, have also had profound effects. One reason that these effects have been so marked is that the international market is competitive on issues other than price alone. Quality, delivery schedules, reliability etc, affect product marketability. South African producers are fortunate in having a domestic market able to take some of their product and pay world prices. By contrast Angola’s and Namibia’s local markets for high priced and high quality fish are small, and their fish can obtain higher prices in the export market, especially in Europe where Namibian whitefish can command a premium. The global market is nonetheless extremely competitive, and the costs of meeting the government’s social engineering objectives have reduced profits. The shift of South
__________________________________________________________________________30 BCLME Project LMR/SE/03/02 Market Analysis of Major Fish Product Markets in the BCLME
African (I&J) investments from Namibia to Argentina may have been influenced by the lower transactions costs of doing business in South America as well as by the desire to vary the supply of whitefish within the company. Levies and official quota fees are relatively lower in South Africa (see section 3.2). The levy structure imposed by the Namibian government raises firms’ costs, and places them at a disadvantage when competing in the international market. Bank credit also varies in price across the three countries. The prime-lending rate is higher in Namibia than in South Africa, (12.5% as against 11% at time of writing) so firms forced to use local debt are at a disadvantage against those using funds sourced abroad or through foreign parent companies A particular problem is the allocation of quota to individuals unconnected to the industry. This should be a declining issue in South Africa, but is central to the Namibian fishery. Perversely, these ‘paper quotas’, which were intended to help broaden control across races in South Africa, and to "Namibianise" the Namibian industry, bear some of the blame for increasing concentration of effective power (and in Namibia of increasing foreign control). The need to buy quota is especially harsh on local firms that have no foreign shareholding. Namibian fishing firms, like those in South Africa, receive no substantive government subsidy, while many of their international competitors do. However, they can be funded by multinational parent companies (Spanish and South African companies retain control of a number of the companies in Namibia). When the State increases the costs of doing business, and margins are squeezed, it increases the need for such cross-subsidization, and enhances control by foreign firms. The paper quota issue has emerged slowly. In South Africa policy was supposed to preclude it, and indeed it seems likely to become rarer in forthcoming rights issues. In Namibia the 1993 Namibian Government policy statement on the allocation of quotas stipulated (paragraphs 8 & 9) that quota would only go to individuals willing “to make investments in vessels within three years” or to lease them (when preference will still go to those investing in “vessels and/or onshore processing facilities”). The latter was problematic since the industry had significant over-capacity in onshore processing plants, but the intention was clear; only those genuinely concerned with the industry were to receive rights. Despite these stated intentions, the Namibian government has attempted to change the composition of the industry by awarding some quota rights to individuals unable to utilize them directly. Companies that lack quota enter into complex contracts with ‘empowered’ rights-holders. Some Namibian rights-holders bring nothing to a company other than their quota, for which they can be paid a flat fee. This generates no substantive change in the industry; it is an implicit tax that raises operating costs. This cost rise lengthens the time needed before recapitalization, and hinders international competitiveness. Hake quota for freezer vessels (the more lucrative, but also more capital intensive branch of the fishery) commands a significant premium over wetfish quota; roughly N$1600 per ton as opposed to N$650 per ton (Japp D. pers. com. Nov 2004). An aspect of the efficiency-associated tradability of quota is that it ensures rights are sold to the users who will derive the greatest financial benefit from them. This advantage falls away if the seller is not free to deal with buyer willing to pay the highest price. To a degree this is the case in Namibia. The discretionary powers open to the minister allow him to influence which rights-holder should negotiate with which company, presumably to prevent the large-scale loss of employment in companies unable to buy rights. Adverse consequences of this tinkering include lack of consolidation in the industry and increased uncertainty. When considering capital investment decisions, the quota buyer faces a double risk: will the rights-holder will retain his annual quota from the Minister, and will the rights-holder renew his contract with the company.
__________________________________________________________________________31 BCLME Project LMR/SE/03/02 Market Analysis of Major Fish Product Markets in the BCLME
The role of the State has been more problematic in Angola where the Government’s direct participation in the industry historically placed it in competition with private fishing firms trying to expand. Although the State owned fleet has been largely privatised, Lankester (2002) suggests that, “This (involvement) may prevent fishermen’s business initiatives and the development of co-operatives”. The Angolan National Private Investment Agency (ANIP) is “the active promotion and selective targeting of foreign investment that might facilitate the reconstruction and economic and social development of Angola”. They define the government’s objectives as such:
The government’s immediate objectives are to reactivate productive fishing processes, increase fish-conservation activities, and renew catch capacities, as well as increase and rationalize existing cold-storage capabilities. It also plans to revamp and equip naval shipyards, dock areas and fishing ports, while improving the commercial distribution of fish on a national level. Providing technical assistance to entrepreneurs, management training, and scientific investigation is also slated.
Previously state-owned, various small fishing enterprises have already been divested to the private sector as part of a privatization program. Currently, preparation for the privatization of larger enterprises is underway (2006).
In this regard, ANIP has published the following (incomplete) table summarising their progress in the privatisation of state-owned fishing companies:
Table 8
SECTORS / COMPANIES SIZE MISSION FINAL OBJECTIVE FISHERIES SECTOR
Province of Luanda EDIPESCA Small Naval shipyards Privatization ex-FARINOL SOCONAL ERMANAL ENATIP Province of Benguela ESTALEIROS DEOLINDA RODRIGUES ALA - ARRIBA Province of Kwanza-Sul
PESKWANZA Large Marketing and distribution of fish Privatization
Province of Namibe EDIPESCA EMPROMAR KUROCA EMPROMAR KAPIANDALO
FROPESCA Large Marketing and distribution of fish Privatization
Source: ANIP, 2006 In 2005, the Ministry of Fisheries and Environment announced a new rule requiring foreign companies wishing to fish in Angola to form joint ventures with companies owned by Angolans and to invest in local fish processing infrastructure.
__________________________________________________________________________32 BCLME Project LMR/SE/03/02 Market Analysis of Major Fish Product Markets in the BCLME
The US State Department in their 2005 Commercial Guide for US Companies (US Commercial Service, 2005) advises their citizens on the following opportunities within the Angolan fisheries:
• rehabilitating the port of Namibe and its cold storage facilities, • establishing a distribution system for fishing equipment, • constructing additional storage facilities for fish distribution to the domestic market, and • constructing a processing facility to produce canned fish.
5 INDUSTRY CONDUCT
The catching, processing and marketing decisions of the firm, and the lobbying activities of the industry, form the core of the industry’s ‘conduct’. All are driven by (and in turn drive) the structure of the industry. By controlling access the State also participates, indirectly steering the technological decisions of firms.
The Namibian fishery is almost wholly export focussed. In 1999 over 85% of fish caught in Namibian waters was processed in Namibia and exported by around 40 companies operating in the export market. At Independence in 1990 all processing of demersal fish took place offshore, none was landed wet. In part this was due to the overwhelming role of foreign fleets in the local fishery. With the Namibianisation of the industry and pressure from government, the proportion of demersal fish landed wet increased to 5% in 1992 and almost 55% in 2000. For hake alone, approximately 59% was landed wet in 2000, up from less than 6% in 1992 (NFI, 2004). Currently a ceiling of 30% of Namibian TAC may be processed in freezer vessels. Most hake is exported to Spain, Portugal, Germany, Italy, France and the USA where it is usually marketed as whitefish. The implications of this are wide ranging. Processing wet-fish ashore is labour (especially female labour) intensive; indeed this processing provides most of the fishing industry’s jobs in Namibia. Freezer trawlers, by contrast, are capital-intensive using relatively low (and typically male) labour inputs. It is clear that the value of shore-processed hake is less than that of fish processed on board vessel. Lange (citing Manning 1998) indicates this by looking at the prices of hake quotas that were traded informally in Namibia. In 1995, freezer trawler quota traded at N$850 per ton, while wet fish quota sold at N$350 per ton. These figures were both well below the market price of legally traded quota in South Africa (R1840/ton where R1=N$1), but the wet fish/freezer trawler differential suggests that the rents accruing to freezer trawled fish significantly exceed those earned when fish are landed and processed ashore. This view of the differential in profitability between freezer trawling and wetfish processing is reinforced by more recent estimates of Namibian quota trading at N$1500/ton to N$1700/ton and N$650/ton for freezer and wetfish respectively (Japp D. pers. com. Nov 2004). For as long as the bulk of the catch comprises small and medium sized fish and markets are stable, freezer trawling is likely to have an edge. However, land based processing does allow greater product range flexibility. Fish coming in 4 This review is extensively informed by the Intracen, 1999 – the Namibian Supply survey on Namibia’s Fish and Fish products and SADC, 2000 - Fisheries Unit information. Other sources are referenced.
__________________________________________________________________________33 BCLME Project LMR/SE/03/02 Market Analysis of Major Fish Product Markets in the BCLME
to a land based plant can be processed in a greater number of ways, and the value adding potential hence more secure. Thus, in South Africa, where there is no constraint on the proportion of catch harvested by freezer vessels, the proportion of TAC landed as wetfish is little different to that in Namibia where it is strictly regulated. Till recently there were three canning factories for pilchards supplied by locally owned purse seine fishing companies. These factories came under significant pressure because of depleted stocks and are now effectively mothballed. Domestic demand for canned pilchards is limited, and the major market was the SACU. South Africa was a major market for pilchards; other markets were Mauritius, Mozambique, the Democratic Republic of Congo (DRC), Zambia, Zimbabwe and the United Kingdom. Anchovy and juvenile horse mackerel caught by pelagic vessels are reduced to fishmeal and fish oil for which the major market is SA. Historically, most horse mackerel has been processed offshore. In the late nineties large amounts of frozen horse mackerel were exported to West Africa and the former Soviet States. A few companies set up smoking, drying and salting plants on land to cater for regional demand, exporting the final product to the DRC and Zimbabwe, though little such activity remains. Although regional demand has increased, and the marketing of horse mackerel catches has remained relatively stable, the industry has explored markets in Europe and the Far East. This market diversification reduces the risks to company revenues caused by exchange rate fluctuations. This fishery is particularly exchange rate sensitive. Fuel is a major component of the cost structure, the value-added mark-up is relatively low, and the product targets a low-income price sensitive market. Both pilchard and horse mackerel target a price conscious market. Close substitutes exist: Norwegian dried fish and Peruvian/Chilean tinned fish have both taken portions of traditional Namibian export markets in Africa. Specialised vessels catch Crab - mainly for Japanese markets -while lobster is landed at Luderitz for onshore processing. Existing factories are big enough to process further increases in allocated quota. The industry produces three products: whole cooked lobster; frozen whole raw lobster and frozen lobster tails. Canning of tuna in Walvis Bay took place between 1993 and 1997 but has since been discontinued - Namibian pole tuna is now canned abroad. The Namibian government is attempting to encourage the establishment of onshore processing through the creation of an attractive investment environment and is on record as “welcoming fisheries cooperation based on commercial joint ventures between the Namibian fishing companies and foreign owned companies” (Intracen, 1999b). There is, however, significant excess capacity in the canning sector because of falling catches. Most of the fishing industries are located in Walvis Bay, which has seen an important expansion of on-shore processing facilities; Luderitz, however, has been hurt by the collapse of the rock lobster fishery. In Walvis Bay, important secondary industries are developing concurrently with the expansion of the fishing industry. Local businesses now service and repair fishing, research and patrol vessels and produce packing materials such as corrugated cardboard boxes and tin plate cans. Furthermore, there are a number of companies supplying electronics, hydraulic engineering, refrigeration, steel construction and engines.
__________________________________________________________________________34 BCLME Project LMR/SE/03/02 Market Analysis of Major Fish Product Markets in the BCLME
The extensive linkage that has taken place between associated industries in Namibia is a sign of a maturing fishing industry. This development has by and large taken place over the last 10 years – prior to this, most products were imported from South Africa.
5.1.2 South Africa
Onshore processing infrastructure is well developed in South Africa. In 1999, according to the SADC Fisheries Unit, seven canning plants were operating to process sardines, while ten processing plants were reducing 250,000 tons of pelagic species into 55,000 tons of fishmeal and 5000 tons of fish oil. In addition 57 processing and freezing plants were preparing products made from demersal species for market (SADC, 2000). In 2004 Rhodes University’s economic assessment of the South African fisheries calculated that some 16 854 people were employed in secondary and associated industries (Mather et al). The fishing industry is a major employer and generator of income in the Western Cape - in 2003, the average annual income of a fisher was R 38 229 (loc cit). Aside from a small cannery in Cape Town, no tuna is processed in South Africa. The unprocessed fish is exported, while the canned product is imported almost exclusively from the Philippines and Thailand (Intracen, 1999a) The fish product on which margins are frequently tightest is fishmeal. The industry response has been cooperation. Nine of the 12 South African firms, and five Namibian firms, market their product jointly through the SA Inshore Fishing Association. The Association also acts as an importer (with corresponding monopsony power) to make up any shortfall of fish needed.
Case Study 1: A firm in the South African hake fishery.5
The function of management is not to maximise current profit, but to maximise the present value of the expected profit stream over time. It also tries to minimise the variance of the revenue stream. It maximises and stabilises profits using economies of large-scale production (economies of scale) and economies of scope. Economies of scale refer to declines in average cost as the volume of fish processed rises (big canneries producing at lower cost per tin than small canneries). Economies of scope refer to cost savings associated with producing a mix of products. Although this typically refers to joint products and by-products, it can also refer to the risk-reduction benefits of running a number of related product lines. Wet-fish, for example can be sold domestically or abroad and in different forms: fresh, frozen, or processed. This freedom to switch fish between lines gives the large producer an edge over the small one. The benefits of this are evident in the trend to vertical integration within the industry. The major firms in South Africa use a vertically integrated structure i.e. they catch, process, distribute and market the product. Some have also integrated horizontally – contractually linking to other firms that catch, and processing on their behalf. This gives the four main ‘vertically integrated’ companies extensive pricing power and entrenches relationships with the equally oligopolistic domestic retailers. The vertically integrated structure is also found in Namibia, where some firms focus on catching and processing a broad product range. The advantage enjoyed by Pescanova in Namibia is the same in principle as that of I&J or Sea Harvest in South Africa. A case study of a large, capital-intensive whitefish fishing, processing and marketing company in South Africa provides an informative production analysis. The company, one of the ‘big four’ in South Africa, is majority owned by a large, listed consumer goods company – other shareholders include a black empowerment company and an employee trust.
5 Informed by Industry Interview 1, 2004
__________________________________________________________________________35 BCLME Project LMR/SE/03/02 Market Analysis of Major Fish Product Markets in the BCLME
The company runs three distinct processes: a fishing operation consisting of 2 freezer trawlers and 15 wet fish vessels; a Fresh Fish Operation (FFO) that uses 19 machines to produce a variety of filleted fish products; and a value-added operation that produces fish fingers, fish cakes and other crumbed products. The basic input into the production process is 45,000 tons of fish caught per year. 13,000 tons (29%) are caught by the freezer trawlers and 32,000 (71%) tons are caught by the wet fish vessels. This catch results in a landed mass of around 10,000 tons of fish from the freezer vessels; the large, high-value fish (over 1.2kg) and very small, low value fish are exported “in-the-round”. The main export destinations are the United States and Australia. About 25,000 tons of fresh fish are landed by the wet fish operation; this supplies the FFO and the value-added operation. The marketing operation requires, on average, one kilogram of packaging for every 12 kilograms of fish. In addition, one kilogram of additives (crumbs, batter etc) is used for every 11 kilograms of fish produced. Around 11% of the landed mass of fish is discarded as fish offal (skin and bones) that is processed into fishmeal. The production facility is relatively water and electricity intensive using 1,5 litres of water and 1,2 watts of electricity for every kilogram of fish produced.
Figure 12
Source: Company Document
__________________________________________________________________________36 BCLME Project LMR/SE/03/02 Market Analysis of Major Fish Product Markets in the BCLME
Angola
Relative to South Africa and Namibia, Angola has always had extremely limited, and at times non-existent, on-shore processing facilities. The few facilities that did exist deteriorated dramatically are independence in 1976. As laid out in BCLME project LMR/SE/03/03 “in the late 1980s the European Economic Community “funded the reconstruction of the Dack Doy shipyards and two canning plants in Tombua”. Up-to-date information from Angola is limited but 1999 data from SADC Fisheries Unit suggests that the aggregate breakdown of fish processing was as follows:
Figure 13
Processing in Angola 1999
Wet74%
Frozen20%
Dried/salted3%
Fish Oil1%
Canned0%
Fishmeal2%
SADC Fisheries Unit, 2000
This means that almost three-quarters of all fish caught in Angola was sold fresh while the domestic processing infrastructure remains under-developed. Anecdotal evidence suggests that the lack of extensive fish processing in Angola follows from the costs and risks of running a processing system in Angola today (Industry Interview 2, 2004). These are linked to the macro-environment within which the industry operates - mentioned in the industry overview. This report has stressed the gains from adding value through processing. In Angola, however, most of the domestic catch is sold wet. This is a direct result of the still undeveloped road, rail, water and electricity infrastructure in coastal areas, especially the south of the country. This finding suggests that the Angolan government should enhance their efforts to support artisanal fisheries by improving infrastructure to support these fisheries and encourage viable, value-adding processing.
The need to add value to domestic catches has been recognised in the new “Basic Private Investment Law” (ANIP) of 21 April 2006. Fish processing has been given priority as a sector, investment being encouraged by a range of incentives. Generous long-term tax breaks (10 to 15 year in the provinces of Benguela and Namibe) and other benefits have been offered in an effort to attract both foreign and domestic investors.
Further discussion of Angolan development is included in Section 5.2.
__________________________________________________________________________37 BCLME Project LMR/SE/03/02 Market Analysis of Major Fish Product Markets in the BCLME
5.2 Output Market: Export VS. Local Consumption6 Fishery exports from Africa as a whole make up a relatively high 19% of total global fish exports with South Africa, Namibia and Angola making up a significant proportion of this amount. Namibia is the 37th largest exporter of fish in the world while South Africa is 39th. In part, export markets provide a ‘vent for surplus’. This argument for trade is strengthened when foreign markets recognise quality gradations that local markets ignore (i.e. foreign markets differentiate on the basis of quality, while local consumers differentiate on the basis of price). An example is the export of high-grade whitefish to Spanish markets where high quality brings higher prices, while such high quality fish is effectively unavailable to local consumers. Taken to the extreme, high value local product can be totally exported, and local markets supplied with lower quality (but cheaper) imports; e.g. the export of hand lined South African squid and its replacement with cheaper trawled imported product (Loligo sp.). The export of unprocessed tuna, and the import of canned tuna, reflects a different situation. Historic factors such as differential freight costs on frozen and tinned products were one source of this anomaly. Another is the USA’s historically high level of protection against imported tinned tuna. Tuna caught in the Benguela region could be exported frozen to American processors, but high tariffs and lack of access to North American distribution channels, precluded export of tinned tuna to that market. South Atlantic tuna is still sought after by foreign canners, but local tuna markets seem content with the internationally less preferred and cheaper skipjack tuna, an Indian Ocean species now imported largely from canneries in Thailand and the Philippines. The same export reversal pertains in the hake market. South Africa is a net hake exporter, but imports lower grade fish from Argentina and New Zealand for the local market.
5.2.1 Angola
Fish exports make up 89,9% of the value of Angola’s official agricultural exports, reflecting both the importance of the sector and the breakdown of commercial agriculture in the county. At the same time these exports make up only 0,3% of total merchandise exports from the country – which are dominated by oil and diamonds. The levels of exports of fish landed in Angola, however, are extremely low at 5% of total landings - most of the catch intended for the export market is transhipped. Hake exports mainly go to Spain while the small pelagics like pilchards and horse mackerel are exported to Zimbabwe and the Democratic Republic of Congo. Other major trading partners are Italy, Thailand, Japan and Nigeria. Fish exports declined by 47% between 2000 and 2004 – mainly because of a dramatic drop-off in exports to Spain after 2002. As Figure 14 shows, in 2004 the major fish product exported was ‘molluscs’ which constituted more than ¾ of all exports. 6 This analysis appears, in more detail in BCLME LMR/SE/03/02 – Balanced Trade
__________________________________________________________________________38 BCLME Project LMR/SE/03/02 Market Analysis of Major Fish Product Markets in the BCLME
Figure 14
���!"�# ����� $� � ��%���������
)�����$���
0����*����$���
����������$���
'�#�*�����
��#���
Source: TradeMap 2006
Exports to the EU are restricted to whole and gutted products because, as the SADC Fisheries Unit describes, “the last visit by EU inspectors in 2000 concluded that the competent authority was not sufficiently trained and equipped to comply with the EU QC requirements” (2000). It is essential that the Angolan authorities ensure that their industry complies with the EU Quality Control requirements in order to facilitate the development of a national processed export market.
__________________________________________________________________________39 BCLME Project LMR/SE/03/02 Market Analysis of Major Fish Product Markets in the BCLME
Figure 15 shows the source of Angolan exports in the period 2001 to 2004. The most significant feature is the dramatic drop-off of exports to Spain. This was most likely caused by a reporting or data collecting error in the gathering of the statistics. It also shows that Angola’s other major trading partners for fish exports are Japan, Thailand, Nigeria and Italy. Figure 15
� $� � �&����%����
1�&�1�&�
2*��.2*��.
+�������&��
�&�� �&��
,�����+������
�
����
����
����
�����
�����
�����
�����
�����
�����
��� ���� ���� ����
'�
(�)
��
��
��
"�*
3�*������(�4-���*��
+������
,�����
,�-�(��
��(��
5���
���*#��
+��6�7����������$�'���
'���
������
8���#-
������
"�&#(�����$�9����
�&��
1�&�
2*��.
0����
���9��:��"';
Source: TradeMap 2006
Foreign fleets have been fishing in Angolan waters for some years, the Russian/Eastern European off-take, in particular, appearing unsustainably high during the 1970s. The Angolan Government’s agreement with the EU allowed freezer trawling by foreign vessels, but this has been void since 2004. A major sticking point appears to have been Angola’s preference for fishing that will generate local jobs by landing wetfish rather than freezing at sea.
5.2.2 South Africa
In 2004 Fish products rank 20th on the list of South Africa’s exports by value – and South Africa has a 0,7% share of world fish product exports (TradeMap). While global exports in fish products grew by 6% between 2000 and 2004, the growth in South Africa’s fish exports in the same period was more than double, at 13%. In the late nineties, 100,000 tons of fish exports, worth roughly R1 billion, made up 11,1% of South Africa’s primary sector exports but only 1% of total exports. By 2004 the value of exports had more than doubled while the volume of exports increased by 20% – the percentage contribution to South Africa’s exports remained roughly the same. (TradeMap) The main destination for exports, at 25% by volume, is the Spanish market – the rest of the European Union receives over 15% of the exported product from South Africa. Roughly a quarter of all exports are bound for inter-regional markets, mainly the DRC, Zimbabwe, Zambia, Mozambique and Mauritius. By volume, South Africa imported more fish products than it exported over this period: 200,000 tons of fish, valued at R0,7 billion, were imported per year. The average value of an
__________________________________________________________________________40 BCLME Project LMR/SE/03/02 Market Analysis of Major Fish Product Markets in the BCLME
exported product (across all products) at R10/kg was significantly higher than the average value of an imported product at R3,50/kg. This reflects a relatively competitive production advantage that indicates the sophistication of the South African fisheries production complex. This sophistication stems from the strength of the vertically integrated fishing companies which, for profit-margin maximisation reasons, focus on importing non-processed bulk products and processing them into higher value specialised products. Because the distribution is in place, and local consumers are relatively unsophisticated in their demands, processing companies are able to satisfy the local market with cheap imported fish, while exporting local whitefish at a premium. One example of trade imbalance that could impact regional development is the fact that, in 1999, supplies from neighbouring countries accounted for only 8% of import demand in South Africa – even when most of these countries demonstrated a considerably larger supply capacity. At the time South African trade and industry officials, in response to this finding, assured that “under the SADC Trade protocol, South Africa has committed to reduce, in a phased-manner, import tariffs on a wide range of products resulting in a duty-free entry of approximately 90% of sub regional exports to South Africa” (International Trade Centre, 1999 By 2004, however, this percentage had actually decline to 7,5% - perhaps indicating the ineffectiveness of the SADC Trade protocol (TradeMap, 2006).
5.2.3 Namibia
Namibia is an economy dominated by mining, fisheries and agriculture. In 2004 Namibia’s fisheries provided 25% of its foreign exchange (TradeMap). The bulk of Namibian Hake is exported to Spain where it is then distributed to other markets in Europe (see figure 16). The main reason for healthy Namibian exports to the EU is the fact that Namibia has Quality Control levels verified by the EU as equivalent to local EU levels. This, together with Lome Convention membership, allows virtually unrestricted access to EU markets. South African fish has to meet a 15% EU tariff that full Lome members are saved. Figure 16
+���� �&����%�������������,
�&��
<*���
'��
��#*���$����
5���
2*��.
,�*�������
�
��7���
��7���
��7���
���7���
���7���
���7���
���7���
���� ��� ���� ����
�� �
���
�'�
(
<*���
,�*�������
2*��.
5���
��#*���$����
'��
�&��
Source: TradeMap 2006
__________________________________________________________________________41 BCLME Project LMR/SE/03/02 Market Analysis of Major Fish Product Markets in the BCLME
Monkfish and sole are exported to France, Italy, Japan and China while deep-sea red crab and lobster are exported mainly to Japan (FAO, 2001d). Company surveys suggest that the most important export markets for Namibian fish are South Africa, Spain, Italy the United States and Australia. Secondary markets include Greece, Jordan, Israel, Germany and Holland.
Case Study 2: Perverse Incentives and Government Policy
Namibian companies have entered into complex contracts with paper rights-holders. The terms of these contracts differ from company to company, but few appear to involve a genuine sharing of risk between rights-holders and actual fishing companies. The rights-holder can regard a paper quota as a short-term source of income, since there is no guarantee of long-term continuity. Such a rights holder would prefer to sell to the highest bidder. Fishing companies have a long run concern with the sustainability of the fish resource and of the industry. In the short run, their incentive is to either compete with each other in bidding for quota from rights-holders, or to keep quota prices down through collusion. The structure of the industry (the degree of oligopoly) influences their likely strategy. The Minister’s role as referee allows him to influence which rights-holders contract with a given company. Short run political goals need not match with the long run sustainability and efficient use of the resource, so it is not obvious that quota reaches the most efficient companies or those generating the most foreign exchange or employment. The use of quota for social engineering can also affect the resource. Examples are the shift to long lining of whitefish, and the fragmentation of pelagic operations. In Namibia, as in South Africa, long lining seemed a low capital but high value technology that might offer access to the industry for new rights holders. As mentioned elsewhere, this it targets large breeding female fish, impacting on hake recruitment rates and the long run sustainability of the stock. Arguably, the large proportion of hake TAC allocated to long-liners also makes the Namibian hake industry more vulnerable to a single market since this product is largely sold with little value added directly into the Spanish market. In both Namibia and South Africa, the tighter profit margins caused by declining quotas and consequent loss of scale economies, rising transactions costs, and a stronger currency, have forced companies to diversify their product ranges. Hake companies are producing more processed products, moving away from targeting a single fresh market that is vulnerable to unpredictable changes in competition and exchange rates. The Minister has limited avenues open to support the industry. Exchange rate and subsidy-based interventions are not options. This leaves changes to the TAC as the principle ‘support’ tool. Ironically, short-term stimulation of the industry by increasing the TAC may increase long run costs. Just as the preferences of rights holders and fishing companies may be unaligned over time, so the time horizons of the minister, of his scientific advisors, and of the fishing companies, may also be unsynchronized. The vulnerability of marginal players makes it politically difficult to lower TAC. Again, short-term concerns lengthen the time necessary for a recovery of the stock that would benefit all participants in the industry. The 2004 quota period demonstrated this problem. The hake TAC increased in 2004 after the industry petitioned and threatened to close factories. This increase coincided with a scientific recommendation that the TAC fall. The tighter margins in the industry have recently impacted on species such as shark that are not yet governed by quota. As pressure on these fisheries increases so will the need for their control, further increasing the authorities’ monitoring costs. The cost of marketing fish is increased when companies have to enter into individual arrangements with contacts abroad. Cross holdings, inter-firm processing and marketing agreements, and in some cases simple firm size, have allowed some firms to utilize economies of scale and scope in processing and marketing their product. However, many of the smaller firms have not done so, and consequently face higher costs, lower prices and greater market risk. There are no national or regional fish marketing boards in any of the three Benguela based economies, and few companies in Namibia pool their resources when entering export markets, though some use processing and supply agreements with external firms such as Oceana.
__________________________________________________________________________42 BCLME Project LMR/SE/03/02 Market Analysis of Major Fish Product Markets in the BCLME
5.2.4 Whole BCLME
The larger South African domestic market explains the relatively high value ratio of imports to exports in South Africa compared to Namibia. Angola’s imports and exports, by value, are similar – a telling indicator of the underdevelopment of the Angolan fisheries.
Figure 17
����$����"���� ������-����,
�
��7���
��7���
��7���
���7���
���7���
���7���
���7���
���� ,�-�(�� ��#*���$����
'�
(-
��
�
2-&��*�
4=&��*�
Source: TradeMap 2006 Figure 18
���������������!"�# .�-//�����-
�
�����
������
������
������
������
������
������
���� ,�-�(��� ��#*���$����
��
�
4=&��*
2-&��*
����#�*��
'�*��
Source: FIGIS
__________________________________________________________________________43 BCLME Project LMR/SE/03/02 Market Analysis of Major Fish Product Markets in the BCLME
Only around 3% of Angola’s total domestic catch (i.e. excluding catches made by foreign vessels in Angolan waters) is reportedly exported, reflecting the lack of export infrastructure in Angola. Namibia’s small market size ensures a relatively large proportion of the catch is exported, mainly to the EU and to SACU. In comparison, a relatively small proportion (22%) of the South African catch is exported because of robust domestic demand. The “Production” measure in Figure 18 represents the “production of processed commodities”. This gives some indication of what proportion of the catch is processed – although, because the output is measured in tons, a lot of weight would be lost during processing.
Figure 19
Processed Exports as a proportion of Total Exports
0
50000
100000
150000
200000
250000
Angola Namibia South Africa
Tons Unprocessed
Processed
Source: FAO, 2001b
The structure of exports is the chief indicator of the export industry’s development and maturity. Unprocessed exports include fresh, chilled or frozen fish and crustaceans and dried, salted or smoked fish. The processed exports presented in Figure 19 above include canned products and oils and fishmeal. The Angolan estimates should be treated with some caution. Of the fish caught by the Angolan fleet and then exported, processed products constituted only 3% in 2001, though they had been recorded at 37% in 1998. What appears to be a significant shift in industry output is probably a consequence of the unavailability of fish canning and processing data for 2000 and 2001 and a threefold increase in unprocessed exports between 1998 and 2001. In Namibia, 21% of exports by quantity consisted of processed products in 2001 although, in 1998, this proportion was 56%. This discrepancy was, again, probably caused by lack of adequate data for the Namibian industry. In South Africa 15% of exports consist of these processed products. This proportion was relatively stable between 1998 and 2001. The value of processed exports as a proportion of total exports is, on average, lower for Namibia and South Africa than the quantity of processed exports as a proportion of total exports (See Table 9). This is explained by the high value per kilogram of high quality fish like large, long-lined hake.
__________________________________________________________________________44 BCLME Project LMR/SE/03/02 Market Analysis of Major Fish Product Markets in the BCLME
Table 9
Processed Exports Angola Namibia South Africa
…by Total Catch Quantity 3% 21% 15%
…by Total Catch Value 14% 6% 7%
Source: FAO, 2001b In a fishery with well-developed processing technology and export markets such high value fish is exported as fresh or frozen whole fish or fillets. In the above analysis, such fish would be defined as ‘unprocessed’ yet would be of relatively high value. Small and medium sized hake would be processed into fishmeal and oil or, especially in South Africa and Namibia; they could be canned or turned into fish fingers.
The well-developed fisheries technology of South Africa and Namibia allow such high value catches to be less damaged during the catching process and processed more efficiently to preserve the value. Anecdotal evidence suggests that the identification of such species is more difficult in a market with under-developed technology like Angola. Further inefficiencies arise when, in some cases, fish with an extremely high value in its whole or fillet form may be processed into lower value dried, salted or smoked product.
5.2.5 Hake
Together, South Africa and Namibia exported 70% of fresh hake exported in 1999. As Table 10 shows, in 1999, the price of fresh South African hake was significantly above the world hake price – this explains the finding that South African hake exports by value were a higher percentage of total exports than South African hake exports by volume. The two countries exported 40% of total frozen hake exports in 1999 – they experienced additional competition in this market from Spain, Portugal, Argentina and Chile. On average, prices of frozen hake were 24% lower than fresh hake. Both South African and Namibian prices were lower than the world price. This price differential is likely to fall as the average size of long-lined hake declines, and if there is a further shift to processing by freezer trawlers. Table 10
Quantity (t) Value Quantity % Value % $/kg R/kg
South Africa 16,879 R 39,920,000 17% 20% $2.37 R 14.45
Namibia 51,430 R 68,461,000 53% 35% $1.33 R 8.13 Hake 1999 Fresh
World 97,453 R 197,061,000 100% 100% $2.02 R 12.36
South Africa 16,252 R 21,922,000 9% 8% $1.35 R 8.24
Namibia 59,118 R 69,967,000 31% 24% $1.18 R 7.23 Hake 1999 Frozen
World 188,232 R 290,279,000 100% 100% $1.54 R 9.42 Source: FAO, 2001b
The major importers of South African frozen Hake are Spain (49%), Portugal (27%) and Italy (17%) - other importers together buy only 7%. Between 2001 and 2005 the average price
__________________________________________________________________________45 BCLME Project LMR/SE/03/02 Market Analysis of Major Fish Product Markets in the BCLME
paid for a ton of frozen hake by these countries was US$1,787, US$2,020 and US$1,404 respectively. Over this period the average price for a ton of hake increased from around US$1,300 to around US$2,000 while the total quantity of South African frozen hake exported declined from around 19 000 tons to about 13 000 tons. This relationship is detailed in Figure 20 that displays a locus of equilibria for South African frozen hake for the period 2001 to 2005. Figure 20
The FAO groups jack and horse mackerel data but basic analysis of prices and quantities can shed some light on South Africa and Namibia’s positions as exporters globally. Table 11 shows that South Africa has an extremely small percentage of the global export market and that South African exports fetch below half of the international price. This probably has more to do with the price differential between the horse and jack mackerel species but inconsistencies with the FAO reporting of this species are many, with Namibia reporting an inconceivable horse mackerel export of zero for 1999 (FAO, 2001b). South Africa and Namibia’s export prices for frozen Mackerel are also below half of the world price and exports make up only 2,3% of global exports. To some extent the pricing may reflect the sizes of the fish caught. This is a pelagic species, when caught as mature fish they command a premium, when caught smaller, the price per ton is lower. If these are a true straddling stock then the geographical location of fishing activities may be more important with this species than with others in the study. It makes little sense to catch undersized fish fit only for fishmeal when the same fish could be caught when larger and more valuable in a different location. This is a topic that warrants further research. Currently Namibia is the dominant producer in the region. The fleet is partly local and partly leased Russian freezer trawlers. The bulk of the catch (approx 80%) is transhipped and moved directly to markets in West Africa, only 20% being landed for re-export or to be processed ashore. [http://www.nfi.com.na/coldstorage.htm]. The use of foreign vessels, and
__________________________________________________________________________46 BCLME Project LMR/SE/03/02 Market Analysis of Major Fish Product Markets in the BCLME
the practice of trans-shipping, limits the local value added and employment generated by this fishery. Table 11
Horse & Jack Mackerel Quantity Value Quantity % Value % $/kg R/kg
South Africa 464 $106,000 0.6% 0.2% $0.23 R 1.40 1999 Fresh World 79,672 $47,275,000 100% 100% $0.59 R 3.63
South Africa 14,462 $3,435,000 4% 1.9% $0.24 R 1.45
Namibia 3,537 $769,000 1% 0.4% $0.22 R 1.33 1999 Frozen World 368,632 $180,740,000 100% 100% $0.49 R 3.00
Source: FAO, 2001b
5.3 Concentration and Market Power
Angola The Angolan industry is in a transformation period. State ownership is declining – there are only five state owned firms remaining. Quota is issued to local firms: since these are often under-capitalised they are typically entering into joint ventures with foreign producers who provide vessels and market access. The implicit incentives underlying the contracts involved in these joint ventures, like those underlying the contracts underpinning the pre-2004 fisheries access agreement with the E.U., are potentially problematic. This issue is addressed in the BCLME microeconomic systems analysis 03/03 2006. South Africa & Namibia A glance at the major firms that dominate the industry in South Africa and Namibia reveals a system of cross-holdings that incorporates extensive (and cross-border) pyramiding and both vertical and horizontal integration. Despite this industrial concentration and its associated cost savings, there are areas of the industry in which transactions costs have been raised by substantial fragmentation. All stakeholders in South Africa and Namibia’s fisheries have been affected by their government’s attempts at transformation. All have had to adapt to a greater number of players, sharing little more (and sometimes markedly less) quota. These legislative changes have affected the ownership structure in each fishery, but in different ways. They are addressed in an individual BCLME research document LMR/SE/03/03: ‘Measuring transformation’. It must again be stressed that the real scale economies in the fishing industry are not in the catching of fish, but in the processing and marketing of it. The company that dominates both the pelagic and whitefish industries of both Namibia and South Africa is Tiger Brands which exercises effective control over a number of firms including Sea Harvest (73%) and Oceana (41%) in South Africa, they owned and are still tied to Premier Fishing SA and have interests in an empowerment company, Seavuna, whose company CEO is also the chair of Sea Harvest. In Namibia they have interests in Namfish/Namsea, and through Oceana also in Etosha fisheries and the Erongo Group (which also has interests in Angola). Through Oceana in particular they have been cultivating joint venture and supply agreements with smaller operators, offering loans and advances, as well as processing catch on behalf of smaller companies and marketing it under their own brand names.
__________________________________________________________________________47 BCLME Project LMR/SE/03/02 Market Analysis of Major Fish Product Markets in the BCLME
On the whitefish side Tiger Brands in South Africa are in competition with Anglovaal industries that run Irvin & Johnson Ltd (shareholding 75% - the remaining 25% are held by three black empowerment companies, Ntshonalanga, Dyambu holdings and Mast Fishing). I&J is the oldest and largest whitefish processor in South Africa, but effectively moved out of fish harvesting and processing in Namibia, and shifted its interests to Argentina in 2001, buying Alpesca SA. Nonetheless, I&J still retain exclusive rights to sell and distribute Namibian fish on behalf of Hangana. Sea Harvest’s original parent company, Pescanova, is still heavily present as Nampesca in Namibia, where it is in opposition to the local Tiger Brand subsidiaries. Its particular strength remains its broad product range and close contact with the Spanish market that Namibia largely supplies. To give an idea of the economies of scope and scale, and the way in which fragmentation of quota merely keeps small operators at the bottom end of the market or forces them into agreements with larger firms that process on their behalf, a glance at two companies: Oceana and Premier Fishing, will suffice. Premier Fishing SA holds an estimated 8% of South Africa’s pelagic quota, as well as 120 tons of rights to South coast rock lobster, 122 tons of west coast rock lobster, 800 tons of hake, and a squid effort allocation of 80 fishermen. It has 100 percent local market share of fish-paste, an estimated 40 percent of deep-sea lobster and 15 percent of in-shore lobster. It has a further 20 percent local market share of organic fertilizer and an estimated 12-15 percent in pelagics. The firm’s most important product lines are frozen hake, tinned fish and organic fertilizer. All pelagics and fish-paste are sold locally and all lobster, squid, hake and abalone are exported. Pilchards are marketed domestically under the Lucky Star brand owned by Oceana, or they are exported under the Premier’s own brand. Oceana has an annual turnover of R2.7 billion and is considered the largest fishing company in South Africa. The company is involved in catching, processing and procurement of pelagic, lobster, abalone, squid, tuna, whitefish and other resources. It has market power, not only in selling its products, but also in buying from the smaller operators who supply it. Its products are sold through an extensive local and international marketing network. The group buys rock lobster and pelagic quotas from small quota holders, and currently is involved with 68 joint ventures and 126 supply and agency agreements (DEAT, 2004: 21). Mackerel, until this season a non-quota species, is purchased for processing and distribution under Oceana's two domestic fish-paste labels. Anchovy (which is a quota species) is processed into fishmeal and through the production process the firm also produces its organic fertiliser. South Coast rock lobster and hake are the only vessel-based operations and everything else is produced on shore. In recent years roughly fifty percent of the firm's profits have come from exports. As these are generally Dollar or Euro denominated, and the Rand/Namibian Dollar rate is fixed, the firm's profits are particularly sensitive the Rand exchange rate. Further factors driving profit include the prices of substitutes (which range from soya to Chilean tinned fish and local poultry) that influence the sales of their various fish products, the condition of the pelagic stocks, climatic conditions and the price of fuel.
__________________________________________________________________________48 BCLME Project LMR/SE/03/02 Market Analysis of Major Fish Product Markets in the BCLME
6 PERFORMANCE
6.1 Detailed Value Chain per Species Including Costing Analysis 7
6.1.1 Hake
The main demersal catch of the Benguela system is made up of the three species of hake - Merluccius polli, M. capensis and M. paradoxus. From a marketing perspective the three species are treated as one and, indeed, are often rebranded as the generic “whitefish”, though M. polli is regarded as the least preferred and some international buyers will pay a premium for M. Capensis. Hake can be a substitute for many fish products with South African producers using hake meat as the base for a product sold as ‘haddock’ and a product sold as ‘whiting’. This substitutability gives fishing companies significant market power (Anon, 1997). The ultimate value of hake products is dependent on the catch method, the fish size, the depth at which the fish is caught and the time elapsed before sale or processing. Although technological advances have reduced the negative effects of net and pressure damage on the hake catch there is still a significant difference in the final catch quality of trawled fish versus long-lined fish. There is also a slight quality difference between hake caught in deep water by the offshore trawl and hake caught in shallower water by the inshore trawl. This quality difference is reflected under average landed value in Table 12. Long-lined hake also has a lower catch-to-landing ratio because a higher proportion of the catch is landed or exported unprocessed. The catch-to-landing ratio is also listed in Table 12. Table 12
SA HAKE CATCH (2000) Landed Value Catch-to-landing Ratio Wholesale Value
The larger number of potential cuts available from a large hake, and their higher flesh/weight ratio, means that larger hake also have a higher landed value. The relationship between size and price is mapped out in Figure 21. The price of larger hake increased by more over the period concerned than the price of smaller hake. Smaller hake are usually sold after some processing, while larger hake are typically higher value before processing, with minimal labour expended on them. Housewives and
7 A value-chain analysis requires detailed product-level data for specific species and identifiable catch methods. Although information will probably be gleaned from forthcoming data requests currently being processed by the BCLME Project Office, the only suitably detailed and inclusive information that has, thus far, been available is from South Africa’s Marine and Coastal Management for the years 1998-2000. Supplementary data has been requested from various South African firms and organisations to provide a more up-to-date analysis, but, as yet, the only such data that has been provided is for the Maasbanker (horse mackerel), Pilchard, Anchovy and Rock Lobster fisheries in Namibia and South Africa. This existing analysis remains useful because of the similarity of the South African and Namibian fisheries and the current lack of verifiable value-adding production in Angola. BCLME LMR/SE/03/02 contains a more detailed analysis of value chains in the BCLME.
__________________________________________________________________________49 BCLME Project LMR/SE/03/02 Market Analysis of Major Fish Product Markets in the BCLME
restaurateurs would rather add value to the product themselves, than leave it to a factory or commercial operation. Figure 21
Size/Price relationship - South African Hake
R 0.00
R 1.00
R 2.00
R 3.00
R 4.00
R 5.00
R 6.00
1 2 3 4 5 6 7
Size
Pric
e
1999
1998
1997
Source: De Swart (pers.com), 2004
Many South African and Namibian vessels, and EU vessels operating in Angolan waters, have significant processing capabilities on board. Vessels like I&J’s, Oceana’s, Namfish’s or Sea Harvest’s factory freezers may head, gut and fillet hake caught in offshore and mid-water fisheries on board and then freeze them to around -25˚C to transport them to shore. Such semi-processed products fetch significantly higher landed prices because of the quality benefits allowed by rapid processing and freezing at sea. On average, in 2000, South African ocean-processed Hake fillets landed with skin on had a landed value of R11,15/kg. The catch-to-landing ratio of the fillets was 1.94 meaning that almost half of the weight of the fish was removed during the processing. With the skin removed the value of the fish increases to R11,30 but the catch-to-landing ratio increases to 2.25. It must be stressed that the remainder is not lost, but is processed into less valuable products including fishmeal. Maximizing the financial value of the hake catch will require a shift away from shore based processing, and towards the use of factory freezer-trawlers. The product is generally landed in better condition and fetches higher prices. Whether this would make macroeconomic sense is less clear. Such a shift would entail significant job losses in the onshore processing plants, and a skewing of employment away from female unskilled labour and towards male skilled and semi-skilled labour. Currently approximately 85% of demersal fish caught by freezer vessels in Namibia is transhipped directly and exported to Spain. The remaining 15% is landed and either further processed or stored against later delivery. (NFI, 2004) Industry interviews8 suggest that consumer markets are moving towards skin-off products that better suit contemporary tastes. This is cited as a reason for the comparative success of the South African companies relative to the Namibian companies who produce a higher proportion of skin-on products. 8 Industry Interview 1
__________________________________________________________________________50 BCLME Project LMR/SE/03/02 Market Analysis of Major Fish Product Markets in the BCLME
Another industry insight is that the efficiency and capital-intensiveness of offshore processing makes it more profitable than onshore processing. A full shift to offshore processing, however, would come with a prohibitive political cost in terms of job losses. Anecdotal evidence suggests that each ton of fish processed on land is associated with 10 jobs. Government allocation of fishing rights in South Africa and Namibia is dependant on socio-economic considerations including the number of jobs provided by a particular right-holder. Whether such a policy is justified or not is dependent on whether a liberalised, and possibly more capital-intensive, industry would generate productivity benefits that could be taxed and the revenues used to subsidise the local economy. As Figure 22 shows, a significant proportion of the wholesale value of South African hake is ‘added’ during basic processing like heading and gutting, filleting and skinning. The wholesale value of long-lined hake, which is generally of higher quality than that caught in other methods, is, on average, 71% higher than the landed value. The ‘value-additions’ are 60% and 27% for offshore and inshore trawled fish respectively. The trend in Figure 22 reflects the quality differences in products caught using different techniques.
Figure 22
Added Value - Hake (2000)
0.00
5.00
10.00
15.00
20.00
25.00
Inshore Traw l Offshore Traw l Longlining
Val
ue
Wholesale Value
Landed Value
Source: De Swart (pers.com), 2004
By-products of hake processing are also sold locally. Fish heads fetch an average price of 21c/kg while offal, used mainly for animal feed, is sold for 31c/kg. Hake roe is valued at around R2,37/kg while unprocessed fishmeal is valued at R2,15/kg. (De Swart (pers.com), 2004) The Namibian hake fishery has a similar structure to the South African industry and has better trade access to the EU, though its product set is not as extensive as South Africa’s and includes more skin-on white-fish products. Table 13 details an example of recent value addition in the Namibian Demersal fishery. While the unprocessed value of frozen hake is higher than that of wet hake, once the product has been processed the value of the wet product marginally exceeds that of the frozen product. As before, these figures have to be
__________________________________________________________________________51 BCLME Project LMR/SE/03/02 Market Analysis of Major Fish Product Markets in the BCLME
interpreted carefully: much value variation can be traced back to differences in the sizes of the fish involved. Table 13
Hake Value /kg 2004 Frozen Hake Hake Wet fish
Unprocessed N$9,89 N$8,63
Processed N$16,11 N$16,69 Partial reply from Namibian Company Survey July 2004
The main by-catch of the offshore and mid-water hake trawl fisheries relevant to this study, their % of the offshore and mid-water trawl catch and their average values are listed in Table 14:
Table 14
SPECIES % of Catch Catch-to-landing ratio Avg value /kg
Monkfish 4,4% 3.44 R 22.03
Kingklip 2,4% 1.52 R 12.85
Snoek 2,1% 1.43 R 4.25
Horse Mackerel 8,4% 1.07 R 1.87
Jacopever 0,5% 1.02 R 1.00 Source: De Swart (pers.com), 2004
The above-mentioned species make up around 81% of the by-catch from the hake fishery in South Africa. Horse mackerel (or maasbanker) dominates the by-catch but fetches relatively low prices – most of the catch is exported whole to African countries like Nigeria. By far the most valuable by-catch is monkfish, which also has a very high catch-to-landing ratio because edible meat makes up such a low proportion of the total fish weight. In Namibia monkfish is specifically targeted and is therefore not classified as a by-catch. Leftover by-catch is sold by South African fish processors to local communities in an attempt to recoup costs - depending on the quality of the fish, the wholesale price can be as little as R1,50 to R2,00 per kilogram. The total value of the South African offshore fishery in the late 1990s is shown in Figure 23 and Table 15.
__________________________________________________________________________52 BCLME Project LMR/SE/03/02 Market Analysis of Major Fish Product Markets in the BCLME
Table 15
Source: De Swart (pers.com), 2004
Figure 23
South African Offshore Fishery - Total Value
Hake Fresh
Value Added
Hake Fillets (Skin on)
Hake Fillets -SkinlessBy-catch
By-products
R 0
R 200
R 400
R 600
R 800
R 1,000
R 1,200
R 1,400
1997 1998 1999
Val
ue (m
illio
ns)
Source: De Swart (pers.com), 2004
A significant decline in skin-on products was compensated, somewhat, by an increase in skinless products, reflecting a trend reported worldwide in the late nineties (Trondsen, 1997: 13).
Value-added increased from roughly 57% of total wholesale value in 1997 to approximately 66% in 1998 and 1999. The fact that value-added represents roughly 2/3 of the wholesale value of the fish highlights the importance of processing facilities associated with the offshore fisheries and the opportunity cost incurred by those countries that lack processing facilities. It appears that South Africa and Namibia are realising most of this potential value-add while Angola would realise substantial benefit if the infrastructural and socio-political environment allowed the further processing of their catch.
__________________________________________________________________________53 BCLME Project LMR/SE/03/02 Market Analysis of Major Fish Product Markets in the BCLME
6.1.2 Small Pelagics
The most important small pelagic species in the Benguela Current are anchovies, pilchards, round herrings and juvenile horse mackerels. Figure 24 shows the breakdown of the 450,000 tons of small pelagics caught in South Africa in 2000. Relative to the hake fisheries, the small pelagic fisheries have higher volumes and lower values. The dynamics of the BCLME small pelagic fishery over the past few years are detailed in Figure 24.
Figure 24
��������� �4� �$��������-/3������
�,5���������-��!����
,� ���������-��!�������������.
�������������
�
������
������
������
�������
�������
/��
/��
/��
/��
/��
/��
/��
/��
/��
/��
/��
/��
/��
/��
/��
/��
/��
/��
/��
/��
//�
//�
//�
//�
//�
����
����
����
��
�
<*���
����"�#�������
�������������
���������.
���������������
�����������-��!����
,� ���"�#�������
,� �����������
,� ��������.
,� ���������-��!����
�,5�����������
�,5�������������
�,5���������-��!����
�,5��������.
Source: FIGIS 2006
Figure 24 clearly shows that the current three most important species by volume are the Namibian Horse Mackerel, the South African Pilchard and the South African Anchovy. It also shows that the Angolan Horse Mackerel and Sardinella were relatively important until the mid-seventies, and the Angolan Anchovy until the 1990s. Despite their currently depleted states, this bodes well for the future potential of these stocks. Remembering that the Namibian catch was included in the South African figures before 1990 it is also notable how fruitful the South African Pilchard stock was in the sixties and early seventies, and how fruitful the South African Anchovy stock was in the late seventies and early eighties. Catch rates for both stocks appeared to collapse in the early 1990s, and are experiencing something of a revival.
__________________________________________________________________________54 BCLME Project LMR/SE/03/02 Market Analysis of Major Fish Product Markets in the BCLME
Figure 25 shows that the South African anchovy catch has increased consistently and dramatically over the period while the pilchard catch has experienced consistent, but less dramatic, growth. The round herring catch has been in steady decline while the horse mackerel catch has dropped off since 1999. Prices have been relatively stable between the range of 35c/kg and 43c/kg except for the pilchard price that more than doubled from 41c/kg to 86c/kg between 1999 and 2000 – this was caused, in part, by the collapse of the Namibian pilchard fishery at the end of the 1990s. While data for the years 2001-2004 is missing, a plot of the 2005 catch and value figures shows that pilchard prices have come back into line with the prices of others small pelagics. Other prices have increased slightly over the period while the pilchard catch has increased dramatically, and the round herring catch has continued to decline. This dramatic price increase in 2000 is also reflected in the small pelagics Locus of Equilibria plotted in Figure 26. In this analysis the price increase appears as the outlier positioned well above the curve. Note that though this is neither the demand for nor the supply of South African small pelagics, but it does show that equilibrium prices are typically stable in the face of short run supply fluctuations, suggesting that it is part of a competitive global market. Figure 26
Small Pelagics Locus of Equilibria '97-'00
0.00
0.10
0.20
0.30
0.40
0.500.60
0.70
0.80
0.90
1.00
0 50000 100000 150000 200000 250000 300000
Quantity (Tons)
Pri
ce (R
and/
kg)
Source: De Swart (pers.com), 2004
__________________________________________________________________________55 BCLME Project LMR/SE/03/02 Market Analysis of Major Fish Product Markets in the BCLME
The landed value of small pelagics is broken down, by South Africa’s Marine and Coastal Management, into four main cost components: the raw fish price, the quota holder’s premium, the cost of labour, and the price of fuel. The detailed proportions will be affected by the stock size, which is a major determinant of CPUE, but in recent years the actual value of the fish represents around 65% of the landed value while the quota holder’s premium or revenue margin is around 10% (from this the quota holder will pay overhead and variable costs not included in the analysis). Ice used in preserving the fish represents around 7% of the value, while the fuel is roughly 17% Figure 27 shows the change in these cost contributions over the three years from 1998 to 2000 and for 2005. The first three years represent the industry before the collapse of the Namibian stock or the movement of the South African one from the West (Benguela) to the South Coast – while the figures for 2005 provide a recent industry update. While the quota holder’s premium rose by 50% between 1998 and 2005 (from 4c/kg to 6c/kg), the cost contribution from fuel costs increased from 3c/kg of fish landed to 10c/kg of fish landed. The cost of ice also increased from 1c/kg to 4c/kg. Figure 27
Small Pelagics: Input cost breakdown and Output prices - South Africa 2000
R 0.00
R 2.00
R 4.00
R 6.00
R 8.00
R 10.00
R 12.00
1998 1999 2000 2005
Out
puts
R 0.00
R 0.10
R 0.20
R 0.30
R 0.40
R 0.50
R 0.60
R 0.70
Inpu
ts
IceFuelPremiumRaw Fish PriceCanned fishBaitFishmealFish oil
Source: De Swart (pers.com), 2004
In total, costs increased by 35% over the two years but only a 17% wholesale price increase was passed on to retailers. This could be explained by the large margins realised by the processors who, in 2000, took fish worth 37c /kg, processed it into fishmeal, and sold it for R2,60 /kg – a value-addition of 703%. The recorded price of fish oil fluctuated from R1012/ton in 1998 to only R270/ton in 1999 and then up to R2600/ton in 2000. This meant that ‘normal’ mark-ups of over 200% were suddenly reduced to 65% in 1999, but increased to 337% in 2005. By far the largest mark-up is that imposed by manufacturers of canned fish who realised 11866%, on average, on a can of fish in 2005. This margin was realised after the addition of tomato sauce and the canning of the product.
__________________________________________________________________________56 BCLME Project LMR/SE/03/02 Market Analysis of Major Fish Product Markets in the BCLME
There is currently no sign of retail canned pilchard prices falling in the South African market despite the recent strength in the Rand and good catch levels – this could be a result of market power leveraged by vertically integrated or oligopolistic firms in the industry, and long-term market contracts.
Case Study 3: The South African Horse Mackerel / Maasbanker Fishery
In South Africa and Namibia a mid-water trawl targets horse mackerel while the juvenile of the species is caught as a by-catch in the small pelagic fishery, and adults are caught as a by-catch of the inshore demersal fishery. Figure 28
Maasbanker Landings and Value - South Africa
0
5000
10000
15000
20000
25000
30000
1997 1998 1999 2000
Tons
R 0.00
R 0.20
R 0.40
R 0.60
R 0.80
R 1.00
R 1.20
R 1.40
R 1.60
R 1.80
R 2.00
Midwater Landings
Inshore Landings
Pelagic Landings
Midwater Value /kg
Inshore Value /kg
Pelagic Value /kg
Source: De Swart (pers.com), 2004 As Figure 28 shows, in most years the biggest catch of horse mackerel is from the mid-water trawl. In 1998, this amount was second to the large catch of juvenile horse mackerel in the pelagic fishery. Per kilogram, the price of a juvenile fish is less than a third of that of an adult fish. As the figure shows, there is a clear negative relationship between price and landings in the mid-water trawl – this trend has continued in the last 4 years where the price of horse mackerel caught in the mid-water trawl has risen to around R4,50 – R5,00 per kilogram while the landings have decreased to almost zero (Industry Interview 2, 2004). This drastic decline in the stock could have been worsened by the massive catch of juvenile fish in the pelagic fishery in 1998. Blue Continent Product (BCP) dominates the South African horse mackerel fishery, a company that lands most of the catch that is transhipped for export into African markets like the DRC and Nigeria. The Namibian equivalent is Namsov that also exports to Central and West African markets but has also been targeting Japan and EU to insure against price and exchange rate instability. There are three main product markets for horse mackerel: a salted and dried market, a fishmeal market and a bait market. Namsov, the largest Namibian horse mackerel producer experimented with canning the fish but “market resistance” meant the project was abandoned (Intracen, 1999b). Anecdotal evidence suggests that a horse mackerel filleting machine could potentially remove the dark layer of fatty flesh present below the lateral line of the fish and that that will improve the taste and possibly remove the “market resistance”. It appears that the technology is prohibitively expensive given the current market dynamics which include a customer base that is extremely price sensitive and will easily move to lower quality substitutes given a marginal price increase.
__________________________________________________________________________57 BCLME Project LMR/SE/03/02 Market Analysis of Major Fish Product Markets in the BCLME
Figure 29
Dried and Salted Maasbanker 2004
R 0.00
R 5.00
R 10.00
R 15.00
R 20.00
R 25.00
R 30.00
Per final kilogram
Mark-up
Overheads
Labour
Salt
Packaging
Capital
Yield Value (33%)
Source: Industry Interview 2
Figure 29 shows the estimated input costs of a kilogram of dried and salted maasbanker (horse mackerel) produced using an industrial process by a large South African producer. The landed fish is: - headed, butterflied and gutted, - washed, - salted for +/- 7 days, - pre-dried, and - dried in mechanical driers for 3-5 days. While the landed value of a kilogram of horse mackerel is R4,50 in 2004, the ‘yield value’, given a yield of 33%, is R13,50 per final kilogram. The final cost to produce a kilogram of dried and salted horse mackerel is R24,00 per kilogram. Given that the market price for the product is only R18,00 in 2004, the product is currently unviable in South Africa. Anecdotal evidence suggests that the main reason for the South African product being priced out of the market is that dried Cod from Norway is readily available in the main dried fish market in Kinshasa, DRC at a price around R18,00/kg. The situation in Namibia appears to be similar, with several companies complaining that the prices they get for their horse mackerel are below their costs although the volumes of landed fish would suggest, at least, a relatively healthy stock. Some of these companies claim that overseas companies are subsidised to make them viable at the expense of local industries. South African horse mackerel producers have therefore, almost entirely, replaced their operations with other non-quota species like shark, jacopever, St Joseph shark and gurnard.
__________________________________________________________________________58 BCLME Project LMR/SE/03/02 Market Analysis of Major Fish Product Markets in the BCLME
6.1.3 Tuna
Tuna processing in South Africa and Namibia is limited to a small cannery in Cape Town. The tendency is for tuna to be exported unprocessed from the Benguela current system, and for canned tuna to be imported into the region. This pattern is explained by the uneven supply of tuna – a migratory fish, the superiority of the global fleet which follows the fish across oceans, and lack of access to the North American distribution channels. While a variety of tuna species are caught in the BCLME, most are migratory and their exploitation requires specific skills. During the drafting of the South African fisheries policy it was decided that foreign vessels would need to fish local waters to make up a shortfall in South African tuna fishing capacity. The application to allow several Korean, Japanese, Philipino and Namibian vessels access was “conditional on the transfer of skills to South African crew; the reflagging of the vessel within 12 months with the SA Maritime Safety Authority; and in the interim period, that is, between the allocation of the quota and the
Figure 30
Fishmeal and Bait: Maasbanker 2004
R 0.00
R 1.00
R 2.00
R 3.00
R 4.00
R 5.00
R 6.00
Fishmeal Bait
Markup Overheads Labour Holding Freezing Packaging Capital Yield Value (33%)
Source: Industry Interview 2, 2004
Figure 30 shows the input breakdown for Maasbanker fishmeal and bait. Once again the final prices are seen to be above the market prices that are currently at R3,75/kg for fishmeal and R2,50/kg for bait. The apparent under-utilization of the horse mackerel fishery does not mean that the remaining stocks are unfished. Significant quantities of juveniles are caught in anchovy nets and turned into fishmeal, while Blue Continent Products catches most of the remaining quota and tranships it for presumably profitable overseas markets.
__________________________________________________________________________59 BCLME Project LMR/SE/03/02 Market Analysis of Major Fish Product Markets in the BCLME
changes of flag, the flag state had to authorise that all fish landed by that vessel accrued to South Africa.” (Business Report) These conditions were imposed because South African was looking to build capacity in tuna fishing and required a local catch record with the International Commission for the Conservation of Atlantic Tuna. Recent reports have suggested that the foreign vessels have failed to meet the conditions imposed in the original agreements and are transhipping fish rather than land them in South Africa, as agreed. (Business Report) As Figure 31 shows, the South African landed value per kilogram stayed relatively constant between 1997 and 2000 with significant disparity between the three species. Value-added over the period, on average, was around 32% of landed value for albacore, 55% for yellowfin and 17% for big eye tuna. This measure increased significantly in 1999 when the wholesale value of albacore and yellowfin increased to 62% and 100% of the landed value respectively. Figure 31
Tuna Landed and Wholesale Value - South Africa
R 0.00
R 2.00
R 4.00
R 6.00
R 8.00
R 10.00
R 12.00
1997 1998 1999 2000
Albacore Landed
Yellow fin Landed
Big Eye Landed
Albacore Wholesale
Yellow fin Wholesale
Big Eye Wholesale
Source: De Swart (pers.com), 2004
South Africa lacks significant processing facilities for tuna and the entire landed catch – except that destined for the one small processing plant in Cape Town - is exported, mainly to the Philippines. The increase in wholesale value in 1999 can be attributed to a depreciation of the Rand in that year which made the imported processed product more expensive.
6.1.4 West Coast Rock Lobster
BCLME/LMR/SE/03/02 “Recommendations on beneficiation and commercialization of fishing activities” provides a detailed analysis of the Rock Lobster market. It outlines the export strategy of South African and Namibian firms which concentrate on producing a wide range of lobster products, thereby reducing market risk and provide economies of scope.
__________________________________________________________________________60 BCLME Project LMR/SE/03/02 Market Analysis of Major Fish Product Markets in the BCLME
It has also resulted in the emergence of “specialist processing intermediaries who offer a range of services to small operators, and to cooperative processing and marketing enterprises that small quota holders can join”. Figure 32
5����������6��!�������������
�
���
���
���
����
����
����
����
����
��� �� ������ ����� ������ ������
��
�
"�����*����
��-�*���'�--������:,��������;
0#���'�--�������:<$$�����;
Source: West Coast Rock Lobster Association 2006
This paper also proposes that the economic viability of the fishery and its associated processing industry is linked to four variables:
1. Catch per unit effort – driven by stock abundance and influenced by water and weather conditions,
2. The exchange rate – the margins in lobster products benefit from a weakening Rand and Namibian Dollar (linked to the Rand 1:1)
3. Market conditions – the supply-side is influenced by the cost and availability of air freight and the demand–side is influenced in a seasonal fashion as producers in Australia and New Zealand drop out of the market towards the end of the Southern African season.
4. Allocation date of quota – quota allocated earlier can be stored in purging tanks, quota allocated later may have to be frozen if tank capacity is limited, and the market may be glutted by the time the catch is brought in.
BCLME/LMR/SE/03/02 “Recommendations on beneficiation and commercialization of fishing activities” also provides detailed value chains for live, frozen and cooked lobster. Figure 32 shows how the West Coast rock lobster combined commercial catch rose from 2100 tons to 3100 tons in the period 2001-2005, prior to that, however, it was relatively stable at approximately 1800 tons. Figure 33 shows that the proportions of products produced in these preceding years have changed significantly. The products produced are less than the total catch because the yield on a frozen lobster tail is approximately 14%-17%. As Figure 33 shows, the increase in live lobster reflects substitution between processing lines with the price increase in live products relative to frozen products over the period.
__________________________________________________________________________61 BCLME Project LMR/SE/03/02 Market Analysis of Major Fish Product Markets in the BCLME
Figure 33
West Coast Rock Lobster - South African Production
Live
Whole Frozen Cooked
Whole Frozen Raw Frozen Tails
Catch
0
200
400
600
800
1,000
1,200
1,400
1,600
1,800
2,000
1998 1999 2000
Tons
Source: De Swart (pers.com), 2004
Figure 34 shows that the landed value dipped from its equilibrium value of around R37/kg to R20/kg in 1999. The value of the various wholesale products continued on an upward trend despite this dip in landed value.
__________________________________________________________________________62 BCLME Project LMR/SE/03/02 Market Analysis of Major Fish Product Markets in the BCLME
Figure 34
R 0
R 20
R 40
R 60
R 80
R 100
R 120
R 140
R 160
R 180
R 200
1998 1999 2000
West Coast Rock Lobster Value per Kilogram - South Africa
Landed Value
Live
Whole Frozen Cooked
Whole Frozen Raw
Frozen Tails
Source: De Swart (pers.com), 2004
Figure 35 on page 63 presents a more recent cost structure provided by the West Coast Rock Lobster Association. This shows that the mean landed value per kilogram for live lobster declined to approximately R104 in 2005 from highs of R130 in 2000 (see Figure 34, above). The Association estimates the following cost structure for the South African commercial Lobster fishery:
__________________________________________________________________________63 BCLME Project LMR/SE/03/02 Market Analysis of Major Fish Product Markets in the BCLME
6.2 Fishing, Processing and Monitoring Capacity in Angola Industry data from Angola is scarce. Anecdotal evidence is not optimistic. The EU fishing agreement did not maximise returns to the country from the resource. In the absence of domestic capacity what has emerged is short-term justification for ‘leasing-out’ resource access to a foreign fleet through agreements that effectively offer a share of the catch in exchange for capital equipment. In the longer-term, the opportunity costs of such contracts outweigh the benefits (in terms of revenue and employment). It appears that the first step in the establishment of a local industry able to catch, process and market significant amounts of the Angolan resource is the formation, and application, of a comprehensive fisheries policy to regulate a sustainable industry. In large measure this need has been addressed by the new fisheries act (6a/04 - 8th October 2004). Importantly, this act requires that all rights be in the hands of Angolan citizens or Angolan registered companies. Several South African investors who have visited Angola with the intention of investing in the fishing industry have identified the uncertainty around policy as the main deterrent to investment. A lack of policy certainty may jeopardise the future of planned capital investments. Again, the need to coordinate investment incentives has been recognised in the activities of the Angolan National Private Investment Agency (ANIP) Other concerns raised are the lack of adequate transport, communication and utility infrastructure. Commercial fishing enterprise has onerous logistical needs - poor infrastructure can preclude investment. Currently, most rents from the Angolan fisheries
__________________________________________________________________________64 BCLME Project LMR/SE/03/02 Market Analysis of Major Fish Product Markets in the BCLME
accrue in Luanda, because it is the only centre with adequate transport infrastructure. If fish is not processed in Luanda, or transhipped, it is sold wet or possibly dried and salted for local consumption. An obvious location for an additional landing and processing location in the south of the country is Lobito. The port has plants processing frozen and salted fish, but its development is restricted by the lack of transport and utility infrastructure to the rest of the country and region. As such, the maintenance of the Lobito railway line to Zambia and the Democratic Republic of Congo is a developmental priority. Namibe also offers potential, but being even further from Luanda and having no rail access, is at an even greater disadvantage than Lobito (Figure 36). Figure 36
__________________________________________________________________________65 BCLME Project LMR/SE/03/02 Market Analysis of Major Fish Product Markets in the BCLME
6.3 Resource Management and Industry Establishment The efficiency of the aggregate national (or regional) industry output can be broken into two distinct components that contribute to the value-adding process:
• Resource Management - The establishment of a stable, well-managed resource, and
• Industry Establishment - The creation and preservation of an efficient, competitive industry
Several fishing company owners interviewed lamented the undercutting experienced in industries like the horse mackerel fishery and ascribed the problems of the industry to the
__________________________________________________________________________66 BCLME Project LMR/SE/03/02 Market Analysis of Major Fish Product Markets in the BCLME
industry distortions created by fisheries policy. Their main issue is that the players in the industry are prevented from developing required economies of scale and can, therefore, not compete against international producers who are able to achieve these scale economies. They attribute this failure to 3 main problems:
• Fragmentation: the quota is divided between too many smaller players who are each unable to develop economies of scale,
• Trans-shipping: the offshore and foreign processing of the catch. This leaves local plant underutilized. It also means local producers exporting processed product, may be competing against fish caught in their own waters, but processed under subsidy abroad.
• Short term quota: business owners in the fishing industry claim that, while it takes approximately 10 years to amortize large capital investments, most quotas are only granted for a fraction of this time.
6.4 Marketing-orientated Value Adding and Supply-demand Balance Market failure associated with a shared resource has traditionally been manifested in a “tragedy of the commons” situation where short-term profit-maximising behaviour by individual firms has resulted in the over-exploitation of fish stocks. As such, most fisheries management has focussed on the sustainable exploitation of the resource rather than the maximisation of the long-term market value of the total catch. This traditional approach is understandable given the complexity of marketing process and the logical reliance on supply- and demand-driven market mechanisms to ensure efficient outcomes in a competitive global market for fish products. One of the consequences of the rapidly developing global market for fish is the entrenching of competitive advantages by individual countries, regions and firms, facilitated by the broad set of processes known as ‘globalisation’. This relatively recent development has created the opportunity for the management of aggregate market-orientated, value-adding (MOVA) processes within the South Atlantic terrestrial fisheries as a whole, South Africa, Namibia and Angola at a domestic level, and the fishing industries within the three countries. Trondsen (2002) defines MOVA as “a business behaviour and culture, which utilizes market values and creates superior value for buyers by generating, disseminating, and responding to market intelligence”. He defines three major, progressive objectives of fisheries management:
1. motivating the maintenance of sustainable fish stocks, 2. allocating fishing rights to preferred fisher groups, and, 3. improving profitability through cost efficiency.
Our market analysis has shown that the three BCLME countries are at different stages in the fulfilment of each of these objectives. South Africa and Namibia have gone some way towards achieving the second objectives, but recent stock management problems in Namibia have undermined some of these achievements. All three countries need to move effectively to the third stage in order to compete globally and maximise the benefits accruing to the region. Global consumer demand for fish has increased in recent years (Trondsen, 1997: 8) while global supply has decreased (FAO, 1999). In the analysis developed by Trondsen and Ottesen (1993) this situation would reflect a negative supply/demand balance (SDB). In a competitive market standard economic theory would predict an aggregate price increase
__________________________________________________________________________67 BCLME Project LMR/SE/03/02 Market Analysis of Major Fish Product Markets in the BCLME
induced by these dynamics – this price increase should translate into an increase in resource rents extractable within productive, well-managed fisheries. A resource rent in fisheries is the profit margin between market value and the costs of catching, processing and selling the catch. In reality, global markets for fish are subject to many rigidities and barriers that may oppose or accentuate these market forces as well as supply, and sometimes demand, attributes particular to fisheries. Fish supply is highly variable year-on-year because of environmental and ecological changes, over-exploitation and related fisheries management obligations. The consumer-level manifestation of this variation depends on the substitutability of fish products. In South Africa and Namibia, and most other fishing countries, governments regulate the industry to ensure the sustainability of fish stocks and a fair distribution of property rights amongst the industry’s participants. These factors can lead to variations within the total fish supply (especially in terms of size, species and catch mix), as well as variations of the total fish supply. Fishing firms are by and large beholden to these ‘basic’ factor conditions but they can potentially modify ‘advanced’ factor conditions to enhance their competitive advantage (Porter 1990 in Trondsen, 1997: 10). In fisheries, advanced factors include specialised technology used to increase the supply of fish preserved and fresh fish quality, to supply specially demanded products and to develop economies of scale in production and logistics from catch to consumer (Trondsen, 1997: 11). Appropriate use of this specialised technology can enhance and entrench a firm’s ‘market power’; that is, the ability of the firm to extract resource rents. If this market power is persistent then it can lead to a Sustainable Competitive Advantage (SCA) as defined by Porter which defines a situation where a firm is utilising “business capabilities in assets and skills” (1980 in Trondsen, 1997: 10) to maximise resource rent extraction. In recent years, this rent maximisation is becoming increasingly dependent on an industry’s ability to add value to processed products, supply quality fresh products, quickly alter the product mix to meet demand, and build more long contracts in stronger buyer-seller relationship. These attributes are all encompassed by a broader, market-orientated, value-adding (MOVA) process as defined by Trondsen (1999: 1). The basic factor conditions on the supply-side listed above are the main constraints to the marketing of fish products. This means that “supply management of fish products in demand is… a key factor for maximizing market values, rather than catch-driven sales” (Trondsen, 1999: 3). Globally, many firms have can use the above-mentioned ‘advanced’ factor conditions to manage their supply. Large, vertically integrated processing and marketing firms like Unilever, Nestle, Pescanova and Nippon Suisan Kaisa attain SCA by expanding economies of scale in production and logistics and leveraging buying power and specialised technology. Harvesting and primary processing are largely retained in coastal States because of domestically-owned rights, but companies involved in this area are encouraged by multinational buyers to produce “standard, semi-processed products… that can be the raw material for further-processed consumer products” (Trondsen, 1997: 10). This process has, on a global scale, diversified the sources of supply and, conversely, concentrated control of market channels in the hands of relatively few firms. These firms have used their market power to increase substitutability between products and reduce dependency on variable supply. The label “Whitefish” is now used on consumer fish packs throughout Europe as a generic name for cod, hake and Alaska Pollack. This has made substitution between the species easier.
__________________________________________________________________________68 BCLME Project LMR/SE/03/02 Market Analysis of Major Fish Product Markets in the BCLME
In South Africa, three large primary processors of fish, Irvin & Johnson, Oceana and Sea Harvest, have developed ‘single channel’ marketing systems that incorporate catching, processing, cold storage and distribution processes. In Namibia, Namfish is the largest vertically integrated fishing company. Trondsen’s analysis provides an insightful positioning of the existing Benguela Current fishery companies and the potential restructuring of the various industries. As defined above, Trondsen forecasts a fundamental shift from a positive SDB to a negative SDB in global fisheries (1997: 16). Initial analysis suggests that this shift is also found in the Benguela Current fisheries. Table 16
TRONDSEN Positive SDB Negative SDB
Market dynamic Supply > Demand Supply < Demand
Product type Semi Processed and Frozen Packs Fresh Consumer Packs
More important Quantity Price
Less important Price Quantity
Superior firm structure Multinationals Small Producers
Source: Trondsen There is a place for smaller, niche fishing companies specialising in the market-orientated provision of quality fresh product. In the processed whitefish industry, however, and to a lesser degree in the pilchard cannery, the viability of such companies will need either the cooperation of the large vertically integrated enterprises, or more direct involvement in marketing by the State.
__________________________________________________________________________69 BCLME Project LMR/SE/03/02 Market Analysis of Major Fish Product Markets in the BCLME
7 CONCLUSIONS
The State can intervene to help reduce the risks faced by fishers and fish processors. Possibilities identified include:
• Use operational management procedures (OMPs) when determining TAC and quota
• Make quota longer lived and tradable
• Secure infrastructural services especially electricity, transport and water
• Improve market access via trade agreement
• Ensure that competitions policy allows vertical and horizontal integration
• Safe and secure banking system that offers forward cover and easy discounting of trade bills.
Other useful interventions with implications for marketing include:
• Pooling catch effort and survey data to improve modelling
• Begin multi-species bio-economic modelling
• Identify excess capacity in the region
• Facilitate joint marketing (marketing cooperatives) to augment supply contracts between fishing firms and processors.
• In the pilchard fishery stop differentiating between bait and other permit – let the fish simply go the highest value use.
• Establishing a coherent long-line/trawl policy for hake – this requires data collection and careful modelling to find the optimal economic yield.
In terms of the whitefish resource, South African and Namibian policy makers and firms face a set of choices:
a) How to catch
• Using long line vessels, or
• Demersal trawlers
b) How to process
• shore based wet-fish processing: maximise short term jobs in the industry but accept lower tax revenues and reduced industry profitability, or
• freezer-trawlers: maximise profits in the industry and tax these, using the tax revenues to create jobs and develop infrastructure
c) To whom to sell – which drives the catching and processing decisions from the industry’s perspective
The States’ interventions will affect their tax revenues and industry employment. They therefore should be informed by the governments’ abilities to spend tax revenues productively. If State spending will not create long-term jobs and improve infrastructure (and
__________________________________________________________________________70 BCLME Project LMR/SE/03/02 Market Analysis of Major Fish Product Markets in the BCLME
hence the productivity of labour and capital) the preservation of exiting shore based processing jobs makes absolute sense. The problem facing Angolan policy makers is more complex. They have to decide on a long-term strategy. Key issues will include the role of domestic processing, the situation of the E.U. fleet and its catch, whether to keep Luanda as the centre of the processing industry or to develop infrastructure at Lobito and Namibe. They also face conflict between the low-income artisanal fishery (which is both a major employer and a significant source of food to local communities) and the commercial fleet. Both groups are effectively unmonitored. Job creation through shore based processing of high value fish remains problematic. Although simple drying and freezing of pelagics is a major employer, much of the catch is currently transhipped for processing elsewhere. In all three countries there have been attempts to encourage small-scale enterprises in the industry. Undoubtedly these have a place, certainly in fishing, but also in areas of processing and distribution. However, this study found that some of the more profitable aspects of the industry remain effectively closed to them, particularly in the generic ‘whitefish’ market. The reason is that larger firms typically have a broad product range, a geographically spread international market, and an ability to import fish for local processing when appropriate. These combine to lower costs, reduce risks and raise effective margins. Economies of scale and scope naturally lead to oligopoly. Undoubtedly the administrations of the three BCLME States could help to increase the returns small-scale operators get in these markets. Two possible interventions would be to cooperatively introduce a single channel marketing board, and to provide low cost cold storage facilities where they are not already in place. However the oligopoly firms currently in the industry are dynamic, profitable, and major employers. They are easier to monitor than small firms, are committed to the industry and have invested in it. It is not obvious that the State should replicate their activities. This report will ultimately inform BCLME project LMR/SE/03/02: “Proposed system of measurable indicators to monitor and evaluate the impacts of the BCLME programme”. To this end, the following Table of market-related measurable indicators has been mooted, based on the observations made during the investigation. Table 17
Indicators Namibia South Africa Angola
State of physical infrastructure
Roads budget Railways budget Number of electricity blackouts
Good Good Poor road, rail & telecommunications electricity supply unreliable.
Catching infrastructure Gear and vessel register
Reasonable Reasonable
Processing infrastructure
Employment, product range, excess capacity
Overcapacity in pelagic industry
General overcapacity Lack of capacity
Distributing infrastructure
# of international flights # of cold storage facilities % of catch transhipped
Reasonable domestic and international links
Strong domestic and international links
Poor domestic and international links
Value-added Mean Final value/ landed value per species
Good, but limited opportunities for Horse-Mackerel
Good Poor
Domestic market Fish imports Fish consumption per capita
Export market EU, HACCP, USDA approval % of catch exported
Excellent Good Poor
__________________________________________________________________________71 BCLME Project LMR/SE/03/02 Market Analysis of Major Fish Product Markets in the BCLME
Marketing Major brands Co-operative boards Trade fairs
Lack of cooperation in export markets.
Large companies have strong brands, but lack of cooperation in export markets.
Weak
State of the resource CPUE Age distribution of species Catch
Pilchard and rock lobster poor. Recovery slow
Most in reasonable condition
Inshore fisheries depleted, offshore uncertain
Modelling of resource # of scientists Years of experience Published papers
Loss of institutional memory since independence. Need for multi-species modelling
Loss of institutional memory. Need for multi-species modelling
NGO and State
Monitoring of resource Budget on enforcement # of inspectors Salaries of inspectors # of patrol vessels # of aircraft
Good, but still has problems
problematic Poor.
Transformation % BEE (S. Africa), % foreign control Employment
Good Good Poor
Property rights Quota duration Transferability of quota # of court cases/ appeals # of convictions
Adequate Adequate Poor
Management Process OMPs operable Teething problems in implementing OMPs
OMPs largely in place. But credibility problems remain with role-players outside industry
Fisheries policy still to be established
__________________________________________________________________________72 BCLME Project LMR/SE/03/02 Market Analysis of Major Fish Product Markets in the BCLME
8 REFERENCES
Agritrade. 2006. “The EC denounces the fisheries agreement with Angola” Available at: http://agricta1.cta.int/en/content/view/full/2255
Anon. 1997. “How South Africa transformed hake into the most sought-after species. In, M Stuttaford, (ed.), Fishing industry handbook: South Africa, Namibia and Mozambique. Marine Information CC, Stellenbosch, South Africa, pp 198-199. ANIP, 2006. How To Invest In Angola pp53-54 Available at: www.caaei.org/HOWTOINVESTINANGOLA2006.doc Boyle, G. A., 1980. Government Regulation of the Fisheries: An analysis of Principles and a Case Study of the SA/ SWA Fishing Industry. Unpublished Economic Hons. Thesis, UCT. Business Report. Available at: http://www.busrep.co.za/index.php?fSectionId=561&fArticleId=3367599 Business Report http://www.busrep.co.za/index.php?fSectionId=565&fArticleId=3124354 Cockcroft, A. C. & A. I. L. Payne, 1999. A cautious fisheries management policy in South Africa: the fisheries for rock lobster, Marine Policy, Vol. 23 # 6, pp. 587-600.
Cole, J. D., 1987. Legal restraints imposed by South African Legislation on Commercial Exploitation of Pelagic Fish. Unpublished LLM Dissertation, Marine Law, UCT. De Swart, C. 2004. Personal Communication. Printed data from the Marine and Coastal Management (MCM) database. 1997-2000 for all species except Demersal: 1997-1999. Department of Environmental Affairs and Tourism (DEAT) 2004. Transformation and the South African Fishing Industry. Government Printer. Pretoria. FAO. 1999 “Information on Fisheries Management in the Republic of Angola” Available at: www.fao.org/fi/fcp/en/ANG/body.htm FAO. 2001a. “Fishery Country Profile: South Africa Profile” Available at: www.fao.org/fi/fcp/en/ZAF/profile.htm FAO. 2001b “Yearbook: Fishery statistics – Commodities” FAO Fisheries Series: No 65. FAO Statistics Series: No. 175. Food and Agriculture Organization of the United Nations, Rome. FAO. 2001c “Information on Fisheries Management in the Republic of South Africa” Available at: www.fao.org/fi/fcp/en/ZAF/body.htm FAO. 2001d “Information on Fisheries Management in the Republic of Namibia” Available at: www.fao.org/fi/fcp/en/NAM/body.htm FAO. 2002. “Fishery Country Profile. Namibia”. Available at: http://www.fao.org/fi/fcp/en/NAM/profile.htm FAO. 2004a. “Fishery Country Profile: Angola”. Available at: http://www.fao.org/fi/fcp/en/AGO/profile.htm
__________________________________________________________________________73 BCLME Project LMR/SE/03/02 Market Analysis of Major Fish Product Markets in the BCLME
FAO. 2004b. “Information on Fisheries management in the Republic of Angola” Available at: http://www.fao.org/fi/fcp/en/AGO/body.htm FAO/GIEWS. 1997. “Food Outlook July/August/September 1997 – Fish and Fisheries Products”. Available at: http://www.fao.org/docrep/004/w6284e/w6284e09.htm FGIS. 2006. “Fisheries Global Information System” Global Capture Production Dataset 1950-2004 Available at: http://www.fao.org/figis Hampton. I, Boyer, D.C., Penney, A.J., Pereira, A.F. and Sardinha, M. 2000. “Integrated overview of the Benguela current region”. UNDP-RAF/96/g43. Available at: www.ioinst.org/bclme/factfig/fisheries.htm Industry Interview 1, 2004. South African White Fish Company Industry Interview 2, 2004. South African Mid-water Trawl Company International Trade Centre. 1999. “Sub regional Trade Expansion in Southern Africa: South African Buyers/Sellers Meeting on Fish and Fish Products” Available at: www.intracen.org/sstp/doc/report/fish.htm Intracen. 1999a. “Supply-Demand Survey on Fish and Fish-products in South Africa” Available at: www.intracen.org/iatp/fishcafe/safrica/ Intracen. 1999b. “Supply-Demand Survey on Namibia’s Fish and Fish-products” Available at: www.intracen.org/iatp/fishcafe/safrica/ Japp, D.W. 1995. “Report submitted to the Longline Management committee on the Hake directed longline pilot study conducted from 23 May 1994 to 31 May 1995”. Department of Environmental Affairs, Sea Fisheries Research Institute, Cape Town. Working Document: WG/09/95/D:H:16 Japp, D.W. 1996. “Summary of the Hake fishery in 1995”. SFRI Working document WG/05/64/D:H: 7 Jones, J.M. (ed) 2003. Fishing Industry Handbook: South Africa, Namibia and Mozambique (31st edition). George Warman Publications, Cape Town. Lankester, Kees. 2002. “The EU-Angola Fisheries Agreement and Fisheries in Angola” Available at: www.panda.org/downloads/marine/Angola_Fishing_brief.doc Mather, D., Britz, P. J., Hecht, T. and Sauer, W.H.H. 2004. “Economic Sectoral Study”. Volume 2. Department of Ichthyology and Fisheries Science and Department of Economics and Economic History, Rhodes University, Grahamstown McGregor R. 2000. McGregor’s Who Owns Whom (20th edition). Purdey Publications, Grant Park. NFI, 2004. Comprehensive Statistics on the Namibian Fishing Industry. Available at: www.NFI.com.na Nichols, Paul. 2004. Email assistance. MFMR, Namibia
__________________________________________________________________________74 BCLME Project LMR/SE/03/02 Market Analysis of Major Fish Product Markets in the BCLME
Porter, M. 1980. Competitive Strategies. The Free Press, N.Y. SADC Fisheries Unit. 2000. “SADC Marine Fisheries & Resources Sector” Available at: www.sadcfisheries.com/country.asp Saville. A. D., 1997. A computational Dynamic Bio-economic Model of the Optimal Utilisation and Management of South Africa's Renewable Marine Resources: A case of the Hake Fishery, Unpublished PhD thesis, University of Natal. TradeMap. 2006. TradeMap: Trade Web: http://trademap.net. Accessed: 25/07/06 Trondsen, T. 1997 “Value-added fresh seafood. Barriers to growth” Journal of International Food and Agribusiness marketing” Vol. 8(4) 1997, pp 55-78 Trondsen, T. 1999. “Market Orientated Value Adding (MOVA) and Fisheries Management”. Norwegian College for Fishery Science, University of Tromsø, Norway. Trondsen T. and Ottesen G. 1993. “Competitive factors for marketing of valued added fresh whitefish in the EU”. Report to the Norwegian Research Council. Norwegian College of Fisheries Science, University of Tromsø. US Commercial Service. 2005 “Doing Business in Angola: A Country Commercial Guide for US Companies” U.S. & Foreign Commercial Service And U.S. Department Of State, van Dongen, Irene S. 1962. Sea fisheries and fish ports in Angola. Sociedade de Geografie, Lisboa. Van Sittert, L., 1993. 'Making like America': The Industrialisation of the St Helena Bay Fisheries c. 1936-c.1956, Journal of South African Studies, Vol. 19, #3,Sept. pp. 422-446. West Coast Rock Lobster Association. 2006. “ESS Estimate 2003/4 Season” World Bank. 2004. “WB Policy Brief 9: Resource rent as a central concept in fisheries management: The case of Namibia” Available at: www.sifar.org/DfID_Keysheets/WBPolicyBrief09_1.htm
United Nations Office for Project Services The Chrysler Building 405 Lexington Avenue New York, NY 10174 USA Telephone: +1-212 457-4000 Fax: +1-212 457-4001 E-mail: [email protected]
BCLME Activity Centre for Living Marine Resources C/o Ministry of Fisheries and Marine Resources Strand Street PO Box 525 Swakopmund Namibia