j ourna l h omepa ge: www.elsev ier .com/ locate /apcatb
ndium-doped TiO2 nanoparticles for photocatalytic CO2 reductionith H2O vapors to CH4
uhammad Tahir1, NorAishah Saidina Amin ∗
hemical Reaction Engineering Group (CREG)/Low Carbon Energy Group, Faculty of Chemical Engineering, Universiti Teknologi Malaysia, 81310 UTM,kudai, Johor Baharu, Johor, Malaysia
r t i c l e i n f o
rticle history:eceived 6 February 2014eceived in revised form 8 May 2014ccepted 22 June 2014vailable online 28 June 2014
eywords:ndium doped TiO2
hotocatalysis
a b s t r a c t
Indium (In)-doped titanium dioxide (TiO2) nanoparticles were synthesized using a controlled sol–gelmethod. The structures and properties of the catalysts were characterized by XRD, FE-SEM, TEM, XPS,BET, UV–vis and PL spectroscopy. Indium, present over the TiO2 in metal state, inhibited crystal growthand produced anatase phase of mesoporous TiO2 nanoparticles. Doping In in TiO2 also increased thesurface area and enlarged the band gap. The photocatalytic activities of In-doped TiO2 nanoparticleswere considerably improved for CO2 reduction with H2O vapors in a cell type photoreactor. CO wasobserved as the main product over TiO2, but doping In in TiO2 remarkably increased the CH4 yield. CH4
production rate over 10 wt.% In-doped TiO 2 was 7.9-fold higher than the bare TiO2 at 100 ◦C and CO2/H2O
O2 reductionydrocarbon fuelsinetic study
ratio of 1.43. In addition, C1–3 higher hydrocarbons namely C2H4, C2H6, C3H6 and C3H8 were detectedin the product mixture. The enhanced photoactivity in mesoporous In-doped TiO2 nanoparticles can beattributed to interfacial transfer of photogenerated charges, which led to effective charge separation andinhibited recombination of photogenerated electron–hole (e−/h+) pairs. Langmuir–Hinshelwood model,developed to investigate reaction rate parameters, fitted well with the experimental data.
Global warming, primarily due to carbon dioxide (CO2) emissionn the atmosphere during fossil fuel combustion has invigoratedonsiderable environmental issues. Therefore, technologies per-aining to carbon management, which not only mitigate globalemperature, but can also fulfill partial energy needs are in demand1]. Artificial photosynthesis is of significance importance dueo water splitting to hydrogen (H2) or CO2 reduction with H2Oo hydrocarbon fuels and value added chemicals such as carbon
onoxide (CO), methane (CH4), methanol (CH3OH), formic acidHCOOH) and formaldehyde (HCHO). Thus, artificial photosynthe-is provides alternative and sustainable pathways to resolve globalnvironmental issues apart from resolving energy crises [2]. In this
erspective, Inoue and Fujishima et al. [3] pioneered photocatalyticO2 reduction with H2O as a reducing agent. The products observedere HCOOH, HCHO, CH3OH and CH4 in presence of both oxide
and non-oxide photocatalysts. Since then, significant efforts havebeen taken to design and develop selective photocatalytic systemfor efficient CO2 reduction to value added chemicals and hydro-carbon fuels, but low photocatalytic activities have hindered thedevelopment. Therefore, better and more efficient photocatalystsare inevitable to maximize CO2 conversion and yield rates withimproved selectivity [4–7].
Among various semiconductor materials, the focus has been onthe widely researched titanium dioxide (TiO2) as photocatalyst.It is well established that TiO2 has several advantages includinghigher oxidative potential, relatively cheap, abundantly available,non-toxic, and chemically/thermally stable [8,9]. However, TiO2 isphotoactive only under UV light irradiations due to its wide bandgap energy (3.20 eV for anatase). Moreover, lower CO2 reductionefficiency and selectivity, attributed to immediate recombinationof photogenerated charges (e−1/h+), has been reported over TiO2.Therefore, it is imperative to modify TiO2 structure to preventrecombination rate of electron and hole pairs for effective CO2photoreduction to value added chemicals and fuels [5].
Previously, different types of metals, non-metals and meso-
porous materials have been investigated to improve TiO2photocatalytic activity. The addition of metals into TiO2 struc-ture could prevent recombination of electron–hole pairs. The morecommon researched metal-doped TiO2 photocatalysts for CO2
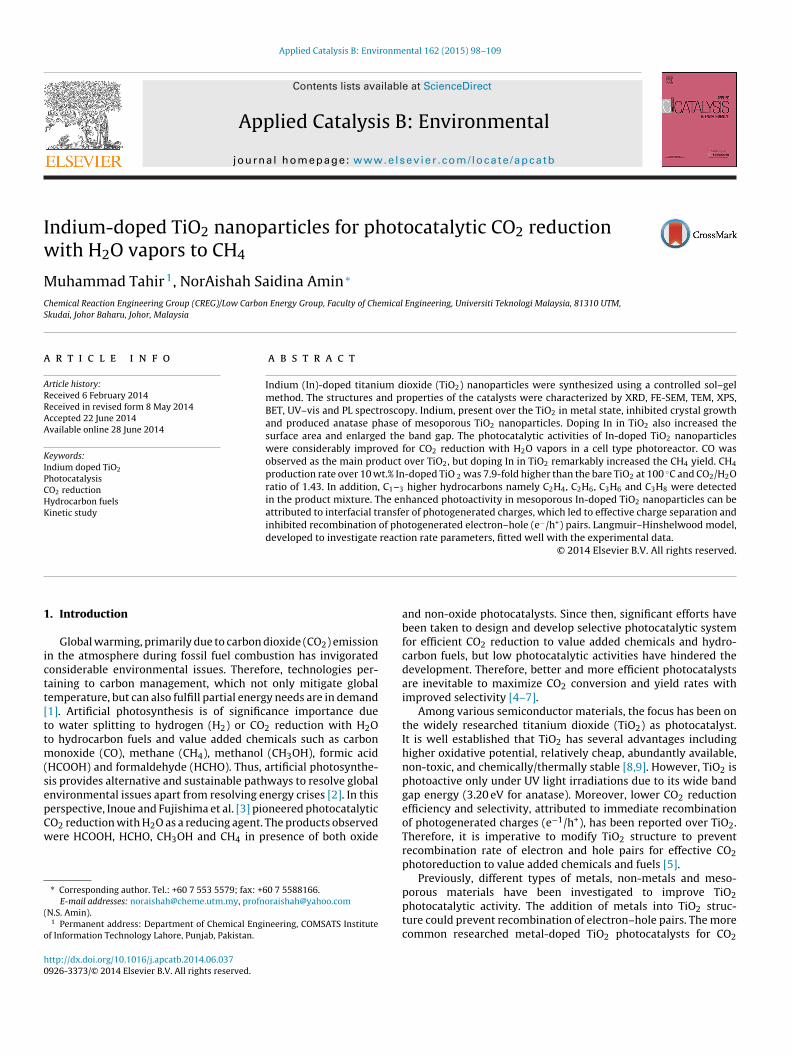
ig. 1. Schematic of sol–gel method for preparation of In-doped TiO2 nanoparticles.
eduction include Cu/TiO2 [10–12], Rh/TiO2 [13], N/TiO2 [14], I/TiO215], N-Cu/TiO2 [16], and Ag/TiO2 [17]. Besides, In is considered asn efficient metal to enhance TiO2 photoactivity and selectivity asn-metal has the ability to produce large number of electrons due toacant d-orbits and can hinder photogenerated charges over TiO2.
The specific characteristics of In-metal include: (1) relativelyheaper, (2) multiple oxidation states (In◦, In+1, In+3), (3) higherlectron production, trapping and mobility, and (4) lower toxic-ty [18]. Pozynak et al. [19] investigated In2O3 modified TiO2 foregradation of 2-chlorophenol and reported efficient separation ofhotogenerated charges in nanocrystalline In2O3/TiO2 photocata-
yst. Similarly, highly efficient N-doped In2O3 was observed during2 production through H2O splitting [20]. In another study, H2O
plitting with higher H2 yield rate was observed over In2O3/TiO221]. Recently, In2O3/C3N4 hybrid photocatalyst was investigatedy Cao et al. [22] for CO2 reduction to solar fuels. Higher CH4 and2 yield rates were observed due to efficient production and sep-ration of photogenerated electron–hole pairs (e−/h+), resulting inigher CO2 reduction efficiency.
Due to the ability of In to produce large number of electronsith hindered recombination rate, it is appropriate to explore it
urther for CO2 reduction applications. The objective of this studys to test the performance of In-doped TiO2 nanoparticles for CO2hotoreduction with H2O vapors to hydrocarbon fuels using cellype photoreactor. The catalyst samples were characterized usingRD, FE-SEM, TEM, BET, XPS, UV–vis and PL spectroscopy. Theperating parameters investigated were In-doping, reaction tem-erature, CO2/H2O feed ratio and irradiation time for maximumield rates. Langmuir–Hinshelwood model was developed to obtainundamental insights for plausible reaction mechanism.
. Experimental
.1. Synthesis of indium doped TiO2 nanocatalysts
Fig. 1 describes the schematic procedure for synthesis ofn-doped TiO2 nanoparticles. In-doped TiO2 nanoparticles wererepared using a controlled sol–gel single step method using tita-ium (IV) iso-propoxide (Merck) and indium (III) nitrate (Merck).
Environmental 162 (2015) 98–109 99
The precursory of titanium solution was prepared with molarratios: Ti(C4H9O)4:15C2H5OH:2CH3COOH (1 M). Typically, 10 mLof titanium tetra iso-propoxide was mixed in 30 mL of isopropanoland was stirred for 30 min in a 250 mL round bottom flask (sam-ple A). In parallel, 6.37 mL of 1 M acetic acid was dissolved in 10 mLof isopropanol by stirring for 30 min (sample B). Hydrolysis processwas conducted by adding drop wise sample B into sample A and vig-orously stirring the mixture for 24 h at 30 ◦C. Next, an appropriateamount of indium nitrate was dissolved in isopropanol under con-stant stirring for 30 min. Both indium and titanium solution werestirred for 12 h until clear sol was produced. The sol was dried inthe oven at 80 ◦C for 12h under airflow. The dried sol was grinded tofine powder. Finally, the samples were calcined in a muffle furnaceat a rate of 5 ◦C min−1 up to 500 ◦C and held at this temperature for5 h. The bare TiO2 nanoparticles were also prepared using the sameprocedure.
2.2. Characterization
In order to determine the structure and crystallinity of the sam-ples, powder X-ray diffraction (XRD) was performed on BrukerD8 advance diffractometer (Cu-K� radiation, � = 1.54060 A, oper-ated at 40 kV and 40 mA). The scanning rate was 1.2◦ min−1 from10◦ to 70◦. Field emission scanning electron microscopy (FE-SEM)was performed using JEOL JSM-6701F with EDX detector for cal-culating elements composition in photocatalysts. The particle sizeand lattice structure of the individual crystals were visualized byhigh-resolution transmission electron microscope (HR-TEM) withFEI-Tecni G2 Transmission Electron Microscope (TEM). Texturalcharacterization of the samples was analyzed with a MicromeriticsASAP 2020. The N2 adsorption–desorption properties were exam-ined at 77 K. Specific surface area (SBET) of monolayer coveragewas determined using Brunauer–Emmett–Teller (BET) method. Thepore size distribution was measured from the adsorption branch ofthe isotherm by means of Barrett–Joyner–Halenda (BJH) method.The XPS measurement was performed using Omicron DAR 400analyser. The photocatalyst was fixed to the sample holder usingcarbon tape. The pass energy used was 20 eV, while the instrumentwas operated at 15 kV. The survey spectra were recorded in therange of 0–1400 eV. The binding energies were calibrated againstthe C1s signal (284.6 eV) as the internal standard. UV–vis absorp-tion spectra of the samples were obtained from Shimadzu UV 3101pc UV-Vis-NIR spectrophotometer. Finally, the recombination rateof the photogenerated electron–hole pairs (e−/h+) was estimatedusing Perkin Elmer LS 55 Luminescence spectrophotometer.
2.3. Photocatalytic activity test
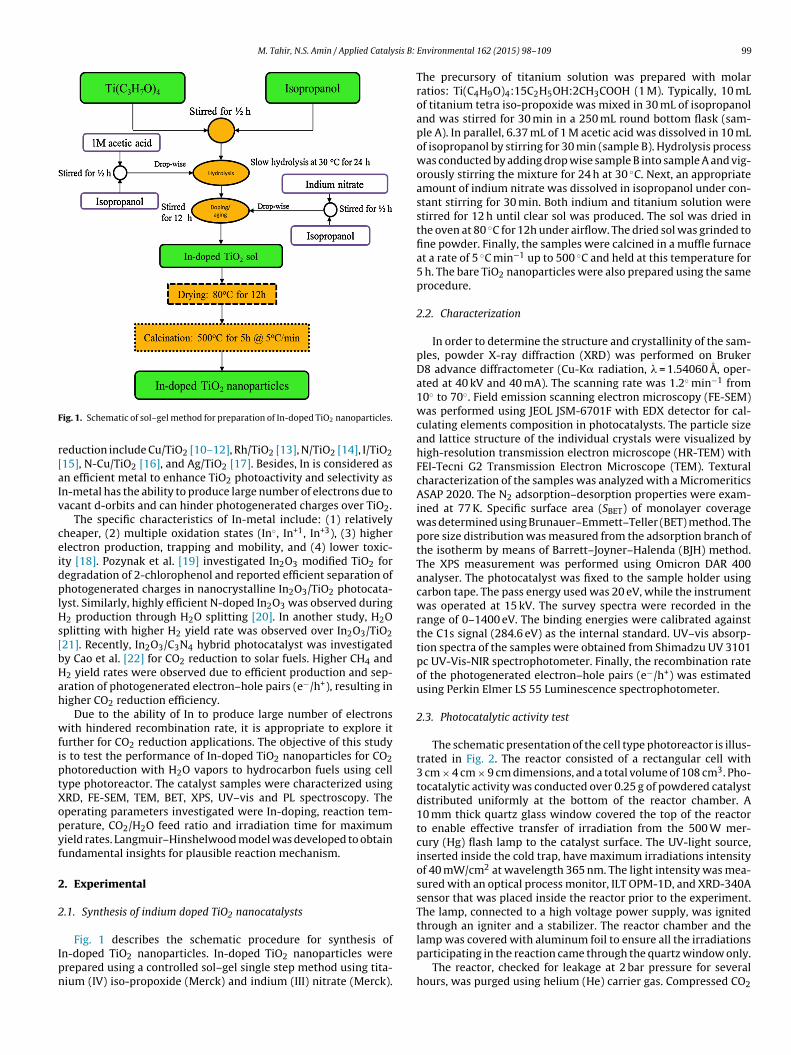
The schematic presentation of the cell type photoreactor is illus-trated in Fig. 2. The reactor consisted of a rectangular cell with3 cm × 4 cm × 9 cm dimensions, and a total volume of 108 cm3. Pho-tocatalytic activity was conducted over 0.25 g of powdered catalystdistributed uniformly at the bottom of the reactor chamber. A10 mm thick quartz glass window covered the top of the reactorto enable effective transfer of irradiation from the 500 W mer-cury (Hg) flash lamp to the catalyst surface. The UV-light source,inserted inside the cold trap, have maximum irradiations intensityof 40 mW/cm2 at wavelength 365 nm. The light intensity was mea-sured with an optical process monitor, ILT OPM-1D, and XRD-340Asensor that was placed inside the reactor prior to the experiment.The lamp, connected to a high voltage power supply, was ignitedthrough an igniter and a stabilizer. The reactor chamber and the
lamp was covered with aluminum foil to ensure all the irradiationsparticipating in the reaction came through the quartz window only.
The reactor, checked for leakage at 2 bar pressure for severalhours, was purged using helium (He) carrier gas. Compressed CO2
99.99%) regulated by mass flow controller (MFC) was bubbledhrough water saturator to carry moisture. The CO2 concentrationas controlled using He (99.99%) as the diluent. The pressure inside
he photoreactor was maintained at 0.20 bars above atmosphericressure. The reactor was purged for an hour using a mixture ofO2 and He prior to starting the experiment.
During photocatalysis process, the product mixture wasnalyzed using an on-line gas chromatograph (GC-Agilent Tech-ologies 6890 N, USA) equipped with a thermal conductivityetector (TCD) and a flame-ionized detector (FID). Similarly, forffline analysis, gaseous products from the reactor were also takensing a gastight syringe (Agilent, 1000 �L) having the same volume.he FID detector was connected with a HP-PLOT Q capillary col-mn (Agilent, length 30 m ID 0.53 mm, film 40 �m) for separationf C1–C6 paraffin and olefin hydrocarbons, alcohols and oxygenatedompounds. The TCD detector was connected to UCW-982, DC-200,orapak Q and Mol Sieve 13X columns. The UCW-982 was used forack flush and reversed flow to ensure C6 and higher compoundsould be detected earlier in the chromatogram. Meanwhile, C1–C2,3–C5 compounds and light gasses (H2, O2, N2 and CO) were sepa-ated using Porapak Q, DC-200, and MS-13X columns, respectively.
.4. Calculation of yield rate and selectivity
The yield rate and selectivity of carbon containing products arealculated using Eqs. (1) and (2).
ield rate of Ci (mole g−1 h−1) = mole of Ci in product(wt. of catalyst × time)
(1)
electivity of product Ci (%) = Ci moles in productTotal moles of C produced
× 100
(2)
here Ci is the mole of carbon species (CO, CH4, C2H4, C2H6, C3H6nd C3H8) in the product mixture and C is the moles of total carbonompounds produced.
. Results and discussion
.1. Structure and morphology of In-doped TiO2
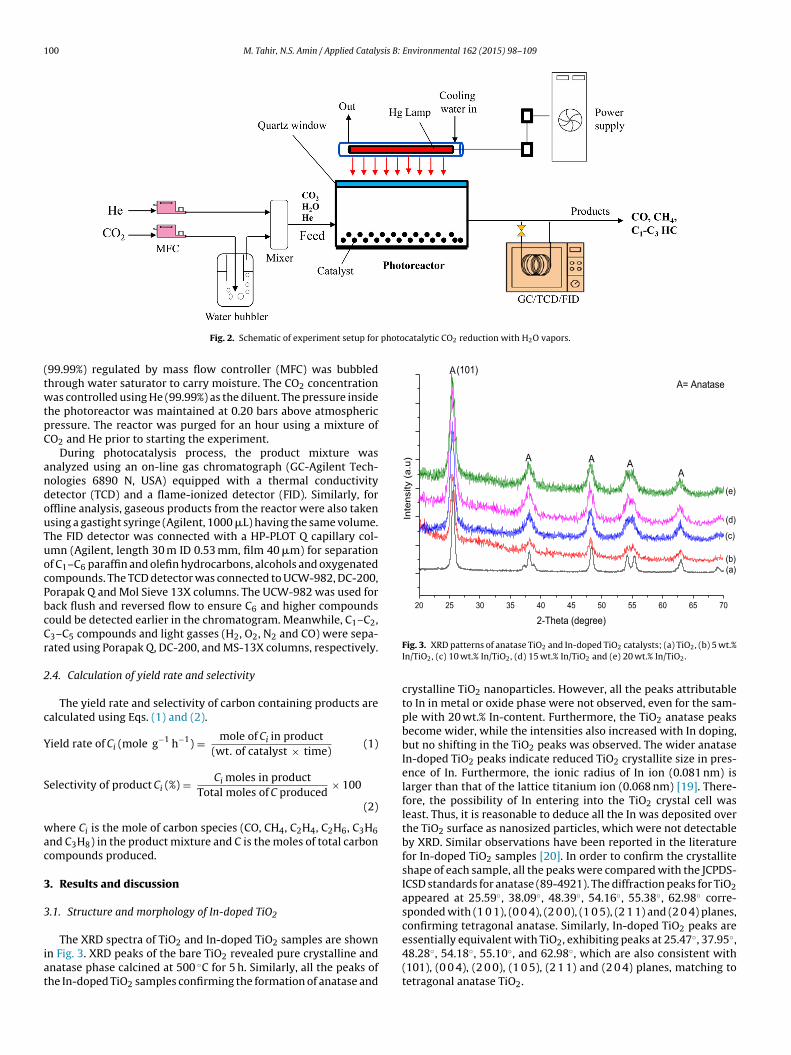
The XRD spectra of TiO2 and In-doped TiO2 samples are shownn Fig. 3. XRD peaks of the bare TiO2 revealed pure crystalline andnatase phase calcined at 500 ◦C for 5 h. Similarly, all the peaks ofhe In-doped TiO2 samples confirming the formation of anatase and
Fig. 3. XRD patterns of anatase TiO2 and In-doped TiO2 catalysts; (a) TiO2, (b) 5 wt.%In/TiO2, (c) 10 wt.% In/TiO2, (d) 15 wt.% In/TiO2 and (e) 20 wt.% In/TiO2.
crystalline TiO2 nanoparticles. However, all the peaks attributableto In in metal or oxide phase were not observed, even for the sam-ple with 20 wt.% In-content. Furthermore, the TiO2 anatase peaksbecome wider, while the intensities also increased with In doping,but no shifting in the TiO2 peaks was observed. The wider anataseIn-doped TiO2 peaks indicate reduced TiO2 crystallite size in pres-ence of In. Furthermore, the ionic radius of In ion (0.081 nm) islarger than that of the lattice titanium ion (0.068 nm) [19]. There-fore, the possibility of In entering into the TiO2 crystal cell wasleast. Thus, it is reasonable to deduce all the In was deposited overthe TiO2 surface as nanosized particles, which were not detectableby XRD. Similar observations have been reported in the literaturefor In-doped TiO2 samples [20]. In order to confirm the crystalliteshape of each sample, all the peaks were compared with the JCPDS-ICSD standards for anatase (89-4921). The diffraction peaks for TiO2appeared at 25.59◦, 38.09◦, 48.39◦, 54.16◦, 55.38◦, 62.98◦ corre-sponded with (1 0 1), (0 0 4), (2 0 0), (1 0 5), (2 1 1) and (2 0 4) planes,confirming tetragonal anatase. Similarly, In-doped TiO2 peaks are
essentially equivalent with TiO2, exhibiting peaks at 25.47◦, 37.95◦,48.28◦, 54.18◦, 55.10◦, and 62.98◦, which are also consistent with(101), (0 0 4), (2 0 0), (1 0 5), (2 1 1) and (2 0 4) planes, matching totetragonal anatase TiO2.
a Crystallite sizes calculated using Scherrer equation.b Surface elemental contents calculated using EDX.
The size of the crystallites in Table 1 was estimated usingcherrer equation based on XRD (1 0 1) peaks. At higher In content,maller crystallites are obtained possibly due to In controllingiO2 crystal growth. The calculated crystallite sizes were 19, 14,1, 10, and 9 nm for TiO2, 5, 10, 15 and 20 wt.% In doped TiO2amples, respectively. Obviously, at higher In content, the decreasen crystallite size is significant. Similar observations have beeneported in the literature [21]. Furthermore, cell parameters andell volumes of TiO2 and In-doped TiO2 crystallites are summarizedn Table 1. The cell parameters and cell volumes are comparable tohose reported in JCPDS-ICSD (89-4921) standards for anatase TiO2,.e. a = b = 3.777 A, c = 9.501, and v = 135.54 A3. These observationsonfirmed fully developed tetragonal crystal shape of anatase
iO2, while In-incorporation into TiO2 lattice did not alter the celltructure.
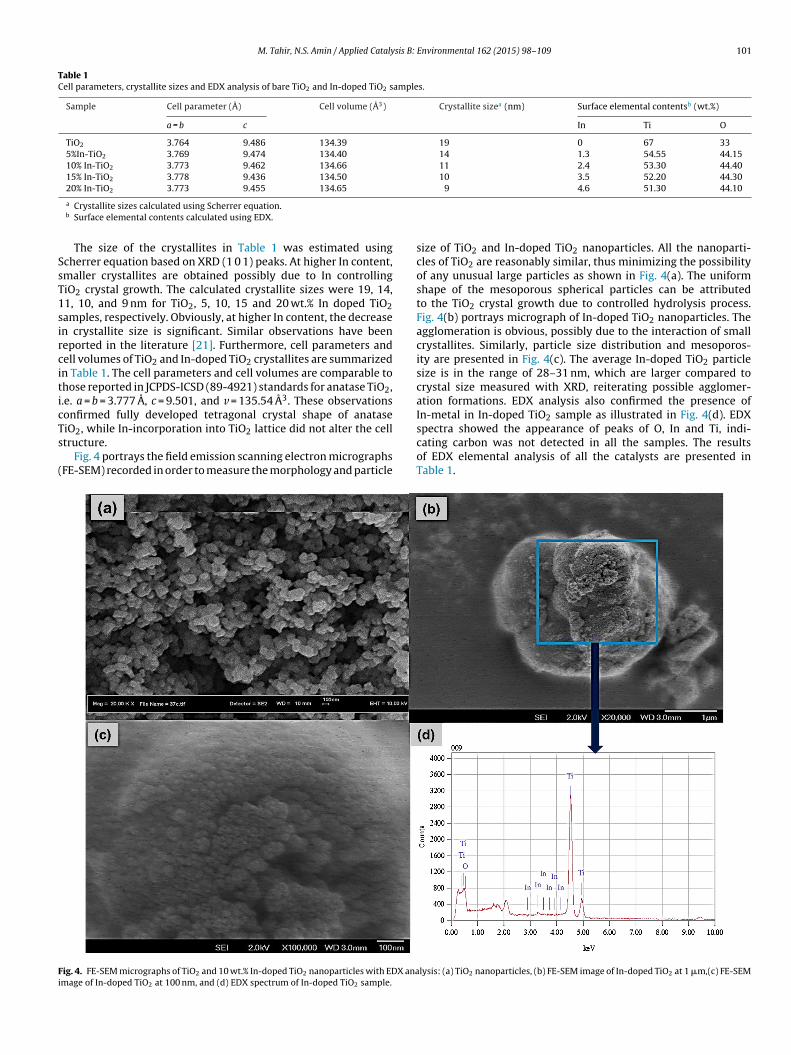
Fig. 4 portrays the field emission scanning electron micrographsFE-SEM) recorded in order to measure the morphology and particle
ig. 4. FE-SEM micrographs of TiO2 and 10 wt.% In-doped TiO2 nanoparticles with EDX anamage of In-doped TiO2 at 100 nm, and (d) EDX spectrum of In-doped TiO2 sample.
size of TiO2 and In-doped TiO2 nanoparticles. All the nanoparti-cles of TiO2 are reasonably similar, thus minimizing the possibilityof any unusual large particles as shown in Fig. 4(a). The uniformshape of the mesoporous spherical particles can be attributedto the TiO2 crystal growth due to controlled hydrolysis process.Fig. 4(b) portrays micrograph of In-doped TiO2 nanoparticles. Theagglomeration is obvious, possibly due to the interaction of smallcrystallites. Similarly, particle size distribution and mesoporos-ity are presented in Fig. 4(c). The average In-doped TiO2 particlesize is in the range of 28–31 nm, which are larger compared tocrystal size measured with XRD, reiterating possible agglomer-ation formations. EDX analysis also confirmed the presence ofIn-metal in In-doped TiO2 sample as illustrated in Fig. 4(d). EDX
spectra showed the appearance of peaks of O, In and Ti, indi-cating carbon was not detected in all the samples. The resultsof EDX elemental analysis of all the catalysts are presented inTable 1.
lysis: (a) TiO2 nanoparticles, (b) FE-SEM image of In-doped TiO2 at 1 �m,(c) FE-SEM
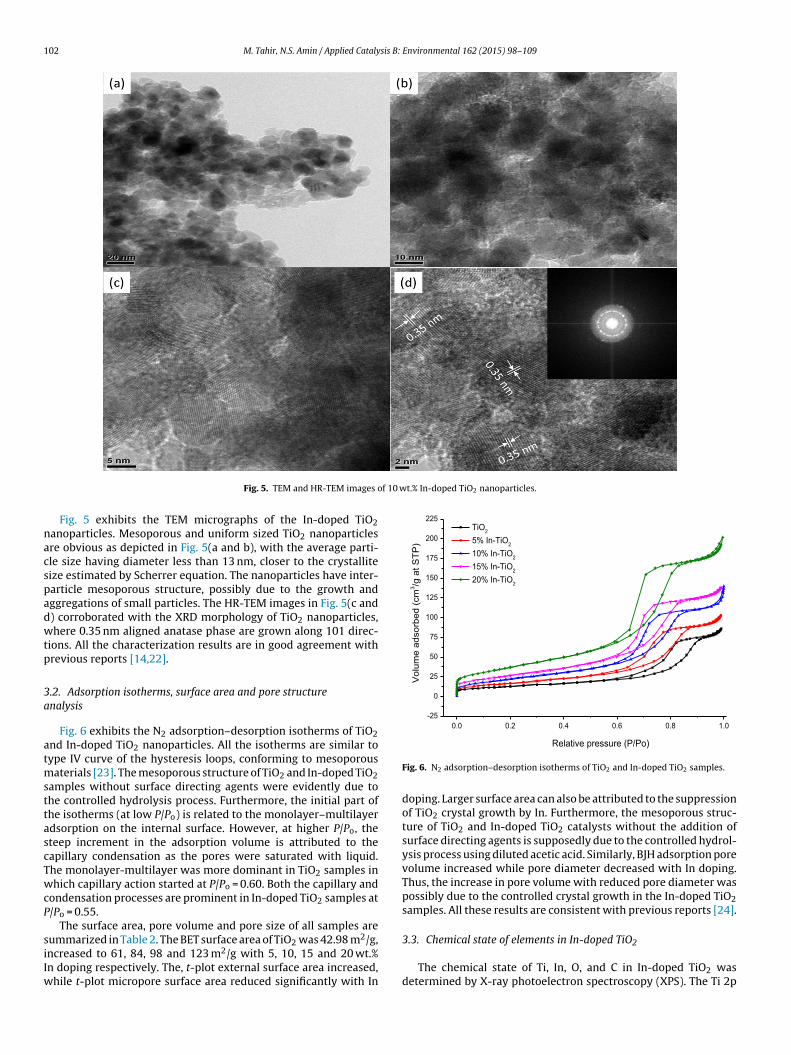
Fig. 5 exhibits the TEM micrographs of the In-doped TiO2anoparticles. Mesoporous and uniform sized TiO2 nanoparticlesre obvious as depicted in Fig. 5(a and b), with the average parti-le size having diameter less than 13 nm, closer to the crystalliteize estimated by Scherrer equation. The nanoparticles have inter-article mesoporous structure, possibly due to the growth andggregations of small particles. The HR-TEM images in Fig. 5(c and) corroborated with the XRD morphology of TiO2 nanoparticles,here 0.35 nm aligned anatase phase are grown along 101 direc-
ions. All the characterization results are in good agreement withrevious reports [14,22].
.2. Adsorption isotherms, surface area and pore structurenalysis
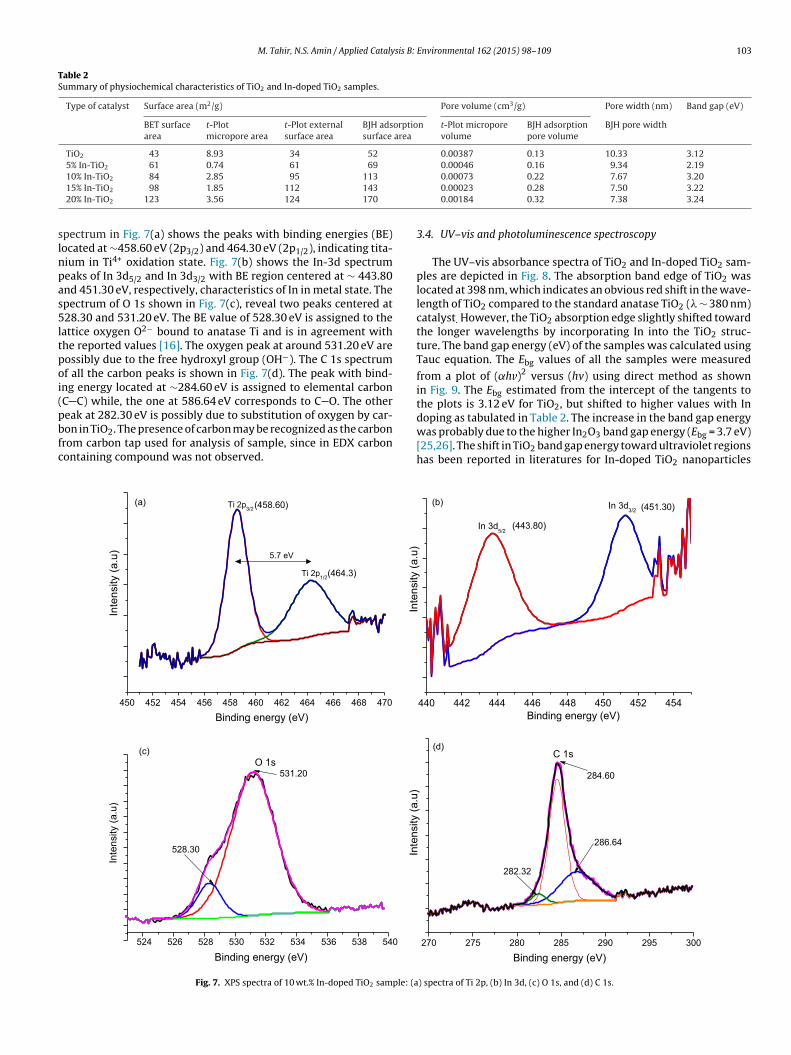
Fig. 6 exhibits the N2 adsorption–desorption isotherms of TiO2nd In-doped TiO2 nanoparticles. All the isotherms are similar toype IV curve of the hysteresis loops, conforming to mesoporous
aterials [23]. The mesoporous structure of TiO2 and In-doped TiO2amples without surface directing agents were evidently due tohe controlled hydrolysis process. Furthermore, the initial part ofhe isotherms (at low P/Po) is related to the monolayer–multilayerdsorption on the internal surface. However, at higher P/Po, theteep increment in the adsorption volume is attributed to theapillary condensation as the pores were saturated with liquid.he monolayer-multilayer was more dominant in TiO2 samples inhich capillary action started at P/Po = 0.60. Both the capillary and
ondensation processes are prominent in In-doped TiO2 samples at/Po = 0.55.
The surface area, pore volume and pore size of all samples are
ummarized in Table 2. The BET surface area of TiO2 was 42.98 m2/g,ncreased to 61, 84, 98 and 123 m2/g with 5, 10, 15 and 20 wt.%n doping respectively. The, t-plot external surface area increased,
hile t-plot micropore surface area reduced significantly with In
Relati ve pressu re (P/Po)
Fig. 6. N2 adsorption–desorption isotherms of TiO2 and In-doped TiO2 samples.
doping. Larger surface area can also be attributed to the suppressionof TiO2 crystal growth by In. Furthermore, the mesoporous struc-ture of TiO2 and In-doped TiO2 catalysts without the addition ofsurface directing agents is supposedly due to the controlled hydrol-ysis process using diluted acetic acid. Similarly, BJH adsorption porevolume increased while pore diameter decreased with In doping.Thus, the increase in pore volume with reduced pore diameter waspossibly due to the controlled crystal growth in the In-doped TiO2samples. All these results are consistent with previous reports [24].
3.3. Chemical state of elements in In-doped TiO2
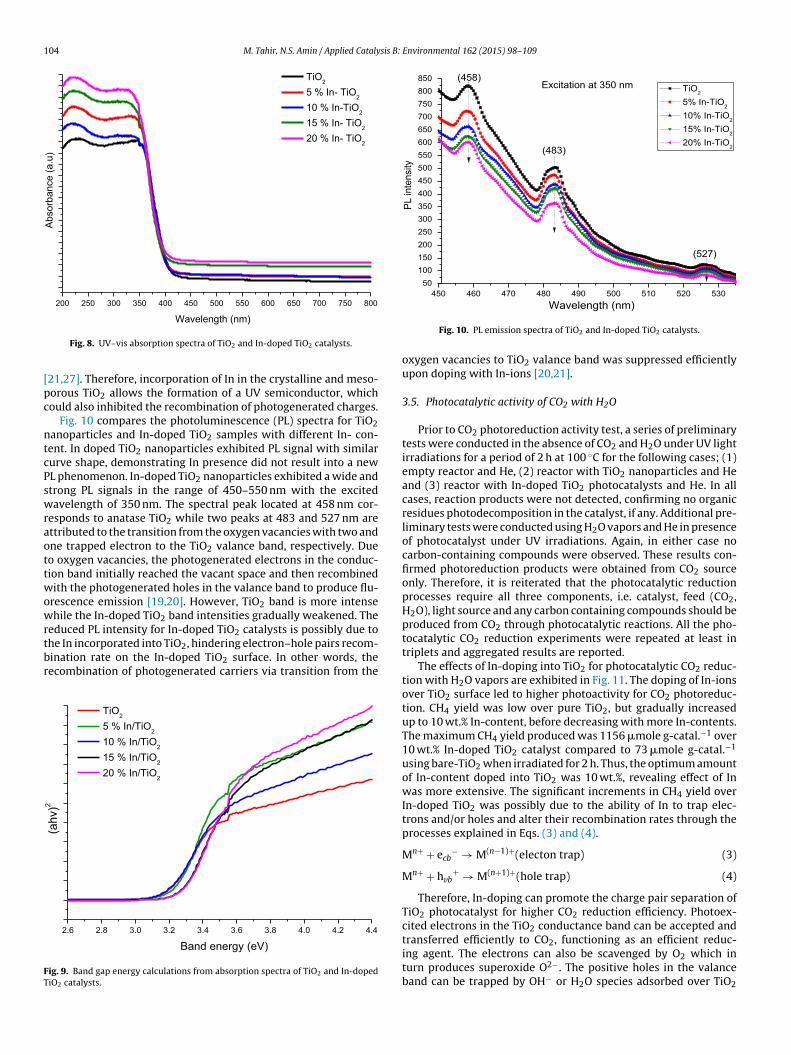
The chemical state of Ti, In, O, and C in In-doped TiO2 wasdetermined by X-ray photoelectron spectroscopy (XPS). The Ti 2p
pectrum in Fig. 7(a) shows the peaks with binding energies (BE)ocated at ∼458.60 eV (2p3/2) and 464.30 eV (2p1/2), indicating tita-ium in Ti4+ oxidation state. Fig. 7(b) shows the In-3d spectrumeaks of In 3d5/2 and In 3d3/2 with BE region centered at ∼ 443.80nd 451.30 eV, respectively, characteristics of In in metal state. Thepectrum of O 1s shown in Fig. 7(c), reveal two peaks centered at28.30 and 531.20 eV. The BE value of 528.30 eV is assigned to the
attice oxygen O2− bound to anatase Ti and is in agreement withhe reported values [16]. The oxygen peak at around 531.20 eV areossibly due to the free hydroxyl group (OH−). The C 1s spectrumf all the carbon peaks is shown in Fig. 7(d). The peak with bind-ng energy located at ∼284.60 eV is assigned to elemental carbonC C) while, the one at 586.64 eV corresponds to C O. The other
eak at 282.30 eV is possibly due to substitution of oxygen by car-on in TiO2. The presence of carbon may be recognized as the carbonrom carbon tap used for analysis of sample, since in EDX carbonontaining compound was not observed.
The UV–vis absorbance spectra of TiO2 and In-doped TiO2 sam-ples are depicted in Fig. 8. The absorption band edge of TiO2 waslocated at 398 nm, which indicates an obvious red shift in the wave-length of TiO2 compared to the standard anatase TiO2 (� ∼ 380 nm)catalyst. However, the TiO2 absorption edge slightly shifted towardthe longer wavelengths by incorporating In into the TiO2 struc-ture. The band gap energy (eV) of the samples was calculated usingTauc equation. The Ebg values of all the samples were measured
from a plot of (˛hv)2 versus (hv) using direct method as shownin Fig. 9. The Ebg estimated from the intercept of the tangents tothe plots is 3.12 eV for TiO2, but shifted to higher values with In
doping as tabulated in Table 2. The increase in the band gap energywas probably due to the higher In2O3 band gap energy (Ebg = 3.7 eV)[25,26]. The shift in TiO2 band gap energy toward ultraviolet regionshas been reported in literatures for In-doped TiO2 nanoparticles
270 27 5 28 0 28 5 29 0 29 5 30 0
440 44 2 44 4 44 6 44 8 45 0 45 2 45 4
(d)
(b)
Inte
nsity
(a.u
)
Binding energ y (eV)
C 1s
284. 60
286. 64
282.32
In 3d3/2
In 3d5/2
Inte
nsity
(a.u
)
Binding e nerg y (eV)
(443.80)
(451. 30)
) spectra of Ti 2p, (b) In 3d, (c) O 1s, and (d) C 1s.
Fig. 8. UV–vis absorption spectra of TiO2 and In-doped TiO2 catalysts.
21,27]. Therefore, incorporation of In in the crystalline and meso-orous TiO2 allows the formation of a UV semiconductor, whichould also inhibited the recombination of photogenerated charges.
Fig. 10 compares the photoluminescence (PL) spectra for TiO2anoparticles and In-doped TiO2 samples with different In- con-ent. In doped TiO2 nanoparticles exhibited PL signal with similarurve shape, demonstrating In presence did not result into a newL phenomenon. In-doped TiO2 nanoparticles exhibited a wide andtrong PL signals in the range of 450–550 nm with the excitedavelength of 350 nm. The spectral peak located at 458 nm cor-
esponds to anatase TiO2 while two peaks at 483 and 527 nm arettributed to the transition from the oxygen vacancies with two andne trapped electron to the TiO2 valance band, respectively. Dueo oxygen vacancies, the photogenerated electrons in the conduc-ion band initially reached the vacant space and then recombinedith the photogenerated holes in the valance band to produce flu-
rescence emission [19,20]. However, TiO2 band is more intensehile the In-doped TiO2 band intensities gradually weakened. The
educed PL intensity for In-doped TiO2 catalysts is possibly due to
he In incorporated into TiO2, hindering electron–hole pairs recom-ination rate on the In-doped TiO2 surface. In other words, theecombination of photogenerated carriers via transition from the
2.6 2.8 3.0 3.2 3.4 3.6 3.8 4.0 4.2 4.4
(ahv
)2
Band energ y (eV)
TiO2
5 % In/ TiO2
10 % In/TiO2
15 % In/TiO2
20 % In/TiO2
ig. 9. Band gap energy calculations from absorption spectra of TiO2 and In-dopediO2 catalysts.
Wavelength ( nm)
Fig. 10. PL emission spectra of TiO2 and In-doped TiO2 catalysts.
oxygen vacancies to TiO2 valance band was suppressed efficientlyupon doping with In-ions [20,21].
3.5. Photocatalytic activity of CO2 with H2O
Prior to CO2 photoreduction activity test, a series of preliminarytests were conducted in the absence of CO2 and H2O under UV lightirradiations for a period of 2 h at 100 ◦C for the following cases; (1)empty reactor and He, (2) reactor with TiO2 nanoparticles and Heand (3) reactor with In-doped TiO2 photocatalysts and He. In allcases, reaction products were not detected, confirming no organicresidues photodecomposition in the catalyst, if any. Additional pre-liminary tests were conducted using H2O vapors and He in presenceof photocatalyst under UV irradiations. Again, in either case nocarbon-containing compounds were observed. These results con-firmed photoreduction products were obtained from CO2 sourceonly. Therefore, it is reiterated that the photocatalytic reductionprocesses require all three components, i.e. catalyst, feed (CO2,H2O), light source and any carbon containing compounds should beproduced from CO2 through photocatalytic reactions. All the pho-tocatalytic CO2 reduction experiments were repeated at least intriplets and aggregated results are reported.
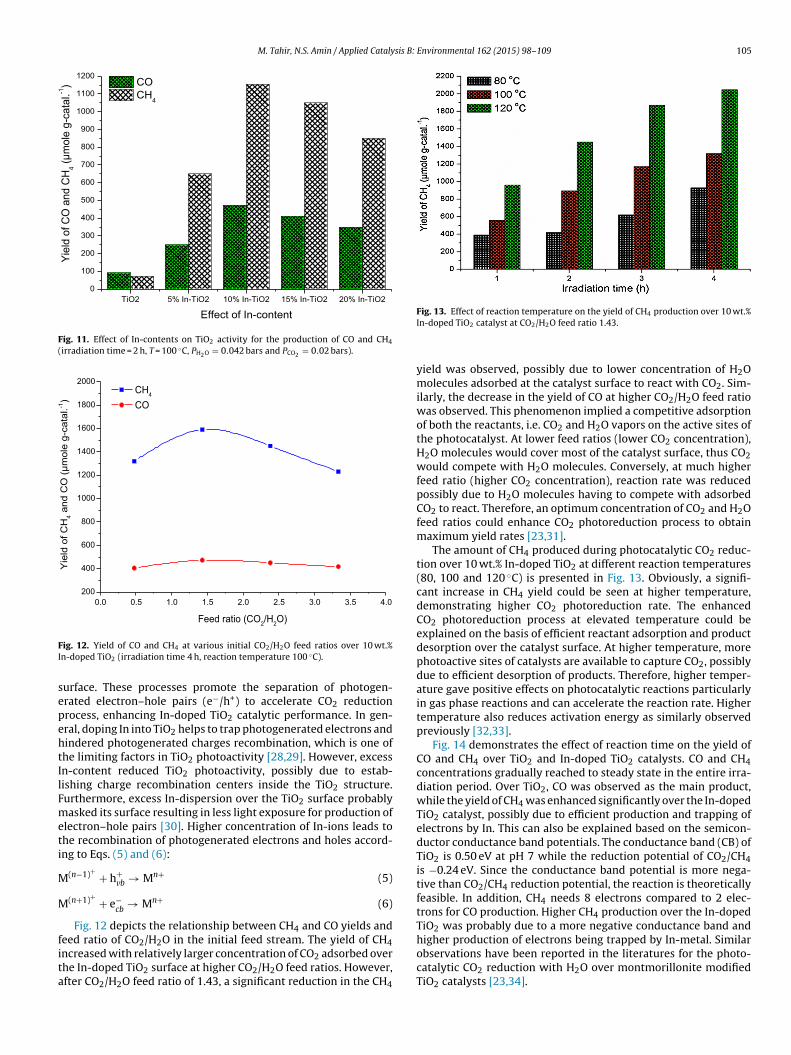
The effects of In-doping into TiO2 for photocatalytic CO2 reduc-tion with H2O vapors are exhibited in Fig. 11. The doping of In-ionsover TiO2 surface led to higher photoactivity for CO2 photoreduc-tion. CH4 yield was low over pure TiO2, but gradually increasedup to 10 wt.% In-content, before decreasing with more In-contents.The maximum CH4 yield produced was 1156 �mole g-catal.−1 over10 wt.% In-doped TiO2 catalyst compared to 73 �mole g-catal.−1
using bare-TiO2 when irradiated for 2 h. Thus, the optimum amountof In-content doped into TiO2 was 10 wt.%, revealing effect of Inwas more extensive. The significant increments in CH4 yield overIn-doped TiO2 was possibly due to the ability of In to trap elec-trons and/or holes and alter their recombination rates through theprocesses explained in Eqs. (3) and (4).
Mn+ + ecb− → M(n−1)+(electon trap) (3)
Mn+ + hvb+ → M(n+1)+(hole trap) (4)
Therefore, In-doping can promote the charge pair separation ofTiO2 photocatalyst for higher CO2 reduction efficiency. Photoex-cited electrons in the TiO2 conductance band can be accepted and
transferred efficiently to CO2, functioning as an efficient reduc-ing agent. The electrons can also be scavenged by O2 which inturn produces superoxide O2−. The positive holes in the valanceband can be trapped by OH− or H2O species adsorbed over TiO2
Fig. 11. Effect of In-contents on TiO2 activity for the production of CO and CH4
(irradiation time = 2 h, T = 100 ◦C, PH2O = 0.042 bars and PCO2 = 0.02 bars).
0.0 0.5 1.0 1.5 2.0 2.5 3.0 3.5 4.0200
400
600
800
1000
1200
1400
1600
1800
2000
Feed r atio (CO2/H 2O)
Yie
ld o
f CH
4 and
CO
(µm
ole
g-ca
tal.-1
)
CH4
CO
FI
sepehtIlFmeti
M
M
fita
ig. 12. Yield of CO and CH4 at various initial CO2/H2O feed ratios over 10 wt.%n-doped TiO2 (irradiation time 4 h, reaction temperature 100 ◦C).
urface. These processes promote the separation of photogen-rated electron–hole pairs (e−/h+) to accelerate CO2 reductionrocess, enhancing In-doped TiO2 catalytic performance. In gen-ral, doping In into TiO2 helps to trap photogenerated electrons andindered photogenerated charges recombination, which is one ofhe limiting factors in TiO2 photoactivity [28,29]. However, excessn-content reduced TiO2 photoactivity, possibly due to estab-ishing charge recombination centers inside the TiO2 structure.urthermore, excess In-dispersion over the TiO2 surface probablyasked its surface resulting in less light exposure for production of
lectron–hole pairs [30]. Higher concentration of In-ions leads tohe recombination of photogenerated electrons and holes accord-ng to Eqs. (5) and (6):
(n−1)+ + h+vb → Mn+ (5)
(n+1)+ + e−cb
→ Mn+ (6)
Fig. 12 depicts the relationship between CH4 and CO yields and
eed ratio of CO2/H2O in the initial feed stream. The yield of CH4ncreased with relatively larger concentration of CO2 adsorbed overhe In-doped TiO2 surface at higher CO2/H2O feed ratios. However,fter CO2/H2O feed ratio of 1.43, a significant reduction in the CH4
Fig. 13. Effect of reaction temperature on the yield of CH4 production over 10 wt.%In-doped TiO2 catalyst at CO2/H2O feed ratio 1.43.
yield was observed, possibly due to lower concentration of H2Omolecules adsorbed at the catalyst surface to react with CO2. Sim-ilarly, the decrease in the yield of CO at higher CO2/H2O feed ratiowas observed. This phenomenon implied a competitive adsorptionof both the reactants, i.e. CO2 and H2O vapors on the active sites ofthe photocatalyst. At lower feed ratios (lower CO2 concentration),H2O molecules would cover most of the catalyst surface, thus CO2would compete with H2O molecules. Conversely, at much higherfeed ratio (higher CO2 concentration), reaction rate was reducedpossibly due to H2O molecules having to compete with adsorbedCO2 to react. Therefore, an optimum concentration of CO2 and H2Ofeed ratios could enhance CO2 photoreduction process to obtainmaximum yield rates [23,31].
The amount of CH4 produced during photocatalytic CO2 reduc-tion over 10 wt.% In-doped TiO2 at different reaction temperatures(80, 100 and 120 ◦C) is presented in Fig. 13. Obviously, a signifi-cant increase in CH4 yield could be seen at higher temperature,demonstrating higher CO2 photoreduction rate. The enhancedCO2 photoreduction process at elevated temperature could beexplained on the basis of efficient reactant adsorption and productdesorption over the catalyst surface. At higher temperature, morephotoactive sites of catalysts are available to capture CO2, possiblydue to efficient desorption of products. Therefore, higher temper-ature gave positive effects on photocatalytic reactions particularlyin gas phase reactions and can accelerate the reaction rate. Highertemperature also reduces activation energy as similarly observedpreviously [32,33].
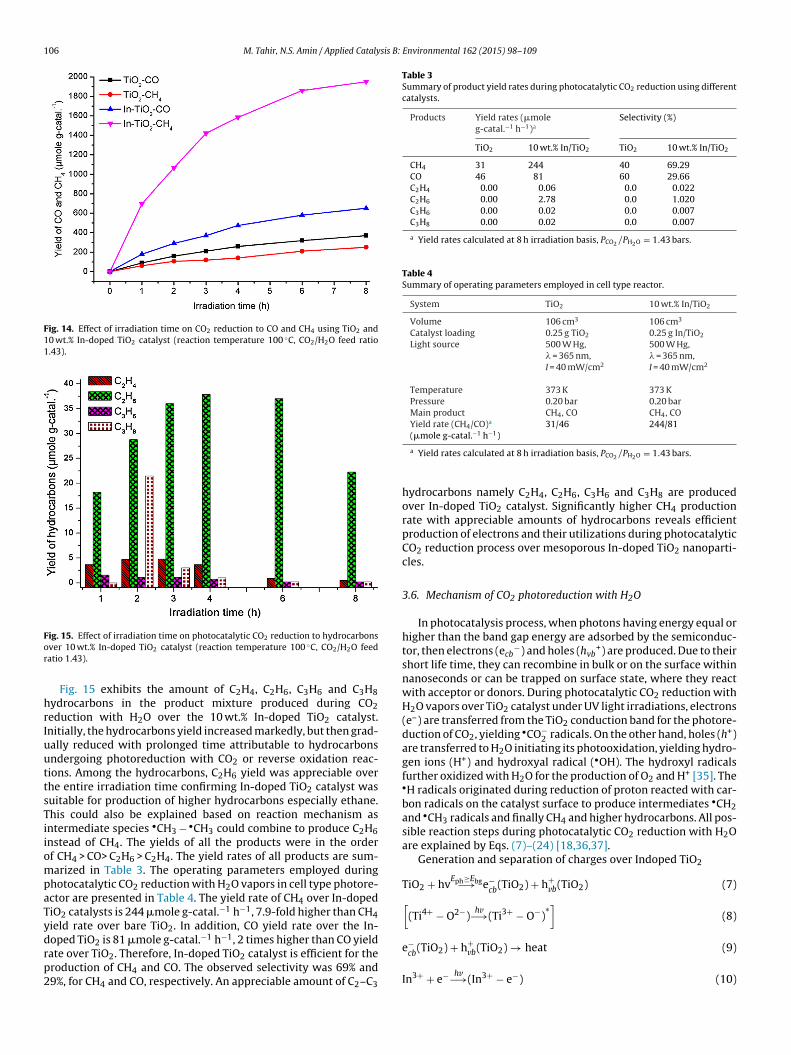
Fig. 14 demonstrates the effect of reaction time on the yield ofCO and CH4 over TiO2 and In-doped TiO2 catalysts. CO and CH4concentrations gradually reached to steady state in the entire irra-diation period. Over TiO2, CO was observed as the main product,while the yield of CH4 was enhanced significantly over the In-dopedTiO2 catalyst, possibly due to efficient production and trapping ofelectrons by In. This can also be explained based on the semicon-ductor conductance band potentials. The conductance band (CB) ofTiO2 is 0.50 eV at pH 7 while the reduction potential of CO2/CH4is −0.24 eV. Since the conductance band potential is more nega-tive than CO2/CH4 reduction potential, the reaction is theoreticallyfeasible. In addition, CH4 needs 8 electrons compared to 2 elec-trons for CO production. Higher CH4 production over the In-dopedTiO2 was probably due to a more negative conductance band andhigher production of electrons being trapped by In-metal. Similar
observations have been reported in the literatures for the photo-catalytic CO2 reduction with H2O over montmorillonite modifiedTiO2 catalysts [23,34].
Fig. 14. Effect of irradiation time on CO2 reduction to CO and CH4 using TiO2 and10 wt.% In-doped TiO2 catalyst (reaction temperature 100 ◦C, CO2/H2O feed ratio1.43).
For
hrIuuttsTiiompaTydrp2
Table 3Summary of product yield rates during photocatalytic CO2 reduction using differentcatalysts.
a Yield rates calculated at 8 h irradiation basis, PCO2 /PH2O = 1.43 bars.
Table 4Summary of operating parameters employed in cell type reactor.
System TiO2 10 wt.% In/TiO2
Volume 106 cm3 106 cm3
Catalyst loading 0.25 g TiO2 0.25 g In/TiO2
Light source 500 W Hg,� = 365 nm,I = 40 mW/cm2
500 W Hg,� = 365 nm,I = 40 mW/cm2
Temperature 373 K 373 KPressure 0.20 bar 0.20 barMain product CH4, CO CH4, COYield rate (CH4/CO)a
−1 −131/46 244/81
ig. 15. Effect of irradiation time on photocatalytic CO2 reduction to hydrocarbonsver 10 wt.% In-doped TiO2 catalyst (reaction temperature 100 ◦C, CO2/H2O feedatio 1.43).
Fig. 15 exhibits the amount of C2H4, C2H6, C3H6 and C3H8ydrocarbons in the product mixture produced during CO2eduction with H2O over the 10 wt.% In-doped TiO2 catalyst.nitially, the hydrocarbons yield increased markedly, but then grad-ally reduced with prolonged time attributable to hydrocarbonsndergoing photoreduction with CO2 or reverse oxidation reac-ions. Among the hydrocarbons, C2H6 yield was appreciable overhe entire irradiation time confirming In-doped TiO2 catalyst wasuitable for production of higher hydrocarbons especially ethane.his could also be explained based on reaction mechanism asntermediate species •CH3 − •CH3 could combine to produce C2H6nstead of CH4. The yields of all the products were in the orderf CH4 > CO> C2H6 > C2H4. The yield rates of all products are sum-arized in Table 3. The operating parameters employed during
hotocatalytic CO2 reduction with H2O vapors in cell type photore-ctor are presented in Table 4. The yield rate of CH4 over In-dopediO2 catalysts is 244 �mole g-catal.−1 h−1, 7.9-fold higher than CH4ield rate over bare TiO2. In addition, CO yield rate over the In-
oped TiO2 is 81 �mole g-catal.−1 h−1, 2 times higher than CO yieldate over TiO2. Therefore, In-doped TiO2 catalyst is efficient for theroduction of CH4 and CO. The observed selectivity was 69% and9%, for CH4 and CO, respectively. An appreciable amount of C2–C3
(�mole g-catal. h )
a Yield rates calculated at 8 h irradiation basis, PCO2 /PH2O = 1.43 bars.
hydrocarbons namely C2H4, C2H6, C3H6 and C3H8 are producedover In-doped TiO2 catalyst. Significantly higher CH4 productionrate with appreciable amounts of hydrocarbons reveals efficientproduction of electrons and their utilizations during photocatalyticCO2 reduction process over mesoporous In-doped TiO2 nanoparti-cles.
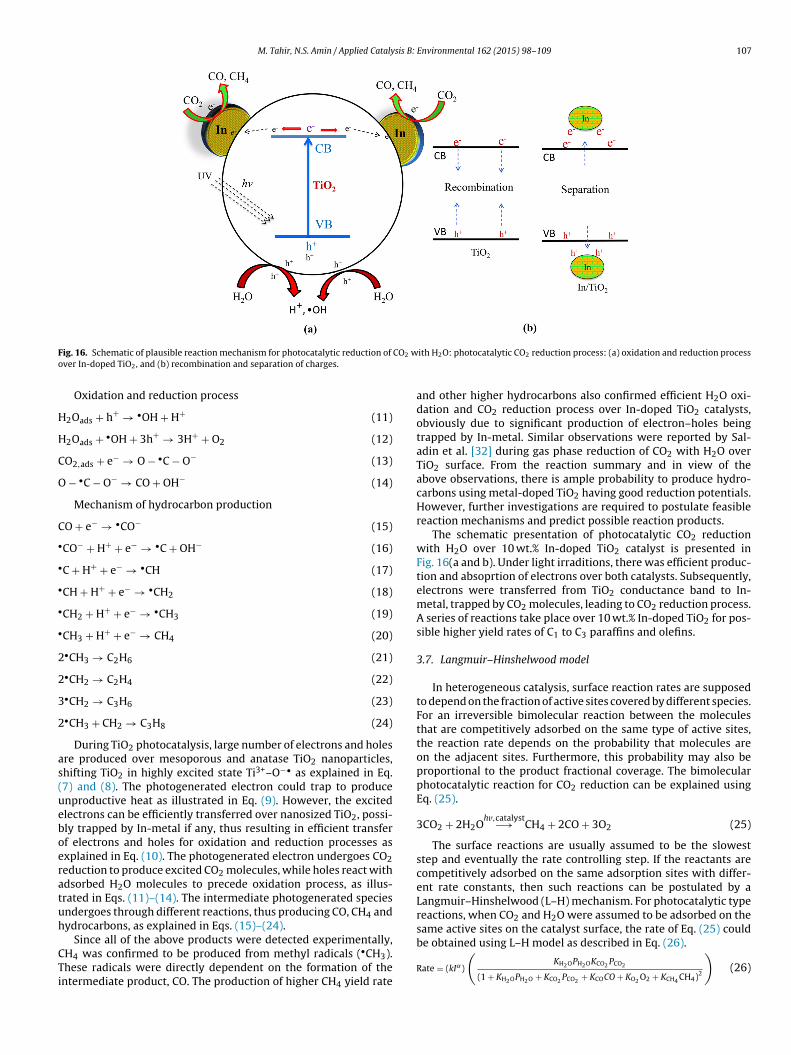
3.6. Mechanism of CO2 photoreduction with H2O
In photocatalysis process, when photons having energy equal orhigher than the band gap energy are adsorbed by the semiconduc-tor, then electrons (ecb
−) and holes (hvb+) are produced. Due to their
short life time, they can recombine in bulk or on the surface withinnanoseconds or can be trapped on surface state, where they reactwith acceptor or donors. During photocatalytic CO2 reduction withH2O vapors over TiO2 catalyst under UV light irradiations, electrons(e–) are transferred from the TiO2 conduction band for the photore-duction of CO2, yielding •CO−
2 radicals. On the other hand, holes (h+)are transferred to H2O initiating its photooxidation, yielding hydro-gen ions (H+) and hydroxyal radical (•OH). The hydroxyl radicalsfurther oxidized with H2O for the production of O2 and H+ [35]. The•H radicals originated during reduction of proton reacted with car-bon radicals on the catalyst surface to produce intermediates •CH2and •CH3 radicals and finally CH4 and higher hydrocarbons. All pos-sible reaction steps during photocatalytic CO2 reduction with H2Oare explained by Eqs. (7)–(24) [18,36,37].
Generation and separation of charges over Indoped TiO2
ig. 16. Schematic of plausible reaction mechanism for photocatalytic reduction of
ver In-doped TiO2, and (b) recombination and separation of charges.
Oxidation and reduction process
2Oads + h+ → •OH + H+ (11)
2Oads + •OH + 3h+ → 3H+ + O2 (12)
O2,ads + e− → O − •C − O− (13)
− •C − O− → CO + OH− (14)
Mechanism of hydrocarbon production
O + e− → •CO− (15)
CO− + H+ + e− → •C + OH− (16)
C + H+ + e− → •CH (17)
CH + H+ + e− → •CH2 (18)
CH2 + H+ + e− → •CH3 (19)
CH3 + H+ + e− → CH4 (20)
•CH3 → C2H6 (21)
•CH2 → C2H4 (22)
•CH2 → C3H6 (23)
•CH3 + CH2 → C3H8 (24)
During TiO2 photocatalysis, large number of electrons and holesre produced over mesoporous and anatase TiO2 nanoparticles,hifting TiO2 in highly excited state Ti3+–O−• as explained in Eq.7) and (8). The photogenerated electron could trap to producenproductive heat as illustrated in Eq. (9). However, the excitedlectrons can be efficiently transferred over nanosized TiO2, possi-ly trapped by In-metal if any, thus resulting in efficient transferf electrons and holes for oxidation and reduction processes asxplained in Eq. (10). The photogenerated electron undergoes CO2eduction to produce excited CO2 molecules, while holes react withdsorbed H2O molecules to precede oxidation process, as illus-rated in Eqs. (11)–(14). The intermediate photogenerated speciesndergoes through different reactions, thus producing CO, CH4 andydrocarbons, as explained in Eqs. (15)–(24).
Since all of the above products were detected experimentally,H4 was confirmed to be produced from methyl radicals (•CH3).hese radicals were directly dependent on the formation of thentermediate product, CO. The production of higher CH4 yield rate
ith H2O: photocatalytic CO2 reduction process: (a) oxidation and reduction process
and other higher hydrocarbons also confirmed efficient H2O oxi-dation and CO2 reduction process over In-doped TiO2 catalysts,obviously due to significant production of electron–holes beingtrapped by In-metal. Similar observations were reported by Sal-adin et al. [32] during gas phase reduction of CO2 with H2O overTiO2 surface. From the reaction summary and in view of theabove observations, there is ample probability to produce hydro-carbons using metal-doped TiO2 having good reduction potentials.However, further investigations are required to postulate feasiblereaction mechanisms and predict possible reaction products.
The schematic presentation of photocatalytic CO2 reductionwith H2O over 10 wt.% In-doped TiO2 catalyst is presented inFig. 16(a and b). Under light irraditions, there was efficient produc-tion and absoprtion of electrons over both catalysts. Subsequently,electrons were transferred from TiO2 conductance band to In-metal, trapped by CO2 molecules, leading to CO2 reduction process.A series of reactions take place over 10 wt.% In-doped TiO2 for pos-sible higher yield rates of C1 to C3 paraffins and olefins.
3.7. Langmuir–Hinshelwood model
In heterogeneous catalysis, surface reaction rates are supposedto depend on the fraction of active sites covered by different species.For an irreversible bimolecular reaction between the moleculesthat are competitively adsorbed on the same type of active sites,the reaction rate depends on the probability that molecules areon the adjacent sites. Furthermore, this probability may also beproportional to the product fractional coverage. The bimolecularphotocatalytic reaction for CO2 reduction can be explained usingEq. (25).
3CO2 + 2H2Ohv,catalyst−→ CH4 + 2CO + 3O2 (25)
The surface reactions are usually assumed to be the sloweststep and eventually the rate controlling step. If the reactants arecompetitively adsorbed on the same adsorption sites with differ-ent rate constants, then such reactions can be postulated by aLangmuir–Hinshelwood (L–H) mechanism. For photocatalytic typereactions, when CO2 and H2O were assumed to be adsorbed on thesame active sites on the catalyst surface, the rate of Eq. (25) could
be obtained using L–H model as described in Eq. (26).
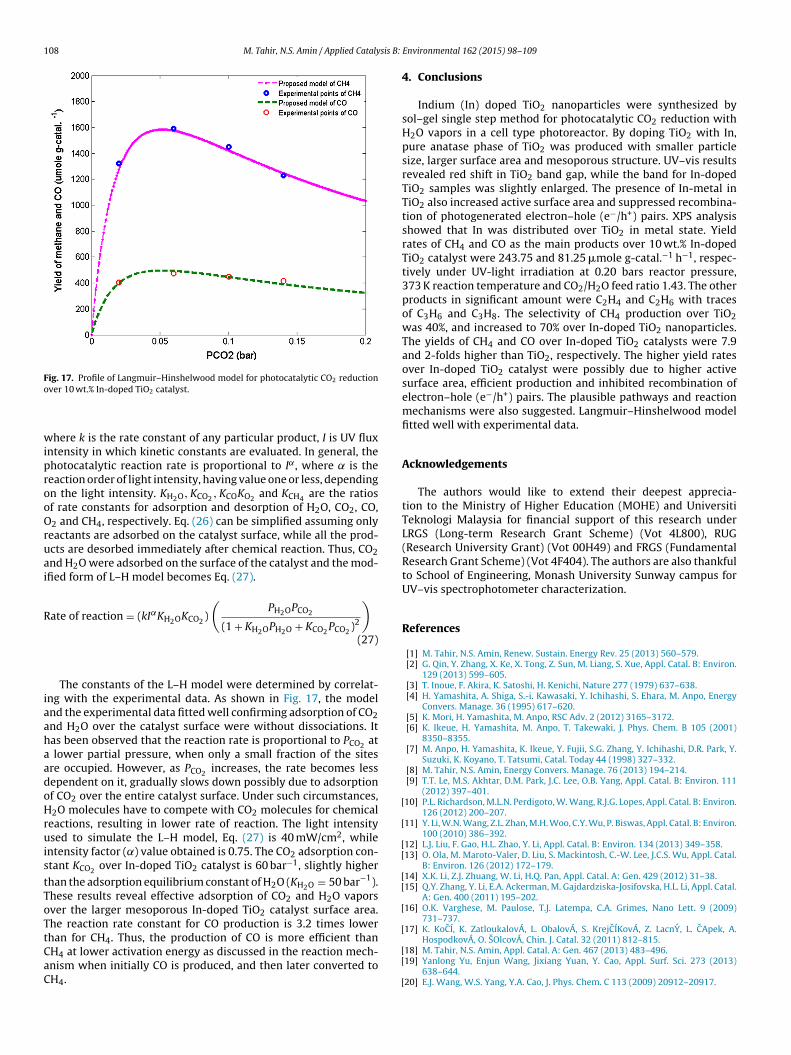
Fig. 17. Profile of Langmuir–Hinshelwood model for photocatalytic CO2 reductiono
wiprooOruai
R
iaahaadoHruis
tToTtCaC
[
[
[[
[[
[731–737.
[17] K. KoCÍ, K. ZatloukalovÁ, L. ObalovÁ, S. KrejCÍKovÁ, Z. LacnY, L. CApek, A.HospodkovÁ, O. SOlcovÁ, Chin. J. Catal. 32 (2011) 812–815.
[18] M. Tahir, N.S. Amin, Appl. Catal. A: Gen. 467 (2013) 483–496.
ver 10 wt.% In-doped TiO2 catalyst.
here k is the rate constant of any particular product, I is UV fluxntensity in which kinetic constants are evaluated. In general, thehotocatalytic reaction rate is proportional to I˛, where is theeaction order of light intensity, having value one or less, dependingn the light intensity. KH2O, KCO2 , KCOKO2 and KCH4 are the ratiosf rate constants for adsorption and desorption of H2O, CO2, CO,2 and CH4, respectively. Eq. (26) can be simplified assuming only
eactants are adsorbed on the catalyst surface, while all the prod-cts are desorbed immediately after chemical reaction. Thus, CO2nd H2O were adsorbed on the surface of the catalyst and the mod-fied form of L–H model becomes Eq. (27).
ate of reaction = (kI˛KH2OKCO2 )
(PH2OPCO2
(1 + KH2OPH2O + KCO2 PCO2 )2
)
(27)
The constants of the L–H model were determined by correlat-ng with the experimental data. As shown in Fig. 17, the modelnd the experimental data fitted well confirming adsorption of CO2nd H2O over the catalyst surface were without dissociations. Itas been observed that the reaction rate is proportional to PCO2 at
lower partial pressure, when only a small fraction of the sitesre occupied. However, as PCO2 increases, the rate becomes lessependent on it, gradually slows down possibly due to adsorptionf CO2 over the entire catalyst surface. Under such circumstances,2O molecules have to compete with CO2 molecules for chemical
eactions, resulting in lower rate of reaction. The light intensitysed to simulate the L–H model, Eq. (27) is 40 mW/cm2, while
ntensity factor (˛) value obtained is 0.75. The CO2 adsorption con-tant KCO2 over In-doped TiO2 catalyst is 60 bar−1, slightly higher
han the adsorption equilibrium constant of H2O (KH2O = 50 bar−1).hese results reveal effective adsorption of CO2 and H2O vaporsver the larger mesoporous In-doped TiO2 catalyst surface area.he reaction rate constant for CO production is 3.2 times lowerhan for CH4. Thus, the production of CO is more efficient than
H4 at lower activation energy as discussed in the reaction mech-nism when initially CO is produced, and then later converted toH4.
[
[
Environmental 162 (2015) 98–109
4. Conclusions
Indium (In) doped TiO2 nanoparticles were synthesized bysol–gel single step method for photocatalytic CO2 reduction withH2O vapors in a cell type photoreactor. By doping TiO2 with In,pure anatase phase of TiO2 was produced with smaller particlesize, larger surface area and mesoporous structure. UV–vis resultsrevealed red shift in TiO2 band gap, while the band for In-dopedTiO2 samples was slightly enlarged. The presence of In-metal inTiO2 also increased active surface area and suppressed recombina-tion of photogenerated electron–hole (e−/h+) pairs. XPS analysisshowed that In was distributed over TiO2 in metal state. Yieldrates of CH4 and CO as the main products over 10 wt.% In-dopedTiO2 catalyst were 243.75 and 81.25 �mole g-catal.−1 h−1, respec-tively under UV-light irradiation at 0.20 bars reactor pressure,373 K reaction temperature and CO2/H2O feed ratio 1.43. The otherproducts in significant amount were C2H4 and C2H6 with tracesof C3H6 and C3H8. The selectivity of CH4 production over TiO2was 40%, and increased to 70% over In-doped TiO2 nanoparticles.The yields of CH4 and CO over In-doped TiO2 catalysts were 7.9and 2-folds higher than TiO2, respectively. The higher yield ratesover In-doped TiO2 catalyst were possibly due to higher activesurface area, efficient production and inhibited recombination ofelectron–hole (e−/h+) pairs. The plausible pathways and reactionmechanisms were also suggested. Langmuir–Hinshelwood modelfitted well with experimental data.
Acknowledgements
The authors would like to extend their deepest apprecia-tion to the Ministry of Higher Education (MOHE) and UniversitiTeknologi Malaysia for financial support of this research underLRGS (Long-term Research Grant Scheme) (Vot 4L800), RUG(Research University Grant) (Vot 00H49) and FRGS (FundamentalResearch Grant Scheme) (Vot 4F404). The authors are also thankfulto School of Engineering, Monash University Sunway campus forUV–vis spectrophotometer characterization.
References
[1] M. Tahir, N.S. Amin, Renew. Sustain. Energy Rev. 25 (2013) 560–579.[2] G. Qin, Y. Zhang, X. Ke, X. Tong, Z. Sun, M. Liang, S. Xue, Appl. Catal. B: Environ.
129 (2013) 599–605.[3] T. Inoue, F. Akira, K. Satoshi, H. Kenichi, Nature 277 (1979) 637–638.[4] H. Yamashita, A. Shiga, S.-i. Kawasaki, Y. Ichihashi, S. Ehara, M. Anpo, Energy
Convers. Manage. 36 (1995) 617–620.[5] K. Mori, H. Yamashita, M. Anpo, RSC Adv. 2 (2012) 3165–3172.[6] K. Ikeue, H. Yamashita, M. Anpo, T. Takewaki, J. Phys. Chem. B 105 (2001)
8350–8355.[7] M. Anpo, H. Yamashita, K. Ikeue, Y. Fujii, S.G. Zhang, Y. Ichihashi, D.R. Park, Y.
Suzuki, K. Koyano, T. Tatsumi, Catal. Today 44 (1998) 327–332.[8] M. Tahir, N.S. Amin, Energy Convers. Manage. 76 (2013) 194–214.[9] T.T. Le, M.S. Akhtar, D.M. Park, J.C. Lee, O.B. Yang, Appl. Catal. B: Environ. 111
22] Huihu Wang, J.L. Fariab, Shijie Donga, Y. Chang, Mater. Sci. Eng. B 177 (2012)913–919.
23] M. Tahir, N.S. Amin, Appl. Catal. B: Environ. 142 (2013) 512–522.24] M. Hinojosa-Reyes, S. Arriaga, L.A. Diaz-Torres, V. Rodríguez-González, Chem.
Eng. J. 224 (2013) 106–113.25] S.K. Poznyak, D.V. Talapin, A.I. Kulak, J. Phys. Chem. B 105 (2001) 4816–4823.26] K.R. Reyes-Gil, E.A. Reyes-García, D. Raftery, J. Phys. Chem. C (2007)
14579–14588.27] V. Rodríguez-González, R. Gómez, M. Moscosa-Santillan, J. Amouroux, J. Sol–Gel
Sci. Technol. 42 (2007) 165–171.28] Xia Yang, Yonghui Wang, Leilei Xu, Xiaodan Yu, Y. Guo, J. Phys. Chem. C 112
(2008) 11481–11489.
[[[
Environmental 162 (2015) 98–109 109
29] S. Nakagawa, A. Kudo, M. Azuma, T. Sakata, J. Electroanal. Chem. 308 (1991)339–343.
31] J.C.S. Wu, H.-M. Lin, C.-L. Lai, Appl. Catal. A: Gen. 296 (2005) 194–200.32] F. Saladin, I. Alxneit, J. Chem. Soc. Farad. Trans. 93 (1997) 4159–4163.33] P.-Y. Liou, S.-C. Chen, J.C.S. Wu, D. Liu, S. Mackintosh, M. Maroto-Valer, R. Lin-
forth, Energy Environ. Sci. 4 (2011) 1487.
35] S.S. Tan, L. Zou, E. Hu, Catal. Today 115 (2006) 269–273.36] S.S. Tan, L. Zou, E. Hu, Catal. Today 131 (2008) 125–129.37] K. Koci, L. Obalova, O. Solcova, Chem. Process. Eng. – Inz. 31 (2010) 395–