Difference in surface melting between indium (110) and (011)
A . M . M o l e n b r o e k * , G . t e r H o r s t , J . W . M . F r e n k e n
FOM-lnstitute for Atomic and Molecular Physics, Kruislaan 407, 1098 SJ Amsterdam, The Netherlands
Received 12 December 1995; accepted for publication 11 March 1996
Abstract
Medium-energy ion scattering measurements and Monte Carlo computer simulations have been used to study the melting behaviour of the two open low-index surfaces of indium: In(110) and In(011). Because of the tetragonal lattice structure, the atomic density at the In(ll0) surface is 3.5% lower than that at the In(011) surface. The corresponding higher surface free energy of the (110) surface is expected to give rise to a slightly stronger surface melting effect at this face than at the (011) face. The ion-scattering measurements indeed show such a difference in melted-layer thickness at temperatures close to the bulk melting point, Tm =429.76 K. Surprisingly, however, the order of the onset of surface disordering is reversed. In(ll0) starts disordering about 25 K closer to Tm than In(011). We attribute this counter-intuitive difference in disordering onset to the difference in adatom-vacancy creation energies at the two surfaces. This idea is corroborated by energy calculations and Monte Carlo computer simulations, in which a Finnis-Sinclair interaction potential between indium atoms was employed. The slightly increased nearest-neighbour distance on the more densely-packed In(011) surface leads to a decreased creation energy of adatoms and vacancies. The resulting higher densities of adatoms and vacancies make In(011) unstable at a lower temperature than In(ll0). These results strongly suggest that the onset of surface disordering involves a mechanical surface instability.
Keywords: Adatoms; Computer simulations; Indium; Low index single crystal surfaces; Medium energy ion scattering (MEIS); Surface melting
1. Introduction
I t is wel l -es tabl ished tha t m a n y crysta l surfaces form a l iquid- l ike film at t empera tu res close to the mel t ing po in t [1 ,2 ] . The L a n d a u theory of surface mel t ing predicts a s imple g rowth law of the l iquid- l ike layer, based on the difference in surface free energies A7 between a d ry surface and a surface covered with a l iquid film [3 ,4 ] . Surface mel t ing is expected when
AY ~ ~Yv --(Ts~ + V~v) > O, (1)
* Corresponding author. Present address: Center for Atomic- scale Materials Physics, Technical University of Denmark, Building 307, DK-2800 Lyngby, Denmark.
and surface s tabi l i ty when A7 <0 . Here 7sv, ])sl and 71v are the o r i en ta t ion -dependen t free energies of the so l i d -vapou r , so l i d - l i qu id and l i qu id -va - p o u r interfaces. The open (110) faces of fcc metals ,
such as A1 [ 5 - 1 0 ] , Au [ 1 1 - 1 3 ] , Cu [14 ,15] and P b [ 1 6 - 1 9 ] , have been shown to exhibi t surface melting. Equ i l ib r ium-shape measurements on mic romete r size crystals indicate tha t the open low-index faces of In also mel t [20] .
The a im of this s tudy is to search for differences in surface mel t ing behav iou r be tween In(011) and I n ( l l 0 ) . Because of the lower a tomic densi ty of the (110) surface, we expect the h igher A~ and therefore the s t ronger surface-mel t ing effect at this surface. This p red ic t ion is conf i rmed by our
104 A.M. Molenbroek et al./Surface Science 365 (1996) 103-117
medium-energy ion scattering (MEIS) measure- ments. However, the onset of the surface disorder- ing on the two In surfaces does not seem to be related to Ay in a straightforward manner. In particular, we find that the (110) surface, which has the larger value of AV, starts disordering about 25 K closer to Tm than the (011) surface. We attribute this reversed onset to the difference in creation energy of adatom-vacancy pairs. Although the (011) surface has the higher atomic density, the nearest-neighbour interatomic distance in the surface plane is slightly larger on this surface than on In(ll0). This leads to a slightly lower energy for adatom-vacancy creation and thus a higher density of adatoms and vacancies on the (011) surface. This strongly suggests that the surface disorder starts as a result of a mechanical instabil- ity of the first atomic layer(s), caused by the presence of a high density of adatoms and vacan- cies. Within this description, the subsequent growth of the liquid-like film with increasing temperature, which is determined by surface free-energy differ- ences, is not directly related to the initial stages of disordering.
This paper is organized as follows. In Section 2 we describe the experimental details of the sample preparation and the temperature control. In Section 3 we determine the room-temperature structure of In(110) and In(011). Next, the temper- ature-dependent backscattering yield is compared with surface-melting growth laws. In Section 5 we consider the qualitative explanation for the reversed order of the initial disordering based on the creation energies for adatom-vacancy pairs. We calculate these creation energies for the two sur- faces, using a Finnis-Sinclair interaction potential between indium atoms. Temperature-dependent Monte Carlo simulations of slabs of In(110) and In(011) confirm that the (011) surface starts disor- dering at a lower temperature. Finally, in Section 6 we discuss these results in terms of a mechanical surface instability.
2. Experimental
The samples were aligned by Laue backdiffrac- tion within 0.2 ° of the (110) and (011) planes and
were spark-cut to a rectangular shape (dimensions: 10 x 10 x 3 mm 3) out of one single-crystal In bar (purity 5N). For mounting purposes 0.5 x 0.3 mm 2 grooves were spark-cut along the edges of the crystals. The crystals were etched in a solution of chloric acid (37%) and hydrogen peroxide (30%) in water in a ratio (1: 1: 2), followed by etching in chloric acid (37%). Because of the softness of In, no mechanical polishing was performed. The crys- tals were mounted in a Mo container using Ta clamps, and transferred into the UHV MEIS- system, described previously [21-23] (base pres- sure 8 x 10 - 9 Pa). The crystals were treated in situ by cycles of 2 h sputtering with 800 eV Ar + (3 #A cm-2), followed by annealing at 350 K for 1 h.
Auger electron spectroscopy did not show any other signals than In after this treatment. Upper estimates of the surface contamination, based on the statistical noise, were: 0<0.5% and C, S <0.25% of a monolayer (one monolayer In(l l0) contains 0.62 x 10 is In atoms per cruz). MEIS energy spectra, however, revealed a minor Pb contamination of about 1% of a monolayer. This contamination could be reduced to below 0.1% of a monolayer (the detection limit) by Ar + sputtering at 350 K.
Low-energy electron diffraction (LEED) showed a sharp (1 x 1) pattern at both surfaces, indicating that In(110) and In(011) are well ordered and not reconstructed at room temperature. The LEED patterns further served to verify the proper align- ment of the (110) and (011) surface orientations.
The Mo container with the crystal was heated radiatively by means of a W filament. The temper- ature was measured with a Pt-100 resistor placed inside the Mo container at the reverse side of the crystal. The Pt-100 resistor was calibrated against the bulk melting point of the In crystals with an accuracy of 0.1 K, by partially melting the crystals. Lateral temperature differences over the sample were estimated to be less than 0.01 K.
The vapour pressure of In at the bulk melting point is extremely low ((9 10 -16 Pa) so that the evaporation of In atoms can be neglected com- pletely ((9 10 -l° monolayers per hour). Therefore, we can safely consider the In crystals to be in thermodynamic equilibrium with their own vapour.
A.M. Molenbroek et aL /Surface Science 365 (1996) 103-117 105
3. Room-temperature structure
3.1. Room-temperature structure of In( l l O)
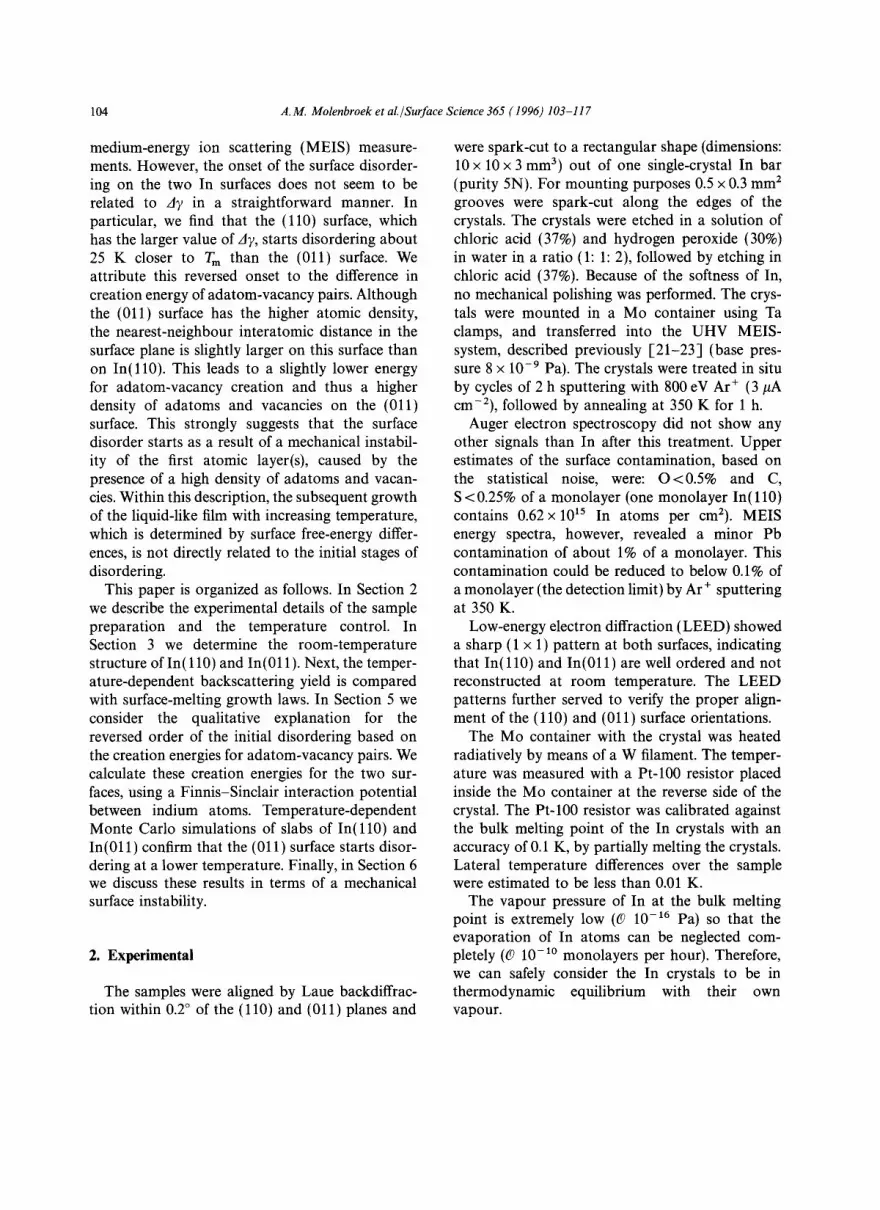
Two equivalent scattering geometries were chosen for the surface-melting experiments on the two surfaces (Fig. 1). These scattering planes were also used to determine the structure of the In surfaces at room temperature. The (110) sample was aligned with its [ i01] axis along the parallel 100 keV proton beam. Backscattered protons were detected over a range of 20 ° around the [011] direction. For the (110) sample this is a symmetric scattering geometry, and the (111) scattering plane is perpendicular to the surface, as usual in MEIS. For the (011) sample however, the scattering plane is tilted 3.5 ° with respect to the physical surface normal.
If an incident proton beam is aligned with a low-index direction of a crystal, the surface atoms cast a shadow on atoms in subsurface layers, parallel to the beam. This shadowing effect results in a reduction of the hitting probability for atoms in deeper layers. In the case of a perfectly ordered, static crystal, no ions can be backscattered from subsurface atoms. However, due to thermal vibrations there is a non-zero probability for back- scattering from atoms in deeper layers. On their way out of the crystal, these backscattered ions are blocked by surface atoms. In the angular spectrum of the total backscattered intensity, the blocking effect gives rise to a minimum in the blocking
a) b)
[lio] [oll]
T ; [(.ol] [o111 [lo7] [110]
In (110) In(O 11)
Fig. 1. Scattering geometries used for the surface-melting experi- ments; projections on the (1 i 1) scattering plane. The (011) sur- face makes an angle of 86.5 ° with respect to the scattering plane, rather than 90 ° .
direction. In the energy spectrum, the ions which are backscattered from surface atoms yield a "sur- face" peak and the shadowing and blocking effects result in a reduction of the yield at lower energies. Ions backscattered from subsurface atoms appear at lower energies because they lose kinetic energy when travelling through the crystal. The integral underneath the surface peak can be converted to an absolute measure for the number of indium atoms per unit area visible to the ion beam and the detector [24]. If there is a disordered (melted) film on top of the surface, the atoms in the film will not contribute to the shadowing and blocking and will be fully visible to the ion beam and the detector. This results in a larger surface peak area.
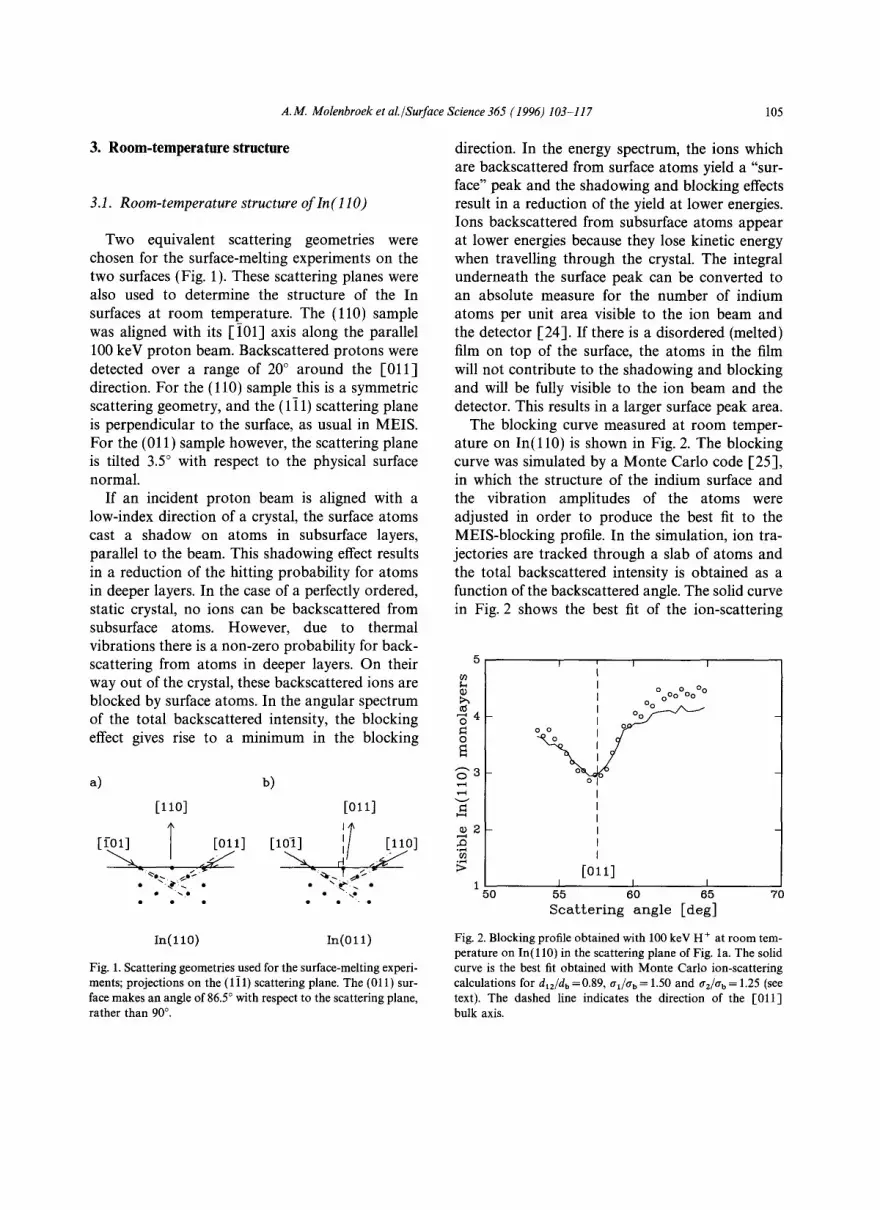
The blocking curve measured at room temper- ature on In( l l0) is shown in Fig. 2. The blocking curve was simulated by a Monte Carlo code [25], in which the structure of the indium surface and the vibration amplitudes of the atoms were adjusted in order to produce the best fit to the MEIS-blocking profile. In the simulation, ion tra- jectories are tracked through a slab of atoms and the total backscattered intensity is obtained as a function of the backscattered angle. The solid curve in Fig. 2 shows the best fit of the ion-scattering
5
~ 4
o
~ z
1 5O
I I I
o ooOooOo Oo o
o o o
[Oll] l i i
55 60 65 S c a t t e r i n g a n g l e [ d e g ]
70
Fig. 2. Blocking profile obtained with 100 keV H ÷ at room tem- perature on In(110) in the scattering plane of Fig. 1 a. The solid curve is the best fit obtained with Monte Carlo ion-scattering calculations for dlz/db =0.89, ~q/(rb = 1.50 and aJab = 1.25 (see text). The dashed line indicates the direction of the [011] bulk axis.
106 A.M. Molenbroek et al.ISurface Science 365 (1996) 103-117
calculations. In these calculations the proton- in- dium interaction was modelled by the universal Biersack-Ziegler potential [26]. The indium atoms were placed on tetragonaloPOSitions according to lattice constants a=4.590 A and c=4.937 A [27]. The vibrations of the indium atoms were chosen isotropic and harmonic, furthermore no correla- tions were assumed. Bulk indium atoms were assumed to vibrate with a root-mean square dis- placement of Ob =0.181 ,~, calculated by means of the harmonic approximation for a Debye temper- ature of OD= 106 K [28]. As fitting parameters we used the outer two interlayer distances d~2 and d23, and the vibration amplitudes (root-mean- square displacements) of the outermost two layers a~ and 0" 2. The high scattering yield at room temperature could only be fitted by strongly enhanced vibration amplitudes of the two outer- most layers. The 0.3 ° shift of the blocking minimum to lower angles with respect to the [011 ] bulk axis and the asymmetry of the minimum are typical for a contracted surface. The best-fit values for the adjustable parameters are: d12/db=0.89+O.03, d23/db=l.O0++_O.03, 0"i/0"b=1.5+0.2 and 0"2 /0"b --="
1.3 +0.2. Here, d b is the bulk interlayer distance. The analysis of the goodness-of-fit shows that the blocking minimum is not very sensitive to 0"~ and 0-2 separately, but rather to the combination 0-2 +0.80-~, which has a best-fit value of 2.50- b.
3.2. Room-temperature structure of ln(O1 I)
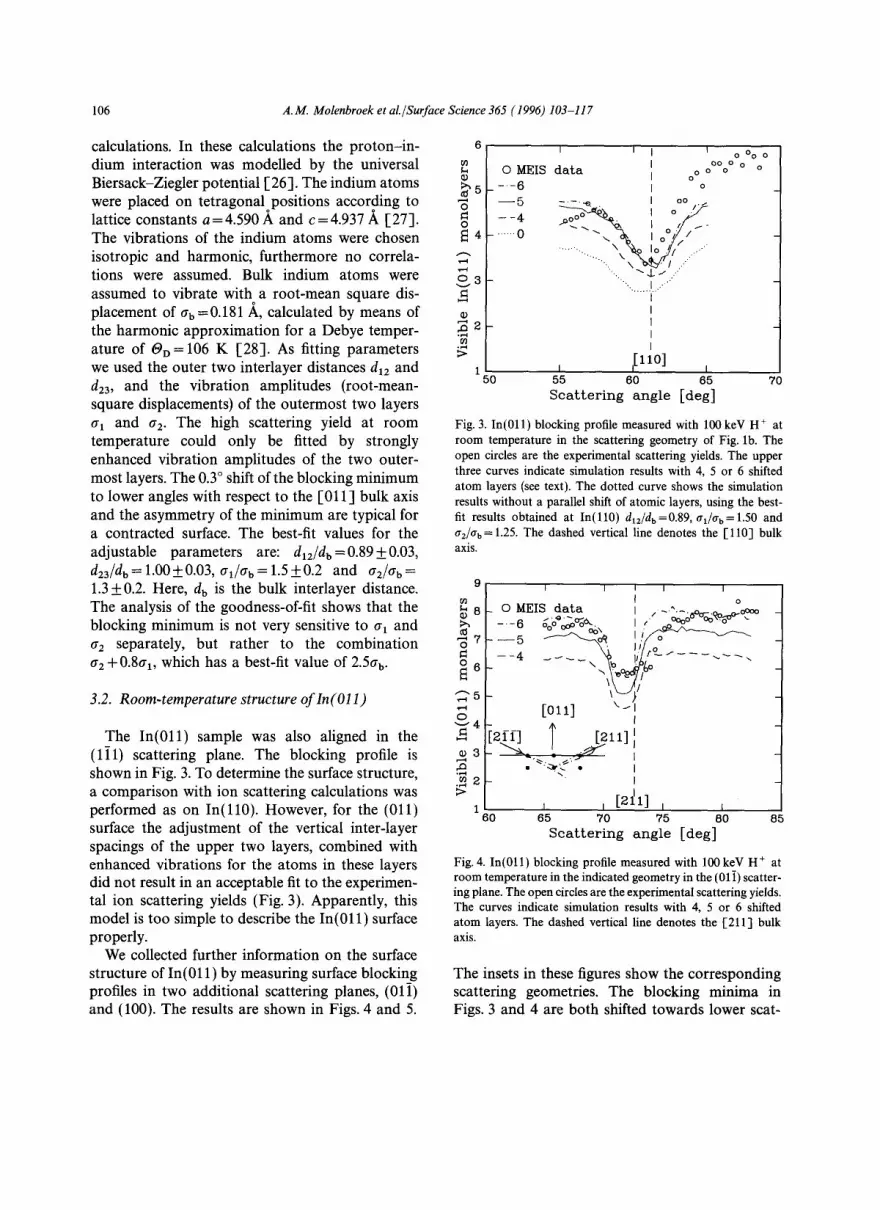
The In(011) sample was also aligned in the (1]1) scattering plane. The blocking profile is shown in Fig. 3. To determine the surface structure, a comparison with ion scattering calculations was performed as on In ( l l0 ) . However, for the (011) surface the adjustment of the vertical inter-layer spacings of the upper two layers, combined with enhanced vibrations for the atoms in these layers did not result in an acceptable fit to the experimen- tal ion scattering yields (Fig. 3). Apparently, this model is too simple to describe the In(011) surface properly.
We collected further information on the surface structure of In(011) by measuring surface blocking profiles in two additional scattering planes, (01i) and (100). The results are shown in Figs. 4 and 5.
6
~o
~ 5
0 ~ 4
~ a
O)
.,..i
1 50
I
0 MEIS data - . - 6
- - 5 - - 4
- ' 0
I I I 0 % 0
J oOOo o o o J o ° I o
z _ ' - -.e I oo
~oo °~ ~ /I
• "~,,L j .. .. . ".......[...- "
I I I i i
, ,[ilO] 55 60 65 S c a t t e r i n g angle [deg]
7 0
Fig. 3. In(011) blocking profile measured with 100 keV H ÷ at room temperature in the scattering geometry of Fig. lb. The open circles are the experimental scattering yields. The upper three curves indicate simulation results with 4, 5 or 6 shifted atom layers (see text). The dotted curve shows the simulation results without a parallel shift of atomic layers, using the best- fit results obtained at In(ll0) d12fdb=0.89, al/ab=l.50 and crz/ab=l.25. The dashed vertical line denotes the [110] bulk axis.
9
~8 ~7
~5
C) "-'4
~3 .o
>
1 60
I
0 MEIS data --6
--5 --4
I I
o
;o
[011] \
• ~ % - "~
, [e l l ] i
65 70 75 80 85
Scattering angle [deg]
Fig. 4. In(011) blocking profile measured with 100 keV H ÷ at room temperature in the indicated geometry in the (01 i) scatter- ing plane. The open circles are the experimental scattering yields. The curves indicate simulation results with 4, 5 or 6 shifted atom layers. The dashed vertical line denotes the [211] bulk axis.
The insets in these figures show the corresponding scattering geometries. The blocking minima in Figs. 3 and 4 are both shifted towards lower scat-
A.M. Molenbroek et al.tSurface Science 365 (1996) 103-117 107
9
~8
- - " 7 0
v 4
~ 3 ..Q
1 70
I I I
0 MEIS data --6 o
°oo r.~. - - 5 oo ~.:.,,%oa~ ° ~ - - 4
/ \
[o11]
_p
I I I I I
o o I ~Oo o % % %
[010] I I I I I I
75 80 85 90 95 100 Sca t t e r ing angle [deg]
1 0 5
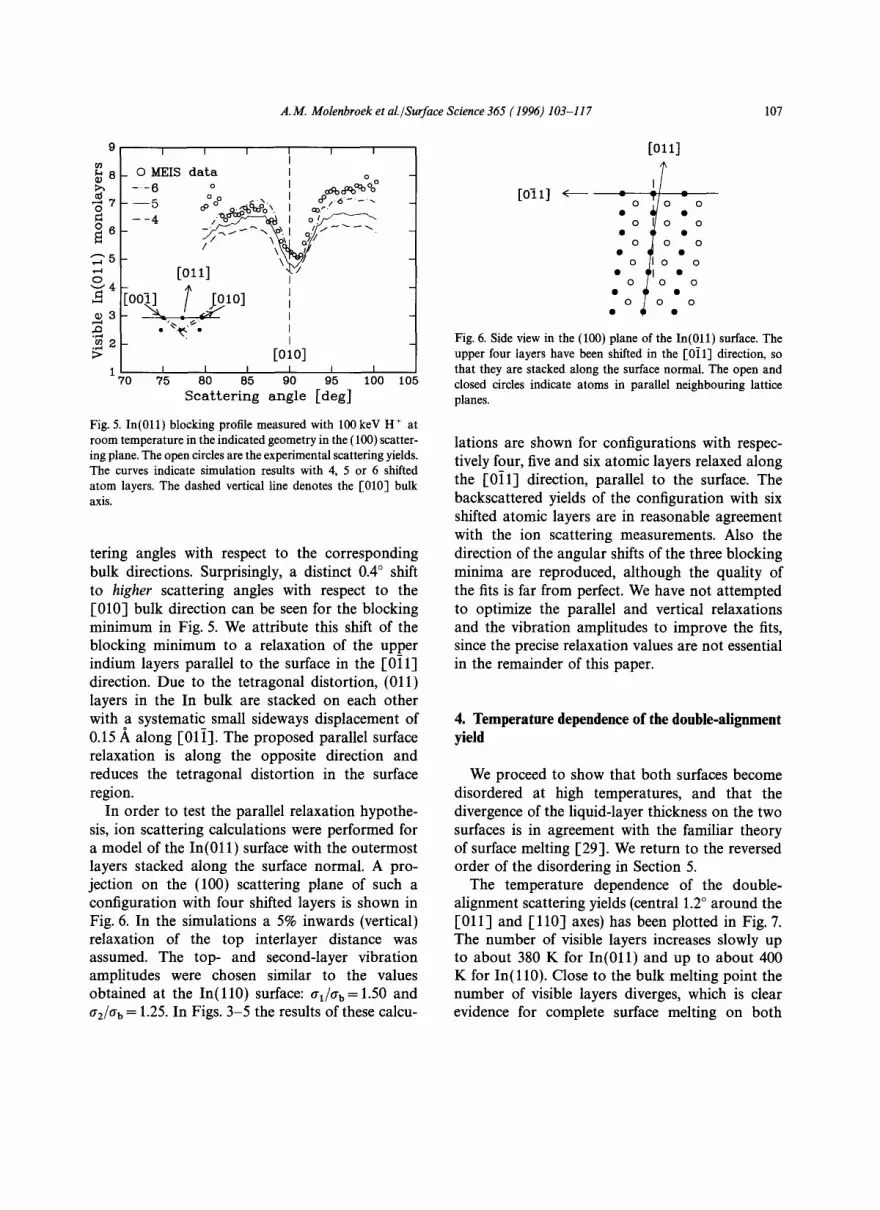
Fig. 5. In(011) blocking profile measured with 100 keV H ÷ at room temperature in the indicated geometry in the (100) scatter- ing plane. The open circles are the experimental scattering yields. The curves indicate simulation results with 4, 5 or 6 shifted atom layers. The dashed vertical line denotes the [010] bulk axis.
tering angles with respect to the corresponding bulk directions. Surprisingly, a distinct 0.4 ° shift to higher scattering angles with respect to the 1,010] bulk direction can be seen for the blocking minimum in Fig. 5. We attribute this shift of the blocking minimum to a relaxation of the upper indium layers parallel to the surface in the rOl l ] direction. Due to the tetragonal distortion, (011) layers in the In bulk are stacked on each other with a systematic small sideways displacement of 0.15 ,~ along [011]. The proposed parallel surface relaxation is along the opposite direction and reduces the tetragonal distortion in the surface region.
In order to test the parallel relaxation hypothe- sis, ion scattering calculations were performed for a model of the In(011) surface with the outermost layers stacked along the surface normal, A pro- jection on the (100) scattering plane of such a configuration with four shifted layers is shown in Fig. 6. In the simulations a 5% inwards (vertical) relaxation of the top interlayer distance was assumed. The top- and second-layer vibration amplitudes were chosen similar to the values obtained at the In ( l l 0 ) surface: t r t /ab=l .50 and a2/ab = 1.25. In Figs. 3-5 the results of these calcu-
[o-i 1] < o
o
o
o
o "I o
[011]
o o
o O
O o
o o
o o
o o
Fig. 6. Side view in the (100) plane of the In(011) surface. The upper four layers have been shifted in the [0il] direction, so that they are stacked along the surface normal. The open and closed circles indicate atoms in parallel neighbouring lattice planes.
lations are shown for configurations with respec- tively four, five and six atomic layers relaxed along the F0i l ] direction, parallel to the surface. The backscattered yields of the configuration with six shifted atomic layers are in reasonable agreement with the ion scattering measurements. Also the direction of the angular shifts of the three blocking minima are reproduced, although the quality of the fits is far from perfect. We have not attempted to optimize the parallel and vertical relaxations and the vibration amplitudes to improve the fits, since the precise relaxation values are not essential in the remainder of this paper.
4. T e m p e r a t u r e d e p e n d e n c e o f t h e d o u b l e - a l i g n m e n t yield
We proceed to show that both surfaces become disordered at high temperatures, and that the divergence of the liquid-layer thickness on the two surfaces is in agreement with the familiar theory of surface melting 1,29]. We return to the reversed order of the disordering in Section 5.
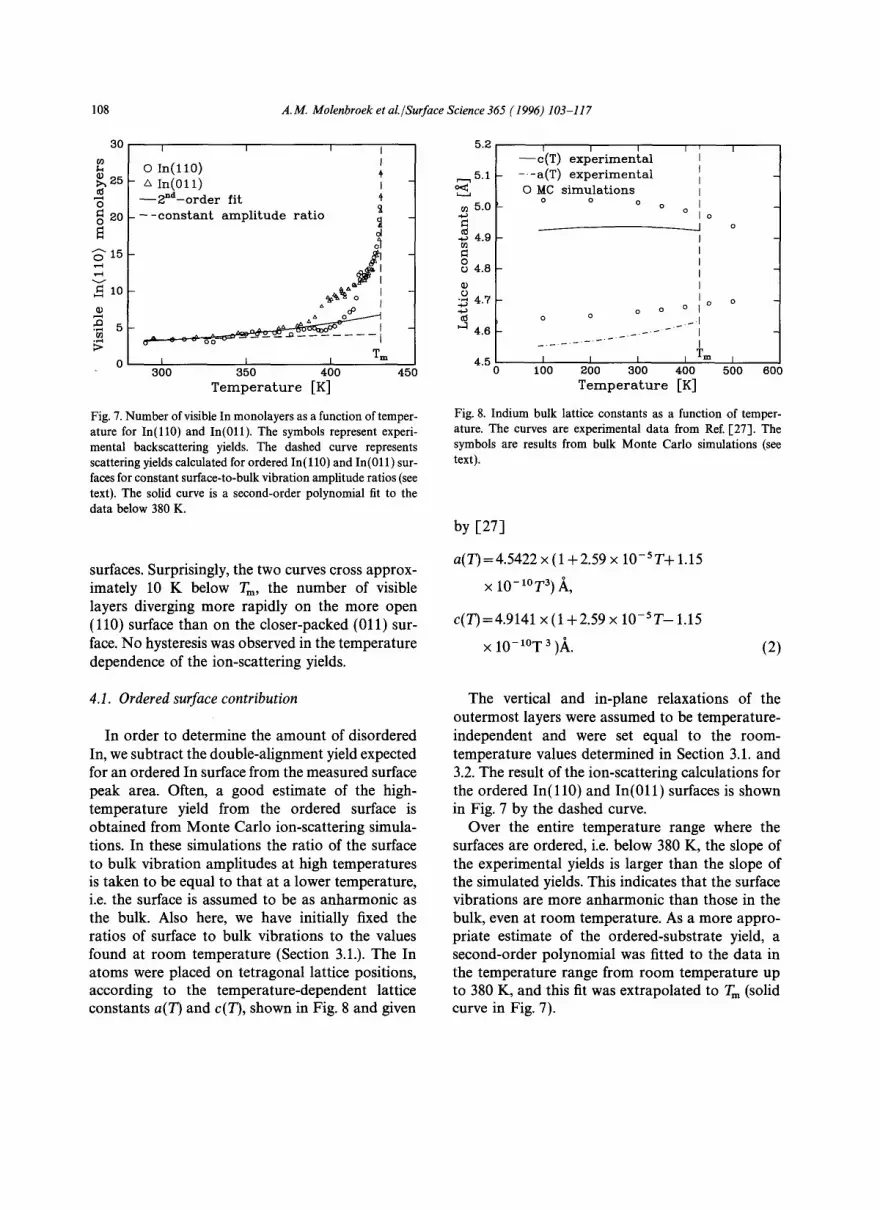
The temperature dependence of the double- alignment scattering yields (central 1.2 ° around the 1,011] and [110] axes) has been plotted in Fig. 7. The number of visible layers increases slowly up to about 380 K for In(011) and up to about 400 K for In( l l0 ) . Close to the bulk melting point the number of visible layers diverges, which is clear evidence for complete surface melting on both
108 A.M. Molenbroek et al,/Surface Science 365 (1996) 103-I17
30 ~9
~, 25
o ~ 20
i5
lo
5
0
I i I I
J 0 In(110) I n ( O l l ) i
- - 2nd--order f i t - - c o n s t a n t a m p l i t u d e r a t i o
d ol
I I I Tm 300 350 400
Tempera tu re [K] 450
Fig. 7. Number of visible In monolayers as a function of temper- ature for In( l l0) and In(011). The symbols represent experi- mental backscattering yields. The dashed curve represents scattering yields calculated for ordered In(110) and In(011) sur- faces for constant surface-to-bulk vibration amplitude ratios (see text). The solid curve is a second-order polynomial fit to the data below 380 K.
surfaces. Surprisingly, the two curves cross approx- imately 10 K below Tm, the number of visible layers diverging more rapidly on the more open (110) surface than on the closer-packed (011) sur- face. No hysteresis was observed in the temperature dependence of the ion-scattering yields.
5.2
5.0
C -~ 4.9
~ 4.8 II)
~ 4 . 7
~ 4.6
I I I
- - e ( T ) e x p e r i m e n t a l - -a(T) e x p e r i m e n t a l 0 MC s i m u l a t i o n s
o o o O
O o
_1 o
4 .5 I 0 5 0 0 6 0 0
o o o o
o o . . ~ j
I
I I I I T m 100 200 300 400
Tempera tu re [K]
Fig. 8. Indium bulk lattice constants as a function of temper- ature. The curves are experimental data from Ref. 1-27]. The symbols are results from bulk Monte Carlo simulations (see text).
by [27]
a(T) =4.5422 x (1 + 2.59 x 10-s T+ 1.15
X 1 0 - 1 ° T 3 ) ,~,
c(T) = 4.9141 x (1 +2.59 x 10-ST - 1.15
x 10-X°T 3 )~,. (2)
4.1. Ordered surface contribution
In order to determine the amount of disordered In, we subtract the double-alignment yield expected for an ordered In surface from the measured surface peak area. Often, a good estimate of the high- temperature yield from the ordered surface is obtained from Monte Carlo ion-scattering simula- tions. In these simulations the ratio of the surface to bulk vibration amplitudes at high temperatures is taken to be equal to that at a lower temperature, i.e. the surface is assumed to be as anharmonic as the bulk. Also here, we have initially fixed the ratios of surface to bulk vibrations to the values found at room temperature (Section 3.1.). The In atoms were placed on tetragonal lattice positions, according to the temperature-dependent lattice constants a(T) and c(T), shown in Fig. 8 and given
The vertical and in-plane relaxations of the outermost layers were assumed to be temperature- independent and were set equal to the room- temperature values determined in Section 3.1. and 3.2. The result of the ion-scattering calculations for the ordered In(110) and In(011) surfaces is shown in Fig. 7 by the dashed curve.
Over the entire temperature range where the surfaces are ordered, i.e. below 380 K, the slope of the experimental yields is larger than the slope of the simulated yields. This indicates that the surface vibrations are more anharmonic than those in the bulk, even at room temperature. As a more appro- priate estimate of the ordered-substrate yield, a second-order polynomial was fitted to the data in the temperature range from room temperature up to 380 K, and this fit was extrapolated to Tm (solid curve in Fig. 7).
A.M. Molenbroek et aL/Surface Science 365 (1996) 103-117 109
4.2. Logarithmic growth regime
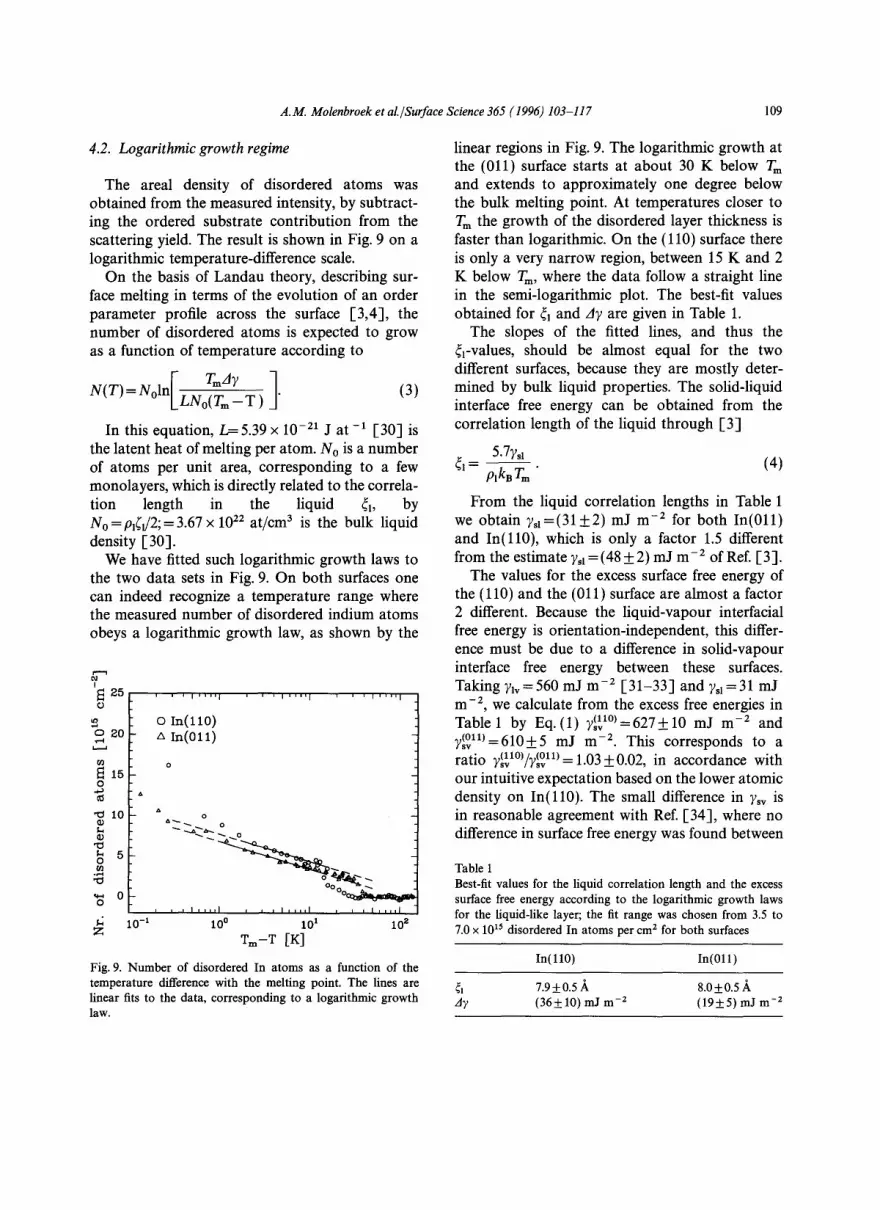
The areal density of disordered atoms was obtained from the measured intensity, by subtract- ing the ordered substrate contribution from the scattering yield. The result is shown in Fig. 9 on a logarithmic temperature-difference scale.
On the basis of Landau theory, describing sur- face melting in terms of the evolution of an order parameter profile across the surface [3,4], the number of disordered atoms is expected to grow as a function of temperature according to
• , F TmZ]~ -]
N(T) = Iv OmLLNo(-~m - T ) ]" (3)
In this equation, L= 5.39 x 10 -21 J a t -1 [30] is the latent heat of melting per atom. No is a number of atoms per unit area, corresponding to a few monolayers, which is directly related to the correla- tion length in the liquid ~l, by No = pl~J2; = 3.67 x 10²² at/cm 3 is the bulk liquid density [30].
We have fitted such logarithmic growth laws to the two data sets in Fig. 9. On both surfaces one can indeed recognize a temperature range where the measured number of disordered indium atoms obeys a logarithmic growth law, as shown by the
g-,
'~ 25 0
@
'~ 10
~ 5 @
~ o
£ i0-I Z
' ' I ' ' ' ' 1
0 In(t10) zx In (011)
o
I i i : 1 1 1 I : i i I l l 1 i
o
A ~ o
~ o
, , I , , , , I , , , I , , , , I , , l , , , , l
I0 ° 101 IO s
Tm-T [K]
Fig. 9. Number of disordered In atoms as a function of the temperature difference with the melting point. The lines are linear fits to the data, corresponding to a logarithmic growth law.
linear regions in Fig. 9. The logarithmic growth at the (011) surface starts at about 30 K below Tm and extends to approximately one degree below the bulk melting point. At temperatures closer to Tm the growth of the disordered layer thickness is faster than logarithmic. On the (110) surface there is only a very narrow region, between 15 K and 2 K below Tm, where the data follow a straight line in the semi-logarithmic plot. The best-fit values obtained for 41 and A7 are given in Table 1.
The slopes of the fitted lines, and thus the ~l-Values, should be almost equal for the two different surfaces, because they are mostly deter- mined by bulk liquid properties. The solid-liquid interface free energy can be obtained from the correlation length of the liquid through [3]
5.7ysl 41= plka ~ . (4)
From the liquid correlation lengths in Table 1 we obtain 7s1=(31+2) mJ m -2 for both In(011) and In(l l0) , which is only a factor 1.5 different from the estimate 7sl = (48 ___ 2) mJ m -2 of Ref. [3].
The values for the excess surface free energy of the (110) and the (011) surface are almost a factor 2 different. Because the liquid-vapour interfacial free energy is orientation-independent, this differ- ence must be due to a difference in solid-vapour interface free energy between these surfaces. Taking 71v = 560 mJ m -2 [-31-33] and 7s1=31 mJ m -2, we calculate from the excess free energies in Table 1 by Eq.(1) V~1°)=627 _10 mJ m -2 and 7 t °n ) -610+5 mJ m -2. This corresponds to a
S V - - - -
ratio ~ (n°)/4°H) - 1 03 +0.02, in accordance with g S V I I S V - - " - -
our intuitive expectation based on the lower atomic density on In(l l0) . The small difference in 7~ is in reasonable agreement with Ref. [34], where no difference in surface free energy was found between
Table 1 Best-fit values for the liquid correlation length and the excess surface free energy according to the logarithmic growth laws for the liquid-like layer; the fit range was chosen from 3.5 to 7.0 x 10¹⁵ disordered In atoms per cm 2 for both surfaces
In ( l l0 ) In(011)
4] 7.9+0.5 ,~ 8.0-1-0.5/k Ay (36___10) mJ m -2 (19_+5) mJ m -2
110 A.M. Molenbroek et al./Surface Science 365 (1996) 103-117
In( l l0) and In(011), but disagrees with electron microscopy measurements on equilibrium-shape In crystals by Heyraud et al. [35]. These authors concluded that the surface free energy on In( l l0) is 1% lower than that on In(011).
4.3. Power-law growth regime
Table 2 Best-fit values for the exponent and the Hamaker constant according to a power-law growth of the liquid-like layer
I n ( l l 0 ) In(011)
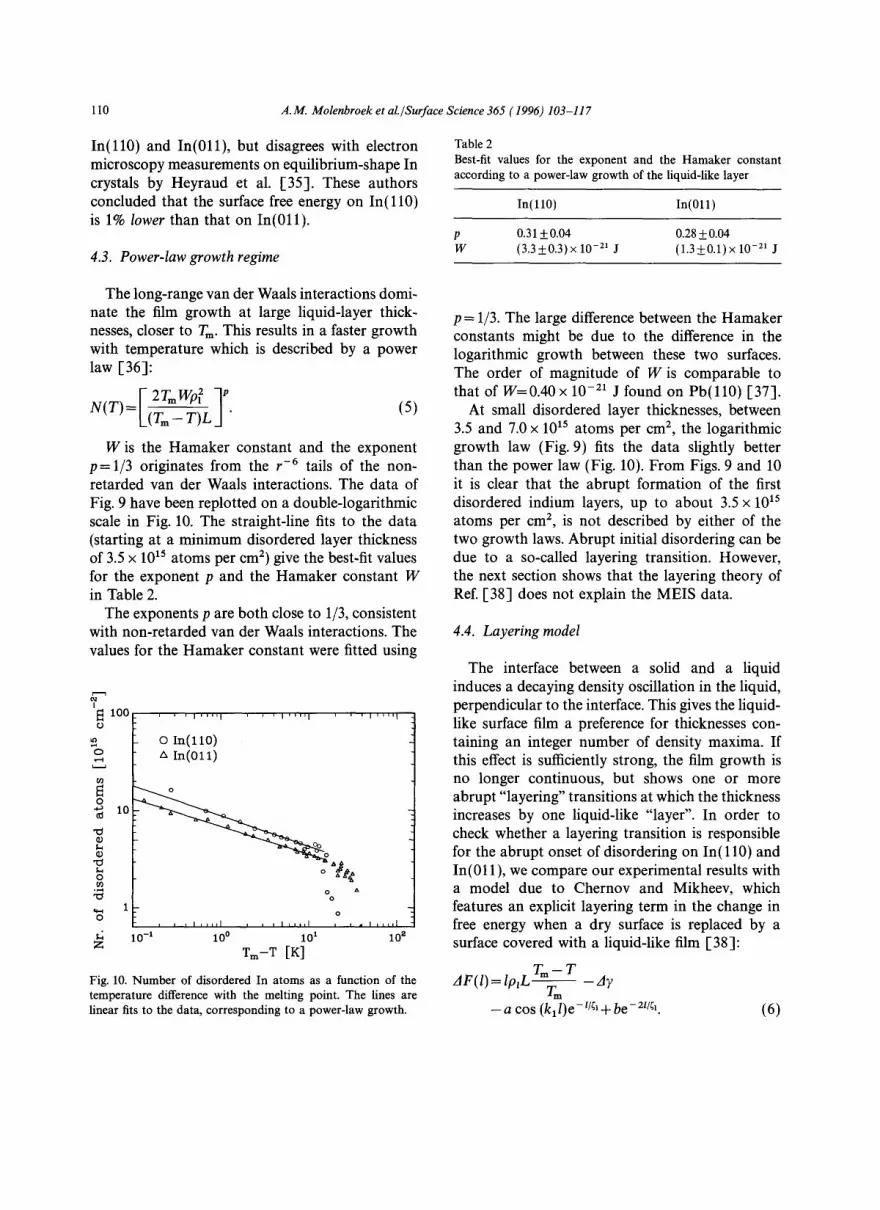
p 0.31 +0.04 0.28+0.04 W (3 .3_0 .3 )x 10 -21 J (1 .3+0.1)x 10 -11 J
The long-range van der Waals interactions domi- nate the film growth at large liquid-layer thick- nesses, closer to Tin. This results in a faster growth with temperature which is described by a power law [36]:
_[_2rmWp 1" N(T)-/(Tin - T)L (5)
W is the Hamaker constant and the exponent p = 1/3 originates from the r -6 tails of the non- retarded van der Waals interactions. The data of Fig. 9 have been replotted on a double-logarithmic scale in Fig. 10. The straight-line fits to the data (starting at a minimum disordered layer thickness of 3.5 x 10¹⁵ atoms per cm 2) give the best-fit values for the exponent p and the Hamaker constant W in Table 2.
The exponents p are both close to 1/3, consistent with non-retarded van der Waals interactions. The values for the Hamaker constant were fitted using
I
100 0
o
o .o 10 t~
II)
o
o
' ' I''''I
0 I n ( l l O ) tn(O11)
' ' I''''I ' ' I''''I
_oo
% "
o
i , i , , , , I , i I I I I L I i ~ i , i l i l
10 -a 10 ° 101 l0 g Z
T m - T [ K ]
Fig. 10. Number of disordered In atoms as a function of the temperature difference with the melting point. The lines are linear fits to the data, corresponding to a power-law growth.
p = 1/3. The large difference between the Hamaker constants might be due to the difference in the logarithmic growth between these two surfaces. The order of magnitude of W is comparable to that of W=0.40 x 10 -21 J found on Pb( l l0) [37].
At small disordered layer thicknesses, between 3.5 and 7.0 x 10¹⁵ atoms per cm 2, the logarithmic growth law (Fig. 9) fits the data slightly better than the power law (Fig. 10). From Figs. 9 and 10 it is clear that the abrupt formation of the first disordered indium layers, up to about 3.5 x 10¹⁵ atoms per cm 2, is not described by either of the two growth laws. Abrupt initial disordering can be due to a so-called layering transition. However, the next section shows that the layering theory of Ref. [38] does not explain the MEIS data.
4.4. Layering model
The interface between a solid and a liquid induces a decaying density oscillation in the liquid, perpendicular to the interface. This gives the liquid- like surface film a preference for thicknesses con- taining an integer number of density maxima. If this effect is sufficiently strong, the film growth is no longer continuous, but shows one or more abrupt "layering" transitions at which the thickness increases by one liquid-like "layer". In order to check whether a layering transition is responsible for the abrupt onset of disordering on In(110) and In(011), we compare our experimental results with a model due to Chernov and Mikheev, which features an explicit layering term in the change in free energy when a dry surface is replaced by a surface covered with a liquid-like film [38]:
Tm-- T dF(1)=Ip,L -T-~ d~
- a c o s ( k 11) e - it~ + b e - 2l/~1. (6)
A.M. Molenbroek et al./Surface Science 365 (1996) 103-117 111
The layering contribution oscillates as a function of the film thickness l - N i p I with a period 2~/kl =3.32 ~ -1 [30], where kx denotes the loca- tion of the first maximum in the structure factor of the liquid. The boundary condition that AF(O)= 0 gives
A ~ = b - a . (7)
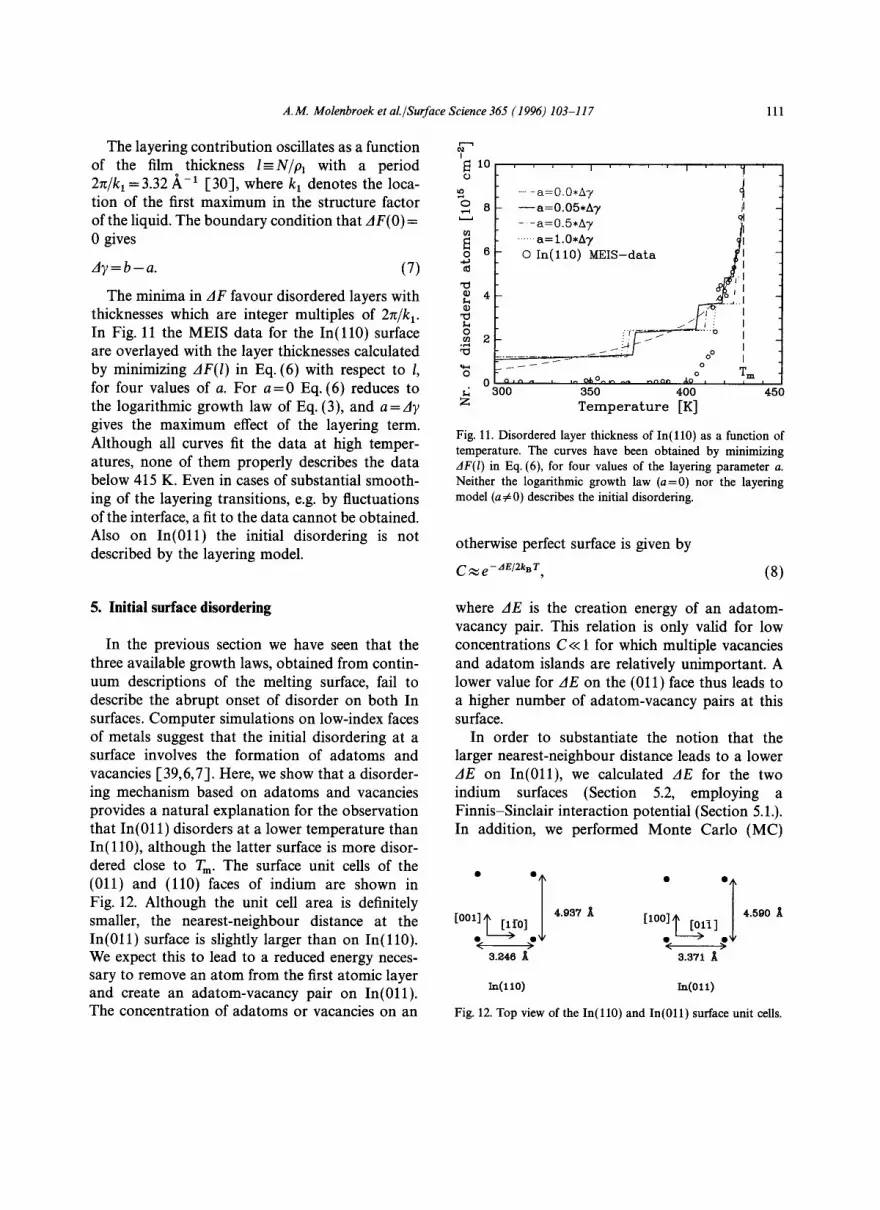
The minima in AF favour disordered layers with thicknesses which are integer multiples of 2~/k 1. In Fig. 11 the MEIS data for the In ( l l 0 ) surface are overlayed with the layer thicknesses calculated by minimizing AF(l) in Eq. (6) with respect to 1, for four values of a. For a - -0 Eq. (6) reduces to the logarithmic growth law of Eq. (3), and a=Ay gives the maximum effect of the layering term. Although all curves fit the data at high temper- atures, none of them properly describes the data below 415 K. Even in cases of substantial smooth- ing of the layering transitions, e.g. by fluctuations of the interface, a fit to the data cannot be obtained. Also on In(011) the initial disordering is not described by the layering model.
I l0
0 tO
o 8 i_..a
£ z
' ' ' ' I ' ' ' ' I
-- -a=O'O*A7 4 - - a = O . O 5 , A 7 il
- - a=0"5*A7 ~1 ...... a = 1.0*A 7 ~1
- o uEIS-d t t ' , i f ,
I IJ//J.. { %1
~ I I
i f'- ~ ~V'YY"--- ..... ° I / ~ y oO I
o Tm 0 c~ , ~ ~ , ,~ 0~,0^ ~ ~ ~ c ~ d~ 0 I I I I
300 350 400 450 Tempera tu re [K]
Fig. 11. Disordered layer thickness of In ( l l0 ) as a function of temperature. The curves have been obtained by minimizing AF(1) in Eq. (6), for four values of the layering parameter a. Neither the logarithmic growth law (a=0) nor the layering model (a~0) describes the initial disordering.
otherwise perfect surface is given by
C ~ e- AE/2kB T, (8)
5. Initial surface disordering
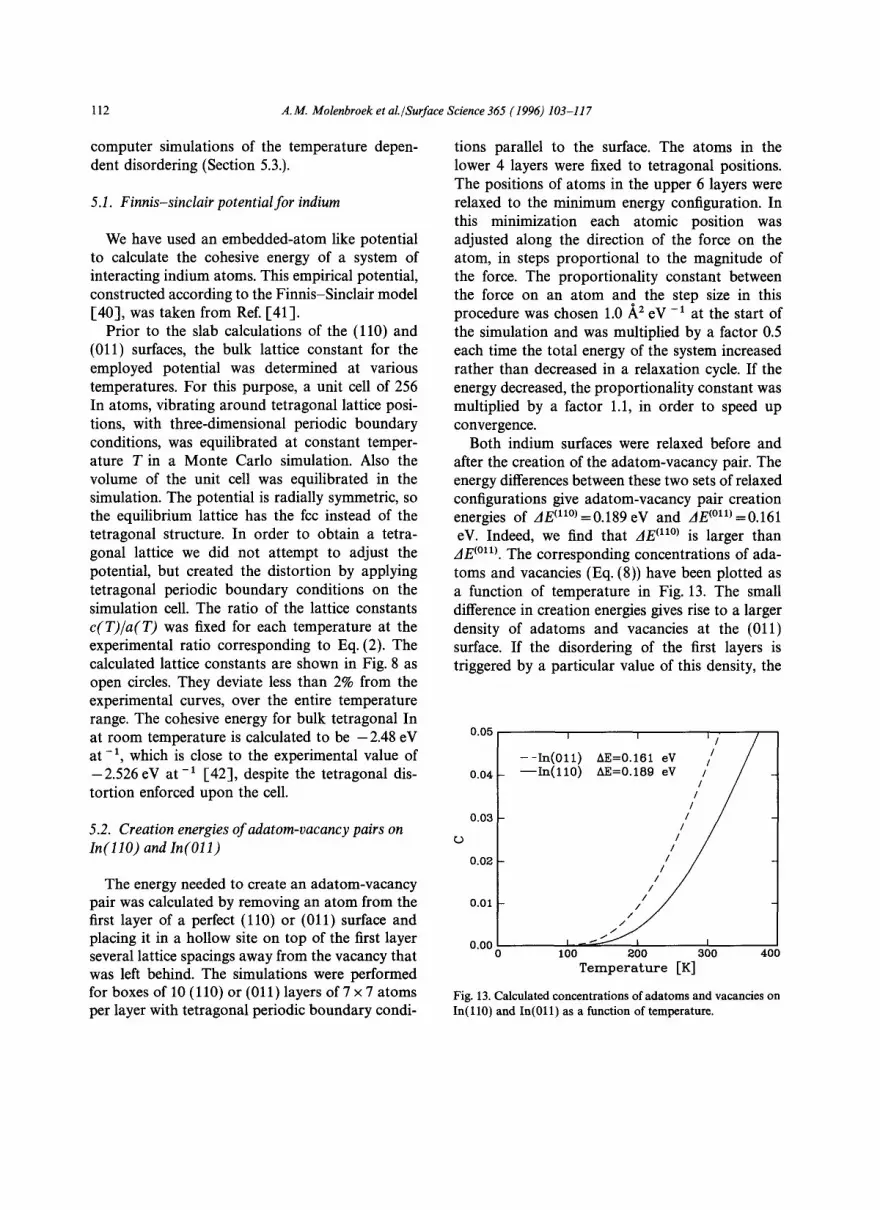
In the previous section we have seen that the three available growth laws, obtained from contin- uum descriptions of the melting surface, fail to describe the abrupt onset of disorder on both In surfaces. Computer simulations on low-index faces of metals suggest that the initial disordering at a surface involves the formation of adatoms and vacancies [39,6,7]. Here, we show that a disorder- ing mechanism based on adatoms and vacancies provides a natural explanation for the observation that In(011) disorders at a lower temperature than In( l l0 ) , although the latter surface is more disor- dered close to T m. The surface unit cells of the (011) and (110) faces of indium are shown in Fig. 12. Although the unit cell area is definitely smaller, the nearest-neighbour distance at the In(011) surface is slightly larger than on In( l l0) . We expect this to lead to a reduced energy neces- sary to remove an atom from the first atomic layer and create an adatom-vacancy pair on In(011). The concentration of adatoms or vacancies on an
where d E is the creation energy of an adatom- vacancy pair. This relation is only valid for low concentrations C<< 1 for which multiple vacancies and adatom islands are relatively unimportant. A lower value for d E on the (011) face thus leads to a higher number of adatom-vacancy pairs at this surface.
In order to substantiate the notion that the larger nearest-neighbour distance leads to a lower AE on In(011), we calculated AE for the two indium surfaces (Section 5.2, employing a Finnis-Sinclair interaction potential (Section 5.1.). In addition, we performed Monte Carlo (MC)
[o0 1 [10o] t nl
3.246 ~ 3.371 3t
4.590 I
~a01o) r,,(olO
Fig. 12. Top view of the In ( l l0 ) and In(011) surface unit cells.
112 A.M. Molenbroek et aL /Surface Science 365 (1996) 103-117
computer simulations of the temperature depen- dent disordering (Section 5.3.).
5.1. Finnis-sinclair potential for indium
We have used an embedded-atom like potential to calculate the cohesive energy of a system of interacting indium atoms. This empirical potential, constructed according to the Finnis-Sinclair model [40], was taken from Ref. [41].
Prior to the slab calculations of the (110) and (011) surfaces, the bulk lattice constant for the employed potential was determined at various temperatures. For this purpose, a unit cell of 256 In atoms, vibrating around tetragonal lattice posi- tions, with three-dimensional periodic boundary conditions, was equilibrated at constant temper- ature T in a Monte Carlo simulation. Also the volume of the unit cell was equilibrated in the simulation. The potential is radially symmetric, so the equilibrium lattice has the fcc instead of the tetragonal structure. In order to obtain a tetra- gonal lattice we did not attempt to adjust the potential, but created the distortion by applying tetragonal periodic boundary conditions on the simulation cell. The ratio of the lattice constants c(T)/a(T) was fixed for each temperature at the experimental ratio corresponding to Eq. (2). The calculated lattice constants are shown in Fig. 8 as open circles. They deviate less than 2% from the experimental curves, over the entire temperature range. The cohesive energy for bulk tetragonal In at room temperature is calculated to be -2.48 eV at-1, which is close to the experimental value of -2.526 eV at -1 [42], despite the tetragonal dis- tortion enforced upon the cell.
5.2. Creation energies of adatom-vacancy pairs on In(llO) and In(011)
The energy needed to create an adatom-vacancy pair was calculated by removing an atom from the first layer of a perfect (110) or (011) surface and placing it in a hollow site on top of the first layer several lattice spacings away from the vacancy that was left behind. The simulations were performed for boxes of 10 (110) or (011) layers of 7 x 7 atoms per layer with tetragonal periodic boundary condi-
tions parallel to the surface. The atoms in the lower 4 layers were fixed to tetragonal positions. The positions of atoms in the upper 6 layers were relaxed to the minimum energy configuration. In this minimization each atomic position was adjusted along the direction of the force on the atom, in steps proportional to the magnitude of the force. The proportionality constant between the force on an atom and the step size in this procedure was chosen 1.0 A 2 eV -x at the start of the simulation and was multiplied by a factor 0.5 each time the total energy of the system increased rather than decreased in a relaxation cycle. If the energy decreased, the proportionality constant was multiplied by a factor 1.1, in order to speed up convergence.
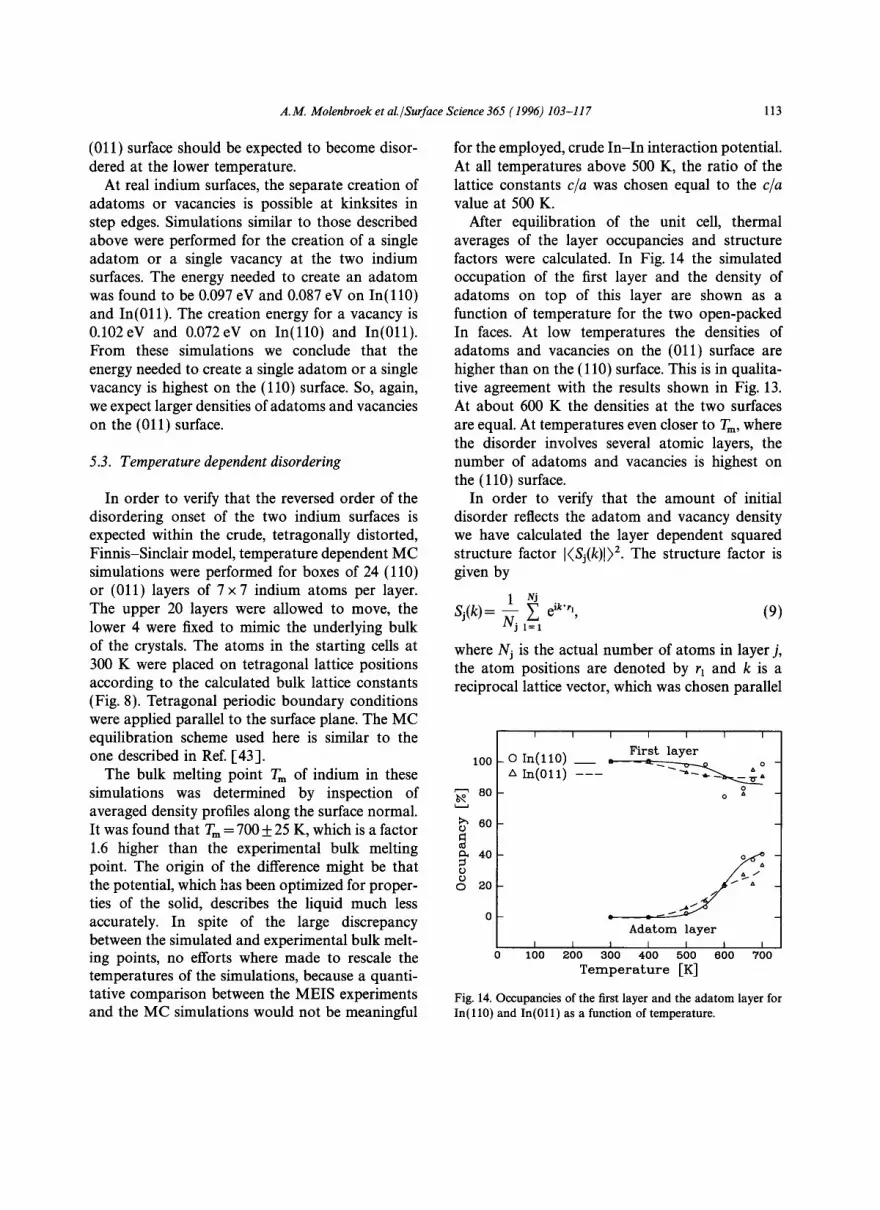
Both indium surfaces were relaxed before and after the creation of the adatom-vacancy pair. The energy differences between these two sets of relaxed configurations give adatom-vacancy pair creation energies of AE (u°) =0.189 eV and AE (°n) =0.161 eV. Indeed, we find that AE m°) is larger than AE ¢°m. The corresponding concentrations of ada- toms and vacancies (Eq. (8)) have been plotted as a function of temperature in Fig. 13. The small difference in creation energies gives rise to a larger density of adatoms and vacancies at the (011) surface. If the disordering of the first layers is triggered by a particular value of this density, the
~)
0.05
0.04
0.03
0.02
0.01
0.00 0
i i b/- /
--In(Oil) AE=O.161 eV // / - - I n ( l l O ) AE=O.189 eV i/// /
I . - I 100 200 300 400
Temperature [K]
Fig. 13. Calculated concentrations of adatoms and vacancies on In( l l0 ) and In(011) as a function of temperature.
A.M. Molenbroek et aL /Surface Science 365 (1996) 103-117 113
(011) surface should be expected to become disor- dered at the lower temperature.
At real indium surfaces, the separate creation of adatoms or vacancies is possible at kinksites in step edges. Simulations similar to those described above were performed for the creation of a single adatom or a single vacancy at the two indium surfaces. The energy needed to create an adatom was found to be 0.097 eV and 0.087 eV on In(l l0) and In(011). The creation energy for a vacancy is 0.102eV and 0.072eV on In(ll0) and In(011). From these simulations we conclude that the energy needed to create a single adatom or a single vacancy is highest on the (110) surface. So, again, we expect larger densities of adatoms and vacancies on the (011) surface.
5.3. Temperature dependent disordering
In order to verify that the reversed order of the disordering onset of the two indium surfaces is expected within the crude, tetragonally distorted, Finnis-Sinclair model, temperature dependent MC simulations were performed for boxes of 24 (110) or (011) layers of 7 x 7 indium atoms per layer. The upper 20 layers were allowed to move, the lower 4 were fixed to mimic the underlying bulk of the crystals. The atoms in the starting cells at 300 K were placed on tetragonal lattice positions according to the calculated bulk lattice constants (Fig. 8). Tetragonal periodic boundary conditions were applied parallel to the surface plane. The MC equilibration scheme used here is similar to the one described in Ref. [43].
The bulk melting point Tm of indium in these simulations was determined by inspection of averaged density profiles along the surface normal. It was found that Tm= 700___ 25 K, which is a factor 1.6 higher than the experimental bulk melting point. The origin of the difference might be that the potential, which has been optimized for proper- ties of the solid, describes the liquid much less accurately. In spite of the large discrepancy between the simulated and experimental bulk melt- ing points, no efforts where made to rescale the temperatures of the simulations, because a quanti- tative comparison between the MEIS experiments and the MC simulations would not be meaningful
for the employed, crude In-In interaction potential. At all temperatures above 500 K, the ratio of the lattice constants c/a was chosen equal to the c/a value at 500 K.
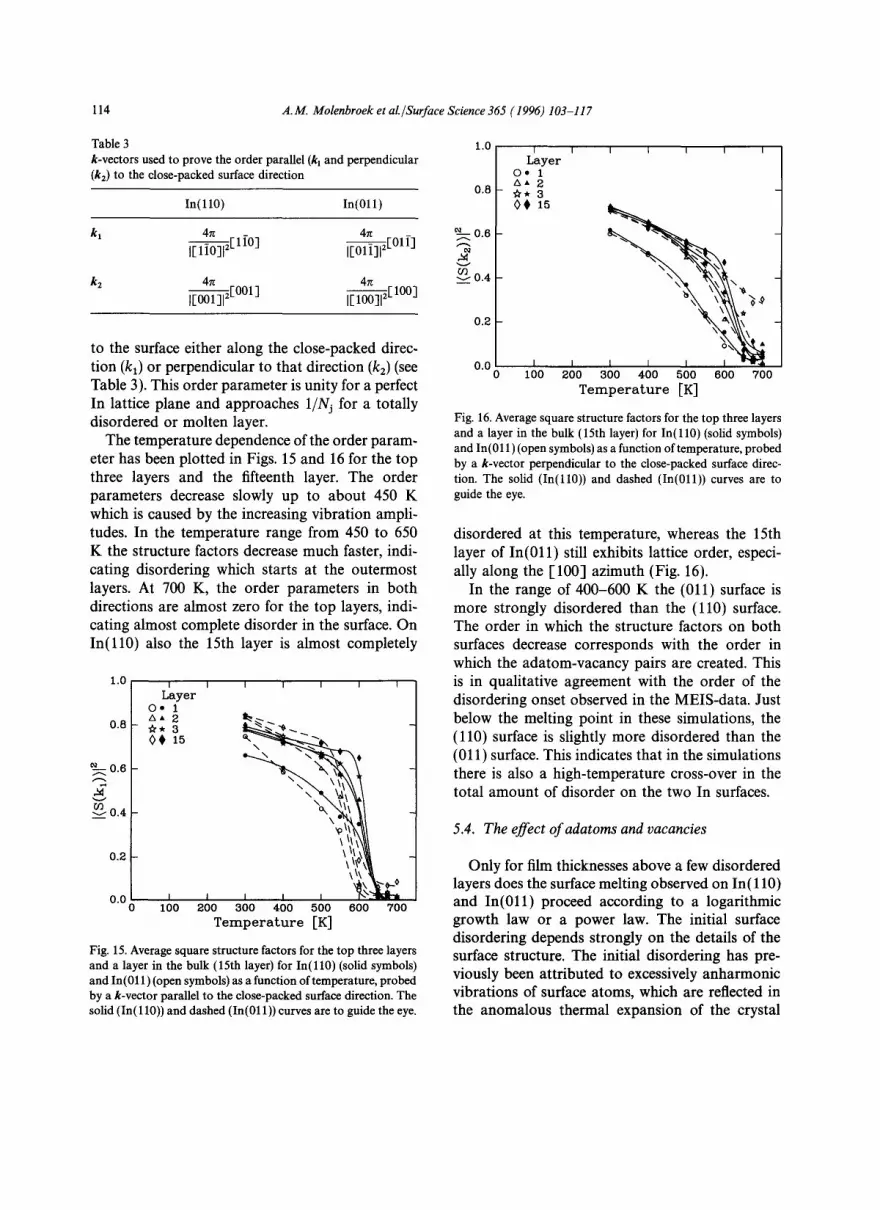
After equilibration of the unit cell, thermal averages of the layer occupancies and structure factors were calculated. In Fig. 14 the simulated occupation of the first layer and the density of adatoms on top of this layer are shown as a function of temperature for the two open-packed In faces. At low temperatures the densities of adatoms and vacancies on the (011) surface are higher than on the (110) surface. This is in qualita- tive agreement with the results shown in Fig. 13. At about 600 K the densities at the two surfaces are equal. At temperatures even closer to Tm, where the disorder involves several atomic layers, the number of adatoms and vacancies is highest on the (110) surface.
In order to verify that the amount of initial disorder reflects the adatom and vacancy density we have calculated the layer dependent squared structure factor [(Sj(k)[) 2. The structure factor is given by
1 Nj Sj(k)= ~ I=I ~' eik'r'' (9)
where Nj is the actual number of atoms in layer j, the atom positions are denoted by rx and k is a reciprocal lattice vector, which was chosen parallel
100
80
h,, (30
40 ¢..)
o 20
I 0 100
f I I I I I I
0 I n ( l l O ) _ _ F i r s t l a y e r
Ix In(011) ---
A J f ~ A
Adatom layer
L l I l t l 200 800 400 500 600 700
T e m p e r a t u r e [K]
Fig. 14. Occupancies of the first layer and the adatom layer for In(110) and In(011) as a function of temperature.
114 A.M. Molenbroek et at~Surface Science 365 (1996) 103-117
Table 3 k-vectors used to prove the order parallel (kl and perpendicular (k2) to the close-packed surface direction
In(llO) In(Oil)
kl 4~ 4~ i[liO]l 2[lfO] i[o1i]12[Olf]
k 2 4n 4~ ~ [ 0 0 1 ] I[ lOO]12[ 100]
to the surface either along the close-packed direc- tion (k,) or perpendicular to that direction (k2) (see Table 3). This order parameter is unity for a perfect In lattice plane and approaches 1/N] for a totally disordered or molten layer.
The temperature dependence of the order param- eter has been plotted in Figs. 15 and 16 for the top three layers and the fifteenth layer. The order parameters decrease slowly up to about 450 K which is caused by the increasing vibration ampli- tudes. In the temperature range from 450 to 650 K the structure factors decrease much faster, indi- cating disordering which starts at the outermost layers. At 700 K, the order parameters in both directions are almost zero for the top layers, indi- cating almost complete disorder in the surface. On In(l l0) also the 15th layer is almost completely
1.0 I Layer
0- l AA2
0.8 ~'* 3 o, 15
0.2
0.0 0 100
~ . 0 . 6
~-~- 0.4
i I i I I I
",. " ~ ',.a
\ \
I I I I
200 300 400 500 Temperature [K]
i 600 700
Fig. 15. Average square structure factors for the top three layers and a layer in the bulk (15th layer) for In(ll0) (solid symbols) and In(011) (open symbols) as a function of temperature, probed by a k-vector parallel to the close-packed surface direction. The solid (In(110)) and dashed (In(011)) curves are to guide the eye.
1.0
0.8
0.6
v
0.4
0.2
I
Layer o * I z~A2 ~ . 3 o, 15
0.0 I I 0 100
I I [ I I I
200 300 400 500 600 700 Temperature [K]
Fig. 16. Average square structure factors for the top three layers and a layer in the bulk (15th layer) for In(l l0) (solid symbols) and In(011) (open symbols) as a function of temperature, probed by a k-vector perpendicular to the close-packed surface direc- tion. The solid (In(ll0)) and dashed (In(011)) curves are to guide the eye.
disordered at this temperature, whereas the 15th layer of In(011) still exhibits lattice order, especi- ally along the [100] azimuth (Fig. 16).
In the range of 400-600 K the (011) surface is more strongly disordered than the (110) surface. The order in which the structure factors on both surfaces decrease corresponds with the order in which the adatom-vacancy pairs are created. This is in qualitative agreement with the order of the disordering onset observed in the MEIS-data. Just below the melting point in these simulations, the (110) surface is slightly more disordered than the (011) surface. This indicates that in the simulations there is also a high-temperature cross-over in the total amount of disorder on the two In surfaces.
5.4. The effect of adatoms and vacancies
Only for film thicknesses above a few disordered layers does the surface melting observed on In(110) and In(011) proceed according to a logarithmic growth law or a power law. The initial surface disordering depends strongly on the details of the surface structure. The initial disordering has pre- viously been attributed to excessively anharmonic vibrations of surface atoms, which are reflected in the anomalous thermal expansion of the crystal
A.M. Molenbroek et al./Surface Science 365 (1996) 103-117 115
surface [44,45,39,46,14]. In Ref. [43] we have shown that strongly anharmonic surface vibrations and anomalous thermal expansion at the surface alone are not sufficient to initiate surface melting on AI(001). Computer simulations on AI(ll0) [6,7] and Ni(l l0) [39] have already indicated that the creation of adatoms and vacancies medi- ates surface melting.
In order to obtain a direct impression of the influence of adatoms and vacancies, we performed several additional Monte Carlo simulations on A1 surfaces [7,43]. In one set of simulations, extra adatoms (or vacancies) were randomly added on AI(ll0), up to concentrations of 20% of a mono- layer. The extra adatoms did not affect the charac- ter of the disordering process with respect to that of an ideal AI(ll0) surface, but they reduced the onset temperature of the surface disordering by several tens of degrees. The addition of extra vacancies at the surface resulted in comparable reductions of the onset temperature of surface disordering.
Similar simulations were performed on the AI(001) surface. The addition of adatoms (or vacancies) up to 16% of a monolayer resulted in reductions of the square of the structure factors which were comparable to the reductions of the structure factors measured on AI(ll0). But the AI(001) surface did not develop a disordered film. From the simulations on AI(001) and AI(ll0) we have to conclude that the mere presence of adatoms or vacancies at the surface is not sufficient to fully destabilize the outer atomic layer(s).
Further information on the influence of adatoms and vacancies on the initial surface disordering was obtained from simulations on AI(110) in which the creation of adatoms was suppressed. This was done by disallowing the A1 atoms to be at positions above a certain height above the crystal surface plane (e.g. 0.1 .~). These simulations showed that the onset temperature of surface melting can be increased by several tens of degrees with respect to the onset temperature at the free AI(110) surface, but the melting of AI(110) could not be precluded. We note that this constrained type of simulation did not only forbid the creation of adatoms, but it also reduced the vibration amplitude of atoms perpendicular to the surface. Furthermore, the
interlayer spacing of the outermost layers was reduced somewhat by the height constraint above the surface. Both these effects may have had an increasing influence on the disordering temperature as well.
6. Discussion
The abrupt onset of disordering on the In sur- faces suggests that the presence of a high density of adatoms and vacancies causes a mechanical instability of the surface layer. Thus, the onset itself is governed by the atomic structure of the solid surface rather than the difference in surface free energy between a crystalline and a melted surface. Because of its tetragonal structure, In is a particu- larly favourable example for separating the proper- ties involved in the onset of the disordering and the subsequent growth of the disordered film. The average density is higher on the In(011) surface, so that this surface has the lower free energy. Nevertheless, the nearest-neighbour distance is smaller on In(ll0), so that this surface produces the lower density of adatoms and vacancies. As a result the order of the onsets of surface disordering is reversed with respect to the growth of the liquid- like layer at larger disordered layer thicknesses.
A somewhat abrupt onset of surface disordering can also be observed at the Pb(ll0) surface [47,18]. The first 3 disordered Pb-monolayers are formed in a much narrower temperature range than that predicted by the logarithmic growth law which properly describes the growth beyond 3 monolayers. Only on AI(110) does the logarithmic growth law give a good description of the initial amounts of disorder [7]. This shows that the onset does not necessarily take place at higher temper- atures than expected from the Landau model.
In a recent study on equilibrium crystal shapes of indium no difference was found in the high- temperature shape changes close to In(l l0) and In(011) [20]. Both surfaces were reported to melt about 36 K below the bulk melting point. This temperature is close to the average of the onset temperatures that can be determined from Fig. 7, approximately 28 K and 47 K below Tm for In(110) and In(011) respectively.
116 A.M. Molenbroek et al./Surface Science 365 (1996) 103-117
7. Conclusions
Medium-ene rgy ion scat ter ing measurements show tha t the In(110) and In(011) surfaces bo th exhibit regular surface melting. F o r d i sordered film thicknesses between five and ten monolayers , the growth of the thickness is well descr ibed by a logar i thmic law. Above ten monolayers , the g rowth crosses over to a power law with an exponen t close to - 1/3.
We observe an a b r u p t onset of surface d isorder- ing on bo th In surfaces which is no t pred ic ted by these g rowth laws. The a b r u p t onset canno t be descr ibed as a layer ing t rans i t ion of the l iquid- l ike film. The ini t ial d i sorder ing is a t t r ibu ted to a first- layer ins tabi l i ty b rough t a b o u t by a high densi ty of a d a t o m s and vacancies at the surface. This mechan i sm also explains the obse rva t ion tha t the In(011) surface, which shows the weaker surface mel t ing effect close to Tm, s tar ts mel t ing at a lower t empera tu re than I n ( l l 0 ) . Because of the larger nea res t -ne ighbour d is tance at the In(011) surface it is easier to create an a d a t o m - v a c a n c y pa i r on this surface, which leads to a lower onset t emper- a ture for the disorder ing. Tota l energy ca lcula t ions and M C s imula t ions suppor t this a rgument , a l though the employed F inn i s -S inc l a i r in te rac t ion poten t ia l has a bu lk mel t ing po in t which is ra ther different f rom the exper imenta l value of Tin.
There seems to be no direct re la t ion between the onset of surface disorder ing, i.e. the ins tabi l i ty of the first layers, and the t h e r m o d y n a m i c g rowth laws based on surface free-energy cons idera t ions which are obeyed at larger l iquid film thicknesses. In principle, it should be possible for surfaces with Ay < 0 to undergo the f irst- layer mechanica l insta- bility, wi thout the subsequent l iquid- l ike film growth at h igher temperatures . I t m a y well be tha t the incomple te surface melt ing, r epor ted on Pb(001) and nearby vicinal or ienta t ions , corres- ponds to such behaviour , ra ther than a layer ing t rans i t ion l"48].
References
[-1] J.G. Dash, Contemp. Phys. 30 (1989) 89. [2] J.F. van der Veen, in Phase Transitions in Surface Films
2, Eds. H. Taub et al. (Plenum, New York, 1991).
1-3] B. Pluis, D. Frenkel and J.F. van der Veen, Surf. Sci. 239 (1990) 282.
[4] R. Lipowsky, Phys. Rev. Lett. 49 (1982) 1575. [5] A.W. Denier van der Gon, R.J. Smith, J.M. Gay,
D.J. O'Connor and J.F. van der Veen, Surf. Sci. 227 (1990) 143.
[6] P. Stoltze, J.K. N~rskov and U. Landman, Surf. Sci. 220 (1989) L693.
[7] A.W. Denier van der Gon, D. Frenkel, J.W.M. Frenken, R.J. Smith and P. Stoltze, Surf. Sci. 256 (1991) 385.
[8] P. von Blanckenhagen, W. Schommers and V. Voegele, J. Vac. Sci. Technol. A 5 (1987) 649.
[9] P. Stoltze, J.K. Norskov and U. Landman, Phys. Rev. Lett. 61 (1988) 440.
[10] H. Dosch, T. Hrfer, J. Peisl and R.L. Johnson, Europhys. Lett. 15 (1991) 527.
[11] P. Carnevali, F. Ercolessi and E. Tosatti, Phys. Rev. B 36 (1987) 6701.
[12] F. Ercolessi, S. Iarlori, O. Tomagnini, E. Tosatti and X.J. Chen, Surf. Sci. 251/252 (1991) 645.
[13] A. Hoss, M. Nold, P. von Blanckenhagen and O. Meyer, Phys. Rev. B 45 (1992) 8714.
[14] H. H~ikkinen and M. Manninen, Phys. Rev. B 46 (1992) 1725.
[15] K.D. Stock, Surf. Sci. 91 (1980) 655. [16] J.W.M. Frenken, P.M.J. Marre and J.F. van der Veen,
Phys. Rev. B 34 (1986) 7506. [17] K.C. Prince, U. Breuer and H.P. Bonzel, Phys. Rev. Lett.
60 (1988) 1146. [18] B. Pluis, A.W. Denier van der Gon, J.F. van der Veen and
A.J. Riemersma, Surf. Sci. 239 (1990) 265. [19] S. Speller, M. Schleberger and W. Heiland, Surf. Sci. 269/
270 (1992) 229. [20] A. Pavlovska, D. Dobrev and E. Bauer, Surf. Sci. 314
(1994) 341. [21] W.C. Turkenburg, E. De Haas, A.F. Neuteboom, J. Ladru
boom and F.W. Saris, Nucl. Instr. Meth. 195 (1982) 581. [23] P.M.J, Marre, A.P. De Jongh, J.W. Derks and J.F. van der
Veen, Nucl. Instr. Meth. B 28 (1987) 76. [24] J.F. van der Veen, Surf. Sci. Rep. 5 (1985) 199. [25] J.W.M. Frenken, R.M. Tromp and J.F. van der Veen, Nucl.
Instr. Meth. B 17 (1986) 334. [26] J.B. Biersack and J.F. Ziegler, Nucl. Instr. Meth. 194
(1982) 93. [27] W.B. Pearson, A Handbook of Lattice Spacings and Struc-
tures of Metals and Alloys, Vol. 4 (Pergamon, Oxford, 1958).
[28] N.F. Mott and H. Jones, The theory of the properties of metals and alloys (Dover, New York, 1958).
[29] J.F. van der Veen, B. Pluis and A.W. Denier van der Gon, Chemistry and Physics of Solid Surfaces VII, Eds. R. Vanselow and R.F. Howe (Springer, Berlin, 1988).
[30] Handbook of Chemistry and Physics, 70th Ed. R.C. Weast, (CRC Press, Boca Raton, FL, 1989).
A.M. Molenbroek et al./Surface Science 365 (1996) 103-117 117
[31] A.R. Miedema, Z. Metallk. 69 (1978) 287, and references therein.
[32] A.R. Miedema and R. Boom, Z. Metallk. 69 (1978) 183, and references therein.
[33] A.R. Miedema and F.J.A. den Broeder, Z. Metallk. 70 (1979) 14, and references therein.
[34] T. Yanagihara, Jpn. J. Appl. Phys. 21 (1982) 1554. [35] J.C. Heyraud and J.J. M6tois, Surf. Sci. 177 (1986) 213. [36] R. Lipowsky, Phys. Rev. Lett. 57 (1986) 2876. [37] B. Pluis, T.N. Taylor, D. Frenkel and J.F. van der Veen,
Phys. Rev. B 40 (1989) 1353. [38] A.A. Chernov and L.V. Mikheev, Phys. Rev. Lett. 60
(1988) 2488. [39] E.T. Chen, R.N. Barnett and U. Landman, Phys. Rev. B
41 (1990) 439.
[40] M.W. Finnis and J.E. Sinclair, Phil. Mag. A 50 (1984) 45. [41] M. Breeman and D.O. Boerma, Phys. Rev. B 46 (1992)
1703. [42] D.D. Wagman, J. Phys. Chem. Ref. Data 11-2 (1982). [43] A.M. Molenbroek and J.W.M. Frenken, Phys. Rev. B 50
(1994) 11132. [44] C.S. Jayanthi, E. Tosatti and L. Pietronero, Phys. Rev. B
31 (1985) 3456. [45] J.W.M. Frenken, F. Huussen and J.F. van der Veen, Phys.
Rev. Lett. 58 (1987) 401. [46] J.F. van der Veen and J.W.M. Frenken, Surf. Sci. 251/252
(1991) 1. [47] J.W.M. Frenken and J.F. van der Veen, Phys. Rev. Lett.
85 (1985) 134. [48] H.M. van Pinxteren and J.W.M. Frenken, Surf. Sci. 275


![Temporally resolved selective regrowth of InP around [110] and [-110] mesas](https://static.documents.pub/doc/80x56/6355ac845108319c8702e8b8/temporally-resolved-selective-regrowth-of-inp-around-110-and-110-mesas.jpg)
