169
| Date post: | 10-Nov-2023 |
| Category: |
Documents |
| Upload: | khangminh22 |
| View: | 0 times |
| Download: | 0 times |
NAUFAL ALIMOV – INSTITUTIONAL INVESTORS AS SHAREHOLDERS
INSTITUTIONAL INVESTORS AS SHAREHOLDERSTHE CASE OF PENSION FUNDS
NAUFAL ALIMOV
EKONOMI OCH SAMHÄLLE ECONOMICS AND SOCIETY
308
NAUFAL ALIMOV
INSTITUTIONAL INVESTORS AS SHAREHOLDERS: THE CASE OF PENSION FUNDS
Institutional ownership in publicly listed companies has grown rapidly in recent decades. It is claimed that insti-tutional investors are well-suited for active involvement in firms’ corporate governance, because they are managed by professional managers who can utilise information bet-ter than lay investors. However, efficient governance may not be in the best interest of asset managers employed by institutional investors. The final role of institutional investors in corporate governance therefore remains an empirical question. In this dissertation, I empirically investigate the role of
public pension funds in firms’ governance, using the data from the Swedish pension system, which was reformed at the turn of the millennium. This data was chosen because Swedish public pension funds have the same history and mandates, and are expected to compete with each other. The thesis consists of four essays. In the first two, I inves-
tigate whether Swedish pension fund ownership is related to firms’ market valuation and corporate governance qual-ity. In paper three, I analyse whether these funds prefer to impact or exit underperforming firms. In the final paper, I examine whether there are similarities in the composition of the Swedish public pension funds’ domestic equity port-folios, and whether these funds adopt similar strategies in selling and buying shares of Swedish listed companies.I find that there is a contemporaneous positive relation-
ship between firms’ market valuation and public pension
fund ownership. The evidence suggests that this relation-ship is a result of public pension funds’ preference for in-vesting in firms the market values highly. My results show that public pension fund ownership in
companies is not associated with better corporate gover-nance. I find no evidence that these funds effect the diver-sification of boards by increasing the proportion of wom-en, foreigners, or directors of various ages. Furthermore, Swedish public pension funds have not been successful in promoting independent directors, securing the non-re-election of an active CEO to the Board of Directors, and reducing the wedge between cash flow and voting rights in listed firms.The analysis indicates that public pension funds tend
to sell their shares of underperforming companies, rather than facilitate the dismissal of the CEO or the Board of Di-rectors. In the final paper, I find that there has been a relatively
high degree of similarity in the domestic equity portfolios of the Swedish public pension funds. My analysis also shows that these funds have timed their purchases and sales of company shares in approximately the same way. These findings are probably the result of the constraints of a small and illiquid market for individual shares and the Swedish pension system’s stringent investment rules.
HANKEN
SCHOOL OF ECONOMICS
HELSINKI
ARKADIANKATU 22, P.O. BOX 479
00101 HELSINKI, FINLAND
TEL +358 (0)9 431 331. FAX +358 (0)9 431 33 333
VAASA
KIRJASTONKATU 16, P.O. BOX 287
65101 VAASA, FINLAND
TEL +358 (0)6 3533 700. FAX +358 (0)6 3533 703
HANKEN.FI/DHANKEN
ISBN 978-952-232-327-9 (printed)
ISBN 978-952-232-328-6 (PDF)
ISSN-L 0424-7256
ISSN 0424-7256 (printed)
ISSN 2242-699X (PDF)
JUVENES PRINT, HELSINKI
Ekonomi och samhälle Economics and Society
Skrifter utgivna vid Svenska handelshögskolan Publications of the Hanken School of Economics
No 308
Naufal Alimov
Institutional Investors as Shareholders
The Case of Pension Funds
Helsinki 2016 <
Institutional investors as shareholders: The case of pension funds
Key words: Institutional investor, pension funds, corporate governance, competition
© Hanken School of Economics & Naufal Alimov, 2016
Naufal Alimov Hanken School of Economics Department of Economics P.O.Box 479, 00101 Helsinki, Finland
Hanken School of Economics ISBN 978-952-232-327-9 (printed) ISBN 978-952-232-328-6 (PDF) ISSN-L 0424-7256 ISSN 0424-7256 (printed) ISSN 2242-699X (PDF)
Juvenes Print – Suomen Yliopistopaino Oy, Helsinki 2016

i
ACKNOWLEDGEMENTS
I am finally at the end of my PhD studies’ long journey. I had no clear idea of what to expect when I arrived in Finland with my wife and son some years ago. The journey had its ups and downs – learning contemporary research techniques during course work, financial difficulties, and an extended quest to find myself as a researcher. It took me a long time to understand that a PhD study is actually a process of transformation on the journey to becoming an unbiased researcher.
First, I would like to express my sincerest gratitude to my supervisor, Professor Tom Berglund, who was much more than my doctoral degree supervisor. He has constantly challenged my way of thinking, inspired me towards better research, and contributed immensely to my formation as a personality. His help in finding solutions for my various problems made my family’s life in Finland run more smoothly. I will always remember our exciting discussions at lunches and other shared activities. He laid out the fundamentals for my future career!
I am extremely grateful to my thesis supervisor, Professor Martin Holmen, for his patience in reading my drafts and providing me with valuable comments and suggestions for improvement. He has encouraged and supported me throughout the process of my dissertation project.
I would like express my gratitude to my pre-examiners, Professor Johan Eklund and, especially, Professor Harley E. Ryan Jr., who have carefully read through my dissertation, and made excellent comments. Their thoughts and suggestions assisted me in taking my analyses further, and have resulted in an improved manuscript.
I am grateful to the participants of the Economics Department’s seminars for their insightful comments. I would especially like to thank Professor Rune Stenbacka, who reviewed my manuscript and gave valuable suggestions for improvement during our follow-up meeting.
I greatly enjoyed participating with presentations and listening to other researchers’ presentations during our small group seminars. I therefore wish to thank Tom Berglund, Laura Arranz Aperte, Robert Gillanders, Olga Neselevska, Jyri Kinnunen, Praveen Malla, Minna Martikainen, Benjamin Maury, Henrik Keinonen, Jonas Spohr, Jakob Strorå, Pontus Troberg, and Tuomas Takalo.
I have benefited greatly from participating in presentations at the annual Nordic Corporate Governance workshops (Stockholm, Copenhagen, and Helsinki). I value the constructive comments of Dr Sophie Nachemson-Ekwall, Professor Per-Olof Bjuggren, and Dr Conny Overland, who reviewed the papers included in this dissertation.
I am also grateful to the participants of the annual PhD workshop organised by the Hanken Centre for Corporate Governance. I would like to thank specially appointed faculty: Professor Ulf Jakobsson, Dr Daniel Wieberg, and Dr Tor Brunzell, who made comments and suggestions that considerably improved my research papers.
I would like to thank participants of GSF/FDPE Winter Research Workshop in Finance (Helsinki), especially Dr Mikko Leppämäki for comments on my research project.

ii
Professor Runer Stenbacka, Dr Staffan Ringbom, and Professor Topi Miettinen, who were the heads of the Economics Department of Hanken of the period of my PhD studies, have helped me with a number of important issues. I am very grateful to them.
I am grateful to Helen Malmsten, the secretary of Hanken’s Department of Economics for her assistance.
I wish to thank Hanken’s Department of Economics and the Centre for Corporate Governance for providing me with office space.
I would like to thank Rupert Moreton, who did an excellent job proofreading the text of this dissertation.
I am thankful to SIS Ägarservice AB, and personally to Sven-Ivan Sundqvist for providing me with excellent ownership data on Swedish listed companies.
I am grateful for the financial support of the Hanken Foundation, the Finnish Cultural Foundation, the Marcus Wallenberg Foundation, Suomen Arvopaperimarkkinoiden Edistämissäätiö, and the Oskar Öflund Foundation.
I am grateful to my local friends Laura Arranz Aperte, Praveen Malla, Olga Neslevska, and Frans Saxen; Sascha and Natia Gokiely, who were further away in Germany; and other friends still further away in Uzbekistan for their encouragement.
I would also like to express my deepest gratitude to my wife, Rano Niyazmuradova, and sons, Timur and Dariy, for their constant support and understanding. I am especially grateful to Rano, who has always been supportive during this important phase in our family’s life. It has not been an easy path together, especially given that our younger son, Dariy, was born in the course of my studies. I would also like to express my gratitude to my mother-in-law, Gulchekha Nugmanova, for her care and help in realising the commencement of my studies in Finland. My thanks also go to my parents, sisters Mashxura and Mahchekhra, and all my other close relatives for their love, which comforted and energised me in my studies.
iii
EXECUTIVE SUMMARY
The role of institutional investors in corporate governance is the main focus of this thesis. It has been argued that institutional investors, which have become more important in capital markets in recent decades, promote value maximisation in companies by protecting the best interests of shareholders. However, asset managers employed by institutional investors may pursue their own interests rather than their employers’. To prevent this, competition between asset managers may be a solution. The evidence concerning the actual outcome of this kind of competition is still scant. The new Swedish pension system provides a “natural experiment”1 in a competitive structure between pension funds. Of particular interest is whether this competition- based structure has produced the active corporate governance involvement that has been advocated as one of the ways to enhance fund performance. If large institutions owning sizable blocks of shares in companies actually contribute to their improved governance, detailed data from the new Swedish pension system should be ideal in identifying that type of impact.
This study helps us understand institutional owners’ capacity and incentives to be active in corporate governance within a competitive framework. Its results should be of interest to people involved in regulating or managing pension funds, and also to officials working on corporate governance regulations.2
Four papers are included in this doctoral dissertation. Below, I outline the main findings of these papers sequentially:
“Market valuation of firms and public pension fund ownership”.
In this paper I study the relationship between public pension fund ownership and firms’ market valuation. Consistent with earlier findings, I find a positive correlation. However, public pension funds tend to increase their holdings in firms after an increase in the market valuation of these firms, whereas there is no relationship between change in pension fund ownership and future change in the market value of these firms. I conclude that the positive correlation between public pension fund ownership and the market valuation of firms in Sweden is the result of public pension funds investing in equity that commands a high price in the stock market, rather than the result of an ability to improve corporate performance.
“Corporate governance by Swedish public pension funds”.
In this paper, I explore the direct relationship between public pension fund ownership and the quality of corporate governance in firms. I find no evidence of public pension funds facilitating the diversification of company boards by increasing the proportion of women, foreigners, or directors of various ages. Furthermore, public pension funds were unsuccessful in promoting independent directors, securing the non-re-election of an active CEO to the Board of Directors, and in reducing the wedge between cash flow and voting rights in listed firms.
1 See Giannetti & Laeven (2009) 2 As mentioned in policy recommendations by Jakobsson & Korkeamaki (2014).

iv
“Public pension funds as shareholders and firm performance”.
The main question addressed in this study is whether Swedish public pension funds are likely to impact a company in their portfolios, directly or indirectly, when they are dissatisfied with its performance, or to “vote with their feet” instead. Thus, the goal of the study is to test two different hypotheses for active portfolio management by these funds: “exit”- that is, sell shares of a low performance company, or “impact” - that is, contribute actively to the dismissal of underperforming CEOs and Boards of Directors.
I find that ownership by public pension funds significantly decreases if a company belongs to the subsample with the lowest ROA (out of 2,3,4,5 groups) during 1 to 3 previous consecutive quarters. However, I do not find a significant relationship between public pension fund ownership and the dismissal of CEOs or a Board of Directors in companies belonging to the low ROA subsample in the course of several past periods.
Thus, the findings in this study indicate that Swedish public pension funds tend to sell their shares of underperforming companies rather than facilitate the dismissal of the CEO or the Board of Directors.
“Competition as a driving force among institutional investors. The case of Swedish pension funds”.
In the final paper I investigate the consequences of having several public pension funds (AP buffer funds) with similar mandates. The main justification for such a structure, when the system was created was to encourage competition between funds. I employ Active Share measure proposed by Petajisto (2013) and Cremers & Petajisto (2009) to evaluate the extent to which Swedish equity portfolios of AP buffer funds overlapped in the years 2001-2012. According to this measure there is a 60-85% overlap of Swedish equity portfolios of AP buffer funds over the sample period (with stronger portfolio convergence between buffer funds after the start of the financial crisis in 2008).
In further analysis I find that there are co-movements in domestic share trades of AP buffer funds. I find no evidence that co-movements are due to “window dressing”.
v
References
Cremers M., Petajisto A., 2009, “How Active Is Your Fund Manager? A New Measure That Predicts Performance”, Review of Financial Studies, 22(9) pp.3329-3365
Giannetti M., Laeven L., 2009, “Pension reform, ownership structure, and corporate governance: Evidence from a natural experiment”, The Review of Financial Studies v 22 n 10, pp. 4091-4127
Jakobsson U., Korekeamaki, 2014, “Ownership and governance of large Finnish firms”, Prime Minister's Office Reports, 6/2014
Petajisto A., 2013, “Active Share and Mutual Fund Performance”, Financial Analysts Journal, 69(4) pp. 73-93
vi
CONTENTS
Chapter I: Introduction
1 BACKGROUND ................................................................................................... 1
2 THE ROLE OF INSTITUTIONAL INVESTORS IN CORPORATE GOVERNANCE ................................................................................................... 3
2.1 Advantages and disadvantages of institutional ownership .................... 3
2.2 Institutional investors within a legal-institutional framework .............. 4
2.3 Institutional investors: monitor or "vote with the feet"? ........................ 5
2.4 Along the path of institutional shareholder activism ............................. 6
2.5 Institutional "voting with the feet" ........................................................ 8
2.6 Major trends in institutional investor activism ...................................... 9
2.7 Literature summary .............................................................................. 10
3 THE SWEDISH CORPORATE GOVERNANCE ............................................... 11
4 THE SWEDISH PENSION SYSTEM................................................................. 13
4.1 Features of the reformed Swedish pension system .............................. 13
4.1.1 Income pension ...................................................................... 14
4.1.2 Premium Pension ................................................................... 15
4.2 Expected changes in the system............................................................ 16
5 THE MAIN THESIS CONCLUSIONS ............................................................... 17
REFERENCES ................................................................................................................. 19
Chapter II: Essays
1 Market valuation of firms and public pension fund ownership ........................ 27
2 Corporate governance by Swedish public pension funds ................................. 56
3 Public pension funds as shareholders and firm performance .......................... 91
4 Competition as a driving force among institutional investors. The case of Swedish pension funds .................................................................................... 121

CHAPTER I: INTRODUCTION
“From a broader perspective corporate governance is socially valuable because it will contribute to efficient use of scarce resources in society, that is, achieves a distribution of some scarce resources that is superior to the solution that would arise without properly functioning corporate governance. The scarce resources that corporate governance targets is managerial talent. A good governance system thus makes the best use of available managerial talent.” (Berglund, 2014)
1
1 BACKGROUND
Economists have long known that value maximisation within the existing legal framework is beneficial for societies at large. This is consistent with shareholder value maximisation. Nevertheless, in publicly held companies with dispersed ownership executives may well act in their own interests at the expense of shareholders, as shareholders are unable to observe the decisions executives may make, or refrain from making. This is referred to as an agency problem3, and it is the purpose of corporate governance to address it. The goal is to safeguard value maximisation by monitoring management and seeking to align the interests of a company’s managers with those of its shareholders.
Since the Second World War institutional investors have become gradually more important in the global capital markets. A crucial question is whether these institutional investors should and can be effective in improving the corporate governance of firms in which they acquire significant blocks of shares.
Some researchers have argued that institutional investors can alleviate the agency problem between shareholders and company managers (Black, 1992; Black & Coffee, 1994). Others point out that institutional investors are themselves subject to agency problems, which reduces their usefulness in exercising this role (Allen, 2001; Menkhoff, 2002; Kahl & Gorton, 1999; Lakonishok et al., 1992).
Regulation proposed by well-meaning political decision makers may not be helpful in addressing these problems. Excessive regulation and legal barriers may instead preclude the active role of institutional investors in firms’ governance (Gillan & Starks, 2003; Rose, 2007; Aggarwal et al., 2011; Black, 1992; Jara-Bertin et al., 2012).
A potential solution may be found in competition between asset managers. Mutual monitoring by competing managers might stimulate better fund management by institutional investors. Competition between fund managers might also lead to more active corporate governance involvement, since significant ownership in a company that experiences a visible corporate governance scandal will reduce the fund’s portfolio return (Brown et al., 1996; Agarwal et al., 2004; Chevalier & Elison, 1999).
Empirical research in this area is hampered by the fact that the issues are quite complex. Each country has a unique setting of formal and informal structures, which makes comparisons difficult, since the differences observed may be the result of a number of factors contributing to country heterogeneity.
One way to tackle such problems is to look for “natural experiments”, that can show if one feasible solution is better than another. The desirability of “natural experiments” in the context of institutional oversight has been eloquently stated by Black & Coffee (1994):
“We cannot run the legal experiment of changing our laws to facilitate institutional oversight of corporate managers and observe how the institutions act. Still less can we go back sixty years or more, change our laws then, and see how the institutions would act if they had grown up in a different legal and political environment. In similar settings, however, social scientists have long used ‘natural experiments’ to gain insight into how a particular legal rule affects behavior across otherwise similar societies.” (Black & Coffee, 1994, pp. 2000)
3 Adam Smith was already aware of this problem as can be seen in his “Wealth of Nations”, published in 1776.

2
In its pension reform finalized at the turn of millennium, Sweden has provided us with a unique “natural experiment” (Giannetti & Laeven, 2009). As a result of the reform, several public pension funds (AP funds) were created with the same starting point and the same mandates. The main objective of creating these multiple public pension funds was to stimulate competition between them (Björkmo & Lundbergh, 2010).
The objective of this study is to investigate whether the competitive institutional framework created in Sweden by pension reform has indeed been effective in stimulating competition between pension funds, and whether it has had an impact on their corporate governance involvement. In particular, I study whether Swedish pension fund ownership is related to (1) firms’ market valuation; (2) firms’ corporate governance quality; and (3) impact vs. exit for underperforming firms. I also study whether there are similarities in the composition of domestic equity portfolios of the Swedish public pension funds, and whether these funds tend to have similar sell and buy strategies in these particular portfolios.
3
2 THE ROLE OF INSTITUTIONAL INVESTORS IN CORPORATE GOVERNANCE
2.1 Advantages and disadvantages of institutional ownership
Institutional investors are organisations that invest money on behalf of their beneficiaries. This definition suggests there are at least the following types of institutional investors: mutual funds, pension funds, endowment funds, insurance companies, banks, private equity funds, hedge funds, and venture capital funds. The main objective of these investors is to create value for their beneficiaries.
The role of institutional investors in corporate governance has been debated extensively, especially since the late 1980s, when pension funds, emerged as big players in capital markets. It has been argued that institutional shareholders should exploit their advantages over individual investors in disciplining management to pursue shareholders’ interests (Clark & Hebb, 2004; Black, 1992; Black & Coffee, 1994).
While recognising the existence of heterogeneous types of institutional investors, several common advantages of institutional ownership have been identified (Menkhoff, 2002; Black, 1992): (1) institutional investors are managed by professionals, who can utilise information better than lay investors; (2) the cost of management is lower for institutional investors, because they can exploit economies of scale; and (3) they have an interest in ensuring better protection of minority shareholder rights, because their actions are constantly under public scrutiny.
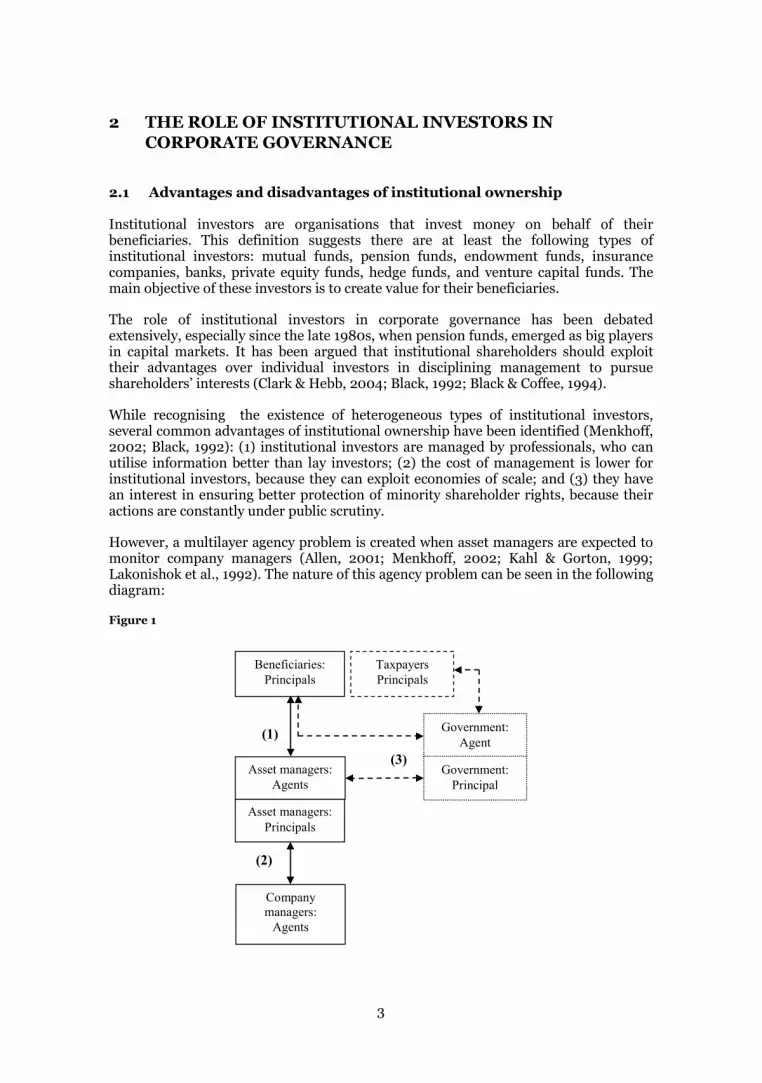
However, a multilayer agency problem is created when asset managers are expected to monitor company managers (Allen, 2001; Menkhoff, 2002; Kahl & Gorton, 1999; Lakonishok et al., 1992). The nature of this agency problem can be seen in the following diagram:
Figure 1
(1)
(2)
(3)
Beneficiaries: Principals
Asset managers: Agents
Government: Agent
Government: Principal
Asset managers: Principals
Company managers:
Agents
Taxpayers Principals
4
An agency problem will exist between (1) beneficiaries and asset managers, and in the next step (2) between asset managers and managers of the firms in which the fund is invested. Conflicts of interest may arise in both links of the chain. Beneficiaries want the long-term value of their funds to be maximised (taking risk appropriately into account). Asset managers are concerned with their reputation (Chevalier & Elison, 1999), which may make them overly risk-averse. In addition, if asset managers are evaluated against predetermined benchmarks on a short-term basis, they may opt for short-term investments. Company managers, in the last link of the chain, may be tempted to expropriate company resources if they are not properly monitored.
The problem becomes even more complicated when the government is the intermediary between beneficiaries and asset managers, as shown on the right hand side (3) of Figue-1 (this is especially the case with public pension funds). Here, the government is the agent of the beneficiaries to the extent that they are taxpayers, but also of other taxpayers. At the same time the government is the asset managers’ principal. Government representatives employed to monitor asset managers are concerned with their career prospects (Lakonishok et al., 1992), and political considerations will therefore play a substantial role. In some cases, there may be a conflict of interest between fund beneficiaries and taxpayers in general.4
Different types of institutional investors are subject to intrinsic agency problems to various degrees. Thus, the layers of agency problems are more complex for public pension funds than for private activist hedge funds or private equity funds. It is therefore erroneous to expect different types of institutional investors in governance of firms to exercise a homogeneous role (Berglund & Alimov, 2015).
The severity of asymmetric information between company managers and investors is another dimension in determining the suitability of a particular type of institutional investor for the “monitoring role”. There have been attempts to relate institutional ownership to asymmetric information (El-Gazzar, 1998; Boemer & Kelley, 2009; Huyghebaert & Hulle, 2004; Gibson et al., 2004). It is usually claimed that institutional investors reduce asymmetric information, as there is a positive relationship between institutional ownership and the severity of asymmetric information. However, the causality may run in reverse: institutional investors may prefer to invest in firms with low asymmetric information to reduce the likelihood their holdings producing unpleasant surprises.
Given the complexity of the different factors involved, the final outcome of institutions’ role in corporate governance is difficult to foresee, and remains largely an empirical question.
2.2 Institutional investors within legal-institutional framework
Institutional investors are subject to a given legal and institutional framework. Their degree of involvement in corporate governance also depends on the nature of their investment strategies and their investment horizons, as well as on their interaction with the market for corporate control, with large shareholders, with employees, and with other company stakeholders (Gillan & Starks, 2003; Jara-Bertin et al., 2012; Aggarwal et al., 2011). 4 Localization decision of an investment could produce this type of a conflict. Beneficiaries as shareholders could benefit from a liberal subsidy provided by the state while taxpayers in general, who will pay the bill, would lose.

5
The legal and institutional framework limits constraints on the extent to which institutional investors are involved in corporate governance (Gillan & Starks, 2003; Jara-Bertin et al., 2012; Aggarwal et al., 2011; Celik & Isaksson, 2013). According to Black & Coffee (1994) overregulation has limited corporate governance involvement and favoured a simple exit strategy practiced by institutional investors in US corporations.
Jara-Bertin et al. (2012) emphasise the differences in the roles undertaken by institutional investors in common and civil law countries. They find a positive relationship between firm value and ownership concentration by institutional investors in civil law countries, and a negative one in common law countries. The authors explanation is that ownership is dispersed in common law countries, and even at low levels of ownership institutional shareholders are able to have an impact on corporate governance. Excessive ownership concentration in this environment, results in undesirable entrenchment. The authors also claim that in civil law countries, where ownership is concentrated, institutional investors can challenge dominant shareholders only when they have sufficient influence.
Institutional investors are also seen as important because they tend to promote best practice in corporate governance in countries with low corporate governance standards (Aggarwal et al., 2011; Ferreira & Matos, 2008; Ferreira et al., 2010; Tihanyi et al., 2003).
According to Aggarwal et al. (2011) institutional ownership drives change in firms’ governance, with reverse causality not holding true. According to the authors foreign investors especially improve firms’ governance in countries with weak shareholder protection, while it is domestic institutional investors that advocate better governance in the US.
The findings of Aggarwal et al. (2011) are supported by Ferreira et al. (2010), who find more M&As in firms with a high proportion of foreign institutional investors, especially in countries with weak corporate governance standards.
Chung & Zhang (2011) and Bushee et al. (2014), on the other hand, find empirical evidence for institutional investors preferring stocks of companies with good corporate governance. Chung & Zhang (2011) conclude that institutional investors are inclined to invest in firms with good corporate governance because of their fiduciary responsibilities, and because the shares of such companies are also more liquid. Furthermore, according to Ferreira & Matos (2008), institutional investors invest in countries with high disclosure standards.
2.3 Institutional investors: monitor or “vote with the feet”?
The main objective of institutional investors is to create value for their beneficiaries. This suggests that they should take the least costly way to achieve a given increase in the gross value of their asset portfolio. When they are dissatisfied with the performance of a company in their portfolios, institutional investors have a number of options: (1) “vote with their feet” - sell company shares; (2) “voice” - hold their shares and try to impact companies’ governance; (3) hold their shares, and do nothing (Gillan & Starks, 2003). In severe cases managers can also be brought to court on the initiative of institutional investors (Cheng et al., 2010). The preferred strategy taken by different institutional investors remains an empirical question.
6
It is claimed that monitoring by institutional investors depends on whether their investments in the companies are short-term or long-term (Bushee, 1998; Bushee, 2001; Elyasiania et al., 2010; Chen et al., 2007).
According to Bushee (1998, 2001) short-term institutional investors (with high portfolio turnover) are unlikely to monitor companies. Bushee (1998) investigates the role of institutional shareholders in companies, in which the tension between achieving earnings targets and R&D expenditure is particularly high. He finds that in companies where the proportion of short-term institutional investors is comparatively high, managers are likely to increase earnings at the expense of R&D expenditure. Moreover, Bushee (2001) finds that institutional investors such as banks, with strict fiduciary responsibilities, and those with high turnover and diverse portfolios prefer to invest in companies with high near-term earnings, even at the expense of long-term shareholder value.
Elyasiania et al. (2010) argue that institutional investors with a long-term horizon can reduce agency costs and decrease information risk by pressing the managers to disclose private information. The authors argue that managers monitored by long-term investors are likely to avoid myopic behaviour. Managers who attract long-term investors build their reputations especially in debt markets, and thus reduce the cost of the debt incurred by their firm. In line with these arguments, the authors find a negative relationship between institutional ownership and the cost of debt.
Chen et al. (2007) claim that independent institutional investors with a long-term concentrated ownership are likely to be engaged in monitoring. Their findings indicate that ownership by this type of institutional investor is positively associated with post-merger firm performance measured by stock returns, accounting profitability measures, and analyst earnings forecasts. Moreover, they find that such investors do not trade for short-term profit, and exit firms that are likely to make very bad bids. The authors suggest that the exit action taken by these investors puts further pressure on managers and strengthens impact monitoring.
Furthermore, a number of studies suggest that, “pressure-resistant” institutional investors that have no business relationship with companies (such as public pension funds or mutual funds) in contrast to “pressure sensitive” ones (such as banks, insurance companies, trusts, and private pension funds), are less subject to management influence, and hence more likely to be monitors (Ferreira and Matos, 2008; Cornett et al., 2007; Bhattacharya & Graham, 2007; Gianneti & Laeven, 2009; Aggarwal et al., 2011; Almazan et al., 2005; Brickley et al., 1988; Woidtke, 2002; Chen et al., 2007).
2.4 Along the path of institutional shareholder activism
Early evidence on institutional shareholder activism comes from the activities of major US public pension funds, such as CalPERS - California Public Employees’ Retirement System - during the 1980s and 1990s (Smith, 1996; Duggal & Millar, 1999; Wahal, 1996; Nesbitt, 1994; Wu, 2004; Woidtke, 2002; Prevost & Rao, 2000). These funds targeted underperforming firms and initiated shareholder proxy proposals. Market reaction to the announcements of the activities of US public pension funds is not usually found to be significantly positive (Del Guercio & Hawkins, 1999; Duggal & Millar, 1999; Wahal, 1996). Shareholder proposals in targeted firms were followed by
7
changes in corporate governance structure, but failed to improve corporate performance (Del Guercio & Hawkins 1999; Prevost & Rao, 2000).
Prevost & Rao (2000) claim that public pension fund proposals in targeted firms may serve as a signal to the market, and that such firms’ management is unlikely to cooperate and prevent the submission of a proposal. This is the argument they give for finding short and long-term deterioration of firm performance in stock price returns and accounting measures after the submission of a shareholder proposal by a public pension fund.
Wu (2004) makes a similar argument that, on announcing the poor corporate governance of firms, US public pension funds, and in particular CalPERS, influenced public opinion and damaged the reputation of the management and directors of those companies during the late 1980s and mid 1990s. As a result, the targeted companies reduced the proportion of insider directors, CEO dismissal became more likely, and CEO dismissal-performance sensitivity increased.
Crutchley et al. (1998) and Nelson (2006) note that shareholder activism by US public pension funds declined in the late 1990s, reflected in lower returns to buy and hold strategies of targeted firms.
The evidence on institutional shareholder activism from other countries is not conclusive either. Faccio & Lasfer (2000) investigate occupational pension funds in the UK, and claim that monitoring by these funds is ineffective. Their findings suggest that UK occupational pension funds target small firms for the most part, and fail to improve corporate governance of firms under their ownership. Such funds have therefore underperformed when compared to industry or a benchmark.
Becht et al. (2007) arrive at an opposite conclusion in investigating shareholder activism by the Hermes UK focus fund. They find that the fund was successful in beating the benchmark through private engagement with firms’ managers. According to the investigators shareholder activism by the fund resulted in corporate restructuring, changes in boards, improved firm performance, and increased cash payouts to shareholders. 5
Rose (2007) investigates Danish data from the turn of the millennium. He shows that equity ownership by the largest institutional investors is associated with companies’ negative performance, while financial institutions such as banks and insurance companies have a positive impact on company performance.
Giannetti & Laeven (2009) investigate similar data as the present study does6 - namely Swedish data after the pension reform finalised at the turn of the millennium. They find a positive relationship between ownership by public pension funds as well as large independent private pension funds and firm valuation. They also find that an increase in public pension fund ownership is related to an additional control premium.
According to Carleton et al. (1998) the lack of a consistent relationship between institutional investor shareholder activism and changes in the governance practised by firms observed in the literature may be due to the fact that institutional shareholders’ 5 However, it is worth noting that the Hermes UK focus fund is organised as a partnership (as is usually the case in private equity funds). 6 The difference here is in time periods. Giannetti & Laeven (2009) consider the period before the financial crisis (2000-2005). In this project I explore a longer period (2001-2012)
8
advocacy for changes in firms is done for the most part by private negotiation, as in the case of TIAA-CREF – one of the biggest US pension funds, which they investigate. The importance of institutional investors’ behind-the-scenes activity is also confirmed by McCahery et al. (2015), who survey institutional activism around the world.
To test the “monitoring hypothesis” researchers have explored institutional ownership against a number of dimensions such as M&As, executive compensation (Almazan et al., 2005; Hartzell & Starks, 2003), earnings management (Chung et al., 2002), and corporate payouts (Grinstein & Michaely, 2005; Scott, 2014; Qayyum et al., 2015; Han et al., 1999).
Qiu (2006) claims that public pensions funds prevent value-reducing acquisitions more than other types of institutional investors, especially in firms with high agency costs. Qiu further argues that firms with high public pension fund ownership perform better having acquired other firms.
Hartzell & Starks (2003) relate institutional ownership to executive compensation. They find that institutional investors have an impact on executive compensation structures, and that institutional ownership is positively related to pay-for-performance sensitivity and negatively to the level of an executive management’s compensation. Almazan et al. (2005) model, and subsequently find empirical support for the theory that “potentially active” institutional investors such as investment advisers and investment companies, unlike banks or insurance companies, have an impact on pay-for-performance sensitivity.
Chung et al. (2002) claim that institutional investors monitor the accounting choices of company managers and inhibit their opportunistic earnings management. In examining discretionary accounting accruals, the authors find that managers in firms with high institutional ownership are less likely to smooth earnings to suit their own preferences by shifting profits from one year to another.
Institutional investors may also alleviate the agency problem by ensuring that managers share profits with shareholders, especially in firms with high free cash flow and low investment opportunities (Jensen, 1986). There have been a number of empirical studies that investigate the relationship between institutional ownership and corporate payouts7 (Grinstein & Michaely, 2005; Scott, 2014; Qayyum et al., 2015). The evidence for this is also mixed. For example, Grinstein & Michaely (2005) find little evidence that institutional investors increase payouts, while Scott (2014) and Qayyum et al. (2015) come to the opposite conclusion. Scott (2014) finds that institutional investors’ ownership in firms with high free cash flow and poor investment opportunities is positively related to corporate payouts, which confirms the monitoring hypothesis. Similarly, Qayyum et al. (2015) argue that institutional investors are likely to be engaged in monitoring and facilitate higher payout at companies weighted relatively highly in their portfolios.
2.5 Institutional ‘voting with the feet’
According to Kahn & Winton (1998) decisions to trade in company shares and decisions to actively intervene are endogenous. They claim that institutional investors are likely to intervene (involve themselves in shareholder activism) if such an action will give them information advantages over uninformed traders in their subsequent trades on 7 Dividend payouts and stock repurchases.
9
private information. According to the authors the likelihood of intervention depends not only on the size of institutional holdings, but also on firm characteristics.
Admati & Pfleiderer (2009) argue that legal barriers, liquidity concerns, agency costs, and free rider problems discourage institutional investors from exerting their “voice” at companies. They show that the ability to exit (potential threat) based on private information by institutional investors has an impact on decisions made by company managers.
Parrino et al. (2003) find empirical evidence for the disciplining effect of institutional investors voting with their feet. They investigate US companies in the 1980s and early 1990s and find that informed investors subject to the prudent man rule exited underperforming firms one year before forced CEO turnover, which obviously depressed prices. The authors conclude that the exit of institutional owners affected boards’ decision to fire underperforming CEOs.
Helwege et al. (2012) argue that the disciplining effect of voting with the feet by institutional investors has diminished over time. The authors relate “voting with the feet” against “voice” implemented by institutional investors to forced CEO turnover over two subsamples, 1982–1994 and 1995–2006. The authors confirm the findings of Parrino et al. (2003) for only the first sub-period – the negative relationship between change in institutional ownership and future CEO dismissal. In further analysis they find that in spite of the fact that “voice” by activist institutional investors is correlated to forced CEO turnover during the entire period, this does not explain the recent upward trend in CEO dismissals.
2.6 Major trends in institutional investor activism
Institutional investors such as hedge funds, private equity funds, and venture capital funds have been more closely related to corporate restructuring in recent decades (Wright et al., 2009; Kaplan & Stromberg, 2009; Harris et al., 2015; Klein & Zur, 2009; Brav et al., 2008; Bebchuk et al. 2015; Brav et al. ,2015).
Corporate restructuring through leveraged buyouts by private equity institutions has become increasingly important as a governance mechanism8 (Wright et al., 2009; Kaplan & Stromberg, 2009; Harris et al., 2015). As Jensen (1989) argues, leveraged buyout organisations, while using debt rather than equity as a major source of capital, have “proper” incentives for value creation. In a normal buyout transaction a private equity fund acquires the majority control of a company and restructures it to enhance its accounting profitability and efficiency (Wright et al., 2009; Kaplan & Stromberg, 2009). Value creation is achieved by the dissemination of best practice by skilled private equity fund managers.
Governance intervention by venture capital firms is also noteworthy. While investing in young and emerging firms, venture capital funds, unlike private equity funds, do not gain major control of companies. Harris et al. (2015) show that the venture capital market has been more active in North America than in Europe. Furthermore, the
8 There have been two waves in leveraged buyouts in recent decades. The first wave peaked during the 1980s, the second in the mid-2000s (Acharya et al., 2013; Wright et al., 2009; Kaplan & Stromberg, 2009; Harris et al., 2015). Buyout activities were hindered by the junk bond crisis that occurred during the early 1990s and the financial crisis that started in 2007.
10
authors find that the difference between the best and the worst funds in terms of value creation is more pronounced in venture than in buyout funds.
There is also evidence that hedge funds exploit their shareholdings in restructuring companies under their ownership (Klein & Zur, 2009; Brav et al., 2008; Bebchuk et al. 2015; Brav et al., 2015). In general, there is a positive market reaction to news of hedge fund intervention (Klein & Zur, 2009; Brav et al., 2008). According to Brav et al. (2008) hedge fund targeted firms experience higher CEO turnover and better operating performance. Klein & Zur (2009) claim that hedge funds also solve the free cash flow problem (Jensen, 1986), while other types of institutional activists, such as private equity funds and venture capital funds, demand change in companies’ operational strategies. Bebchuk et al. (2015) and Brav et al. (2015) also claim that intervention by hedge funds does not damage long-term shareholder value.
2.7 Literature summary
Institutional investors are part of a multilayer agency problem. The ability of ultimate beneficiaries to make asset managers accountable for funds’ performance is an important characteristic that differentiates types of institutional investors. Different types of institutions will cater to demands from investors that differ in their capacity to monitor asset managers. Institutions that cater to less sophisticated investors are better off by a pre-commitment to invest only in assets with a relatively low degree of investment asymmetry. Standardised systems run by less expensive personnel will allow these institutions to stay competitive. However, more sophisticated investors, who are able to assess the likely impact of strategic choices by firms, will have an advantage in picking asset managers who are strongly incentivised to find undervalued assets. These managers are allowed to invest in assets that are subject to substantial information asymmetry.9 Empirical findings reported for different types of institutions are mostly in line with this view. For example, equity funds and activist hedge funds that cater to more sophisticated investors more than other types of institutional investors, are those that have been largely involved in corporate restructuring.
Ownership engagement by institutional investors that are subject to severe potential agency problems is the most likely explanation of the mixed findings in the literature concerning the corporate governance involvement by institutional investors.10 An important additional issue is whether institutional investors with weak engagement by the ultimate beneficiaries can be induced to act in the interests of these beneficiaries by additional mechanisms. Competition between the AP funds in the Swedish system should provide such a mechanism. The actual role of this competition and its consequences to corporate governance are thus worthy of a proper investigation. The Swedish pension reform finalised at the turn of the millennium is an example of encouraging competition between otherwise heavily regulated institutional investors – the pension funds. In this study I also examine the evidence concerning the consequences of this additional mechanism.
9 For a more detailed discussion of this, see Berglund & Alimov (2015). 10 This is, for example, the case for pension funds, as discussed in previous sections.
11
3 THE SWEDISH CORPORATE GOVERNANCE
Corporate governance in Sweden is regulated by the Companies Act (2005), the Swedish Corporate Governance Code (SCGC)11, and generally accepted practice (Lekvall et al., 2014). The SCGC applies mostly to listed companies and relies on the “comply or explain” principle. Since the turn of the millennium, the number of listed companies in Sweden12 has ranged between 250 and 300.
Swedish corporate governance shares features with other Nordic countries (Finland, Denmark, and Norway). These features constitute the Nordic Corporate Governance Model (NCGM), which is considered an alternative to the Anglo-Saxon model (Lekvall et al., 2014). The model’s distinguishing characteristic is that the largest shareholders have dominant positions in companies stemming from their ownership and corporate governance structures. They take long-term responsibility for the companies, and this is generally accepted by other shareholders and society (Lekvall, 2009).
Swedish companies are noted for their high concentration of ownership. In 2014, about 67% of Swedish listed companies had at least one shareholder, with about 20% of voting rights, whereas in 17 % of companies there was a shareholder who held at least 50% of voting rights (Lekvall et al., 2014). The positions of the largest shareholders are strengthened by companies’ practice of dual class shares. More than half of the Swedish listed companies have multiple class shares.
Both the Companies Act and the SCGC require that Swedish companies have three main governing bodies: the General Shareholders’ Meeting, the Board of Directors, and the CEO. The Shareholders’ Meeting is the highest decision-making body. The Nomination Committee, which consists mainly of the largest shareholders (with at least one member independent of the company’s largest shareholders), proposes candidates for the Board of Directors and their remuneration to the Shareholders’ Meeting.
The Board of Directors consists primarily of non-executives, and only one person from management (usually the CEO) may be a member of the board. A majority of directors should be independent of the company (at least two persons should also be independent of the largest shareholders). Boards may also include employee representatives (up to three persons in large companies). In practice, unions do not always choose to take up their right to representation on Boards of Directors, which may be due to the costs associated with such membership (Berglund & Holmen, 2013).
At the same time the Swedish corporate governance model, like the NCGM in general, is characterised by good protection of minority shareholders, which discourages the largest shareholders from extracting private benefits at the expense of other shareholders (Holmen & Knopf, 2004; Lekvall, 2009; Lekvall et al., 2014).
Corporate governance in general evolves over time, and this is no less the case in Sweden. The role of foreign investors has increased dramatically since the 1990s, when Sweden became a member of the EU. Deregulation and social reforms have resulted in a rapid increase in the institutional share of capital markets in recent decades in
11 The Swedish Corporate Governance Code was introduced in 2005 and amended in 2008, 2010, and 2015. 12 Nasdaq Stockholm, and Nordic Growth Market

12
Sweden. In the 1950s the share of institutional investors in capital markets was close to zero. Today, institutional investors hold about 85% of Swedish market capitalisation (Lekvall et al. 2014). These forces have contributed to a decline in power in the hands of the largest shareholders, but they have not been sufficient to cause a convergence towards the Anglo-Saxon model, which is characterised by dispersed ownership and management control (Henrekson & Jakobsson, 2012).
With this increase in institutional ownership in Swedish companies, it remains an open question as to what role they can play in the governance of firms in which they have substantial stakes. In this study I focus on Swedish pension funds, and explore several dimensions of their corporate governance involvement.
13
4 THE SWEDISH PENSION SYSTEM
The Swedish pension system reform finalised at the turn of millennium created the grounds for the study of the role pension funds play in firms’ governance. As Giannetti & Laeven (2009) note, the Swedish pension system provides us with a unique “natural experiment”. First, it creates a competitive structure among institutional investors (pension funds). Second, these institutional investors have the same history and the same mandates. Third, in this setting, we can utilise pension reform’s exogenous shock to institutional ownership to find causal effects (Giannetti & Laeven, 2009).
4.1 Features of the reformed Swedish pension system
The new Swedish pension system, which came into full effect between 1999 and 2000, may be considered a unique experiment that aims to find a compromise between various retirement and demographic factors and the financial constraints within a changing environment.
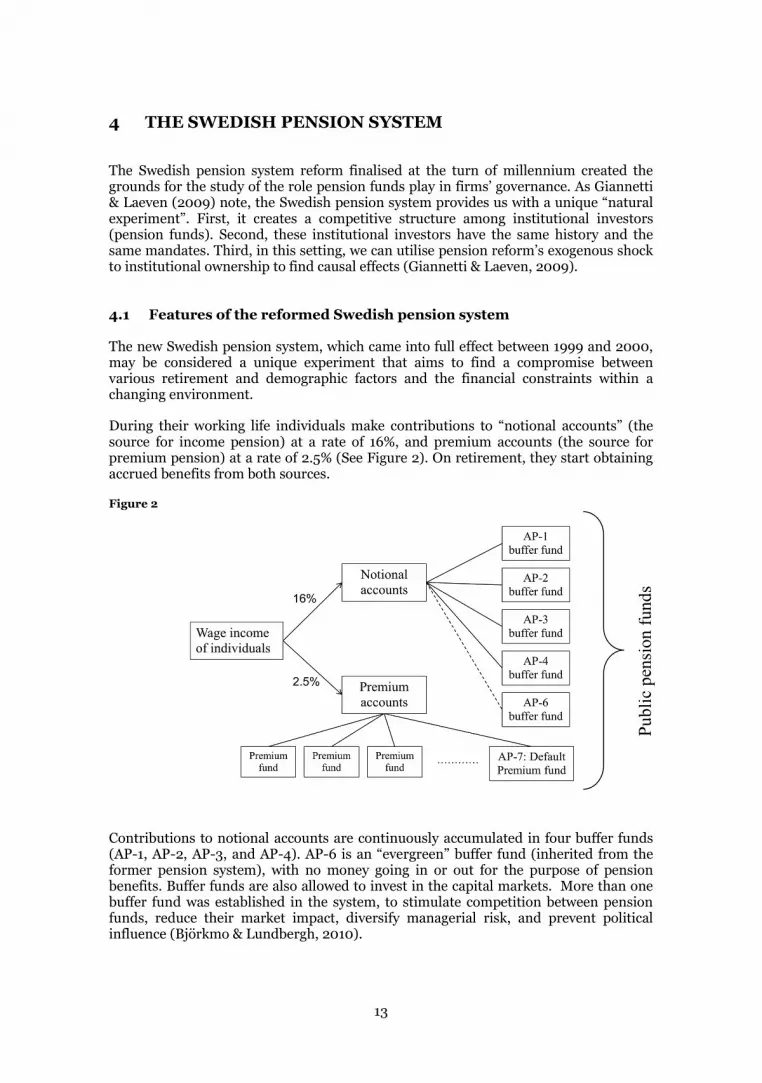
During their working life individuals make contributions to “notional accounts” (the source for income pension) at a rate of 16%, and premium accounts (the source for premium pension) at a rate of 2.5% (See Figure 2). On retirement, they start obtaining accrued benefits from both sources.
Figure 2
Contributions to notional accounts are continuously accumulated in four buffer funds (AP-1, AP-2, AP-3, and AP-4). AP-6 is an “evergreen” buffer fund (inherited from the former pension system), with no money going in or out for the purpose of pension benefits. Buffer funds are also allowed to invest in the capital markets. More than one buffer fund was established in the system, to stimulate competition between pension funds, reduce their market impact, diversify managerial risk, and prevent political influence (Björkmo & Lundbergh, 2010).
Publ
ic p
ensi
on fu
nds

14
Individuals are allowed to manage their contributions into the premium pension part and allocate their money to up to 5 funds (premium pension funds) accredited by the Premium Pension Authority. Premium pension funds, in turn, invest money in the capital markets. There are now more than 800 pension funds within the Swedish premium pension system. When not managed actively, premium pension money is directed to a government-managed default AP-7 fund.
4.1.1 Income pension
The Swedish income pension system is often called a Notional Defined Contribution system, and has the following features:
Pension rights are collected in “notional accounts” throughout individuals’ working life with a defined contribution rate of 16%.
Pension rights in “notional accounts” are adjusted annually according to the average income index.
On retirement, pensions are calculated in accordance with life expectancy.
Flexible retirement is allowed, but those who retire earlier automatically receive fewer benefits.
There is a residence-based guarantee pension for low income retirees.
Funds in “notional accounts” are directed towards AP 1-4 funds in equal amounts. Pension benefits are paid out from AP 1-4 funds.13 If total liabilities exceed total pension contributions, then an automated balancing mechanism is triggered, and “notional accounts” are adjusted upwards less than country’s average wage growth.
Thus, the main objective of buffer funds (AP-1, AP-2, AP-3, and AP-4) is to stabilise the system, when differences arise between fixed pension contributions and benefits (which vary depending on demographic factors such as life expectancy and individuals’ age of retirement). The buffer funds allocate resources in the capital markets.
Governance and management of AP buffer funds is based on the Swedish National Pension Insurance Funds Act (SFS 2000:192). Boards of Directors of AP buffer funds are appointed by the government. They consist of nine members (including two representatives nominated by organisations representing employee interests, and another two representing employer interests).
As stated in the act, AP funds should manage their funds to achieve the highest possible return at the lowest possible risk in the best interest of the retirement pension insurance.
The following investment rules apply to AP 1-4 funds:
Investments should be mostly in stock exchange-listed assets (not more than 5% in unlisted assets).
13 The system is therefore still formally pay-as-you-go

15
Each fund may hold not more than 10% of the voting rights of a listed company.
Not more than 2% of the market value of shares listed on the Swedish stock exchange should be held.
At least 10 % of a fund’s assets are to be managed by external management.
A maximum of 40% of each fund’s assets may be exposed to currency risk.
At least 30% of assets should be invested in debt instruments with low liquidity risk.
4.1.2 Premium Pension
The premium pension system is governed by the Premium Pension Authority (PPM) which manages individual premium accounts, enters into agreement with funds wishing to participate, provides information on fund share values, and acts as a “clearinghouse”. Having contributed 2.5% of their income to premium accounts, individuals may self-regulate their portfolios by allocating their money to a number of funds available in the system. The following rules apply to such activity:
Individuals may choose up to 5 funds out of about 800.
Individuals may change their choice as many times as they wish.
If they do not choose a fund, their premium contributions are invested into the default Premium Savings Fund (Premiersparfonden) – AP-7.
Once individuals have chosen a fund, they may not switch to the Premium Savings Fund.
The total return of the Premium Savings Fund should be at least equal to, and the risk lower than the average of all actively chosen funds.
The Premium Savings Fund is managed by internal as well as external managers.
After the age of 61, individuals’ accumulated premium funds are converted to annuities. Annuities may be withdrawn in full or in ¼, ½, ¾ parts at a time.
AP-7 is required to manage assets for the benefit of savers, and to hold shares with no more than 5% of voting rights in a single company (Swedish National Pension Insurance Funds Act, 2000). Unlike other AP funds, AP-7 is inhibited in the exercise of its voting rights.14 Nevertheless, it is stated that AP-7 is involved in firms’ governance:
“By working closely with other institutional investors, without being part of any formal coalition or group, we can take an active part in board nomination processes. We can engage in dialogue with senior company officers and can attend shareholder meetings without voting. In the case of
14 But it can do so if investment cannot be satisfied in another manner (Swedish National Pension Insurance Funds Act, 2000);

16
foreign investees, we are allowed to vote at company meetings and to participate in public debate.” (AP 7, 2015)
In this study AP buffer funds (AP-1, AP-2, AP-3, and AP-4), the AP-6 fund, and the government-regulated AP-7 fund from the premium pension system are labelled as “public pension funds”, while funds accredited within the premium pension system are labelled as "premium pension funds".
4.2 Expected changes in the system
Since its establishment, there has been extensive criticism of the system. The system has been criticised for being overregulated. The rationale for having more than one buffer fund in the system has also been heavily questioned. Thus there have been calls to merge the AP funds (see for example, Fowler, 2011; Carter, 2010).
Criticism was strongest following a review of AP funds by a team (Buffer Capital Inquiry - Buffertkapitalsutredningen) led by Mats Langensjö, appointed by the Swedish Finance Ministry, and the Swedish Pension Group in 2011.
The investigators (Buffertkapitalsutredningen, 2012) criticise the investment rules as too restrictive, and propose to replace them with a Prudent Person Rule and stricter monitoring. At the same time they argue that separate funds do not take a unified responsibility over buffer capital in the pension system. They therefore suggest the establishment of an independent board to supervise AP funds that would set performance objectives, and undertake monitoring of all AP funds.
Recently, there has been a discussion in Sweden as to whether the Buffer Capital Inquiry group proposals should be adopted (See for example, White, 2015; Williams, 2015a, Williams, 2015b). Indeed, the New AP fund regulation (Finansdepartementet, 2015) has been proposed15. The following changes in the system have been suggested: (1) merge the AP-2 fund with AP-6 (which is a private equity fund inherited from the former system); (2) eliminate one of the remaining AP buffer funds from the system; (3) replace investment rules with Prudent Person Rule; (4) create a Supervisory Board (the National Pension Fund Board); (5) the evaluate performance of AP funds against a single reference portfolio.
The debate is ongoing, and political consensus has yet to be reached.
15 In December 2015, deputy finance minister Per Bolund announced that reforms of AP fund system as stated in the New AP fund regulation (Finansdepartementet, 2015) would be cancelled.
17
5 THE MAIN THESIS CONCLUSIONS
The Swedish pension reform finalised at the turn of the millennium created a competitive framework for pension funds. Competition was thought to boost the performance of pension funds, and their active involvement in corporate governance. Indeed, Swedish pension funds claim that they are active in the corporate governance of firms under their ownership.
The results of my thesis project indicate that there is a contemporaneous positive relationship between firms’ market valuation and public pension fund ownership. Giannetti & Laeven (2009) claim that such a positive relationship arises from Swedish public pension funds improving the quality of firms’ corporate governance. My analysis shows that the relationship arises from public pension funds investing in firms that are highly valued by the market, rather than from public pension funds driving the market value of firms.
In the next paper in my thesis I find that public pension funds are unlikely to intensify the diversification of company boards (through increasing proportion of females, foreigners, or directors of various ages); nor are they likely to promote independent directors, or prevent the re-election of active CEOs to the Boards of Directors of companies they own.
Underperforming companies in portfolios held by public pension funds are the subject of my analysis in the next chapter of the thesis. Indeed, these were the companies that needed the corporate governance intervention the most. I find that public pension funds sell shares of companies that have underperformed several previous consecutive quarters. However, I do not find evidence for public pension funds facilitating the dismissal of CEOs and Boards of Directors when they do not sell shares of underperforming companies.
My results indicate that Swedish public pension funds have not brought changes to the corporate governance of firms under their ownership. A principal reason for these findings may lie in the strict investment rules that limit pension funds’ control of particular companies. The overall picture that emerges is that regulation compels pension funds to diversify their portfolios, to guarantee a low risk for the pension buffer capital, while there is a public pressure on these funds to be active in the corporate governance of the firms in which they invest. However, investment rules have limited the rewards from successful engagement in individual firms’ governance, while costs are largely fixed in the form of resources required to form an expert judgment. It has been much cheaper for the funds to sell shares of underperforming companies, making it possible to meet performance objectives on an annual basis, and to keep up with other pension funds in the system (especially when it comes to public evaluations).
As previous results suggest that competition between pension funds has not contributed to their corporate governance involvement, in the next paper I investigate whether there is indeed proper competition between them. I find that there has been a relatively high degree of similarity in domestic equity portfolios of the Swedish public pension funds. Further analysis shows that these funds have timed their purchases and sales of company shares in roughly the same way. These findings do not necessarily support a claim that competition has failed, it may rather be an outcome of constraints caused by small and illiquid market for individual shares and too restrictive investment rules in the Swedish pension system.

18
The pension system created by the Swedish pension reform provides excellent evidence that it is difficult to match detailed regulation and active corporate governance involvement by institutional investors. After all, the main objective of institutional investors is to ensure the best long term return on investments for their beneficiaries. Forcing them to be active in corporate governance may simply force them to take on costs that do not result in benefits that fully compensate for these costs.
Finally, one may speculate that less stringent investment rules and more performance based incentive schemes for portfolio managers might have produced more efficient competition and better performance in the Swedish pension system. A closer examination of the relationship between incentives, management turnover and performance of the Swedish pension funds is a relevant question for future research.
19
REFERENCES
Acharya V., Gottschalg O, Hahn M., Kehoe C., 2013, “Corporate governance and value creation: Evidence from private equity”, Review of Financial Studies 26, pp.368–402
Admati A., Pfleiderer, P., 2009, “The 'Wall Street Walk' and shareholder activism: exit as a form of voice”, Review of Financial Studies 22, pp. 2645–2685
Aggarwal R., Erel I., Ferreira M., Matos P., 2011, “Does governance travel around the world? Evidence from institutional investors”, Journal of Financial Economics 100 (2011), pp. 154–181
Allen F., 2001, “Do financial institutions matter?”, The Journal of Finance, Vol. LVI, No. 4, pp. 1165–1175
Almazan A., Hartzell J., Starks L., 2005, “Active Institutional Shareholders and Costs of Monitoring: Evidence from Executive Compensation”, Financial Management, 34, pp. 5–34
Barber, B. M., 2007. “Monitoring the monitor: Evaluating CalPERS’ shareholder activism”, Journal of Investing 16, pp. 66–80.
Bebchuk L., Brav A., Jiang W., 2015, “The Long-Term Effects of Hedge Fund Activism”, Columbia Law Review, Vol. 115, 2015, pp. 1085-1156
Becht M., Franks J., Mayers C., Rossi S., 2007, “Returns to shareholder activism: Evidence from a clinical study of the Hermes UK focus fund”, Review of Financial Studies, 22(8), pp. 3039–3129.
Berglund T., 2014, “Corporate Governance and Optimal Transparency”, in J Forssbaeck & L Oxelheim (eds), The Oxford Handbook of Economic and Institutional Transparency. Oxford University Press, Oxford, pp. 359-371.
Berglund T., Alimov N., 2015, “Institutional Shareholders and Corporate Governance: A Survey”, Hanken Working paper
Berglund T., Holmen M., 2013, “Why Employees Choose to be Represented on Corporate Boards”, manuscript Centre for Finance, University of Gothenburg, and Hanken School of Economics. Available at: http://www.gu.se/digitalAssets/1495/1495049_holmen_berglund_cgir_version.pdf, Accessed on August 30, 2016
Bhattacharya P., Graham M., 2007, “Institutional Ownership and Firm Performance: Evidence from Finland”, Accounting, Finance, Financial Planning and Insurance Series 2007_01, Faculty of Business and Law, School of Accounting, Economics and Finance
20
Björkmo M., Lundbergh S., 2010, “Restructuring Sweden’s AP Funds for Scale and Global Impact”, Rotman International Journal of Pension Management, Volume 3 • Issue 1 Spring 2010
Black B., 1992, “Agents Watching Agents: The Promise of Institutional Investor Voice”, UCLA Law Review, Vol. 39, pp. 811-89
Black B., Coffee J., 1994, “Hail Britannia? Institutional investor behavior under limited regulation”, Michigan Law Review 92, pp. 1997-2087.
Boehmer E., Kelley, E.2009, “Institutional Investors and the Informational Efficiency of Prices”, Review of Financial Studies 22, pp. 3563-3594
Brav A., Jiang W., Kim H., 2015, “The Real Effects of Hedge Fund Activism: Productivity, Asset Allocation, and Labor Outcomes”, Working paper, Available at SSRN: http://ssrn.com/abstract=2022904 orhttp://dx.doi.org/10.2139/ssrn.2022904
Brav A., Wei J., Frank P., Randall T., 2008, “Hedge fund activism, corporate governance, and firm performance”, Journal of Finance 63, pp. 1729–1775
Brickley J., Lease R., Smith C., 1988, “Ownership Structure and Voting on Antitakeover Amendments”, Journal of Financial Economics 20, pp. 267-292
Brown K., Harlow W., Starks L., 1996, “Of Tournaments and Temptations: An Analysis of Managerial Incentives in the Mutual Fund Industry”, The Journal of Finance, Vol. 51, No. 1 (Mar., 1996), pp. 85-110
Bushee, B.J., 1998, “The influence of institutional investors on myopic R&D investment behavior”, The Accounting Review, Vol. 73, No. 3 pp. 305-333
Bushee B., 2001, “Do Institutional Investors Prefer Near-Term Earnings over Long-Run Value?”, Contemporary Accounting Research, 18, pp. 207–246
Bushee B., Carter M., Gerakos J., 2014, “Institutional Investor Preferences for Corporate Governance Mechanisms”, Journal of Management Accounting Research, Vol. 26, No. 2, pp. 123 - 149
Carleton W., Nelson J., Weisbach M., 1998, “The influence of institutions on corporate governance through private negotiations: Evidence from TIAA-CREF”, The Journal of Finance, Vol. 53, No. 4, pp. 1335–1362
Çelik S., Isaksson M., 2013, “Institutional Investors as Owners: Who Are They and What Do They Do?”, OECD Corporate Governance Working Papers, No. 11,
Chemmanur T., He S., Hu G., 2009, “The Role of Institutional Investors in Seasoned Equity Offerings”, Journal of Financial Economics (JFE), Vol. 94, No. 3, pp. 384-411
21
Chen X., Harford J., Li K., 2007, “Monitoring: Which institutions matter?”, Journal of Financial Economics 86, pp. 279–305
Cheng C., Huang H., Li Y., Lobo G., 2010, “Institutional Monitoring Through Shareholder Litigation”, Journal of Financial Economics, Vol. 95, pp. 356-383, 2010
Chevalier J., Ellison G., 1999, “Career Concerns of Mutual Fund Managers”, Quarterly Journal of Economics, Vol. 114, no. 2 (May 1999), pp. 389-432
Chung K., Zhang H., 2011, “Corporate governance and institutional ownership”, Journal of Financial and Quantitative Analysis", 46 (1), pp. 247–273.
Chung R., Firth M., Kim J., 2002, “Institutional monitoring and opportunistic earnings management”, Journal of Corporate Finance 8, pp. 29–48
Clark G, Hebb T. 2004, “Pension Fund Corporate Engagement: The Fifth Stage of Capitalism”, Industrial Relations, Vol. 59 (1) pp. 142–171
Cornett M., Marcus A., Saunders A., Tehranian H., 2007, “The impact of institutional ownership on corporate governance performance”, Journal of Banking & Finance 31, pp. 1771-1794
Cremers M., Petajisto A., 2009, “How Active Is Your Fund Manager? A New Measure That Predicts Performance”, Review of Financial Studies, 22(9) pp.3329-3365
Crutchley C., Hudson C., Jensen M., 1998, “The Shareholder Wealth Effects of CalPERS' Activism”, Financial Services Review, Vol. 7 No 1. pp. 1-10
Del Guercio D., Hawkins J., 1999, “The motivation and impact of pension fund activism”, Journal of Financial Economics, Volume 52, Issue 3, June 1999, pp. 293–340
Del Guercio D., Cole L., Woidtke T., 2008, “Do Boards Pay Attention When Institutional Investor Activists 'Just Vote No'?”, Journal of Financial Economics (JFE), Vol. 90, pp. 84-103.
Demiralp I., D'Mello R., Schlingemann F., Subramaniam V., 2011, “Are there Monitoring Benefits to Institutional Ownership? Evidence from Seasoned Equity Offerings”, Journal of Corporate Finance 17, pp.1340-1359.
Duggal R., Millar J., 1999, “Institutional ownership and firm performance: The case of bidder returns”, Journal of Corporate Finance 5, pp. 103-117
El- Gazzar S., 1998, “Predisclosure information and institutional ownership: A cross-sectional examination of market regulations during earnings announcement periods”, The Accounting Review, Vol. 73, No. 1 pp. 119-129
22
Elyasiania E., Jiab J., Maoa C., 2010, “Institutional ownership stability and the cost of debt”, Journal of Financial Markets 13, pp. 475–500
Faccio M., Lasfer A., 2000, “Do occupational pension funds monitor companies in which they hold large stakes?”, Journal of Corporate Finance 6, pp. 71-110
Ferreira M., Matos P., 2008, “The colors of investors’ money: The role of institutional investors around the world”, Journal of Financial Economics, Volume 88, Issue 3, pp. 499–533
Ferreira, M., Massa, M., Matos, P., 2010, "Shareholders at the gate? institutional investors and cross-border mergers and acquisitions", Review of Financial Studies 23, pp. 601–644
Fong K., Gallagher D., Gardner P., Swan P., 2011, “Follow the leader: fund managers trading in signal-strength sequence”, Accounting & Finance, 51, pp. 684–710
Giannetti M., Laeven L., 2009, “Pension reform, ownership structure, and corporate governance: Evidence from a natural experiment”, The Review of Financial Studies v 22 n 10, pp. 4091-4127
Gibson S., Safieddine A., Sonti R., 2004, “Smart investment by smart money: Evidence from seasoned equity offerings”, Journal of Financial Economics 72, pp. 581-604
Gillan S., Starks L., 2000, “Corporate governance proposals and shareholder activism: the role of institutional investors”, Journal of Financial Economics 57, pp. 275-305
Gillan S., Starks L., 2003, “Corporate Governance, Corporate Ownership, and the Role of Institutional Investors: A Global Perspective”, Journal of Applied Finance 13, pp. 4-22
Gillan S., Starks L., 2007, “The Evolution of Shareholder Activism in the United States”, Journal of Applied Corporate Finance, 19, pp. 55–73
Gopalan R., 2008, “Institutional Stock Sales and Takeovers: The Disciplinary Role of Voting with Your Feet”, Working paper, Available at SSRN: http://ssrn.com/abstract=891515 or http://dx.doi.org/10.2139/ssrn.891515
Graves S., Waddock, 1994, “Institutional owners and corporate social performance”, Academy of Management Journal, 1994, Vol. 37, No.4, pp. 1034-1046
Grinstein Y., Michaely R., 2005, “Institutional Holdings and Payout Policy”, The Journal of Finance, Vol. LX, No. 3, June 2005, pp. 1389-1426.
Han K., Lee S., Suk D., 1999, “Institutional shareholders and dividends”, Journal of Financial and Strategic Decisions, Vol. 12, No. 1, pp. 53-62
23
Harris R., Jenkinson T., Kaplan, S, 2015, “How Do Private Equity Investments Perform Compared to Public Equity?”, forthcoming Journal of Investment Management
Hartzell J., Starks L., 2003, “Institutional investors and executive compensation”, Journal of Finance 58, pp. 2351–2374
Helwege J., Intintoli V., Zhang, 2012, “Voting with their feet or activism? Institutional investors’ impact on CEO turnover”, Journal of Corporate Finance 18, pp. 22–37
Henrekson M., Jakobsson U., 2012, “The Swedish Corporate Control Model: Convergence, Persistence or Decline?” Corporate Governance: An International Review, Vol. 20, Issue 2, pp. 212-227, 2012.
Holmen M., Knopf J., 2004, “Minority Shareholder Protections and the Private Benefits of Control for Swedish Mergers”, Journal of Financial and Quantitative Analysis, 39, pp. 167-191
Huyghebaert N., Hulle C., 2004, “The role of institutional investors in corporate finance”, Tijdschrift voor Economie en Management, Vol. XLIX, 4, pp. 689-726
Jara-Bertin M., Lopez-Iturriaga F., Lopez-de-Foronda O., 2012, “Does the influence of institutional investors depend on the institutional framework? An international analysis”, Applied Economics - Vol. 44, No. 3, pp. 265 - 278
Jensen, M., 1986, “Agency cost free cash flow, corporate finance, and takeovers”, American Economic Review, 76(2), pp. 323–329
Jensen, M. 1989, “Eclipse of the public corporation”, Harvard Business Review, Sept.–Oct. pp. 61–74
Kahl M., Gorton G., 1999, “Blockholder Identity, Equity Ownership Structures, and Hostile Takeovers”, NBER Working Paper No. w7123. Available at SSRN: http://ssrn.com/abstract=165132
Kahn C., Winton A., 1998, “Ownership Structure, Speculation, and Shareholder Intervention”, The Journal of Finance, 53, pp. 99–129
Kaplan S., Stromberg P., 2009, “Leveraged Buyouts and Private Equity”, Journal of Economic Perspectives, 23(1), pp. 121-46.
Klein A., Zur E., 2009, “Entrepreneurial Shareholder Activism: Hedge Funds and Other Private Investors”, The Journal of Finance, VOL. LXIV, NO. 1, pp. 187-229
Lakonishok J., Shleifer A, Vishny R., Hart O., Perry G., 1992, “The structure and performance of the money management industry”, Brookings Papers on Economic Activity. Microeconomics, pp. 339-391.
24
Lekvall P., 2009, “The Swedish corporate governance model”, in The Handbook of International Corporate governance. A definite guide, 2nd edition, pp. 368-376.
Lekvall P., Hansen J., Lonfeldt C., Airaksinen M., Berglund T., Weymarn T., Knudsen G., Norvik H., Skog R., Sjoman E., 2014, “The Nordic Corporate Governance Model”, TMG Sthlm, Stockholm
McCahery J., Sautner Z., Starks L., 2015, “Behind the scenes: The corporate governance preferences of institutional investors”, Journal of Finance, Forthcoming
Menkhoff L. 2002, “Institutional Investors: The External Cost of a successful Innovation”, Journal of Economic Issues, Vol. 36, No 4, pp. 907-933
Nelson J., 2006, “The ‘CalPERS effect’ revisited again”, Journal of Corporate Finance 12, pp. 187-213
Nesbitt, S., 1994, “Long-term rewards from shareholder activism: a study of the ‘CalPERS effect’”, Journal of Applied Corporate Finance 6, pp. 75 – 80
Parrino R., Sias R., Starks, L., 2003, “Voting with their feet: institutional ownership changes around forced CEO turnover”, Journal of Financial Economics, 68, pp. 3–46
Petajisto A., 2013, “Active Share and Mutual Fund Performance”, Financial Analysts Journal, 2013, 69(4) pp. 73-93
Prevost A., Rao R., 2000, “Of what value are shareholder proposals sponsored by public pension funds?”, The Journal of Business, Vol. 73, No. 2, pp. 177-204
Qayyum A., Nagel G., Roskelley K., 2015, “Do Motivated Institutional Investors Monitor Firm Payout and Performance?”, Journal of Financial Research, Forthcoming
Qiu L., 2006, “Which institutional investors monitor? Evidence from acquisitions activity”, Brown Economics Working Paper Series No. 2004-21; Yale ICF Working Paper No. 04-15. Available at SSRN:http://ssrn.com/abstract=521803
Rose, C., 2007, “Can institutional investors fix the corporate governance problem? Some Danish evidence”, Journal of Management & Governance, Volume 11, Issue 4, pp. 405-428
Scott R., 2014, “Do institutional investors alleviate agency problems by influencing payout policy in firms with poor investment opportunities?”, Accounting and Finance Research, Vol. 3, No. 3, pp. 43-57
Smith M., 1996, “Shareholder activism by Institutional investors: Evidence from CalPERS”, The Journal of Finance, Vol. 51, No. 1, pp. 227-252
25
Song W., Szewczyk S., 2003, “Does Coordinated Institutional Investor Activism Reverse the Fortunes of Underperforming Firms?”, Journal of Financial and Quantitative Analysis, 38, pp. 317-336
Tihanyi L., Johnson R., Hoskisson R., Hitt M., 2003, “Institutional ownership differences and international diversification: The effects of boards of directors and technological opportunity”, Academy of Management Journal, 2003, Vol., 46, No. 2, pp. 195-211
Wahal S., 1996, “Pension fund activism and firm performance”, Journal of Financial and Quantitative Analysis, Vol. 31, pp. 1-23
Woidtke T., 2002, “Agents watching agents? Evidence from pension fund ownership and firm value”, Journal of Financial Economics 63, pp. 99-131
Wright M., Amess K., Weir C., Girma S., 2009, “Private Equity and Corporate Governance: Retrospect and Prospect”, Corporate Governance: An International Review, 17(3), pp. 353–375
Wu Y, 2004, “The impact of public opinion on board structure changes, director career progression, and CEO turnover: Evidence from CalPERS’ corporate governance program”, Journal of Corporate Finance 10, pp. 199–227
Web citations:
AP 7, 2015, “Policies”, from: http://www.ap7.se/en/About-AP7/About-us/Policies/#sthash.DtvfTULc.dpuf, accessed: 01.11.2015
Carter D., 2010, “Merger of Swedish AP funds shot down by Pension Group”, Pensions & Investments, available at: < http://www.pionline.com/article/20100614/PRINT/306149982/merger-of-swedish-ap-funds-shot-down-by-pension-group >, accessed: 15.10.2016
Fowler H., 2011, “Sweden considers merging AP funds”, Professional Pensions, available at: < http://www.professionalpensions.com/global-pensions/news/2081237/sweden-considers-merging-ap-funds >, accessed: 15.10.2016
White A., 2015, “What consolidation means for the AP funds”, Published in www.top1000funds.com.au, available at: <http://www.top1000funds.com/news/2014/04/04/what-consolidation-means-for-the-ap-funds/>, accessed: 01.08.2015
Williams J., 2015a, “Sweden to close AP6 buffer fund, consolidate unlisted assets into AP2”, Investment & Pensions Europe, available at: <http://www.ipe.com/countries/nordic-region/sweden-to-close-ap6-buffer-fund-consolidate-unlisted-assets-into-ap2/10008576.fullarticle>, accessed: 01.08.2015

26
Williams J., 2015b, “AP fund reforms undermine ‘strongest competitive advantage' – Langensjö”, Investment & Pensions Europe, from: <http://www.ipe.com/countries/nordic-region/ap-fund-reforms-undermine-strongest-competitive-advantage-langensj/10008594.fullarticle>, accessed: 01.08.2015

CHAPTER II: ESSAYS

27
MARKET VALUATION OF FIRMS AND PUBLIC PENSION FUND OWNERSHIP1
Naufal Alimov*
Abstract
I investigate the relationship between the market valuation of Swedish firms and ownership by pension funds using data from 2001-2011. In line with previous studies, I find a positive significant relationship between public pension fund ownership (the AP funds of the Swedish pension system) and the market valuation of Swedish firms.
Dynamic analysis reveals that public pension funds increase their holdings in firms after an increase in market valuation of firms, while change in pension fund ownership is not related to future change in the market value of firms.
It therefore seems that the positive correlation between public pension fund ownership and Swedish firms’ market valuation is a result of the concentration of public pension fund investment in equity valued high by the market, rather than the ability of public pension funds to improve corporate performance.
JEL Classification: G23, G30, G38
Key words: Institutional investors, pension funds, corporate governance, market valuation of firms
*Hanken School of Economics, Department of Economics
1 I am grateful to Tom Berglund, Martin Holmen, Ulf Jakobsson, Praveen Malla, Laura Arranz Aperte, and the participants of the PhD workshop in corporate governance for their valuable comments; to the Hanken Foundation, and Finnish Cultural Foundation for financial support.
28
1 INTRODUCTION
Institutional investors play an important role in financial markets2. The role of these investors3 in the governance of firms has thus been debated extensively in the literature4. Among the different types of institutional investors pension funds constitute an important category. An important question is whether these funds can improve the efficiency of firms. Markets may value pension funds’ ownership in firms if pension funds have a positive impact on corporate governance. Views on the role of pension funds in the governance of firms range from the positive (Clark & Hebb, 2004; Iglesias-Palau, 2000; Rebai , 2001; Giannetti & Laeven, 2009) to the negative (Faccio & Lasfer, 2002) as well as those that see it as insignificant (Wahal, 1996; Del Guercio & Hawkins 1999), and mixed (Del Guercio & Hawkins 1999; Woidtke, 2002).
A positive contemporaneous relationship between pension fund ownership and firms’ market value is taken as evidence of the capacity of pension funds to improve firms’ governance. Such a claim is made by Giannetti & Laeven (2009), who investigate the case of Swedish public pension funds after the pension reform at the turn of the millennium. The important feature of the reformed Swedish pension system is that a competitive structure has been created between public pension funds (AP funds). At the same time the operation of these funds has been subject to strict investment rules (see this dissertation’s introduction). Giannetti & Laeven (2009) find a positive relationship between public pension fund ownership and market valuation of firms. The authors claim that this relationship arises from the ability of these funds to improve the corporate governance of firms in which they have substantial ownership. However, a positive relationship between pension fund ownership and firms’ market value may also arise if these funds invest heavily in firms valued high by the market.
In this study I extend the dataset used by Giannetti & Laeven (2009), and conduct an in-depth analysis of the problem. I explore pension fund ownership in Sweden, while employing data on Stockholm listed companies for the period 2001-2011. This period covers the financial crisis that started in 2007-2008, which is particularly interesting because it gives an exogenous variation to ownership data that is exploited in the project.
I find that the contemporaneous relationship between firm market value and public pension fund ownership is statistically significant and positive, while the relationship with premium pension fund ownership is not significant.
A dynamic study reveals that changes in firms’ market value are positively associated with future changes in public pension fund ownership in those firms. The reverse relationship does not hold true. These findings are in line with the “selection phenomena” hypothesis – the inclination of public pension funds to invest in firms with a high market value, as opposed to the tendency of markets to place a premium on the stocks of firms owned by public pension funds.
2 According to the Federal Reserve Board (2011), institutional investors hold over 60% equity in the US stock market. 3 Institutional investors are organisations that invest money on behalf of beneficiaries. 4 For a literature survey see Berglund & Alimov (2015).

29
These findings are in line with Gompers & Metrick (2001), who show that institutional investors compared with other investors, concentrate more on large and liquid stock.
Another factor in public pension fund concentration on high Market-to-Book firms may be the “prudent man law” concerns outlined by Del Guercio (1996). He argues that institutional investors, like pension funds, tend to invest according to prudent-man laws that make them accountable for the characteristics of assets in isolation and not for overall portfolio performance. According to the author prudence concerns compel institutional investors to concentrate on high-quality (blue chip) shares.
However, the findings in this study may be the result of the structure of the pension system in Sweden. The extent to which this paper’s findings reflect the specific features of the Swedish pension system is an interesting topic for future research.
30
2 LITERATURE REVIEW AND STATEMENT OF HYPOTHESES
The Swedish pension reform that transformed the system from a pure pay-as-you-go to a partly funded scheme has generated two types of pension funds which act in the capital market: public pension funds (AP funds), and premium pension funds. An important question is whether capital market activities by pension funds have engendered a relationship between their shareholdings and market valuation of the firms. Furthermore, if this is indeed the case, can we regard this correlation as the outcome of pension funds’ corporate activism, or as a reflection of their stock-picking activities?
Depending on their relationship with the beneficiaries, and firms considered for investment, as well as their goals and the cost-benefit analysis of ownership, institutional investors, like pension funds, make short-term or long term commitment to company ownership (Rubach & Terrence, 2009; Ryan & Schneider, 2003). Firms’ market valuation can therefore be correlated with ownership through corporate governance activism by investors with a long-term commitment to a company, or through share trading by investors with shorter investment horizons that may result in the over- or under- representation of a particular type of investor in a company, labelled as “selection phenomena”.
Clark & Hebb (2004) claim that because pension funds are usually locked-in in the firms in which they invest (because of the passive market index they are part of or because their exit might erode their share prices), they prefer to exert all their power in increasing long-term shareholder value and firm profitability. They argue that pension funds may compromise the tension between short-term stock price and long-term interests. On the one hand competition between pension funds pushes them to react aggressively in the stock markets, while on the other hand the long-term nature of their investment prompts them to rely on firms’ fundamentals.
Woidtke (2002) analyses the separate effects of private versus public pension funds on the valuation of Fortune 500 firms. She employs a two-stage estimation method with instrumenting past earnings and estimated transaction costs of funds to verify her hypotheses. She thus detects a positive impact from private pension fund ownership and a negative one from public pension fund ownership on the valuation of the firms she investigates. She argues that the positive effect from private pension funds was the results of higher performance-based compensation mechanisms practised in those funds that resulted in a convergence of interest with other shareholders in the firms in which they invested. However, she suggests public pension funds pursue objectives other than shareholder wealth maximisation. She confirms this by finding negative significant effects, especially from activist public pension funds that highlight poor corporate governance or social issues that are not expected to increase firm value.
Giannetti & Laeven (2009) exploit the variation in ownership concentration caused by Swedish pension reform to analyse the relationship between pension fund ownership and firms’ market valuation. The authors reveal a positive relationship between public pension funds holdings and market valuation of firms. According to the authors this relationship is a result of the capacity of public pension funds to affect corporate performance through their corporate activism. The authors support their argument with a fact that markets reacted negatively to the news about public pension fund mass stock decrease during the initial stage of pension reform.
31
Indeed, Swedish public pension funds claim to have been targeting corporate governance issues in firms under their ownership in order to increase firm performance and maximise shareholder wealth. The question is whether they are able to make an impact on these companies.
Based on these arguments and findings, my first hypothesis is that there is a positive correlation between firms’ market value and pension fund ownership.
Research Hypothesis-1
There is a positive relationship between pension fund ownership and firms’ market valuation.
When pension fund ownership and market valuation of firms are correlated, it does not necessarily signify the effectiveness of pension fund corporate activism. Importantly, however, there are numerous “selection phenomena” reasons that could drive the correlation between pension fund ownership and firms’ market valuation.
Pension funds may exit firms when dissatisfied with the management, as Parrino et al. (2003) argue, and because institutional investors are usually considered as “informed agents” (Ali et al., 2004; Ke & Ramalingegowda, 2005) their exit from firms might influence share prices. Moreover, institutional investors, like pension funds, may be prudent man law followers and concentrate on highly valued “blue chip” companies, as their beneficiaries value single shares in addition to whole portfolio structure and return (Del Guercio, 1996; Lakonishok et al. 1994). Finally, pension funds may choose high valued stock for liquidity reasons. These last two reasons clearly imply a positive correlation between pension fund ownership and firms’ market valuation.
Research Hypothesis-2
Pension funds select shares with a high market value.
32
3 DATA
Data was collected with regard to companies listed on the Stockholm Stock Exchange for the period 2001-2011. To avoid survivorship bias, only companies that were listed as of 2001, were included in the sample5. In total, there were 193 companies out of which 10 were delisted, and 40 merged (observations were included only up to a merger date).
Financial data was obtained through Thomson Reuters and Worldscope (via Thomson One database), as well as The Bureau van Dijk’s Orbis database. Ownership data for listed companies was collected from the Thomson One database. As there was no information concerning the ownership of delisted companies in the Thomson One database, I entered ownership information on delisted firms from “Agarna Och Markten” book series by Fristedt & Sundqvist (2001-2009). The Thomson One database provides information on ownership for all investors that hold even a very small percentage of cash flow rights in companies. The “Agarna Och Markten” series shows the 25 largest owners of Swedish companies.
5 If we select firms listed more recently, the sample will be biased (it will include only firms with a certain characteristics that survived in the listing). For this reason, I have chosen firms that were listed at the beginning of the sample.
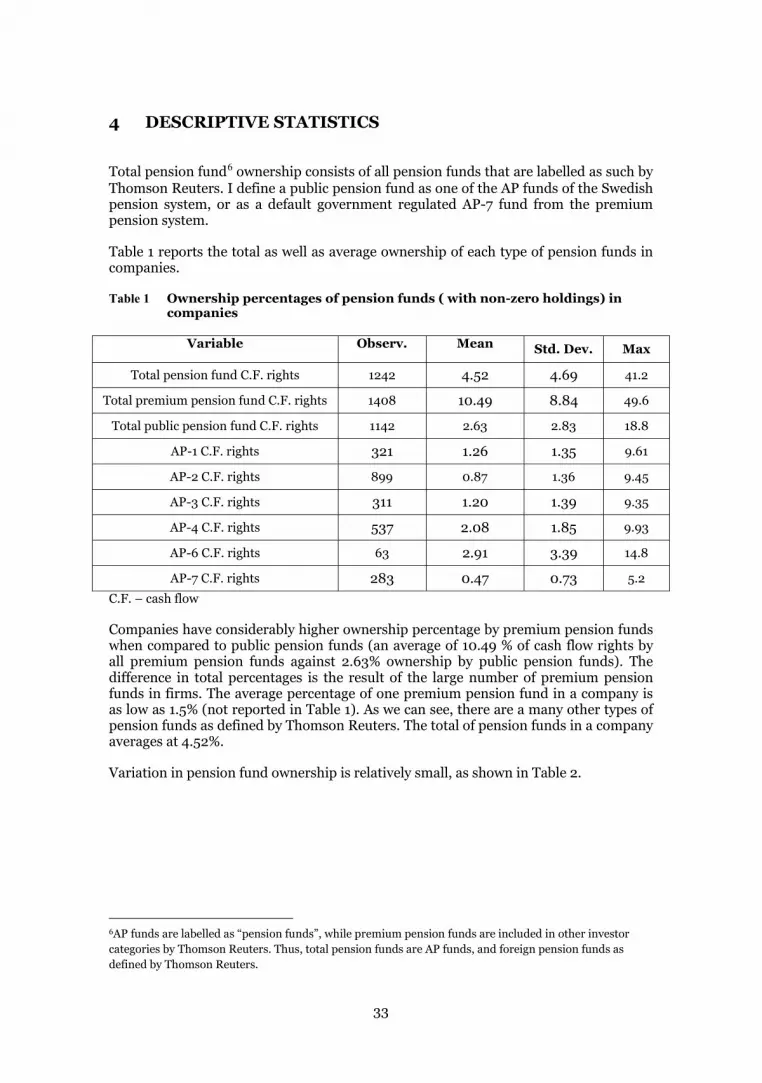
33
4 DESCRIPTIVE STATISTICS
Total pension fund6 ownership consists of all pension funds that are labelled as such by Thomson Reuters. I define a public pension fund as one of the AP funds of the Swedish pension system, or as a default government regulated AP-7 fund from the premium pension system.
Table 1 reports the total as well as average ownership of each type of pension funds in companies.
Table 1 Ownership percentages of pension funds ( with non-zero holdings) in companies
Variable
Observ.
Mean
Std. Dev. Max
Total pension fund C.F. rights 1242 4.52 4.69 41.2
Total premium pension fund C.F. rights 1408 10.49 8.84 49.6
Total public pension fund C.F. rights 1142 2.63 2.83 18.8
AP-1 C.F. rights 321 1.26 1.35 9.61
AP-2 C.F. rights 899 0.87 1.36 9.45
AP-3 C.F. rights 311 1.20 1.39 9.35
AP-4 C.F. rights 537 2.08 1.85 9.93
AP-6 C.F. rights 63 2.91 3.39 14.8
AP-7 C.F. rights 283 0.47 0.73 5.2
C.F. – cash flow
Companies have considerably higher ownership percentage by premium pension funds when compared to public pension funds (an average of 10.49 % of cash flow rights by all premium pension funds against 2.63% ownership by public pension funds). The difference in total percentages is the result of the large number of premium pension funds in firms. The average percentage of one premium pension fund in a company is as low as 1.5% (not reported in Table 1). As we can see, there are a many other types of pension funds as defined by Thomson Reuters. The total of pension funds in a company averages at 4.52%.
Variation in pension fund ownership is relatively small, as shown in Table 2.
6AP funds are labelled as “pension funds”, while premium pension funds are included in other investor categories by Thomson Reuters. Thus, total pension funds are AP funds, and foreign pension funds as defined by Thomson Reuters.
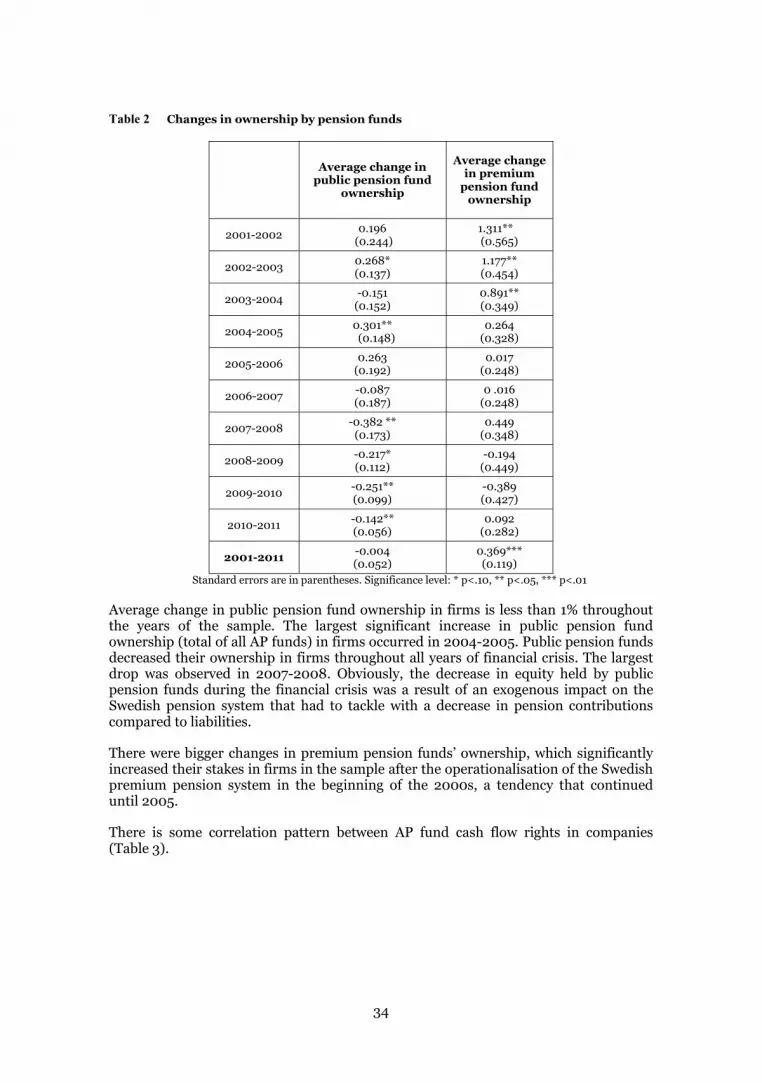
34
Table 2 Changes in ownership by pension funds
Average change in public pension fund
ownership
Average change in premium
pension fund ownership
2001-2002 0.196 (0.244)
1.311** (0.565)
2002-2003 0.268* (0.137)
1.177** (0.454)
2003-2004 -0.151 (0.152)
0.891** (0.349)
2004-2005 0.301** (0.148)
0.264 (0.328)
2005-2006 0.263 (0.192)
0.017 (0.248)
2006-2007 -0.087 (0.187)
0 .016 (0.248)
2007-2008 -0.382 ** (0.173)
0.449 (0.348)
2008-2009 -0.217* (0.112)
-0.194 (0.449)
2009-2010 -0.251** (0.099)
-0.389 (0.427)
2010-2011 -0.142** (0.056)
0.092 (0.282)
2001-2011 -0.004 (0.052)
0.369*** (0.119)
Standard errors are in parentheses. Significance level: * p<.10, ** p<.05, *** p<.01
Average change in public pension fund ownership in firms is less than 1% throughout the years of the sample. The largest significant increase in public pension fund ownership (total of all AP funds) in firms occurred in 2004-2005. Public pension funds decreased their ownership in firms throughout all years of financial crisis. The largest drop was observed in 2007-2008. Obviously, the decrease in equity held by public pension funds during the financial crisis was a result of an exogenous impact on the Swedish pension system that had to tackle with a decrease in pension contributions compared to liabilities.
There were bigger changes in premium pension funds’ ownership, which significantly increased their stakes in firms in the sample after the operationalisation of the Swedish premium pension system in the beginning of the 2000s, a tendency that continued until 2005.
There is some correlation pattern between AP fund cash flow rights in companies (Table 3).

Tab
le 3
C
orre
lati
on m
atri
x
C.F
. ri
ghts
by
Pu
blic
pe
n.
Mar
ket
to B
ook
C.F
. ri
ghts
by
Pr
emiu
m p
ens.
AP-
1 A
P-2
AP-
3 A
P-4
AP-
6 A
P-7
Mul
tip
le
shar
es
OM
X
dum
my
Age
of
com
pany
Deb
t to
tota
l as
sets
% b
y th
e la
rges
t ow
ner
RO
E
Mar
ket-
to-
Boo
k 0.
096
C.F
. rig
hts
by
Prem
ium
pen
. 0.
225
-0.0
26
AP-
1 0.
480
0.03
1 0.
061
AP-
2 0.
559
-0.0
15
0.10
0
0.16
1
AP-
3 0.
509
0.24
3 0.
089
0.18
8 0.
153
AP-
4 0.
673
0.02
3 0.
275
0.08
3 0.
078
0.13
7
AP-
6 0.
358
0.04
1 -0
.062
0.
013
-0.0
08
0.03
7 0.
063
AP-
7 0.
348
0.02
5 0.
026
0.10
9 0.
153
0.18
0 0.
105
0.18
0
Mul
tipl
e sh
ares
0.
005
-0.0
16
0.11
0 0.
026
-0.0
03
0.05
1 0.
017
-0.0
45
-0.0
81
OM
X d
umm
y 0.
250
0.00
9 0.
045
0.30
9 0.
147
0.16
1 0.
075
-0.0
02
0.12
1 0.
112
A
ge o
f co
mpa
ny
0.03
1 -0
.092
0.
027
0.07
1 0.
036
0.07
2 -0
.010
-0
.036
-0
.014
0.
026
0.02
9
D
ebt t
o to
tal
asse
ts
0.10
5 -0
.052
-0
.008
0.
068
0.11
8 0.
063
0.02
0 -0
.013
0.
058
0.04
8 0.
082
0.23
1
% b
y th
e la
rges
t ow
ner
-0.0
49
-0.0
38
0.02
1 -0
.024
-0
.005
-0
.032
-0
.004
-0
.049
-0
.093
0.
077
-0.0
47
0.09
0
-0.0
11
RO
E
0.02
9 -0
.040
-0
.027
-0
.001
-0
.024
-0
.027
0.
057
0.12
4 0.
072
0.00
1 0.
012
0.01
2 0.
008
-0.0
17
Lo
g of
tota
l em
ploy
ees
0.35
6 -0
.104
0.
297
0.30
0
0.21
2 0.
181
0.21
0 -0
.027
0.
157
0.09
5 0.
559
0.33
0 0.
352
-0.0
15
0.02
2
C.F
. - c
ash
flow
35
36
5 MARKET-TO-BOOK - PENSION FUND OWNERSHIP RELATIONSHIP
Following the literature (for example Giannetti & Laeven, 2009), I employ the Market-to-Book ratio as a measure of market valuation of firms in the study of its relationship with pension fund ownership.
I start with an investigation of the contemporaneous relationship between pension fund ownership and the market valuation of firms while regressing the Market-to-Book on pension fund ownership variables (total pension funds as defined by Thomson Reuters, public pension funds as a total of all AP funds, and premium pension funds). Control variables in these regressions are the ownership percentage of the largest shareholder, the size of the firm (as measured by the logarithm of the total number of employees), debt normalised by total assets, the illiquidity measure7, the Multiple shares dummy (with the variable equal to 1 if there are more than one class of shares in the company)8, as well as industry and time fixed effects.
First, I investigate the subsample 2001-2006 through pooled OLS estimation. The results are reported in Table 4.
7 Illiquidity = (ask price – bid price), which is computed as an average for the last 6 end of months of the year. 8 Ideally, one should include the wedge between voting rights and cash flow rights in companies as an additional control, as both pension fund ownership and Market-to-Book may be co-determined by the wedge. Unfortunately, I was able to collect information only on cash flow rights through the Thomson Reuters database. In subsequent robustness tests with SIS Ägarservice AB ownership data (which has information on both cash flow as well as voting rights), I include a wedge variable in the regressions.
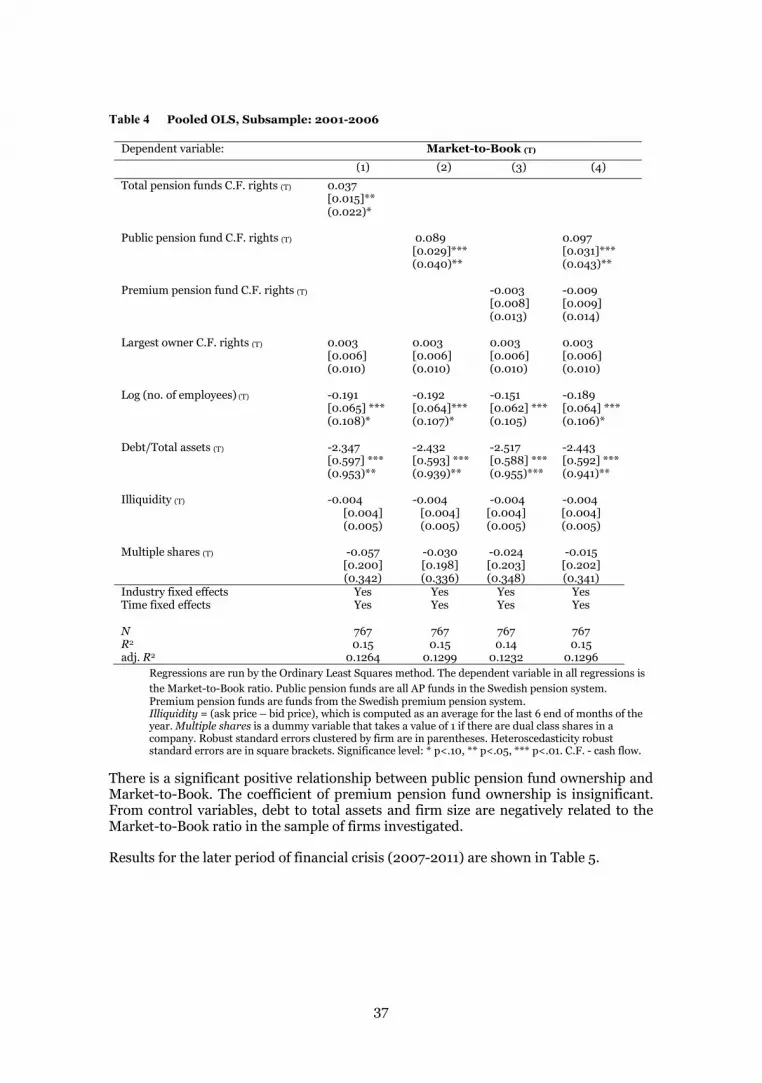
37
Table 4 Pooled OLS, Subsample: 2001-2006
Dependent variable: Market-to-Book (T) (1) (2) (3) (4)
Total pension funds C.F. rights (T) 0.037 [0.015]**
(0.022)* Public pension fund C.F. rights (T) 0.089 0.097 [0.029]***
(0.040)** [0.031]*** (0.043)**
Premium pension fund C.F. rights (T) -0.003 -0.009 [0.008]
(0.013) [0.009] (0.014)
Largest owner C.F. rights (T) 0.003 0.003 0.003 0.003 [0.006]
(0.010) [0.006] (0.010)
[0.006] (0.010)
[0.006] (0.010)
Log (no. of employees) (T) -0.191 -0.192 -0.151 -0.189 [0.065] ***
(0.108)* [0.064]*** (0.107)*
[0.062] *** (0.105)
[0.064] *** (0.106)*
Debt/Total assets (T) -2.347 -2.432 -2.517 -2.443 [0.597] ***
(0.953)** [0.593] *** (0.939)**
[0.588] *** (0.955)***
[0.592] *** (0.941)**
Illiquidity (T) -0.004 -0.004 -0.004 -0.004 [0.004]
(0.005) [0.004] (0.005)
[0.004] (0.005)
[0.004] (0.005)
Multiple shares (T) -0.057 -0.030 -0.024 -0.015 [0.200]
(0.342) [0.198] (0.336)
[0.203] (0.348)
[0.202] (0.341)
Industry fixed effects Yes Yes Yes Yes Time fixed effects Yes Yes Yes Yes N 767 767 767 767 R2 0.15 0.15 0.14 0.15 adj. R2 0.1264 0.1299 0.1232 0.1296
Regressions are run by the Ordinary Least Squares method. The dependent variable in all regressions is the Market-to-Book ratio. Public pension funds are all AP funds in the Swedish pension system. Premium pension funds are funds from the Swedish premium pension system. Illiquidity = (ask price – bid price), which is computed as an average for the last 6 end of months of the year. Multiple shares is a dummy variable that takes a value of 1 if there are dual class shares in a company. Robust standard errors clustered by firm are in parentheses. Heteroscedasticity robust standard errors are in square brackets. Significance level: * p<.10, ** p<.05, *** p<.01. C.F. - cash flow.
There is a significant positive relationship between public pension fund ownership and Market-to-Book. The coefficient of premium pension fund ownership is insignificant. From control variables, debt to total assets and firm size are negatively related to the Market-to-Book ratio in the sample of firms investigated.
Results for the later period of financial crisis (2007-2011) are shown in Table 5.
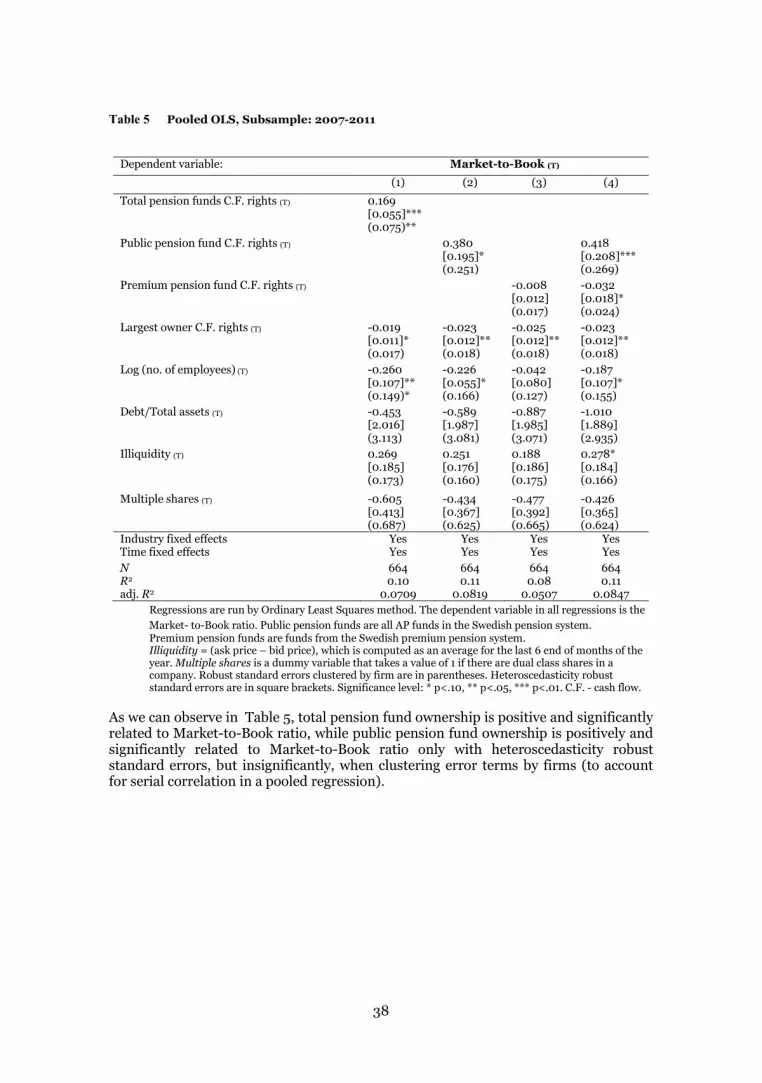
38
Table 5 Pooled OLS, Subsample: 2007-2011
Dependent variable: Market-to-Book (T) (1) (2) (3) (4)
Total pension funds C.F. rights (T) 0.169 [0.055]***
(0.075)**
Public pension fund C.F. rights (T) 0.380 [0.195]* 0.418
[0.208]*** (0.251) (0.269)
Premium pension fund C.F. rights (T) -0.008 -0.032 [0.012]
(0.017) [0.018]* (0.024)
Largest owner C.F. rights (T) -0.019 -0.023 -0.025 -0.023 [0.011]*
(0.017) [0.012]** (0.018)
[0.012]** (0.018)
[0.012]** (0.018)
Log (no. of employees) (T) -0.260 -0.226 -0.042 -0.187 [0.107]**
(0.149)* [0.055]* (0.166)
[0.080] (0.127)
[0.107]* (0.155)
Debt/Total assets (T) -0.453 -0.589 -0.887 -1.010 [2.016]
(3.113) [1.987] (3.081)
[1.985] (3.071)
[1.889] (2.935)
Illiquidity (T) 0.269 0.251 0.188 0.278* [0.185]
(0.173) [0.176] (0.160)
[0.186] (0.175)
[0.184] (0.166)
Multiple shares (T) -0.605 -0.434 -0.477 -0.426 [0.413]
(0.687) [0.367] (0.625)
[0.392] (0.665)
[0.365] (0.624)
Industry fixed effects Yes Yes Yes Yes Time fixed effects Yes Yes Yes Yes
N 664 664 664 664 R2 0.10 0.11 0.08 0.11 adj. R2 0.0709 0.0819 0.0507 0.0847
Regressions are run by Ordinary Least Squares method. The dependent variable in all regressions is the Market- to-Book ratio. Public pension funds are all AP funds in the Swedish pension system. Premium pension funds are funds from the Swedish premium pension system. Illiquidity = (ask price – bid price), which is computed as an average for the last 6 end of months of the year. Multiple shares is a dummy variable that takes a value of 1 if there are dual class shares in a company. Robust standard errors clustered by firm are in parentheses. Heteroscedasticity robust standard errors are in square brackets. Significance level: * p<.10, ** p<.05, *** p<.01. C.F. - cash flow.
As we can observe in Table 5, total pension fund ownership is positive and significantly related to Market-to-Book ratio, while public pension fund ownership is positively and significantly related to Market-to-Book ratio only with heteroscedasticity robust standard errors, but insignificantly, when clustering error terms by firms (to account for serial correlation in a pooled regression).
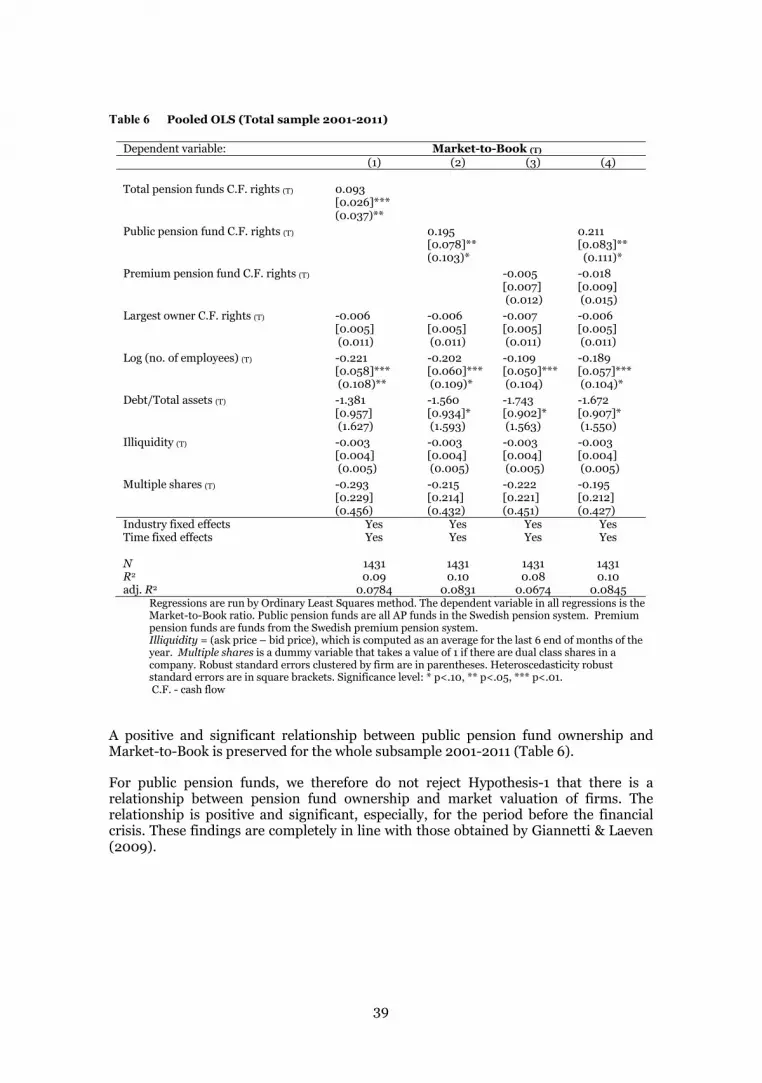
39
Table 6 Pooled OLS (Total sample 2001-2011)
Dependent variable: Market-to-Book (T) (1) (2) (3) (4) Total pension funds C.F. rights (T) 0.093
[0.026]***
(0.037)**
Public pension fund C.F. rights (T) 0.195 0.211 [0.078]**
(0.103)* [0.083]** (0.111)*
Premium pension fund C.F. rights (T) -0.005 -0.018 [0.007]
(0.012) [0.009] (0.015)
Largest owner C.F. rights (T) -0.006 -0.006 -0.007 -0.006 [0.005]
(0.011) [0.005] (0.011)
[0.005] (0.011)
[0.005] (0.011)
Log (no. of employees) (T) -0.221 -0.202 -0.109 -0.189 [0.058]***
(0.108)** [0.060]*** (0.109)*
[0.050]*** (0.104)
[0.057]*** (0.104)*
Debt/Total assets (T) -1.381 -1.560 -1.743 -1.672 [0.957]
(1.627) [0.934]* (1.593)
[0.902]* (1.563)
[0.907]* (1.550)
Illiquidity (T) -0.003 -0.003 -0.003 -0.003 [0.004]
(0.005) [0.004] (0.005)
[0.004] (0.005)
[0.004] (0.005)
Multiple shares (T) -0.293 -0.215 -0.222 -0.195 [0.229]
(0.456) [0.214] (0.432)
[0.221] (0.451)
[0.212] (0.427)
Industry fixed effects Yes Yes Yes Yes Time fixed effects Yes Yes Yes Yes N 1431 1431 1431 1431 R2 0.09 0.10 0.08 0.10 adj. R2 0.0784 0.0831 0.0674 0.0845
Regressions are run by Ordinary Least Squares method. The dependent variable in all regressions is the Market-to-Book ratio. Public pension funds are all AP funds in the Swedish pension system. Premium pension funds are funds from the Swedish premium pension system. Illiquidity = (ask price – bid price), which is computed as an average for the last 6 end of months of the year. Multiple shares is a dummy variable that takes a value of 1 if there are dual class shares in a company. Robust standard errors clustered by firm are in parentheses. Heteroscedasticity robust standard errors are in square brackets. Significance level: * p<.10, ** p<.05, *** p<.01. C.F. - cash flow
A positive and significant relationship between public pension fund ownership and Market-to-Book is preserved for the whole subsample 2001-2011 (Table 6).
For public pension funds, we therefore do not reject Hypothesis-1 that there is a relationship between pension fund ownership and market valuation of firms. The relationship is positive and significant, especially, for the period before the financial crisis. These findings are completely in line with those obtained by Giannetti & Laeven (2009).

40
6 DYNAMIC ANALYSIS OF PENSION FUND OWNERSHIP AND MARKET-TO-BOOK RELATIONSHIP
It is premature to judge a pension fund’s capacity to influence corporate performance merely by observing a contemporaneous relationship between public pension fund ownership and Market-to-Book ratio. As the literature suggests, institutional investors such as pension funds may be inclined to invest in firms with a high market value out of liquidity or prudent-man law concerns (Gompers & Metrick, 2001; Del Guercio, 1996; Lakonishok et al., 1994), which explains their contemporaneous correlation, especially given the high year-to-year autocorrelation of pension fund holdings in firms.
We therefore need a dynamic study of the relationship between Market-to-Book and public pension fund ownership to separate any corporate governance impact from stock picking experienced by public pension funds.
If the positive relationship between Market-to-Book ratio and public pension fund ownership were due to these funds’ capacity to positively influence firm performance through corporate governance, then an increase in their holdings in firms should result in a future increase of these firms’ Market-to-Book ratio. On the contrary, a positive correlation between changes in Market-to-Book ratio and a future change in public pension fund ownership denotes stock-picking practices experienced by public pension funds.
I employ the following control variables to study the impact of the changes in Market-to-Book on future changes in public pension fund ownership:
an OMX index dummy (where the dummy equals 1 if a firm belongs to the OMX index) - Clark &Hebb (2004), Cornett et al. (2007), and Guercio& Hawkins (1999) argue that institutional investors, like pension funds, would be less likely to vote with their feet if company assets were included in the index;
Multiple shares dummy (with the variable equal to 1 if there are more than one class of shares in the company) - Li et al. (2008), for example, find that institutional holdings are much lower in firms with dual-class shares compared to those with single class shares. In robustness tests with SIS Ägarservice AB ownership data, I also employ Wedge ratio (computed as the ratio between the voting and cash flow rights of the largest owner), used alternately with Multiple shares dummy variable.
ROE - as the ability of a firm to generate return on investment;
the percentage of ownership by the largest shareholder - as a proxy for ownership concentration;
firm size - as a control for firm specific risk as suggested by Parrino et al. (2003), Pedersen & Thomsen (2003), Ferreira & Matos (2008), Gompers & Metrick (2001) among others;
debt to total assets - as a measure of control by firms’ creditors (Pedersen & Thomsen, 2003);
and industry and time fixed effect.
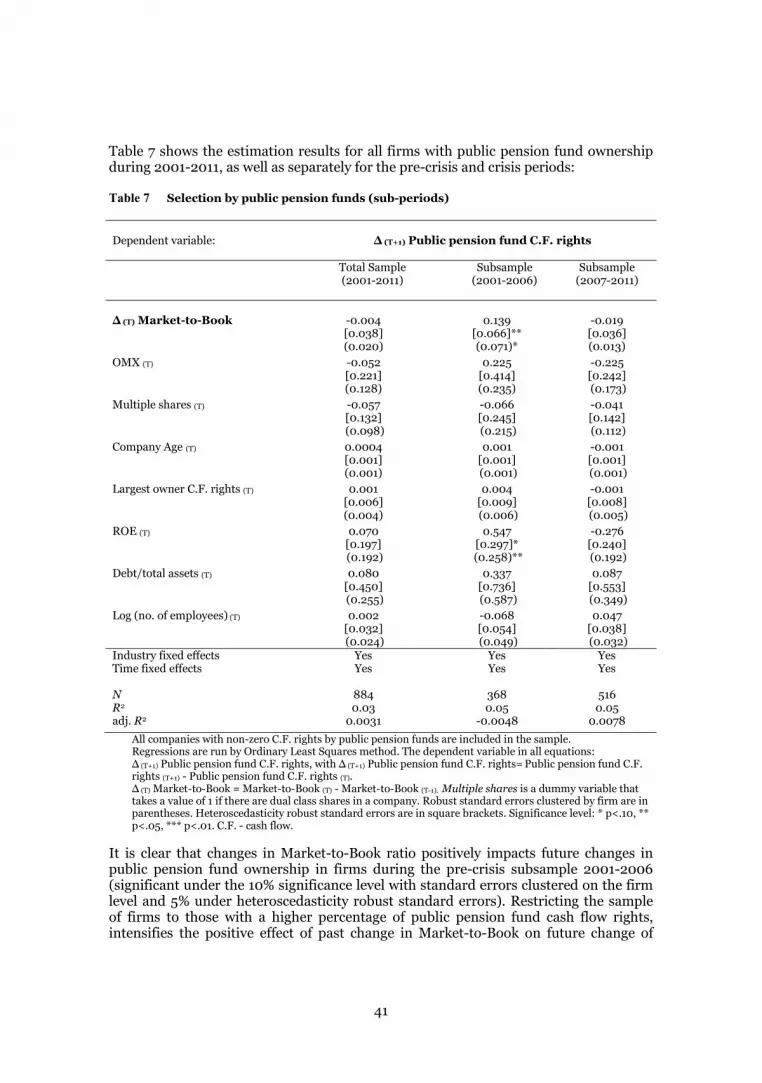
41
Table 7 shows the estimation results for all firms with public pension fund ownership during 2001-2011, as well as separately for the pre-crisis and crisis periods:
Table 7 Selection by public pension funds (sub-periods)
All companies with non-zero C.F. rights by public pension funds are included in the sample. Regressions are run by Ordinary Least Squares method. The dependent variable in all equations:
(T+1) (T+1) Public pension fund C.F. rights= Public pension fund C.F. rights (T+1) - Public pension fund C.F. rights (T).
(T) Market-to-Book = Market-to-Book (T) - Market-to-Book (T-1). Multiple shares is a dummy variable that takes a value of 1 if there are dual class shares in a company. Robust standard errors clustered by firm are in parentheses. Heteroscedasticity robust standard errors are in square brackets. Significance level: * p<.10, ** p<.05, *** p<.01. C.F. - cash flow.
It is clear that changes in Market-to-Book ratio positively impacts future changes in public pension fund ownership in firms during the pre-crisis subsample 2001-2006 (significant under the 10% significance level with standard errors clustered on the firm level and 5% under heteroscedasticity robust standard errors). Restricting the sample of firms to those with a higher percentage of public pension fund cash flow rights, intensifies the positive effect of past change in Market-to-Book on future change of
Dependent variable:
(T+1) Public pension fund C.F. rights
Total Sample
(2001-2011) Subsample
(2001-2006)
Subsample (2007-2011)
(T) Market-to-Book
-0.004 [0.038]
0.139
[0.066]**
-0.019 [0.036]
(0.020) (0.071)* (0.013)
OMX (T) -0.052 0.225 -0.225 [0.221]
(0.128) [0.414] (0.235)
[0.242] (0.173)
Multiple shares (T) -0.057 -0.066 -0.041 [0.132]
(0.098) [0.245] (0.215)
[0.142] (0.112)
Company Age (T) 0.0004 0.001 -0.001 [0.001]
(0.001) [0.001] (0.001)
[0.001] (0.001)
Largest owner C.F. rights (T) 0.001 0.004 -0.001 [0.006]
(0.004) [0.009] (0.006)
[0.008] (0.005)
ROE (T) 0.070 0.547 -0.276 [0.197]
(0.192) [0.297]*
(0.258)** [0.240] (0.192)
Debt/total assets (T) 0.080 0.337 0.087 [0.450]
(0.255) [0.736] (0.587)
[0.553] (0.349)
Log (no. of employees) (T) 0.002 -0.068 0.047 [0.032]
(0.024) [0.054] (0.049)
[0.038] (0.032)
Industry fixed effects Yes Yes Yes Time fixed effects Yes Yes Yes N 884 368 516 R2 0.03 0.05 0.05 adj. R2 0.0031 -0.0048 0.0078
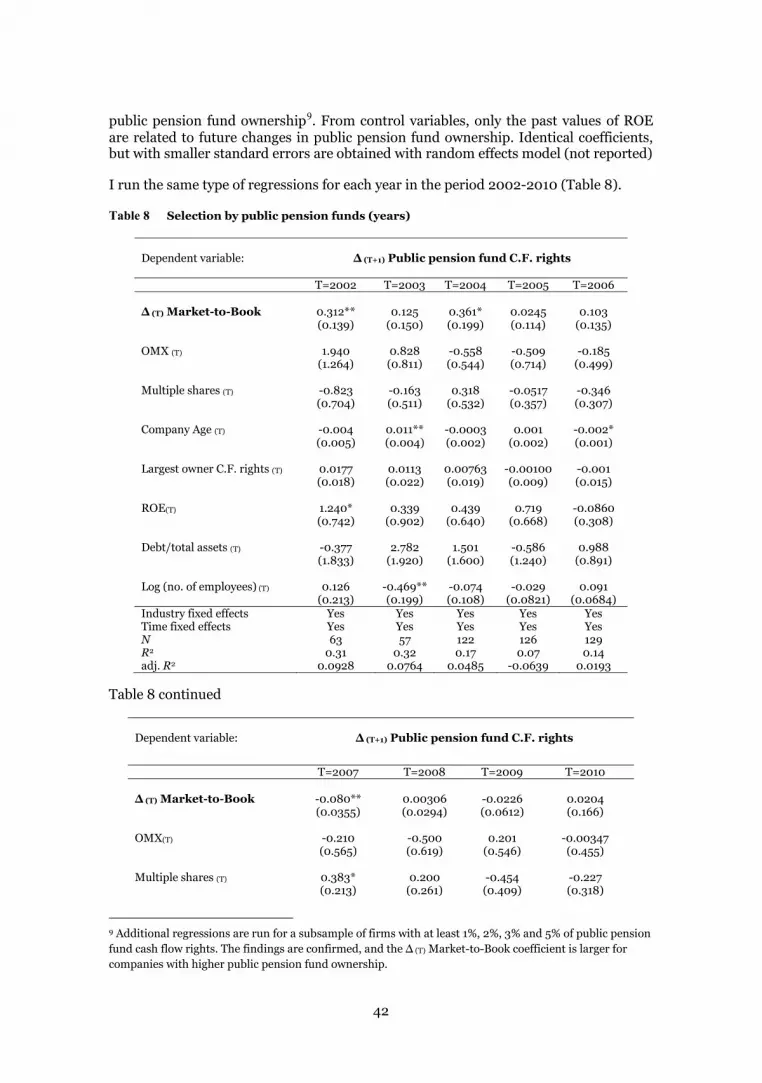
42
public pension fund ownership9. From control variables, only the past values of ROE are related to future changes in public pension fund ownership. Identical coefficients, but with smaller standard errors are obtained with random effects model (not reported)
I run the same type of regressions for each year in the period 2002-2010 (Table 8).
Table 8 Selection by public pension funds (years)
Table 8 continued
Dependent variable:
(T+1) Public pension fund C.F. rights
T=2007 T=2008 T=2009 T=2010
(T) Market-to-Book -0.080** 0.00306 -0.0226 0.0204 (0.0355) (0.0294) (0.0612) (0.166) OMX(T) -0.210 -0.500 0.201 -0.00347 (0.565) (0.619) (0.546) (0.455) Multiple shares (T) 0.383* 0.200 -0.454 -0.227 (0.213) (0.261) (0.409) (0.318)
9 Additional regressions are run for a subsample of firms with at least 1%, 2%, 3% and 5% of public pension fund cash flow rights. The findings are confirmed, and the (T) Market-to-Book coefficient is larger for companies with higher public pension fund ownership.
Dependent variable:
(T+1) Public pension fund C.F. rights
T=2002 T=2003 T=2004 T=2005 T=2006
(T) Market-to-Book 0.312** 0.125 0.361* 0.0245 0.103 (0.139) (0.150) (0.199) (0.114) (0.135) OMX (T) 1.940 0.828 -0.558 -0.509 -0.185 (1.264) (0.811) (0.544) (0.714) (0.499) Multiple shares (T) -0.823 -0.163 0.318 -0.0517 -0.346 (0.704) (0.511) (0.532) (0.357) (0.307) Company Age (T) -0.004 0.011** -0.0003 0.001 -0.002* (0.005) (0.004) (0.002) (0.002) (0.001) Largest owner C.F. rights (T) 0.0177 0.0113 0.00763 -0.00100 -0.001 (0.018) (0.022) (0.019) (0.009) (0.015) ROE(T) 1.240* 0.339 0.439 0.719 -0.0860 (0.742) (0.902) (0.640) (0.668) (0.308) Debt/total assets (T) -0.377 2.782 1.501 -0.586 0.988 (1.833) (1.920) (1.600) (1.240) (0.891) Log (no. of employees) (T) 0.126 -0.469** -0.074 -0.029 0.091 (0.213) (0.199) (0.108) (0.0821) (0.0684) Industry fixed effects Yes Yes Yes Yes Yes Time fixed effects Yes Yes Yes Yes Yes N 63 57 122 126 129 R2 0.31 0.32 0.17 0.07 0.14 adj. R2 0.0928 0.0764 0.0485 -0.0639 0.0193
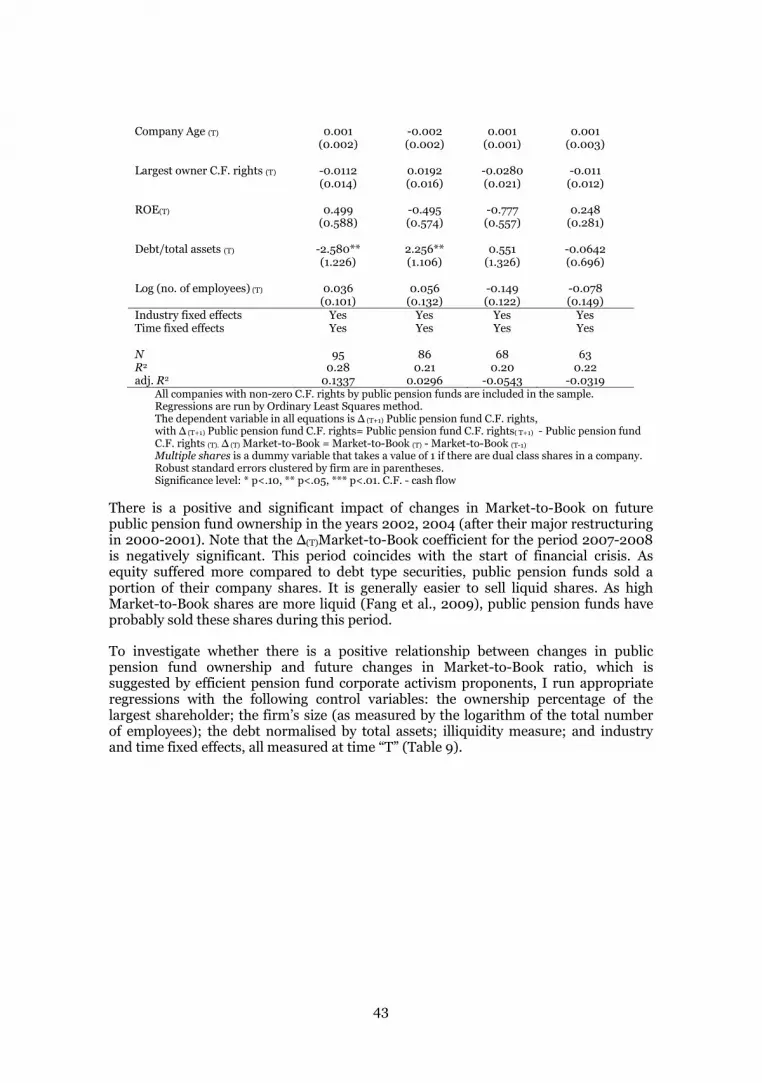
43
Company Age (T) 0.001 -0.002 0.001 0.001 (0.002) (0.002) (0.001) (0.003) Largest owner C.F. rights (T) -0.0112 0.0192 -0.0280 -0.011 (0.014) (0.016) (0.021) (0.012) ROE(T) 0.499 -0.495 -0.777 0.248 (0.588) (0.574) (0.557) (0.281) Debt/total assets (T) -2.580** 2.256** 0.551 -0.0642 (1.226) (1.106) (1.326) (0.696) Log (no. of employees) (T) 0.036 0.056 -0.149 -0.078 (0.101) (0.132) (0.122) (0.149) Industry fixed effects Yes Yes Yes Yes Time fixed effects Yes Yes Yes Yes N 95 86 68 63 R2 0.28 0.21 0.20 0.22 adj. R2 0.1337 0.0296 -0.0543 -0.0319
All companies with non-zero C.F. rights by public pension funds are included in the sample. Regressions are run by Ordinary Least Squares method. The dependent variable in all equations is (T+1) Public pension fund C.F. rights,
(T+1) Public pension fund C.F. rights= Public pension fund C.F. rights( T+1) - Public pension fund C.F. rights (T). (T) Market-to-Book = Market-to-Book (T) - Market-to-Book (T-1)
Multiple shares is a dummy variable that takes a value of 1 if there are dual class shares in a company. Robust standard errors clustered by firm are in parentheses. Significance level: * p<.10, ** p<.05, *** p<.01. C.F. - cash flow
There is a positive and significant impact of changes in Market-to-Book on future public pension fund ownership in the years 2002, 2004 (after their major restructuring in 2000-2001). Note that the (T)Market-to-Book coefficient for the period 2007-2008 is negatively significant. This period coincides with the start of financial crisis. As equity suffered more compared to debt type securities, public pension funds sold a portion of their company shares. It is generally easier to sell liquid shares. As high Market-to-Book shares are more liquid (Fang et al., 2009), public pension funds have probably sold these shares during this period.
To investigate whether there is a positive relationship between changes in public pension fund ownership and future changes in Market-to-Book ratio, which is suggested by efficient pension fund corporate activism proponents, I run appropriate regressions with the following control variables: the ownership percentage of the largest shareholder; the firm’s size (as measured by the logarithm of the total number of employees); the debt normalised by total assets; illiquidity measure; and industry and time fixed effects, all measured at time “T” (Table 9).
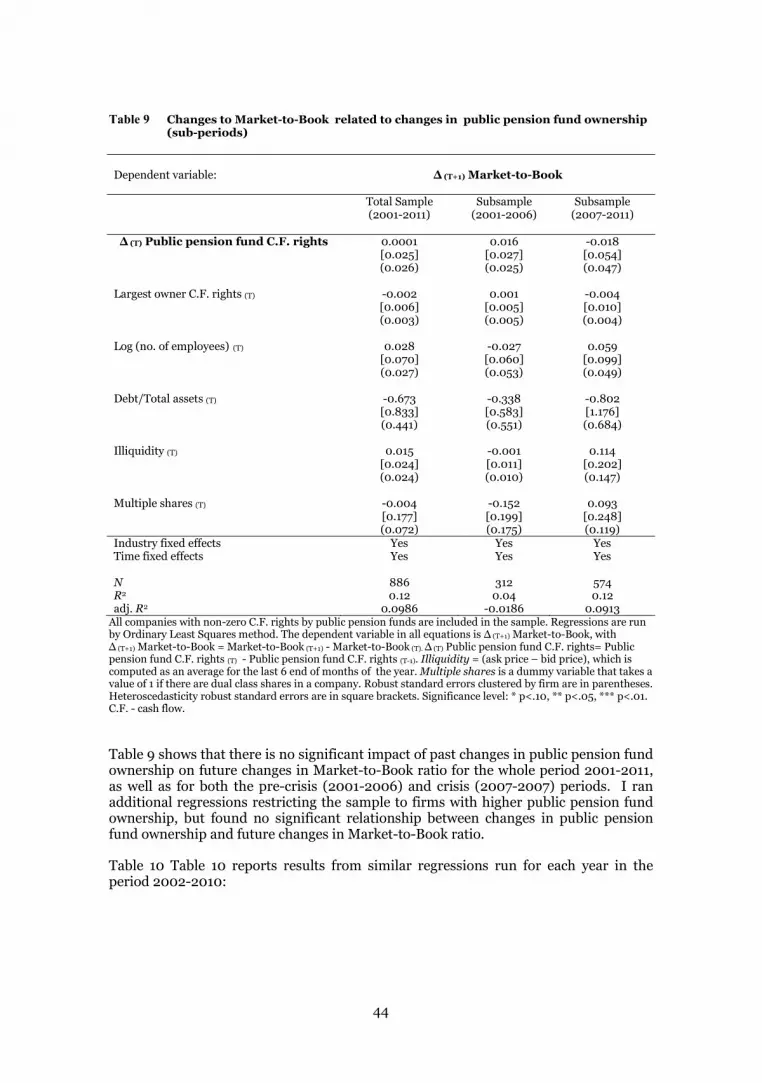
44
Table 9 Changes to Market-to-Book related to changes in public pension fund ownership (sub-periods)
Dependent variable:
(T+1) Market-to-Book
Total Sample
(2001-2011) Subsample
(2001-2006)
Subsample (2007-2011)
(T) Public pension fund C.F. rights 0.0001
[0.025] 0.016
[0.027] -0.018 [0.054]
(0.026) (0.025) (0.047) Largest owner C.F. rights (T) -0.002
[0.006] 0.001
[0.005] -0.004 [0.010]
(0.003) (0.005) (0.004) Log (no. of employees) (T) 0.028
[0.070] -0.027 [0.060]
0.059 [0.099]
(0.027) (0.053) (0.049) Debt/Total assets (T) -0.673
[0.833] -0.338 [0.583]
-0.802 [1.176]
(0.441) (0.551) (0.684) Illiquidity (T) 0.015
[0.024] -0.001 [0.011]
0.114 [0.202]
(0.024) (0.010) (0.147) Multiple shares (T) -0.004
[0.177] -0.152 [0.199]
0.093 [0.248]
(0.072) (0.175) (0.119) Industry fixed effects Yes Yes Yes Time fixed effects Yes Yes Yes N 886 312 574 R2 0.12 0.04 0.12 adj. R2 0.0986 -0.0186 0.0913
All companies with non-zero C.F. rights by public pension funds are included in the sample. Regressions are run by Ordinary Least Squares method. The dependent variable in all equations is (T+1) Market-to-Book, with
(T+1) Market-to-Book = Market-to-Book (T+1) - Market-to-Book (T). (T) Public pension fund C.F. rights= Public pension fund C.F. rights (T) - Public pension fund C.F. rights (T-1). Illiquidity = (ask price – bid price), which is computed as an average for the last 6 end of months of the year. Multiple shares is a dummy variable that takes a value of 1 if there are dual class shares in a company. Robust standard errors clustered by firm are in parentheses. Heteroscedasticity robust standard errors are in square brackets. Significance level: * p<.10, ** p<.05, *** p<.01. C.F. - cash flow.
Table 9 shows that there is no significant impact of past changes in public pension fund ownership on future changes in Market-to-Book ratio for the whole period 2001-2011, as well as for both the pre-crisis (2001-2006) and crisis (2007-2007) periods. I ran additional regressions restricting the sample to firms with higher public pension fund ownership, but found no significant relationship between changes in public pension fund ownership and future changes in Market-to-Book ratio.
Table 10 Table 10 reports results from similar regressions run for each year in the period 2002-2010:
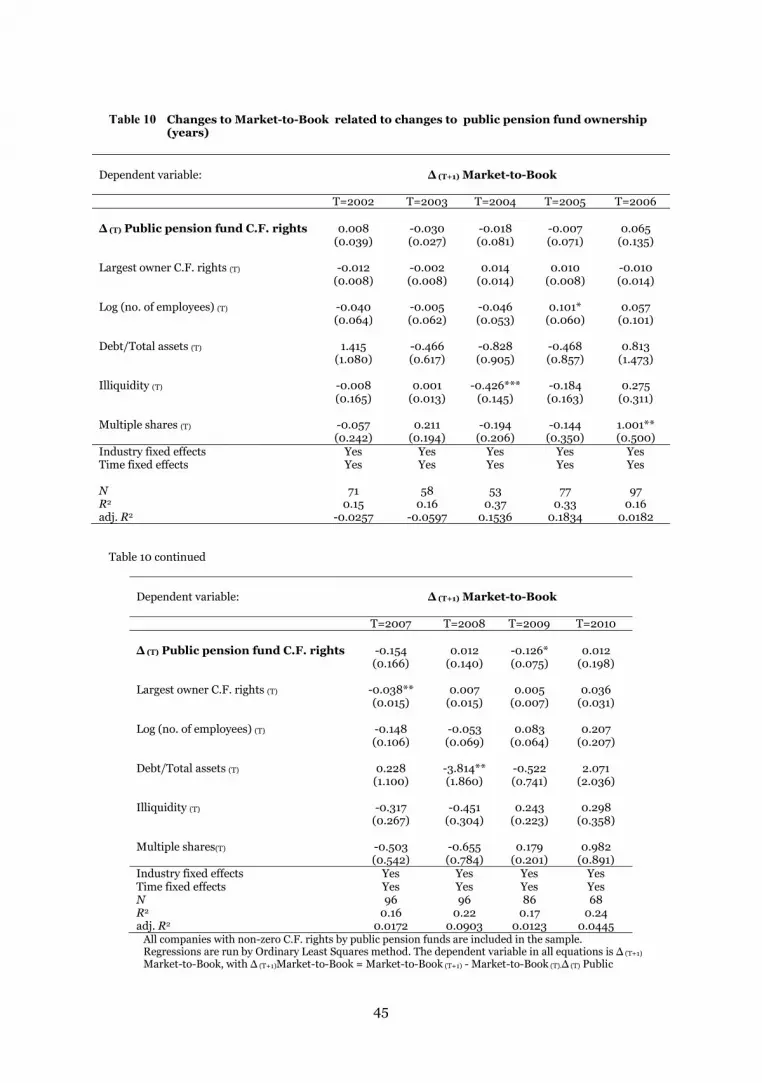
45
Table 10 Changes to Market-to-Book related to changes to public pension fund ownership (years)
Dependent variable:
(T+1) Market-to-Book
T=2002 T=2003 T=2004 T=2005 T=2006
(T) Public pension fund C.F. rights 0.008 -0.030 -0.018 -0.007 0.065
(0.039) (0.027) (0.081) (0.071) (0.135) Largest owner C.F. rights (T) -0.012 -0.002 0.014 0.010 -0.010 (0.008) (0.008) (0.014) (0.008) (0.014) Log (no. of employees) (T) -0.040 -0.005 -0.046 0.101* 0.057 (0.064) (0.062) (0.053) (0.060) (0.101) Debt/Total assets (T) 1.415 -0.466 -0.828 -0.468 0.813 (1.080) (0.617) (0.905) (0.857) (1.473) Illiquidity (T) -0.008 0.001 -0.426*** -0.184 0.275 (0.165) (0.013) (0.145) (0.163) (0.311) Multiple shares (T) -0.057 0.211 -0.194 -0.144 1.001** (0.242) (0.194) (0.206) (0.350) (0.500) Industry fixed effects Yes Yes Yes Yes Yes Time fixed effects Yes Yes Yes Yes Yes
N 71 58 53 77 97 R2 0.15 0.16 0.37 0.33 0.16 adj. R2 -0.0257 -0.0597 0.1536 0.1834 0.0182
Table 10 continued
Dependent variable:
(T+1) Market-to-Book
T=2007 T=2008 T=2009 T=2010
(T) Public pension fund C.F. rights -0.154 0.012 -0.126* 0.012
(0.166) (0.140) (0.075) (0.198) Largest owner C.F. rights (T) -0.038** 0.007 0.005 0.036 (0.015) (0.015) (0.007) (0.031) Log (no. of employees) (T) -0.148 -0.053 0.083 0.207 (0.106) (0.069) (0.064) (0.207) Debt/Total assets (T) 0.228 -3.814** -0.522 2.071 (1.100) (1.860) (0.741) (2.036) Illiquidity (T) -0.317 -0.451 0.243 0.298 (0.267) (0.304) (0.223) (0.358) Multiple shares(T) -0.503 -0.655 0.179 0.982 (0.542) (0.784) (0.201) (0.891) Industry fixed effects Yes Yes Yes Yes Time fixed effects Yes Yes Yes Yes N 96 96 86 68 R2 0.16 0.22 0.17 0.24 adj. R2 0.0172 0.0903 0.0123 0.0445
All companies with non-zero C.F. rights by public pension funds are included in the sample. Regressions are run by Ordinary Least Squares method. The dependent variable in all equations is (T+1) Market-to- (T+1)Market-to-Book = Market-to-Book (T+1) - Market-to-Book (T). (T) Public

46
pension fund C.F. rights= Public pension fund C.F. rights (T) - Public pension fund C.F. rights (T-1); Illiquidity = (ask price – bid price), which is computed as an average for the last 6 end of months of the year. Multiple shares is a dummy variable that takes a value of 1 if there are dual class shares in a company. Robust standard errors clustered by firm are in parentheses. Significance level: * p<.10, ** p<.05, *** p<.01. C.F. - cash flow.
There is no relationship between past change in pension fund ownership and future changes in Market-to-Book ratio in any of the sample years, except for 2009, which is negatively significant, and is therefore not in line with public pension fund activism claims.
Analysis in this section revealed a positive and significant impact of past changes in Market-to-Book ratio on future changes in public pension fund ownership for the period before the financial crisis that started in 2007-2008. Changes in public pension fund ownership did not influence future changes in Market-to-Book ratio observed in the sample of firms. Thus, the finding does not reject the selection hypothesis tested for public pension funds.
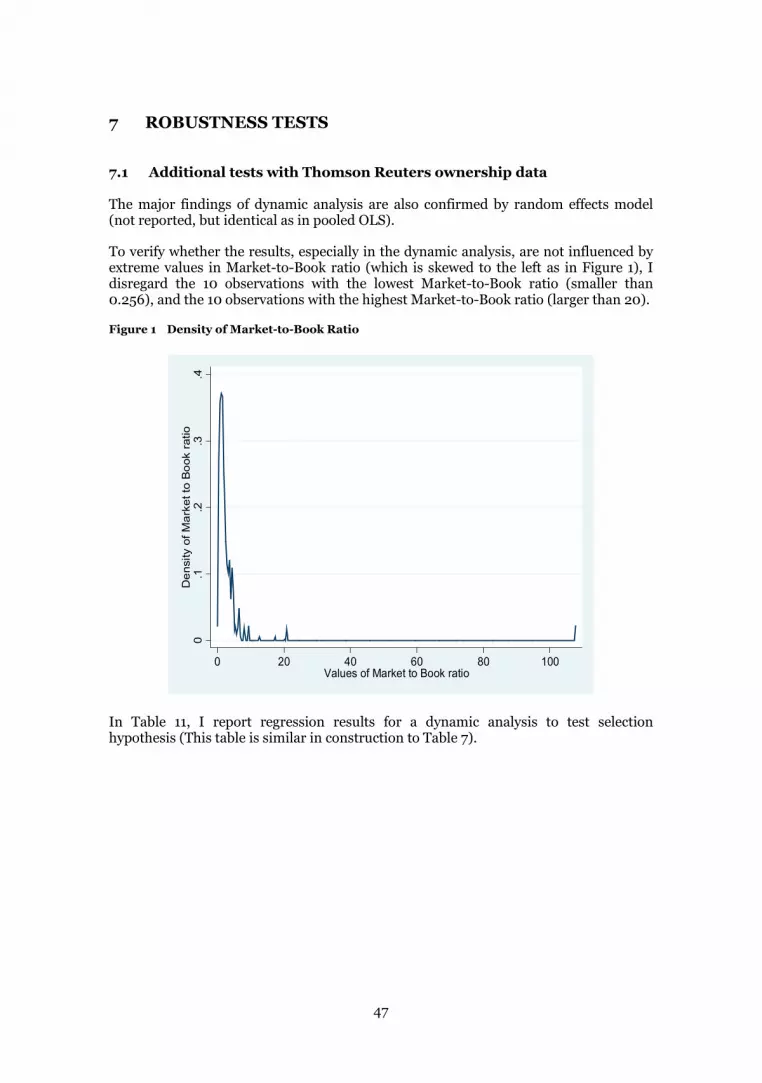
47
7 ROBUSTNESS TESTS
7.1 Additional tests with Thomson Reuters ownership data
The major findings of dynamic analysis are also confirmed by random effects model (not reported, but identical as in pooled OLS).
To verify whether the results, especially in the dynamic analysis, are not influenced by extreme values in Market-to-Book ratio (which is skewed to the left as in Figure 1), I disregard the 10 observations with the lowest Market-to-Book ratio (smaller than 0.256), and the 10 observations with the highest Market-to-Book ratio (larger than 20).
Figure 1 Density of Market-to-Book Ratio
In Table 11, I report regression results for a dynamic analysis to test selection hypothesis (This table is similar in construction to Table 7).
0.1
.2.3
.4D
ensi
ty o
f Mar
ket t
o B
ook
ratio
0 20 40 60 80 100Values of Market to Book ratio
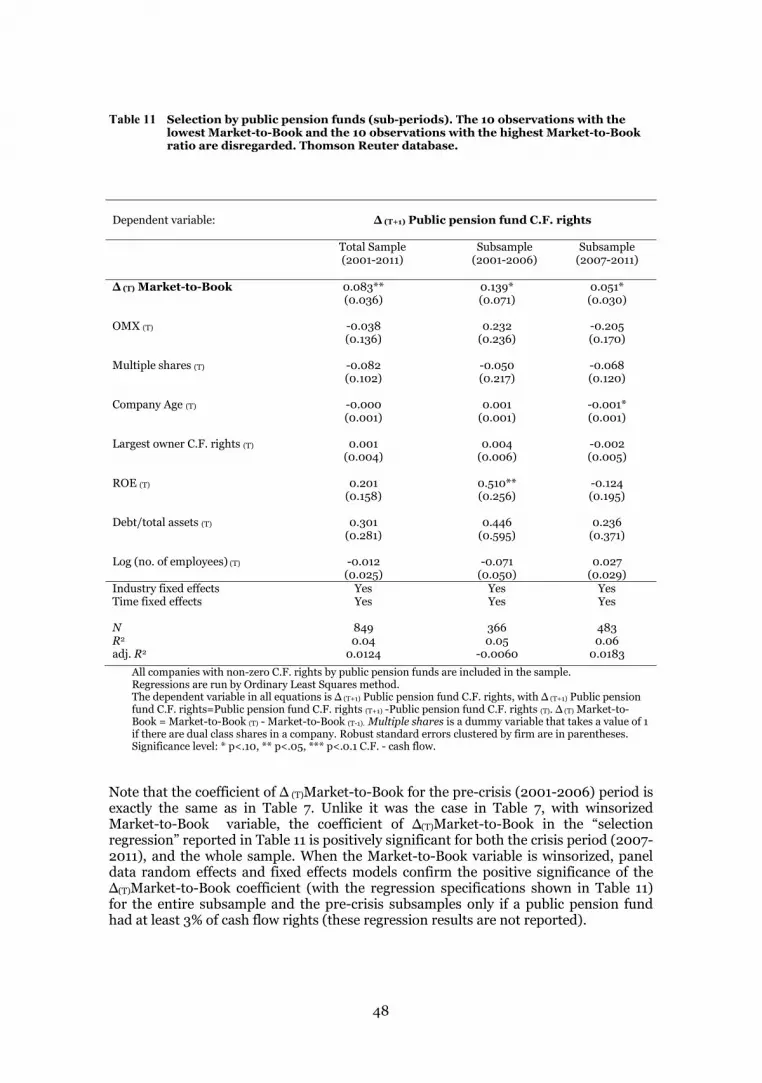
48
Table 11 Selection by public pension funds (sub-periods). The 10 observations with the lowest Market-to-Book and the 10 observations with the highest Market-to-Book ratio are disregarded. Thomson Reuter database.
All companies with non-zero C.F. rights by public pension funds are included in the sample. Regressions are run by Ordinary Least Squares method. The dependent variable in all equations is (T+1) (T+1) Public pension fund C.F. rights=Public pension fund C.F. rights (T+1) -Public pension fund C.F. rights (T). (T) Market-to-Book = Market-to-Book (T) - Market-to-Book (T-1). Multiple shares is a dummy variable that takes a value of 1 if there are dual class shares in a company. Robust standard errors clustered by firm are in parentheses. Significance level: * p<.10, ** p<.05, *** p<.0.1 C.F. - cash flow.
Note that the (T)Market-to-Book for the pre-crisis (2001-2006) period is exactly the same as in Table 7. Unlike it was the case in Table 7, with winsorized Market-to-Book variable, the coefficient of (T)Market-to-Book in the “selection regression” reported in Table 11 is positively significant for both the crisis period (2007-2011), and the whole sample. When the Market-to-Book variable is winsorized, panel data random effects and fixed effects models confirm the positive significance of the
(T)Market-to-Book coefficient (with the regression specifications shown in Table 11) for the entire subsample and the pre-crisis subsamples only if a public pension fund had at least 3% of cash flow rights (these regression results are not reported).
Dependent variable:
(T+1) Public pension fund C.F. rights
Total Sample
(2001-2011) Subsample
(2001-2006)
Subsample (2007-2011)
(T) Market-to-Book 0.083** 0.139* 0.051* (0.036) (0.071) (0.030) OMX (T) -0.038 0.232 -0.205 (0.136) (0.236) (0.170) Multiple shares (T) -0.082 -0.050 -0.068 (0.102) (0.217) (0.120) Company Age (T) -0.000 0.001 -0.001* (0.001) (0.001) (0.001) Largest owner C.F. rights (T) 0.001 0.004 -0.002 (0.004) (0.006) (0.005) ROE (T) 0.201 0.510** -0.124 (0.158) (0.256) (0.195) Debt/total assets (T) 0.301 0.446 0.236 (0.281) (0.595) (0.371) Log (no. of employees) (T) -0.012 -0.071 0.027 (0.025) (0.050) (0.029) Industry fixed effects Yes Yes Yes Time fixed effects Yes Yes Yes N 849 366 483 R2 0.04 0.05 0.06 adj. R2 0.0124 -0.0060 0.0183
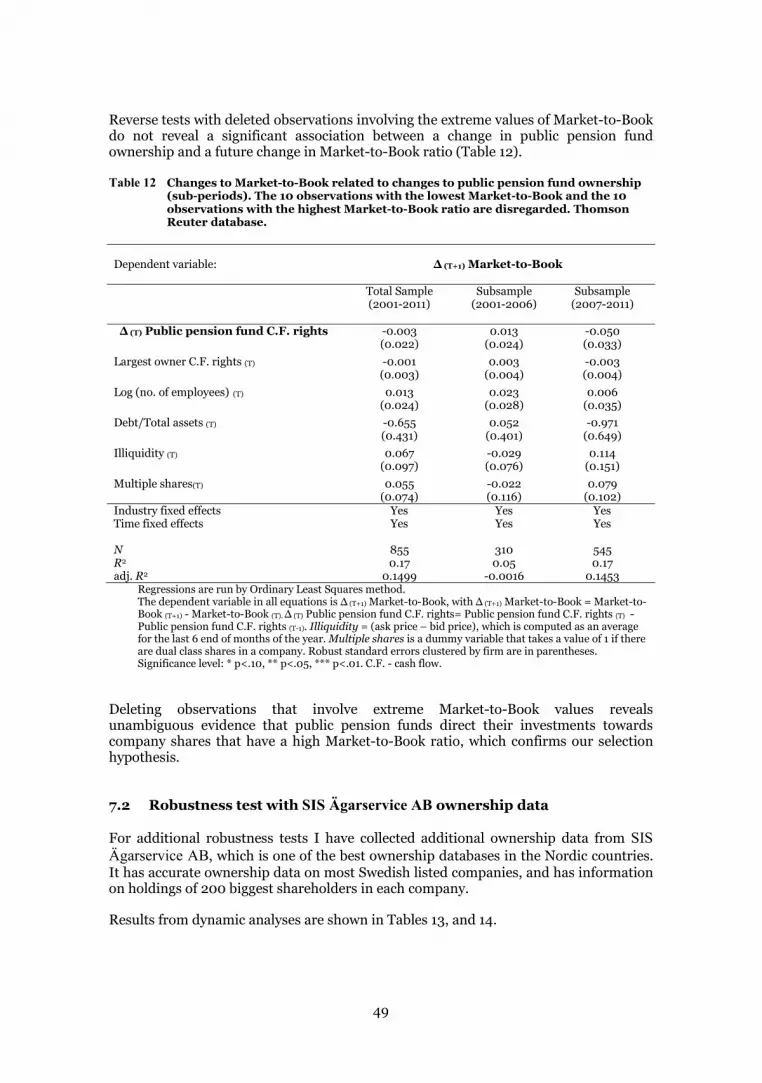
49
Reverse tests with deleted observations involving the extreme values of Market-to-Book do not reveal a significant association between a change in public pension fund ownership and a future change in Market-to-Book ratio (Table 12).
Table 12 Changes to Market-to-Book related to changes to public pension fund ownership (sub-periods). The 10 observations with the lowest Market-to-Book and the 10 observations with the highest Market-to-Book ratio are disregarded. Thomson Reuter database.
Dependent variable:
(T+1) Market-to-Book
Total Sample
(2001-2011) Subsample
(2001-2006)
Subsample (2007-2011)
(T) Public pension fund C.F. rights -0.003 0.013 -0.050
(0.022) (0.024) (0.033)
Largest owner C.F. rights (T) -0.001 0.003 -0.003 (0.003) (0.004) (0.004)
Log (no. of employees) (T) 0.013 0.023 0.006 (0.024) (0.028) (0.035)
Debt/Total assets (T) -0.655 0.052 -0.971 (0.431) (0.401) (0.649)
Illiquidity (T) 0.067 -0.029 0.114 (0.097) (0.076) (0.151)
Multiple shares(T) 0.055 -0.022 0.079 (0.074) (0.116) (0.102) Industry fixed effects Yes Yes Yes Time fixed effects Yes Yes Yes N 855 310 545 R2 0.17 0.05 0.17 adj. R2 0.1499 -0.0016 0.1453
Regressions are run by Ordinary Least Squares method. The dependent variable in all equations is (T+1) Market-to- (T+1) Market-to-Book = Market-to-Book (T+1) - Market-to-Book (T). (T) Public pension fund C.F. rights= Public pension fund C.F. rights (T) - Public pension fund C.F. rights (T-1). Illiquidity = (ask price – bid price), which is computed as an average for the last 6 end of months of the year. Multiple shares is a dummy variable that takes a value of 1 if there are dual class shares in a company. Robust standard errors clustered by firm are in parentheses. Significance level: * p<.10, ** p<.05, *** p<.01. C.F. - cash flow.
Deleting observations that involve extreme Market-to-Book values reveals unambiguous evidence that public pension funds direct their investments towards company shares that have a high Market-to-Book ratio, which confirms our selection hypothesis.
7.2 Robustness test with SIS Ägarservice AB ownership data
For additional robustness tests I have collected additional ownership data from SIS Ägarservice AB, which is one of the best ownership databases in the Nordic countries. It has accurate ownership data on most Swedish listed companies, and has information on holdings of 200 biggest shareholders in each company.
Results from dynamic analyses are shown in Tables 13, and 14.

50
Unlike it was the case with Thomson Reuters database, I have obtained information on both cash flow as well as voting rights in companies from SIS Ägarservice AB. I have thus been able to compute an additional control variable - Wedge ratio (computed as the ratio between the voting and cash flow rights of the largest owner), which I use alternately with Multiple shares dummy (the variable that takes a value of 1 if there are dual class shares in a company).
According to the results, for the whole subsample (2001-2011), change in Market-to-Book is positively and significantly related to future change in public pension fund ownership irrespective of whether we employ Wedge ratio or Multiple shares dummy. This relationship also holds true for pooled OLS and panel data models10.
In the subsample before the financial crises (2001-2006), there is a positive relationship between Market-to-Book ratio and future change in public pension fund ownership only when Multiple shares dummy is included instead of Wedge ratio variable.
In contrast, in the regressions in the financial crisis subsample (2007-2011) the inclusion of Wedge ratio variable identifies a positive relationship between Market-to-Book ratio and future change in public pension fund ownership, unlike it is the case with the inclusion of Multiple shares variable.
I apply the same regression strategy in reverse regression in Table 14. I find no significant positive relationship between a change in public pension fund ownership and a future change in Market-to-Book ratio. This non-significance holds true across all specifications and regression models.
In general, the SIS Ägarservice AB ownership database provides stronger evidence for public pension funds selecting firms with a high market value.
10 Random effect models give identical results as pooled OLS
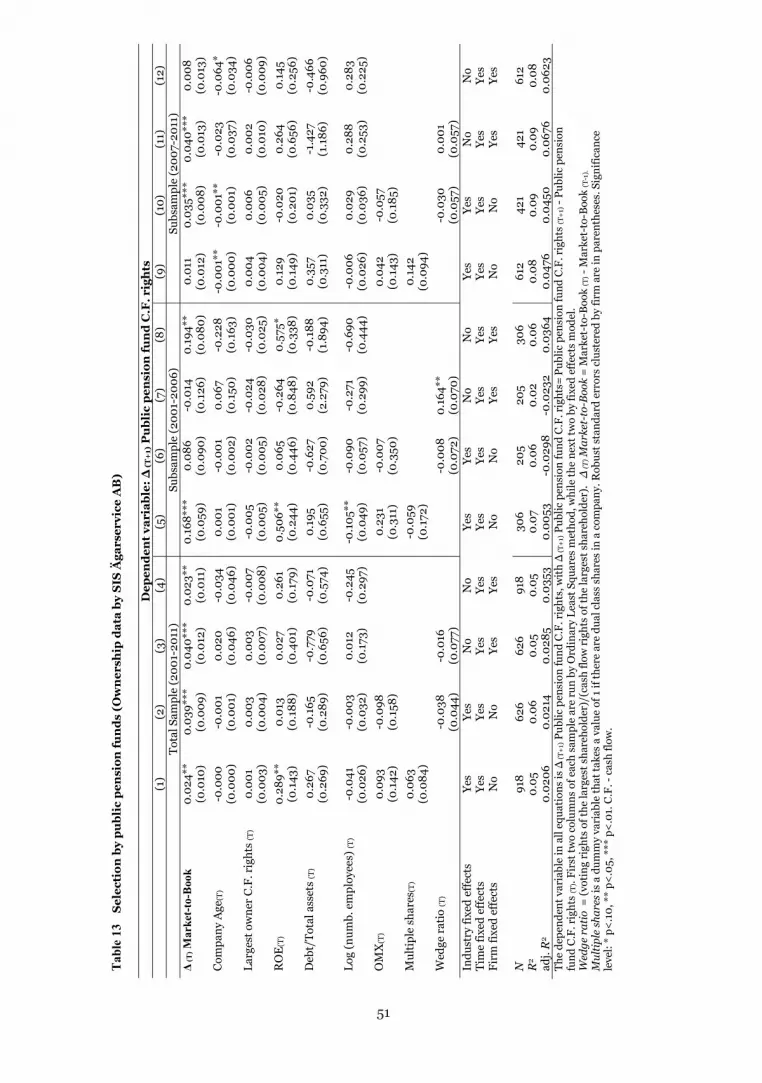
Tab
le 1
3 S
elec
tion
by
pu
blic
pen
sion
fun
ds
(Ow
ner
ship
dat
a by
SIS
Äga
rser
vice
AB
)
(T
+1)
Pu
blic
pen
sion
fun
d C
.F. r
igh
ts
(1
) (2
) (3
) (4
) (5
) (6
) (7
) (8
) (9
) (1
0)
(11)
(1
2)
To
tal S
ampl
e (2
001-
2011
) Su
bsam
ple
(200
1-20
06)
Subs
ampl
e (2
007-
2011
) (T
) Mar
ket-
to-B
ook
0.02
4**
0.03
9***
0.
040*
**
0.02
3**
0.16
8***
0.
086
-0.0
14
0.19
4**
0.01
1 0.
035*
**
0.04
0***
0.
008
(0
.010
) (0
.009
) (0
.012
) (0
.011
) (0
.059
) (0
.090
) (0
.126
) (0
.080
) (0
.012
) (0
.008
) (0
.013
) (0
.013
)
Com
pany
Age
(T)
-0.0
00
-0.0
01
0.02
0 -0
.034
0.
001
-0.0
01
0.06
7 -0
.228
-0
.001
**
-0.0
01**
-0
.023
-0
.064
*
(0.0
00)
(0.0
01)
(0.0
46)
(0.0
46)
(0.0
01)
(0.0
02)
(0.1
50)
(0.1
63)
(0.0
00)
(0.0
01)
(0.0
37)
(0.0
34)
Larg
est o
wne
r C
.F. r
ight
s (T
) 0.
001
0.00
3 0.
003
-0.0
07
-0.0
05
-0.0
02
-0.0
24
-0.0
30
0.00
4 0.
006
0.00
2 -0
.006
(0.0
03)
(0.0
04)
(0.0
07)
(0.0
08)
(0.0
05)
(0.0
05)
(0.0
28)
(0.0
25)
(0.0
04)
(0.0
05)
(0.0
10)
(0.0
09)
RO
E(T
) 0.
289*
* 0.
013
0.02
7 0.
261
0.50
6**
0.06
5 -0
.264
0.
575*
0.
129
-0.0
20
0.26
4 0.
145
(0
.143
) (0
.188
) (0
.401
) (0
.179
) (0
.244
) (0
.446
) (0
.848
) (0
.338
) (0
.149
) (0
.201
) (0
.656
) (0
.256
)
Deb
t/To
tal a
sset
s (T
) 0.
267
-0.1
65
-0.7
79
-0.0
71
0.19
5 -0
.627
0.
592
-0.1
88
0.35
7 0.
035
-1.4
27
-0.4
66
(0
.269
) (0
.289
) (0
.656
) (0
.574
) (0
.655
) (0
.700
) (2
.279
) (1
.894
) (0
.311
) (0
.332
) (1
.186
) (0
.960
)
Log
(num
b. e
mpl
oyee
s) (T
) -0
.041
-0
.003
0.
012
-0.2
45
-0.1
05**
-0
.090
-0
.271
-0
.690
-0
.006
0.
029
0.28
8 0.
283
(0
.026
) (0
.032
) (0
.173
) (0
.297
) (0
.049
) (0
.057
) (0
.299
) (0
.444
) (0
.026
) (0
.036
) (0
.253
) (0
.225
)
OM
X(T
) 0.
093
-0.0
98
0.23
1 -0
.007
0.
042
-0.0
57
(0
.142
) (0
.158
)
(0
.311
) (0
.350
)
(0
.143
) (0
.185
)
Mul
tipl
e sh
ares
(T)
0.
063
-0
.059
0.14
2
(0
.084
)
(0.1
72)
(0
.094
)
Wed
ge r
atio
(T)
-0.0
38
-0.0
16
-0.0
08
0.16
4**
-0.0
30
0.00
1
(0.0
44)
(0.0
77)
(0.0
72)
(0.0
70)
(0.0
57)
(0.0
57)
In
dust
ry fi
xed
effe
cts
Yes
Yes
No
No
Yes
Yes
No
No
Yes
Yes
No
No
Tim
e fix
ed e
ffec
ts
Yes
Yes
Yes
Yes
Yes
Yes
Yes
Yes
Yes
Yes
Yes
Yes
Firm
fixe
d ef
fect
s N
o N
o Ye
s Ye
s N
o N
o Ye
s Ye
s N
o N
o Ye
s Ye
s
N
918
626
626
918
306
205
205
306
612
421
421
612
R2
0.05
0.
06
0.05
0.
05
0.07
0.
06
0.02
0.
06
0.08
0.
09
0.09
0.
08
adj.
R2
0.02
06
0.02
14
0.02
85
0.03
53
0.00
53
-0.0
298
-0.0
232
0.03
64
0.04
76
0.04
50
0.06
76
0.06
23
The
depe
nden
t var
iabl
e in
all
equa
tion
s is
(T
+1)
(T
+1)
Pub
lic p
ensi
on fu
nd C
.F. r
ight
s= P
ublic
pen
sion
fund
C.F
. rig
hts
(T+
1) -
Publ
ic p
ensi
on
fund
C.F
. rig
hts
(T).
Firs
t tw
o co
lum
ns o
f eac
h sa
mpl
e ar
e ru
n by
Ord
inar
y Le
ast S
quar
es m
etho
d, w
hile
the
next
two
by fi
xed
effe
cts
mod
el.
Wed
ge r
atio
= (v
otin
g ri
ghts
of t
he la
rges
t sha
reho
lder
)/(c
ash
flow
rig
hts
of th
e la
rges
t sha
reho
lder
).
(T) M
arke
t-to
-Boo
k =
Mar
ket-
to-B
ook
(T) -
Mar
ket-
to-B
ook
(T-1
).
Mul
tipl
e sh
ares
is a
dum
my
vari
able
that
take
s a
valu
e of
1 if
ther
e ar
e du
al c
lass
sha
res
in a
com
pany
. Rob
ust s
tand
ard
erro
rs c
lust
ered
by
firm
are
in p
aren
thes
es. S
igni
fican
ce
leve
l: *
p<.1
0, *
* p<
.05,
***
p<
.01.
C.F
. - c
ash
flow
.
51
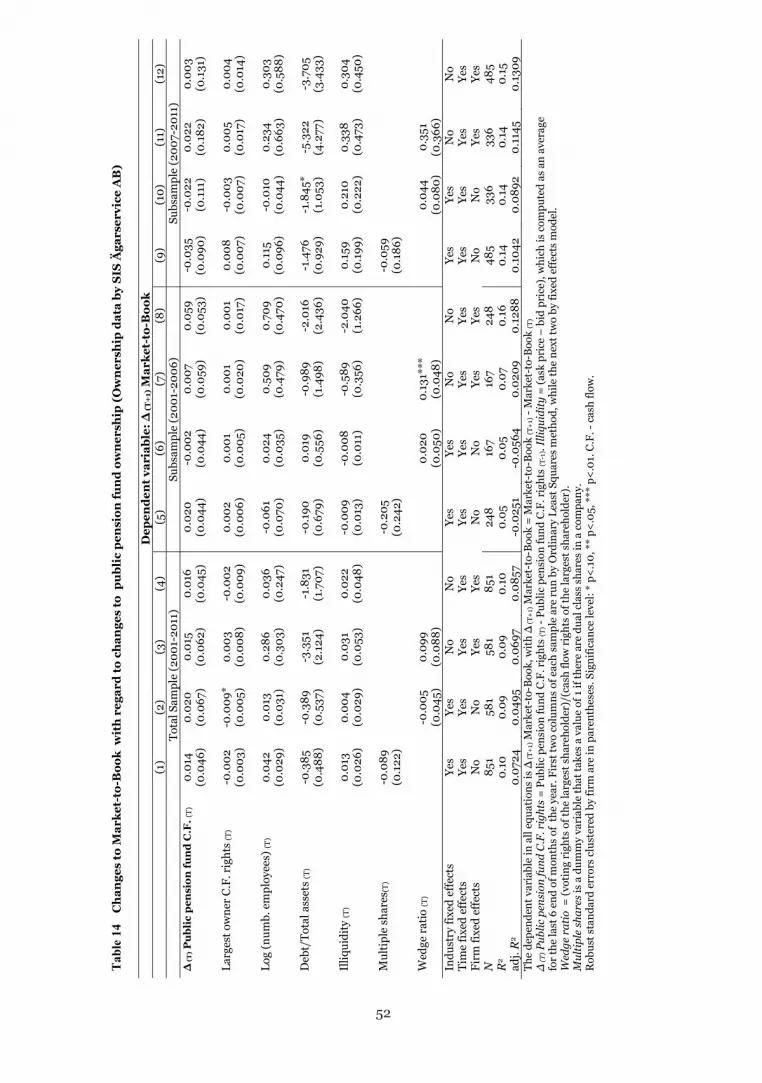
Tab
le 1
4 C
han
ges
to M
arke
t-to
-Boo
k w
ith
reg
ard
to
chan
ges
to p
ubl
ic p
ensi
on fu
nd
ow
ner
ship
(O
wn
ersh
ip d
ata
by S
IS Ä
gars
ervi
ce A
B)
(
T+
1) M
arke
t-to
-Boo
k
(1)
(2)
(3)
(4)
(5)
(6)
(7)
(8)
(9)
(10)
(1
1)
(12)
Tota
l Sam
ple
(200
1-20
11)
Subs
ampl
e (2
001-
2006
) Su
bsam
ple
(200
7-20
11)
(T
) Pu
blic
pen
sion
fun
d C
.F. (
T)
0.01
4 0.
020
0.01
5 0.
016
0.02
0 -0
.002
0.
007
0.05
9 -0
.035
-0
.022
0.
022
0.00
3
(0.0
46)
(0.0
67)
(0.0
62)
(0.0
45)
(0.0
44)
(0.0
44)
(0.0
59)
(0.0
53)
(0.0
90)
(0.1
11)
(0.1
82)
(0.1
31)
La
rges
t ow
ner
C.F
. rig
hts
(T)
-0.0
02
-0.0
09*
0.00
3 -0
.002
0.
002
0.00
1 0.
001
0.00
1 0.
008
-0.0
03
0.00
5 0.
004
(0
.003
) (0
.005
) (0
.008
) (0
.009
) (0
.006
) (0
.005
) (0
.020
) (0
.017
) (0
.007
) (0
.007
) (0
.017
) (0
.014
)
Log
(num
b. e
mpl
oyee
s) (T
) 0.
042
0.01
3 0.
286
0.03
6 -0
.061
0.
024
0.50
9 0.
709
0.11
5 -0
.010
0.
234
0.30
3
(0.0
29)
(0.0
31)
(0.3
03)
(0.2
47)
(0.0
70)
(0.0
35)
(0.4
79)
(0.4
70)
(0.0
96)
(0.0
44)
(0.6
63)
(0.5
88)
D
ebt/
Tota
l ass
ets
(T)
-0.3
85
-0.3
89
-3.3
51
-1.8
31
-0.1
90
0.01
9 -0
.989
-2
.016
-1
.476
-1
.845
* -5
.322
-3
.705
(0.4
88)
(0.5
37)
(2.1
24)
(1.7
07)
(0.6
79)
(0.5
56)
(1.4
98)
(2.4
36)
(0.9
29)
(1.0
53)
(4.2
77)
(3.4
33)
Il
liqui
dity
(T)
0.01
3 0.
004
0.03
1 0.
022
-0.0
09
-0.0
08
-0.5
89
-2.0
40
0.15
9 0.
210
0.33
8 0.
304
(0
.026
) (0
.029
) (0
.053
) (0
.048
) (0
.013
) (0
.011
) (0
.356
) (1
.266
) (0
.199
) (0
.222
) (0
.473
) (0
.450
)
Mul
tipl
e sh
ares
(T)
-0
.089
-0.2
05
-0
.059
(0
.122
)
(0.2
42)
(0
.186
)
W
edge
rat
io (T
)
-0
.005
0.
099
0.02
0 0.
131*
**
0.04
4 0.
351
(0
.045
) (0
.088
)
(0
.050
) (0
.048
)
(0
.080
) (0
.366
)
Indu
stry
fixe
d ef
fect
s Ye
s Ye
s N
o N
o Ye
s Ye
s N
o N
o Ye
s Ye
s N
o N
o Ti
me
fixed
eff
ects
Ye
s Ye
s Ye
s Ye
s Ye
s Ye
s Ye
s Ye
s Ye
s Ye
s Ye
s Ye
s Fi
rm fi
xed
effe
cts
No
No
Yes
Yes
No
No
Yes
Yes
No
No
Yes
Yes
N
851
581
581
851
248
167
167
248
485
336
336
485
R2
0.10
0.
09
0.09
0.
10
0.05
0.
05
0.07
0.
16
0.14
0.
14
0.14
0.
15
adj.
R2
0.07
24
0.04
95
0.06
97
0.08
57
-0.0
251
-0.0
564
0.02
09
0.12
88
0.10
42
0.08
92
0.11
45
0.13
09
The
depe
nden
t var
iabl
e in
all
equa
tion
s is
(T
+1)
Mar
ket-
to-
(T+
1) M
arke
t-to
-Boo
k =
Mar
ket-
to-B
ook
(T+
1) -
Mar
ket-
to-B
ook
(T)
(T) P
ublic
pen
sion
fund
C.F
. rig
hts
= P
ublic
pen
sion
fund
C.F
. rig
hts
(T) -
Pub
lic p
ensi
on fu
nd C
.F. r
ight
s (T
-1).
Illiq
uidi
ty =
(ask
pri
ce –
bid
pri
ce),
whi
ch is
com
pute
d as
an
aver
age
for
the
last
6 e
nd o
f mon
ths
of t
he y
ear.
Fir
st tw
o co
lum
ns o
f eac
h sa
mpl
e ar
e ru
n by
Ord
inar
y Le
ast S
quar
es m
etho
d, w
hile
the
next
two
by fi
xed
effe
cts
mod
el.
Wed
ge r
atio
= (v
otin
g ri
ghts
of t
he la
rges
t sha
reho
lder
)/(c
ash
flow
rig
hts
of th
e la
rges
t sha
reho
lder
).
M
ulti
ple
shar
es is
a d
umm
y va
riab
le th
at ta
kes
a va
lue
of 1
if th
ere
are
dual
cla
ss s
hare
s in
a c
ompa
ny.
Rob
ust s
tand
ard
erro
rs c
lust
ered
by
firm
are
in p
aren
thes
es. S
igni
fican
ce le
vel:
* p<
.10,
**
p<.0
5, *
** p
<.0
1. C
.F. -
cas
h flo
w.
52

53
8 CONCLUSION
In this study, I have analysed the relationship between the market value (measured by Market-to-Book ratio) of Stockholm listed companies and pension fund ownership in the restructured Swedish pension system for the period 2001-2011.
In line with the previous research of Giannetti & Laeven (2009) I have found that public pension funds (the AP funds of the Swedish pension system) are positively related, and premium pension funds are not related to the market value of the Swedish firms in the sample.
In further analysis I have found that changes in Market-to-Book ratio are positively and significantly related to future changes in public pension fund holdings. A reverse relationship between changes in public pension fund ownership and future changes in Market-to-Book ratio does not hold. The dynamic relationship therefore confirms the hypothesis of public pension funds selecting firms with high market value.
I therefore claim that the positive correlation between the contemporaneous market value of firms and public pension fund ownership is the result of these funds’ preference for investing in firms valued high by the market.
54
REFERENCES
Ali A., Durtschi C., Lev B, Trombley M., 2004, “Changes in Institutional Ownership and Subsequent Earnings Announcement Abnormal Returns”, Journal of Accounting, Auditing, & Finance 19, pp. 221–48.
Clark G, Hebb T. 2004, “Pension Fund Corporate Engagement: The Fifth Stage of Capitalism”, Industrial Relations, Vol. 59 (1) pp. 142–171.
Cornett M., Marcus A., Saunders A., Tehranian H., 2007, “The impact of institutional ownership on corporate governance performance”, Journal of Banking & Finance 31, pp. 1771-1794
Del Guercio D., 1996, “The distorting effect of the prudent-man laws on institutional equity investments”, Journal of Financial Economics, Vol. 40, No 1, pp. 31-62
Del Guercio D., Hawkins J., 1999, “The motivation and impact of pension fund activism”, Journal of Financial Economics, 52, pp. 293-340
Faccio M., Lasfer, M., 2002, “Institutional Shareholders and Corporate Governance: The Case of U.K. Pension Funds”, in J. McCahery et al. (eds.), Corporate Governance Regimes: Convergence and Diversity, (Oxford University Press: Oxford), pp. 603-624
Fang V., Noe T., Tice S., 2009, “Stock market liquidity and firm value”, Journal of Financial Economics, 94 (2009) 150–169
Ferreira M., Matos P., 2008, “The colors of investors’ money: The role of institutional investors around the world”, Journal of Financial Economics, Volume 88, Issue 3, pp. 499–533
Giannetti M., Laeven L., 2009, “Pension reform, ownership structure, and corporate governance: Evidence from a natural experiment”, The Review of Financial Studies v 22 n 10, pp. 4091-4127
Gompers P., Metrick A, 2001, “Institutional Investors and Equity Prices”, Quarterly Journal of Economics 116, pp. 229-259
Iglesias-Palau A., 2000, “Pension reform and corporate governance: impact in Chile”, Revista ABANTE, Vol. 3, pp. 111-143
Ke B., Ramalingegowda S., 2005, “Do Institutional Investors Exploit the Post-Earnings Announcement Drift?”, Journal of Accounting & Economics 39, pp. 25-53
Lakonishok J., Shleifer V., Vishny R., 1994, “Contrarian Investment, Extrapolation, and Risk”, Journal of Finance, Vol. 49, No. 5 (Dec., 1994), pp. 1541-1578
55
Li K., Ortiz-Molina H., Zhao X., 2008, “Do Institutional Investors Care About Shareholder Rights? Evidence from Institutional Investment in Dual-Class Firms”, Financial Management, 37 (2008), 713-745
Parrino R, Sias R., Starks L., 2003, “Voting with their feet: institutional ownership changes around forced CEO turnover”, Journal of Financial Economics, Vol. 68, pp 3-46
Pedersen T., Thomsen S., 2003, “Ownership structure and value of the largest European firms: the importance of owner identity”, Journal of Management and Governance, 7, pp. 27-55.
Rebai I., 2011, “Institutional shareholders differences and corporate performance”, International Journal of Advanced Economics and Business Management, Vol No. 1 Issue No. 2, pp. 071-080
Rubach M., Terrence S., 2009, “Determinants of Institutional Investor Activism: A Test of the Ryan-Schneider Model (2002)”, Journal of Managerial Issues Vol. 21, No. 2, pp. 245-261
Ryan L. V., Schneider M., 2003, “Institutional Investor Power and Heterogeneity: Implications for Agency and Stakeholder Theories”, Business & Society December 2003 42, pp. 398-429
Wahal S., 1996, “Pension fund activism and firm performance”, Journal of Financial and Quantitative Analysis, Vol. 31, pp. 1-23
Woidtke T., 2002, “Agents watching agents? Evidence from pension fund ownership and firm value”, Journal of Financial Economics 63, pp. 99-131.
56
CORPORATE GOVERNANCE BY SWEDISH PUBLIC PENSION FUNDS1
Naufal Alimov*
Abstract
The major question addressed in this analysis is the extent to which public pension funds are able to improve the corporate governance of companies in their portfolios.
I find that Swedish public pension funds have not contributed to company boards’ increased diversity by raising the proportion of females, foreigners, or directors of a range of ages. Nor have Swedish public pension funds contributed to the promotion of independent directors, effected the non-re-election of CEOs to Boards of Directors, or decreased the wedge between cash flow and the voting rights practised by firms.
JEL Classification: G23, G28, G30, G38
Key words: Institutional investors, pension funds, corporate governance
*Hanken School of Economics, Department of Economics
1 I am grateful to Tom Berglund, Martin Holmen, Mikko Leppämäki, Tor Brunzell, Ulf Jakobsson, Praveen Malla, and Laura Arranz Aperte, as well as the participants at the Nordic Corporate Governance Workshop (Copenhagen), the GSF Winter Research Workshop in Finance (Helsinki), the PhD Workshop in Corporate Governance (Helsinki), seminars at the Hanken Centre for Corporate Governance for their insightful comments; and to the Marcus Wallenberg Foundation and Suomen Arvopaperimarkkinoiden Edistämissäätiö for their financial support. I am grateful to SIS Ägarservice AB for providing me with ownership data.
57
1 INTRODUCTION
With more than €100 billion at their disposal, Swedish public pension funds2 in the reformed pension system are allowed to invest in the capital market by buying Swedish companies’ equity (see this dissertation’s introduction for a detailed description of the reformed Swedish pension system). In this study I investigate the capacity of these funds to improve the corporate governance of firms in their portfolios. There are three main reasons for exploring the Swedish public pension funds’ involvement in corporate governance of firms. First, there is controversial empirical evidence concerning the involvement of institutional investors in general, and public pension funds in particular, in the governance of companies in which they own shares. Second, the Swedish pension reform has created a new group of publicly managed funds with similar mandates that can be utilised as a natural experiment in empirical research (Giannetti & Laeven, 2009). Third, many countries are considering the Swedish public pension system’s model as an alternative to their own systems, and the efficacy of these pension funds' capacity to improve the corporate governance of domestic firms may affect their choice.
Indeed, Swedish public pension funds express their desire to improve the corporate governance of firms under their ownership:
“Investments in well managed companies provide higher returns and lower risks in the long term. In view of this, an important component of Första AP-fonden’s management model is to be an active owner... The Fund’s ownership approach is founded on the conviction that engagement and setting of requirements can make a difference... The Fund works actively to influence the structure and evaluation of compensation systems and to increase the level of diversity on company boards. This influence takes place through dialogue with the company boards, participation in nominating committees and voting at general shareholder meetings.” (AP-1, 2011)
“The Fund’s corporate governance work shall: originate in the Fund’s duty to protect and grow the capital invested so as to contribute to a healthy return on investments; safeguard the best interests of shareholders and individual companies; take into account the unique circumstances and needs of each individual company; exercise the rights and obligations of its ownership role in a responsible and sustainable manner; ...” (AP-4, 2013)
To assess the capacity of Swedish public pension funds to improve firms’ corporate governance, I examine the relationship between their ownership and the state of firms’ corporate governance. In particular, I investigate whether public pension fund ownership is associated with the future diversification of boards (an increase in the age range and the proportion of females and foreigners on a Board of Directors), an increase in the proportion of independent board members, the non-re-election of CEOs to the Board of Directors, as well as a decrease in the wedge between voting and cash flow rights in companies.
The results do not support the notion that Swedish public pension funds have been effective in improving firms’ corporate governance.
2 The four buffer funds - AP-1, AP-2, AP-3, AP-4, the “evergreen” AP-6 fund (with funds inherited from the previous system), and the AP-7 premium pension fund are all labelled as Swedish public pension funds in this analysis.
58
2 LITERATURE REVIEW
According to the literature the role of institutional investors in general, and pension funds in particular, in firms’ corporate governance is not conclusive. The most optimistic claims about the role of pension funds in corporate governance are probably made by Clark & Hebb (2004). They believe that pension fund corporate engagement creates the “Fifth Stage of Capitalism”, which is unprecedented in any previous stage of corporate development. Thus, the authors argue that pension funds can exert unified action by representing a dispersed ownership.
Most studies on the institutional role in firms’ corporate governance are conducted on US and UK data. Wahal (1996) investigates the performance of firms targeted by US pension funds. The firms studied were targeted by pension funds to initiate governance-related and takeover-related shareholder proposals. The author finds no significant abnormal returns around targeting announcements. He provides evidence that pension funds have not been successful in improving the corporate performance of firms that were underperforming relative to the market. This result remains true when measuring firm performance by market-adjusted and industry-adjusted returns or accounting measures. Thus, the author concludes that monitoring by pension funds is ineffective.
A more positive view on the efficacy of pension funds’ corporate governance activism is expressed by Del Guercio & Hawkins (1999). Like Wahal (1996), they study the impact of shareholder proposals on the performance of targeted firms in the US. They argue that the lack of inefficiency of shareholder proposals by pension funds revealed in the previous literature may be the result of a lack of recognition of heterogeneity in pension funds’ motivation and tactics. Hence, the authors differentiate the funds they study with regard to the extent to which they are passively indexed or the degree to which funds rely on external or internal management. The authors compare changes in the business policies and governance of targeted firms after the announcement of shareholder proposals with those of control firms. They show that there are significantly higher corporate changes in targeted firms after pension funds’ submission of shareholder proposals. In further analysis the authors reveal that although pension fund initiated shareholder proposals were effective in bringing changes to the corporate governance of targeted firms, they had no significant impact on stock returns or accountability measures.
The positive impact of institutional investors on firms’ governance and performance is also confirmed by McConnell & Servaes (1990) and Cornett et al. (2007), among others. Hartzell & Starks (2003) conclude that high institutional ownership, especially ownership by pension funds and investment companies, is related to managers’ pay-for-performance compensation.
However, Faccio & Lasfer (2002), who study occupational pension fund ownership in the UK, claim not to have found any significant relationship between occupational pension fund holdings and the duality of CEO/board chairperson, board size, or the number of executive directors in the regression of pension fund ownership on the variables of interest.
Studies of the institutional role in corporate governance in other countries are often related to pension reforms.

59
Giannetti & Laeven (2009) analyse the relationship between Swedish pension fund ownership and the market value of firms in their portfolio after the reform at the turn of millennium. They claim that public pension funds had a positive influence, while small private pension funds had none on firms’ market valuation. The authors conclude that the positive correlation between pension fund ownership and firms’ market valuation is a result of the fact that public pension funds improve the corporate governance of firms in their portfolio.
Iglesias-Palau (2000) analyses the aftermath of the Chilean transformation from a pay-as-you-go pension system into a funded system. He argues that in spite of the restrictions of various regulations such as investment restrictions, the prohibition of joint collective agreements with other shareholders, and the publicising of opinion about the companies, pension funds had a positive impact on firms’ corporate governance. The author claims that pension fund corporate activism stimulated an increase in the election of independent-specialist board members, a decrease in monitoring costs, an increase in the number of shareholder meetings, and an improvement in bondholder protection in Chile.
60
3 HYPOTHESES
In this section I hypothesise a number of ways in which pension funds may improve the corporate governance of firms in their ownership.
It is argued that more diverse boards better understand the environment and business of companies, foster creativity in decision making, and provide access to resources and connections (Conger & Lawler, 2001; Ferreira, 2010). Diversity on a Board of Directors may improve decision making and result in better firm performance (Carter et al., 2003).
Research Hypothesis-1:
Public pension funds effect the diversification of company boards.
The different dimensions of board diversity include gender, nationality, age, education, etc. In this study I concentrate on gender, age, and the presence of foreigners on boards as determinants of board diversity.
There is growing pressure around the world to attract females to company directorships. Indeed, a formal law requiring female participation on boards was enacted in Norway in 2008. The Swedish code of corporate governance also states that companies must strive for equal gender distribution on boards3. Female board members increase board diversity (Ruigrok et al., 2007; Carter et al., 2010) and exercise better management monitoring (Fondas & Sassalos, 2000; Adams & Ferreira, 2009).
AP funds also claim their intention to effect an increase in the proportion of females on boards:
“The Second AP Fund emphasizes the importance of increasing the percentage of women on the boards of quoted companies. When participating in the nomination process, the Fund will therefore devote special attention to this need. The Fund also feels that the nominating committees should submit concrete proposals for achieving a better balance in the way boards are composed in terms of gender, age, background, experience and competence.” (AP-2, 2010b)
It is therefore interesting to verify if public pension funds are indeed able to promote females on the boards of companies in which they are shareholders.
Research Hypothesis-1a:
Public pension funds effect an increase in the proportion of females on companies’ Boards of Directors.
Foreign directors may provide additional expertise not available to domestic directors. In addition, boards with foreign directors signal the openness of a firm for foreign investment and a commitment to transparency (Oxelheim & Randoy, 2001; Aggarwal et al., 2011; Ferreira et al., 2010).
3 Section 4.1 of the Swedish Code of Corporate Governance (2008, 2010).
61
Research Hypothesis-1b:
Swedish public pension funds promote the appointment of foreigners on companies’ Boards of Directors.
It is argued that different age groups may bring different insights to company boards (Kang et al., 2007). According to Houle (1990) older directors are more experienced, middle-aged directors take an active role in society, and younger directors go through a learning process that is later utilised within a company.
In this study I consider the age range in Boards of Directors as another measure of board diversity.
Research Hypothesis-1c:
Public pension funds effect the election of directors with a wide age range
There has been a long-running discussion on the role of independent board members (outsiders) in improving corporate performance (see, for example, Hermalin & Weisbach, 2003; Cotter et al., 1997; Rosenstein & Wyatt, 1990; Rosenstein & Wyatt, 1997, etc.). Importantly, the Swedish Code of Corporate Governance (2010) states that a majority of directors appointed at annual shareholder meetings are to be independent of the company and its executive management. Furthermore, the code stresses that at least two board members should be independent of the company and its executive management and also independent of its major shareholders4.
The next hypothesis reflects on the ability of Swedish public pension funds to promote the appointment of independent board members.
Research Hypothesis-2:
Swedish public pension funds promote the appointment of independent members to companies’ Boards of Directors.
When CEOs sit on a Board of Directors, they are more likely to be involved in the selection of new board members. According to Shivdasani & Yermack (1999) directors are less aggressive monitors when CEOs are involved in the selection process. In addition, firms are less likely to select independent and grey directors (those who have some connection to companies) when CEOs participate in the selection. CEOs sitting on a Board of Directors are also likely to influence their own compensation schemes. It is not, therefore, the best strategy to include CEOs on boards. The next hypothesis assesses the possible impact of public pension funds on the non-inclusion of CEOs in Boards of Directors.
Research Hypothesis-3:
Swedish public pension funds achieve the non-re-election of CEOs to Boards of Directors.
4 Sections 4.4 and 4.5 of the Swedish Code of Corporate Governance (2010)

62
According to Institutional Shareholder Services (2007), Swedish corporate ownership is characterised by a high concentration of control ownership achieved through dual-class shares5.
Pajuste (2005) notes that there is a Europe-wide tendency to unify shares with differential voting rights. Excessive control of ownership by minority shareholders may be detrimental, as it may create an environment in which corporate resources are diverted for private benefits and the cost of capital increases. Adams & Fereira (2008) conduct an extensive review of the literature on the deviation from the one-share-one-vote rule, and conclude that there is empirical support for the detrimental impact of dual-class structures on firm value, which may be explained by the entrenchment of the largest shareholders in general or the management in particular (Claessens et al., 2002; Lins, 2003; Gompers et al., 2010; Lauterbach & Pajuste, 2013). Lauterbach & Pajuste (2013) find that firm value reached its peak after one year, and diminished gradually following the unification of shares in European firms.
Swedish AP funds claim that they strive to reduce the wedge between cash flow and voting rights in companies in their portfolios:
“In companies with varied voting rights, situations can arise where minority shareholders have difficulty in asserting their rights. In such cases, the Second AP Fund is positive to the equalization of voting rights. The Fund favors reducing the difference in voting rights between different classes of asset...” (AP-2, 2010a)
“The Second AP Fund considers that one share should in principle entitle the holder to one vote. The Swedish system features different classes of ordinary shares, carrying different voting rights: class A and class B shares. The Fund is broadly positive to reducing the discrepancies in voting rights between different classes of share.” (AP-2, 2014)
It is therefore reasonable to test whether Swedish public pension funds effect a decrease in the wedge between the cash flow and voting rights of shares in firms under their ownership.
Research Hypothesis-4:
Public pension funds facilitate a decrease in the wedge between cash flow and voting rights in companies in which they hold shares.
5 58% of Swedish listed firms practise dual class shares.

63
4 DATA
Annual data was collected for companies listed on the Stockholm Stock Exchange for the period 2001-2012.
To avoid survivorship bias, only companies listed as of 2001 were included in the sample. In total, there were 193 companies, out of which 10 were delisted, and 40 merged.
Financial data was obtained through Thomson Reuters and Worldscope (via the Thomson One database), as well as the Orbis database of the Bureau van Dijk.
Annual ownership data was collected through the SIS Ägarservice AB (2013) database, which identifies the cash flow and voting rights of the 200 biggest shareholders of a company. Ownership of delisted and merged companies was obtained through “Agarna Och Markten” by Fristedt & Sundqvist (2001-2009), a series which shows the 25 largest owners of Swedish listed companies.

64
5 EMPIRICAL APPROACH
First, I approach each hypothesis by analysing the contemporaneous relationship between dependent variables in interest and public pension fund ownership (first stage). In particular, I regress each dependent variable at time “T” on public pension fund holdings observed at time “T” employing both pooled as well as panel data models. Where possible, standard errors are clustered by firm to reflect the correlation in observations taken from particular companies during different years.
Although fixed effects models eliminate unchanging firm level heterogeneity correlated both with public pension fund holdings and dependent variables, they do not completely cure for endogeneity to allow the causal interpretation which we seek6. In the second stage, therefore, I exploit the panel nature of data and regress changes in dependent variables of interest taken from time “T+1” on public pension fund ownership (together with other control variables) from time “T”. I do not employ fixed effects models in this setting, as this approach would cause double differencing. In this analysis I also consecutively add different sets of control variables to see their possible interactions with the dependent variable and with public pension fund ownership variables.
For the sake of convenience I label the first stage - Contemporaneous analysis, and the second - Dynamic analysis.
6 For example, in a contemporaneous regression of the percentage of female board members on public pension fund holdings by fixed effects models, differencing may eliminate uncontrolled time invariant firm-specific factors that influence both the decision of public pension funds to invest in firms and have an impact on the selection of females to serve on Boards of Directors. However, this does not allow for the fact that pension funds may have selected investment in firms that have a high percentage of females on their Board of Directors.

65
6 CONTROL VARIABLES
All specifications and estimation models, except for the fixed effects model, include industry and time fixed effects. Firm fixed effects are controlled in fixed effects models, while time-invariant industry dummies are eliminated in those regressions by differencing.
General controls for board determinants
Hypotheses 1-3 target the investigation of public pension fund ownership’s impact on a number of board characteristics such as the proportion of females, foreigners, and independent directors, the age range of directors and whether there is a CEO on the board.
Thus, the general controls for board determinants are as follows:
1) Board characteristics:
the proportion of females on the board (except equations investigating its determinants);
the proportion of independent members on the board (except equations investigating its determinants);
whether the CEO is a member of the board (except equations investigating its determinants);
board size;
change in board size.
2) Firm characteristics:
Company Age7.
3) Firm performance and valuation controls:
ROA;
Leverage (total debt/total assets);
Market-to-Book.
4) The wedge between voting and cash flow rights (largest owner voting rights/ largest owner cash flow rights)
Additional controls for board determinants
As Gregoric (2013) argues, firms with at least one female on the Board of Directors are unlikely to increase the proportion of females in the next year. Equations investigating 7 For multicollinearity reasons I do not additionally control for firm size in these regressions, as it is highly correlated with board size.
66
a public pension fund’s impact on the proportion of females elected to a Board of Directors also include the proportion of females on the board in the previous period.
Equations exploring the impact of public pension funds on CEO board membership also include CEO characteristics such as CEO age and CEO education level – the CEO (graduate) dummy, equal to a value of 1 if the CEO has a graduate education (master’s degree or higher), and the CEO change dummy, equal to a value of 1 if the company’s CEO has changed.
Controls for wedge equations
Although the market valuation of dual-class structured firms has been widely debated, there is scarce literature on the determinants of the wedge between cash flow and voting rights.
According to Kim et al. (2007) there is a negative relationship between dual-class stock splits and stock liquidity. Dey et al. (2009) find that firms with dual-class shares are more leveraged, thus attenuating agency problems in these firms.
For these reasons, when investigating the Wedge-public pension fund ownership link, I control for liquidity (through an Illiquidity variable measured as an average of the difference between ask and bid prices observed at the last 6 end of the months of the year), Leverage (total debt/total assets), and also Company age and firm size (a logarithm of the number of employees).
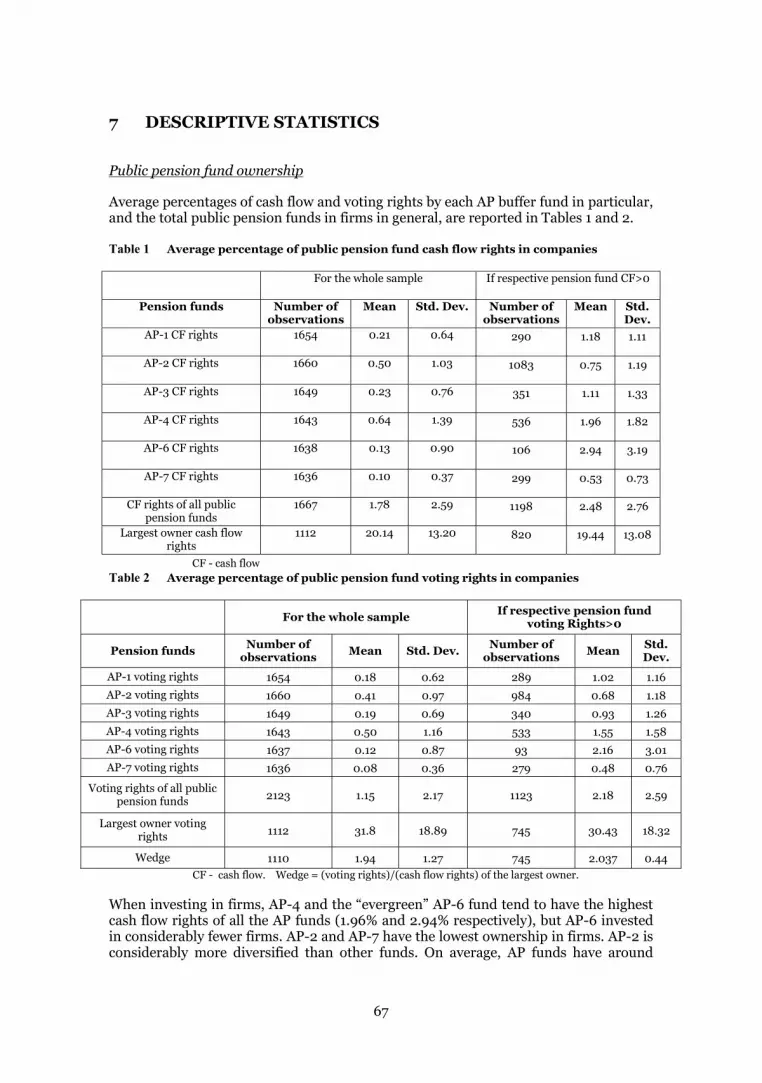
67
7 DESCRIPTIVE STATISTICS
Public pension fund ownership
Average percentages of cash flow and voting rights by each AP buffer fund in particular, and the total public pension funds in firms in general, are reported in Tables 1 and 2.
Table 1 Average percentage of public pension fund cash flow rights in companies
For the whole sample If respective pension fund CF>0
Pension funds Number of observations
Mean Std. Dev. Number of observations
Mean Std. Dev.
AP-1 CF rights 1654 0.21 0.64 290 1.18 1.11
AP-2 CF rights 1660 0.50 1.03 1083 0.75 1.19
AP-3 CF rights 1649 0.23 0.76 351 1.11 1.33
AP-4 CF rights 1643 0.64 1.39 536 1.96 1.82
AP-6 CF rights 1638 0.13 0.90 106 2.94 3.19
AP-7 CF rights 1636 0.10 0.37 299 0.53 0.73
CF rights of all public pension funds
1667 1.78 2.59 1198 2.48 2.76
Largest owner cash flow rights
1112 20.14 13.20 820 19.44 13.08
CF - cash flow Table 2 Average percentage of public pension fund voting rights in companies
For the whole sample If respective pension fund voting Rights>0
Pension funds Number of observations Mean Std. Dev. Number of
observations Mean Std. Dev.
AP-1 voting rights 1654 0.18 0.62 289 1.02 1.16 AP-2 voting rights 1660 0.41 0.97 984 0.68 1.18 AP-3 voting rights 1649 0.19 0.69 340 0.93 1.26 AP-4 voting rights 1643 0.50 1.16 533 1.55 1.58 AP-6 voting rights 1637 0.12 0.87 93 2.16 3.01 AP-7 voting rights 1636 0.08 0.36 279 0.48 0.76
Voting rights of all public pension funds 2123 1.15 2.17 1123 2.18 2.59
Largest owner voting rights 1112 31.8 18.89 745 30.43 18.32
Wedge 1110 1.94 1.27 745 2.037 0.44 CF - cash flow. Wedge = (voting rights)/(cash flow rights) of the largest owner.
When investing in firms, AP-4 and the “evergreen” AP-6 fund tend to have the highest cash flow rights of all the AP funds (1.96% and 2.94% respectively), but AP-6 invested in considerably fewer firms. AP-2 and AP-7 have the lowest ownership in firms. AP-2 is considerably more diversified than other funds. On average, AP funds have around
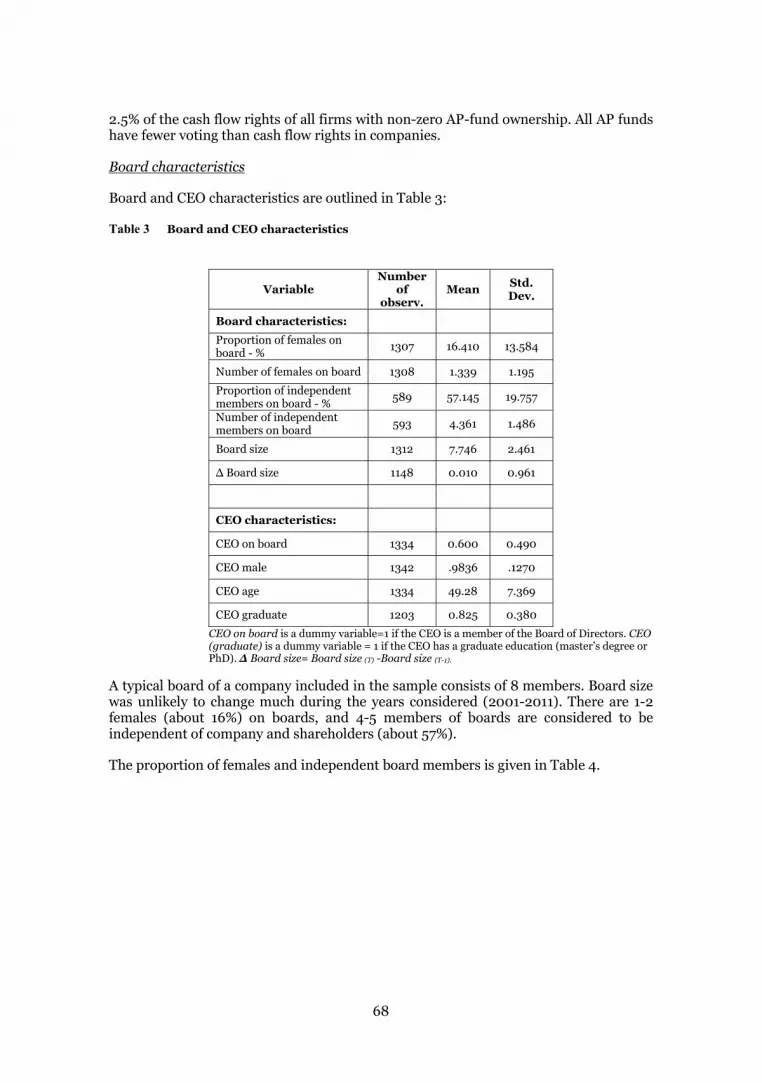
68
2.5% of the cash flow rights of all firms with non-zero AP-fund ownership. All AP funds have fewer voting than cash flow rights in companies.
Board characteristics
Board and CEO characteristics are outlined in Table 3:
Table 3 Board and CEO characteristics
CEO on board is a dummy variable=1 if the CEO is a member of the Board of Directors. CEO (graduate) is a dummy variable = 1 if the CEO has a graduate education (master’s degree or PhD). Board size= Board size (T) -Board size (T-1).
A typical board of a company included in the sample consists of 8 members. Board size was unlikely to change much during the years considered (2001-2011). There are 1-2 females (about 16%) on boards, and 4-5 members of boards are considered to be independent of company and shareholders (about 57%).
The proportion of females and independent board members is given in Table 4.
Variable Number
of observ.
Mean Std. Dev.
Board characteristics: Proportion of females on board - % 1307 16.410 13.584
Number of females on board 1308 1.339 1.195
Proportion of independent members on board - % 589 57.145 19.757
Number of independent members on board 593 4.361 1.486
Board size 1312 7.746 2.461
1148 0.010 0.961
CEO characteristics: CEO on board 1334 0.600 0.490
CEO male 1342 .9836 .1270
CEO age 1334 49.28 7.369
CEO graduate 1203 0.825 0.380
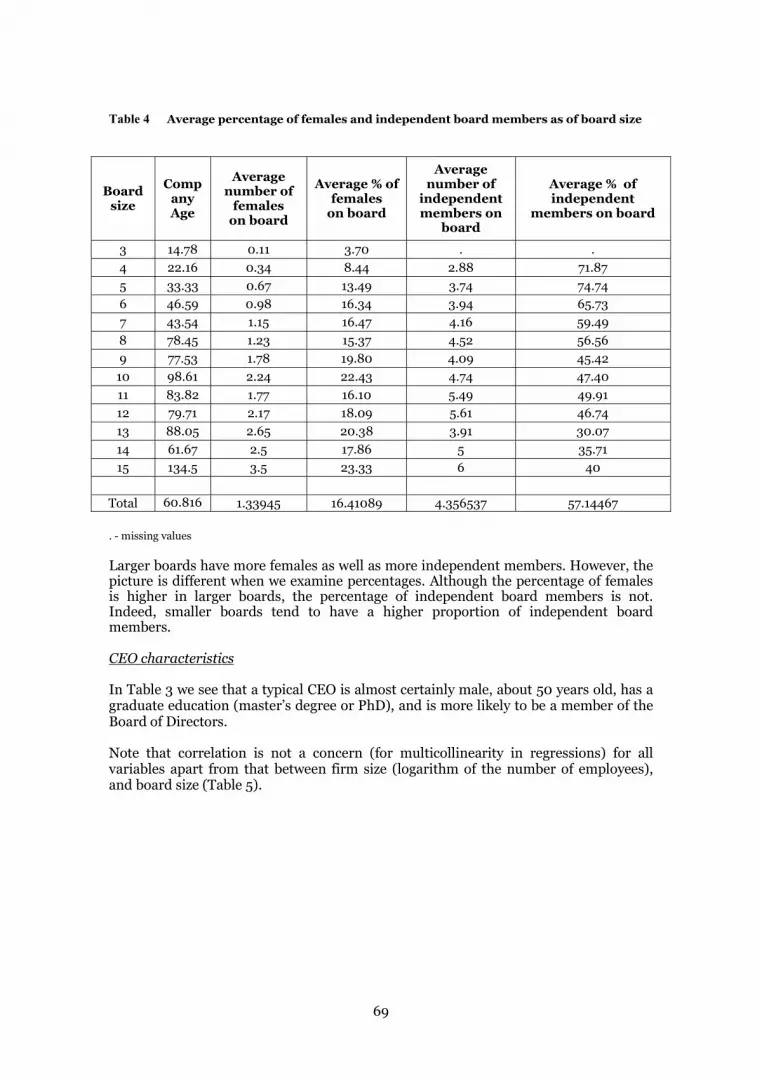
69
Table 4 Average percentage of females and independent board members as of board size
Board size
Company Age
Average number of
females on board
Average % of females
on board
Average number of
independent members on
board
Average % of independent
members on board
3 14.78 0.11 3.70 . . 4 22.16 0.34 8.44 2.88 71.87 5 33.33 0.67 13.49 3.74 74.74 6 46.59 0.98 16.34 3.94 65.73 7 43.54 1.15 16.47 4.16 59.49 8 78.45 1.23 15.37 4.52 56.56 9 77.53 1.78 19.80 4.09 45.42 10 98.61 2.24 22.43 4.74 47.40 11 83.82 1.77 16.10 5.49 49.91 12 79.71 2.17 18.09 5.61 46.74 13 88.05 2.65 20.38 3.91 30.07 14 61.67 2.5 17.86 5 35.71 15 134.5 3.5 23.33 6 40
Total 60.816 1.33945 16.41089 4.356537 57.14467
. - missing values Larger boards have more females as well as more independent members. However, the picture is different when we examine percentages. Although the percentage of females is higher in larger boards, the percentage of independent board members is not. Indeed, smaller boards tend to have a higher proportion of independent board members. CEO characteristics
In Table 3 we see that a typical CEO is almost certainly male, about 50 years old, has a graduate education (master’s degree or PhD), and is more likely to be a member of the Board of Directors.
Note that correlation is not a concern (for multicollinearity in regressions) for all variables apart from that between firm size (logarithm of the number of employees), and board size (Table 5).
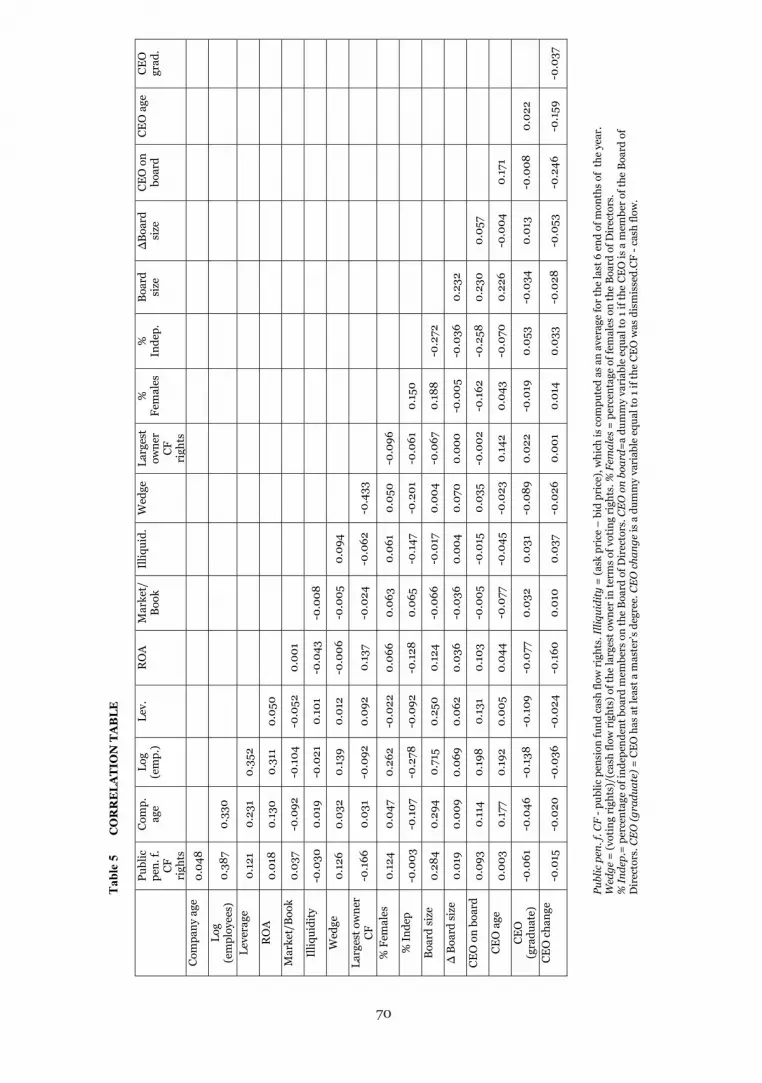
Tab
le 5
C
OR
RE
LA
TIO
N T
AB
LE
Publ
ic p
en. f
. CF
- pub
lic p
ensi
on fu
nd c
ash
flow
rig
hts.
Illiq
uidi
ty =
(ask
pri
ce –
bid
pri
ce),
whi
ch is
com
pute
d as
an
aver
age
for
the
last
6 e
nd o
f mon
ths
of t
he y
ear.
W
edge
= (v
otin
g ri
ghts
)/(c
ash
flow
rig
hts)
of t
he la
rges
t ow
ner
in te
rms
of v
otin
g ri
ghts
. % F
emal
es =
per
cent
age
of fe
mal
es o
n th
e B
oard
of D
irec
tors
. %
Inde
p.=
per
cent
age
of in
depe
nden
t boa
rd m
embe
rs o
n th
e B
oard
of D
irec
tors
. CE
O o
n bo
ard=
a du
mm
y va
riab
le e
qual
to 1
if th
e C
EO
is a
mem
ber
of th
e B
oard
of
Dir
ecto
rs. C
EO
(gra
duat
e) =
CE
O h
as a
t lea
st a
mas
ter’
s de
gree
. CE
O c
hang
e is
a d
umm
y va
riab
le e
qual
to 1
if th
e C
EO
was
dis
mis
sed.
CF
- cas
h flo
w.
Pu
blic
pe
n. f.
C
F ri
ghts
Com
p.
age
Log
(em
p.)
Lev.
R
OA
M
arke
t/
Boo
k Il
liqui
d.
Wed
ge
Larg
est
owne
r C
F ri
ghts
%
Fem
ales
%
In
dep.
B
oard
si
ze
size
C
EO
on
boar
d C
EO
age
C
EO
gr
ad.
Com
pany
age
0.
048
Log
(em
ploy
ees)
0.
387
0.33
0
Le
vera
ge
0.12
1 0.
231
0.35
2 R
OA
0.
018
0.13
0 0.
311
0.05
0 M
arke
t/B
ook
0.03
7 -0
.092
-0
.104
-0
.052
0.
001
Illiq
uidi
ty
-0.0
30
0.01
9 -0
.021
0.
101
-0.0
43
-0.0
08
Wed
ge
0.12
6 0.
032
0.13
9 0.
012
-0.0
06
-0.0
05
0.09
4 La
rges
t ow
ner
CF
-0
.166
0.
031
-0.0
92
0.09
2 0.
137
-0.0
24
-0.0
62
-0.4
33
% F
emal
es
0.12
4 0.
047
0.26
2 -0
.022
0.
066
0.06
3 0.
061
0.05
0 -0
.096
%
Inde
p -0
.003
-0
.107
-0
.278
-0
.092
-0
.128
0.
065
-0.1
47
-0.2
01
-0.0
61
0.15
0 B
oard
siz
e 0.
284
0.29
4 0.
715
0.25
0 0.
124
-0.0
66
-0.0
17
0.00
4 -0
.067
0.
188
-0.2
72
0.
019
0.00
9 0.
069
0.06
2 0.
036
-0.0
36
0.00
4 0.
070
0.00
0 -0
.005
-0
.036
0.
232
CE
O o
n bo
ard
0.09
3 0.
114
0.19
8 0.
131
0.10
3 -0
.005
-0
.015
0.
035
-0.0
02
-0.1
62
-0.2
58
0.23
0 0.
057
CE
O a
ge
0.00
3 0.
177
0.19
2 0.
005
0.04
4 -0
.077
-0
.045
-0
.023
0.
142
0.04
3 -0
.070
0.
226
-0.0
04
0.17
1 C
EO
(g
radu
ate)
-0
.061
-0
.046
-0
.138
-0
.109
-0
.077
0.
032
0.03
1 -0
.089
0.
022
-0.0
19
0.05
3 -0
.034
0.
013
-0.0
08
0.02
2
CE
O c
hang
e -0
.015
-0
.020
-0
.036
-0
.024
-0
.160
0.
010
0.
037
-0.0
26
0.00
1 0.
014
0.03
3 -0
.028
-0
.053
-0
.246
-0
.159
-0
.037
70
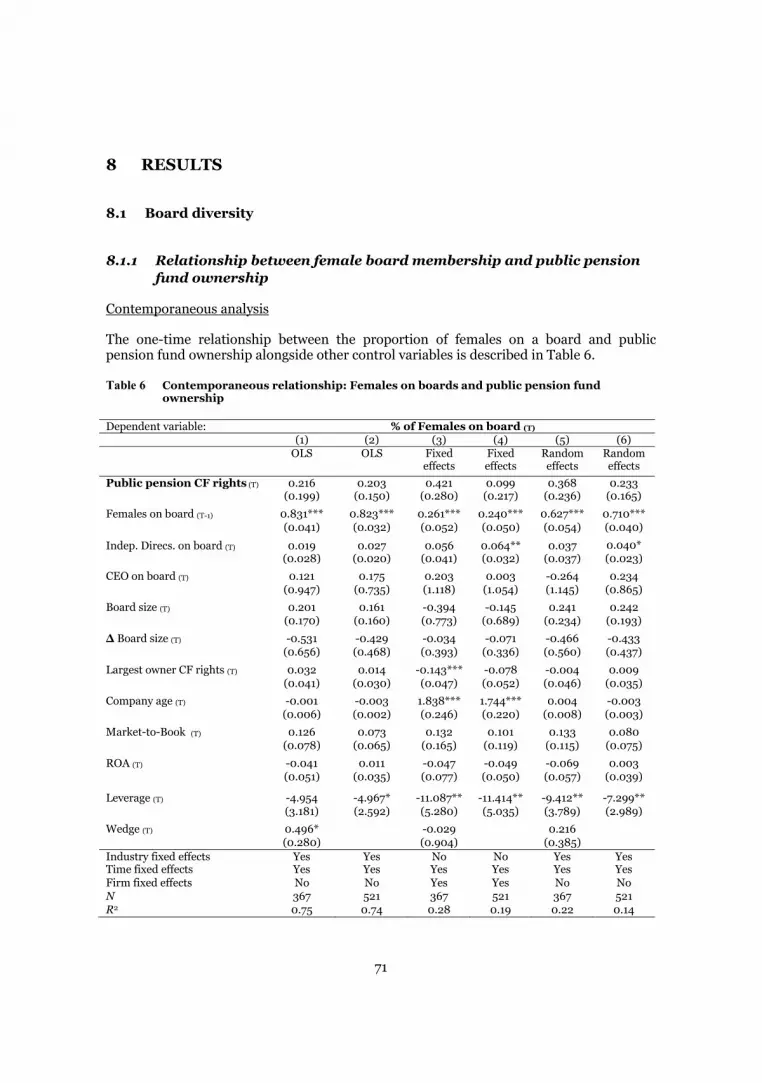
71
8 RESULTS
8.1 Board diversity
8.1.1 Relationship between female board membership and public pension fund ownership
Contemporaneous analysis
The one-time relationship between the proportion of females on a board and public pension fund ownership alongside other control variables is described in Table 6.
Table 6 Contemporaneous relationship: Females on boards and public pension fund ownership
Dependent variable: % of Females on board (T) (1) (2) (3) (4) (5) (6) OLS OLS Fixed
effects Fixed effects
Random effects
Random effects
Public pension CF rights (T) 0.216 0.203 0.421 0.099 0.368 0.233 (0.199) (0.150) (0.280) (0.217) (0.236) (0.165)
Females on board (T-1) 0.831*** 0.823*** 0.261*** 0.240*** 0.627*** 0.710*** (0.041) (0.032) (0.052) (0.050) (0.054) (0.040)
Indep. Direcs. on board (T) 0.019 0.027 0.056 0.064** 0.037 0.040* (0.028) (0.020) (0.041) (0.032) (0.037) (0.023)
CEO on board (T) 0.121 0.175 0.203 0.003 -0.264 0.234 (0.947) (0.735) (1.118) (1.054) (1.145) (0.865)
Board size (T) 0.201 0.161 -0.394 -0.145 0.241 0.242 (0.170) (0.160) (0.773) (0.689) (0.234) (0.193)
Board size (T) -0.531 -0.429 -0.034 -0.071 -0.466 -0.433 (0.656) (0.468) (0.393) (0.336) (0.560) (0.437)
Largest owner CF rights (T) 0.032 0.014 -0.143*** -0.078 -0.004 0.009 (0.041) (0.030) (0.047) (0.052) (0.046) (0.035)
Company age (T) -0.001 -0.003 1.838*** 1.744*** 0.004 -0.003 (0.006) (0.002) (0.246) (0.220) (0.008) (0.003)
Market-to-Book (T) 0.126 0.073 0.132 0.101 0.133 0.080 (0.078) (0.065) (0.165) (0.119) (0.115) (0.075)
ROA (T) -0.041 0.011 -0.047 -0.049 -0.069 0.003 (0.051) (0.035) (0.077) (0.050) (0.057) (0.039)
Leverage (T) -4.954 -4.967* -11.087** -11.414** -9.412** -7.299** (3.181) (2.592) (5.280) (5.035) (3.789) (2.989)
Wedge (T) 0.496* -0.029 0.216 (0.280) (0.904) (0.385) Industry fixed effects Yes Yes No No Yes Yes Time fixed effects Yes Yes Yes Yes Yes Yes Firm fixed effects No No Yes Yes No No N 367 521 367 521 367 521 R2 0.75 0.74 0.28 0.19 0.22 0.14

72
The dependent variable is the percentage of females on the Board of Directors. Females on board is the percentage of females on the Board of Directors. Independent directors on board is the percentage of directors independent both of the company and its shareholders. CEO on board is a dummy variable = 1 if the CEO is a member of the board. Board size (T)= Board size (T) -Board size (T-1). Wedge = (largest owner voting rights)/(largest owner cash flow rights). Robust standard errors clustered by company are in parentheses. CF - cash flow.
The dependent variable in Table 6 is the percentage of females on the board8. Note also that the Independent members on board variable is in percentages9.
Importantly, public pension fund holdings are not contemporaneously related to the percentage of females on a board (revealed in pooled OLS, fixed effects, and random effects models).
When considering control variables, the availability of females to serve on a board is a good indicator of whether females will be present in the following year. Firms with a higher proportion of females on their boards are less leveraged (noted by all models and specifications). There is also some evidence (pooled OLS regressions in Column 1 of Table 6) that there is a higher proportion of females on the boards of firms with a high wedge between voting and cash flow rights. Furthermore, the fixed effects model identifies a positive relationship between company age and the proportion of females on boards.
Dynamic analysis
Table 7 compiles estimation results from investigating the relationship between public pension fund cash flow rights in companies and a future increase in the proportion of female members of boards.
According to all models and specifications we can see that past values in public pension fund ownership are not associated with future increase in the percentage of females on a Board of Directors.
The control variables show that firms valued high by the market and those with larger boards, increase the proportion of female directors. However, boards that already have a high percentage of females on their boards are more likely to decrease that proportion in the following year.
8 The percentage of females is considered against the total board size, which includes employee representatives. The focus is on the proportion of females on the board, irrespective of whether they have been elected at the Annual General Shareholders Meeting or by employee unions. 9 The percentage of independent members on boards is considered against the total board size less the number of employee representatives, as employee representatives are not independent of the company. Thus, the percentage of independent board members is considered against those elected at the Annual General Shareholders Meeting.
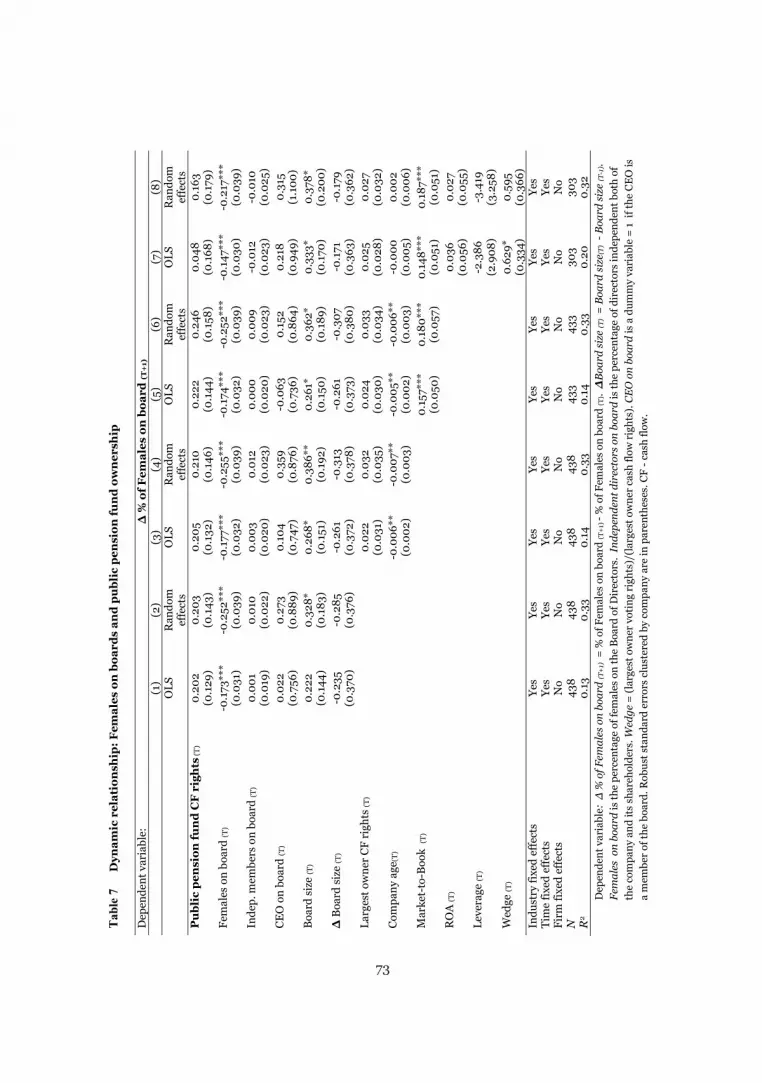
Tab
le 7
D
ynam
ic r
elat
ion
ship
: Fem
ales
on
boa
rds
and
pu
blic
pen
sion
fun
d o
wn
ersh
ip
Dep
ende
nt v
aria
ble:
em
ales
on
boa
rd (T
+1)
(1)
(2)
(3)
(4)
(5)
(6)
(7)
(8)
O
LS
Ran
dom
ef
fect
s O
LS
Ran
dom
ef
fect
s O
LS
Ran
dom
ef
fect
s O
LS
Ran
dom
ef
fect
s P
ubl
ic p
ensi
on fu
nd
CF
rig
hts
(T)
0.20
2 0.
203
0.20
5 0.
210
0.22
2 0.
246
0.04
8 0.
163
(0
.129
) (0
.143
) (0
.132
) (0
.146
) (0
.144
) (0
.158
) (0
.168
) (0
.179
)
Fem
ales
on
boar
d (T
)
-0.1
73**
* -0
.252
***
-0.1
77**
* -0
.255
***
-0.1
74**
* -0
.252
***
-0.1
47**
* -0
.217
***
(0
.031
) (0
.039
) (0
.032
) (0
.039
) (0
.032
) (0
.039
) (0
.030
) (0
.039
)
Inde
p. m
embe
rs o
n bo
ard
(T)
0.
001
0.01
0 0.
003
0.01
2 0.
000
0.00
9 -0
.012
-0
.010
(0.0
19)
(0.0
22)
(0.0
20)
(0.0
23)
(0.0
20)
(0.0
23)
(0.0
23)
(0.0
25)
CE
O o
n bo
ard
(T)
0.
022
0.27
3 0.
104
0.35
9 -0
.063
0.
152
0.21
8 0.
315
(0
.756
) (0
.889
) (0
.747
) (0
.876
) (0
.736
) (0
.864
) (0
.949
) (1
.100
)
Boa
rd s
ize
(T)
0.
222
0.32
8*
0.26
8*
0.38
6**
0.26
1*
0.36
2*
0.33
3*
0.37
8*
(0
.144
) (0
.183
) (0
.151
) (0
.192
) (0
.150
) (0
.189
) (0
.170
) (0
.200
)
Boa
rd s
ize
(T)
-0
.235
-0
.285
-0
.261
-0
.313
-0
.261
-0
.307
-0
.171
-0
.179
(0.3
70)
(0.3
76)
(0.3
72)
(0.3
78)
(0.3
73)
(0.3
80)
(0.3
63)
(0.3
62)
Larg
est o
wne
r C
F ri
ghts
(T)
0.
022
0.03
2 0.
024
0.03
3 0.
025
0.02
7
(0.0
31)
(0.0
35)
(0.0
30)
(0.0
34)
(0.0
28)
(0.0
32)
Com
pany
age
(T)
-0
.006
**
-0.0
07**
-0
.005
**
-0.0
06**
-0
.000
0.
002
(0
.002
) (0
.003
) (0
.002
) (0
.003
) (0
.005
) (0
.006
)
Mar
ket-
to-B
ook
(T)
0.
157*
**
0.18
0***
0.
148*
**
0.18
7***
(0.0
50)
(0.0
57)
(0.0
51)
(0.0
51)
RO
A (T
)
0.03
6 0.
027
(0
.056
) (0
.055
)
Leve
rage
(T)
-2
.386
-3
.419
(2.9
08)
(3.2
58)
Wed
ge (T
)
0.62
9*
0.59
5
(0.3
34)
(0.3
66)
Indu
stry
fixe
d ef
fect
s Ye
s Ye
s Ye
s Ye
s Ye
s Ye
s Ye
s Ye
s Ti
me
fixed
eff
ects
Ye
s Ye
s Ye
s Ye
s Ye
s Ye
s Ye
s Ye
s Fi
rm fi
xed
effe
cts
No
No
No
No
No
No
No
No
N
438
438
438
438
433
433
303
303
R2
0.13
0.
33
0.14
0.
33
0.14
0.
33
0.20
0.
32
Dep
ende
nt v
aria
ble
(T+
1) =
% o
f Fem
ales
on
boar
d (T
+1)
- %
of F
emal
es o
n bo
ard
(T).
B
oard
siz
e (T
) =
Boa
rd s
ize (
T) -
Boa
rd s
ize
(T-1
).
Fem
ales
on
boar
d is
the
perc
enta
ge o
f fem
ales
on
the
Boa
rd o
f Dir
ecto
rs.
Inde
pend
ent d
irec
tors
on
boar
d is
the
perc
enta
ge o
f dir
ecto
rs in
depe
nden
t bot
h of
th
e co
mpa
ny a
nd it
s sh
areh
olde
rs. W
edge
= (l
arge
st o
wne
r vo
ting
rig
hts)
/(la
rges
t ow
ner
cash
flow
rig
hts)
. CE
O o
n bo
ard
is a
dum
my
vari
able
= 1
if t
he C
EO
is
a m
embe
r of
the
boar
d. R
obus
t sta
ndar
d er
rors
clu
ster
ed b
y co
mpa
ny a
re in
par
enth
eses
. CF
- cas
h flo
w.
7 3
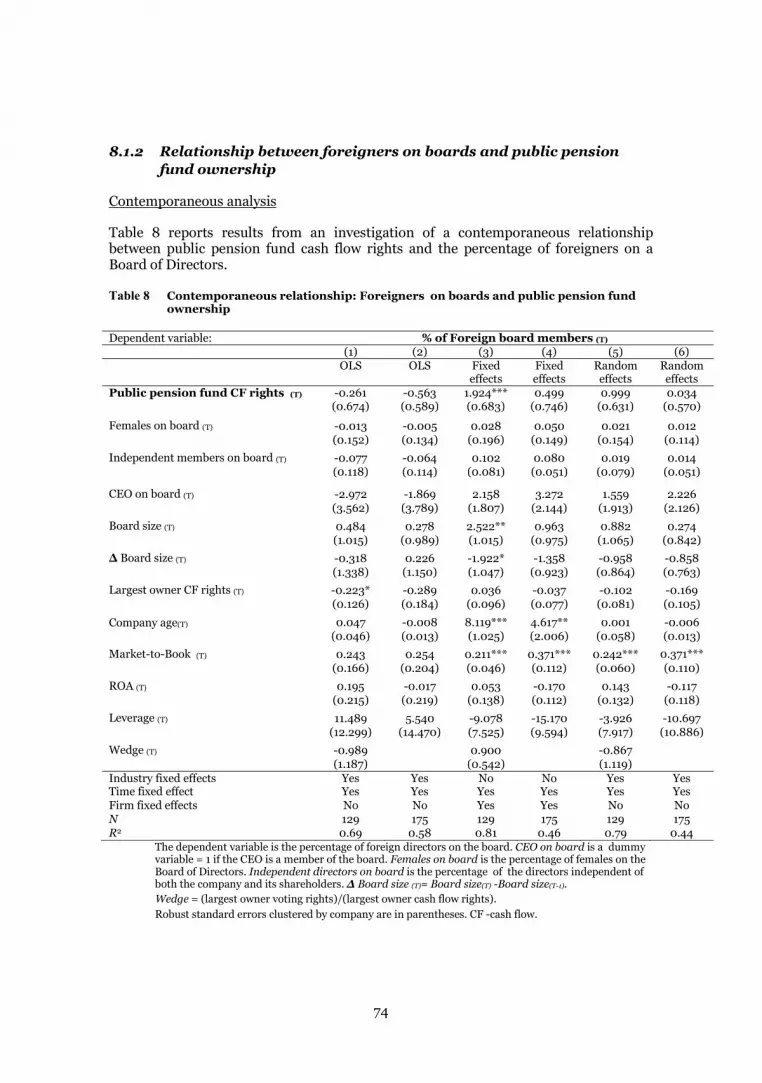
74
8.1.2 Relationship between foreigners on boards and public pension fund ownership
Contemporaneous analysis
Table 8 reports results from an investigation of a contemporaneous relationship between public pension fund cash flow rights and the percentage of foreigners on a Board of Directors.
Table 8 Contemporaneous relationship: Foreigners on boards and public pension fund ownership
Dependent variable: % of Foreign board members (T) (1) (2) (3) (4) (5) (6) OLS OLS Fixed
effects Fixed effects
Random effects
Random effects
Public pension fund CF rights (T) -0.261 -0.563 1.924*** 0.499 0.999 0.034 (0.674) (0.589) (0.683) (0.746) (0.631) (0.570)
Females on board (T) -0.013 -0.005 0.028 0.050 0.021 0.012 (0.152) (0.134) (0.196) (0.149) (0.154) (0.114) Independent members on board (T) -0.077 -0.064 0.102 0.080 0.019 0.014 (0.118) (0.114) (0.081) (0.051) (0.079) (0.051)
CEO on board (T) -2.972 -1.869 2.158 3.272 1.559 2.226 (3.562) (3.789) (1.807) (2.144) (1.913) (2.126) Board size (T) 0.484 0.278 2.522** 0.963 0.882 0.274 (1.015) (0.989) (1.015) (0.975) (1.065) (0.842)
Board size (T) -0.318 0.226 -1.922* -1.358 -0.958 -0.858 (1.338) (1.150) (1.047) (0.923) (0.864) (0.763) Largest owner CF rights (T) -0.223* -0.289 0.036 -0.037 -0.102 -0.169 (0.126) (0.184) (0.096) (0.077) (0.081) (0.105)
Company age(T) 0.047 -0.008 8.119*** 4.617** 0.001 -0.006 (0.046) (0.013) (1.025) (2.006) (0.058) (0.013) Market-to-Book (T) 0.243 0.254 0.211*** 0.371*** 0.242*** 0.371*** (0.166) (0.204) (0.046) (0.112) (0.060) (0.110) ROA (T) 0.195 -0.017 0.053 -0.170 0.143 -0.117 (0.215) (0.219) (0.138) (0.112) (0.132) (0.118) Leverage (T) 11.489 5.540 -9.078 -15.170 -3.926 -10.697 (12.299) (14.470) (7.525) (9.594) (7.917) (10.886) Wedge (T) -0.989 0.900 -0.867 (1.187) (0.542) (1.119) Industry fixed effects Yes Yes No No Yes Yes Time fixed effect Yes Yes Yes Yes Yes Yes Firm fixed effects No No Yes Yes No No N 129 175 129 175 129 175 R2 0.69 0.58 0.81 0.46 0.79 0.44
The dependent variable is the percentage of foreign directors on the board. CEO on board is a dummy variable = 1 if the CEO is a member of the board. Females on board is the percentage of females on the Board of Directors. Independent directors on board is the percentage of the directors independent of both the company and its shareholders. Board size (T)= Board size(T) -Board size(T-1). Wedge = (largest owner voting rights)/(largest owner cash flow rights). Robust standard errors clustered by company are in parentheses. CF -cash flow.
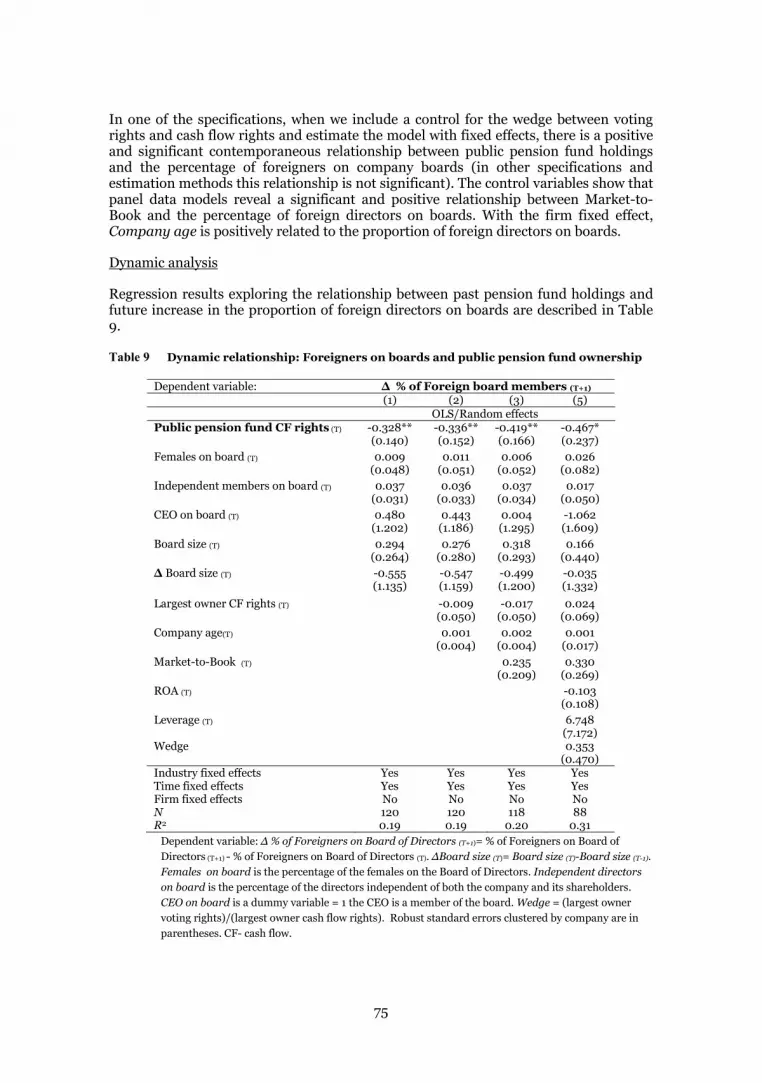
75
In one of the specifications, when we include a control for the wedge between voting rights and cash flow rights and estimate the model with fixed effects, there is a positive and significant contemporaneous relationship between public pension fund holdings and the percentage of foreigners on company boards (in other specifications and estimation methods this relationship is not significant). The control variables show that panel data models reveal a significant and positive relationship between Market-to-Book and the percentage of foreign directors on boards. With the firm fixed effect, Company age is positively related to the proportion of foreign directors on boards.
Dynamic analysis
Regression results exploring the relationship between past pension fund holdings and future increase in the proportion of foreign directors on boards are described in Table 9.
Table 9 Dynamic relationship: Foreigners on boards and public pension fund ownership
Dependent variable: (T+1) (1) (2) (3) (5) OLS/Random effects Public pension fund CF rights (T) -0.328** -0.336** -0.419** -0.467* (0.140) (0.152) (0.166) (0.237)
Females on board (T) 0.009 0.011 0.006 0.026 (0.048) (0.051) (0.052) (0.082)
Independent members on board (T) 0.037 0.036 0.037 0.017 (0.031) (0.033) (0.034) (0.050)
CEO on board (T) 0.480 0.443 0.004 -1.062 (1.202) (1.186) (1.295) (1.609)
Board size (T) 0.294 0.276 0.318 0.166 (0.264) (0.280) (0.293) (0.440)
Board size (T) -0.555 -0.547 -0.499 -0.035 (1.135) (1.159) (1.200) (1.332)
Largest owner CF rights (T) -0.009 -0.017 0.024 (0.050) (0.050) (0.069)
Company age(T) 0.001 0.002 0.001 (0.004) (0.004) (0.017)
Market-to-Book (T) 0.235 0.330 (0.209) (0.269)
ROA (T) -0.103 (0.108)
Leverage (T) 6.748 (7.172) Wedge 0.353 (0.470) Industry fixed effects Yes Yes Yes Yes Time fixed effects Yes Yes Yes Yes Firm fixed effects No No No No N 120 120 118 88 R2 0.19 0.19 0.20 0.31
Dependent variable: (T+1)= % of Foreigners on Board of Directors (T+1) - % of Foreigners on Board of Directors (T). Board size (T)= Board size (T)-Board size (T-1). Females on board is the percentage of the females on the Board of Directors. Independent directors on board is the percentage of the directors independent of both the company and its shareholders. CEO on board is a dummy variable = 1 the CEO is a member of the board. Wedge = (largest owner voting rights)/(largest owner cash flow rights). Robust standard errors clustered by company are in parentheses. CF- cash flow.
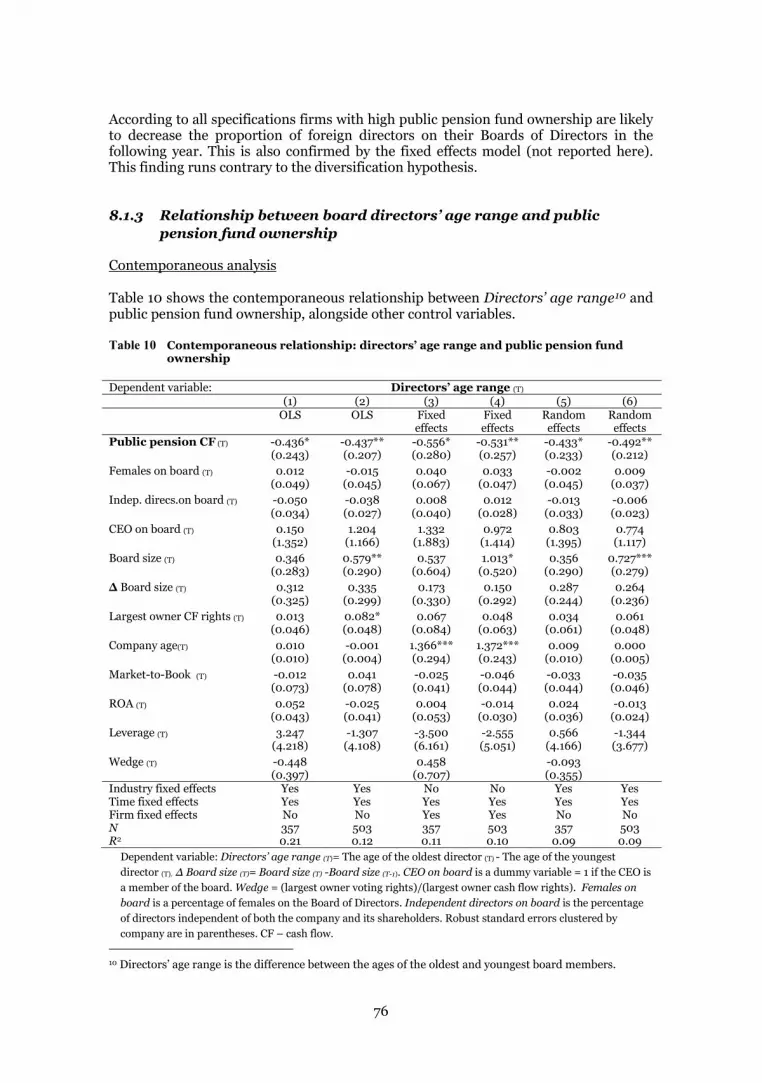
76
According to all specifications firms with high public pension fund ownership are likely to decrease the proportion of foreign directors on their Boards of Directors in the following year. This is also confirmed by the fixed effects model (not reported here). This finding runs contrary to the diversification hypothesis.
8.1.3 Relationship between board directors’ age range and public pension fund ownership
Contemporaneous analysis
Table 10 shows the contemporaneous relationship between Directors’ age range10 and public pension fund ownership, alongside other control variables.
Table 10 Contemporaneous relationship: directors’ age range and public pension fund ownership
Dependent variable: Directors’ age range (T) (1) (2) (3) (4) (5) (6) OLS OLS Fixed
effects Fixed effects
Random effects
Random effects
Public pension CF (T) -0.436* -0.437** -0.556* -0.531** -0.433* -0.492** (0.243) (0.207) (0.280) (0.257) (0.233) (0.212)
Females on board (T) 0.012 -0.015 0.040 0.033 -0.002 0.009 (0.049) (0.045) (0.067) (0.047) (0.045) (0.037)
Indep. direcs.on board (T) -0.050 -0.038 0.008 0.012 -0.013 -0.006 (0.034) (0.027) (0.040) (0.028) (0.033) (0.023)
CEO on board (T) 0.150 1.204 1.332 0.972 0.803 0.774 (1.352) (1.166) (1.883) (1.414) (1.395) (1.117)
Board size (T) 0.346 0.579** 0.537 1.013* 0.356 0.727*** (0.283) (0.290) (0.604) (0.520) (0.290) (0.279)
Board size (T) 0.312 0.335 0.173 0.150 0.287 0.264 (0.325) (0.299) (0.330) (0.292) (0.244) (0.236)
Largest owner CF rights (T) 0.013 0.082* 0.067 0.048 0.034 0.061 (0.046) (0.048) (0.084) (0.063) (0.061) (0.048)
Company age(T) 0.010 -0.001 1.366*** 1.372*** 0.009 0.000 (0.010) (0.004) (0.294) (0.243) (0.010) (0.005)
Market-to-Book (T) -0.012 0.041 -0.025 -0.046 -0.033 -0.035 (0.073) (0.078) (0.041) (0.044) (0.044) (0.046)
ROA (T) 0.052 -0.025 0.004 -0.014 0.024 -0.013 (0.043) (0.041) (0.053) (0.030) (0.036) (0.024)
Leverage (T) 3.247 -1.307 -3.500 -2.555 0.566 -1.344 (4.218) (4.108) (6.161) (5.051) (4.166) (3.677)
Wedge (T) -0.448 0.458 -0.093 (0.397) (0.707) (0.355) Industry fixed effects Yes Yes No No Yes Yes Time fixed effects Yes Yes Yes Yes Yes Yes Firm fixed effects No No Yes Yes No No N 357 503 357 503 357 503 R2 0.21 0.12 0.11 0.10 0.09 0.09
Dependent variable: Directors’ age range (T)= The age of the oldest director (T) - The age of the youngest director (T). Board size (T)= Board size (T) -Board size (T-1). CEO on board is a dummy variable = 1 if the CEO is a member of the board. Wedge = (largest owner voting rights)/(largest owner cash flow rights). Females on board is a percentage of females on the Board of Directors. Independent directors on board is the percentage of directors independent of both the company and its shareholders. Robust standard errors clustered by company are in parentheses. CF – cash flow.
10 Directors’ age range is the difference between the ages of the oldest and youngest board members.
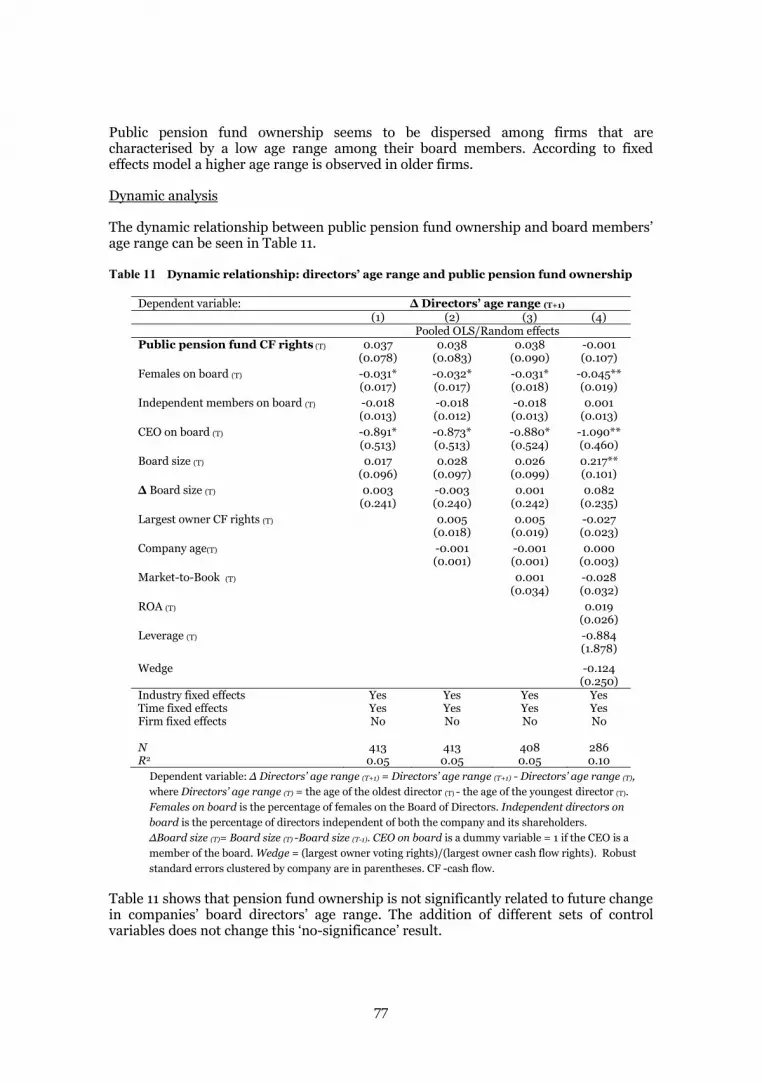
77
Public pension fund ownership seems to be dispersed among firms that are characterised by a low age range among their board members. According to fixed effects model a higher age range is observed in older firms.
Dynamic analysis
The dynamic relationship between public pension fund ownership and board members’ age range can be seen in Table 11.
Table 11 Dynamic relationship: directors’ age range and public pension fund ownership
Dependent variable: Directors’ age range (T+1) (1) (2) (3) (4) Pooled OLS/Random effects Public pension fund CF rights (T) 0.037 0.038 0.038 -0.001 (0.078) (0.083) (0.090) (0.107)
Females on board (T) -0.031* -0.032* -0.031* -0.045** (0.017) (0.017) (0.018) (0.019)
Independent members on board (T) -0.018 -0.018 -0.018 0.001 (0.013) (0.012) (0.013) (0.013)
CEO on board (T) -0.891* -0.873* -0.880* -1.090** (0.513) (0.513) (0.524) (0.460)
Board size (T) 0.017 0.028 0.026 0.217** (0.096) (0.097) (0.099) (0.101)
Board size (T) 0.003 -0.003 0.001 0.082 (0.241) (0.240) (0.242) (0.235)
Largest owner CF rights (T) 0.005 0.005 -0.027 (0.018) (0.019) (0.023)
Company age(T) -0.001 -0.001 0.000 (0.001) (0.001) (0.003)
Market-to-Book (T) 0.001 -0.028 (0.034) (0.032)
ROA (T) 0.019 (0.026)
Leverage (T) -0.884 (1.878)
Wedge -0.124 (0.250) Industry fixed effects Yes Yes Yes Yes Time fixed effects Yes Yes Yes Yes Firm fixed effects No No No No N 413 413 408 286 R2 0.05 0.05 0.05 0.10
Dependent variable: Directors’ age range (T+1) = Directors’ age range (T+1) - Directors’ age range (T), where Directors’ age range (T) = the age of the oldest director (T) - the age of the youngest director (T). Females on board is the percentage of females on the Board of Directors. Independent directors on board is the percentage of directors independent of both the company and its shareholders.
Board size (T)= Board size (T) -Board size (T-1). CEO on board is a dummy variable = 1 if the CEO is a member of the board. Wedge = (largest owner voting rights)/(largest owner cash flow rights). Robust standard errors clustered by company are in parentheses. CF -cash flow.
Table 11 shows that pension fund ownership is not significantly related to future change in companies’ board directors’ age range. The addition of different sets of control variables does not change this ‘no-significance’ result.
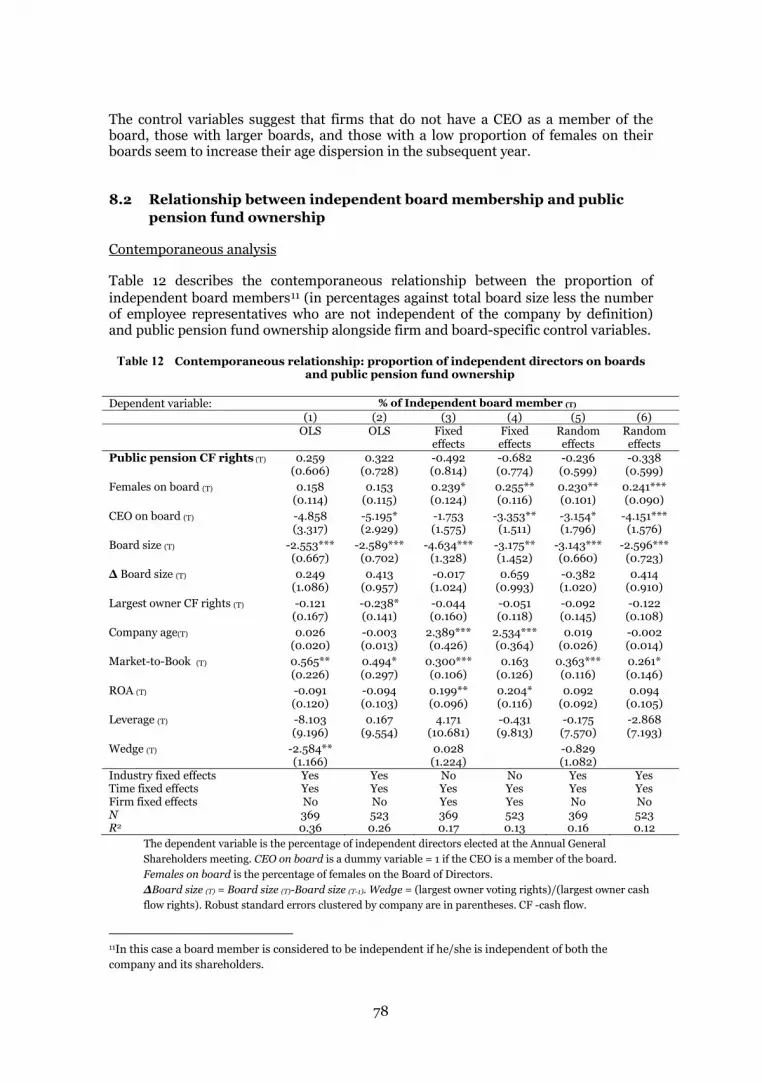
78
The control variables suggest that firms that do not have a CEO as a member of the board, those with larger boards, and those with a low proportion of females on their boards seem to increase their age dispersion in the subsequent year.
8.2 Relationship between independent board membership and public pension fund ownership
Contemporaneous analysis
Table 12 describes the contemporaneous relationship between the proportion of independent board members11 (in percentages against total board size less the number of employee representatives who are not independent of the company by definition) and public pension fund ownership alongside firm and board-specific control variables.
Table 12 Contemporaneous relationship: proportion of independent directors on boards and public pension fund ownership
Dependent variable: % of Independent board member (T) (1) (2) (3) (4) (5) (6) OLS OLS Fixed
effects Fixed effects
Random effects
Random effects
Public pension CF rights (T) 0.259 0.322 -0.492 -0.682 -0.236 -0.338 (0.606) (0.728) (0.814) (0.774) (0.599) (0.599)
Females on board (T) 0.158 0.153 0.239* 0.255** 0.230** 0.241*** (0.114) (0.115) (0.124) (0.116) (0.101) (0.090)
CEO on board (T) -4.858 -5.195* -1.753 -3.353** -3.154* -4.151*** (3.317) (2.929) (1.575) (1.511) (1.796) (1.576)
Board size (T) -2.553*** -2.589*** -4.634*** -3.175** -3.143*** -2.596*** (0.667) (0.702) (1.328) (1.452) (0.660) (0.723)
Board size (T) 0.249 0.413 -0.017 0.659 -0.382 0.414 (1.086) (0.957) (1.024) (0.993) (1.020) (0.910)
Largest owner CF rights (T) -0.121 -0.238* -0.044 -0.051 -0.092 -0.122 (0.167) (0.141) (0.160) (0.118) (0.145) (0.108)
Company age(T) 0.026 -0.003 2.389*** 2.534*** 0.019 -0.002 (0.020) (0.013) (0.426) (0.364) (0.026) (0.014)
Market-to-Book (T) 0.565** 0.494* 0.300*** 0.163 0.363*** 0.261* (0.226) (0.297) (0.106) (0.126) (0.116) (0.146)
ROA (T) -0.091 -0.094 0.199** 0.204* 0.092 0.094 (0.120) (0.103) (0.096) (0.116) (0.092) (0.105)
Leverage (T) -8.103 0.167 4.171 -0.431 -0.175 -2.868 (9.196) (9.554) (10.681) (9.813) (7.570) (7.193)
Wedge (T) -2.584** 0.028 -0.829 (1.166) (1.224) (1.082) Industry fixed effects Yes Yes No No Yes Yes Time fixed effects Yes Yes Yes Yes Yes Yes Firm fixed effects No No Yes Yes No No N 369 523 369 523 369 523 R2 0.36 0.26 0.17 0.13 0.16 0.12
The dependent variable is the percentage of independent directors elected at the Annual General Shareholders meeting. CEO on board is a dummy variable = 1 if the CEO is a member of the board. Females on board is the percentage of females on the Board of Directors.
Board size (T) = Board size (T)-Board size (T-1). Wedge = (largest owner voting rights)/(largest owner cash flow rights). Robust standard errors clustered by company are in parentheses. CF -cash flow.
11In this case a board member is considered to be independent if he/she is independent of both the company and its shareholders.
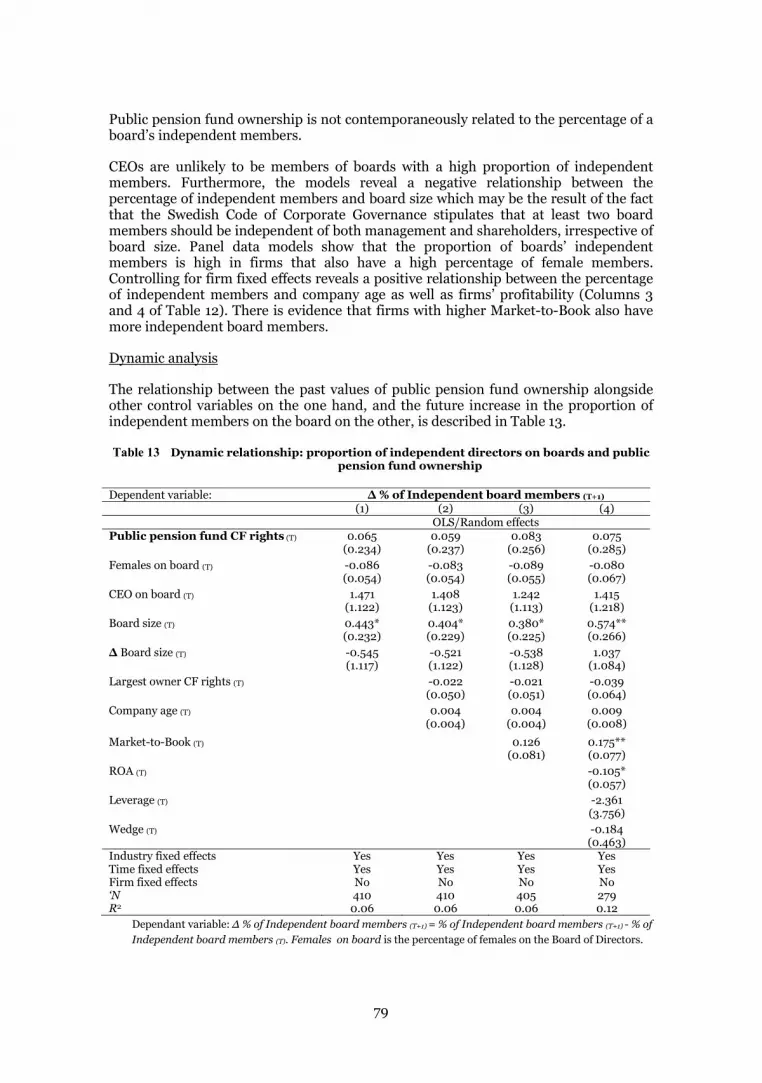
79
Public pension fund ownership is not contemporaneously related to the percentage of a board’s independent members.
CEOs are unlikely to be members of boards with a high proportion of independent members. Furthermore, the models reveal a negative relationship between the percentage of independent members and board size which may be the result of the fact that the Swedish Code of Corporate Governance stipulates that at least two board members should be independent of both management and shareholders, irrespective of board size. Panel data models show that the proportion of boards’ independent members is high in firms that also have a high percentage of female members. Controlling for firm fixed effects reveals a positive relationship between the percentage of independent members and company age as well as firms’ profitability (Columns 3 and 4 of Table 12). There is evidence that firms with higher Market-to-Book also have more independent board members.
Dynamic analysis
The relationship between the past values of public pension fund ownership alongside other control variables on the one hand, and the future increase in the proportion of independent members on the board on the other, is described in Table 13.
Table 13 Dynamic relationship: proportion of independent directors on boards and public pension fund ownership
Dependent variable: % of Independent board members (T+1) (1) (2) (3) (4) OLS/Random effects Public pension fund CF rights (T) 0.065 0.059 0.083 0.075 (0.234) (0.237) (0.256) (0.285)
Females on board (T) -0.086 -0.083 -0.089 -0.080 (0.054) (0.054) (0.055) (0.067)
CEO on board (T) 1.471 1.408 1.242 1.415 (1.122) (1.123) (1.113) (1.218)
Board size (T) 0.443* 0.404* 0.380* 0.574** (0.232) (0.229) (0.225) (0.266)
Board size (T) -0.545 -0.521 -0.538 1.037 (1.117) (1.122) (1.128) (1.084)
Largest owner CF rights (T) -0.022 -0.021 -0.039 (0.050) (0.051) (0.064)
Company age (T) 0.004 0.004 0.009 (0.004) (0.004) (0.008)
Market-to-Book (T) 0.126 0.175** (0.081) (0.077)
ROA (T) -0.105* (0.057)
Leverage (T) -2.361 (3.756)
Wedge (T) -0.184 (0.463) Industry fixed effects Yes Yes Yes Yes Time fixed effects Yes Yes Yes Yes Firm fixed effects No No No No ‘N 410 410 405 279 R2 0.06 0.06 0.06 0.12
Dependant variable: (T+1) = % of Independent board members (T+1) - % of Independent board members (T). Females on board is the percentage of females on the Board of Directors.
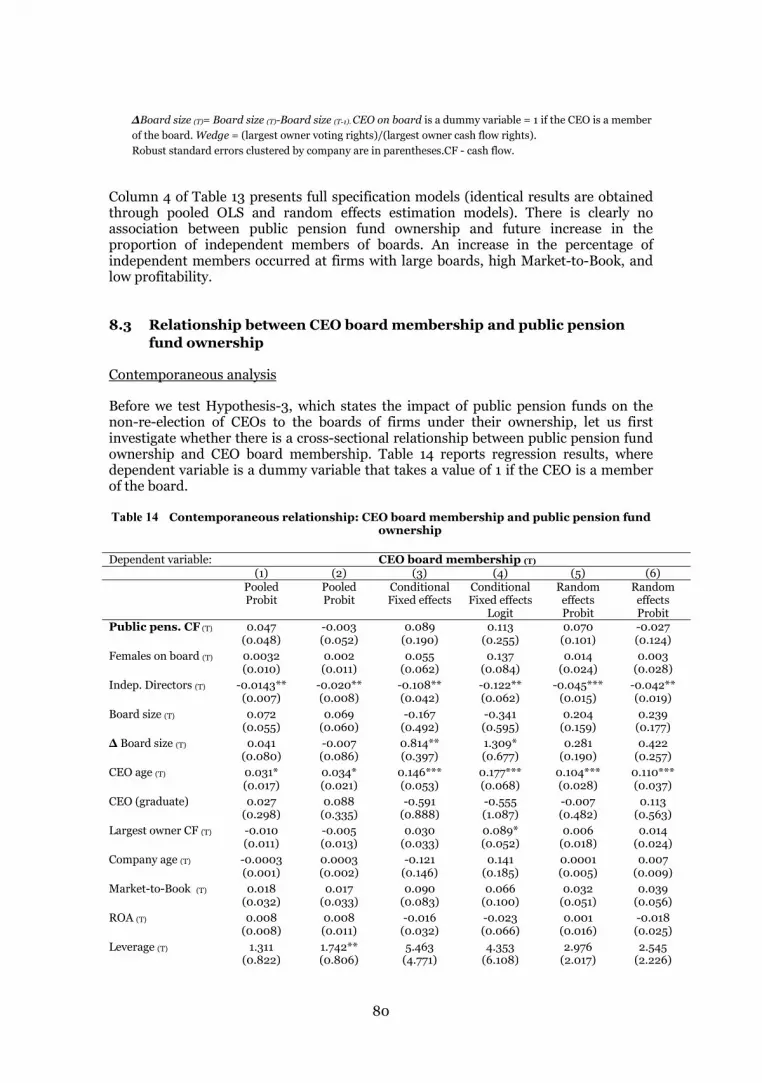
80
Board size (T)= Board size (T)-Board size (T-1). CEO on board is a dummy variable = 1 if the CEO is a member of the board. Wedge = (largest owner voting rights)/(largest owner cash flow rights). Robust standard errors clustered by company are in parentheses.CF - cash flow.
Column 4 of Table 13 presents full specification models (identical results are obtained through pooled OLS and random effects estimation models). There is clearly no association between public pension fund ownership and future increase in the proportion of independent members of boards. An increase in the percentage of independent members occurred at firms with large boards, high Market-to-Book, and low profitability.
8.3 Relationship between CEO board membership and public pension fund ownership
Contemporaneous analysis
Before we test Hypothesis-3, which states the impact of public pension funds on the non-re-election of CEOs to the boards of firms under their ownership, let us first investigate whether there is a cross-sectional relationship between public pension fund ownership and CEO board membership. Table 14 reports regression results, where dependent variable is a dummy variable that takes a value of 1 if the CEO is a member of the board.
Table 14 Contemporaneous relationship: CEO board membership and public pension fund ownership
Dependent variable: CEO board membership (T) (1) (2) (3) (4) (5) (6) Pooled
Probit Pooled Probit
Conditional Fixed effects
Conditional Fixed effects
Logit
Random effects Probit
Random effects Probit
Public pens. CF (T) 0.047 -0.003 0.089 0.113 0.070 -0.027 (0.048) (0.052) (0.190) (0.255) (0.101) (0.124)
Females on board (T) 0.0032 0.002 0.055 0.137 0.014 0.003 (0.010) (0.011) (0.062) (0.084) (0.024) (0.028)
Indep. Directors (T) -0.0143** -0.020** -0.108** -0.122** -0.045*** -0.042** (0.007) (0.008) (0.042) (0.062) (0.015) (0.019)
Board size (T) 0.072 0.069 -0.167 -0.341 0.204 0.239 (0.055) (0.060) (0.492) (0.595) (0.159) (0.177)
Board size (T) 0.041 -0.007 0.814** 1.309* 0.281 0.422 (0.080) (0.086) (0.397) (0.677) (0.190) (0.257)
CEO age (T) 0.031* 0.034* 0.146*** 0.177*** 0.104*** 0.110*** (0.017) (0.021) (0.053) (0.068) (0.028) (0.037)
CEO (graduate) 0.027 0.088 -0.591 -0.555 -0.007 0.113 (0.298) (0.335) (0.888) (1.087) (0.482) (0.563)
Largest owner CF (T) -0.010 -0.005 0.030 0.089* 0.006 0.014 (0.011) (0.013) (0.033) (0.052) (0.018) (0.024)
Company age (T) -0.0003 0.0003 -0.121 0.141 0.0001 0.007 (0.001) (0.002) (0.146) (0.185) (0.005) (0.009)
Market-to-Book (T) 0.018 0.017 0.090 0.066 0.032 0.039 (0.032) (0.033) (0.083) (0.100) (0.051) (0.056)
ROA (T) 0.008 0.008 -0.016 -0.023 0.001 -0.018 (0.008) (0.011) (0.032) (0.066) (0.016) (0.025)
Leverage (T) 1.311 1.742** 5.463 4.353 2.976 2.545 (0.822) (0.806) (4.771) (6.108) (2.017) (2.226)
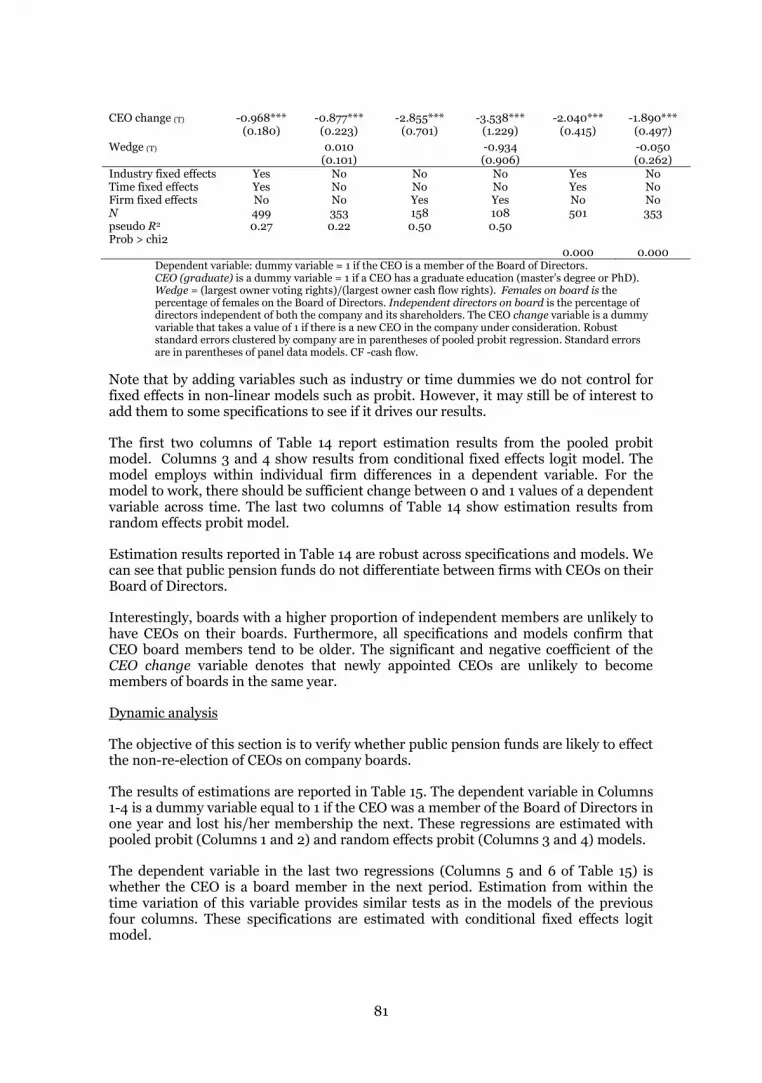
81
CEO change (T) -0.968*** -0.877*** -2.855*** -3.538*** -2.040*** -1.890*** (0.180) (0.223) (0.701) (1.229) (0.415) (0.497)
Wedge (T) 0.010 -0.934 -0.050 (0.101) (0.906) (0.262) Industry fixed effects Yes No No No Yes No Time fixed effects Yes No No No Yes No Firm fixed effects No No Yes Yes No No N 499 353 158 108 501 353 pseudo R2 Prob > chi2
0.27 0.22 0.50 0.50
0.000 0.000 Dependent variable: dummy variable = 1 if the CEO is a member of the Board of Directors. CEO (graduate) is a dummy variable = 1 if a CEO has a graduate education (master’s degree or PhD). Wedge = (largest owner voting rights)/(largest owner cash flow rights). Females on board is the percentage of females on the Board of Directors. Independent directors on board is the percentage of directors independent of both the company and its shareholders. The CEO change variable is a dummy variable that takes a value of 1 if there is a new CEO in the company under consideration. Robust standard errors clustered by company are in parentheses of pooled probit regression. Standard errors are in parentheses of panel data models. CF -cash flow.
Note that by adding variables such as industry or time dummies we do not control for fixed effects in non-linear models such as probit. However, it may still be of interest to add them to some specifications to see if it drives our results.
The first two columns of Table 14 report estimation results from the pooled probit model. Columns 3 and 4 show results from conditional fixed effects logit model. The model employs within individual firm differences in a dependent variable. For the model to work, there should be sufficient change between 0 and 1 values of a dependent variable across time. The last two columns of Table 14 show estimation results from random effects probit model.
Estimation results reported in Table 14 are robust across specifications and models. We can see that public pension funds do not differentiate between firms with CEOs on their Board of Directors.
Interestingly, boards with a higher proportion of independent members are unlikely to have CEOs on their boards. Furthermore, all specifications and models confirm that CEO board members tend to be older. The significant and negative coefficient of the CEO change variable denotes that newly appointed CEOs are unlikely to become members of boards in the same year.
Dynamic analysis
The objective of this section is to verify whether public pension funds are likely to effect the non-re-election of CEOs on company boards.
The results of estimations are reported in Table 15. The dependent variable in Columns 1-4 is a dummy variable equal to 1 if the CEO was a member of the Board of Directors in one year and lost his/her membership the next. These regressions are estimated with pooled probit (Columns 1 and 2) and random effects probit (Columns 3 and 4) models.
The dependent variable in the last two regressions (Columns 5 and 6 of Table 15) is whether the CEO is a board member in the next period. Estimation from within the time variation of this variable provides similar tests as in the models of the previous four columns. These specifications are estimated with conditional fixed effects logit model.
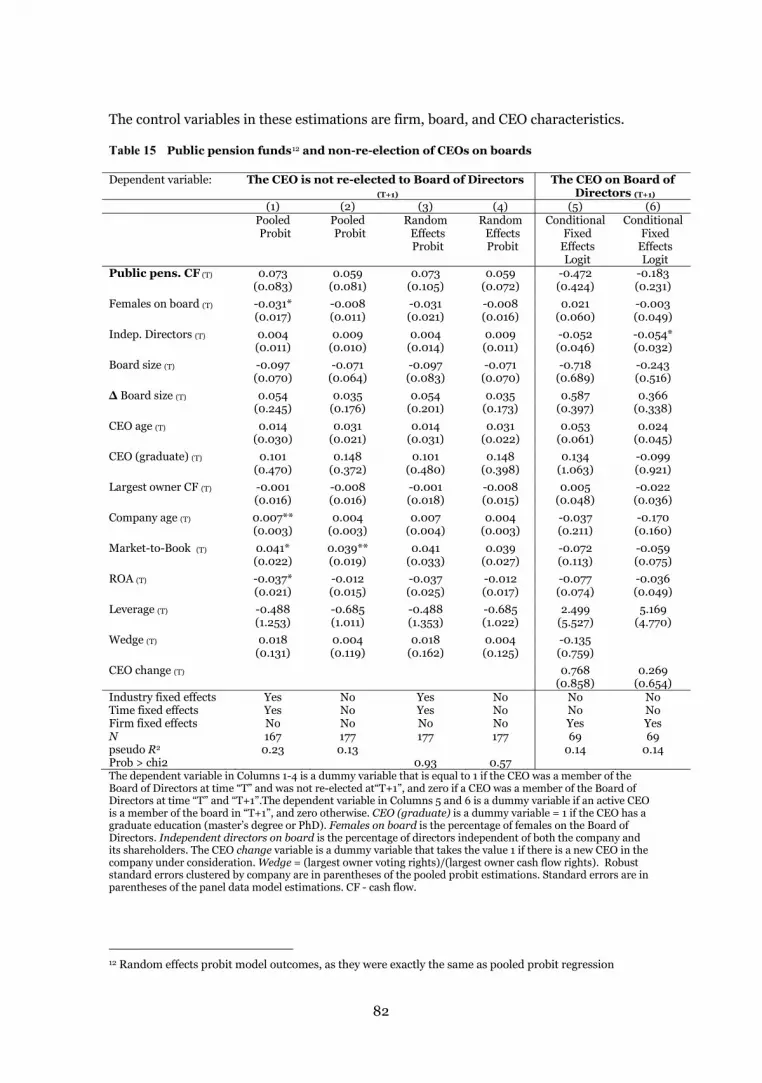
82
The control variables in these estimations are firm, board, and CEO characteristics.
Table 15 Public pension funds12 and non-re-election of CEOs on boards
Dependent variable: The CEO is not re-elected to Board of Directors (T+1)
The CEO on Board of Directors (T+1)
(1) (2) (3) (4) (5) (6) Pooled
Probit Pooled Probit
Random Effects Probit
Random Effects Probit
Conditional Fixed
Effects Logit
Conditional Fixed
Effects Logit
Public pens. CF (T) 0.073 0.059 0.073 0.059 -0.472 -0.183 (0.083) (0.081) (0.105) (0.072) (0.424) (0.231)
Females on board (T) -0.031* -0.008 -0.031 -0.008 0.021 -0.003 (0.017) (0.011) (0.021) (0.016) (0.060) (0.049)
Indep. Directors (T) 0.004 0.009 0.004 0.009 -0.052 -0.054* (0.011) (0.010) (0.014) (0.011) (0.046) (0.032)
Board size (T) -0.097 -0.071 -0.097 -0.071 -0.718 -0.243 (0.070) (0.064) (0.083) (0.070) (0.689) (0.516)
Board size (T) 0.054 0.035 0.054 0.035 0.587 0.366 (0.245) (0.176) (0.201) (0.173) (0.397) (0.338)
CEO age (T) 0.014 0.031 0.014 0.031 0.053 0.024 (0.030) (0.021) (0.031) (0.022) (0.061) (0.045)
CEO (graduate) (T) 0.101 0.148 0.101 0.148 0.134 -0.099 (0.470) (0.372) (0.480) (0.398) (1.063) (0.921)
Largest owner CF (T) -0.001 -0.008 -0.001 -0.008 0.005 -0.022 (0.016) (0.016) (0.018) (0.015) (0.048) (0.036)
Company age (T) 0.007** 0.004 0.007 0.004 -0.037 -0.170 (0.003) (0.003) (0.004) (0.003) (0.211) (0.160)
Market-to-Book (T) 0.041* 0.039** 0.041 0.039 -0.072 -0.059 (0.022) (0.019) (0.033) (0.027) (0.113) (0.075)
ROA (T) -0.037* -0.012 -0.037 -0.012 -0.077 -0.036 (0.021) (0.015) (0.025) (0.017) (0.074) (0.049)
Leverage (T) -0.488 -0.685 -0.488 -0.685 2.499 5.169 (1.253) (1.011) (1.353) (1.022) (5.527) (4.770)
Wedge (T) 0.018 0.004 0.018 0.004 -0.135 (0.131) (0.119) (0.162) (0.125) (0.759)
CEO change (T) 0.768 0.269 (0.858) (0.654) Industry fixed effects Yes No Yes No No No Time fixed effects Yes No Yes No No No Firm fixed effects No No No No Yes Yes N 167 177 177 177 69 69 pseudo R2
Prob > chi2 0.23 0.13
0.93
0.57 0.14 0.14
The dependent variable in Columns 1-4 is a dummy variable that is equal to 1 if the CEO was a member of the Board of Directors at time “T” and was not re-elected at“T+1”, and zero if a CEO was a member of the Board of Directors at time “T” and “T+1”.The dependent variable in Columns 5 and 6 is a dummy variable if an active CEO is a member of the board in “T+1”, and zero otherwise. CEO (graduate) is a dummy variable = 1 if the CEO has a graduate education (master’s degree or PhD). Females on board is the percentage of females on the Board of Directors. Independent directors on board is the percentage of directors independent of both the company and its shareholders. The CEO change variable is a dummy variable that takes the value 1 if there is a new CEO in the company under consideration. Wedge = (largest owner voting rights)/(largest owner cash flow rights). Robust standard errors clustered by company are in parentheses of the pooled probit estimations. Standard errors are in parentheses of the panel data model estimations. CF - cash flow.
12 Random effects probit model outcomes, as they were exactly the same as pooled probit regression
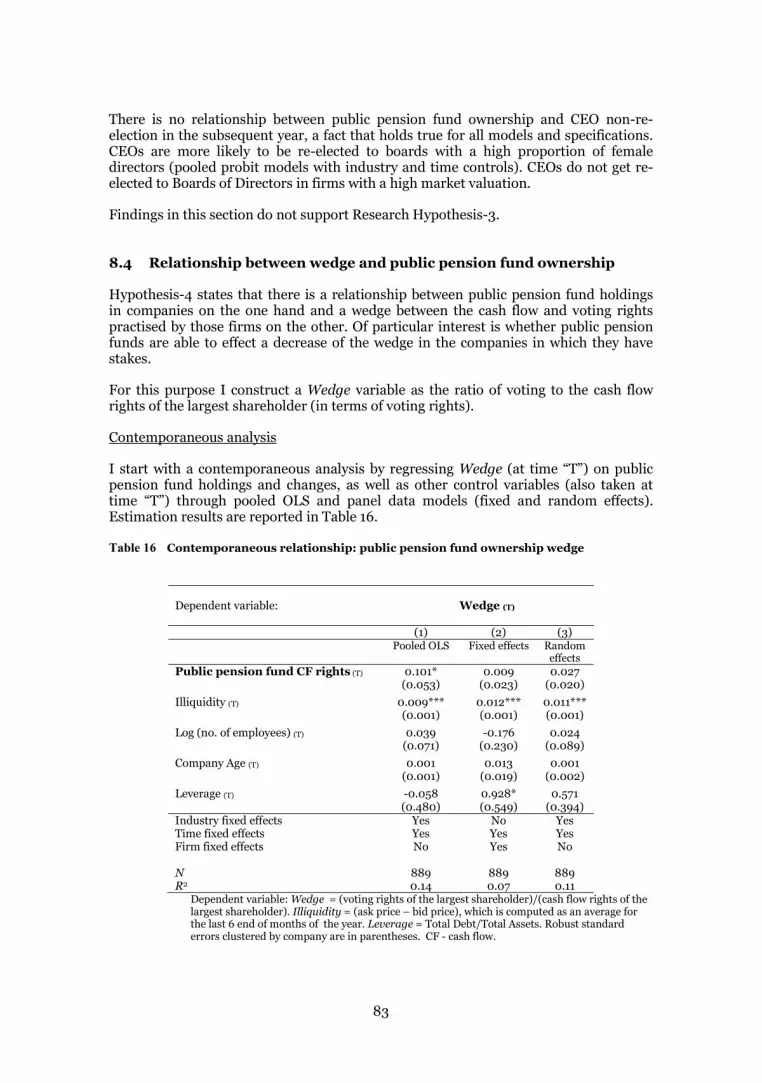
83
There is no relationship between public pension fund ownership and CEO non-re-election in the subsequent year, a fact that holds true for all models and specifications. CEOs are more likely to be re-elected to boards with a high proportion of female directors (pooled probit models with industry and time controls). CEOs do not get re-elected to Boards of Directors in firms with a high market valuation.
Findings in this section do not support Research Hypothesis-3.
8.4 Relationship between wedge and public pension fund ownership
Hypothesis-4 states that there is a relationship between public pension fund holdings in companies on the one hand and a wedge between the cash flow and voting rights practised by those firms on the other. Of particular interest is whether public pension funds are able to effect a decrease of the wedge in the companies in which they have stakes.
For this purpose I construct a Wedge variable as the ratio of voting to the cash flow rights of the largest shareholder (in terms of voting rights).
Contemporaneous analysis
I start with a contemporaneous analysis by regressing Wedge (at time “T”) on public pension fund holdings and changes, as well as other control variables (also taken at time “T”) through pooled OLS and panel data models (fixed and random effects). Estimation results are reported in Table 16.
Table 16 Contemporaneous relationship: public pension fund ownership wedge
Dependent variable:
Wedge (T)
(1) (2) (3) Pooled OLS Fixed effects Random
effects Public pension fund CF rights (T) 0.101* 0.009 0.027 (0.053) (0.023) (0.020)
Illiquidity (T) 0.009*** 0.012*** 0.011*** (0.001) (0.001) (0.001)
Log (no. of employees) (T) 0.039 -0.176 0.024 (0.071) (0.230) (0.089)
Company Age (T) 0.001 0.013 0.001 (0.001) (0.019) (0.002)
Leverage (T) -0.058 0.928* 0.571 (0.480) (0.549) (0.394) Industry fixed effects Yes No Yes Time fixed effects Yes Yes Yes Firm fixed effects No Yes No N 889 889 889 R2 0.14 0.07 0.11
Dependent variable: Wedge = (voting rights of the largest shareholder)/(cash flow rights of the largest shareholder). Illiquidity = (ask price – bid price), which is computed as an average for the last 6 end of months of the year. Leverage = Total Debt/Total Assets. Robust standard errors clustered by company are in parentheses. CF - cash flow.
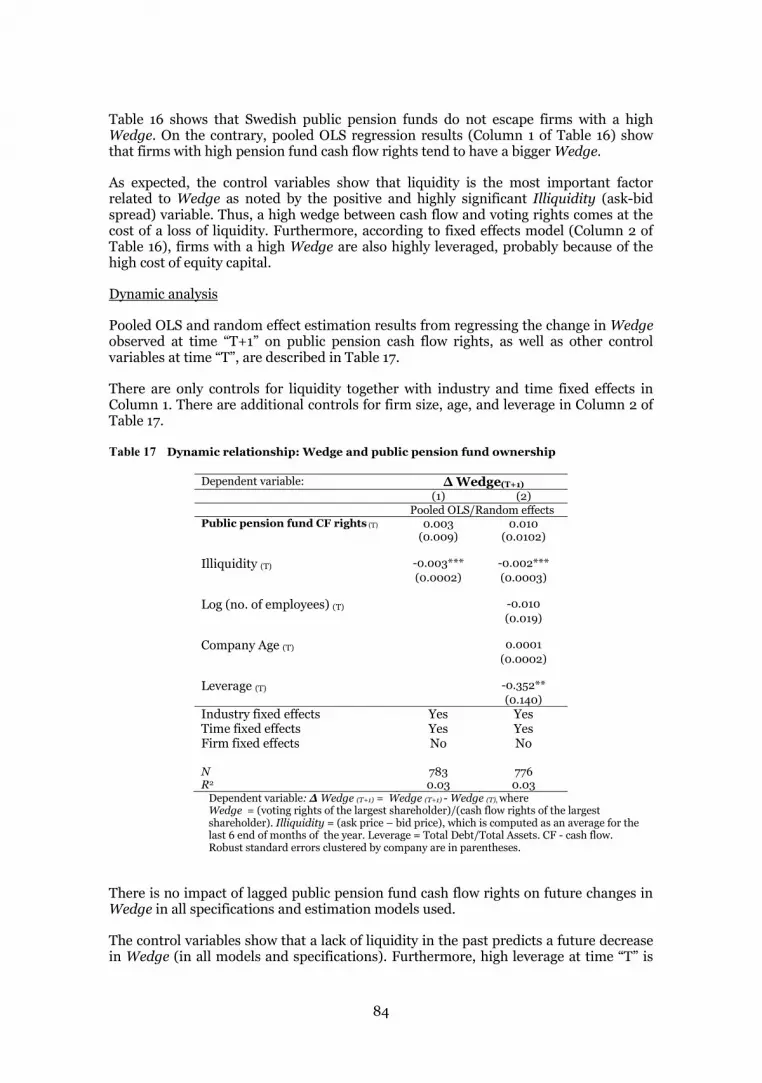
84
Table 16 shows that Swedish public pension funds do not escape firms with a high Wedge. On the contrary, pooled OLS regression results (Column 1 of Table 16) show that firms with high pension fund cash flow rights tend to have a bigger Wedge.
As expected, the control variables show that liquidity is the most important factor related to Wedge as noted by the positive and highly significant Illiquidity (ask-bid spread) variable. Thus, a high wedge between cash flow and voting rights comes at the cost of a loss of liquidity. Furthermore, according to fixed effects model (Column 2 of Table 16), firms with a high Wedge are also highly leveraged, probably because of the high cost of equity capital.
Dynamic analysis
Pooled OLS and random effect estimation results from regressing the change in Wedge observed at time “T+1” on public pension cash flow rights, as well as other control variables at time “T”, are described in Table 17.
There are only controls for liquidity together with industry and time fixed effects in Column 1. There are additional controls for firm size, age, and leverage in Column 2 of Table 17.
Table 17 Dynamic relationship: Wedge and public pension fund ownership
Dependent variable: (T+1) (1) (2) Pooled OLS/Random effects Public pension fund CF rights (T) 0.003 0.010 (0.009) (0.0102) Illiquidity (T) -0.003*** -0.002*** (0.0002) (0.0003) Log (no. of employees) (T) -0.010 (0.019) Company Age (T) 0.0001 (0.0002) Leverage (T) -0.352** (0.140) Industry fixed effects Yes Yes Time fixed effects Yes Yes Firm fixed effects No No N 783 776 R2 0.03 0.03
Dependent variable: Wedge (T+1) = Wedge (T+1) - Wedge (T), where Wedge = (voting rights of the largest shareholder)/(cash flow rights of the largest shareholder). Illiquidity = (ask price – bid price), which is computed as an average for the last 6 end of months of the year. Leverage = Total Debt/Total Assets. CF - cash flow. Robust standard errors clustered by company are in parentheses.
There is no impact of lagged public pension fund cash flow rights on future changes in Wedge in all specifications and estimation models used.
The control variables show that a lack of liquidity in the past predicts a future decrease in Wedge (in all models and specifications). Furthermore, high leverage at time “T” is

85
associated with a decrease in wedge at time “T+1”. It is likely that, with this wedge decrease, the cost of equity capital in time “T+1” becomes lower, resulting in higher leverage than in the past.

86
9 CONCLUSION
I have investigated whether Swedish public pension funds (the AP funds: AP-1, AP-2, AP-3, AP-4, AP-6, and AP-7) have improved the corporate governance of firms in their portfolio.
In particular, I have examined the relationship between public pension fund cash flow rights and factors considered to be corporate governance beneficial, such as board diversity (for example, increasing the proportion of female and foreign board members, as well as widening board directors’ age range), the proportion of independent members on boards, CEO board memberships, and the wedge between the voting and cash flow rights.
I have found no significant relationship between public pension fund cash flow rights and any future increase in the proportion of female board members or any increase in directors’ age range. There is a negative relationship between public pension fund ownership and future change in the proportion of foreigners on boards, a fact which may signify these funds’ preference for “Swedish” boards –and which does not support the diversification hypothesis.
In further analysis I have not identified a significant influence of public pension funds on any increase in the proportion of independent directors on boards, the non-re-election of CEOs to boards, or the decrease in the wedge between companies’ cash flow and voting rights.
Estimation results do not support the notion that public pension funds have a beneficial impact on firms’ corporate governance.
87
REFERENCES
Adams, R., Ferreira, D., 2008, “One Share-One Vote: The Empirical Evidence”, Review of Finance (2008) 12, pp. 51-91
Adams, R., Ferreira, D., 2009, “Women in the boardroom and their impact on governance and performance”, Journal of Financial Economics 94(2), pp. 291-309.
Aggarwal R., Erel I., Ferreira M., and Matos P., 2011, “Does governance travel around the world? Evidence from institutional investors”, Journal of Financial Economics 100 (2011) pp. 154–181
Conger J., Lawler E., 2001, “Building a high-performing board: How to choose the right members”, Buisness Strategy Review, 2001, Volume 12, Issue 3, pp 11-19
Carter, D., Simkins, B.. and Simpson, W., 2003, “Corporate Governance, Board Diversity, and Firm Value”, Financial Review, 38, pp. 33–53
Carter, D., D'Souza, F., Simkins, B., & Simpson, W.G., 2010, “The Gender and Ethnic Diversity of US Boards and Board Committees and Firm Financial Performance”, Corporate Governance: An International Review, 18(5), pp. 396-414
Claessens S., Djankov S., Fan J., Lang L., 2002, “Disentangling the Incentive and Entrenchment Effects of Large Shareholdings”, The Journal of Finance , Vol. 57, No. 6 (Dec., 2002), pp. 2741-2771
Clark G, Hebb T. 2004, “Pension Fund Corporate Engagement: The Fifth Stage of Capitalism”, Industrial Relations, Vol. 59 (1) pp. 142–171.
Conger J., Lawler E., 2001, “Building a high-performing board: How to choose the right members”, Business Strategy Review, 12(3), pp. 11-19
Cornett M., Marcus A., Saunders A., Tehranian H., 2007, “The impact of institutional ownership on corporate governance performance”, Journal of Banking & Finance 31, pp. 1771-1794
Cotter, F., Shivdasani A., Zenner M., 1997, “Do independent directors enhance target shareholder wealth during tender offers?”, Journal of Financial Economics, Vol. 43, Issue 2, pp. 195–218
Del Guercio D., 1996, “The distorting effect of the prudent-man laws on institutional equity investments”, Journal of Financial Economics, Vol. 40, No 1, pp. 31-62
88
Del Guercio D., Hawkins J., 1999, “The motivation and impact of pension fund activism”, Journal of Financial Economics, Volume 52, Issue 3, June 1999, pp. 293–340
Dey A., Wang X., Nikolaev V., 2009, “Disproportional Control Rights and the Bonding Role of Debt”, Available at SSRN: http://ssrn.com/abstract=1516351 , retrieved in November 2013
Faccio M., Lasfer, M., 2002, “Institutional Shareholders and Corporate Governance: The Case of U.K. Pension Funds”, in J. McCahery et al. (eds.), Corporate Governance Regimes: Convergence and Diversity, (Oxford University Press: Oxford), pp. 603-624
Ferreira D., 2010, “Board Diversity, in Corporate Governance: A Synthesis of Theory, Research, and Practice (eds H. K. Baker and R. Anderson)”, John Wiley & Sons, Inc., Hoboken, NJ, USA. doi: 10.1002/9781118258439.ch12
Ferreira, M., Massa, M., Matos, P., 2010, “Shareholders at the gate? institutional investors and cross-border mergers and acquisitions”, Review of Financial Studies 23, pp. 601–644
Fondas, N., S. Sassalos 2000, “A different voice in the boardroom: how the presence of women directors affects board influence over management”, Global Focus 12, pp. 13–22.
Giannetti M., Laeven L., 2009, “Pension reform, ownership structure, and corporate governance: Evidence from a natural experiment”, The Review of Financial Studies v 22 n 10, pp. 4091-4127
Gompers P., Ishii J., Metrick A., 2010, “Extreme Governance: An Analysis of Dual-Class Firms in the United States”, The Review of Financial Studies 23(3), pp. 1051-1088.
Gregoric A., Oxelheim L., Randoy T., Thomsen S., 2013, “Changing the Corporate Elite? Not So Easy., Female Directors' Appointments onto Corporate Boards”, IFN Working Paper No 978
Hartzell J, Starks L., 2003, “Institutional Investors and Executive Compensation”, The Journal of Finance Volume 58, Issue 6, pp. 2351–2374
Hermalin B., Weisbach M., 2003, “Boards Of Directors As An Endogenously Determined Institution: A Survey Of The Economic Literature”, Economic Policy Review, Vol.9, pp. 7-26
Houle C., 1990, “Who should be on your Board?”, Nonprofit World, 8 (1), pp. 33-35.
Iglesias-Palau A., 2000, “Pension reform and corporate governance: impact in Chile”, Revista ABANTE, vol. 3, pp. 111-143
89
Institutional Shareholder Services, 2007, “Proportionality between ownership and control in EU listed companies: External study commissioned by the European Commission”
Kang H., Cheng M., Gray S., 2007, “Corporate Governance and Board Composition: Diversity and Independence of Australian Boards”, Corporate Governance: An International Review, Vol. 15, No. 2, pp. 194-207
Kim J., Lin J., Singh A., Yu W., 2007, “Dual-class splits and stock liquidity”, Working paper
Lauterbach B., Pajuste A., 2013, “Voluntary Dual Class Share Unifications – a Mixed Bag of Governance Improvements and Shareholder Expropriation”, Presented at Tel-Aviv University, Israel (June 2013).
Lins K., 2003, “Equity Ownership and Firm Value in Emerging Markets”, Journal of Financial and Quantitative Analysis vol. 38, no. 1., pp. 159-184
McConnell J., Servaes H., 1990, “Additional evidence on equity ownership and corporate value”. Journal of Financial Economics 27, pp. 595–612.
Oxelheim L., Randoy T., 2001, “The Impact of Foreign Board Membership on Firm Value”, Research Institute of Industrial Economics Working Paper No. 567: 1-37
Pajuste A., 2005, “Determinants And Consequences Of The Unification Of Dual-Class Shares”, European Central Bank, Working paper No 465
Rosenstein S, Wyatt JG. 1990, “Outside directors, board independence, and shareholder wealth”, Journal of Financial Economics, 26, pp.175–91.
Rosenstein S, Wyatt JG. 1997, “Inside directors, board effectiveness, and shareholder wealth”, Journal of Financial Economics, 44(2), pp. 229–50
Ruigrok W., Peck S., Tacheva S., 2007, “Nationality and Gender Diversity on Swiss Corporate Boards”, Corporate Governance: An International Review Volume 15, Issue 4, pp. 546–557
Shivdasani A., Yermack D., 1999, “CEO Involvement in the Selection of New Board Members: An Empirical Analysis”, The Journal of Finance , Vol. 54, No. 5, pp. 1829-1853
Wahal S., 1996, “Pension fund activism and firm performance”, Journal of Financial and Quantitative Analysis, Vol. 31, pp. 1-23
Woidtke T., 2002, “Agents watching agents? Evidence from pension fund ownership and firm value”, Journal of Financial Economics 63, pp. 99-131

90
Web citations:
AP-1, 2011, “A Dedicated Owner”, available at: <http://www.ap1.se/en/Corporate-governance/>, accessed: 18.11.2013
AP-2, 2010a, “Corporate governance policy principles. Shareholder Structure”, available at: < http://www.ap2.se/en/corporate-governance-/Corporate-governance-policy-9-principles/3-Shareholder-structure/>, accessed: 18.11.2013
AP-2, 2010b, “Corporate governance 9 policy principles. 4 Board of directors and nomination process”, available at: < http://www.ap2.se/en/corporate-governance-/Corporate-governance-policy-9-principles/4-Board-of-directors-and-nomination-process/>, accessed: 18.11.2013
AP-2, 2014, “Corporate governance policy”, available at: <http://www.ap2.se/en/corporate-governance-/>, accessed: 01.11.2013
AP-4, 2013, “Responsible investors contribute to positive change”, <http://www.ap4.se/web/templates/Page.aspx?id=368>, accessed: 18.11.2013
Swedish Code of Corporate Governance, 2008, Swedish Corporate Governance Board, available at: <http://www.corporategovernanceboard.se/media/35382/swecode_08_090421.pdf>, accessed: 18.11.2013
Swedish Code of Corporate Governance, 2010, Produced by Hallvarsson & Halvarsson. Printed by Trosa Tryckeri, Stockholm, available at: <http://www.corporategovernanceboard.se/media/45322/svenskkodbolagsstyrn_2010_eng_korrigerad20110321.pdf>, accessed: 18.11.2013
91
PUBLIC PENSION FUNDS AS SHAREHOLDERS AND FIRM PERFORMANCE1
Naufal Alimov*
Abstract
The extent to which actively managed pension funds believe that they add value to their holdings is an important question. Are public pension funds likely to “vote with their feet”, or do they instead try to have an impact when they become dissatisfied with the performance of companies in their portfolios? This study thus tests two competing hypotheses: “exit”, that is, sell underperforming company shares, or “direct impact”, that is, contribute actively to securing the resignation of underperforming CEOs and Boards of Directors.
In testing the “exit” hypothesis through an investigation of quarterly data, I find that ownership by public pension funds significantly decreased if a company was in the group with the lowest ROA during the previous consecutive 1 to 3 quarters.
I do not find a significant relationship between CEO resignation and public pension fund ownership in companies that had the lowest ROA in the previous several consecutive quarters. Furthermore, analysis of annual data does not identify an increase in the board replacement ratio of underperforming companies facilitated by public pension funds, as suggested by the “direct impact” hypothesis.
Thus, the findings in this study indicate that Swedish public pension funds tend to sell their shares in underperforming companies, instead of seeking to influence them through corporate governance mechanisms that would increase the likelihood that underperforming CEOs or the Boards of Directors be replaced.
JEL Classification: G11, G23, G28, G30, G38, M21
Key words: Institutional investors, pension funds, corporate governance, investment decisions
*Hanken School of Economics, Department of Economics
1 I would like to thank Ulf Jakobsson, Tom Berglund, Martin Holmen, Robert Gillanders, Praveen Malla, and Laura Arranz Aperte, as well as participants at the Nordic Corporate Governance Workshop (Stockholm), the PhD Workshop in Corporate Governance (Helsinki), seminars at the Hanken Centre for Corporate Governance for their helpful comments; and the Marcus Wallenberg Foundationand theHanken Foundation for their financial support. I am also grateful to SIS Ägarservice AB for providing me with ownership data on Swedish listed companies.
92
1 INTRODUCTION
As noted by Black (1990), institutional investors are able to exploit economies of scale to overcome the shareholder passivity common to individual investors. However, he acknowledges that there are various legal barriers, conflicts of interest, and monitoring costs that may preclude institutional investors from being engaged in shareholder activism instead of “voting with their feet”. In this study I investigate whether institutional investors tend to impact the governance of firms directly, rather than simply selling their shares of companies.
At the turn of the millennium Sweden created a competitive environment for public pension funds (AP funds). It is thought that this setting provides a benevolent environment for their active corporate governance involvement. Therefore, if it is found that Swedish pension funds are ineffective in their corporate governance in such an environment, it will afford strong evidence that this type of institutional investors is ill-equipped to solve corporate governance problems.
The prevalent claim of Swedish AP funds is that they practise “direct impact” channels of influence:
“Shareholder activism is about how the shareholders in a company influence the company to take its corporate responsibility. Första AP-fonden’s shareholder activism covers three areas internationally known as ESG, which stands for Environment, Social and Governance. Första AP-fonden takes an active approach to ownership issues even outside the official channels, such as nominating committees and general meetings. This is done via dialogues with the companies, individually or in cooperation with other shareholders.” (AP-1, 2016)
“The Second AP Fund is tasked with the ownership and management of the capital it receives and is actively engaged in addressing environmental, ethical and corporate governance issues associated with these responsibilities”. (AP-2, 2015, pp. 2)
The objective of this study is to empirically test whether reform-generated Swedish public pension funds are inclined to influence the governance of companies (the “direct impact” hypothesis) or sell company shares (the “exit” hypothesis) when dissatisfied with performance. The analysis focuses on underperforming companies, as these would most profit from governance intervention.
I find that, in line with the “exit” hypothesis, Swedish public pension funds significantly decreased their ownership in companies that underperformed in their ROAs in up to 3 consecutive quarters.
However, I do not find support for the “direct impact” hypothesis. In particular, I focus on the likelihood that public pension funds seek to effect the resignation of CEOs and the replacement of the Board of Directors if they decide to stay with such underperforming companies. I do not find a significant positive relationship between CEO resignation and public pension fund ownership in companies that had the lowest ROA in the previous consecutive 3 quarters. Furthermore, a study of the annual data does not reveal that public pension funds facilitate an increase in the replacement rate of badly performing Boards of Directors.
Thus, the findings in this study indicate that Swedish public pension funds tend to sell shares of underperforming companies rather than seek to influence them through corporate governance mechanisms, thereby increasing the likelihood that underperforming CEOs will resign or Boards of Directors will be replaced.

93
In the next section I describe the literature on the role of institutional shareholders in firms’ governance. This is followed by a statement of research hypotheses in section 3, a description of data in section 4, and empirical tests of two competing hypotheses in section 5. Discussion and conclusions are presented in the final sections.
94
2 LITERATURE REVIEW
It is claimed that the involvement of institutional investors in firms’ corporate governance depends on whether their investments in companies are short-term or long-term (Bushee, 1998; Bushee, 2001; Chen et al., 2007) and whether they have had previous business relations with them (Cornett et al., 2007; Bhattacharya & Graham, 2007; Gianneti & Laeven, 2009). This stream of research suggests that institutional investors are more likely to be active in a firm’s corporate governance if they have had no prior relationship with it, and if their investment in this company is long-term.
Some early studies of US data find evidence that large public pension funds such as CalPERS –the California Public Employees’ Retirement System – were involved in the corporate governance of firms during the 1980s (Smith, 1996; Duggal & Millar, 1999; Del Guercio & Hawkins, 1999). For example, Smith (1996) finds that CalPERS was successful in changing the corporate governance structures of targeted firms.
Del Guercio & Hawkins (1999) confirm that there were significantly higher corporate changes in targeted firms after a submission of shareholder proposals by US pension funds. They claim that a pension fund initiating shareholder proposals had no significant impact on stock returns or accountability measures, even if they were successful in effecting change in targeted firms’ corporate governance activity.
However, Wahal (1996) concludes that monitoring by US pension funds is ineffective. He investigates firms targeted by nine major US pension funds, and finds no significant short-term or long-term improvements in stock price or accountability measures during these firms’ post-targeting periods.
Nor is evidence from other countries on the effectiveness of institutional investors in solving corporate governance problems conclusive (Faccio & Lasfer, 2002; Giannetti & Laeven, 2009; Becht et al., 2007; Rose, 2007).
According to Faccio & Lasfer (2002) occupational pension funds in the UK are more passive than those in the US. They reveal no significant relationship between occupational pension fund holdings and the duality of the CEO/board chairperson, the size of the board, or the number of executive directors.
Becht et al. (2007), who investigate shareholder activism by the Hermes UK focus fund, come to a different conclusion. They find that the Hermes UK focus fund caused substantial corporate restructuring in targeted firms, achieved primarily through private negotiations rather than shareholder proposals or proxy statements.
Recent reforms of pension systems in a number of countries have provided researchers with an opportunity to exploit exogenous shock in ownership structure in their study of the role played by institutional shareholders in firms’ governance. A good example here is the analysis by Giannetti & Laeven (2009), who investigate Swedish data following the pension reform of the early 2000s. The authors find a positive relationship between firms’ market valuation and public pension fund holdings, which they attribute to the latter’s capacity to improve firms’ corporate governance.
The alternative impact channel – that is, institutional investors “voting with their feet”–is tested by Parrino et al. (2003). They find no significant change in institutional ownership before and after voluntary CEO turnover. On the other hand, institutional

95
ownership decreased two years before a forced CEO turnover. This is a clear example of the impact institutional investors may have even when they “exit”.
The disciplining effect of institutional investors voting with their feet found by Parrino et al. (2003) was also tested for later periods by Helwege et al. (2012). They find that institutional investors’ voting with their feet in underperforming companies decreased during the later periods, and was therefore unlikely to explain an increase in forced CEO turnover.
In summary, the evidence on the impact channels preferred by institutional investors both in the US and in Europe is mixed. In this paper I introduce further empirical evidence by focusing on the role of public pension funds in underperforming firms using the Swedish natural pension system experiment as a background.
96
3 RESEARCH HYPOTHESES
The main objective of Swedish AP funds is to maintain the stability of the pension system, while attaining a long-term high return on the investment of accumulated public money. How this goal is achieved in practice is an important question. These public pension funds confirm that they face the dilemma of “voting with their feet” or trying to make an impact through corporate governance:
“The Fund shall therefore only be an active owner in those cases where action could influence the longterm rate of return and/or the risk in a favourable direction. In accordance with a Government Bill that is the basis of the reformed pension system, it would not be desirable that the AP funds took a pronounced active ownership role…”. (AP-1, Annual Report 2001, pp. 15)
“In its capacity of a major shareholder, Första AP-fonden is able to influence the companies in which it invests – shareholder activism. The Fund’s influence shall be exerted such that it helps increase the Fund’s long-term return. In our view, active ownership makes our investments more sustainable. We are involved and influence the companies in which we own shares, taking them in what we consider to be the right direction. It can be a case of board composition, remuneration and incentive programmes, capital structure, labour rights issues, the environment and safety. We work in a structured manner with sustainability analysis both ahead of an investment, and as owners.” (AP-1, 2014, pp. 4)
This study aims to assess the two alternative approaches taken by AP funds by investigating their ownership strategies for underperforming Swedish companies2. The study’s focus on underperforming companies is justified because these companies need governance intervention most.
If pension funds are indeed corporate governance activists, they should try to remedy problems instead of adopting a sell-off strategy when a firm is underperforming.
The “exit hypothesis”, taking ROA as a measure of firm performance, is as follows:
Research Hypothesis-1:
Public pension funds do not sell shares of companies that have a low ROA.
If Swedish public pension funds are committed to remedying problems in underperforming firms, they should effect the dismissal of underperforming CEOs and Boards of Directors (the “direct impact” hypothesis).
2 It is indeed the case that AP funds have equity in foreign companies, but this is mostly indexed and managed externally:
“The external management is passive, implying close to benchmark, while management of the internal portfolio is more active.” (AP-1, Annual Report 2001, pp. 22).
“Virtually all the large international fund managers are to some extent engaged in “passive” or index-related asset management. This involves managing all or at least the greater part of a fund’s own equities or fixed income portfolio to mirror a selected index. In practice, this means that the particular fund’s own portfolio consistently mimics the performance of the chosen index. International fund managers often choose the MSCI” (AP-1, Annual Report 2002, pp. 7).

97
Research Hypothesis-2.1:
CEOs are fired more often in underperforming firms with a high level of public pension fund ownership.
Research Hypothesis-2.2:
Boards of Directors are more likely to be replaced in underperforming firms with a high level of public pension fund ownership.
Not rejecting research hypotheses would support the argument that Swedish public pension funds are committed to companies under their ownership, and do not simply “vote with their feet” when a firm starts underperforming.

98
4 DATA
Annual and quarterly data were collected on companies listed on the Stockholm Stock Exchange for the period 2001-2012. To avoid survivorship bias, only companies that were listed as of 2001 were included in the sample. There are 193 Swedish listed companies in the sample, out of which 40 were either delisted or merged.
Annual ownership data was retrieved through the Thomson One database, which provides information on the ownership of all investors holding a very small percentage (considerably less than 1%) of companies’ cash flow rights. Quarterly ownership data was obtained from SIS Ägarservice AB (2013), which identifies the cash flow and voting rights of the 200 biggest shareholders in companies. Ownership at delisted and merged companies was collected from “Agarna Och Markten” by Fristedt & Sundqvist (2001-2009). This book series shows the 25 largest owners of Swedish listed companies.
Information on CEO resignation and board replacement rate was collected manually through companies’ annual reports. Financial data was obtained via the Thomson One database, as well as the Orbis database of the Bureau van Dijk.
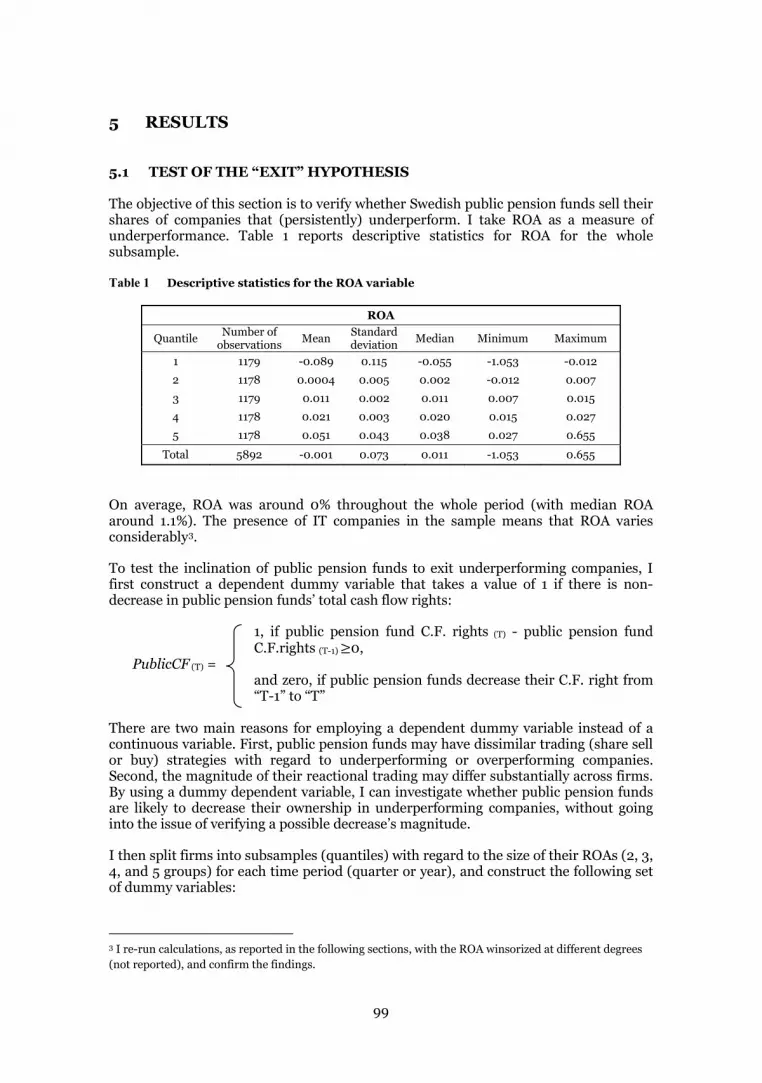
99
5 RESULTS
5.1 TEST OF THE “EXIT” HYPOTHESIS
The objective of this section is to verify whether Swedish public pension funds sell their shares of companies that (persistently) underperform. I take ROA as a measure of underperformance. Table 1 reports descriptive statistics for ROA for the whole subsample.
Table 1 Descriptive statistics for the ROA variable
ROA
Quantile Number of observations Mean Standard
deviation Median Minimum Maximum
1 1179 -0.089 0.115 -0.055 -1.053 -0.012
2 1178 0.0004 0.005 0.002 -0.012 0.007
3 1179 0.011 0.002 0.011 0.007 0.015
4 1178 0.021 0.003 0.020 0.015 0.027
5 1178 0.051 0.043 0.038 0.027 0.655
Total 5892 -0.001 0.073 0.011 -1.053 0.655
On average, ROA was around 0% throughout the whole period (with median ROA around 1.1%). The presence of IT companies in the sample means that ROA varies considerably3.
To test the inclination of public pension funds to exit underperforming companies, I first construct a dependent dummy variable that takes a value of 1 if there is non-decrease in public pension funds’ total cash flow rights:
1, if public pension fund C.F. rights (T) - public pension fund C.F.rights (T-1) 0,
PublicCF (T) = and zero, if public pension funds decrease their C.F. right from “T-1” to “T”
There are two main reasons for employing a dependent dummy variable instead of a continuous variable. First, public pension funds may have dissimilar trading (share sell or buy) strategies with regard to underperforming or overperforming companies. Second, the magnitude of their reactional trading may differ substantially across firms. By using a dummy dependent variable, I can investigate whether public pension funds are likely to decrease their ownership in underperforming companies, without going into the issue of verifying a possible decrease’s magnitude.
I then split firms into subsamples (quantiles) with regard to the size of their ROAs (2, 3, 4, and 5 groups) for each time period (quarter or year), and construct the following set of dummy variables:
3 I re-run calculations, as reported in the following sections, with the ROA winsorized at different degrees (not reported), and confirm the findings.
100
1, if a firm belonged to the lowest ROA group out of “G” groups for “N” last quarters in a row
ROAG,N dummy = and zero otherwise Here, G {2, 3, 4, 5}, and N {1, 2, 3}
This construction of ROA dummies allows (1) an analysis of pension funds’ strategies in firms that underperformed for several consecutive periods and (2) a definition of underperformance at different stringency levels4. It is not possible to follow this strategy with a continuous ROA variable.
Finally, I regress through pooled probit model PublicCF from time “T” on ROA dummies alongside other control variables (all in last quarter values) as listed below: Largest owner cash flow rights5 – as a proxy for ownership concentration (Giannetti & Laeven, 2009); Debt/Total assets – leverage as a measure of control by creditors of the firm (Pedersen & Thomsen, 2003); Market-to-Book ratio – market valuation of firms (Del Guercio, 1996); Illiquidity6 – as a control for liquidity concerns (Maug, 1998); Logarithm of the number of employees – firm size as a control for firm-specific risk (Gompers & Metrick 2001; Parrino et al., 2003; Pedersen & Thomsen, 2003; Demsetz & Lehn, 1985); industry and time fixed effects.
Note that board size is highly correlated with firm size (a logarithm of the number of employees) and leverage (see Table 2). It is therefore reasonable not to include this variable simultaneously in the regressions for multicollenearity reasons.
I conduct separate analyses with raw (industry-unadjusted) ROAs and industry-adjusted ROAs. For this reason I introduce additional notation to ROAG,N dummies, such that ROArawG,N denotes dummies constructed from industry-unadjusted raw ROAs, and ROAindG,N denotes dummies constructed from industry-adjusted ROAs.
4 More stringent when “N” is 4 rather than 3, for example. 5 Using largest owner voting rights instead of cash flow rights as a measure of ownership concentration in regressions did not affect the major findings 6Illiquidity = (ask price – bid price)/(mid price), which is computed on weekly (end of week) ask-and-bid prices
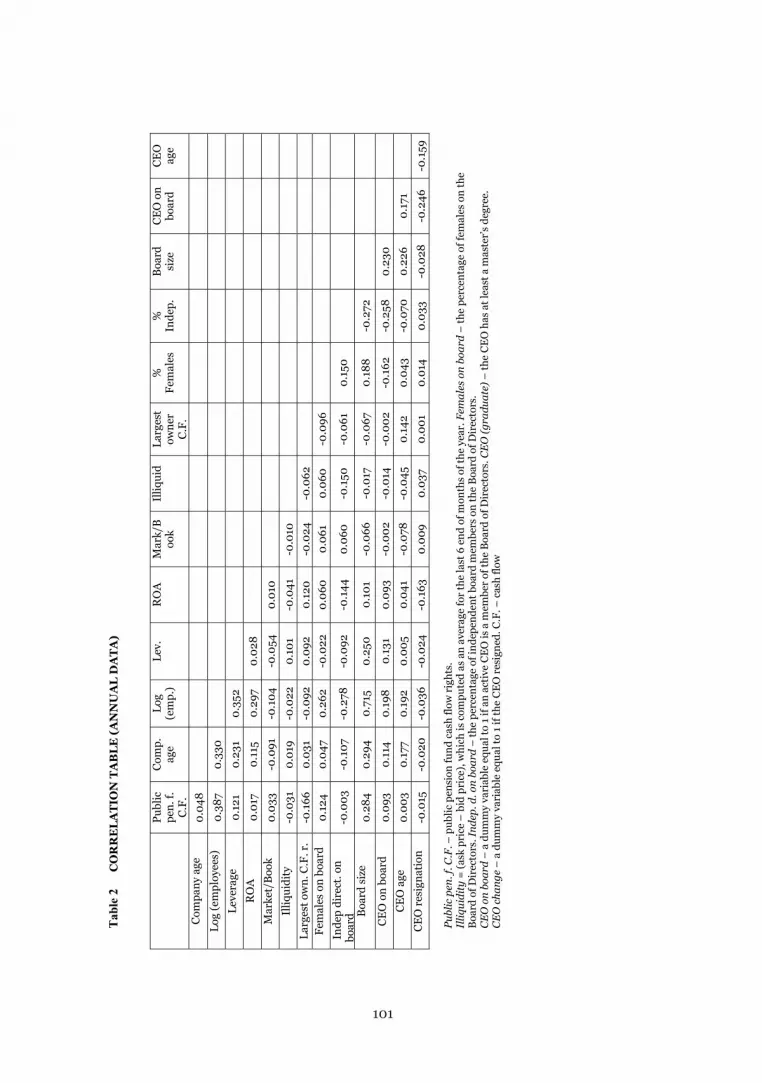
Tab
le 2
C
OR
RE
LA
TIO
N T
AB
LE
(A
NN
UA
L D
AT
A)
Publ
ic
pen.
f.
C.F
.
Com
p.
age
Log
(em
p.)
Lev.
R
OA
M
ark/
Boo
k Il
liqui
d La
rges
t ow
ner
C.F
.
%
Fem
ales
%
In
dep.
B
oard
si
ze
CE
O o
n bo
ard
CE
O
age
Com
pany
age
0.
048
Log
(em
ploy
ees)
0.
387
0.33
0 Le
vera
ge
0.12
1 0.
231
0.35
2 R
OA
0.
017
0.11
5 0.
297
0.02
8 M
arke
t/B
ook
0.03
3 -0
.091
-0
.104
-0
.054
0.
010
Il
liqui
dity
-0
.031
0.
019
-0.0
22
0.10
1 -0
.041
-0
.010
La
rges
t ow
n. C
.F. r
. -0
.166
0.
031
-0.0
92
0.09
2 0.
120
-0.0
24
-0.0
62
Fem
ales
on
boar
d 0.
124
0.04
7 0.
262
-0.0
22
0.06
0
0.06
1 0.
060
-0
.096
I
ndep
dir
ect.
on
boar
d -0
.003
-0
.107
-0
.278
-0
.092
-0
.144
0.
060
-0
.150
-0
.061
0.
150
Boa
rd s
ize
0.28
4 0.
294
0.71
5 0.
250
0.10
1 -0
.066
-0
.017
-0
.067
0.
188
-0.2
72
CE
O o
n bo
ard
0.09
3 0.
114
0.19
8 0.
131
0.09
3 -0
.002
-0
.014
-0
.002
-0
.162
-0
.258
0.
230
CE
O a
ge
0.00
3 0.
177
0.19
2 0.
005
0.04
1 -0
.078
-0
.045
0.
142
0.04
3 -0
.070
0.
226
0.17
1 C
EO
res
igna
tion
-0
.015
-0
.020
-0
.036
-0
.024
-0
.163
0.
009
0.03
7 0.
001
0.01
4 0.
033
-0.0
28
-0.2
46
-0.1
59
Publ
ic p
en. f
. C.F
. – p
ublic
pen
sion
fund
cas
h flo
w r
ight
s.
Illiq
uidi
ty =
(ask
pri
ce –
bid
pri
ce),
whi
ch is
com
pute
d as
an
aver
age
for
the
last
6 e
nd o
f mon
ths
of th
e ye
ar. F
emal
es o
n bo
ard
– th
e pe
rcen
tage
of f
emal
es o
n th
e B
oard
of D
irec
tors
. Ind
ep. d
. on
boar
d –
the
perc
enta
ge o
f ind
epen
dent
boa
rd m
embe
rs o
n th
e B
oard
of D
irec
tors
. C
EO
on
boar
d –
a d
umm
y va
riab
le e
qual
to 1
if a
n ac
tive
CE
O is
a m
embe
r of
the
Boa
rd o
f Dir
ecto
rs. C
EO
(gra
duat
e) –
the
CE
O h
as a
t lea
st a
mas
ter’
s de
gree
. C
EO
cha
nge
– a
dum
my
vari
able
equ
al to
1 if
the
CE
O r
esig
ned.
C.F
. – c
ash
flow
101
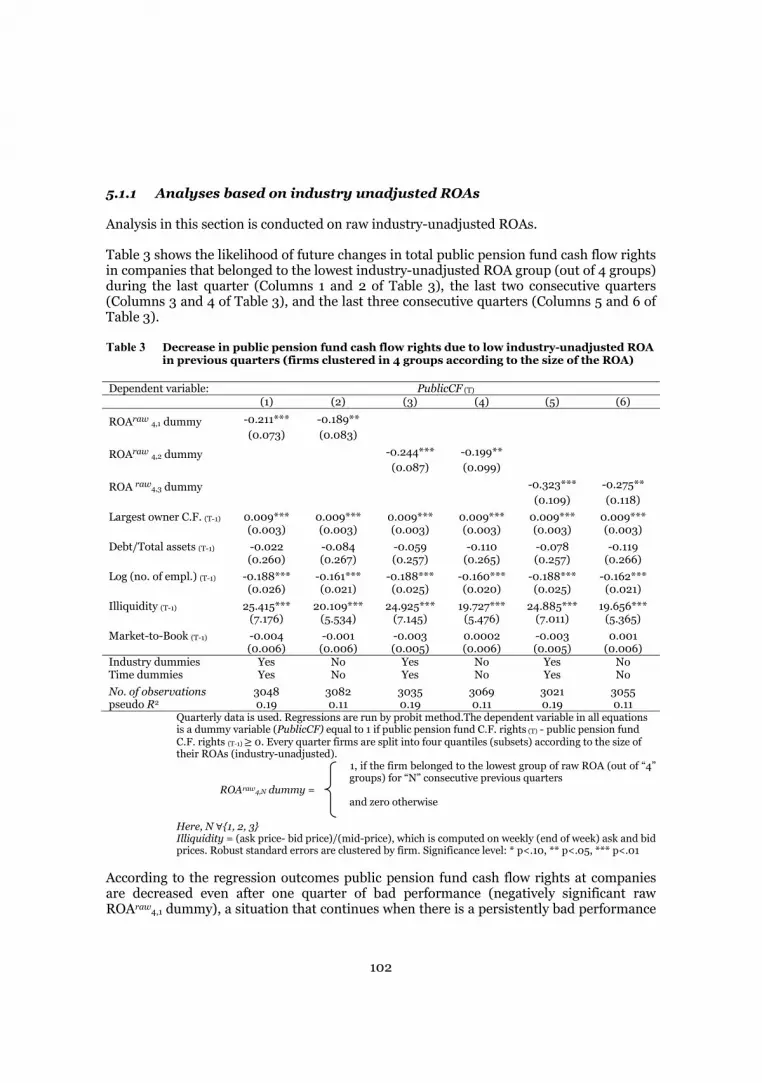
102
5.1.1 Analyses based on industry unadjusted ROAs
Analysis in this section is conducted on raw industry-unadjusted ROAs.
Table 3 shows the likelihood of future changes in total public pension fund cash flow rights in companies that belonged to the lowest industry-unadjusted ROA group (out of 4 groups) during the last quarter (Columns 1 and 2 of Table 3), the last two consecutive quarters (Columns 3 and 4 of Table 3), and the last three consecutive quarters (Columns 5 and 6 of Table 3).
Table 3 Decrease in public pension fund cash flow rights due to low industry-unadjusted ROA in previous quarters (firms clustered in 4 groups according to the size of the ROA)
Dependent variable: PublicCF (T) (1) (2) (3) (4) (5) (6)
ROAraw 4,1 dummy -0.211*** -0.189** (0.073) (0.083)
ROAraw 4,2 dummy -0.244*** -0.199** (0.087) (0.099)
ROA raw4,3 dummy -0.323*** -0.275** (0.109) (0.118)
Largest owner C.F. (T-1) 0.009*** 0.009*** 0.009*** 0.009*** 0.009*** 0.009*** (0.003) (0.003) (0.003) (0.003) (0.003) (0.003)
Debt/Total assets (T-1) -0.022 -0.084 -0.059 -0.110 -0.078 -0.119 (0.260) (0.267) (0.257) (0.265) (0.257) (0.266)
Log (no. of empl.) (T-1) -0.188*** -0.161*** -0.188*** -0.160*** -0.188*** -0.162*** (0.026) (0.021) (0.025) (0.020) (0.025) (0.021)
Illiquidity (T-1) 25.415*** 20.109*** 24.925*** 19.727*** 24.885*** 19.656*** (7.176) (5.534) (7.145) (5.476) (7.011) (5.365)
Market-to-Book (T-1) -0.004 -0.001 -0.003 0.0002 -0.003 0.001 (0.006) (0.006) (0.005) (0.006) (0.005) (0.006) Industry dummies Yes No Yes No Yes No Time dummies Yes No Yes No Yes No
No. of observations 3048 3082 3035 3069 3021 3055 pseudo R2 0.19 0.11 0.19 0.11 0.19 0.11
Quarterly data is used. Regressions are run by probit method.The dependent variable in all equations is a dummy variable (PublicCF) equal to 1 if public pension fund C.F. rights (T) - public pension fund C.F. rights (T-1) 0. Every quarter firms are split into four quantiles (subsets) according to the size of their ROAs (industry-unadjusted).
1, if the firm belonged to the lowest group of raw ROA (out of “4” groups) for “N” consecutive previous quarters
ROAraw4,N dummy = and zero otherwise Here, N {1, 2, 3} Illiquidity = (ask price- bid price)/(mid-price), which is computed on weekly (end of week) ask and bid prices. Robust standard errors are clustered by firm. Significance level: * p<.10, ** p<.05, *** p<.01
According to the regression outcomes public pension fund cash flow rights at companies are decreased even after one quarter of bad performance (negatively significant raw ROAraw4,1 dummy), a situation that continues when there is a persistently bad performance
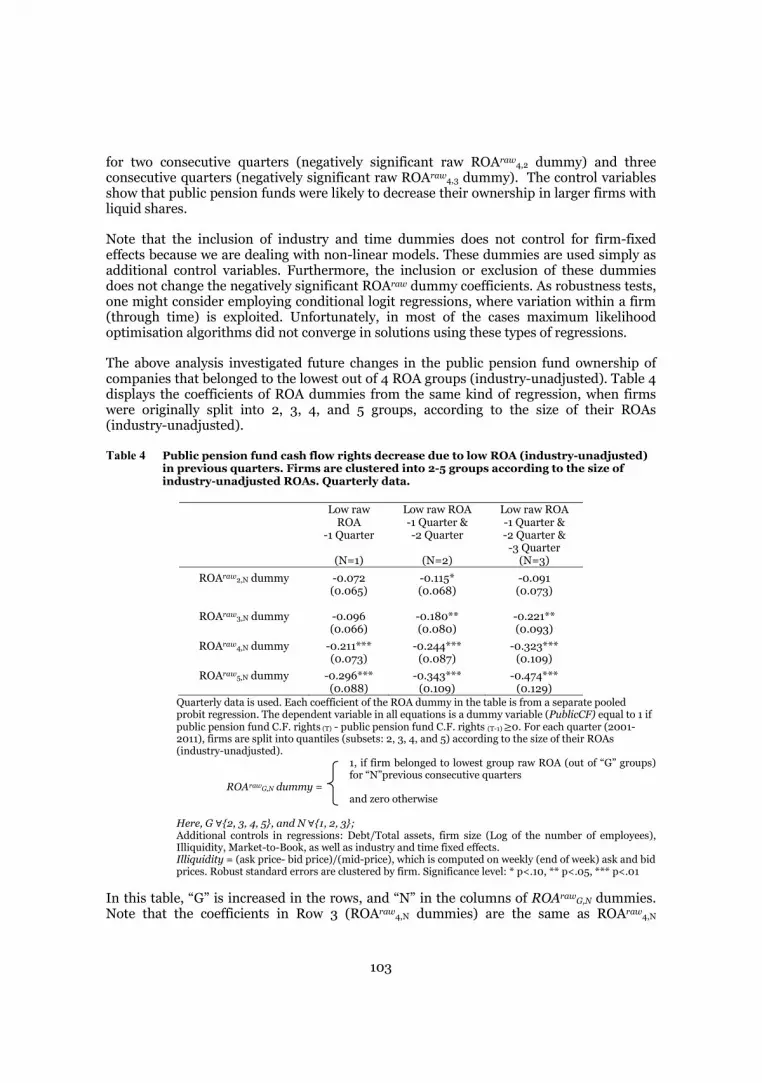
103
for two consecutive quarters (negatively significant raw ROAraw4,2 dummy) and three consecutive quarters (negatively significant raw ROAraw4,3 dummy). The control variables show that public pension funds were likely to decrease their ownership in larger firms with liquid shares.
Note that the inclusion of industry and time dummies does not control for firm-fixed effects because we are dealing with non-linear models. These dummies are used simply as additional control variables. Furthermore, the inclusion or exclusion of these dummies does not change the negatively significant ROAraw dummy coefficients. As robustness tests, one might consider employing conditional logit regressions, where variation within a firm (through time) is exploited. Unfortunately, in most of the cases maximum likelihood optimisation algorithms did not converge in solutions using these types of regressions.
The above analysis investigated future changes in the public pension fund ownership of companies that belonged to the lowest out of 4 ROA groups (industry-unadjusted). Table 4 displays the coefficients of ROA dummies from the same kind of regression, when firms were originally split into 2, 3, 4, and 5 groups, according to the size of their ROAs (industry-unadjusted).
Table 4 Public pension fund cash flow rights decrease due to low ROA (industry-unadjusted) in previous quarters. Firms are clustered into 2-5 groups according to the size of industry-unadjusted ROAs. Quarterly data.
Quarterly data is used. Each coefficient of the ROA dummy in the table is from a separate pooled probit regression. The dependent variable in all equations is a dummy variable (PublicCF) equal to 1 if public pension fund C.F. rights (T) - public pension fund C.F. rights (T-1) 0. For each quarter (2001-2011), firms are split into quantiles (subsets: 2, 3, 4, and 5) according to the size of their ROAs (industry-unadjusted).
1, if firm belonged to lowest group raw ROA (out of “G” groups) for “N”previous consecutive quarters
ROArawG,N dummy = and zero otherwise Here, G {2, 3, 4, 5}, and N {1, 2, 3}; Additional controls in regressions: Debt/Total assets, firm size (Log of the number of employees), Illiquidity, Market-to-Book, as well as industry and time fixed effects. Illiquidity = (ask price- bid price)/(mid-price), which is computed on weekly (end of week) ask and bid prices. Robust standard errors are clustered by firm. Significance level: * p<.10, ** p<.05, *** p<.01
In this table, “G” is increased in the rows, and “N” in the columns of ROArawG,N dummies. Note that the coefficients in Row 3 (ROAraw4,N dummies) are the same as ROAraw4,N
Low raw ROA
-1 Quarter
(N=1)
Low raw ROA -1 Quarter & -2 Quarter
(N=2)
Low raw ROA -1 Quarter & -2 Quarter & -3 Quarter
(N=3)
ROAraw2,N dummy -0.072 -0.115* -0.091 (0.065) (0.068) (0.073)
ROAraw3,N dummy -0.096 -0.180** -0.221** (0.066) (0.080) (0.093)
ROAraw4,N dummy -0.211*** -0.244*** -0.323*** (0.073) (0.087) (0.109)
ROAraw5,N dummy -0.296*** -0.343*** -0.474*** (0.088) (0.109) (0.129)
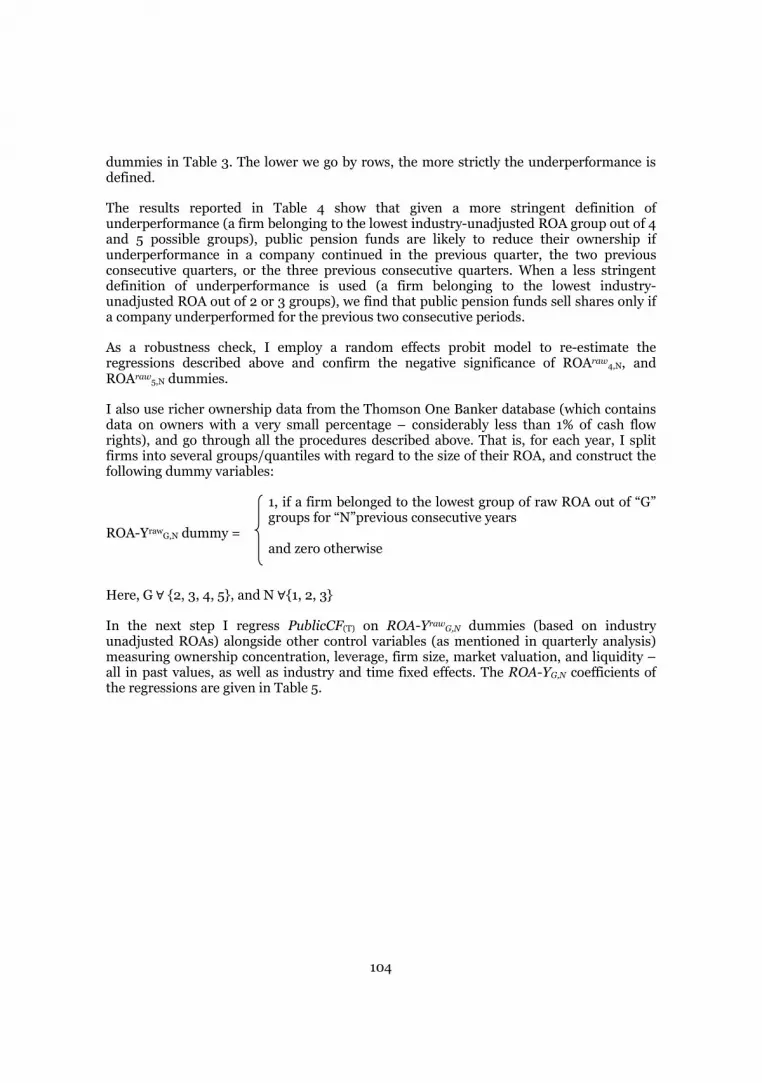
104
dummies in Table 3. The lower we go by rows, the more strictly the underperformance is defined.
The results reported in Table 4 show that given a more stringent definition of underperformance (a firm belonging to the lowest industry-unadjusted ROA group out of 4 and 5 possible groups), public pension funds are likely to reduce their ownership if underperformance in a company continued in the previous quarter, the two previous consecutive quarters, or the three previous consecutive quarters. When a less stringent definition of underperformance is used (a firm belonging to the lowest industry-unadjusted ROA out of 2 or 3 groups), we find that public pension funds sell shares only if a company underperformed for the previous two consecutive periods.
As a robustness check, I employ a random effects probit model to re-estimate the regressions described above and confirm the negative significance of ROAraw4,N, and ROAraw5,N dummies.
I also use richer ownership data from the Thomson One Banker database (which contains data on owners with a very small percentage – considerably less than 1% of cash flow rights), and go through all the procedures described above. That is, for each year, I split firms into several groups/quantiles with regard to the size of their ROA, and construct the following dummy variables:
1, if a firm belonged to the lowest group of raw ROA out of “G” groups for “N”previous consecutive years
ROA-YrawG,N dummy = and zero otherwise
Here, G {2, 3, 4, 5}, and N {1, 2, 3}
In the next step I regress PublicCF(T) on ROA-YrawG,N dummies (based on industry unadjusted ROAs) alongside other control variables (as mentioned in quarterly analysis) measuring ownership concentration, leverage, firm size, market valuation, and liquidity – all in past values, as well as industry and time fixed effects. The ROA-YG,N coefficients of the regressions are given in Table 5.
105
Table 5 Public pension fund cash flow rights changes due to low ROA (industry unadjusted) in previous years. Firms are clustered into 2-5 groups according to the size of ROAs
(industry unadjusted). Annual data.
The annual Thomson One Baker data is used. Coefficients of ROA dummies in the table are from pooled probit regressions. The dependent variable in all equations is a dummy variable (PublicCF) equal to 1 if public pension fund C.F. rights (T) - public pension fund C.F. rights (T-1) 0. For each year (2001-2011), firms are split into quantiles (subsets: 2, 3, 4, and 5) according to the size of their ROAs (industry-unadjusted).
1, if a firm belonged to the lowest group raw ROA out of “G” groups for “N” previous consecutive years
ROA-YrawG,N dummy = and zero otherwise Here, G {2, 3, 4, 5}, and N {1, 2, 3} Additional controls in regressions: Debt/Total assets, firm size (log of the number of employees), Illiquidity, Market-to-Book, as well as industry and time fixed effects. Illiquidity = (ask price – bid price)/(mid price), which is computed as an average for the last 6 end of months of the year. Robust standard errors are clustered by firm. Significance level: * p<.10, ** p<.05, *** p<.01
Findings from quarterly data, that is, a decrease in public pension ownership in companies that had a low ROA (industry-unadjusted) during the previous year (previous consecutive 1-3 quarters), are also confirmed in the annual data. Furthermore, the effect is distinguishable even if we define underperformance less strictly (significance of ROA-Yraw3,1 dummy).
Low ROA -1 Year
(N=1)
Low ROA -1 Year & -2 Year
(N=2)
Low ROA -1 Year & -2 Year & -3 Year (N=3)
ROA-Y raw2,N dummy -0.077 -0.178 -0.018 (0.116) (0.117) (0.145)
ROA-Y raw3,N dummy -0.247* -0.252 -0.236 (0.134) (0.155) (0.167)
ROA-Y raw4,N dummy -0.301** -0.159 -0.143 (0.146) (0.168) (0.193)
ROA-Y raw5,N dummy -0.286* -0.197 -0.288 (0.152) (0.186) (0.209)
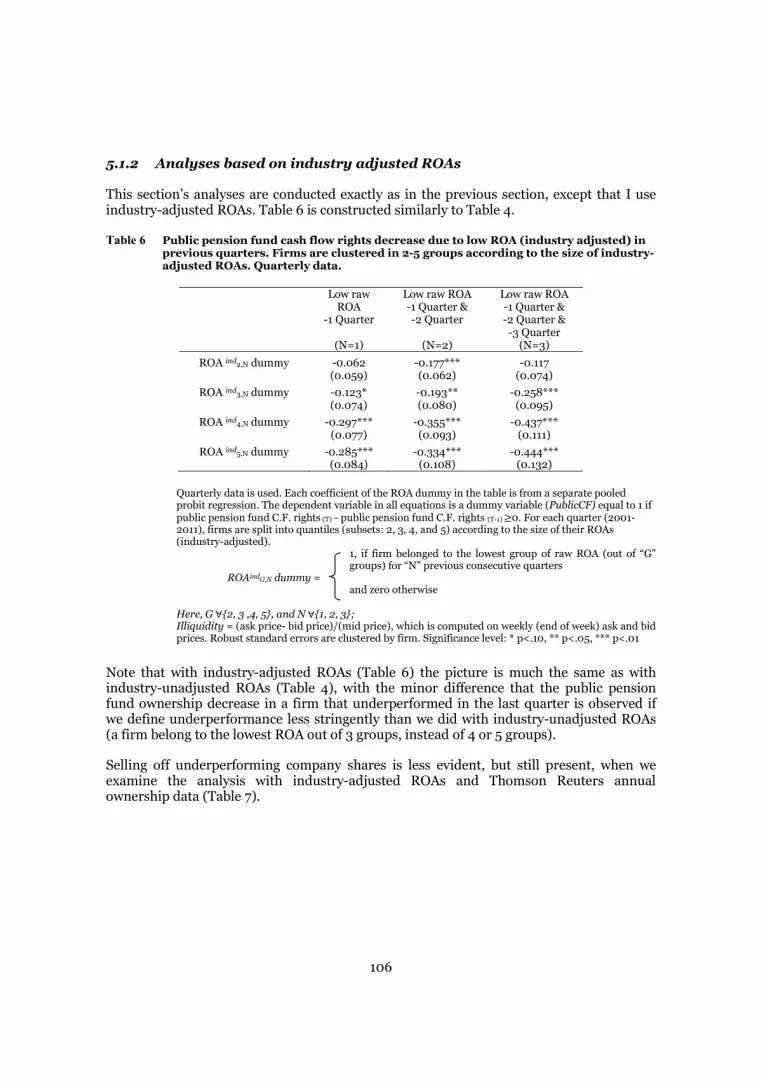
106
5.1.2 Analyses based on industry adjusted ROAs
This section’s analyses are conducted exactly as in the previous section, except that I use industry-adjusted ROAs. Table 6 is constructed similarly to Table 4.
Table 6 Public pension fund cash flow rights decrease due to low ROA (industry adjusted) in previous quarters. Firms are clustered in 2-5 groups according to the size of industry-adjusted ROAs. Quarterly data.
Quarterly data is used. Each coefficient of the ROA dummy in the table is from a separate pooled probit regression. The dependent variable in all equations is a dummy variable (PublicCF) equal to 1 if public pension fund C.F. rights (T) - public pension fund C.F. rights (T-1) 0. For each quarter (2001-2011), firms are split into quantiles (subsets: 2, 3, 4, and 5) according to the size of their ROAs (industry-adjusted).
1, if firm belonged to the lowest group of raw ROA (out of “G” groups) for “N” previous consecutive quarters
ROAindG,N dummy = and zero otherwise Here, G {2, 3 ,4, 5}, and N {1, 2, 3}; Illiquidity = (ask price- bid price)/(mid price), which is computed on weekly (end of week) ask and bid prices. Robust standard errors are clustered by firm. Significance level: * p<.10, ** p<.05, *** p<.01
Note that with industry-adjusted ROAs (Table 6) the picture is much the same as with industry-unadjusted ROAs (Table 4), with the minor difference that the public pension fund ownership decrease in a firm that underperformed in the last quarter is observed if we define underperformance less stringently than we did with industry-unadjusted ROAs (a firm belong to the lowest ROA out of 3 groups, instead of 4 or 5 groups).
Selling off underperforming company shares is less evident, but still present, when we examine the analysis with industry-adjusted ROAs and Thomson Reuters annual ownership data (Table 7).
Low raw ROA
-1 Quarter
(N=1)
Low raw ROA -1 Quarter & -2 Quarter
(N=2)
Low raw ROA -1 Quarter & -2 Quarter & -3 Quarter
(N=3)
ROA ind2,N dummy -0.062 -0.177*** -0.117 (0.059) (0.062) (0.074)
ROA ind3,N dummy -0.123* -0.193** -0.258*** (0.074) (0.080) (0.095)
ROA ind4,N dummy -0.297*** -0.355*** -0.437*** (0.077) (0.093) (0.111)
ROA ind5,N dummy -0.285*** -0.334*** -0.444*** (0.084) (0.108) (0.132)
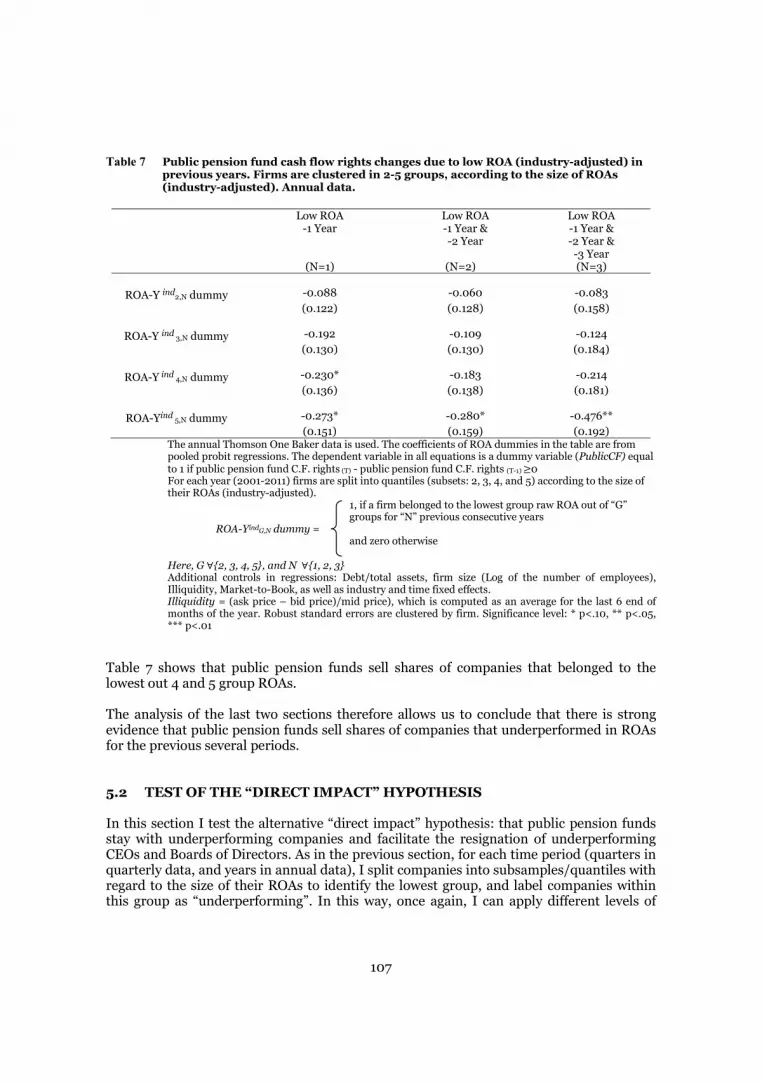
107
Table 7 Public pension fund cash flow rights changes due to low ROA (industry-adjusted) in previous years. Firms are clustered in 2-5 groups, according to the size of ROAs (industry-adjusted). Annual data.
The annual Thomson One Baker data is used. The coefficients of ROA dummies in the table are from pooled probit regressions. The dependent variable in all equations is a dummy variable (PublicCF) equal to 1 if public pension fund C.F. rights (T) - public pension fund C.F. rights (T-1) 0 For each year (2001-2011) firms are split into quantiles (subsets: 2, 3, 4, and 5) according to the size of their ROAs (industry-adjusted).
1, if a firm belonged to the lowest group raw ROA out of “G” groups for “N” previous consecutive years
ROA-YindG,N dummy = and zero otherwise Here, G {2, 3, 4, 5}, and N {1, 2, 3} Additional controls in regressions: Debt/total assets, firm size (Log of the number of employees), Illiquidity, Market-to-Book, as well as industry and time fixed effects. Illiquidity = (ask price – bid price)/mid price), which is computed as an average for the last 6 end of months of the year. Robust standard errors are clustered by firm. Significance level: * p<.10, ** p<.05, *** p<.01
Table 7 shows that public pension funds sell shares of companies that belonged to the lowest out 4 and 5 group ROAs. The analysis of the last two sections therefore allows us to conclude that there is strong evidence that public pension funds sell shares of companies that underperformed in ROAs for the previous several periods.
5.2 TEST OF THE “DIRECT IMPACT” HYPOTHESIS
In this section I test the alternative “direct impact” hypothesis: that public pension funds stay with underperforming companies and facilitate the resignation of underperforming CEOs and Boards of Directors. As in the previous section, for each time period (quarters in quarterly data, and years in annual data), I split companies into subsamples/quantiles with regard to the size of their ROAs to identify the lowest group, and label companies within this group as “underperforming”. In this way, once again, I can apply different levels of
Low ROA -1 Year
(N=1)
Low ROA -1 Year & -2 Year
(N=2)
Low ROA -1 Year & -2 Year & -3 Year (N=3)
ROA-Y ind2,N dummy -0.088 -0.060 -0.083
(0.122) (0.128) (0.158)
ROA-Y ind 3,N dummy -0.192 -0.109 -0.124 (0.130) (0.130) (0.184)
ROA-Y ind 4,N dummy -0.230* -0.183 -0.214 (0.136) (0.138) (0.181)
ROA-Yind 5,N dummy -0.273* -0.280* -0.476** (0.151) (0.159) (0.192)
108
stringency for the definition of underperformance (the lowest ROA group out of 2, 3, 4, or 5 groups).
5.2.1 PUBLIC PENSION FUND IMPACT ON THE RESIGNATION OF UNDERPERFORMING CEOs
In this section I investigate whether public pension funds, when they decide not to decrease their ownership in underperforming firms, facilitate the dismissal of CEOs.
To do this, I collect information on CEO resignations from company annual reports7. Unfortunately, I am unable to determine whether a particular CEO was fired or left the company for their own reasons.
In the next step I construct a dummy variable taking a value of 1 if the CEO resigned and regress it (through a pooled probit model) on the previous values of total public pension fund ownership alongside control variables within the sample of underperforming firms (firms that underperformed for the previous quarter, the previous consecutive two quarters, and the previous consecutive three quarters) which were also characterised by a non-decrease of public pension fund ownership. Control variables in these regressions are CEO characteristics - CEO age, CEO on board dummy (with a dummy equal to 1 if the CEO is a member of the Board of Directors), ownership concentration measured by largest owner cash flow rights, leverage, firm size measured by a logarithm of the number of employees, and market valuation measured by Market-to-Book ratio, all in past values, as well as industry and time dummies.
For example, I consider regression outcomes in a subsample of firms in which public pension funds did not decrease their ownership, and at the same time underperformed (belonged to the lowest ROA group out of 4 possible groups) during the previous quarters. I report regression results based on raw industry-unadjusted ROAs in Table 8, and on industry-adjusted ROAs in Table 9.
7 There are 188 CEO resignations in the sample.
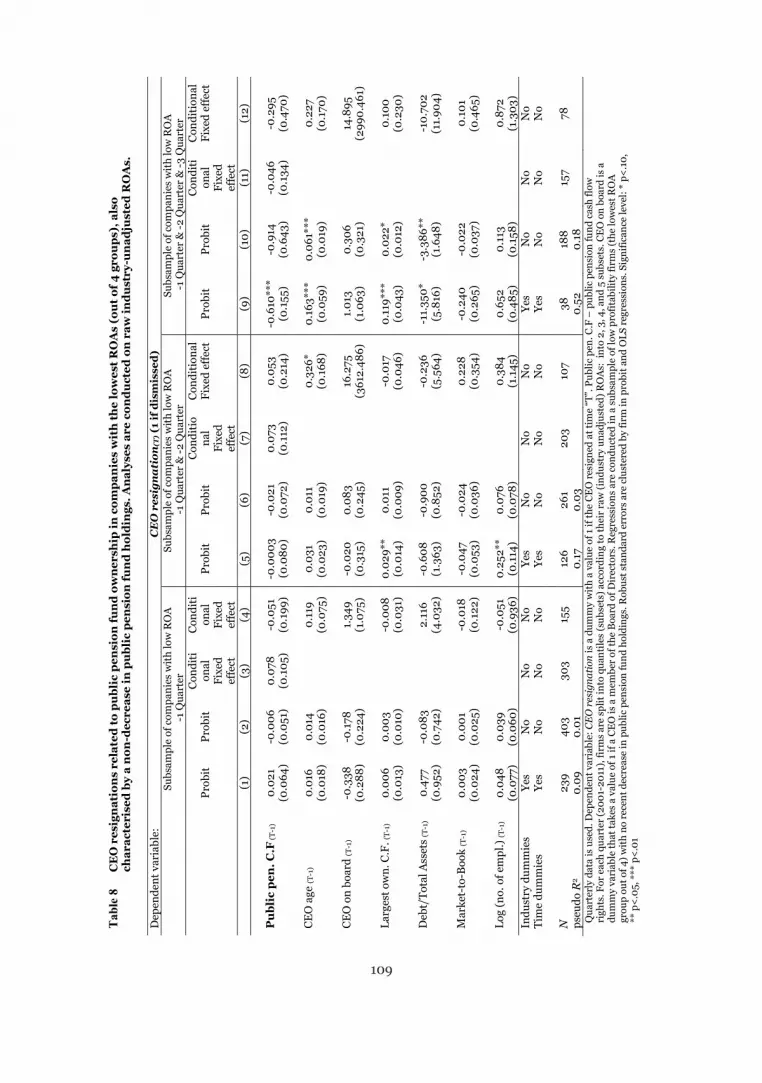
Tab
le 8
C
EO
res
ign
atio
ns
rela
ted
to p
ubl
ic p
ensi
on fu
nd
ow
ner
ship
in c
omp
anie
s w
ith
the
low
est
RO
As
(ou
t of
4 g
rou
ps)
, als
o ch
arac
teri
sed
by
a n
on-d
ecre
ase
in p
ubl
ic p
ensi
on fu
nd
hol
din
gs. A
nal
yses
are
con
du
cted
on
raw
ind
ust
ry-u
nad
just
ed R
OA
s.
Dep
ende
nt v
aria
ble:
C
EO
res
ign
ati
on(T
) (1
if d
ism
isse
d)
Su
bsam
ple
of c
ompa
nies
wit
h lo
w R
OA
-1
Qua
rter
Su
bsam
ple
of c
ompa
nies
wit
h lo
w R
OA
-1
Qua
rter
& -2
Qua
rter
Su
bsam
ple
of c
ompa
nies
wit
h lo
w R
OA
-1
Qua
rter
& -2
Qua
rter
& -3
Qua
rter
Pr
obit
Prob
it
Con
diti
onal
Fi
xed
effe
ct
Con
diti
onal
Fi
xed
effe
ct
Pr
obit
Prob
it
Con
diti
ona
l Fi
xed
effe
ct
Con
diti
onal
Fi
xed
effe
ct
Pr
obit
Prob
it
Con
diti
onal
Fi
xed
effe
ct
Con
diti
onal
Fi
xed
effe
ct
(1
) (2
) (3
) (4
) (5
) (6
) (7
) (8
) (9
) (1
0)
(11)
(1
2)
P
ubl
ic p
en. C
.F (T
-1)
0.
021
-0.0
06
0.07
8 -0
.051
-0
.000
3 -0
.021
0.
073
0.05
3 -0
.610
***
-0.9
14
-0.0
46
-0.2
95
(0
.064
) (0
.051
) (0
.105
) (0
.199
) (0
.080
) (0
.072
) (0
.112
) (0
.214
) (0
.155
) (0
.643
) (0
.134
) (0
.470
)
CE
O a
ge (T
-1)
0.
016
0.01
4
0.11
9 0.
031
0.01
1
0.32
6*
0.16
3***
0.
061*
**
0.
227
(0
.018
) (0
.016
)
(0.0
75)
(0.0
23)
(0.0
19)
(0
.168
) (0
.059
) (0
.019
)
(0.1
70)
C
EO
on
boar
d (T
-1)
-0
.338
-0
.178
1.34
9 -0
.020
0.
083
16
.275
1.
013
0.30
6
14.8
95
(0
.288
) (0
.224
)
(1.0
75)
(0.3
15)
(0.2
45)
(3
612.
486)
(1
.063
) (0
.321
)
(299
0.46
1)
La
rges
t ow
n. C
.F. (
T-1)
0.
006
0.00
3
-0.0
08
0.02
9**
0.01
1
-0.0
17
0.11
9***
0.
022*
0.10
0
(0.0
13)
(0.0
10)
(0
.031
) (0
.014
) (0
.009
)
(0.0
46)
(0.0
43)
(0.0
12)
(0
.230
)
Deb
t/To
tal A
sset
s (T
-1)
0.
477
-0.0
83
2.
116
-0.6
08
-0.9
00
-0
.236
-1
1.35
0*
-3.3
86**
-10.
702
(0
.952
) (0
.742
)
(4.0
32)
(1.3
63)
(0.8
52)
(5
.564
) (5
.816
) (1
.648
)
(11.
904)
Mar
ket-
to-B
ook
(T-1
)
0.00
3 0.
001
-0
.018
-0
.047
-0
.024
0.22
8 -0
.240
-0
.022
0.10
1
(0.0
24)
(0.0
25)
(0
.122
) (0
.053
) (0
.036
)
(0.3
54)
(0.2
65)
(0.0
37)
(0
.465
)
Log
(no.
of e
mpl
.) (T
-1)
0.
048
0.03
9
-0.0
51
0.25
2**
0.07
6
0.38
4 0.
652
0.11
3
0.87
2
(0.0
77)
(0.0
60)
(0
.936
) (0
.114
) (0
.078
)
(1.1
45)
(0.4
85)
(0.1
58)
(1
.303
) In
dust
ry d
umm
ies
Yes
No
No
No
Yes
No
No
No
Yes
No
No
No
Tim
e du
mm
ies
Yes
No
No
No
Yes
No
No
No
Yes
No
No
No
N
23
9 40
3 30
3 15
5 12
6 26
1 20
3 10
7 38
18
8 15
7 78
ps
eudo
R2
0.09
0.
01
0.17
0.
03
0.52
0.
18
Qua
rter
ly d
ata
is u
sed.
Dep
ende
nt v
aria
ble:
CE
O r
esig
nati
on is
a d
umm
y w
ith
a va
lue
of 1
if th
e C
EO
res
igne
d at
tim
e “T
”. P
ublic
pen
. C.F
– p
ublic
pen
sion
fund
cas
h flo
w
righ
ts. F
or e
ach
quar
ter
(200
1-20
11),
firm
s ar
e sp
lit in
to q
uant
iles
(sub
sets
) acc
ordi
ng to
thei
r ra
w (i
ndus
try
unad
just
ed) R
OA
s: i
nto
2, 3
, 4, a
nd 5
sub
sets
. CE
O o
n bo
ard
is a
du
mm
y va
riab
le th
at ta
kes
a va
lue
of 1
if a
CE
O is
a m
embe
r of
the
Boa
rd o
f Dir
ecto
rs. R
egre
ssio
ns a
re c
ondu
cted
in a
sub
sam
ple
of lo
w p
rofi
tabi
lity
firm
s (t
he lo
wes
t RO
A
grou
p ou
t of 4
) wit
h no
rec
ent d
ecre
ase
in p
ublic
pen
sion
fund
hol
ding
s. R
obus
t sta
ndar
d er
rors
are
clu
ster
ed b
y fi
rm in
pro
bit a
nd O
LS r
egre
ssio
ns. S
igni
fica
nce
leve
l: *
p<.1
0,
** p
<.0
5, *
** p
<.0
1
109
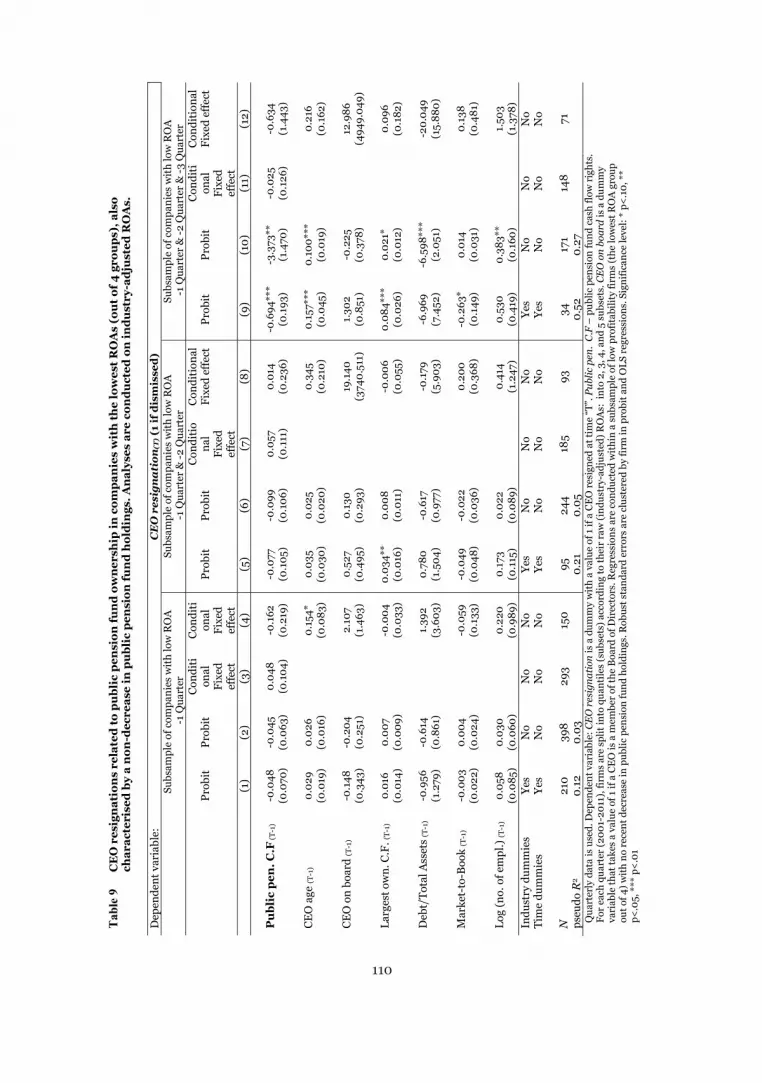
Tab
le 9
C
EO
res
ign
atio
ns
rela
ted
to p
ubl
ic p
ensi
on fu
nd
ow
ner
ship
in c
omp
anie
s w
ith
the
low
est
RO
As
(ou
t of
4 g
rou
ps)
, als
o ch
arac
teri
sed
by
a n
on-d
ecre
ase
in p
ubl
ic p
ensi
on fu
nd
hol
din
gs. A
nal
yses
are
con
du
cted
on
ind
ust
ry-a
dju
sted
RO
As.
Dep
ende
nt v
aria
ble:
C
EO
res
ign
ati
on(T
) (1
if d
ism
isse
d)
Su
bsam
ple
of c
ompa
nies
wit
h lo
w R
OA
-1
Qua
rter
Su
bsam
ple
of c
ompa
nies
wit
h lo
w R
OA
-1
Qua
rter
& -2
Qua
rter
Su
bsam
ple
of c
ompa
nies
wit
h lo
w R
OA
-1
Qua
rter
& -2
Qua
rter
& -3
Qua
rter
Pr
obit
Prob
it
Con
diti
onal
Fi
xed
effe
ct
Con
diti
onal
Fi
xed
effe
ct
Pr
obit
Prob
it
Con
diti
ona
l Fi
xed
effe
ct
Con
diti
onal
Fi
xed
effe
ct
Pr
obit
Prob
it
Con
diti
onal
Fi
xed
effe
ct
Con
diti
onal
Fi
xed
effe
ct
(1
) (2
) (3
) (4
) (5
) (6
) (7
) (8
) (9
) (1
0)
(11)
(1
2)
P
ubl
ic p
en. C
.F (T
-1)
-0
.048
-0
.045
0.
048
-0.1
62
-0.0
77
-0.0
99
0.05
7 0.
014
-0.6
94**
* -3
.373
**
-0.0
25
-0.6
34
(0
.070
) (0
.063
) (0
.104
) (0
.219
) (0
.105
) (0
.106
) (0
.111
) (0
.236
) (0
.193
) (1
.470
) (0
.126
) (1
.443
)
CE
O a
ge (T
-1)
0.
029
0.02
6
0.15
4*
0.03
5 0.
025
0.
345
0.15
7***
0.
100*
**
0.
216
(0
.019
) (0
.016
)
(0.0
83)
(0.0
30)
(0.0
20)
(0
.210
) (0
.045
) (0
.019
)
(0.1
62)
C
EO
on
boar
d (T
-1)
-0
.148
-0
.204
2.10
7 0.
527
0.13
0
19.1
40
1.30
2 -0
.225
12.9
86
(0
.343
) (0
.251
)
(1.4
63)
(0.4
95)
(0.2
93)
(3
740.
511)
(0
.851
) (0
.378
)
(494
9.04
9)
La
rges
t ow
n. C
.F. (
T-1)
0.
016
0.00
7
-0.0
04
0.03
4**
0.00
8
-0.0
06
0.08
4***
0.
021*
0.09
6
(0.0
14)
(0.0
09)
(0
.033
) (0
.016
) (0
.011
)
(0.0
55)
(0.0
26)
(0.0
12)
(0
.182
)
Deb
t/To
tal A
sset
s (T
-1)
-0
.956
-0
.614
1.39
2 0.
780
-0.6
17
-0
.179
-6
.969
-6
.598
***
-2
0.04
9
(1.2
79)
(0.8
61)
(3
.603
) (1
.504
) (0
.977
)
(5.9
03)
(7.4
52)
(2.0
51)
(1
5.88
0)
M
arke
t-to
-Boo
k (T
-1)
-0
.003
0.
004
-0
.059
-0
.049
-0
.022
0.20
0 -0
.263
* 0.
014
0.
138
(0
.022
) (0
.024
)
(0.1
33)
(0.0
48)
(0.0
36)
(0
.368
) (0
.149
) (0
.031
)
(0.4
81)
Lo
g (n
o. o
f em
pl.)
(T-1
)
0.05
8 0.
030
0.
220
0.17
3 0.
022
0.
414
0.53
0 0.
383*
*
1.50
3
(0.0
85)
(0.0
60)
(0
.989
) (0
.115
) (0
.089
)
(1.2
47)
(0.4
19)
(0.1
60)
(1
.378
) In
dust
ry d
umm
ies
Yes
No
No
No
Yes
No
No
No
Yes
No
No
No
Tim
e du
mm
ies
Yes
No
No
No
Yes
No
No
No
Yes
No
No
No
N
21
0 39
8 29
3 15
0 95
24
4 18
5 93
34
17
1 14
8 71
ps
eudo
R2
0.12
0.
03
0.21
0.
05
0.52
0.
27
Qua
rter
ly d
ata
is u
sed.
Dep
ende
nt v
aria
ble:
CE
O r
esig
nati
on is
a d
umm
y w
ith
a va
lue
of 1
if a
CE
O r
esig
ned
at ti
me
“T”.
Pub
lic p
en.
C.F
– p
ublic
pen
sion
fund
cas
h flo
w r
ight
s.
For
each
qua
rter
(200
1-20
11),
firm
s ar
e sp
lit in
to q
uant
iles
(sub
sets
) acc
ordi
ng to
thei
r ra
w (i
ndus
try-
adju
sted
) RO
As:
int
o 2,
3, 4
, and
5 s
ubse
ts. C
EO
on
boar
d is
a d
umm
y va
riab
le th
at ta
kes
a va
lue
of 1
if a
CE
O is
a m
embe
r of
the
Boa
rd o
f Dir
ecto
rs. R
egre
ssio
ns a
re c
ondu
cted
wit
hin
a su
bsam
ple
of lo
w p
rofit
abili
ty fi
rms
(the
low
est R
OA
gro
up
out o
f 4) w
ith
no r
ecen
t dec
reas
e in
pub
lic p
ensi
on fu
nd h
oldi
ngs.
Rob
ust s
tand
ard
erro
rs a
re c
lust
ered
by
firm
in p
robi
t and
OLS
reg
ress
ions
. Sig
nifi
canc
e le
vel:
* p<
.10,
**
p<.0
5, *
** p
<.0
1
110
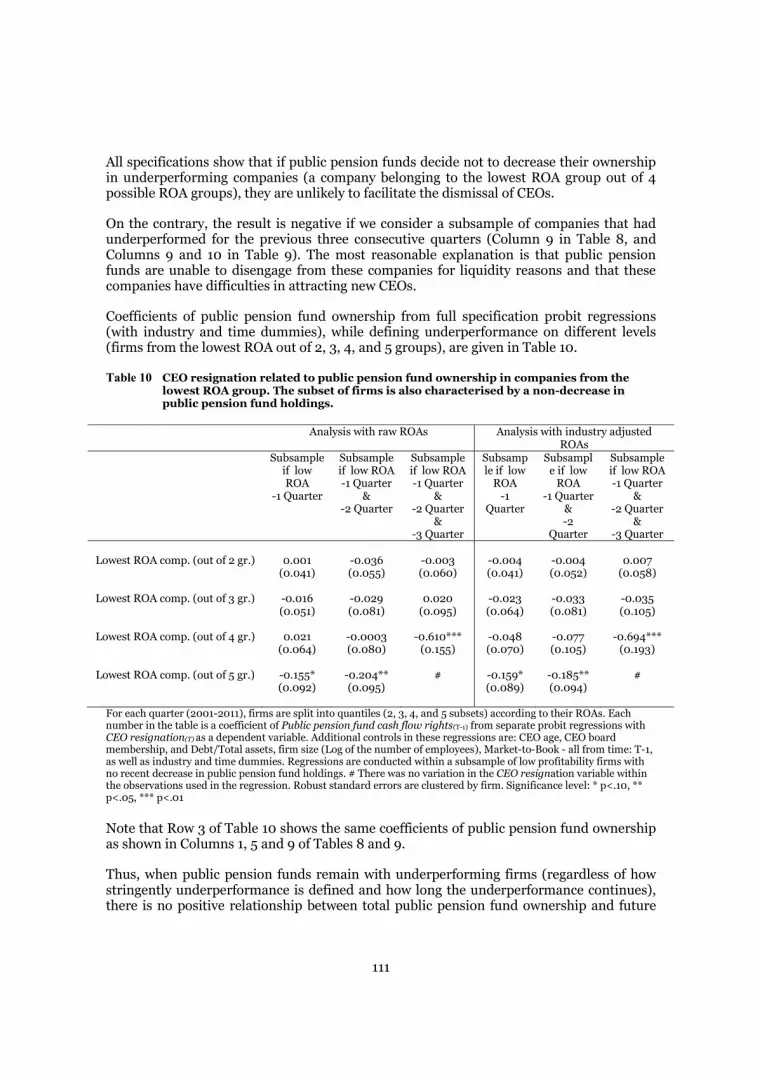
111
All specifications show that if public pension funds decide not to decrease their ownership in underperforming companies (a company belonging to the lowest ROA group out of 4 possible ROA groups), they are unlikely to facilitate the dismissal of CEOs.
On the contrary, the result is negative if we consider a subsample of companies that had underperformed for the previous three consecutive quarters (Column 9 in Table 8, and Columns 9 and 10 in Table 9). The most reasonable explanation is that public pension funds are unable to disengage from these companies for liquidity reasons and that these companies have difficulties in attracting new CEOs.
Coefficients of public pension fund ownership from full specification probit regressions (with industry and time dummies), while defining underperformance on different levels (firms from the lowest ROA out of 2, 3, 4, and 5 groups), are given in Table 10.
Table 10 CEO resignation related to public pension fund ownership in companies from the lowest ROA group. The subset of firms is also characterised by a non-decrease in public pension fund holdings.
Analysis with raw ROAs Analysis with industry adjusted ROAs
Subsample if low ROA
-1 Quarter
Subsample if low ROA -1 Quarter
& -2 Quarter
Subsample if low ROA -1 Quarter
& -2 Quarter
& -3 Quarter
Subsample if low
ROA -1
Quarter
Subsample if low
ROA -1 Quarter
& -2
Quarter
Subsample if low ROA -1 Quarter
& -2 Quarter
& -3 Quarter
Lowest ROA comp. (out of 2 gr.) 0.001 -0.036 -0.003 -0.004 -0.004 0.007
(0.041) (0.055) (0.060) (0.041) (0.052) (0.058)
Lowest ROA comp. (out of 3 gr.) -0.016 -0.029 0.020 -0.023 -0.033 -0.035 (0.051) (0.081) (0.095) (0.064) (0.081) (0.105)
Lowest ROA comp. (out of 4 gr.) 0.021 -0.0003 -0.610*** -0.048 -0.077 -0.694*** (0.064) (0.080) (0.155) (0.070) (0.105) (0.193)
Lowest ROA comp. (out of 5 gr.) -0.155* -0.204** # -0.159* -0.185** # (0.092) (0.095) (0.089) (0.094)
For each quarter (2001-2011), firms are split into quantiles (2, 3, 4, and 5 subsets) according to their ROAs. Each number in the table is a coefficient of Public pension fund cash flow rights(T-1) from separate probit regressions with CEO resignation(T) as a dependent variable. Additional controls in these regressions are: CEO age, CEO board membership, and Debt/Total assets, firm size (Log of the number of employees), Market-to-Book - all from time: T-1, as well as industry and time dummies. Regressions are conducted within a subsample of low profitability firms with no recent decrease in public pension fund holdings. # There was no variation in the CEO resignation variable within the observations used in the regression. Robust standard errors are clustered by firm. Significance level: * p<.10, ** p<.05, *** p<.01 Note that Row 3 of Table 10 shows the same coefficients of public pension fund ownership as shown in Columns 1, 5 and 9 of Tables 8 and 9.
Thus, when public pension funds remain with underperforming firms (regardless of how stringently underperformance is defined and how long the underperformance continues), there is no positive relationship between total public pension fund ownership and future

112
CEO resignations. On the contrary, this relationship is negatively significant for the subsample of severely underperforming companies (belonging to the lowest ROA group out of 5 possible groups) over a longer period (the last three consecutive quarters).
As a robustness check I re-estimate the model using a random effects probit model, and confirm that there was no relationship between public pension fund holdings and future CEO resignations in underperforming firms that were also characterised by a non-decrease of public pension fund ownership.
To summarise, analyses in this section show that if public pension funds stay with underperforming companies, they are unlikely to facilitate CEO dismissal.
5.2.2 PUBLIC PENSION FUND IMPACT ON THE REPLACEMENT OF UNDERPERFORMING BOARDS OF DIRECTORS
This section addresses the question of whether public pension funds that do not exercise an “exit” in an underperforming company facilitate the replacement of the Board of Directors.
I use annual data to investigate this issue, because directors are appointed to the board annually. I define Board turnover as the percentage of new AGM (Annual General Shareholder Meeting) elected board members measured against the total number of AGM elected board members.
As before, for each period (in this case for each year) I split companies into quantiles/subsamples with regard to the size of their ROAs (both raw and industry-adjusted), and define a company as underperforming if it belonged to the lowest ROA group (out of 2, 3, 4, and 5 groups).
Finally, I regress Board turnover from time “T” on past values of public pension fund cash flow rights and control variables within the subsample of underperforming firms (with the lowest ROA out of 2, 3, 4, and 5 groups during the previous quarter, the previous two quarters, and the previous consecutive three quarters), characterised also by a non-decrease in public pension fund cash flow rights. Controls in these regressions are board characteristics (board size8, percentage of independent and female board members), ownership concentration (largest owner cash flow rights), leverage (Debt/Total assets), firm size - logarithm of the number of employees, and liquidity, all in past values as well as industry and time dummies.
Examples of the regression outcomes with an underperforming company identified as the one with the lowest ROA out of 4 groups are reported in Table 11 (Columns 1-3 base their analysis on raw industry-unadjusted ROAs, and Columns 4-6 base their analysis on industry-adjusted ROAs).
As we can see, the relationship between previous public pension fund ownership and future board turnover is negatively significant (Columns 1, 3, and 6 of Table 11). It may be 8 Note that firm size (the logarithm of the number of employees) is not included in these regressions for multicollinearity reasons, as board size is highly correlated with this variable (more than 70%: see Table-1)
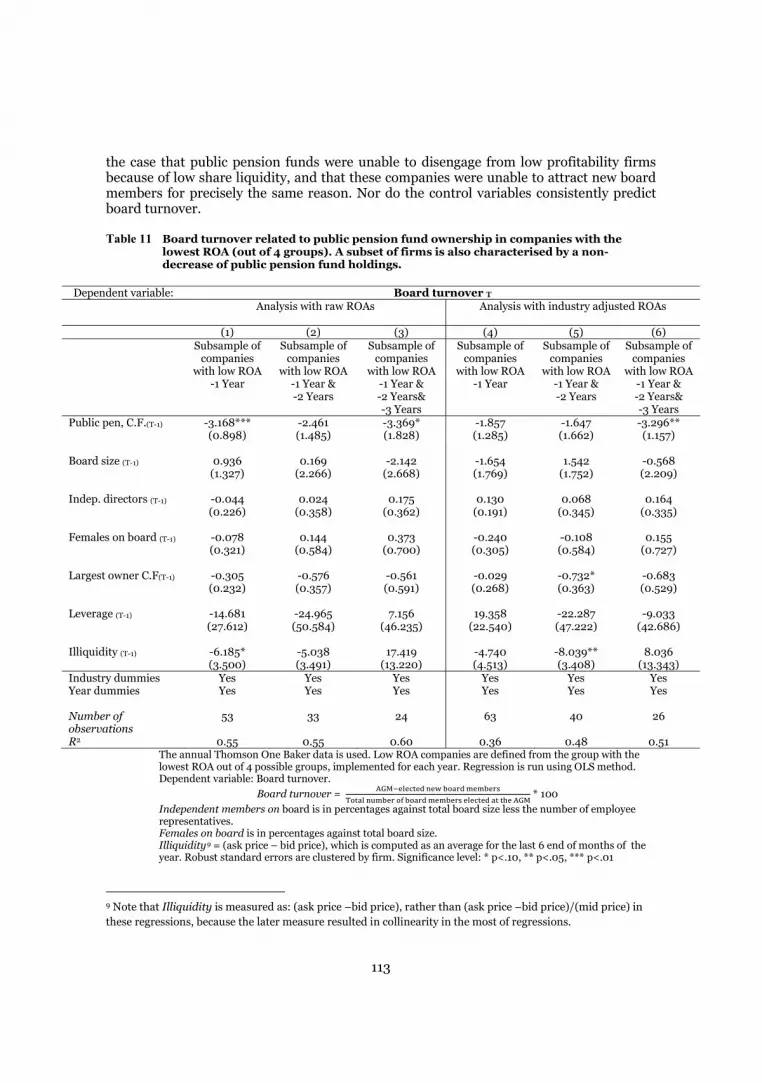
113
the case that public pension funds were unable to disengage from low profitability firms because of low share liquidity, and that these companies were unable to attract new board members for precisely the same reason. Nor do the control variables consistently predict board turnover.
Table 11 Board turnover related to public pension fund ownership in companies with the lowest ROA (out of 4 groups). A subset of firms is also characterised by a non-decrease of public pension fund holdings.
Dependent variable: Board turnover T
Analysis with raw ROAs Analysis with industry adjusted ROAs
(1) (2) (3) (4) (5) (6)
Subsample of companies
with low ROA -1 Year
Subsample of companies
with low ROA -1 Year & -2 Years
Subsample of companies
with low ROA -1 Year & -2 Years& -3 Years
Subsample of companies
with low ROA -1 Year
Subsample of companies
with low ROA -1 Year & -2 Years
Subsample of companies
with low ROA -1 Year & -2 Years& -3 Years
Public pen, C.F.(T-1) -3.168*** -2.461 -3.369* -1.857 -1.647 -3.296** (0.898) (1.485) (1.828) (1.285) (1.662) (1.157) Board size (T-1) 0.936 0.169 -2.142 -1.654 1.542 -0.568 (1.327) (2.266) (2.668) (1.769) (1.752) (2.209) Indep. directors (T-1) -0.044 0.024 0.175 0.130 0.068 0.164 (0.226) (0.358) (0.362) (0.191) (0.345) (0.335) Females on board (T-1) -0.078 0.144 0.373 -0.240 -0.108 0.155 (0.321) (0.584) (0.700) (0.305) (0.584) (0.727) Largest owner C.F(T-1) -0.305 -0.576 -0.561 -0.029 -0.732* -0.683 (0.232) (0.357) (0.591) (0.268) (0.363) (0.529) Leverage (T-1) -14.681 -24.965 7.156 19.358 -22.287 -9.033 (27.612) (50.584) (46.235) (22.540) (47.222) (42.686) Illiquidity (T-1) -6.185* -5.038 17.419 -4.740 -8.039** 8.036 (3.500) (3.491) (13.220) (4.513) (3.408) (13.343) Industry dummies Yes Yes Yes Yes Yes Yes Year dummies Yes Yes Yes Yes Yes Yes Number of observations
53 33 24 63 40 26
R2 0.55 0.55 0.60 0.36 0.48 0.51 The annual Thomson One Baker data is used. Low ROA companies are defined from the group with the lowest ROA out of 4 possible groups, implemented for each year. Regression is run using OLS method. Dependent variable: Board turnover.
Board turnover = * 100 Independent members on board is in percentages against total board size less the number of employee representatives. Females on board is in percentages against total board size. Illiquidity9 = (ask price – bid price), which is computed as an average for the last 6 end of months of the year. Robust standard errors are clustered by firm. Significance level: * p<.10, ** p<.05, *** p<.01
9 Note that Illiquidity is measured as: (ask price –bid price), rather than (ask price –bid price)/(mid price) in these regressions, because the later measure resulted in collinearity in the most of regressions.
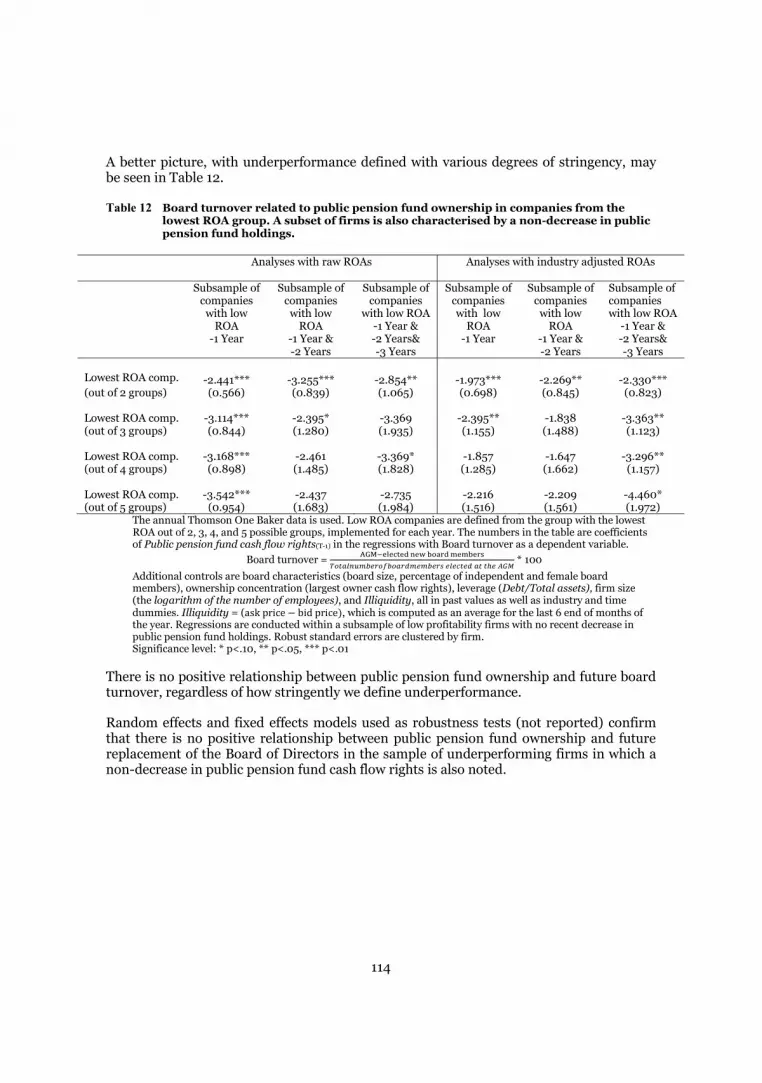
114
A better picture, with underperformance defined with various degrees of stringency, may be seen in Table 12.
Table 12 Board turnover related to public pension fund ownership in companies from the lowest ROA group. A subset of firms is also characterised by a non-decrease in public pension fund holdings.
Analyses with raw ROAs Analyses with industry adjusted ROAs
Subsample of companies
with low ROA
-1 Year
Subsample of companies
with low ROA
-1 Year & -2 Years
Subsample of companies
with low ROA -1 Year & -2 Years& -3 Years
Subsample of companies with low
ROA -1 Year
Subsample of companies
with low ROA
-1 Year & -2 Years
Subsample of companies with low ROA
-1 Year & -2 Years& -3 Years
Lowest ROA comp. -2.441*** -3.255*** -2.854** -1.973*** -2.269** -2.330*** (out of 2 groups) (0.566) (0.839) (1.065) (0.698) (0.845) (0.823) Lowest ROA comp. -3.114*** -2.395* -3.369 -2.395** -1.838 -3.363** (out of 3 groups) (0.844) (1.280) (1.935) (1.155) (1.488) (1.123) Lowest ROA comp. -3.168*** -2.461 -3.369* -1.857 -1.647 -3.296** (out of 4 groups) (0.898) (1.485) (1.828) (1.285) (1.662) (1.157) Lowest ROA comp. -3.542*** -2.437 -2.735 -2.216 -2.209 -4.460* (out of 5 groups) (0.954) (1.683) (1.984) (1.516) (1.561) (1.972)
The annual Thomson One Baker data is used. Low ROA companies are defined from the group with the lowest ROA out of 2, 3, 4, and 5 possible groups, implemented for each year. The numbers in the table are coefficients of Public pension fund cash flow rights(T-1) in the regressions with Board turnover as a dependent variable.
Board turnover = * 100 Additional controls are board characteristics (board size, percentage of independent and female board members), ownership concentration (largest owner cash flow rights), leverage (Debt/Total assets), firm size (the logarithm of the number of employees), and Illiquidity, all in past values as well as industry and time dummies. Illiquidity = (ask price bid price), which is computed as an average for the last 6 end of months of the year. Regressions are conducted within a subsample of low profitability firms with no recent decrease in public pension fund holdings. Robust standard errors are clustered by firm. Significance level: * p<.10, ** p<.05, *** p<.01
There is no positive relationship between public pension fund ownership and future board turnover, regardless of how stringently we define underperformance.
Random effects and fixed effects models used as robustness tests (not reported) confirm that there is no positive relationship between public pension fund ownership and future replacement of the Board of Directors in the sample of underperforming firms in which a non-decrease in public pension fund cash flow rights is also noted.
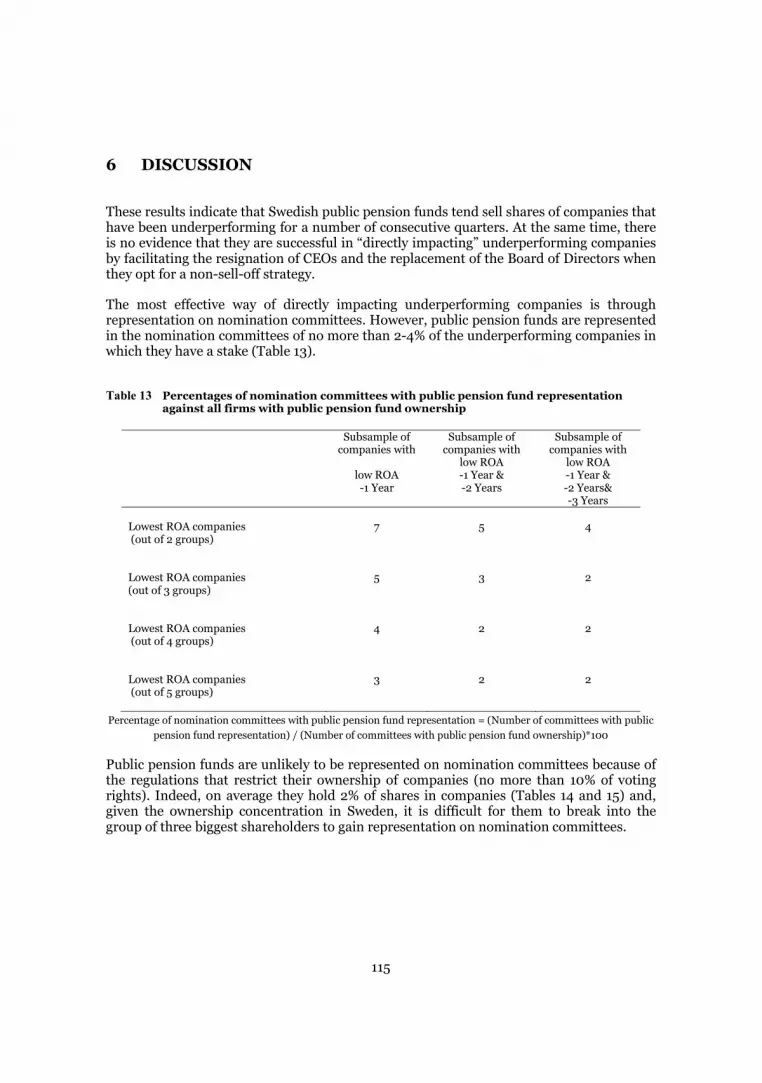
115
6 DISCUSSION
These results indicate that Swedish public pension funds tend sell shares of companies that have been underperforming for a number of consecutive quarters. At the same time, there is no evidence that they are successful in “directly impacting” underperforming companies by facilitating the resignation of CEOs and the replacement of the Board of Directors when they opt for a non-sell-off strategy.
The most effective way of directly impacting underperforming companies is through representation on nomination committees. However, public pension funds are represented in the nomination committees of no more than 2-4% of the underperforming companies in which they have a stake (Table 13).
Table 13 Percentages of nomination committees with public pension fund representation
against all firms with public pension fund ownership
Subsample of companies with
low ROA -1 Year
Subsample of companies with
low ROA -1 Year & -2 Years
Subsample of companies with
low ROA -1 Year & -2 Years& -3 Years
Lowest ROA companies (out of 2 groups)
7 5 4
Lowest ROA companies (out of 3 groups)
5 3 2
Lowest ROA companies (out of 4 groups)
4 2 2
Lowest ROA companies (out of 5 groups)
3 2 2
Percentage of nomination committees with public pension fund representation = (Number of committees with public
pension fund representation) / (Number of committees with public pension fund ownership)*100
Public pension funds are unlikely to be represented on nomination committees because of the regulations that restrict their ownership of companies (no more than 10% of voting rights). Indeed, on average they hold 2% of shares in companies (Tables 14 and 15) and, given the ownership concentration in Sweden, it is difficult for them to break into the group of three biggest shareholders to gain representation on nomination committees.
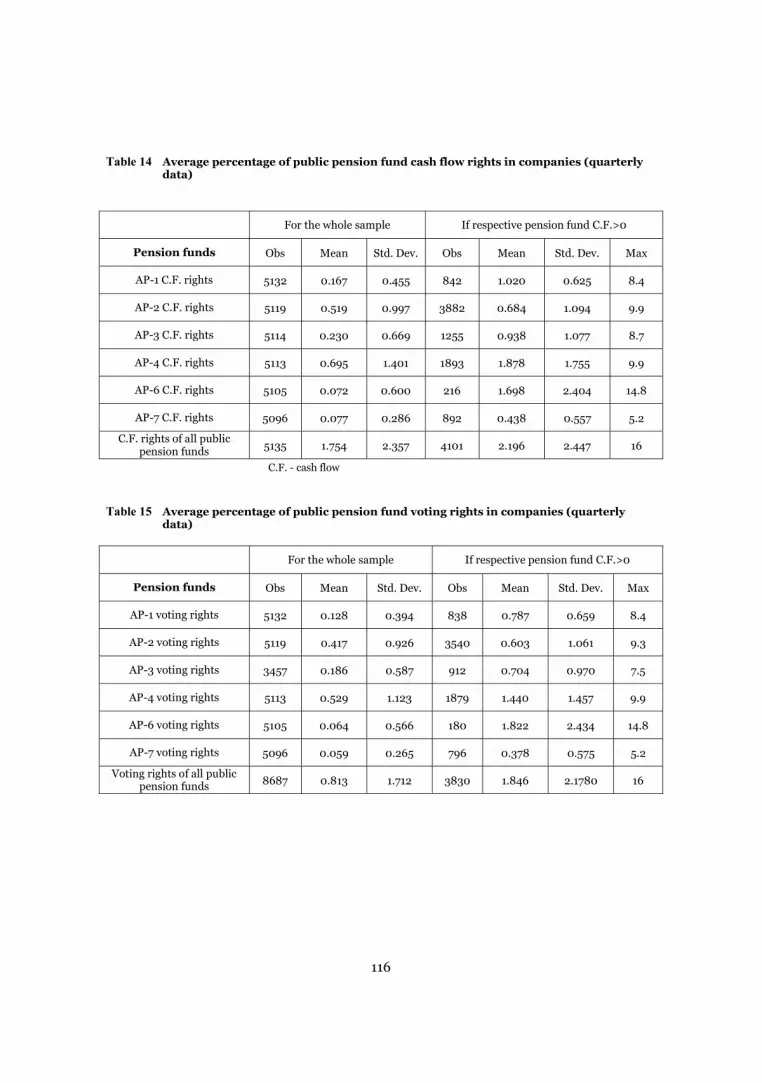
116
Table 14 Average percentage of public pension fund cash flow rights in companies (quarterly data)
For the whole sample If respective pension fund C.F.>0
Pension funds Obs Mean Std. Dev. Obs Mean Std. Dev. Max
AP-1 C.F. rights 5132 0.167 0.455 842 1.020 0.625 8.4
AP-2 C.F. rights 5119 0.519 0.997 3882 0.684 1.094 9.9
AP-3 C.F. rights 5114 0.230 0.669 1255 0.938 1.077 8.7
AP-4 C.F. rights 5113 0.695 1.401 1893 1.878 1.755 9.9
AP-6 C.F. rights 5105 0.072 0.600 216 1.698 2.404 14.8
AP-7 C.F. rights 5096 0.077 0.286 892 0.438 0.557 5.2
C.F. rights of all public pension funds 5135 1.754 2.357 4101 2.196 2.447 16
C.F. - cash flow
Table 15 Average percentage of public pension fund voting rights in companies (quarterly
data)
For the whole sample If respective pension fund C.F.>0
Pension funds Obs Mean Std. Dev. Obs Mean Std. Dev. Max
AP-1 voting rights 5132 0.128 0.394 838 0.787 0.659 8.4
AP-2 voting rights 5119 0.417 0.926 3540 0.603 1.061 9.3
AP-3 voting rights 3457 0.186 0.587 912 0.704 0.970 7.5
AP-4 voting rights 5113 0.529 1.123 1879 1.440 1.457 9.9
AP-6 voting rights 5105 0.064 0.566 180 1.822 2.434 14.8
AP-7 voting rights 5096 0.059 0.265 796 0.378 0.575 5.2
Voting rights of all public pension funds 8687 0.813 1.712 3830 1.846 2.1780 16
117
7 CONCLUSION
This study focuses on the interesting institutional framework created following pension reform in Sweden. There are several Swedish public pension funds (AP funds) with similar mandates allowed to invest public money in capital markets, including in the form of firm equity. The objective of the analysis has been to empirically assess the role of Swedish public pension funds in the governance of firms through a test of two competing impact channels: “exit” and “direct impact” through governance. The study’s focus has been on underperforming firms, as they are the ones that require action by public pension funds. The ownership strategy of AP funds in Swedish listed companies has been analysed in quarterly and annual data. I have found that public pension funds decrease their ownership in firms that underperformed in terms of their ROA in the previous consecutive 1 to 3 quarters. Furthermore, there is no significant relationship between public pension fund ownership and CEO resignation and board replacement rate in companies characterised by a poor previous performance, and a non-decrease in public pension fund ownership.
In summary, Swedish public pension funds tend to “vote with their feet” when dissatisfied with company performance. I do not find evidence for their “direct impact” on the underperforming companies.
118
REFERENCES
Becht M., Franks J., Mayers C., Rossi S., 2007, “Returns to shareholder activism: Evidence from a clinical study of the Hermes UK focus fund”, Review of Financial Studies, 22(8), pp. 3039–3129.
Bhattacharya P., Graham M., “Institutional Ownership and Firm Performance: Evidence from Finland”, (July 2007). Available at SSRN: http://ssrn.com/abstract=1000092
Black B., 1990, “Shareholder passivity reexamined”, Michigan Law Review, Vol. 89, pp.520-591
Bushee, B.J., 1998, “The influence of institutional investors on myopic R&D investment behavior”, The Accounting Review, Vol. 73, No. 3 pp. 305-333
Bushee B., 2001, “Do Institutional Investors Prefer Near-Term Earnings over Long-Run Value?”, Contemporary Accounting Research, 18, pp. 207–246
Chen X., Harford J., Li K., 2007, “Monitoring: Which institutions matter?” Journal of Financial Economics 86, pp. 279–305
Cornett M., Marcus A., Saunders A., Tehranian H., 2007, “The impact of institutional ownership on corporate governance performance”, Journal of Banking & Finance 31, pp. 1771-1794
Del Guercio D., 1996, “The distorting effect of the prudent-man laws on institutional equity investments”, Journal of Financial Economics, Vol. 40, No 1, pp. 31-62
Del Guercio D., Hawkins J., 1999, “The motivation and impact of pension fund activism”, Journal of Financial Economics, Vol. 52, Issue 3, pp. 293-340
Demsetz H., Lehn K., 1985, “The Structure of Corporate Ownership: Causes and Consequences”, Journal of Political Economy 93(6), pp 1155–1177
Duggal R., Millar J., 1999, “Institutional ownership and firm performance”, Journal of Corporate Finance 5 pp. 103-117
Faccio M., Lasfer, M., 2002, “Institutional Shareholders and Corporate Governance: The Case of U.K. Pension Funds”, in J. McCahery et al. (eds.), Corporate Governance Regimes: Convergence and Diversity, (Oxford University Press: Oxford), pp. 603-624
119
Giannetti M., Laeven L., 2009, “Pension reform, ownership structure, and corporate governance: Evidence from a natural experiment”, The Review of Financial Studies v 22 n 10, pp. 4091-4127
Gompers P., Metrick A., 2001, “Institutional investors and equity prices”, The Quarterly Journal of Economics, Vol. 116, Issue-1, pp 229-259
Helwege J., Intintoli V., Zhang, 2012, “Voting with their feet or activism? Institutional investors’ impact on CEO turnover”, Journal of Corporate Finance 18, pp. 22–37
Maug E., 1998, “Large shareholders as monitors: Is there a trade-off between liquidity and control?”, Journal of Finance 53-1, pp. 65-98.
Parrino R., Sias R., Starks L., 2003, “Voting with their feet: institutional ownership changes around forced CEO turnover”, Journal of Financial Economics 68, (2003) pp. 3–46
Pedersen T., Thomsen S., 2003, “Ownership structure and value of the largest European firms: the importance of owner identity”, Journal of Management and Governance 7, pp. 27-55
Rose C., 2007, “Can institutional investors fix the corporate governance problem? Some Danish Evidence”, Journal of Management & Governance., Vol. 11 Issue 4, pp. 405-428
Smith M., 1996, “Shareholder activism by institutional investors: Evidence from CalPERS”, The Journal of Finance Vol. 51 No1 pp. 227-252
Wahal S., 1996, “Pension fund activism and firm performance”, Journal of Financial and Quantitative Analysis, Vol. 31, pp. 1-23
Web citations:
AP-1, 2001, “Annual report 2001”, available at: <http://www.ap1.se/upload/reports/307815_EN_wkr0001.pdf>, accessed: 16.10.2016
AP-1, 2002, “Annual report 2002”, available at: <http://www.ap1.se/upload/reports/307751_EN_wkr0001.pdf>, accessed: 16.10.2016
AP-1, 2016, “Shareholder activism”, available at: <http://www.ap1.se/en/Corporate-governance/>, accessed: 14.10.2016

120
AP-1, 2014, “Ownership report 2014”, available at: <http://www.ap1.se/upload/Rapporter/AP1%20Ownership%20Report%202014.pdf>, accessed: 14.10.2016
AP-2, 2015, “Second AP Fund Corporate Governance Policy”, available at: < http://www.ap2.se/globalassets/hallbarhet-agarstyrning/corporate-governance-policy.pdf>, accessed: 14.10.2016
121
COMPETITION AS A DRIVING FORCE AMONG INSTITUTIONAL INVESTORS.
THE CASE OF SWEDISH PENSION FUNDS1
Naufal Alimov*
Abstract
A central feature of the Swedish pension fund reform at the turn of the millennium was to encourage competition among the newly created funds (AP 1-4 buffer funds) to enhance their performance. In light of the previous results reported in this thesis the question arises as to what extent there is actual competition for performance. Instead of competing they may simply be following each other into and out of the same securities. In comparing pension funds’ domestic equity portfolios, I find a portfolio overlap of 60-85% during the sample period (2001-2012), using the measure proposed by Cremers & Petajisto (2009). Greater portfolio similarity is observed especially after the financial crisis. In further analysis I identify the co-movements of AP funds’ domestic equity portfolios. These co-movements are not caused by “window dressing” at the end of the fiscal year, but can be seen as consistent with the leader-follower behaviour suggested by Fong et al. (2011).
JEL Classification: G11, G23, G28, G30, G38, M21
Key words: Institutional investors, pension funds, competition, portfolio choice, investment decisions
*Hanken School of Economics, Department of Economics
1 I would like to thank Daniel Wieberg, Rune Stenbacka, Tom Berglund, Martin Holmen, Laura Arranz Aperte, Praveen Malla, as well as participants at the PhD Workshop in Corporate Governance (Helsinki) and Seminars at the Hanken Centre for Corporate Governance for their insightful comments; and the Marcus Wallenberg Foundationand Suomen Arvopaperimarkkinoiden Edistämissäätiö for their financial support. I am also grateful to SIS Ägarservice AB for providing me with excellent ownership data on Swedish listed companies.
122
1 INTRODUCTION
It is argued that competition between institutional investors is a driving force for their better performance, because asset managers compete to achieve higher remuneration (Brown et al., 1996; Agarwal, et al. 2004) or better career prospects (Chevalier & Elison, 1999). Competitive pressure may also encourage institutional investors to improve the quality of the corporate governance of firms in their portfolios (Black, 1992). On the other hand, competitive pressure reinforced by the fact that asset managers are subject to agency problems, excessive regulation, and evaluation on an annual basis against predetermined benchmarks (Black, 1992; Lakonishok, 1992), and the constant performance judgement by public scrutiny may result in fund managers following each other into and out of the same securities at the same time (Lakonishok et al., 1992; Nofsinger & Sias R, 1999; Bushee, 2001; Sias, 2004; Fong et al., 2011; Jame, 2011).
Sweden has an interesting example of establishing a framework with a number of public pension funds (AP buffer funds) that have similar mandates and the same history. One of the main reasons for creating more than one buffer fund was to stimulate competition among them alongside other reasons, such as reducing their market impact, diversifying managerial risk, and diminishing political influence (Björkmo & Lundbergh 2010).
In this study I investigate whether the Swedish pension system has indeed been successful in encouraging competition between buffer funds in contrast to their following each other into and out of the same securities. I focus the analysis on AP funds’ domestic equities because they manage these portfolios actively and internally, whereas their foreign securities are mostly indexed or managed externally2.
During the sample period (2001-2012) the AP 1-4 funds demonstrated similar patterns of performance change (in terms of returns generated) both in general and in Swedish equity portfolios. There is therefore a good reason to compare their portfolios’ composition to test whether there has been a tendency for them to have similar portfolio over time (Björkmo & Lundbergh 2010). In using the measure suggested by Cremers & Petajisto (2009), and Petajisto (2013), I find a 60-85% portfolio overlap between Swedish AP 1-4 equities. Their portfolio overlap appears to have increased somewhat during the later sample period, and especially after the financial crisis.
On further analysis, I find co-movements within the Swedish equity portfolios of the AP 1-4 funds. Co-movements in AP funds’ share trades are observed both in purchases and sales. One of the funds that had comparatively better performance was followed more intensively by other AP funds.
I go a step further and test whether the co-movements are the result of their selling stocks with a low return and buying ones with a high return at intensified rate during the last quarter, i.e. “window dressing” (Lakonishok, 1991). Window dressing behaviour designed to avoid questions from the authorities would be a clear evidence of “bad” competition. I do not find clear-cut evidence in my analysis of “window dressing” behaviour by AP funds that would explain the co-movements in their portfolios.
2At least until the end of the sample period 2001-2012, the in-house management of foreign securities has increased between 2012 and 2015.

123
Next, I outline the literature and state my hypotheses. In the analysis that follows I start with a performance comparison of AP funds before measuring their portfolio similarities. In the subsequent sections I outline the results of testing co-movement and window-dressing hypotheses. I conclude with a discussion of perspective changes in the system in the context of my findings.
124
2 LITERATURE AND HYPOTHESES
Brown et al. (1996) note the importance of competition between asset managers. They compare the mutual fund market to a tournament in which asset managers compete for higher remuneration, the “winning” of which depends on better relative performance. At the same time the authors suggest that such competition has implications for their portfolio management, which is not always desirable, as “losers” take a short-term view and re-focus on projects with a higher risk than “winners” do, even at shareholders’ expense.
Chevalier & Ellison (1999) claim that career concerns and competition between asset managers has an impact on their portfolio decisions. They find that managerial turnover is related to past performance. Their findings show that younger asset managers, who are more likely to lose their jobs, tend to be risk-averse. This argument is consistent with the notion that young asset managers act in line with others or index their portfolios.
Bushee (2001) also supports the view that competition between institutional investors may force them to take relatively short-term gains. He argues that competitive pressures and the frequent evaluation of fund managers compel them to invest in firms that demonstrate high near-term earnings at the expense of long-term value. He finds that institutional investors with a high portfolio turnover and diverse portfolios with a near-term investment horizon prefer near-term earnings.
It is documented that institutional investors move in and out of the same securities at the same time for reasons other than competition for better performance. In the literature such behaviour is labelled broadly as herding (Sias, 2004). As the literature explains (Sias, 2004; Choi & Sias, 2009), herding among institutional investors may occur if institutional investors: (1) follow correlated signals –investigative herding, (2) infer information from each other’s trades –informational cascades (Bikhchandari et al., 1992; Sias, 2004); (3) have reputational and remuneration penalties for acting differently – reputational herding (Scharfstein & Stein 1990; Chevalier & Ellison, 1999; Massa & Patgiri, 2007); (4) are attracted to stocks with specific characteristics – characteristic herding (Sias, 2004); (5) enter the same industries – fads (Choi & Sias, 2009). A stricter definition of herding would encompass reasons 3-5, because the first two reasons fall into the category of informative trading.
Early studies find weak evidence on institutional herding. For example, Lakonishok et al. (1992) claim that US pension funds in the 1980s were more likely to practise positive feedback trading than they were to follow each other into the same securities. Notably, the authors design a herding measure that has been extensively used in subsequent studies of institutional herding.
On the other hand, Sias (2004), who investigates data up to the late 1990s, identifies strong institutional herding. The author finds that institutional investors follow both their own as well as other institutional investors’ last quarter trades. The author concludes that institutional investors move in the same direction because they are momentum traders and infer information from each other’s trades.
Contrary to the existing literature on herding, Fong et al. (2011) use the leader-follower behaviour argument to explain institutional herding. They claim that leaders with superior market information try to disguise valuable information by executing trade

125
packages through multiple brokers and over several days. In consequence, other institutional investors trade on the same securities and in the same direction as the leaders. The authors support the informational nature of leader-follower behaviour by demonstrating that the number of followers is lower when leaders disguise their trades, and that it is higher when leaders have a strong reputation.
According to Jame (2011) when pension funds are compared to other institutional investors, they are more likely to herd through uninformative trading because they have greater fiduciary responsibilities, less need for performance compensation, and larger reputational costs. Consistent with his argument, he finds that pension fund herding, unlike other institutional herding, is followed by a reversal in stock returns. This effect is stronger in smaller, and hence noisier, stocks, in line with reputational and characteristic herding and in contrast to investigative herding.
Particular attention in the literature has been given to the relationship between institutional investor herding and subsequent stock returns. For example, Nofsinger & Sias (1999) document a positive correlation between annual changes in institutional ownership and contemporaneous returns. They claim that such a relationship arises from institutional investors practising positive feedback trading and also from their being better informed which drives returns. According to Sias (2004) institutional herding has no negative impact on near-term returns – it is weakly positive. More recent studies, however, find a reversal in longer-term stock returns following institutional herding (Gutierrez & Keley, 2009; Dasgupta et al. 2011a; Dasgupta et al. 2011b; Jame, 2011).
As evidenced in the literature, competition has an impact on asset managers’ performance. Competitive pressure may also result in institutional investors trading in the same stock and in the same direction. Such behaviour may have both positive and negative features, depending on whether institutions contribute to information revelation and whether prices are driven down from their intrinsic level because of herding.
In line with the previous literature, it is reasonable to test whether there has been a tendency for AP funds to have similar portfolios over time, and whether they have similar buy and sell strategies within their domestic equity portfolios.
Hypothesis 1, and 2 reflect on these considerations:
Hypothesis – 1:
AP funds have different equity portfolio compositions.
Hypothesis – 2:
AP funds have dissimilar buy and sell strategies in their equity portfolios.
Furthermore, correlated trading between AP funds would be undesirable if it resulted primarily from their “window dressing” behaviour at year ends (the practice of removing stocks that have recently declined sharply in value simply to please public opinion or a controlling agency) (Lakonishok, 1991).

126
Hypothesis – 3:
There is no specific pattern in AP funds’ ownership changes during the last quarter (no “window dressing”).
127
3 DATA
I have collected data on AP funds’ Swedish equity portfolios from their financial reports for the period from the last quarter of 2001 to the last quarter of 2012. As financial reports of AP funds are issued on a semi-annual basis, I fill the missing quarters with data obtained from SIS Ägarservice AB, which has rich and accurate information on ownership data, especially in Swedish companies3. Information collected includes the value of holdings (in Swedish kronas), as well as the ownership position in a company (the number of shares, percentage of cash flow, and voting rights). From the value of holdings for each AP fund and each quarter in the sample I have computed the Swedish equity portfolio weights assigned to each of the securities.
I have also obtained information for stock market returns and ask-bid spread (a measure for liquidity) from the Thomson Reuters One Banker and FactSet databases. These databases have no information on delisted companies, so I have retrieved missing information from Datastream.
3 Note that AP fund portfolios include equity of both financial and non-financial companies.
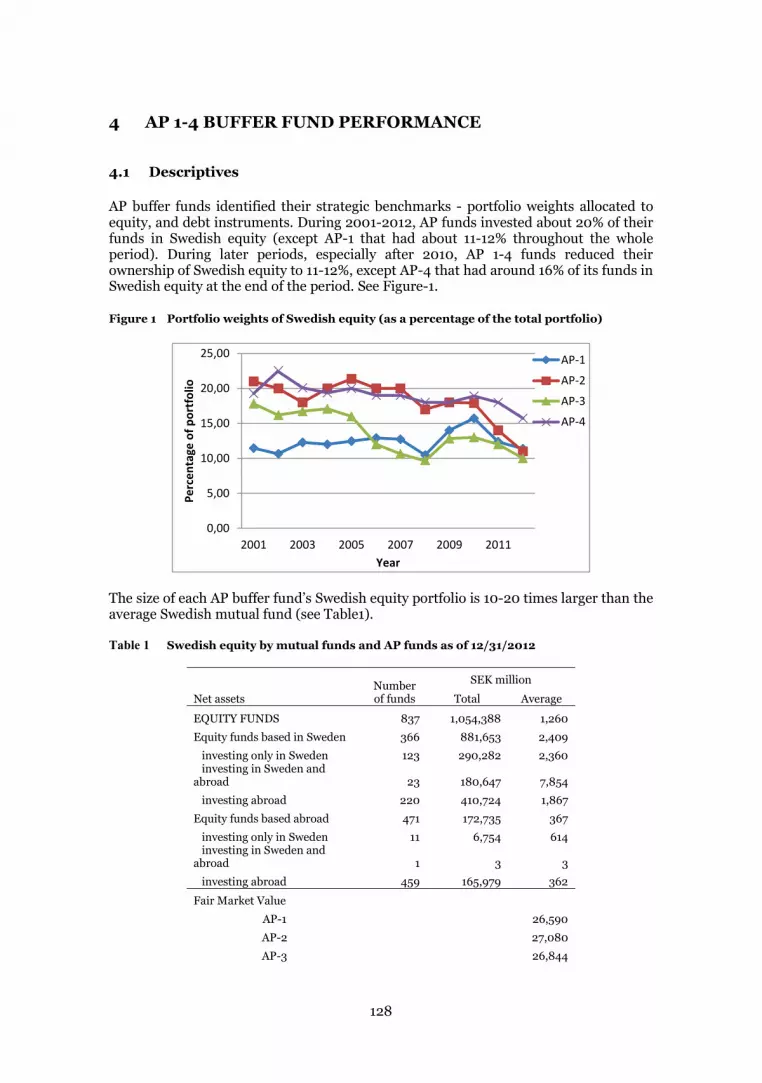
128
4 AP 1-4 BUFFER FUND PERFORMANCE
4.1 Descriptives
AP buffer funds identified their strategic benchmarks - portfolio weights allocated to equity, and debt instruments. During 2001-2012, AP funds invested about 20% of their funds in Swedish equity (except AP-1 that had about 11-12% throughout the whole period). During later periods, especially after 2010, AP 1-4 funds reduced their ownership of Swedish equity to 11-12%, except AP-4 that had around 16% of its funds in Swedish equity at the end of the period. See Figure-1.
Figure 1 Portfolio weights of Swedish equity (as a percentage of the total portfolio)
The size of each AP buffer fund’s Swedish equity portfolio is 10-20 times larger than the average Swedish mutual fund (see Table1).
Table 1 Swedish equity by mutual funds and AP funds as of 12/31/2012
Number of funds
SEK million
Net assets Total Average
EQUITY FUNDS 837 1,054,388 1,260
Equity funds based in Sweden 366 881,653 2,409
investing only in Sweden 123 290,282 2,360 investing in Sweden and abroad 23 180,647 7,854
investing abroad 220 410,724 1,867
Equity funds based abroad 471 172,735 367
investing only in Sweden 11 6,754 614 investing in Sweden and abroad 1 3 3
investing abroad 459 165,979 362
Fair Market Value
AP-1 26,590
AP-2 27,080
AP-3 26,844
0,00
5,00
10,00
15,00
20,00
25,00
2001 2003 2005 2007 2009 2011
Perc
enta
ge o
f por
tfolio
Year
AP-1AP-2AP-3AP-4

129
AP-4 40,921 Source: Swedish Investment Fund Association Statistics, Annual reports of Swedish AP 1-4
The largest holding in terms of cash flow rights in Swedish companies is observed in AP-4, and is close to 2%.
Table 2 Ownership and portfolio turnover of AP funds
Cash flow rights4 Annual portfolio turnover (sales)
Annual portfolio turnover
(purchases)
Annual portfolio turnover (min)
AP-1 1.054 *** (0.003)
13.081*** (2.790)
8.103*** (2.102)
5.589*** (1.108)
AP-2 0.664*** (0.0130)
22.81*** (5.662)
7.972 *** (2.252)
6.521 *** (1.489)
AP-3 0.867*** (0.022)
25.128** (9.212)
10.259*** (2.947)
6.185*** (1.857)
AP-4 1.771*** (0.029)
27.918*** (7.784)
18.647* (10.026)
13.428* (6.706)
Standard errors are in brackets. Standard errors in Columns 2-4 are from the time series. Significance level: * p<.10, ** p<.05, *** p<.01
(T) (i) |(C.F.(i,T) - C.F.(i,T-1))<0|*w(i,t-1)]; (T) (i) |(C.F.(i,T) - C.F.(i,T-1))>0|*w(i,t-1)];
Annual portfolio (T) (i) |(C.F.(i,T) - C.F.(i,T-1))<0|*w(i,t-1) (i) |(C.F.(i,T) - C.F.(i,T-
1))>0|*w(i,t-1)];} Here, w - portfolio weight given by fund to a specific security; C.F.- cash flow rights; T - time period (years); i - security Turnover measures are in percentages From Table 2 we can see that the other AP funds have smaller holdings in companies (around 1% by AP-1, and under 1% by AP-3 and AP-2). The holdings of AP-2 are the most dispersed.
AP funds’ portfolio turnover in terms of sales (Column 2 of Table 2) is larger than portfolio turnover in terms of purchases (Column 3 of Table 2). This arises from the fact that in the later periods AP funds reduced their Swedish equity holdings, and more data is therefore available from these periods. The largest changes within the Swedish equity portfolios are observed in AP-4.
4.2 Portfolio management and performance
AP 1-4 buffer funds all claim to have actively managed their Swedish equity portfolios. Their foreign equity is mostly indexed or managed externally. In the later periods AP funds have also increased their in-house management of foreign equity.
AP 1-4 funds have targeted a long-term annual real return (inflation-adjusted) of 4%. This target is required to maintain the balance (from the AP buffer funds’ perspective) between pension contributions and liabilities that are annually adjusted upwards with income growth in Sweden (income grew on average by 3.4% annually between 2001 and 2011 in Sweden).
4 If cash flow rights of the fund >0
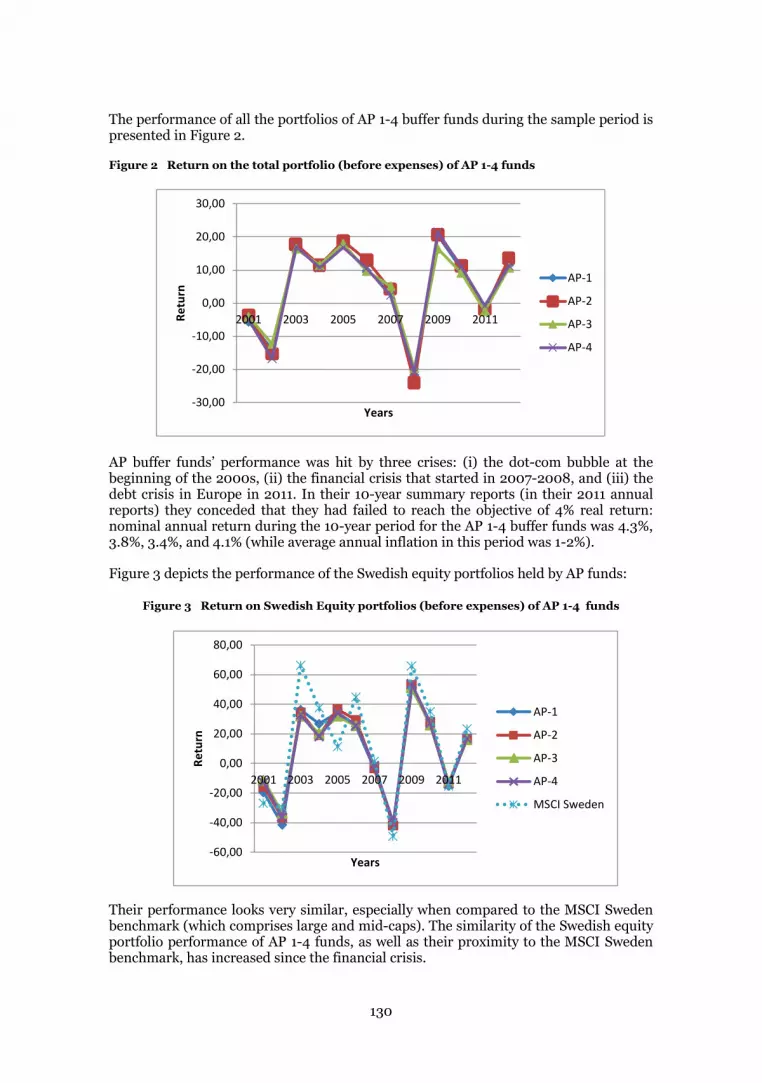
130
The performance of all the portfolios of AP 1-4 buffer funds during the sample period is presented in Figure 2.
Figure 2 Return on the total portfolio (before expenses) of AP 1-4 funds
AP buffer funds’ performance was hit by three crises: (i) the dot-com bubble at the beginning of the 2000s, (ii) the financial crisis that started in 2007-2008, and (iii) the debt crisis in Europe in 2011. In their 10-year summary reports (in their 2011 annual reports) they conceded that they had failed to reach the objective of 4% real return: nominal annual return during the 10-year period for the AP 1-4 buffer funds was 4.3%, 3.8%, 3.4%, and 4.1% (while average annual inflation in this period was 1-2%).
Figure 3 depicts the performance of the Swedish equity portfolios held by AP funds:
Figure 3 Return on Swedish Equity portfolios (before expenses) of AP 1-4 funds
Their performance looks very similar, especially when compared to the MSCI Sweden benchmark (which comprises large and mid-caps). The similarity of the Swedish equity portfolio performance of AP 1-4 funds, as well as their proximity to the MSCI Sweden benchmark, has increased since the financial crisis.
-30,00
-20,00
-10,00
0,00
10,00
20,00
30,00
2001 2003 2005 2007 2009 2011Retu
rn
Years
AP-1
AP-2
AP-3
AP-4
-60,00
-40,00
-20,00
0,00
20,00
40,00
60,00
80,00
2001 2003 2005 2007 2009 2011
Retu
rn
Years
AP-1
AP-2
AP-3
AP-4
MSCI Sweden

131
If we were to compare the funds’ Swedish equity portfolios with the OMX Stockholm Benchmark Index, which represents the most liquid stocks (not in the graph), we would have seen much greater proximity during the entire period.

132
5 THE SIMILARITY OF AP 1-4 FUNDS’ SWEDISH EQUITY PORTFOLIOS
In this section I aim to identify the similarity of AP 1-4 buffer funds’ Swedish equity portfolios (Hypothesis-1). For the purposes of this section I define AP funds’ Swedish equity portfolios as consisting of the weights assigned to particular stock by each of the funds (the value of holdings in a company against the total value of the Swedish equity portfolio) during each quarter in the period.
To compare portfolios we need an appropriate measure. The Active Share measure proposed by Petajisto (2013) and Cremers & Petajisto (2009) seems suitable for our purpose.
Active Share = | wfund,i - wbenchmark,i|
where wfund,i are the portfolio weights of specific equity in the fund, w benchmark,i are the portfolio weights of specific equity in the fund taken as a benchmark (other AP funds, average of other AP funds) and N is the quantity of stock.
If there is zero portfolio overlap between a fund under consideration and another fund, the Active Share will be equal to 100. I therefore define the portfolio overlap measure as the following:
Portfolio Overlap = 100 - Active Share
The portfolio overlap measure is between “0” and “100”, taking the value“0” if there is no overlap and “100” if there is complete overlap between the portfolios of the funds compared.
I calculate portfolio overlap between each fund against other funds, as well as those funds’ average portfolio–the benchmark – for each quarter and year during the sample period.
The results are given in Tables 3, 4, 5, and 6.
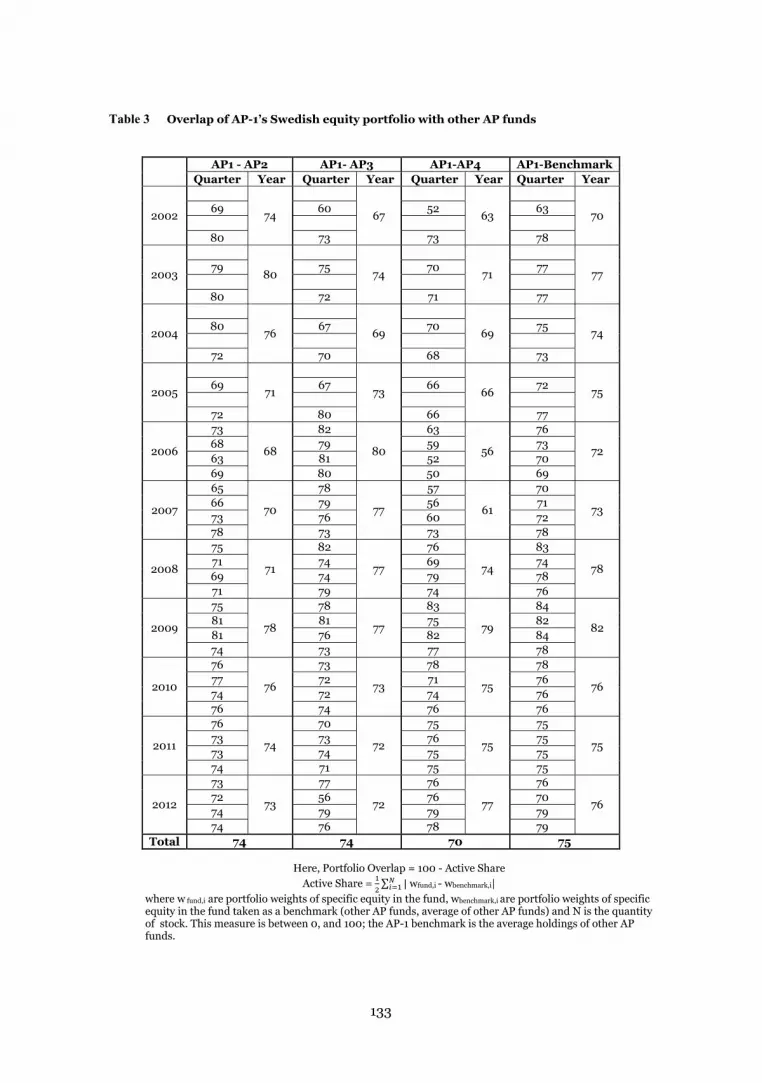
133
Table 3 Overlap of AP-1’s Swedish equity portfolio with other AP funds
AP1 - AP2 AP1- AP3 AP1-AP4 AP1-BenchmarkQuarter Year Quarter Year Quarter Year Quarter Year
2002 74 67 63 7069 60 52 63
80 73 73 78
2003 80 74 71 7779 75 70 77
80 72 71 77
2004 76 69 69 7480 67 70 75
72 70 68 73
2005 71 73 66 7569 67 66 72
72 80 66 77
2006
73
68
82
80
63
56
76
7268 79 59 7363 81 52 7069 80 50 69
2007
65
70
78
77
57
61
70
7366 79 56 7173 76 60 7278 73 73 78
2008
75
71
82
77
76
74
83
7871 74 69 7469 74 79 7871 79 74 76
2009
75
78
78
77
83
79
84
8281 81 75 8281 76 82 8474 73 77 78
2010
76
76
73
73
78
75
78
7677 72 71 7674 72 74 7676 74 76 76
2011
76
74
70
72
75
75
75
7573 73 76 7573 74 75 7574 71 75 75
2012
73
73
77
72
76
77
76
7672 56 76 7074 79 79 7974 76 78 79
Total 74 74 70 75
Here, Portfolio Overlap = 100 - Active ShareActive Share = | wfund,i - wbenchmark,i|
where w fund,i are portfolio weights of specific equity in the fund, wbenchmark,i are portfolio weights of specific equity in the fund taken as a benchmark (other AP funds, average of other AP funds) and N is the quantity of stock. This measure is between 0, and 100; the AP-1 benchmark is the average holdings of other AP funds.
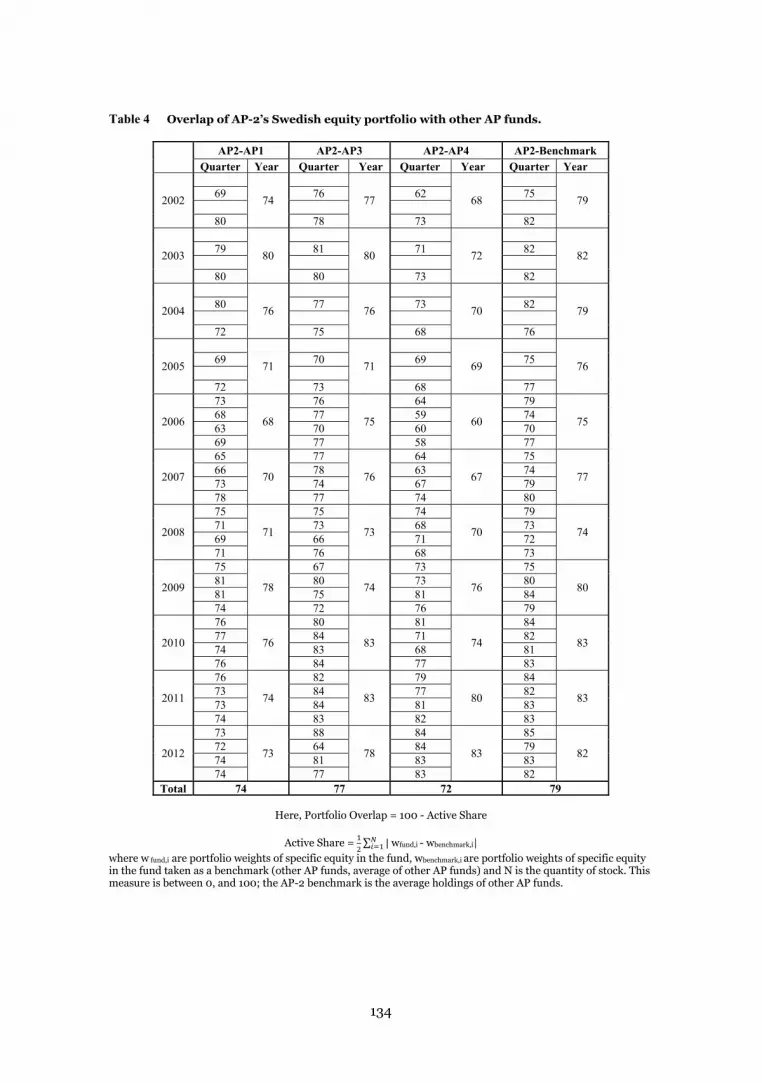
134
Table 4 Overlap of AP-2’s Swedish equity portfolio with other AP funds.
AP2-AP1 AP2-AP3 AP2-AP4 AP2-BenchmarkQuarter Year Quarter Year Quarter Year Quarter Year
2002 74 77 68 7969 76 62 75
80 78 73 82
2003 80 80 72 8279 81 71 82
80 80 73 82
2004 76 76 70 7980 77 73 82
72 75 68 76
2005 71 71 69 7669 70 69 75
72 73 68 77
2006
73
68
76
75
64
60
79
7568 77 59 7463 70 60 7069 77 58 77
2007
65
70
77
76
64
67
75
7766 78 63 7473 74 67 7978 77 74 80
2008
75
71
75
73
74
70
79
7471 73 68 7369 66 71 7271 76 68 73
2009
75
78
67
74
73
76
75
8081 80 73 8081 75 81 8474 72 76 79
2010
76
76
80
83
81
74
84
8377 84 71 8274 83 68 8176 84 77 83
2011
76
74
82
83
79
80
84
8373 84 77 8273 84 81 8374 83 82 83
2012
73
73
88
78
84
83
85
8272 64 84 7974 81 83 8374 77 83 82
Total 74 77 72 79
Here, Portfolio Overlap = 100 - Active Share
Active Share = | wfund,i - wbenchmark,i|where w fund,i are portfolio weights of specific equity in the fund, wbenchmark,i are portfolio weights of specific equity in the fund taken as a benchmark (other AP funds, average of other AP funds) and N is the quantity of stock. This measure is between 0, and 100; the AP-2 benchmark is the average holdings of other AP funds.
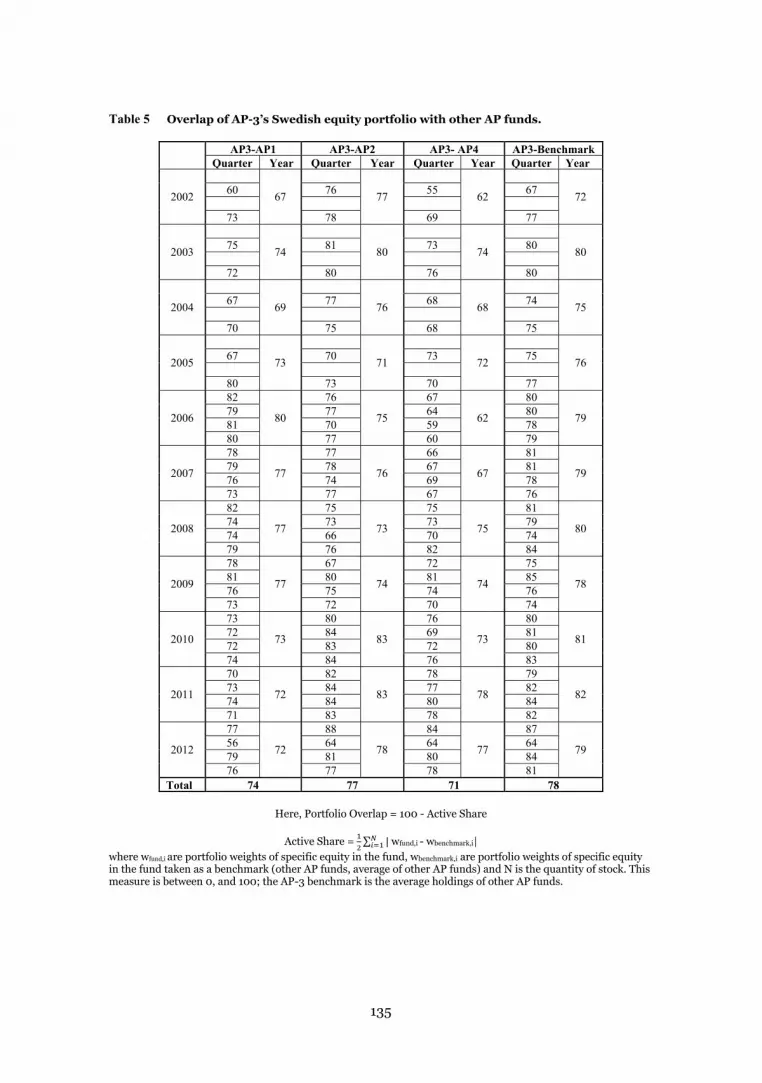
135
Table 5 Overlap of AP-3’s Swedish equity portfolio with other AP funds.
AP3-AP1 AP3-AP2 AP3- AP4 AP3-BenchmarkQuarter Year Quarter Year Quarter Year Quarter Year
2002 67 77 62 7260 76 55 67
73 78 69 77
2003 74 80 74 8075 81 73 80
72 80 76 80
2004 69 76 68 7567 77 68 74
70 75 68 75
2005 73 71 72 7667 70 73 75
80 73 70 77
2006
82
80
76
75
67
62
80
7979 77 64 8081 70 59 7880 77 60 79
2007
78
77
77
76
66
67
81
7979 78 67 8176 74 69 7873 77 67 76
2008
82
77
75
73
75
75
81
8074 73 73 7974 66 70 7479 76 82 84
2009
78
77
67
74
72
74
75
7881 80 81 8576 75 74 7673 72 70 74
2010
73
73
80
83
76
73
80
8172 84 69 8172 83 72 8074 84 76 83
2011
70
72
82
83
78
78
79
8273 84 77 8274 84 80 8471 83 78 82
2012
77
72
88
78
84
77
87
7956 64 64 6479 81 80 8476 77 78 81
Total 74 77 71 78
Here, Portfolio Overlap = 100 - Active Share
Active Share = | wfund,i - wbenchmark,i|where wfund,i are portfolio weights of specific equity in the fund, wbenchmark,i are portfolio weights of specific equity in the fund taken as a benchmark (other AP funds, average of other AP funds) and N is the quantity of stock. This measure is between 0, and 100; the AP-3 benchmark is the average holdings of other AP funds.
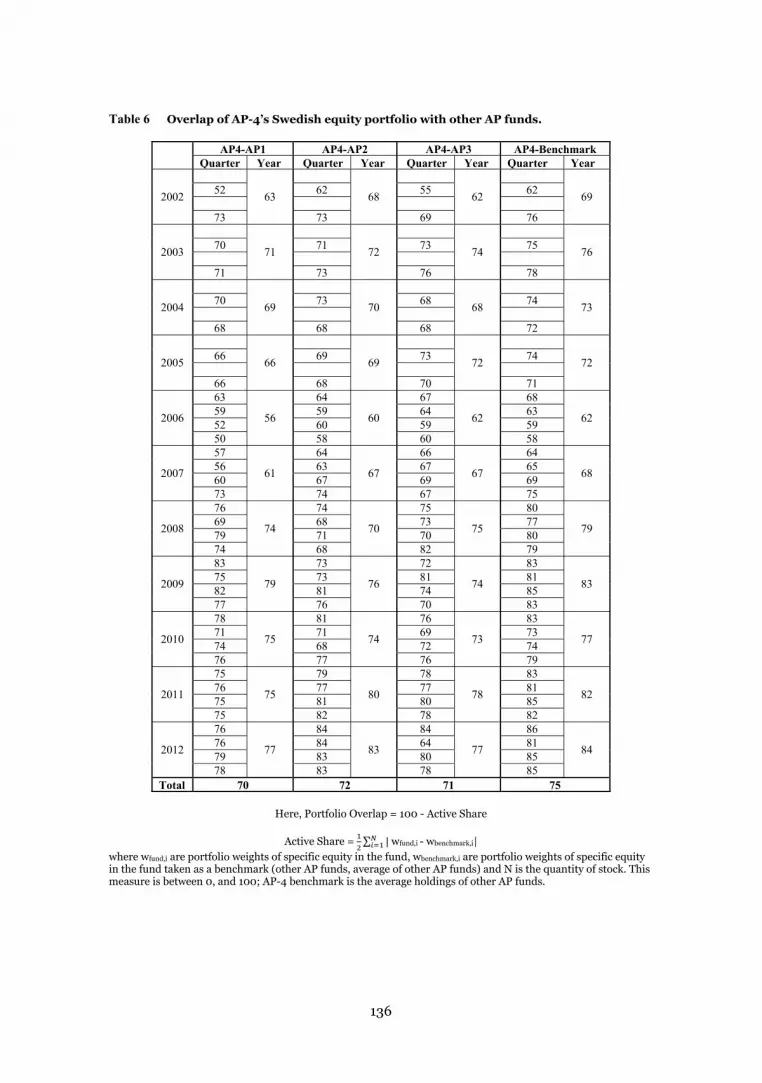
136
Table 6 Overlap of AP-4’s Swedish equity portfolio with other AP funds.
AP4-AP1 AP4-AP2 AP4-AP3 AP4-BenchmarkQuarter Year Quarter Year Quarter Year Quarter Year
2002 63 68 62 6952 62 55 62
73 73 69 76
2003 71 72 74 7670 71 73 75
71 73 76 78
2004 69 70 68 7370 73 68 74
68 68 68 72
2005 66 69 72 7266 69 73 74
66 68 70 71
2006
63
56
64
60
67
62
68
6259 59 64 6352 60 59 5950 58 60 58
2007
57
61
64
67
66
67
64
6856 63 67 6560 67 69 6973 74 67 75
2008
76
74
74
70
75
75
80
7969 68 73 7779 71 70 8074 68 82 79
2009
83
79
73
76
72
74
83
8375 73 81 8182 81 74 8577 76 70 83
2010
78
75
81
74
76
73
83
7771 71 69 7374 68 72 7476 77 76 79
2011
75
75
79
80
78
78
83
8276 77 77 8175 81 80 8575 82 78 82
2012
76
77
84
83
84
77
86
8476 84 64 8179 83 80 8578 83 78 85
Total 70 72 71 75
Here, Portfolio Overlap = 100 - Active Share
Active Share = | wfund,i - wbenchmark,i|where wfund,i are portfolio weights of specific equity in the fund, wbenchmark,i are portfolio weights of specific equity in the fund taken as a benchmark (other AP funds, average of other AP funds) and N is the quantity of stock. This measure is between 0, and 100; AP-4 benchmark is the average holdings of other AP funds.
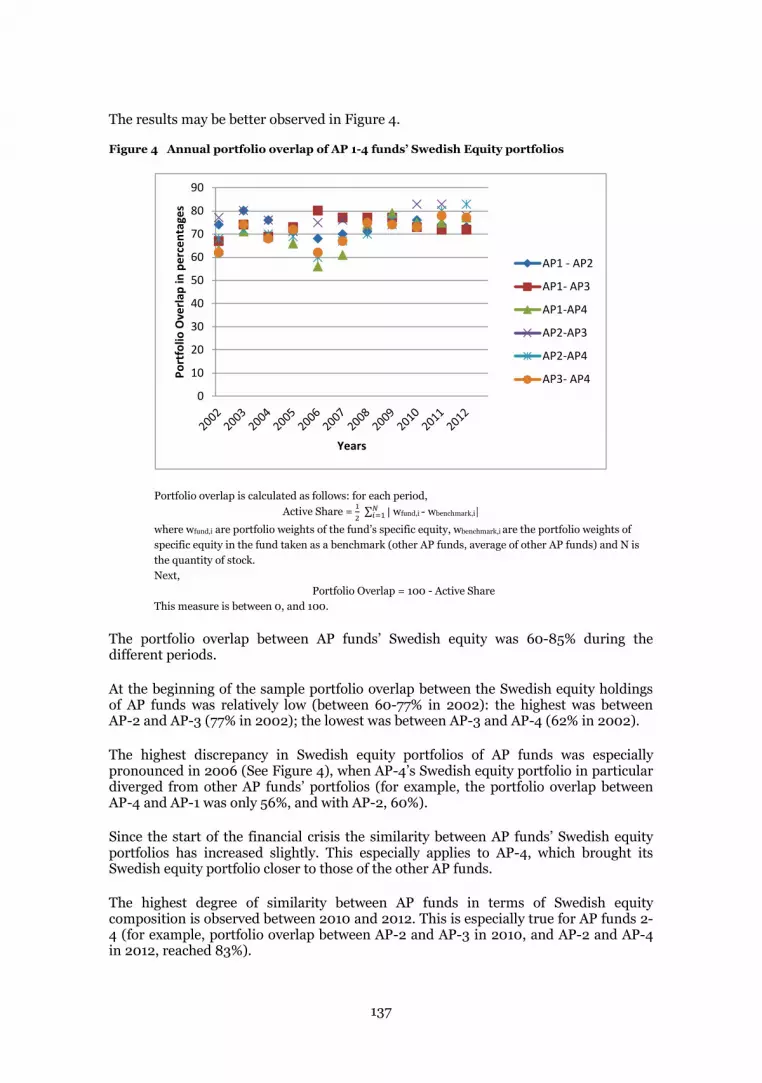
137
The results may be better observed in Figure 4.
Figure 4 Annual portfolio overlap of AP 1-4 funds’ Swedish Equity portfolios
Portfolio overlap is calculated as follows: for each period, Active Share = | wfund,i - wbenchmark,i|
where wfund,i are portfolio weights of the fund’s specific equity, wbenchmark,i are the portfolio weights of specific equity in the fund taken as a benchmark (other AP funds, average of other AP funds) and N is the quantity of stock. Next,
Portfolio Overlap = 100 - Active Share This measure is between 0, and 100.
The portfolio overlap between AP funds’ Swedish equity was 60-85% during the different periods.
At the beginning of the sample portfolio overlap between the Swedish equity holdings of AP funds was relatively low (between 60-77% in 2002): the highest was between AP-2 and AP-3 (77% in 2002); the lowest was between AP-3 and AP-4 (62% in 2002).
The highest discrepancy in Swedish equity portfolios of AP funds was especially pronounced in 2006 (See Figure 4), when AP-4’s Swedish equity portfolio in particular diverged from other AP funds’ portfolios (for example, the portfolio overlap between AP-4 and AP-1 was only 56%, and with AP-2, 60%).
Since the start of the financial crisis the similarity between AP funds’ Swedish equity portfolios has increased slightly. This especially applies to AP-4, which brought its Swedish equity portfolio closer to those of the other AP funds.
The highest degree of similarity between AP funds in terms of Swedish equity composition is observed between 2010 and 2012. This is especially true for AP funds 2-4 (for example, portfolio overlap between AP-2 and AP-3 in 2010, and AP-2 and AP-4 in 2012, reached 83%).
0
10
20
30
40
50
60
70
80
90Po
rtfo
lio O
verla
p in
per
cent
ages
Years
AP1 - AP2
AP1- AP3
AP1-AP4
AP2-AP3
AP2-AP4
AP3- AP4

138
Judging the extent of Swedish equity portfolio similarity between the AP 1-4 funds remains a subjective matter. One could also argue that a 20-25% portfolio difference between AP funds has the capacity to generate substantial differences in performance. However, Figure 3 above shows that the returns generated by AP funds’ Swedish equity portfolios, especially following the financial crisis, were close to identical.
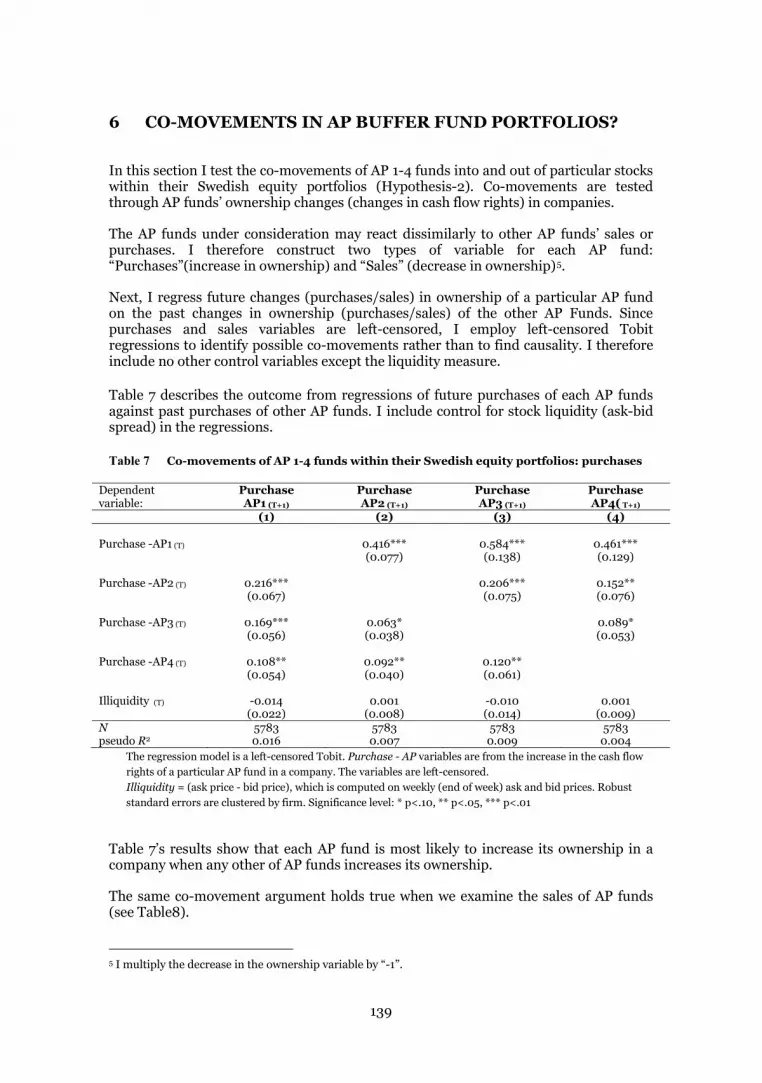
139
6 CO-MOVEMENTS IN AP BUFFER FUND PORTFOLIOS?
In this section I test the co-movements of AP 1-4 funds into and out of particular stocks within their Swedish equity portfolios (Hypothesis-2). Co-movements are tested through AP funds’ ownership changes (changes in cash flow rights) in companies.
The AP funds under consideration may react dissimilarly to other AP funds’ sales or purchases. I therefore construct two types of variable for each AP fund: “Purchases”(increase in ownership) and “Sales” (decrease in ownership)5.
Next, I regress future changes (purchases/sales) in ownership of a particular AP fund on the past changes in ownership (purchases/sales) of the other AP Funds. Since purchases and sales variables are left-censored, I employ left-censored Tobit regressions to identify possible co-movements rather than to find causality. I therefore include no other control variables except the liquidity measure.
Table 7 describes the outcome from regressions of future purchases of each AP funds against past purchases of other AP funds. I include control for stock liquidity (ask-bid spread) in the regressions.
Table 7 Co-movements of AP 1-4 funds within their Swedish equity portfolios: purchases
The regression model is a left-censored Tobit. Purchase - AP variables are from the increase in the cash flow rights of a particular AP fund in a company. The variables are left-censored. Illiquidity = (ask price - bid price), which is computed on weekly (end of week) ask and bid prices. Robust standard errors are clustered by firm. Significance level: * p<.10, ** p<.05, *** p<.01
Table 7’s results show that each AP fund is most likely to increase its ownership in a company when any other of AP funds increases its ownership.
The same co-movement argument holds true when we examine the sales of AP funds (see Table8).
5 I multiply the decrease in the ownership variable by “-1”.
Dependent variable:
Purchase AP1 (T+1)
Purchase AP2 (T+1)
Purchase AP3 (T+1)
Purchase AP4( T+1)
(1) (2) (3) (4) Purchase -AP1 (T) 0.416*** 0.584*** 0.461*** (0.077) (0.138) (0.129) Purchase -AP2 (T) 0.216*** 0.206*** 0.152** (0.067) (0.075) (0.076) Purchase -AP3 (T) 0.169*** 0.063* 0.089* (0.056) (0.038) (0.053) Purchase -AP4 (T) 0.108** 0.092** 0.120** (0.054) (0.040) (0.061) Illiquidity (T) -0.014 0.001 -0.010 0.001 (0.022) (0.008) (0.014) (0.009) N 5783 5783 5783 5783 pseudo R2 0.016 0.007 0.009 0.004
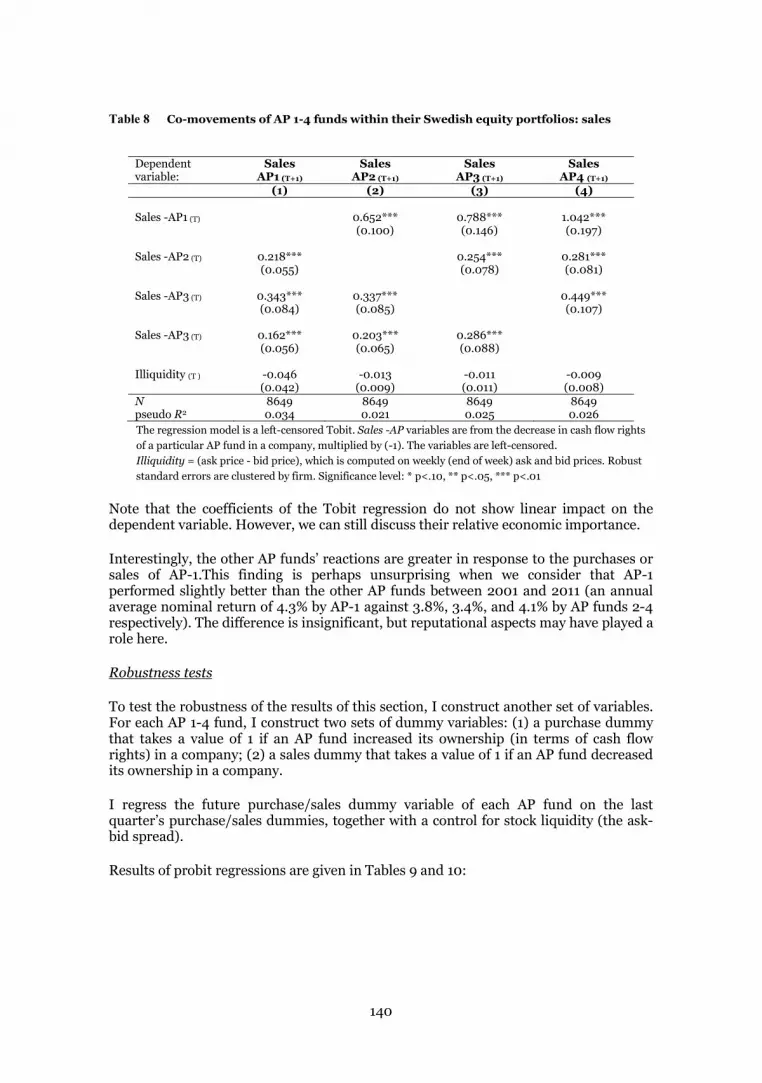
140
Table 8 Co-movements of AP 1-4 funds within their Swedish equity portfolios: sales
Dependent variable:
Sales AP1 (T+1)
Sales AP2 (T+1)
Sales AP3 (T+1)
Sales AP4 (T+1)
(1) (2) (3) (4) Sales -AP1 (T) 0.652*** 0.788*** 1.042*** (0.100) (0.146) (0.197) Sales -AP2 (T) 0.218*** 0.254*** 0.281*** (0.055) (0.078) (0.081) Sales -AP3 (T) 0.343*** 0.337*** 0.449*** (0.084) (0.085) (0.107) Sales -AP3 (T) 0.162*** 0.203*** 0.286*** (0.056) (0.065) (0.088) Illiquidity (T ) -0.046 -0.013 -0.011 -0.009 (0.042) (0.009) (0.011) (0.008) N 8649 8649 8649 8649 pseudo R2 0.034 0.021 0.025 0.026 The regression model is a left-censored Tobit. Sales -AP variables are from the decrease in cash flow rights of a particular AP fund in a company, multiplied by (-1). The variables are left-censored. Illiquidity = (ask price - bid price), which is computed on weekly (end of week) ask and bid prices. Robust standard errors are clustered by firm. Significance level: * p<.10, ** p<.05, *** p<.01
Note that the coefficients of the Tobit regression do not show linear impact on the dependent variable. However, we can still discuss their relative economic importance.
Interestingly, the other AP funds’ reactions are greater in response to the purchases or sales of AP-1.This finding is perhaps unsurprising when we consider that AP-1 performed slightly better than the other AP funds between 2001 and 2011 (an annual average nominal return of 4.3% by AP-1 against 3.8%, 3.4%, and 4.1% by AP funds 2-4 respectively). The difference is insignificant, but reputational aspects may have played a role here.
Robustness tests
To test the robustness of the results of this section, I construct another set of variables. For each AP 1-4 fund, I construct two sets of dummy variables: (1) a purchase dummy that takes a value of 1 if an AP fund increased its ownership (in terms of cash flow rights) in a company; (2) a sales dummy that takes a value of 1 if an AP fund decreased its ownership in a company.
I regress the future purchase/sales dummy variable of each AP fund on the last quarter’s purchase/sales dummies, together with a control for stock liquidity (the ask-bid spread).
Results of probit regressions are given in Tables 9 and 10:
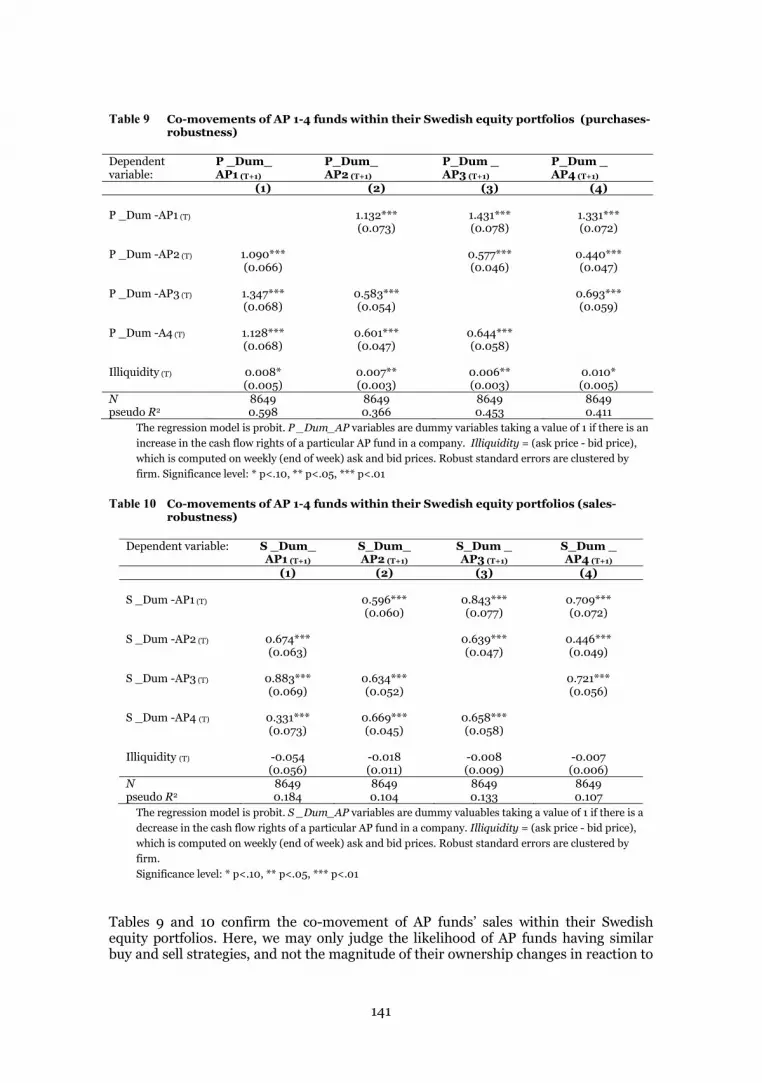
141
Table 9 Co-movements of AP 1-4 funds within their Swedish equity portfolios (purchases- robustness)
Dependent variable:
P _Dum_ AP1 (T+1)
P_Dum_ AP2 (T+1)
P_Dum _ AP3 (T+1)
P_Dum _ AP4 (T+1)
(1) (2) (3) (4) P _Dum -AP1 (T) 1.132*** 1.431*** 1.331*** (0.073) (0.078) (0.072) P _Dum -AP2 (T) 1.090*** 0.577*** 0.440*** (0.066) (0.046) (0.047) P _Dum -AP3 (T) 1.347*** 0.583*** 0.693*** (0.068) (0.054) (0.059) P _Dum -A4 (T) 1.128*** 0.601*** 0.644*** (0.068) (0.047) (0.058) Illiquidity (T) 0.008* 0.007** 0.006** 0.010* (0.005) (0.003) (0.003) (0.005) N 8649 8649 8649 8649 pseudo R2 0.598 0.366 0.453 0.411
The regression model is probit. P _Dum_AP variables are dummy variables taking a value of 1 if there is an increase in the cash flow rights of a particular AP fund in a company. Illiquidity = (ask price - bid price), which is computed on weekly (end of week) ask and bid prices. Robust standard errors are clustered by firm. Significance level: * p<.10, ** p<.05, *** p<.01
Table 10 Co-movements of AP 1-4 funds within their Swedish equity portfolios (sales-
robustness)
Dependent variable: S _Dum_ AP1 (T+1)
S_Dum_ AP2 (T+1)
S_Dum _ AP3 (T+1)
S_Dum _ AP4 (T+1)
(1) (2) (3) (4) S _Dum -AP1 (T) 0.596*** 0.843*** 0.709*** (0.060) (0.077) (0.072) S _Dum -AP2 (T) 0.674*** 0.639*** 0.446*** (0.063) (0.047) (0.049) S _Dum -AP3 (T) 0.883*** 0.634*** 0.721*** (0.069) (0.052) (0.056) S _Dum -AP4 (T) 0.331*** 0.669*** 0.658*** (0.073) (0.045) (0.058) Illiquidity (T) -0.054 -0.018 -0.008 -0.007 (0.056) (0.011) (0.009) (0.006) N 8649 8649 8649 8649 pseudo R2 0.184 0.104 0.133 0.107
The regression model is probit. S _Dum_AP variables are dummy valuables taking a value of 1 if there is a decrease in the cash flow rights of a particular AP fund in a company. Illiquidity = (ask price - bid price), which is computed on weekly (end of week) ask and bid prices. Robust standard errors are clustered by firm. Significance level: * p<.10, ** p<.05, *** p<.01
Tables 9 and 10 confirm the co-movement of AP funds’ sales within their Swedish equity portfolios. Here, we may only judge the likelihood of AP funds having similar buy and sell strategies, and not the magnitude of their ownership changes in reaction to

142
the level of change in other AP funds. Whether AP-1 is being followed by a significantly greater degree of ownership change in other AP funds is not verified here.
Section conclusion:
The results in this section suggest that there is indeed a co-movement by AP funds 1-4 within their Swedish equity portfolios. The fact that one of the AP funds is followed more extensively is consistent with Fong et al. (2011), who suggest a rational and intentional following of the leader with superior information by other institutional investors, and the leader getting higher return on investment along the co-movement towards price discovery.

143
7 CO-MOVEMENTS THROUGH WINDOW DRESSING?
If the co-movement of AP funds were a result of their selling off low-return stock and buying high-return stock more extensively during the last quarter immediately before reporting their holdings in annual reports to please the controller (the state) and public opinion, we would consider especially such co-movement to run counter to competition arguments. In this section I therefore test AP funds’ “window dressing” behaviour (Hypothesis-3).
To this end, I split the sample of firms into five quantiles with regard to their performance in terms of the stock returns for each quarter, and then consider the quarterly changes in ownership by AP 1-4 funds (sales/purchases of stock) for each performance group. Subsequently, I compare Quarter 1-3 trades with those observed in Quarter 4. The results are given in Tables 11 (for AP-1), 12 (for AP-2), 13 (for AP-3), and 14 (for AP-4).
Our main interest here is in the significant difference between Quarter 4 and Quarter 1-3 trades in selling losers and buying winners.
Table 11 Test of window dressing by AP-1
AP-1 Purchases
Return (low to high) last
quarter Quarters 1-3 Quarter 4 Difference
1 0.293*** (0.062)
0.357*** (0.080)
0.063 (0.110)
2 0.266*** (0.038)
0.541** (0.192)
0.285** (0.120)
3 0.285*** (0.036)
0.285** (0.087)
0.0008 (0.091)
4 0.261*** (0.043)
0.136*** (0.042)
- 0.125 (0.088)
5 0.353*** (0.055)
0.280*** (0.058)
- 0.074 (0.101)
AP-1 Sales
Return (low to high) last
quarter Quarters 1-3 Quarter 4 Difference
1 0.310*** (0.063)
0.190*** (0.053)
- 0.124 (0.113)
2 0.263*** (0.037)
0.264*** (0.054)
0.002 (0.081)
3 0.249*** (0.033)
0.204*** (0.046)
-0.045 (0.061)
4 0.261*** (0.034)
0.182*** (0.036)
- 0.079 (0.050)
5 0.360*** (0.069)
0.180*** (0.040)
- 0.18** (0.084)
For each quarter, firms are split into 5 quantiles with regard to stock returns.
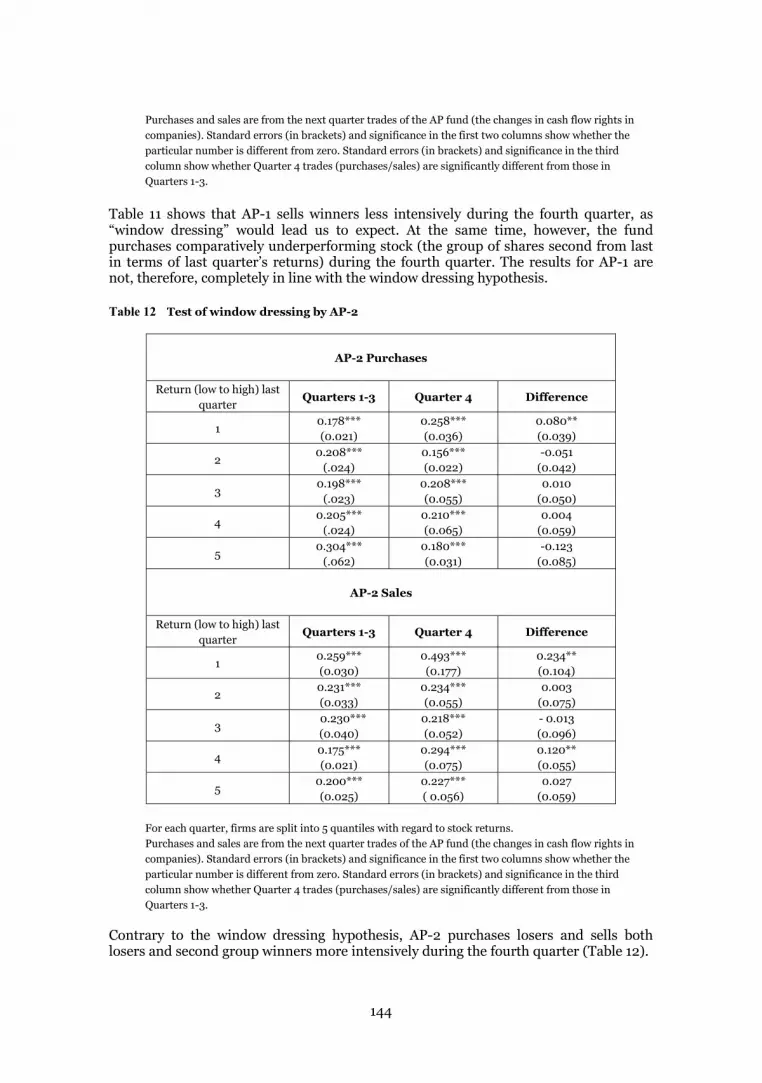
144
Purchases and sales are from the next quarter trades of the AP fund (the changes in cash flow rights in companies). Standard errors (in brackets) and significance in the first two columns show whether the particular number is different from zero. Standard errors (in brackets) and significance in the third column show whether Quarter 4 trades (purchases/sales) are significantly different from those in Quarters 1-3.
Table 11 shows that AP-1 sells winners less intensively during the fourth quarter, as “window dressing” would lead us to expect. At the same time, however, the fund purchases comparatively underperforming stock (the group of shares second from last in terms of last quarter’s returns) during the fourth quarter. The results for AP-1 are not, therefore, completely in line with the window dressing hypothesis.
Table 12 Test of window dressing by AP-2
AP-2 Purchases
Return (low to high) last
quarter Quarters 1-3 Quarter 4 Difference
1 0.178*** (0.021)
0.258*** (0.036)
0.080** (0.039)
2 0.208***
(.024) 0.156*** (0.022)
-0.051 (0.042)
3 0.198***
(.023) 0.208*** (0.055)
0.010 (0.050)
4 0.205***
(.024) 0.210*** (0.065)
0.004 (0.059)
5 0.304***
(.062) 0.180*** (0.031)
-0.123 (0.085)
AP-2 Sales
Return (low to high) last
quarter Quarters 1-3 Quarter 4 Difference
1 0.259*** (0.030)
0.493*** (0.177)
0.234** (0.104)
2 0.231*** (0.033)
0.234*** (0.055)
0.003 (0.075)
3 0.230***
(0.040) 0.218*** (0.052)
- 0.013 (0.096)
4 0.175*** (0.021)
0.294*** (0.075)
0.120** (0.055)
5 0.200*** (0.025)
0.227*** ( 0.056)
0.027 (0.059)
For each quarter, firms are split into 5 quantiles with regard to stock returns. Purchases and sales are from the next quarter trades of the AP fund (the changes in cash flow rights in companies). Standard errors (in brackets) and significance in the first two columns show whether the particular number is different from zero. Standard errors (in brackets) and significance in the third column show whether Quarter 4 trades (purchases/sales) are significantly different from those in Quarters 1-3.
Contrary to the window dressing hypothesis, AP-2 purchases losers and sells both losers and second group winners more intensively during the fourth quarter (Table 12).
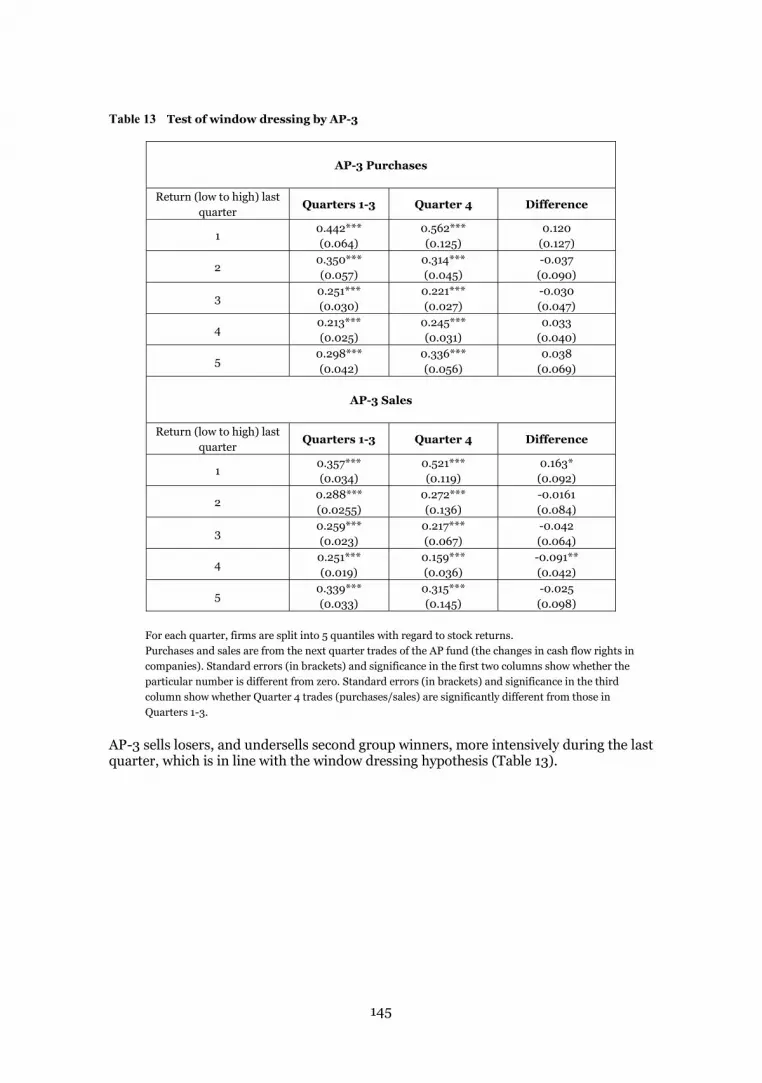
145
Table 13 Test of window dressing by AP-3
AP-3 Purchases
Return (low to high) last
quarter Quarters 1-3 Quarter 4 Difference
1 0.442*** (0.064)
0.562*** (0.125)
0.120 (0.127)
2 0.350*** (0.057)
0.314*** (0.045)
-0.037 (0.090)
3 0.251*** (0.030)
0.221*** (0.027)
-0.030 (0.047)
4 0.213*** (0.025)
0.245*** (0.031)
0.033 (0.040)
5 0.298*** (0.042)
0.336*** (0.056)
0.038 (0.069)
AP-3 Sales
Return (low to high) last
quarter Quarters 1-3 Quarter 4 Difference
1 0.357*** (0.034)
0.521*** (0.119)
0.163* (0.092)
2 0.288*** (0.0255)
0.272*** (0.136)
-0.0161 (0.084)
3 0.259*** (0.023)
0.217*** (0.067)
-0.042 (0.064)
4 0.251*** (0.019)
0.159*** (0.036)
-0.091** (0.042)
5 0.339*** (0.033)
0.315*** (0.145)
-0.025 (0.098)
For each quarter, firms are split into 5 quantiles with regard to stock returns. Purchases and sales are from the next quarter trades of the AP fund (the changes in cash flow rights in companies). Standard errors (in brackets) and significance in the first two columns show whether the particular number is different from zero. Standard errors (in brackets) and significance in the third column show whether Quarter 4 trades (purchases/sales) are significantly different from those in Quarters 1-3.
AP-3 sells losers, and undersells second group winners, more intensively during the last quarter, which is in line with the window dressing hypothesis (Table 13).
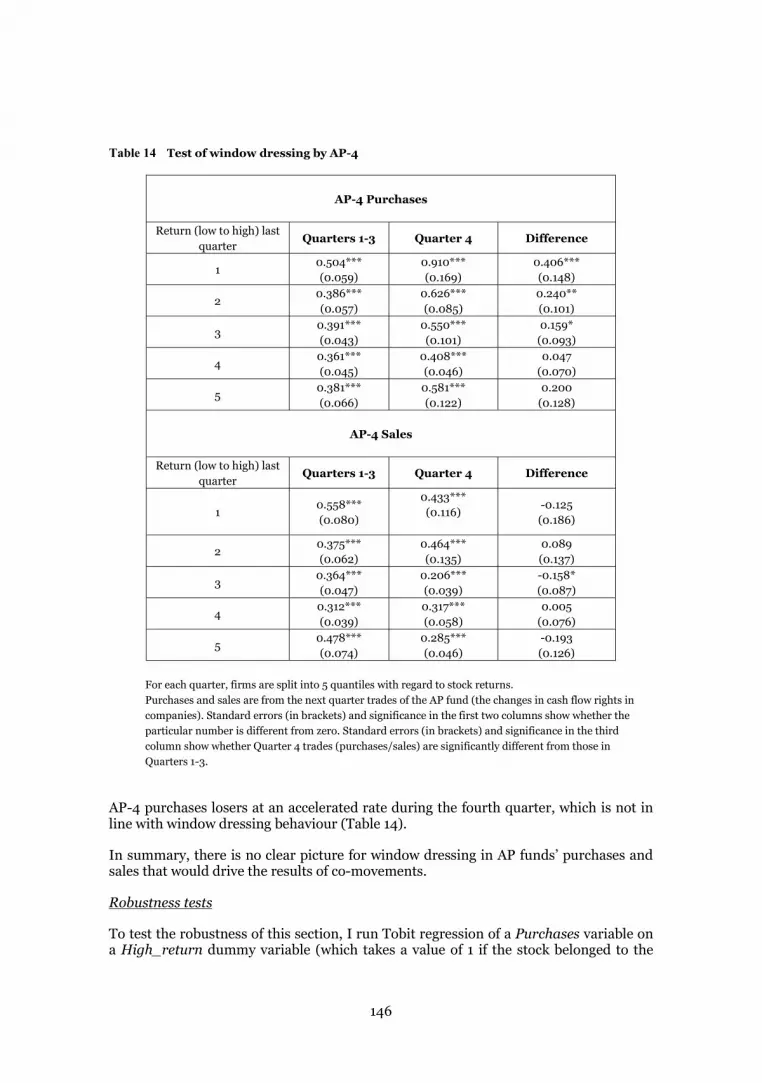
146
Table 14 Test of window dressing by AP-4
AP-4 Purchases
Return (low to high) last
quarter Quarters 1-3 Quarter 4 Difference
1 0.504*** (0.059)
0.910*** (0.169)
0.406*** (0.148)
2 0.386*** (0.057)
0.626*** (0.085)
0.240** (0.101)
3 0.391*** (0.043)
0.550*** (0.101)
0.159* (0.093)
4 0.361*** (0.045)
0.408*** (0.046)
0.047 (0.070)
5 0.381*** (0.066)
0.581*** (0.122)
0.200 (0.128)
AP-4 Sales
Return (low to high) last
quarter Quarters 1-3 Quarter 4 Difference
1 0.558*** (0.080)
0.433*** (0.116)
-0.125 (0.186)
2 0.375*** (0.062)
0.464*** (0.135)
0.089 (0.137)
3 0.364*** (0.047)
0.206*** (0.039)
-0.158* (0.087)
4 0.312*** (0.039)
0.317*** (0.058)
0.005 (0.076)
5 0.478*** (0.074)
0.285*** (0.046)
-0.193 (0.126)
For each quarter, firms are split into 5 quantiles with regard to stock returns. Purchases and sales are from the next quarter trades of the AP fund (the changes in cash flow rights in companies). Standard errors (in brackets) and significance in the first two columns show whether the particular number is different from zero. Standard errors (in brackets) and significance in the third column show whether Quarter 4 trades (purchases/sales) are significantly different from those in Quarters 1-3.
AP-4 purchases losers at an accelerated rate during the fourth quarter, which is not in line with window dressing behaviour (Table 14).
In summary, there is no clear picture for window dressing in AP funds’ purchases and sales that would drive the results of co-movements.
Robustness tests
To test the robustness of this section, I run Tobit regression of a Purchases variable on a High_return dummy variable (which takes a value of 1 if the stock belonged to the
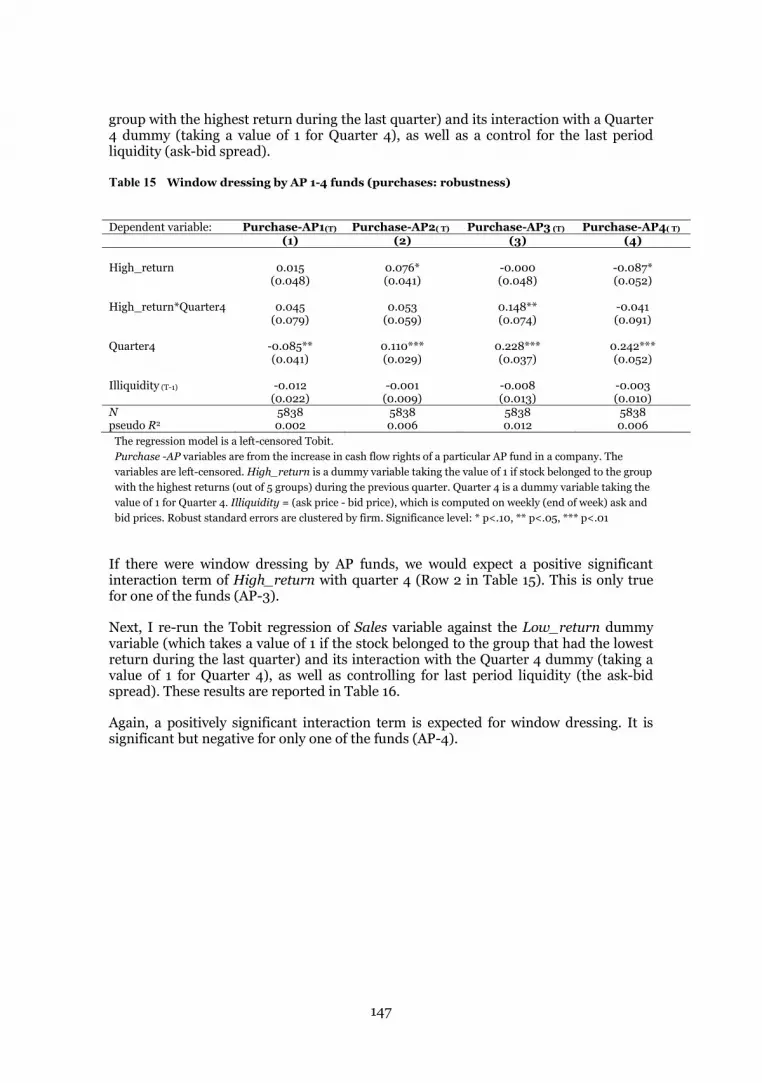
147
group with the highest return during the last quarter) and its interaction with a Quarter 4 dummy (taking a value of 1 for Quarter 4), as well as a control for the last period liquidity (ask-bid spread).
Table 15 Window dressing by AP 1-4 funds (purchases: robustness)
Dependent variable: Purchase-AP1(T) Purchase-AP2( T) Purchase-AP3 (T) Purchase-AP4( T) (1) (2) (3) (4) High_return 0.015 0.076* -0.000 -0.087* (0.048) (0.041) (0.048) (0.052) High_return*Quarter4 0.045 0.053 0.148** -0.041 (0.079) (0.059) (0.074) (0.091) Quarter4 -0.085** 0.110*** 0.228*** 0.242*** (0.041) (0.029) (0.037) (0.052) Illiquidity (T-1) -0.012 -0.001 -0.008 -0.003 (0.022) (0.009) (0.013) (0.010) N 5838 5838 5838 5838 pseudo R2 0.002 0.006 0.012 0.006
The regression model is a left-censored Tobit. Purchase -AP variables are from the increase in cash flow rights of a particular AP fund in a company. The variables are left-censored. High_return is a dummy variable taking the value of 1 if stock belonged to the group with the highest returns (out of 5 groups) during the previous quarter. Quarter 4 is a dummy variable taking the value of 1 for Quarter 4. Illiquidity = (ask price - bid price), which is computed on weekly (end of week) ask and bid prices. Robust standard errors are clustered by firm. Significance level: * p<.10, ** p<.05, *** p<.01
If there were window dressing by AP funds, we would expect a positive significant interaction term of High_return with quarter 4 (Row 2 in Table 15). This is only true for one of the funds (AP-3).
Next, I re-run the Tobit regression of Sales variable against the Low_return dummy variable (which takes a value of 1 if the stock belonged to the group that had the lowest return during the last quarter) and its interaction with the Quarter 4 dummy (taking a value of 1 for Quarter 4), as well as controlling for last period liquidity (the ask-bid spread). These results are reported in Table 16.
Again, a positively significant interaction term is expected for window dressing. It is significant but negative for only one of the funds (AP-4).
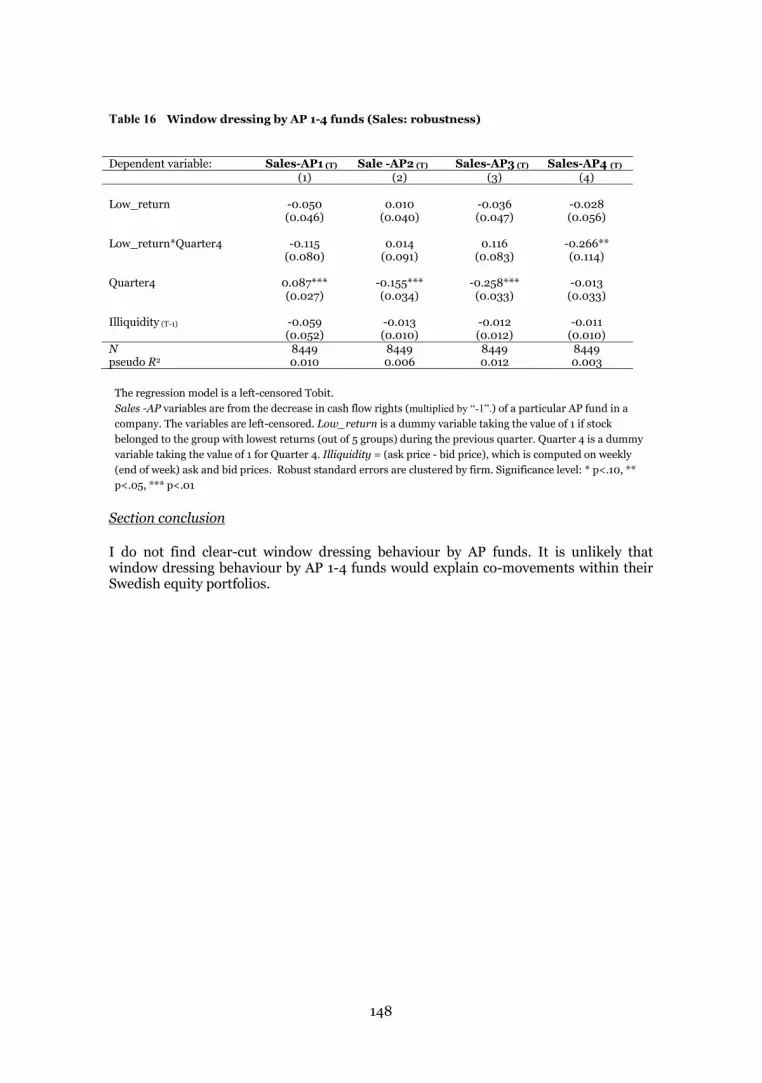
148
Table 16 Window dressing by AP 1-4 funds (Sales: robustness)
Dependent variable: Sales-AP1 (T) Sale -AP2 (T) Sales-AP3 (T) Sales-AP4 (T) (1) (2) (3) (4) Low_return -0.050 0.010 -0.036 -0.028 (0.046) (0.040) (0.047) (0.056) Low_return*Quarter4 -0.115 0.014 0.116 -0.266** (0.080) (0.091) (0.083) (0.114) Quarter4 0.087*** -0.155*** -0.258*** -0.013 (0.027) (0.034) (0.033) (0.033) Illiquidity (T-1) -0.059 -0.013 -0.012 -0.011 (0.052) (0.010) (0.012) (0.010) N 8449 8449 8449 8449 pseudo R2 0.010 0.006 0.012 0.003
The regression model is a left-censored Tobit. Sales -AP variables are from the decrease in cash flow rights (multiplied by “-1”.) of a particular AP fund in a company. The variables are left-censored. Low_return is a dummy variable taking the value of 1 if stock belonged to the group with lowest returns (out of 5 groups) during the previous quarter. Quarter 4 is a dummy variable taking the value of 1 for Quarter 4. Illiquidity = (ask price - bid price), which is computed on weekly (end of week) ask and bid prices. Robust standard errors are clustered by firm. Significance level: * p<.10, ** p<.05, *** p<.01
Section conclusion
I do not find clear-cut window dressing behaviour by AP funds. It is unlikely that window dressing behaviour by AP 1-4 funds would explain co-movements within their Swedish equity portfolios.
149
8 OTHER POSSIBLE EXPLANATIONS FOR CO-MOVEMENTS IN AP BUFFER FUND PORTFOLIOS
The previous section’s results indicate that there is no window dressing by AP buffer funds that may explain the co-movements in their portfolios.
Another possible explanation may lie in the specificities of the contracts of the asset managers employed by these funds6. Co-movements would have been expected if the performance of AP fund asset managers were benchmarked against the performance of other AP funds in the system and influenced their compensation schemes. However, this is not the case. Before 2010, there was a limited incentive-based remuneration for AP fund employees7. Nowadays, AP fund senior managers are paid only fixed salaries, while there is a limited performance based compensation for other employees:
“The Fund’s Board has adopted a remuneration policy for senior executives. The total amount of remuneration shall be reasonable, fair and characterized by moderation. Furthermore, the level of remuneration shall be market-based and competitive with respect to the labour market where the executive works, but without being higher than the norm for comparable positions. The total remuneration package consists of fixed/basic salary, benefits and pension... The Fund previously had a variable remuneration program for the employees. The program was consistent with both the Swedish Government’s guidelines regarding terms of employment for senior executives in the AP funds and the Fund’s own remuneration policies. The program was evaluated and the Fund’s Board of Directors found that it did not have the desired attributes. The Fund consequently decided to terminate the program with effect from 1 January 2010. As a result, no variable salary is paid to senior executives or other employees.” (AP-1, 2016)
“The Board of Directors approves a programme for variable remuneration in line with the Swedish Government's guidelines. The Second AP Fund's incentive programme comprises all staff apart from the CEO and other members of the Executive Management Group. This incentive programme means that all other members of staff are entitled to a maximum of two months' salary in variable remuneration. The programme is linked to long-term goals calculated over three and five years” (AP-2, 2016)
Aversion to responsibility may be another explanation for co-movements. Each AP fund may be unwilling to take a risk of making investment decisions that deviate much from those of other AP fund, especially when facing the annual AP buffer fund performance reports to the Swedish parliament, and public opinion. This speculation is in line with reputational herding literature that explains that asset managers do not take the risk of following their own signals, but follow others instead out of concern for their career prospects (Scharfstein and Stein, 1990; Chevalier & Ellison, 1999; Massa & Patgiri, 2007).
However, the most realistic explanation for co-movements in AP fund portfolios may stem from the fact that AP funds’ investment decisions are based on the same information sources. It is thus not surprising that there is a certain similarity in their portfolios and co-movements in ownership changes given the small size of the market.
6Remember that AP funds’ Swedish equity portfolios are managed primarily in-house. 7 According to email responses from Ossian Ekdahl, Head of Communication of AP-1, and AP-6 board member, Per Strömberg.
150
9 DISCUSSION
The rationale for having more than one AP buffer fund in the Swedish pension system has been questioned since their establishment. It has been argued that the system is unsuccessful in encouraging competition in performance between buffer funds (Björkmo & Lundbergh, 2010; Buffertkapitalsutredningen, 2012). There have therefore been calls to merge the AP funds (see, for example, Fowler, 2011; Carter, 2010).
A team of investigators led by Mats Langensjö (of the Buffer Capital Inquiry - Buffertkapitalsutredningen), which was tasked to evaluate the system by the Finance Ministry Swedish Pension Group, noted the following:
“The competition between the four AP-funds has if anything had a negative influence. The management of the funds has become much the same. It has been more important that results do not deviate from the other funds in the short term than to implement a deliberate long-term strategy. Competition among the funds has also contributed to a misdirected focus on their internal costs.” (Buffertkapitalsutredningen, 2012)
In this study I have found that there is certain similarity in equity portfolios of AP funds. They are also likely to have similar sell and buy strategies in their domestic equity portfolios. However, it is an overstatement to say that competition has been misdirected. These may simply be the result of a small market, low liquidity, and over-regulation of a system that was designed for the realities of 15 years ago – when there were still live discussions about the dot-com bubble.
Indeed, the Buffer Capital Inquiry group suggested that investment rules should be replaced with a less stringent prudent-person rule8. Later, a political consensus formed around this suggestion, as was reflected in the new AP fund regulation (Finansdepartementet, 2015)9. However, this regulation suggests a merger of some AP funds, the creation of a unified supervisory board, and the evaluation of funds’ performance against a reference portfolio. These suggestions do not support the fostering of competition, and may result in an even stronger convergence of AP funds.
Such concerns were expressed by Eva Halvarsson, CEO of AP-2, in that fund’s Annual Report for 2014:
“... It is important that there are several independent funds, pursuing different strategies – which is how things are at present. If implemented, the reforms proposed by the Pensions Group will reduce this spread of risk and the relative independence enjoyed by the AP Funds. ... One proposal is that the funds’ administrative functions should be centralized. The Second AP Fund has a successful and complex organisation, in which administration and portfolio management work closely together and have been tailored for each other. ... Extracting a single aspect from this concept poses a significantly increased risk – rather like removing the leg from a stool. It’s likely to collapse.” (AP-2, Annual Report 2014, pp. 3)
Furthermore, as Mats Langensjö notes, evaluation by reference portfolio may result in heavy indexation being practised by AP fund managers (in Williams, 2015b), which would represent a further step away from competition.
8 Prudent-person rule: “A fiduciary must discharge his or her duties with the care, skill, prudence, and
diligence that a prudent person acting in a like capacity would use in the conduct of an enterprise of like character and aims.” Galer (2015)
9 In December 2015, deputy finance minister Per Bolund announced that this regulation would be abandoned.

151
AP funds also states that:
“There are a number of unresolved risks in the Pension group's proposal, including greater risk of standardization, shortsightedness and political influence of the AP funds. ... With an annual evaluation of the AP funds' performance to that of the reference portfolio, together with that the planning process of the reference portfolio and its asset allocation moves from the AP funds to the Pension Authority which increasingly focuses on the Income Index and constraints in the pension system, increases the risk of shortsightedness and consequently nearly passive index management.” (AP-4, Interim Report 2015, pp. 13)
As we can see, there are lessons to be learned from the Swedish pension reform. It is very difficult to set stringent investment rules and expect that institutional investors will be active in the governance of firms in their portfolios. In the most likely scenario asset managers would be restricted to short-term performance, drive their portfolios in a similar manner, and regard corporate governance involvement as too costly.
152
10 CONCLUSION
Sweden has introduced a competitive structure among several public pension funds (AP 1-4 buffer funds) on reforming its pension system. The main question addressed in this paper is whether those funds compete for performance rather than follow each other into and out of the same securities. While investigating Swedish equities of AP 1-4 funds, I have found that there is 60-85% overlap between their portfolios during the sample period 2001-2012. Further analysis has revealed co-movements in their domestic share trades. There is higher reaction to one of the AP fund's share trades by other AP funds. I have not found evidence for window dressing by AP 1-4 funds that could explain co-movements in their Swedish equity portfolios.
The findings of this study are consistent with the leader-follower behaviour in institutional investors observed by Fong et al. (2011). The co-movements, given their numerous investment rules, state control, and public scrutiny also accord with the literature concerning reputational herding (Scharfstein and Stein 1990; Chevalier & Ellison, 1999; Massa & Patgiri, 2007): it may well be that fund managers are unwilling to deviate from other funds because of their career concerns. However, the most likely explanation may stem from the fact that the Swedish market is relatively small (there are a limited number of stocks to choose from) and the AP funds base their investment decisions on the same information sources. For these reasons it may transpire that the AP funds have similar domestic equity portfolios and co-movements in ownership changes.
153
REFERENCES
Agarwal V., Daniel N., and Naik N., 2004, “Flows, Performance, and Managerial Incentives in Hedge Funds”, Annual Conference Paper No. 501. Available at SSRN:http://ssrn.com/abstract=424369 or http://dx.doi.org/10.2139/ssrn.424369
Bikhchandani S., Hirshleifer D., Welch I., 1992, “A Theory of Fads, Fashion, Custom, and Cultural Change as Informational Cascades”, Journal of Political Economy, Vol. 100, No. 5 (Oct., 1992), pp. 992-1026
Björkmo M., Lundbergh S., 2010 “Restructuring Sweden’s AP Funds for Scale and Global Impact”, Rotman International Journal of Pension Management, Volume 3 • Issue 1 Spring 2010
Black B., 1992, “Agents Watching Agents: The Promise of Institutional Investor Voice”, UCLA Law Review 39, pp. 811-893.
Brown K., Harlow W., Starks L., 1996, '”Of Tournaments and Temptations: An Analysis of Managerial Incentives in the Mutual Fund Industry”, The Journal of Finance, Vol. 51, No. 1 (Mar., 1996), pp. 85-110
Buffertkapitalsutredningen , 2012, “AP-fonderna i pensionssystemet – effektivare förvaltning av pensionsreserven”, SOU 2012:53, Betänkande av Buffertkapitalsutredningen, Tryckt av Elanders Sverige AB, Stockholm 2012, retrieved on the 1st of August, 2015, from: http://www.regeringen.se/contentassets/065e282d66b24a3f9185f018abd0ea31/ap-fonderna-i-pensionssystemet---effektivare-forvaltning-av-pensionsreserven-sou-201253
Bushee, B., 2001, “Do Institutional Investors Prefer Near-Term Earnings over Long-Run Value?”, Contemporary Accounting Research, 18 pp. 207–246.
Chevalier J, Ellison G., 1999, “Career Concerns of Mutual Fund Managers”, Quarterly Journal of Economics, Vol. 114, no. 2 (May 1999), pp. 389-432
Choi, N., Sias, R. W., 2009, “Institutional industry herding”, Journal of Financial Economics 94, pp. 469-491
Cremers M., Petajisto A., 2009, “How Active Is Your Fund Manager? A New Measure That Predicts Performance”, Review of Financial Studies, 2009, 22(9) pp.3329-3365
Dasgupta. A, Prat A., and Verardo M. 2011a, “The price impact of institutional herding”, Review of Financial Studies, 24 (3), pp. 892-925. ISSN 0893-9454
154
Dasgupta A., Prat A., and Verardo M., 2011b, “Institutional trade persistence and long-term equity returns”, The Journal of Finance, 66(2), pp. 635–653.
Finansdepartementet, 2015, “Nya regler för AP-fonderna”, Ds 2015:34, Tryckt av Elanders Sverige AB, Stockholm 2015, retrieved on the 1st of August, 2015 from: http://www.regeringen.se/contentassets/8db380dbf4254e25a55df8d31ee3c74e/nya-regler-for-ap-fonderna-ds-201534.pdf
Fong K., Gallagher D., Gardner P., Swan P., 2011, “Follow the leader: fund managers trading in signal-strength sequence”, Accounting and Finance, 51, pp. 684–710
Galer R., 2015, “ ‘Prudent person rule’ standard for the investment of pension fund assets”, available at: http://www.oecd.org/finance/private-pensions/2763540.pdf
Gutierrez R., Kelley E., 2009, “Institutional Herding and Future Stock Returns” Working paper, Available at SSRN: http://ssrn.com/abstract=1107523 or http://dx.doi.org/10.2139/ssrn.1107523
Jame R., 2001, “Pension Fund Herding and Stock Returns”, Working Paper, Available at SSRN:http://ssrn.com/abstract=1746483 or http://dx.doi.org/10.2139/ssrn.1746483
Lakonishok, J., Shleifer A., Thaler R., and Visny R., 1991, “Window Dressing by Pension Fund Managers”, American Economic Review 81, pp. 227-231.
Lakonishok J., Shleifer A, and Vishny R., 1992. “The Impact of Institutional Trading on Stock Prices.” Journal of Financial Economics 20, pp. 23-43
Massa M., Patgiri R., 2007, “Compensation and Managerial Herding: Evidence from the Mutual Fund Industry”, Working paper, available at: SSRN http://ssrn.com/abstract=756885 or http://dx.doi.org/10.2139/ssrn.756885
Nofsinger J., Sias R., 1999, “Herding ad feedback trading by institutional and individual investors”, The Journal of Finance, Vol.54, No 6 pp. 2263-2295
Petajisto A., 2013, “Active Share and Mutual Fund Performance”, Financial Analysts Journal, 2013, 69(4) pp. 73-93
Scharfstein, D., Stein, J., 1990, “Herd behavior and investment”, American Economic Review 80, pp. 465–479
Sias R., 2004, “Institutional herding”, The Review of Financial studies, Vol. 17, No1, pp. 165-206
155
Web citations:
AP-1, 2016, “Remuneration”, available at: <http://www.ap1.se/en/About-AP1/Organization/Remuneration/>, accessed: 14.10.2016
AP-2, 2014, “Annual report 2014”, available at: <http://www.ap2.se/globalassets/nyheter-och-rapporter/arsredovisningar/annual-report-2014.pdf>, accessed: 16.10.2016
AP-2, 2016, “Remuneration”, available at: <http://www.ap2.se/en/about-ap2/organization/remuneration/>, accessed: 14.10.2016
AP-4, 2015, “Interim report 2015”, available at: < http://www.ap4.se/globalassets/formular/rapportarkiv/2015/halvarsrapport-2015/ap4_interim-report-2015.pdf>, accessed: 16.10.2016
Carter D., 2010, “Merger of Swedish AP funds shot down by Pension Group”, Pensions & Investments, available at: < http://www.pionline.com/article/20100614/PRINT/306149982/merger-of-swedish-ap-funds-shot-down-by-pension-group >, accessed: 15.10.2016
Fowler H., 2011, “Sweden considers merging AP funds”, Professional Pensions, available at: < http://www.professionalpensions.com/global-pensions/news/2081237/sweden-considers-merging-ap-funds >, accessed: 15.10.2016
White A., 2015, “What consolidation means for the AP funds”, Published in www.top1000funds.com.au, available at: http://www.top1000funds.com/news/2014/04/04/what-consolidation-means-for-the-ap-funds/, accessed: 01.08.2015
Williams, J, 2015a, “Sweden to close AP6 buffer fund, consolidate unlisted assets into AP2”, Investment & Pensions Europe, available at: <http://www.ipe.com/countries/nordic-region/sweden-to-close-ap6-buffer-fund-consolidate-unlisted-assets-into-ap2/10008576.fullarticle>, accessed: 01.08.2015
Williams, J, 2015b, “AP fund reforms undermine ‘strongest competitive advantage' – Langensjö”, Investment & Pensions Europe, from: <http://www.ipe.com/countries/nordic-region/ap-fund-reforms-undermine-strongest-competitive-advantage-langensj/10008594.fullarticle>, accessed: 01.08.2015

EKONOMI OCH SAMHÄLLE Skrifter utgivna vid Svenska handelshögskolan
ECONOMICS AND SOCIETY
Publications of the Hanken School of Economics
273. DHANAY MARÍA CADILLO CHANDLER: The Role of Patents in Latin American Development: 'models of protection' of pharmaceutical patents and access to medicines in Brazil, Chile and Venezuela. Helsinki 2014.
274. CARLOS A. DIAZ RUIZ: Market Representations in Action: Foundations for the
Performativity of Representations in Marketing. Helsinki 2014. 275. IRA HAAVISTO: Performance in Humanitarian Supply Chains. Helsinki 2014. 276. SALLA PÖYRY: Essays on Financial Market Frictions and Imperfections. Helsinki
2014. 277. HELENA LIEWENDAHL: What Motivates Employees to Live up to Value Promises:
An Employee Discourse. Helsinki 2014. 278. ALEXEI KOVESHNIKOV: Micro-Political Perspectives on Multinational
Corporations: Legitimation, Stereotyping and Recontextualization. Helsinki 2014. 279. FRÉDÉRIC DÉLÈZE: Essays in Quantitative Analysis of the Effects of Market
Imperfections on Asset Returns. Helsinki 2014. 280. KAI HUOTARI: Experientializing – How C2C Communication Becomes Part of the
Service Experience. The Case of Live-tweeting and TV-viewing. Helsinki 2014. 281. RICHARD KEDZIOR: How Digital Worlds Become Material: An Ethnographic and
Netnographic Investigation in Second Life. Helsinki 2014. 282. MARIA FORSS: Fortbildning är mer ”fort” än ”bildning”. En kritisk granskning av
fortbildning för sjukskötaren. Helsingfors 2014. 283. MAGNUS BLOMKVIST: Essays on Market States, Firm Growth and Corporate
Finance Decisions. Helsinki 2014. 284. ANNAMARI TUORI: Doing Intersectional Identity Work: Social Categories,
Inequalities, and Silences. Helsinki 2014. 285. SANNE BOR: A Theory of Meta-Organisation: An Analysis of Steering Processes in
European Commission-Funded R&D ‘Network of Excellence’ Consortia. Helsinki 2014.
286. RINAT MUKMINOV: Deposit Markets, Lending Markets and Bank Screening
Incentives. Helsinki 2015. 287. LINUS NYMAN: Understanding Code Forking in Open Source Software. An
Examination of Code Forking, its Effect on Open Source Software, and How it is Viewed and Practiced by Developers. Helsinki 2015.
288. HENRIK VIRTANEN: Integrerat och sekventiellt samarbete mellan konkurrenter:
En studie av små och medelstora företag i en internationell kontext. Integrated and

Sequential Cooperation between Competitors: A Study of Small and Medium-sized Enterprises in an International Context. With an English Summary. Helsinki 2015.
289. JOHN PETTERSSON: Essays on Momentum and Risk. Helsinki 2015. 290. LING ELEANOR ZHANG: On Becoming Bicultural: Language Competence,
Acculturation and Cross-cultural Adjustment of Expatriates in China. Helsinki 2015. 291. ALAIN VAILLANCOURT: Consolidation in Humanitarian Logistics. Helsinki 2015. 292. HARRY SALONAHO: Förändringsbehov i Finlands arbetslagstiftning och arbets-
marknadsmekanismer. Helsingfors 2015. 293. OLUGBENGA OLUFEAGBA: Essays on the Currency Effect on Stock Market
Relationships and Stock Return Forecast. Helsinki 2016. 294. JESPER HAGA: Essays on Asset Pricing Anomalies, Information Flow and Risk.
Helsinki 2016. 295. GUSTAV MEDBERG: How Do Customers Perceive Value-In-Use? Empirical Insights
from Bank Service Stories. Helsinki 2016. 296. ANU TORKKELI: Structuring Corporate Capital Gains Tax System in the European
Union. A Comparative Finnish Perspective. Helsinki 2016. 297. SERGEY OSMEKHIN: Essays on Algorithmic Trading. Helsinki 2016. 298. ANNIKKI ROOS: Understanding Information Practices in Biomedicine. A Domain
Analytical Approach. Helsinki 2016. 299. YAMIN XIE: Essays on Corporate Finance and Governance. Helsinki 2016. 300. JIMI SIEKKINEN: Within and Cross-Country Differences in the Value Relevance of
Fair Values. Helsinki 2016. 301. DAVID H. GONZÁLEZ OSORIO: Essays on Mutual Fund Performance. Helsinki
2016. 302. MO ZHANG: Essays on Mispricing in the Chinese Stock Market. Helsinki 2016. 303. DENNIS SUNDVIK: Earnings Management in Response to Corporate Tax Rate
Changes. Essays on Private Firms. Helsinki 2016. 304. MARIA EHRNSTRÖM-FUENTES: Legitimacy in the Pluriverse: Towards an
Expanded View on Corporate-Community Relations in the Global Forestry Industry. Helsinki 2016.
305. PAULA KOSKINEN SANDBERG: The Politics of Gender Pay Equity. Policy
Mechanisms, Institutionalised Undervaluation, and Non-Decision Making. Helsinki 2016.
306. TRICIA CLELAND SILVA: Packaging Nurses: Mapping the Social Worlds of Trans-
national Human Resource Management. Helsinki 2016. 307. PETTERI GÜNTHER: Transformation of the Recorded Music Industry to the Digital
Age: A Review of Technology-Driven Changes in the EU Copyright Framework Focusing on their Effect on Digital Music Markets. Helsinki 2016.
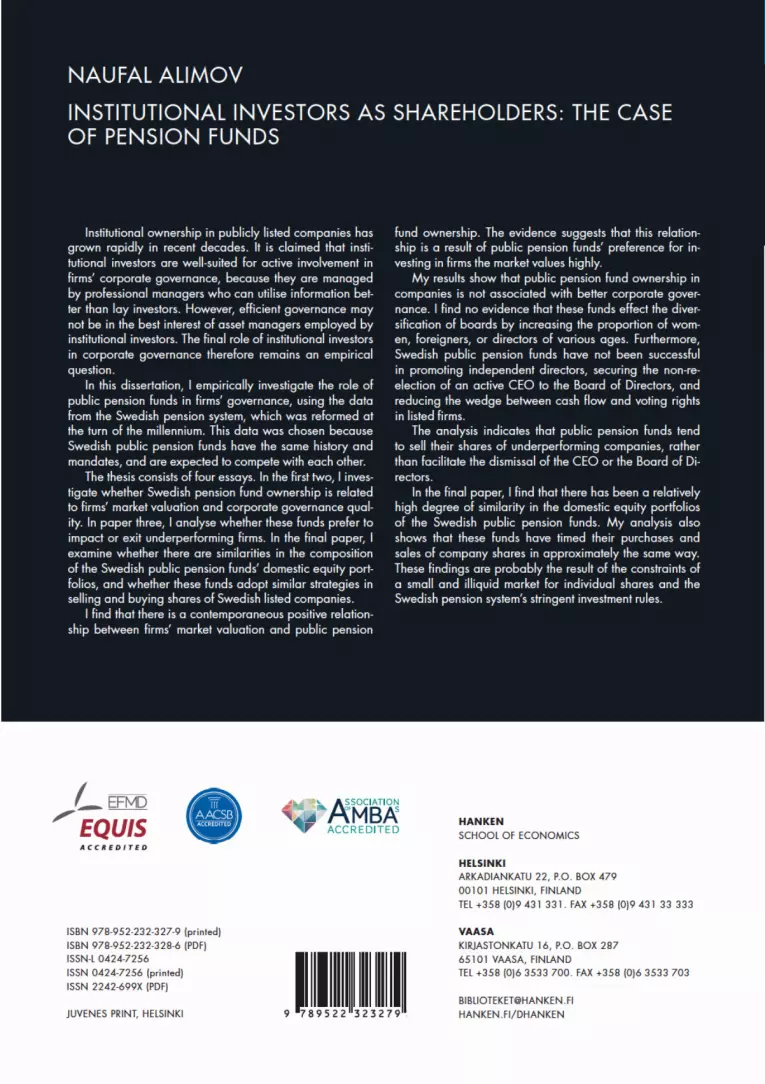
NAUFAL ALIMOV – INSTITUTIONAL INVESTORS AS SHAREHOLDERS
INSTITUTIONAL INVESTORS AS SHAREHOLDERSTHE CASE OF PENSION FUNDS
NAUFAL ALIMOV
EKONOMI OCH SAMHÄLLE ECONOMICS AND SOCIETY
308
NAUFAL ALIMOV
INSTITUTIONAL INVESTORS AS SHAREHOLDERS: THE CASE OF PENSION FUNDS
Institutional ownership in publicly listed companies has grown rapidly in recent decades. It is claimed that insti-tutional investors are well-suited for active involvement in firms’ corporate governance, because they are managed by professional managers who can utilise information bet-ter than lay investors. However, efficient governance may not be in the best interest of asset managers employed by institutional investors. The final role of institutional investors in corporate governance therefore remains an empirical question. In this dissertation, I empirically investigate the role of
public pension funds in firms’ governance, using the data from the Swedish pension system, which was reformed at the turn of the millennium. This data was chosen because Swedish public pension funds have the same history and mandates, and are expected to compete with each other. The thesis consists of four essays. In the first two, I inves-
tigate whether Swedish pension fund ownership is related to firms’ market valuation and corporate governance qual-ity. In paper three, I analyse whether these funds prefer to impact or exit underperforming firms. In the final paper, I examine whether there are similarities in the composition of the Swedish public pension funds’ domestic equity port-folios, and whether these funds adopt similar strategies in selling and buying shares of Swedish listed companies.I find that there is a contemporaneous positive relation-
ship between firms’ market valuation and public pension
fund ownership. The evidence suggests that this relation-ship is a result of public pension funds’ preference for in-vesting in firms the market values highly. My results show that public pension fund ownership in
companies is not associated with better corporate gover-nance. I find no evidence that these funds effect the diver-sification of boards by increasing the proportion of wom-en, foreigners, or directors of various ages. Furthermore, Swedish public pension funds have not been successful in promoting independent directors, securing the non-re-election of an active CEO to the Board of Directors, and reducing the wedge between cash flow and voting rights in listed firms.The analysis indicates that public pension funds tend
to sell their shares of underperforming companies, rather than facilitate the dismissal of the CEO or the Board of Di-rectors. In the final paper, I find that there has been a relatively
high degree of similarity in the domestic equity portfolios of the Swedish public pension funds. My analysis also shows that these funds have timed their purchases and sales of company shares in approximately the same way. These findings are probably the result of the constraints of a small and illiquid market for individual shares and the Swedish pension system’s stringent investment rules.
HANKEN
SCHOOL OF ECONOMICS
HELSINKI
ARKADIANKATU 22, P.O. BOX 479
00101 HELSINKI, FINLAND
TEL +358 (0)9 431 331. FAX +358 (0)9 431 33 333
VAASA
KIRJASTONKATU 16, P.O. BOX 287
65101 VAASA, FINLAND
TEL +358 (0)6 3533 700. FAX +358 (0)6 3533 703
HANKEN.FI/DHANKEN
ISBN 978-952-232-327-9 (printed)
ISBN 978-952-232-328-6 (PDF)
ISSN-L 0424-7256
ISSN 0424-7256 (printed)
ISSN 2242-699X (PDF)
JUVENES PRINT, HELSINKI


