Abstract An evaluation of three commercial hydro-codes which may be used for the purpose of simulating the interaction of explosive blasts with RC structures is presented. Firstly, a simple test case with a known prescribed impulse was chosen for the model verification in all three codes. Then, a practical structure design for test validation and parameter calibration was suggested. Computations of TNT charge blasts at varying distances from the structures were performed. A comparison of the results obtained by the codes is presented. Keywords: hydro-code, simulation, concrete, explosive blast wave, dynamic response, protective structure, LS-Dyna, Dytran, Autodyn. 1 Introduction The conventional use of concrete as a structural material is mostly for static and quasi-static loading, such as in building, bridges, etc. The design methodology for such loads is well established. In recent years, however, the need to evaluate concrete behaviour under dynamic loading has become increasingly important due to terrorist activities involving explosive charges. The aim of this work is to study the dynamic response of a typical reinforced concrete structure to a nearby detonation of an explosive charge employing various hydro-codes. We chose an inverted U-shaped structure, reinforced symmetrically with respect to the expected loading, with a typical span of 3 m and a thickness of 200 mm. The choice of this shape was motivated by the simplicity of applying the appropriate boundary conditions to its feet. This generic structure was subjected to the loading produced by detonating a 20 kg charge of TNT explosive, at a distance of 0.5 m above its centre, and to a contact detonation of 1 kg TNT charge. The response to these loadings was obtained employing three commercial hydro-codes, using their internal material models for representing the concrete and the reinforcing bars.
Paper 159 Interaction of Explosive Blasts with Reinforced Concrete Structures E. Kochavi, Y. Kivity, E. Gal and G. Ben-Dor Protective Technologies R&D Center Faculty of Engineering Sciences Ben-Gurion University of the Negev, Beer-Sheva, Israel
The numerical model consisted of a full interaction between the blast wave and the structure. To this end the blast wave was represented in an Eulerian finite volume mesh, while the concrete was modelled by a Lagrangian solid finite element mesh, with discrete embedded rod elements for the reinforcing bars. The resulting centre deflection of the structure is chosen for comparing the results of the three simulations. We also checked the sensitivity of the results to various parameters such as overall mesh size, concrete strength, position of the Eulerian mesh with respect to the structure, etc. This study enables one to avoid the pitfalls of such simulations by the correct choice of modelling parameters.
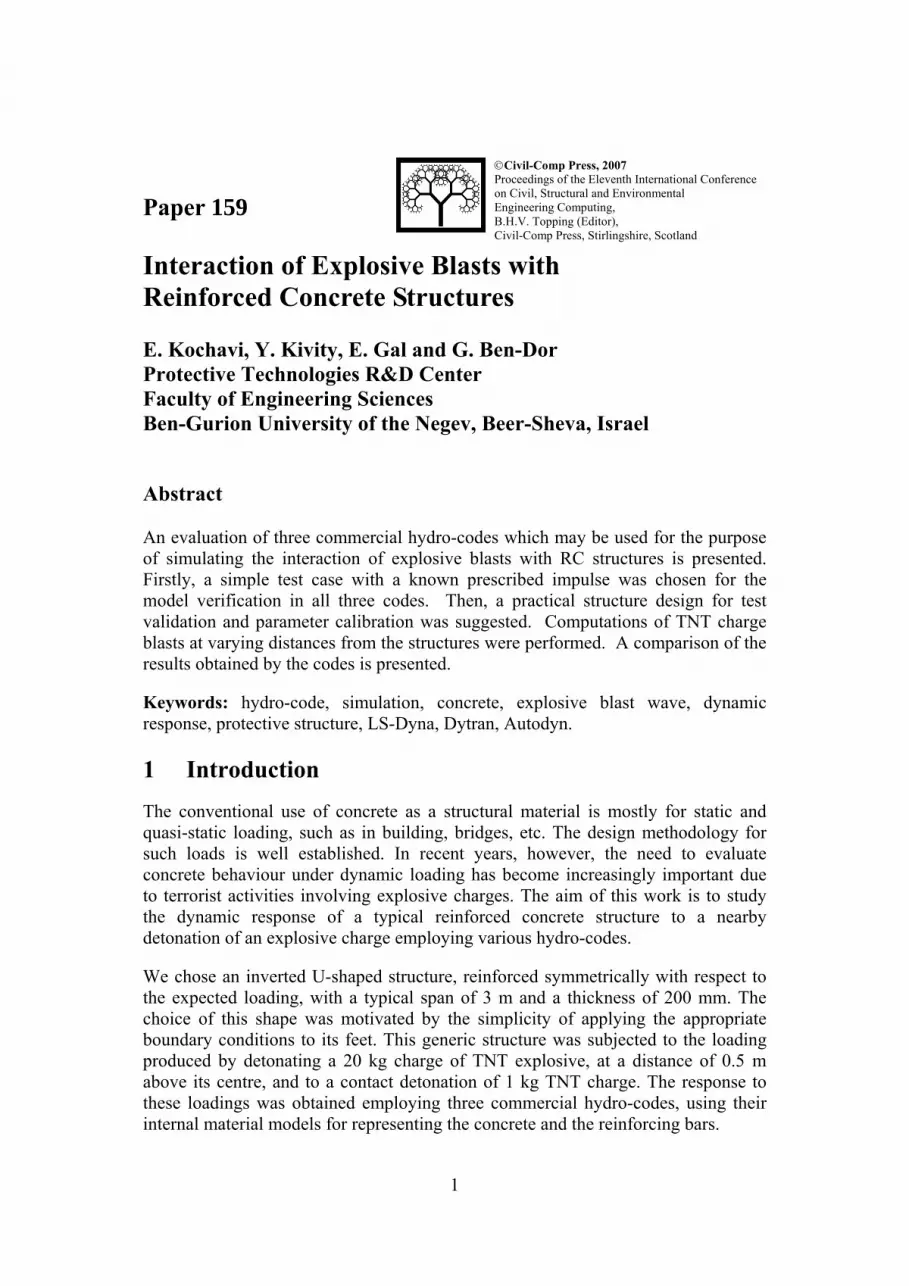
2 A simple verification case In order to make sure that a typical RC design is solved correctly by the three codes to be used in this work, a simple case of a RC beam was defined. Figure 1 shows the dimensions and longitudinal reinforcement. The section of the beam with rebars 10mm in diameter. A load, which is varying in time is defined as uniformly distributed over the wide face along the beam.
Figure 1: A simply supported beam, loading and section
In order to verify the results against analytical solutions that can be easily carried out for this simple case, The material propertied were selected for the first computations as elastic or bilinear elastic plastic. The values taken for these material properties are for the concrete: Pa1064.27 9⋅=elasticE , 18.0=ν , Pa101 9⋅=plasticE , Pa1020 6⋅=yieldσ And for the steel: Pa10200 9⋅=elasticE , 3.0=ν , Pa106 9⋅=plasticE , Pa10400 6⋅=yieldσ The properties are brought in the following order: Young modulus, Poisson's ratio, Plastic modulus and yield stress. A computation was performed for an elastic material (without yield) and the beam was loaded with a step load of 0.1 MPa of infinite duration. The maximal deflections obtained by all codes were 10.23-10.50mm (2.5% deviation). An analytical static solution was performed for the composite beam and a deflection of 5.19 was obtained. Since the load is a step load, when solving the problem dynamically, the maximal deflection should be exactly twice the static load and indeed, this confirms the results obtained.
3 m
q(t)
3
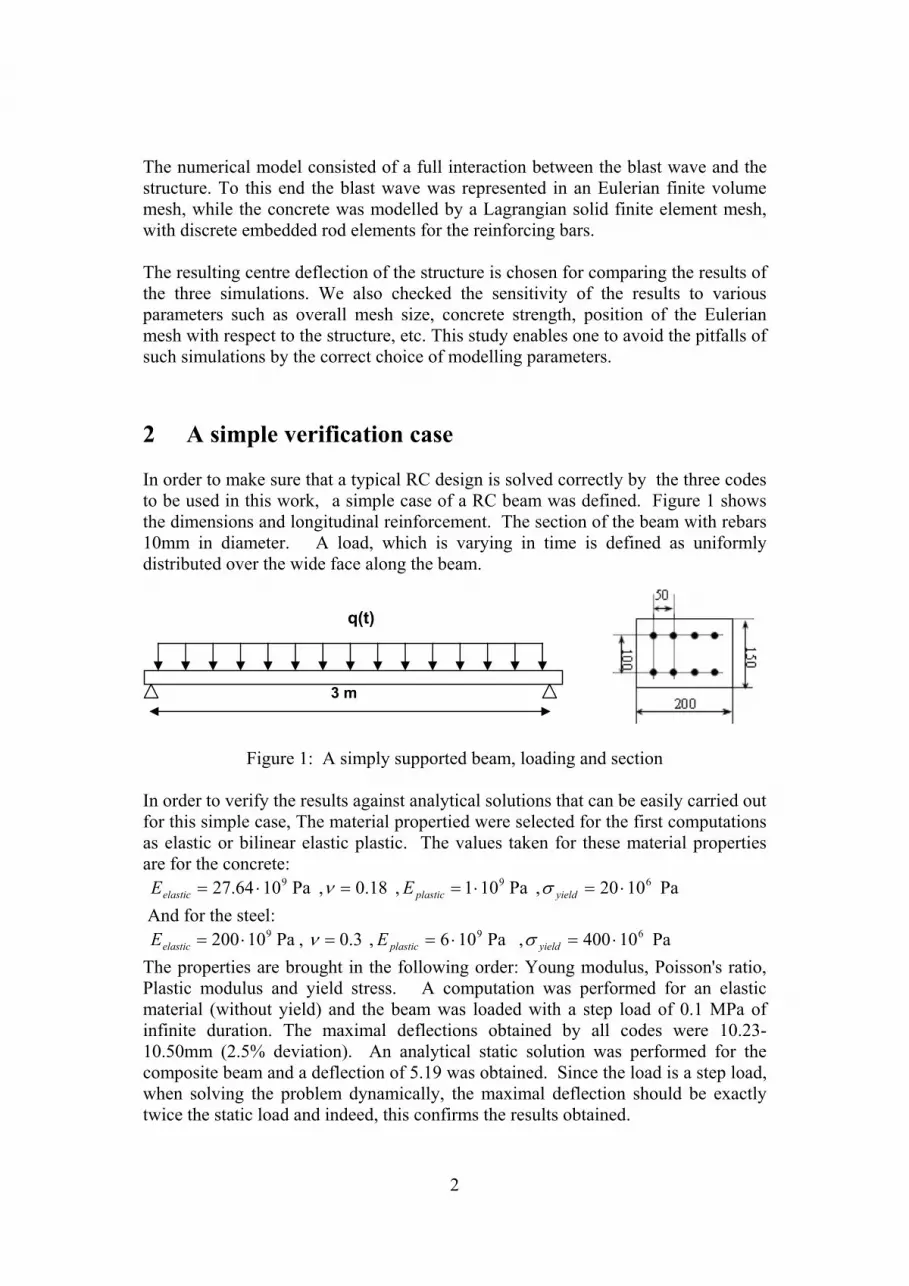
As a further test case a short duration step load was defined, more similar to a blast load, with a trapezoidal load was defined initiating from zero at zero time, ramping to 0.1MPa within 1ms, staying at that level for 6ms and then ramping down to zero again within 1ms. This time variation of the load is referred hereafter as the standard pulse. Figure 2 shows the results obtained by all codes for this load, which are indeed in very good agreement with each other. The differences between the results obtained by the three codes were much smaller than obtained in the long duration step load. This demonstrates the advantage of these explicit codes to solve accurately short events.
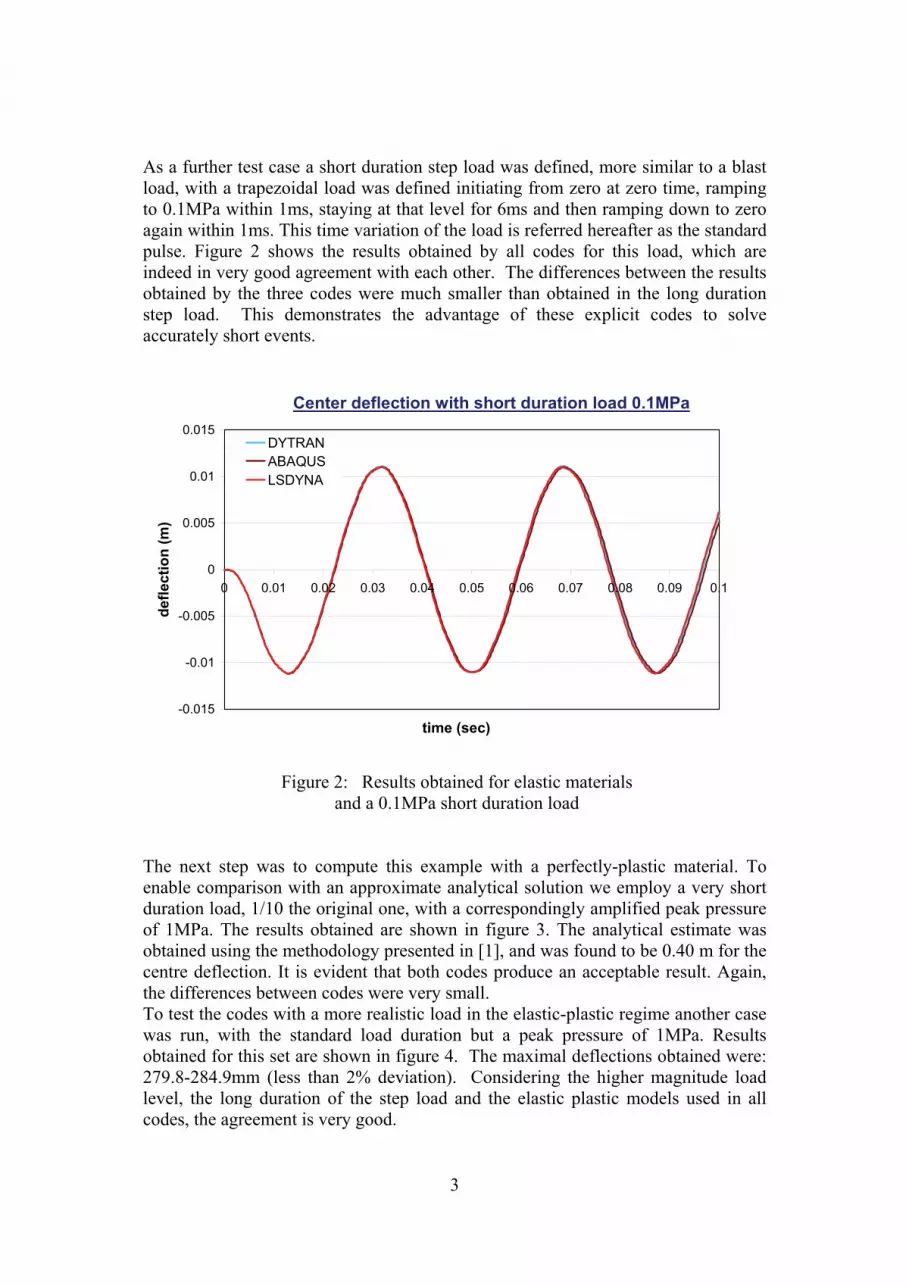
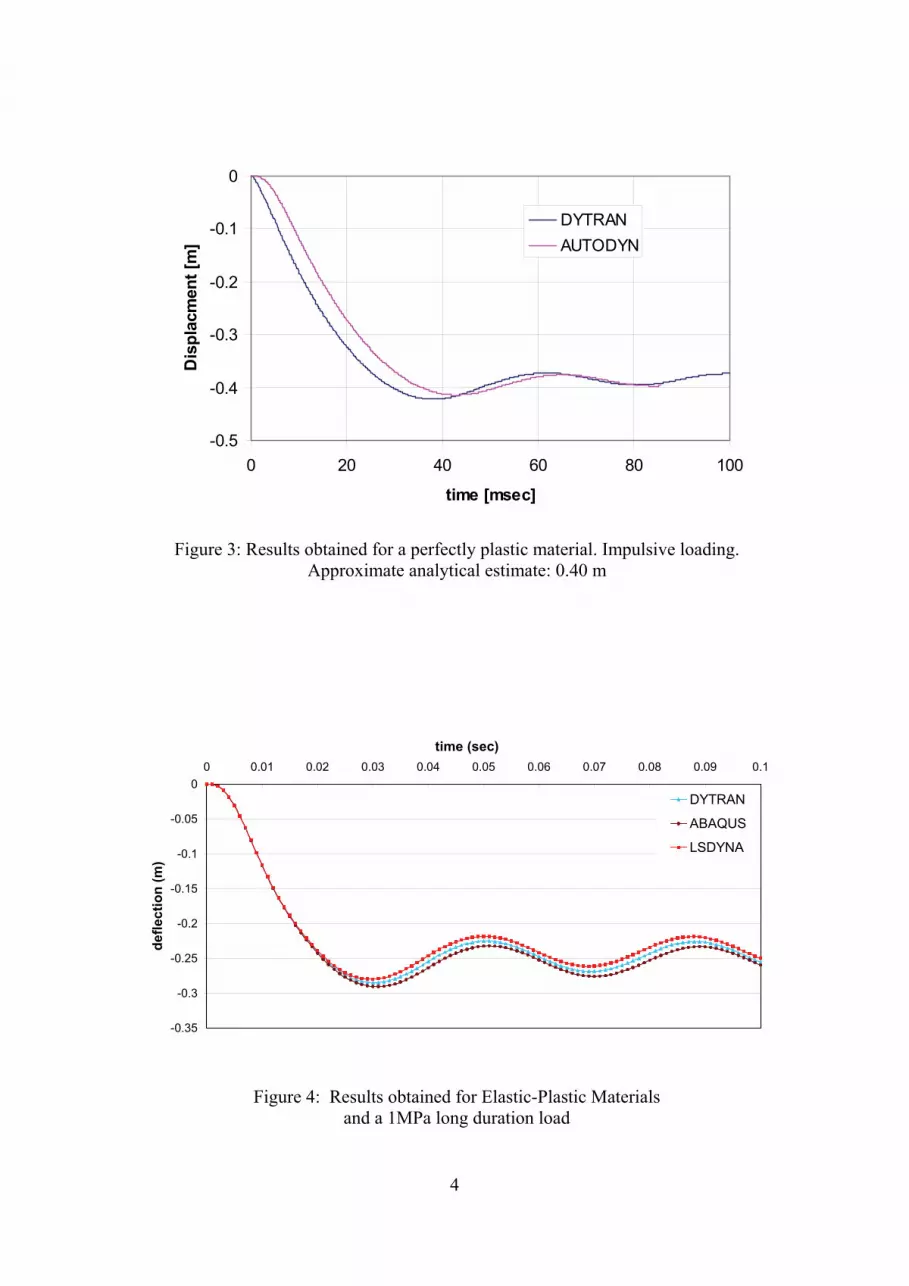
and a 0.1MPa short duration load The next step was to compute this example with a perfectly-plastic material. To enable comparison with an approximate analytical solution we employ a very short duration load, 1/10 the original one, with a correspondingly amplified peak pressure of 1MPa. The results obtained are shown in figure 3. The analytical estimate was obtained using the methodology presented in [1], and was found to be 0.40 m for the centre deflection. It is evident that both codes produce an acceptable result. Again, the differences between codes were very small. To test the codes with a more realistic load in the elastic-plastic regime another case was run, with the standard load duration but a peak pressure of 1MPa. Results obtained for this set are shown in figure 4. The maximal deflections obtained were: 279.8-284.9mm (less than 2% deviation). Considering the higher magnitude load level, the long duration of the step load and the elastic plastic models used in all codes, the agreement is very good.
4
-0.5
-0.4
-0.3
-0.2
-0.1
0
0 20 40 60 80 100
time [msec]
Dis
plac
men
t [m
]
DYTRANAUTODYN
Figure 3: Results obtained for a perfectly plastic material. Impulsive loading. Approximate analytical estimate: 0.40 m
Figure 4: Results obtained for Elastic-Plastic Materials and a 1MPa long duration load
5
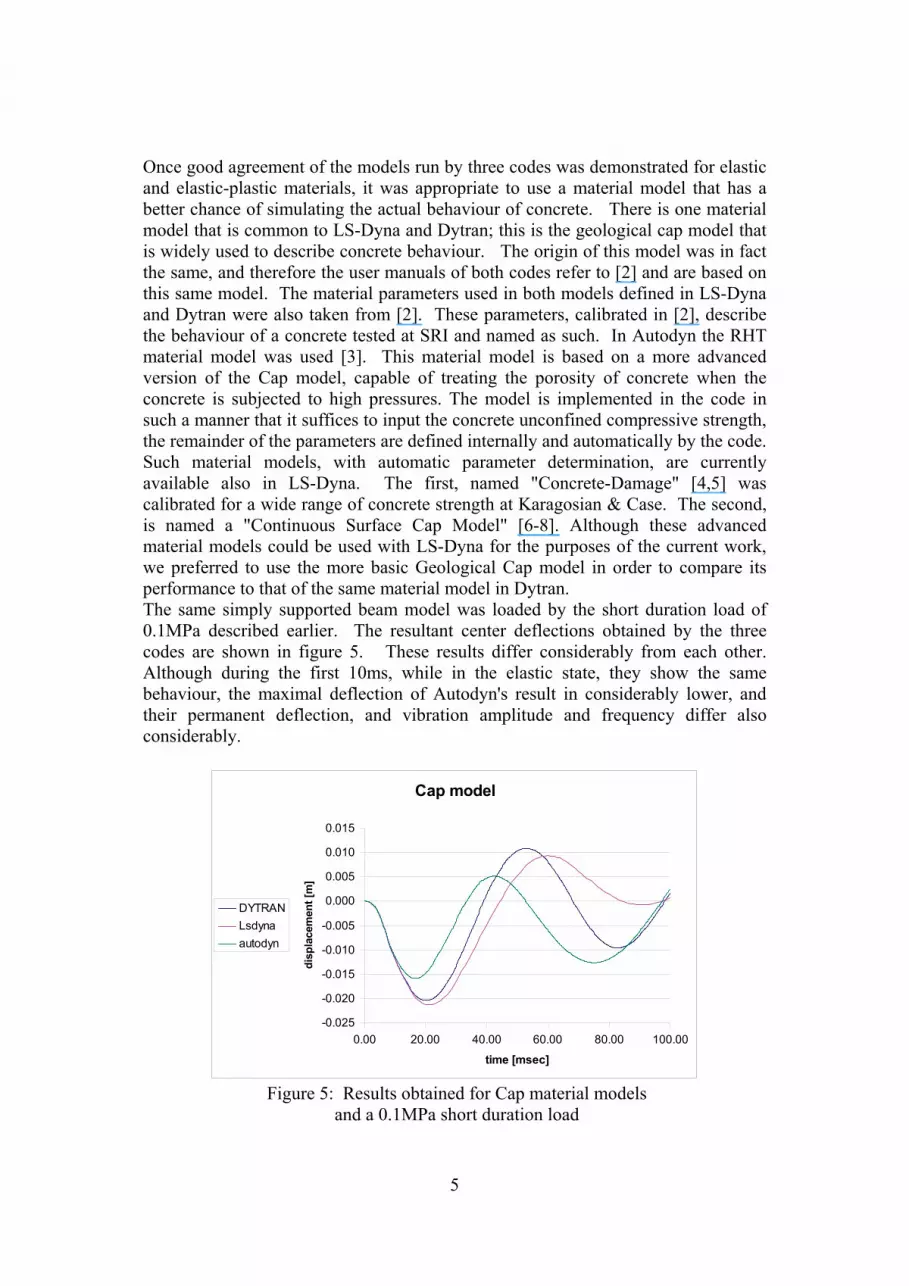
Once good agreement of the models run by three codes was demonstrated for elastic and elastic-plastic materials, it was appropriate to use a material model that has a better chance of simulating the actual behaviour of concrete. There is one material model that is common to LS-Dyna and Dytran; this is the geological cap model that is widely used to describe concrete behaviour. The origin of this model was in fact the same, and therefore the user manuals of both codes refer to [2] and are based on this same model. The material parameters used in both models defined in LS-Dyna and Dytran were also taken from [2]. These parameters, calibrated in [2], describe the behaviour of a concrete tested at SRI and named as such. In Autodyn the RHT material model was used [3]. This material model is based on a more advanced version of the Cap model, capable of treating the porosity of concrete when the concrete is subjected to high pressures. The model is implemented in the code in such a manner that it suffices to input the concrete unconfined compressive strength, the remainder of the parameters are defined internally and automatically by the code. Such material models, with automatic parameter determination, are currently available also in LS-Dyna. The first, named "Concrete-Damage" [4,5] was calibrated for a wide range of concrete strength at Karagosian & Case. The second, is named a "Continuous Surface Cap Model" [6-8]. Although these advanced material models could be used with LS-Dyna for the purposes of the current work, we preferred to use the more basic Geological Cap model in order to compare its performance to that of the same material model in Dytran. The same simply supported beam model was loaded by the short duration load of 0.1MPa described earlier. The resultant center deflections obtained by the three codes are shown in figure 5. These results differ considerably from each other. Although during the first 10ms, while in the elastic state, they show the same behaviour, the maximal deflection of Autodyn's result in considerably lower, and their permanent deflection, and vibration amplitude and frequency differ also considerably.
Cap model
-0.025
-0.020
-0.015
-0.010
-0.005
0.000
0.005
0.010
0.015
0.00 20.00 40.00 60.00 80.00 100.00
time [msec]
disp
lace
men
t [m
]
DYTRANLsdynaautodyn
Figure 5: Results obtained for Cap material models
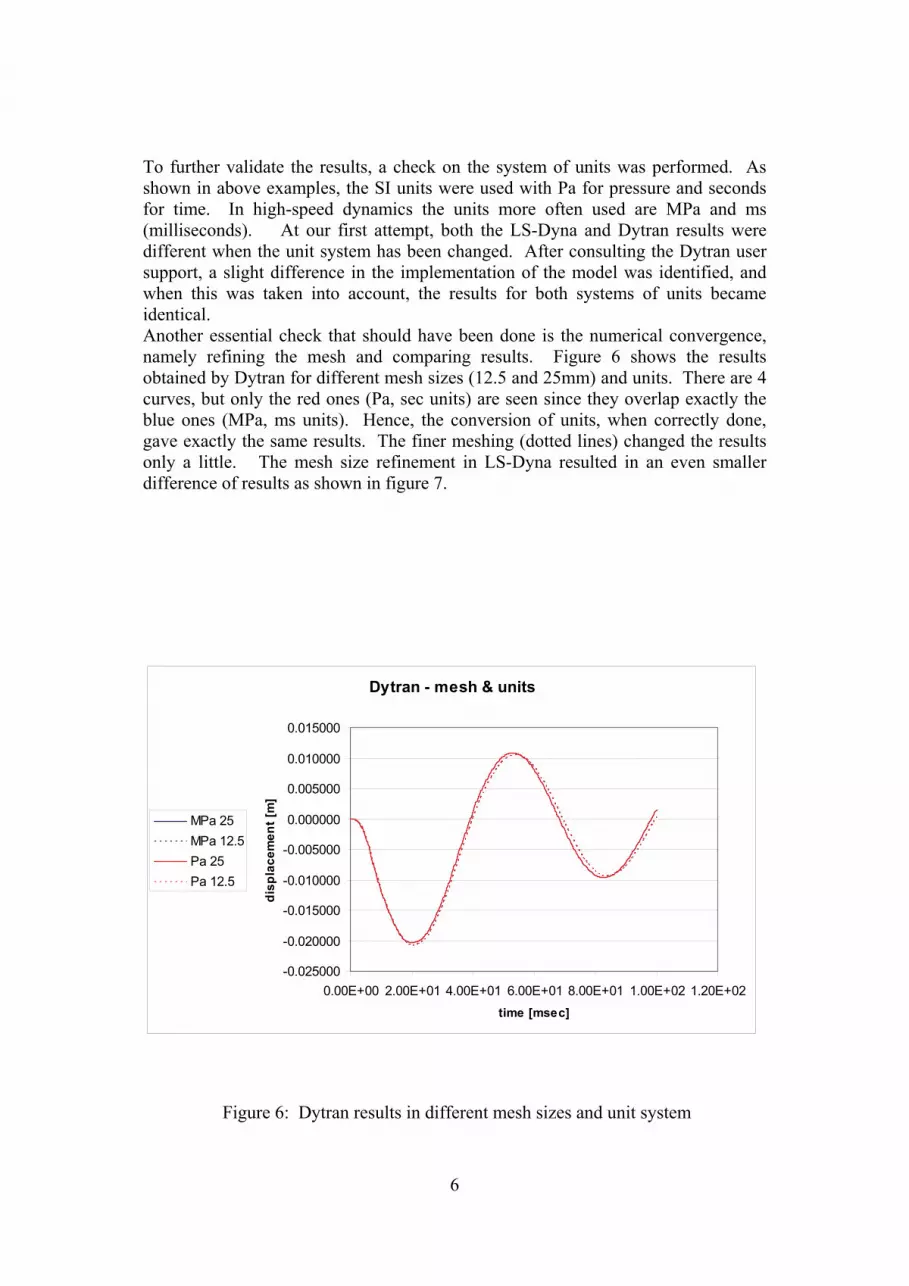
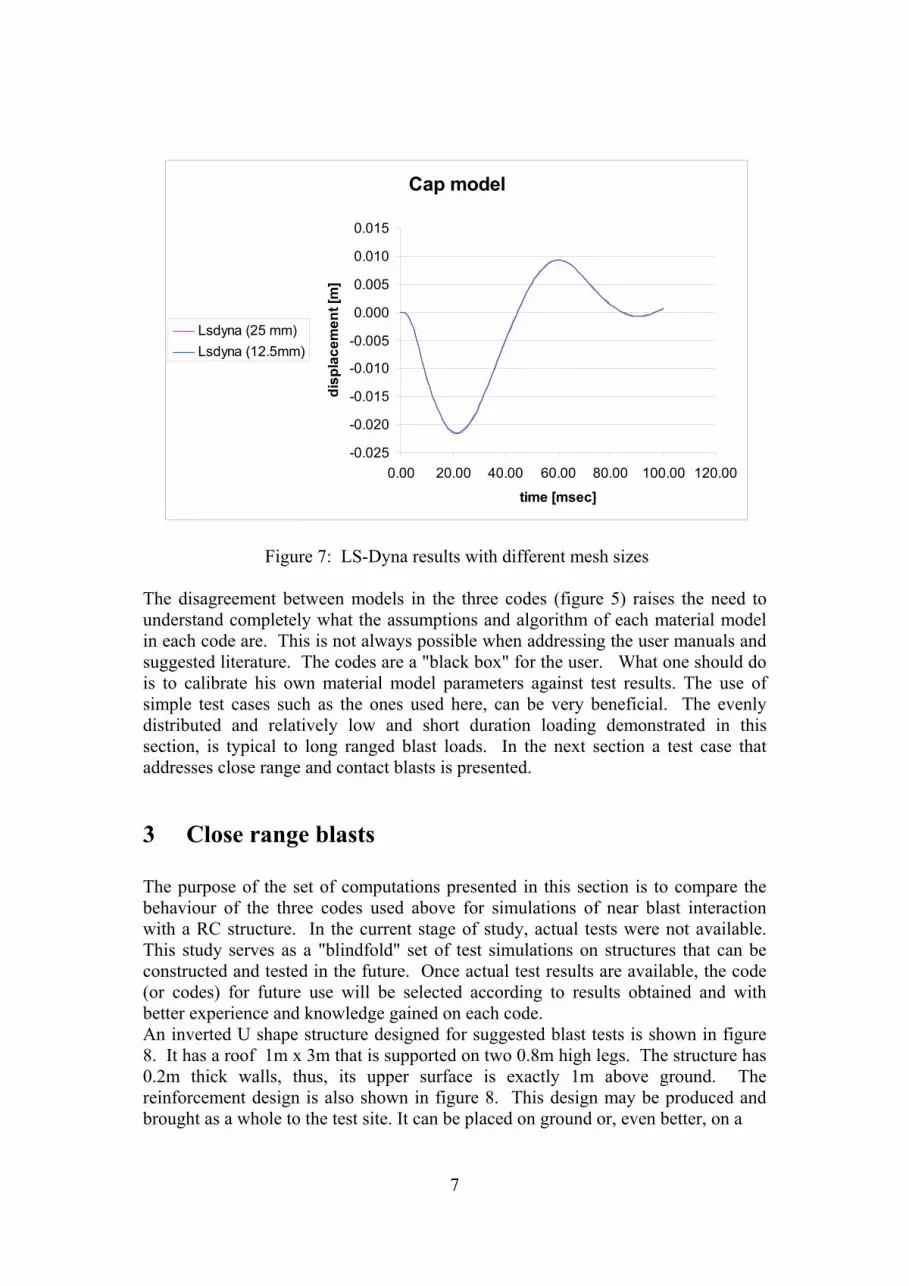
To further validate the results, a check on the system of units was performed. As shown in above examples, the SI units were used with Pa for pressure and seconds for time. In high-speed dynamics the units more often used are MPa and ms (milliseconds). At our first attempt, both the LS-Dyna and Dytran results were different when the unit system has been changed. After consulting the Dytran user support, a slight difference in the implementation of the model was identified, and when this was taken into account, the results for both systems of units became identical. Another essential check that should have been done is the numerical convergence, namely refining the mesh and comparing results. Figure 6 shows the results obtained by Dytran for different mesh sizes (12.5 and 25mm) and units. There are 4 curves, but only the red ones (Pa, sec units) are seen since they overlap exactly the blue ones (MPa, ms units). Hence, the conversion of units, when correctly done, gave exactly the same results. The finer meshing (dotted lines) changed the results only a little. The mesh size refinement in LS-Dyna resulted in an even smaller difference of results as shown in figure 7.
Figure 6: Dytran results in different mesh sizes and unit system
7
Cap model
-0.025
-0.020
-0.015
-0.010
-0.005
0.000
0.005
0.010
0.015
0.00 20.00 40.00 60.00 80.00 100.00 120.00
time [msec]
disp
lace
men
t [m
]Lsdyna (25 mm)Lsdyna (12.5mm)
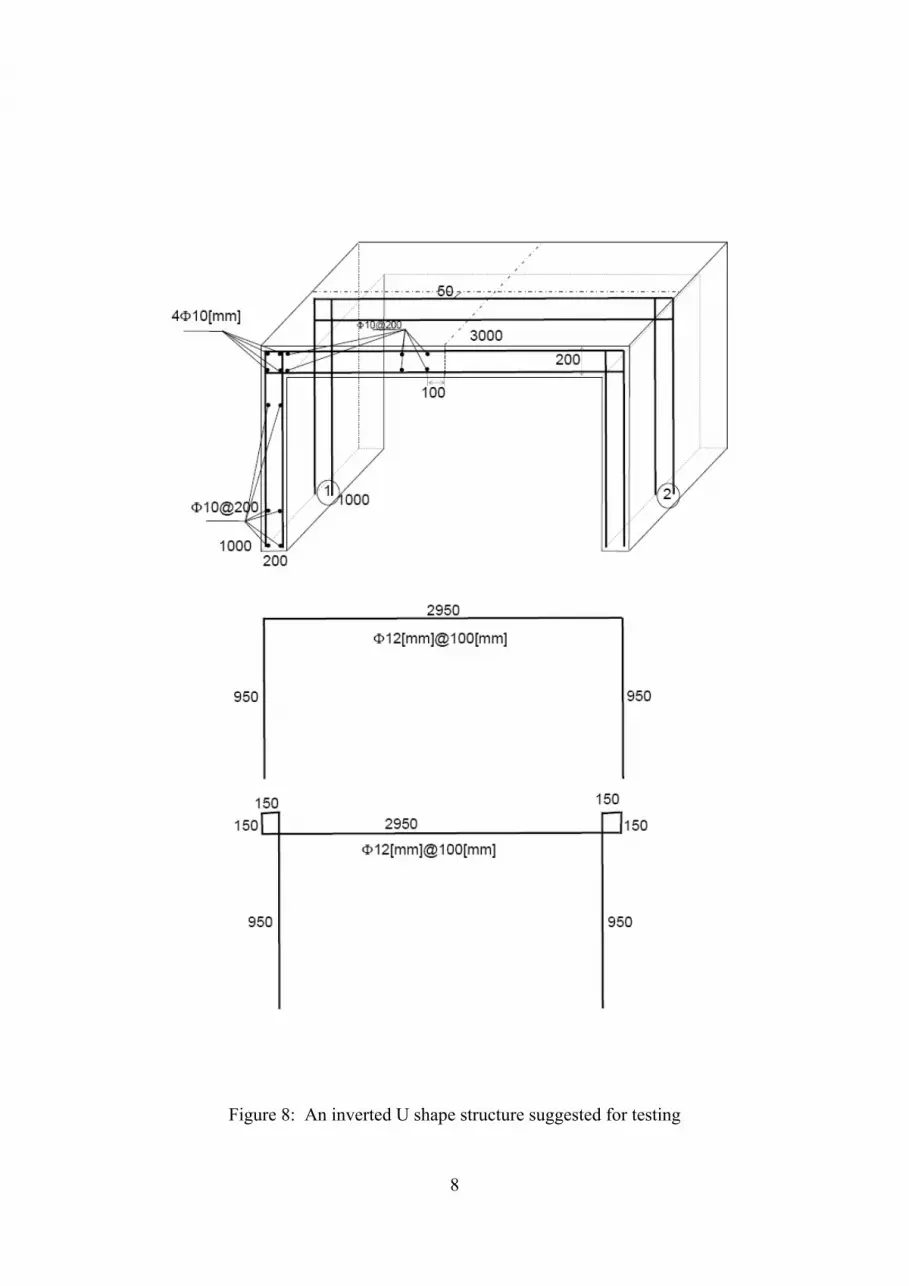
Figure 7: LS-Dyna results with different mesh sizes The disagreement between models in the three codes (figure 5) raises the need to understand completely what the assumptions and algorithm of each material model in each code are. This is not always possible when addressing the user manuals and suggested literature. The codes are a "black box" for the user. What one should do is to calibrate his own material model parameters against test results. The use of simple test cases such as the ones used here, can be very beneficial. The evenly distributed and relatively low and short duration loading demonstrated in this section, is typical to long ranged blast loads. In the next section a test case that addresses close range and contact blasts is presented. 3 Close range blasts The purpose of the set of computations presented in this section is to compare the behaviour of the three codes used above for simulations of near blast interaction with a RC structure. In the current stage of study, actual tests were not available. This study serves as a "blindfold" set of test simulations on structures that can be constructed and tested in the future. Once actual test results are available, the code (or codes) for future use will be selected according to results obtained and with better experience and knowledge gained on each code. An inverted U shape structure designed for suggested blast tests is shown in figure 8. It has a roof 1m x 3m that is supported on two 0.8m high legs. The structure has 0.2m thick walls, thus, its upper surface is exactly 1m above ground. The reinforcement design is also shown in figure 8. This design may be produced and brought as a whole to the test site. It can be placed on ground or, even better, on a
8
Figure 8: An inverted U shape structure suggested for testing
9
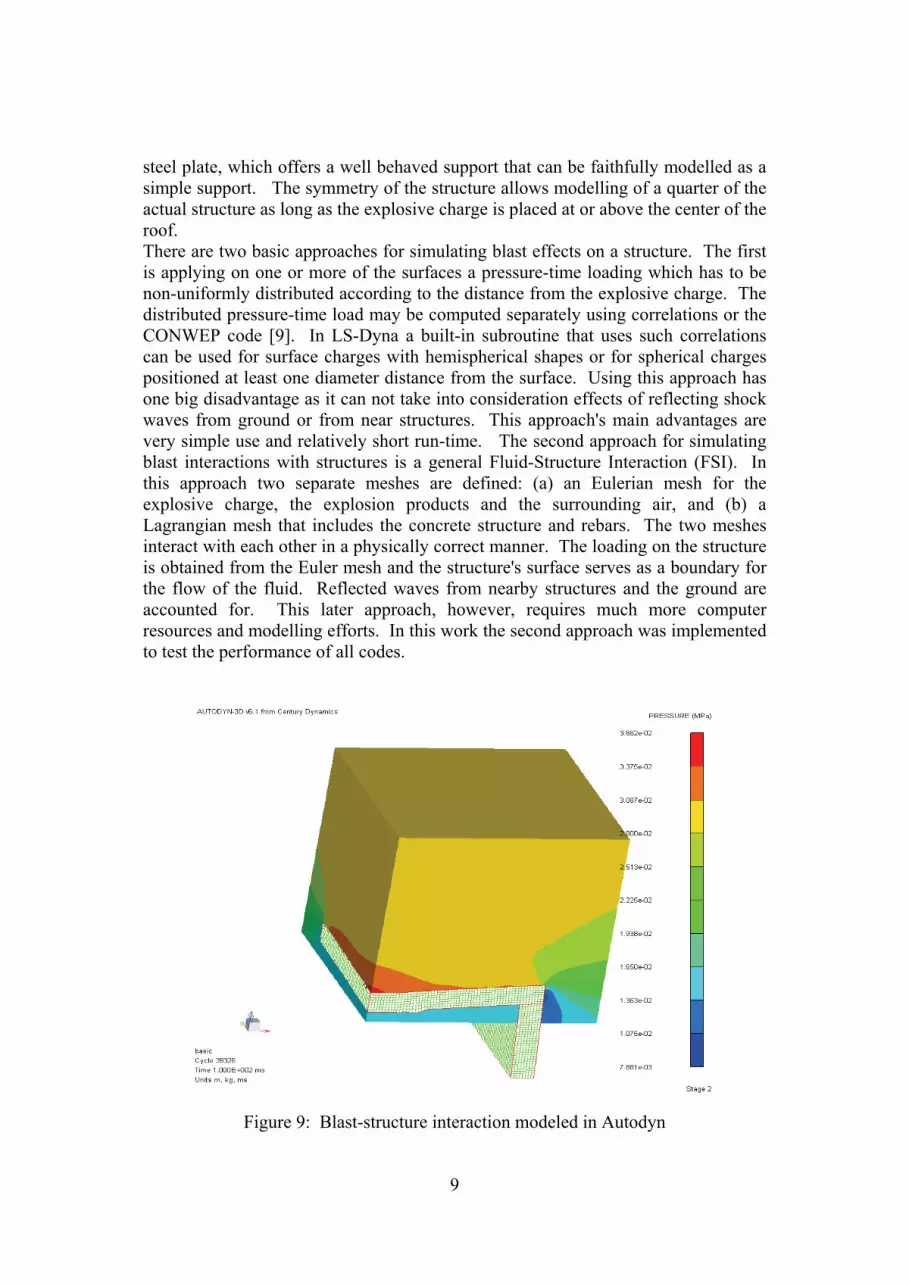
steel plate, which offers a well behaved support that can be faithfully modelled as a simple support. The symmetry of the structure allows modelling of a quarter of the actual structure as long as the explosive charge is placed at or above the center of the roof. There are two basic approaches for simulating blast effects on a structure. The first is applying on one or more of the surfaces a pressure-time loading which has to be non-uniformly distributed according to the distance from the explosive charge. The distributed pressure-time load may be computed separately using correlations or the CONWEP code [9]. In LS-Dyna a built-in subroutine that uses such correlations can be used for surface charges with hemispherical shapes or for spherical charges positioned at least one diameter distance from the surface. Using this approach has one big disadvantage as it can not take into consideration effects of reflecting shock waves from ground or from near structures. This approach's main advantages are very simple use and relatively short run-time. The second approach for simulating blast interactions with structures is a general Fluid-Structure Interaction (FSI). In this approach two separate meshes are defined: (a) an Eulerian mesh for the explosive charge, the explosion products and the surrounding air, and (b) a Lagrangian mesh that includes the concrete structure and rebars. The two meshes interact with each other in a physically correct manner. The loading on the structure is obtained from the Euler mesh and the structure's surface serves as a boundary for the flow of the fluid. Reflected waves from nearby structures and the ground are accounted for. This later approach, however, requires much more computer resources and modelling efforts. In this work the second approach was implemented to test the performance of all codes.
Figure 9: Blast-structure interaction modeled in Autodyn
10
Cap model with blast from 0.5 m
-0.16
-0.14
-0.12
-0.1
-0.08
-0.06
-0.04
-0.02
00 20 40 60 80 100 120
time (msec)
disp
lace
men
t (m
)
DytranAutodynLSDyna
Figure 10: Mid roof deflections obtained due to 0.5 distant blast
Autodyn vs Dytran - contact blast
-0.12
-0.10
-0.08
-0.06
-0.04
-0.02
0.000.00 10.00 20.00 30.00
time (ms)
disp
lace
men
t (m
)
Autodyn-topDytran-top
Figure 11: Mid roof deflections obtained due to contact blast
11
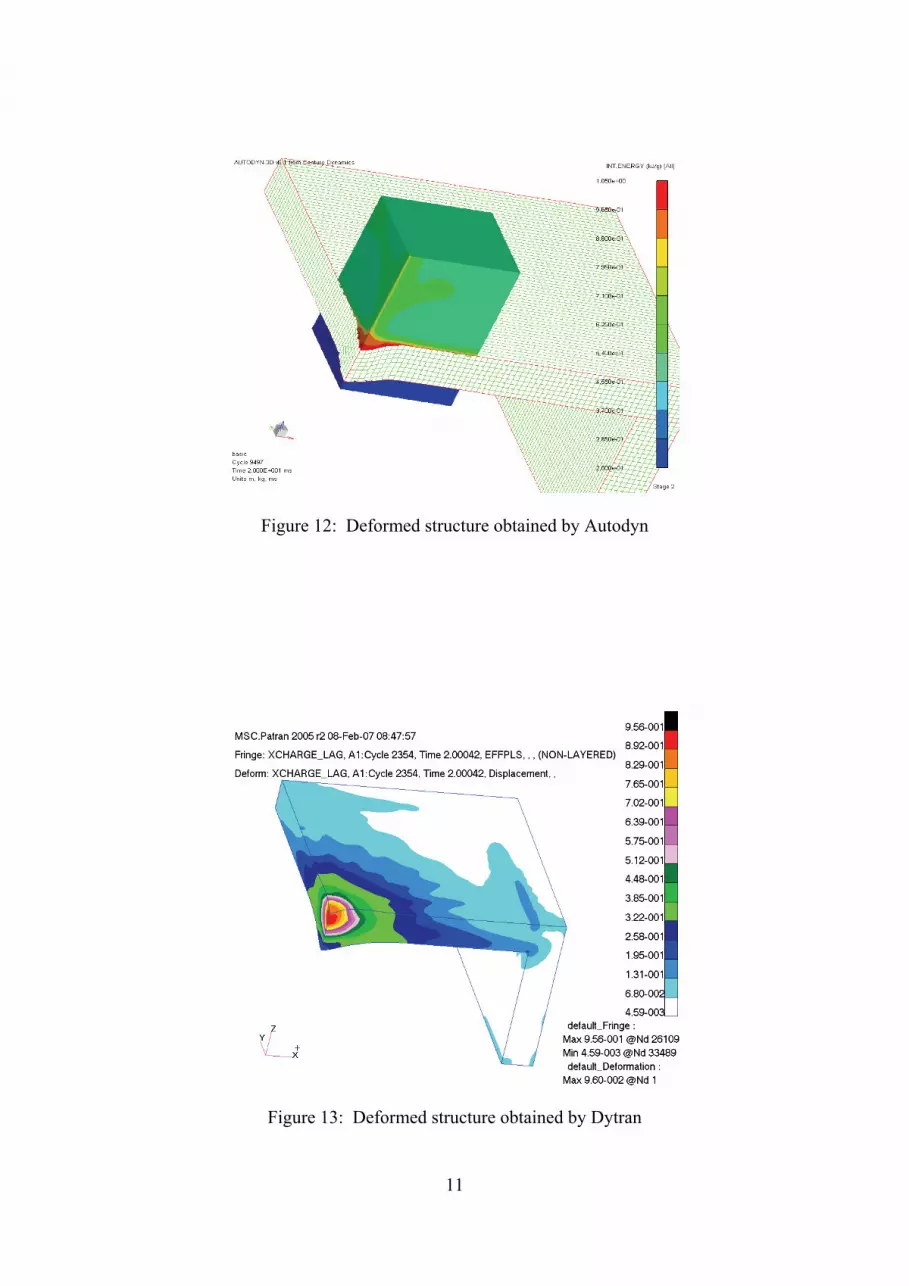
Figure 12: Deformed structure obtained by Autodyn
Figure 13: Deformed structure obtained by Dytran
12
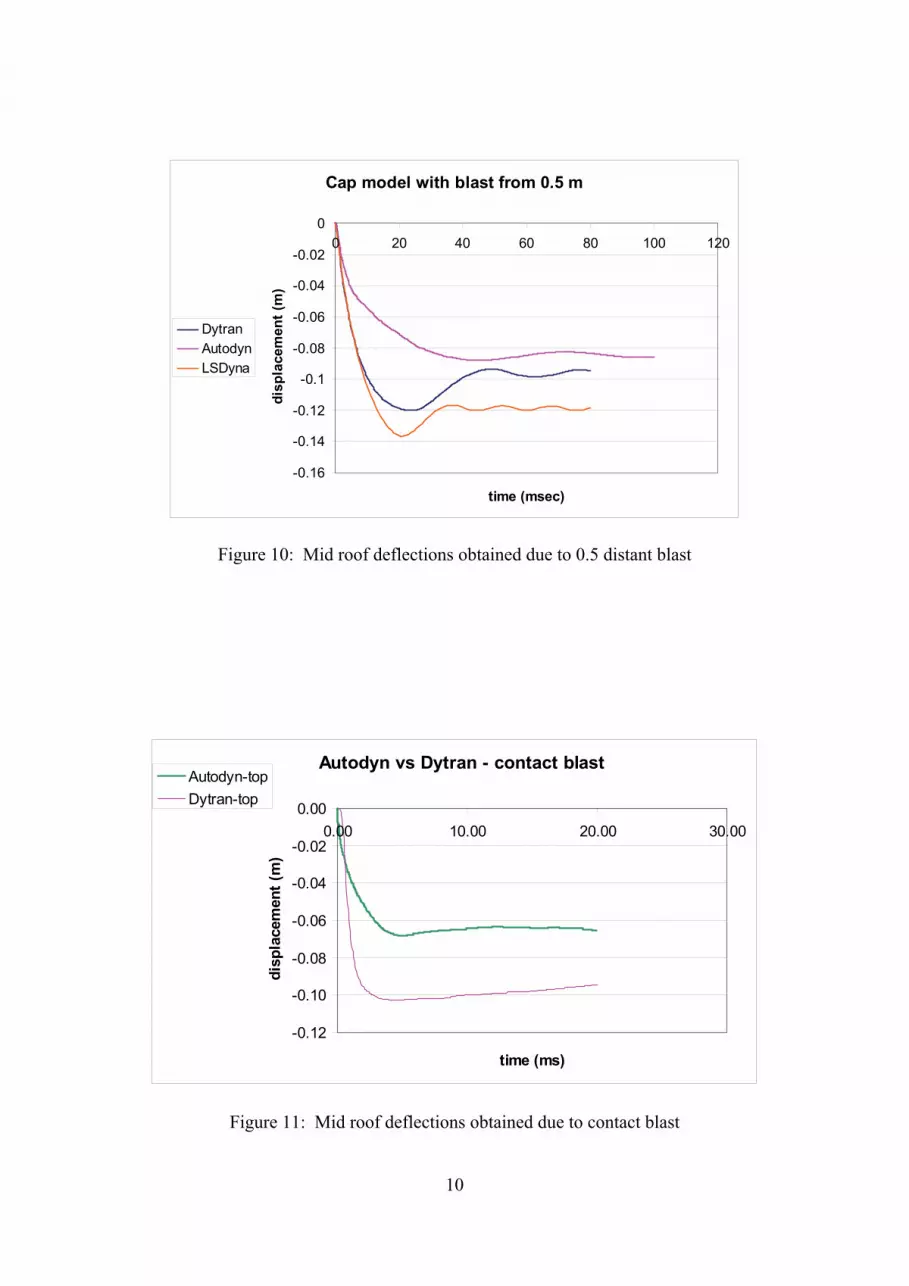
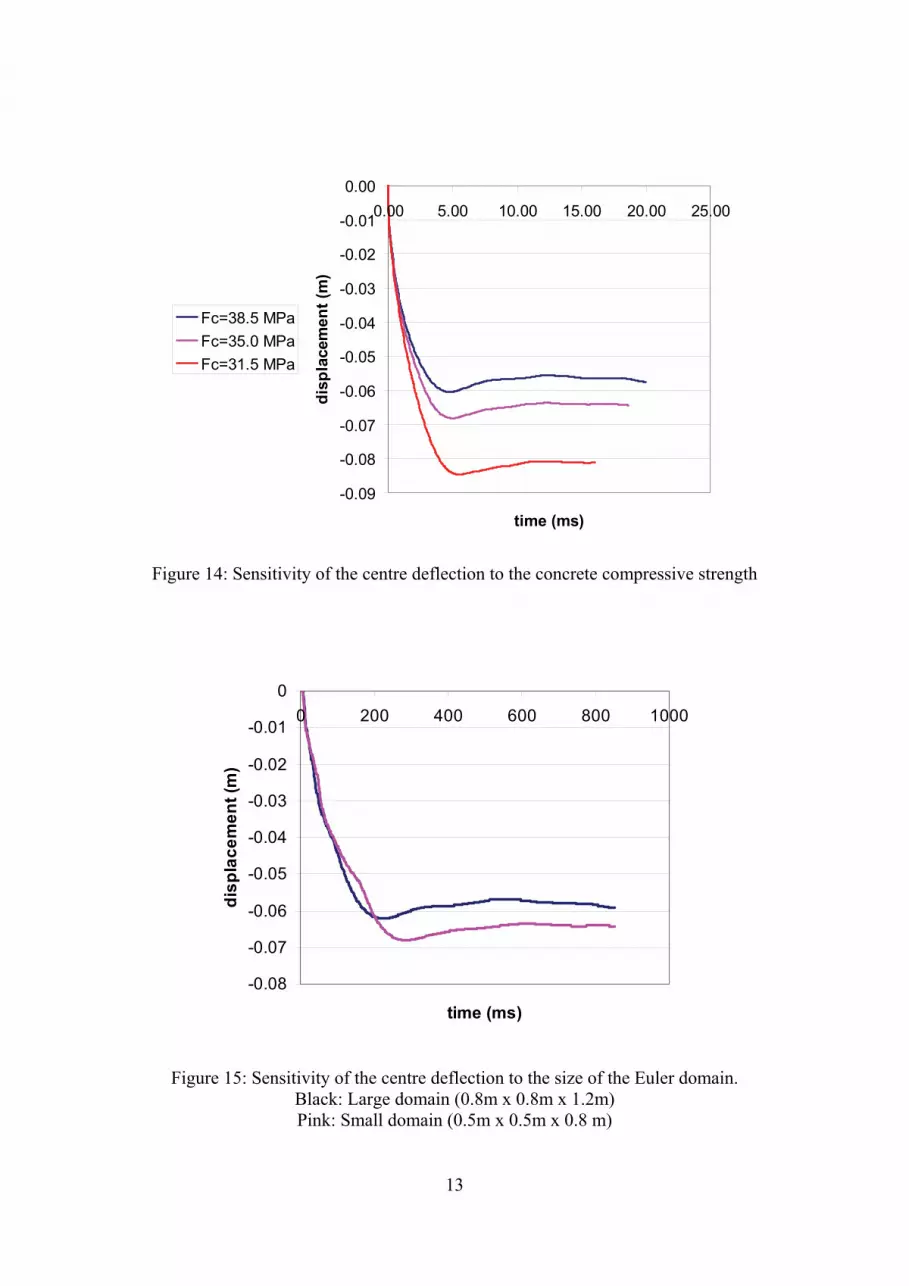
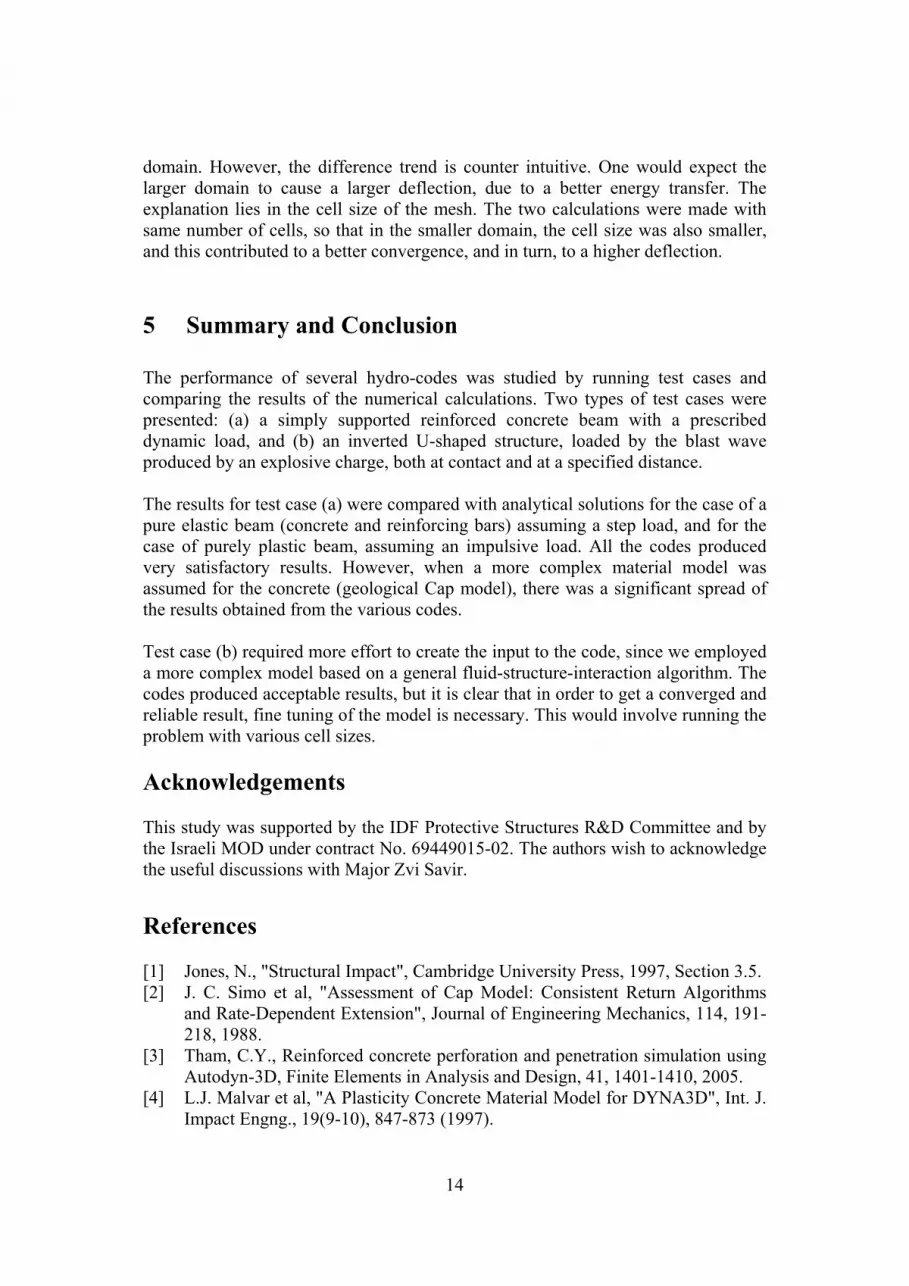
Figure 9 shows a model computed with Autodyn. A quarter of the structure is presented by the Lagrangian mesh (in green) and the block which contains the air and charge showing pressure contours. The first case computed was a 20kg TNT spherical charge centered 0.5m above the roof's center. The displacements histories obtained at the centre of the upper surface are shown in figure 10. The differences between the codes predictions are strikingly large. We were able to obtain results for this charge when brought closer to 0.4 and 0.3m distances from the roof, with results showing more and more differences in predictions. A contact blast was simulated with the charge being two brick-like charges placed at the roof's centre side by side. Each of them has 100mm x 65mm x 48.08mm dimensions. Figure 11 shows the results obtained by Autodyn and Dytran. Figures 12 and 13 show the deflected structure at the largest deformation obtained. The maximal deflections obtained by the two codes largely differ from each other. 4 Sensitivity of the Results In this section we test the sensitivity of the centre deflection of the inverted-U structure to two parameters. The first parameter is a physical one: the compressive strength of the concrete. The second parameter is numerical: the size of the Euler domain. The effect of the unconfined compressive strength of the concrete is shown in figure 14, where the results of three calculations are compared in terms of the centre deflection. The three values of the compressive strength are a nominal value of 35 MPa, a lower value of 31.5 MPa (nominal -10%), and a higher value of 38.5 MPa (nominal +10%). It can be seen that the lower and higher values results are not symmetrical with respect to the nominal value. Increasing the strength brings a smaller effect on the deflection than lowering the strength. This effect is obviously related to the nonlinear plastic behaviour of the concrete. With the lower strength concrete the plastic effect becomes more pronounced. The second parameter tested is the size of the Euler domain. Theoretically, one should use a large Euler domain to ensure that all the blast energy is transferred to the structure. Furthermore, the cell size of the Euler mesh should be small enough to ensure convergence of the results. Following the above recommendations usually results in a large number of cells which is often prohibitive in practical applications. In actual calculations, invariably some comprise is made. Figure 15 shows a comparison of two calculations of the same problem: the response of the inverted-U structure to a contact explosive charge of 1 kg TNT placed on the centre of the structure. The pink line represents a "small" size Euler domain, 0.5m x 0.5m x 0.8m, which was also shown in figure 11. The black line represents a "large" domain of 0.8m x 0.8m x 1.2m. It is seen that a difference of about 8% in terms of deflection is caused by the difference in the size of the Euler
13
-0.09
-0.08
-0.07
-0.06
-0.05
-0.04
-0.03
-0.02
-0.01
0.000.00 5.00 10.00 15.00 20.00 25.00
time (ms)
disp
lace
men
t (m
)Fc=38.5 MPaFc=35.0 MPaFc=31.5 MPa
Figure 14: Sensitivity of the centre deflection to the concrete compressive strength
-0.08
-0.07
-0.06
-0.05
-0.04
-0.03
-0.02
-0.01
00 200 400 600 800 1000
time (ms)
disp
lace
men
t (m
)
Figure 15: Sensitivity of the centre deflection to the size of the Euler domain. Black: Large domain (0.8m x 0.8m x 1.2m) Pink: Small domain (0.5m x 0.5m x 0.8 m)
14
domain. However, the difference trend is counter intuitive. One would expect the larger domain to cause a larger deflection, due to a better energy transfer. The explanation lies in the cell size of the mesh. The two calculations were made with same number of cells, so that in the smaller domain, the cell size was also smaller, and this contributed to a better convergence, and in turn, to a higher deflection. 5 Summary and Conclusion The performance of several hydro-codes was studied by running test cases and comparing the results of the numerical calculations. Two types of test cases were presented: (a) a simply supported reinforced concrete beam with a prescribed dynamic load, and (b) an inverted U-shaped structure, loaded by the blast wave produced by an explosive charge, both at contact and at a specified distance. The results for test case (a) were compared with analytical solutions for the case of a pure elastic beam (concrete and reinforcing bars) assuming a step load, and for the case of purely plastic beam, assuming an impulsive load. All the codes produced very satisfactory results. However, when a more complex material model was assumed for the concrete (geological Cap model), there was a significant spread of the results obtained from the various codes. Test case (b) required more effort to create the input to the code, since we employed a more complex model based on a general fluid-structure-interaction algorithm. The codes produced acceptable results, but it is clear that in order to get a converged and reliable result, fine tuning of the model is necessary. This would involve running the problem with various cell sizes. Acknowledgements This study was supported by the IDF Protective Structures R&D Committee and by the Israeli MOD under contract No. 69449015-02. The authors wish to acknowledge the useful discussions with Major Zvi Savir. References [1] Jones, N., "Structural Impact", Cambridge University Press, 1997, Section 3.5. [2] J. C. Simo et al, "Assessment of Cap Model: Consistent Return Algorithms
and Rate-Dependent Extension", Journal of Engineering Mechanics, 114, 191-218, 1988.
[3] Tham, C.Y., Reinforced concrete perforation and penetration simulation using Autodyn-3D, Finite Elements in Analysis and Design, 41, 1401-1410, 2005.
[4] L.J. Malvar et al, "A Plasticity Concrete Material Model for DYNA3D", Int. J. Impact Engng., 19(9-10), 847-873 (1997).
[6] L.E. Schwer, Y.D. Murray, "A Three-Invariant Smooth Cap Model With Mixed Hardening", International Journal for Numerical and Analytical Methods in Geomechanics, 18, 657-688 (1994).
[7] L.E. Schwer, Y.D. Murray, "Continuous Surface Cap Model for Geomaterial Modeling: A new LS-Dyna Material Type", 7th Int. LS-Dyna users conference, Detroit, (2002).
[8] Y.D. Murray, "Theory and Evaluation of Concrete Material Model 159", 8th Int. LS-Dyna users conference, Detroit (2004).
[9] "CONWEP, Conventional Weapons Effects", US Army Tri-Service Manual, TM5-855, 1992.