Manufacturing, Market Policy and Exports in Australia: Emulating the East Asian Economic Miracle? Celal Bayari Nagoya City University Graduate School of Economics CITATION Bayari, Celal (2011) Manufacturing, Market Policy and Exports in Australia: Emulating the East Asian Economic Miracle? East Asia: Comparative Perspective. 10(1): 7-32. ISSN 1975 6135. 1
Transcript
Manufacturing, Market Policy and Exports inAustralia: Emulating the East Asian Economic Miracle?
Celal Bayari
Nagoya City University Graduate School of Economics
CITATION
Bayari, Celal (2011) Manufacturing, Market Policy andExports in Australia: Emulating the East AsianEconomic Miracle? East Asia: Comparative Perspective. 10(1):7-32. ISSN 1975 6135.
1
MANUFACTURING, MARKET POLICY AND EXPORTS IN AUSTRALIA: EMULATING THEEAST ASIAN ECONOMIC MIRACLE?
Celal Bayari
Nagoya City University Graduate School of Economics
Abstract
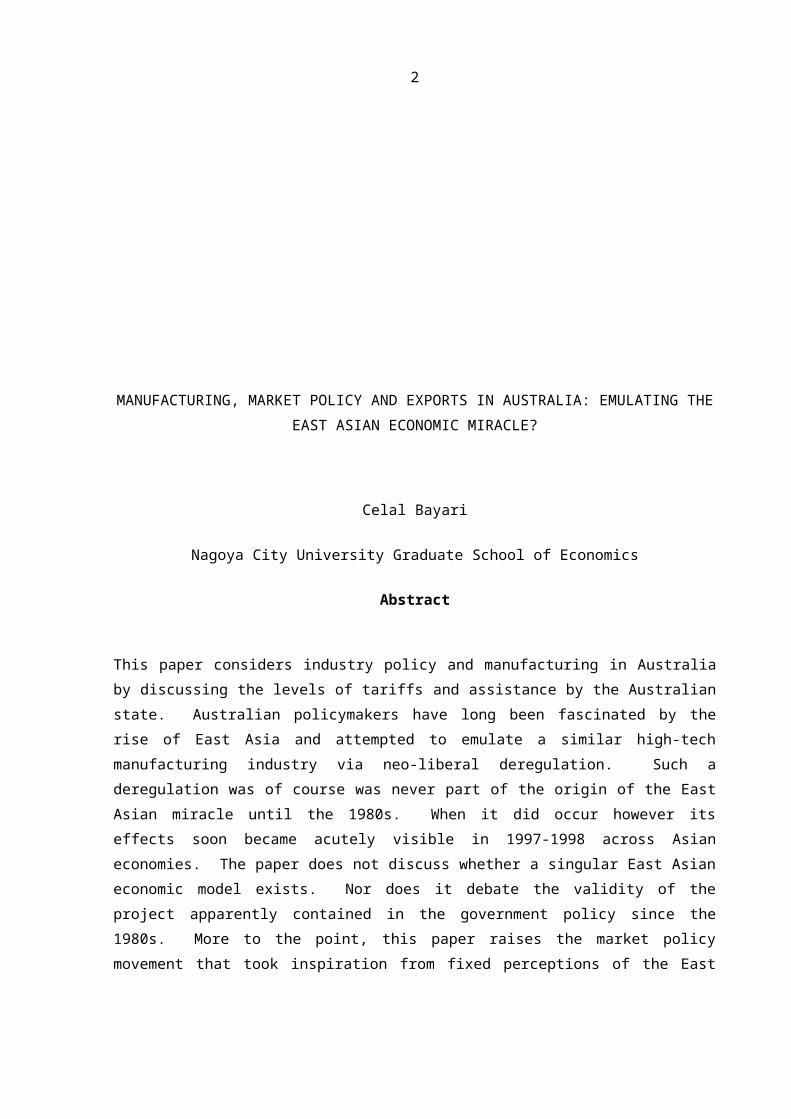
This paper considers industry policy and manufacturing in Australiaby discussing the levels of tariffs and assistance by the Australianstate. Australian policymakers have long been fascinated by therise of East Asia and attempted to emulate a similar high-techmanufacturing industry via neo-liberal deregulation. Such aderegulation was of course was never part of the origin of the EastAsian miracle until the 1980s. When it did occur however itseffects soon became acutely visible in 1997-1998 across Asianeconomies. The paper does not discuss whether a singular East Asianeconomic model exists. Nor does it debate the validity of theproject apparently contained in the government policy since the1980s. More to the point, this paper raises the market policymovement that took inspiration from fixed perceptions of the East
2
Asian economic miracle which was frequently (but not necessarilycorrectly) identified with neo-liberal deregulation. In the paper,the exports of elaborately transformed manufactures, especiallyduring the Howard Coalition government (1996-2007) period, areanalysed. What is Australia’s trade performance in suchmanufactures, including elaborately transformed manufactures? Whatis the debate on the current support mechanisms? Most importantly,what has the 1990s-2000s neo-liberal market governance achieved inAustralia? The paper covers these questions and reflects on thenature of Australian manufacturing exports to Japan.
IntroductionIn Australia, from the 1970s onwards protection of the domesticmarket and industry assistance came to be more intensely debated(Jones 2002: 1-7). The late 1970s signalled the ‘age ofuncertainty’ after the ‘age of growth’ (viz. the post-war period)(Wheelwright 1978: 15). There was too little time for theAustralian economy to adjust to the structural fallout (ofindustries) in the 1980s, and the ad hoc, inconsistent andconflicting policy-making that has extended into the 2000s (Jones2000: 60-61). With the rise of East Asia’s export-orientedeconomies, the pressure on the Australian market kept building upcontinuously. From the late 1980s Australia’s overall share ofworld exports began declining ever more rapidly, while the EastAsian economies were capturing the export markets in the developedworld (Pinkstone 1992: 377). Also in the late 1980s Australia beganto suffer a decline in its share of world foreign investment flows,while Japan’s foreign investment in Asia has continuously increased(EIU 1996: 1-35). This trend of declining foreign investment inAustralia continued with the growth in the Chinese economy and itsflow-on effects to the economies of Hong Kong, Singapore and Taiwan.
East Asian governments selectively began intervening in theirtariff-protected domestic markets to increase their export share in
3
foreign markets (Rodan et al. 1997: chapters 1 and 2). ForAustralian studies on the region's industrialisation throughgovernment intervention see Higgott and Robison (1985) and Robisonet al. (1987). In contrast, in Australia from 1987 onwards theintensification of trade liberalisation meant that the mechanisms ofsupport and encouragement (e.g. tax rebates) for manufacturingexporters to retool and retrain lost political support as tariffreductions gained in priority (Capling and Galligan 1992: chapter1). Hence, the Australian policy of market governance was theopposite of what was practised in other countries in the region.The Capling and Galligan (1992) study Beyond the Protective State is on apar with the Costa and Duffy (1991) book, Labor, Prosperity and the Ninetieson having faith in the deregulated market, although neither bookpredicted where that market eventually took Australia. Inparticular, the decline of elaborately transformed manufacturesexports that intensified after the federal election of the firstHoward Coalition government is a development without precedent.
The Garnaut Report, Australia and the Northeast Asian Ascendancy, arguedthat tariffs and industry-assistance programs were the mosteconomically debilitating policy mistakes of twentieth-centuryAustralia (Garnaut 1989: 211). However, at the time of the report’spublication, the highly successful East Asian markets were wellprotected in comparison with the Australian market. Even so, TheGarnaut Report advocated minimum control on capital flows into andout of the Australian market as the way to replicate the Asianmarket miracle (Garnaut 1989: 103), although it refrained fromoffering a comprehensive policy blue-print to assist exportmanufacturers. Financial deregulation required minimum control oncapital movement, but did not provide a national policy to maintaina competitive manufacturing base. As discussed below, this problembecame more acute with the decline in exports of elaboratelytransformed manufactures (ETMs) which are higher value-added
4
exports, after the cancellation of industry-assistance programs in1996.
Have these post-1996 developments that led to an decline in marketintervention led to an increase in exports of ETMs? This isdiscussed below. Also presented below are the trade deficit figuresfor, not just for the ETMs, but the entire manufacturing sector. Asshown below, the deficit for the entire manufacturing sector hasincreased in the period 1992-1993 to 2007-2008 while industryassistance reduction continued. The Rudd Labor government formed inlate 2007 revised industry assistance programs and this is visiblein the statistics for 2008-2009 in the below tables. This paperfocuses on the 1996-2007 Howard Liberal/National Coalitiongovernment.
Beilharz argues that Garnaut had an image of a type ofmanufacturing that was ‘less British, more Japanese style’. He addsthat ‘the leading role of the Japanese state in its economic miracle[, however,] simply slipped under the hyperbole. This has notprevented The Garnaut Report from becoming an axiomatic referencepoint to which both Federal government and opposition genuflect’(Beilharz 1994: 142). Australia’s proximity to the market models inAsia was of no educational benefit to the policymakers in Canberra.Australia’s neo-liberals paid no attention to the early tariff-basedmanufacturing growth in the East Asian economies.
Beilharz argues the following historical reason for the types ofprotectionism in Australia:
Australian political culture has helped to construct aparticular kind of society on the basis of social ordomestic, and economic or international senses ofprotection. Starting from the sensibility that theAustralian economy and society are small, and thereforevulnerable, this kind of argument not only centres on
5
culture but also on power, which is always asymmetricalin its distribution … Australian ... institutions ofeconomic and social protection ... have ... helpedconstruct a polity and a way of life that is relativelyadvantageous to very many of its citizens, larger as wellas smaller. This was, after all, the logic of newprotection itself, and however flawed its application ornon-application may have been, we still need to travelwith lifeboats (Beilharz 1994: 211).
The role of ‘support’ by state intervention for certain desiredeconomic outcomes has been shown to be part and parcel of marketexchange (Barbalet 2001, 1998). The ‘lifeboats’ analogy is similarto the emotional-support mechanisms for local and localisedbusinesses, which ensure that they act in a desirable way bycreating confidence at sufficient levels for continued inwardinvestment. If the business community feels reassured and confidentthat the government will act in a ‘responsible’ way, then certainlevels of investment activity may eventuate.
The Pappas Carter Evan Koop Report, The Global Challenge: AustralianManufacturing in the 1990s (1990), published a year after The GarnautReport, Australia and the Northeast Asian Ascendancy, argues against removingindustry protections and tariffs without first installing acomprehensive national industry policy. This is not a blueprint ofnew style of protectionism, but a defence of state interventioninformed by the belief that ‘[n]o modern country of significant sizehas maintained a vital economy without a strong industrial base thatincludes at least some tradeable ETM [elaborately transformedmanufacturing] industries’ (AMC 1990: v). When the AustralianCouncil of Trade Unions (ACTU) engaged with the issue of themanufacturing, in Australia Reconstructed, it suggested that thegovernment intervene in the labour market to speed up the transferof skills and workers from declining industries to those that were
6
expanding (ACTU-TDC 1987: chapters 1 and 2). For the ACTU, theproblem is seen mainly in terms of labour market restructuring andre-skilling and not as an issue of the broader industrial base ofthe nation. The governance of the Australian market after the 1980sfollowed a vision of the industrial base as being free of governmentintervention, but in reality government continuously financesindustry assistance schemes.
The manufacturing sector contains ‘smart’ jobs with skills thatare beneficial to the entire domestic market. Such jobs bringhigher amounts of payroll and income tax to the government treasury.As the manufacturing sector declines, so does the related jobmarket. The end result is a rise in the numbers of skilled peoplewho cannot find work to utilise their abilities, and eventually adecline in the number of skilled jobs leading to a shortage oftrained people down the line (Weller and Webber 2001: 160-195).Inevitably, the decline in manufacturing jobs has affectedvocational training and skills in the labour market in the early2000s. Australia began to suffer a shortage of skilledmanufacturing people ‘in the positions of tool-makers, metalfabricators, motor mechanics, electricians, refrigeration mechanicsand plumbers’, at levels that could threaten ‘to hold back economicgrowth’ (Maiden 2003: 4).
Skills training is a form of social spending that creates value inthe labour market and which is appropriated by private investors.Toner argues that MNEs that invest in Australia expect to find alabour market which has been trained by publicly funded vocationaleducation (Toner 2004: 29). However, public funding of education inAustralia has been suffering a decline as a result of neo-liberalism. Hence, the lack of skills in the labour market is anoutcome of the dominant economic orthodoxy. This is a neo-liberaldilemma. While neo-liberalism argues that public spending crowdsout private investment, it actually feeds that investment. Neo-
7
liberal market governance discourages the kinds of productiveeconomic activities that are central to employment and income growth(Grabel 2002: 39). Instead it encourages speculative economicactivity which leaves fewer funds available for the manufacturingsector, which is the sector that creates (high skill) jobs andenhances growth (Stiglitz 2002: 101).
The rise of neo-liberal market policies in Australia has not meantan end to all the industry-assistance programs. The small size ofthe Australian economy which does not allow large economies ofscale, and dated technology in the manufacturing sector and reducedprofits in protected sectors, meant that there would be areorientation towards protection of manufacturing industries in the1990s (Fagan and Webber 1999: 146). This explains why the Laborgovernments that preceded the first Howard Coalition government wererunning industry-assistance programs while professing to toe theneo-liberal non-intervention line. From the first Howard Coalitiongovernment onwards, however, there were reductions in such programs.The post-war history of industry-assistance schemes defies anyanalysis that seeks a clear pattern (Jones 2000, 2002).
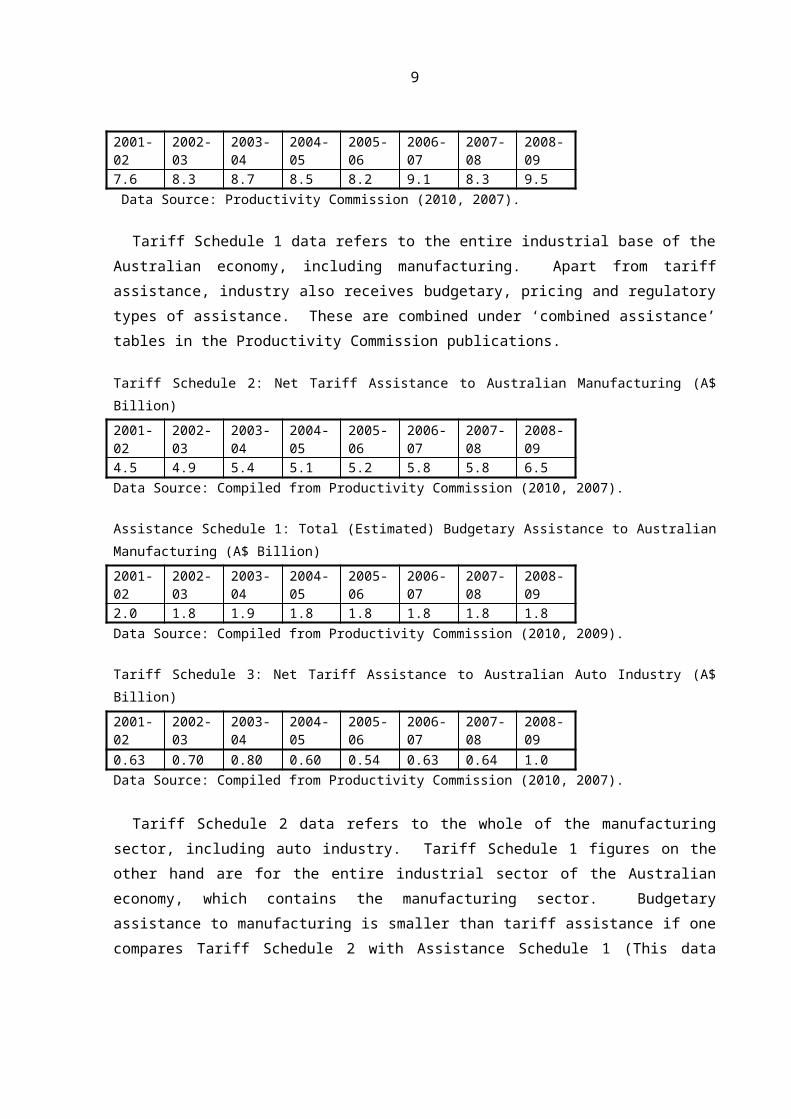
Tariffs and tradeThe value of industry assistance in 2008-2009 was approximatelyA$17.2 billion in gross terms and A$9 billion in net terms(Productivity Commission 2010: xii). This large outlay shows theextent of the state’s direct intervention in the market. ‘Total(gross) tariff assistance’ to industry in 2008-2009 (see TariffSchedule 1) was A$9.5 billion. ‘Net Tariff Assistance’ to Australianmanufacturing in the same period was A$6.5 billion (see TariffSchedule 2). The manufacturing sector is the major beneficiary oftariff assistance and the automotive industry is the biggest segmentof the manufacturing sector.
Tariff Schedule 1: Total (Gross) Tariff Assistance to Australian Industry(A$ Billion)
Tariff Schedule 1 data refers to the entire industrial base of theAustralian economy, including manufacturing. Apart from tariffassistance, industry also receives budgetary, pricing and regulatorytypes of assistance. These are combined under ‘combined assistance’tables in the Productivity Commission publications.
Tariff Schedule 2: Net Tariff Assistance to Australian Manufacturing (A$Billion)2001-02
Tariff Schedule 2 data refers to the whole of the manufacturingsector, including auto industry. Tariff Schedule 1 figures on theother hand are for the entire industrial sector of the Australianeconomy, which contains the manufacturing sector. Budgetaryassistance to manufacturing is smaller than tariff assistance if onecompares Tariff Schedule 2 with Assistance Schedule 1 (This data
9
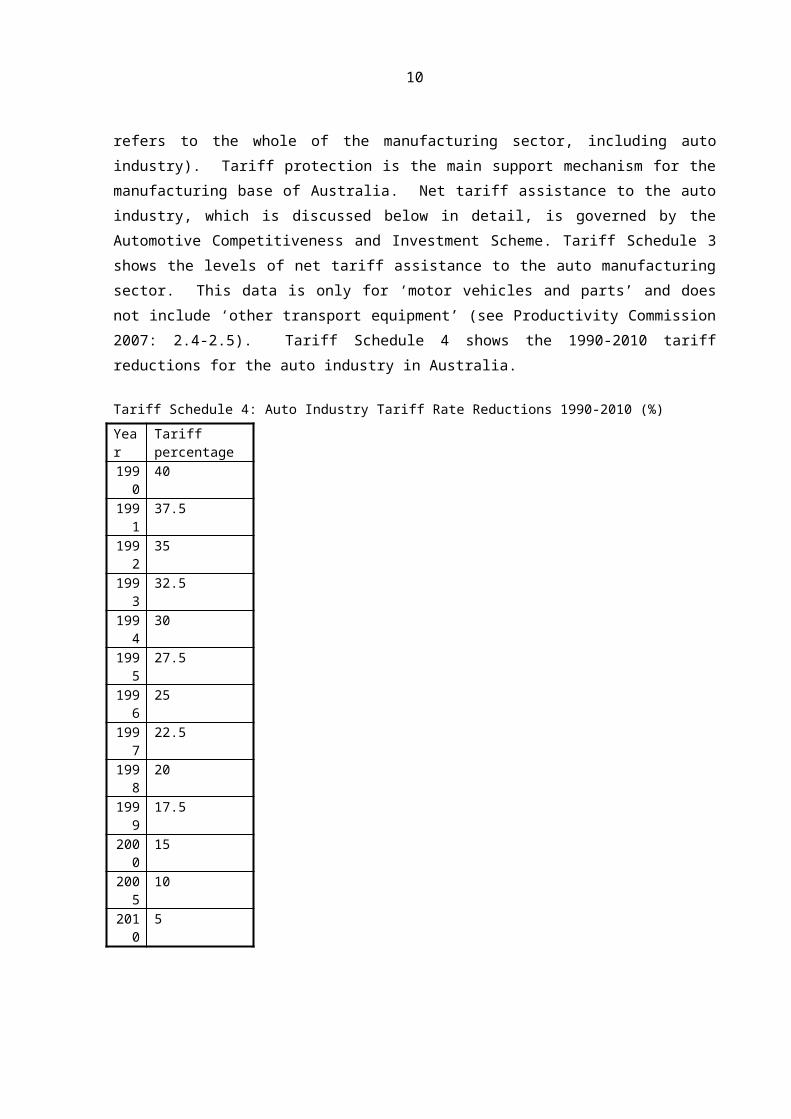
refers to the whole of the manufacturing sector, including autoindustry). Tariff protection is the main support mechanism for themanufacturing base of Australia. Net tariff assistance to the autoindustry, which is discussed below in detail, is governed by theAutomotive Competitiveness and Investment Scheme. Tariff Schedule 3shows the levels of net tariff assistance to the auto manufacturingsector. This data is only for ‘motor vehicles and parts’ and doesnot include ‘other transport equipment’ (see Productivity Commission2007: 2.4-2.5). Tariff Schedule 4 shows the 1990-2010 tariffreductions for the auto industry in Australia.
Tariff Schedule 4: Auto Industry Tariff Rate Reductions 1990-2010 (%)Year
Tariff percentage
1990
40
1991
37.5
1992
35
1993
32.5
1994
30
1995
27.5
1996
25
1997
22.5
1998
20
1999
17.5
2000
15
2005
10
2010
5
10
Data Source: Compiled from Productivity Commission (2002a), Department ofInnovation, Industry, Science and Research (2009).
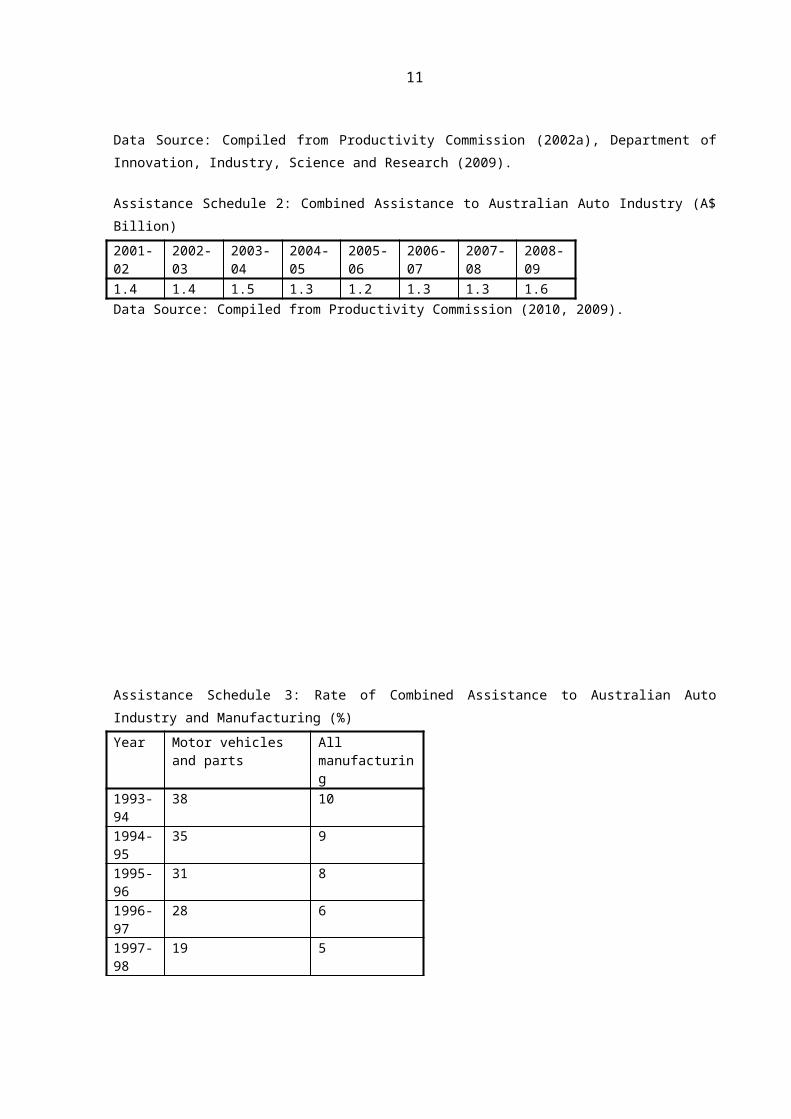
Assistance Schedule 2: Combined Assistance to Australian Auto Industry (A$Billion)2001-02
Assistance Schedule 3: Rate of Combined Assistance to Australian AutoIndustry and Manufacturing (%)Year Motor vehicles
and partsAll manufacturing
1993-94
38 10
1994-95
35 9
1995-96
31 8
1996-97
28 6
1997-98
19 5
11
1998-99
19 5
1999-00
19 5
2000-01
19 5
2001-02
18 5
2002-03
16 5
2003-04
16 5
2004-05
15 5
2005-06
13 5
2006-07
12.1 4.5
2007-08
12 4.6
2008-09
11.8 4.6
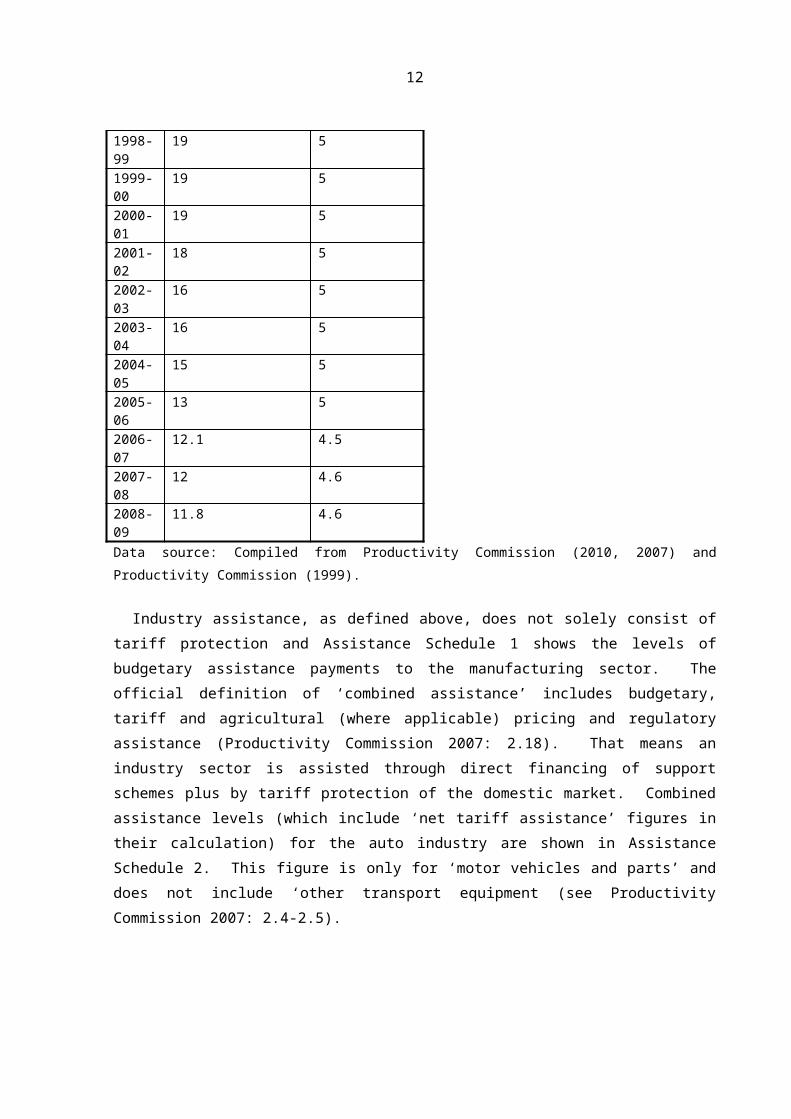
Data source: Compiled from Productivity Commission (2010, 2007) andProductivity Commission (1999).
Industry assistance, as defined above, does not solely consist oftariff protection and Assistance Schedule 1 shows the levels ofbudgetary assistance payments to the manufacturing sector. Theofficial definition of ‘combined assistance’ includes budgetary,tariff and agricultural (where applicable) pricing and regulatoryassistance (Productivity Commission 2007: 2.18). That means anindustry sector is assisted through direct financing of supportschemes plus by tariff protection of the domestic market. Combinedassistance levels (which include ‘net tariff assistance’ figures intheir calculation) for the auto industry are shown in AssistanceSchedule 2. This figure is only for ‘motor vehicles and parts’ anddoes not include ‘other transport equipment (see ProductivityCommission 2007: 2.4-2.5).
12
Assistance Schedule 3 shows the ‘effective rates of assistance’from 1993-1994 onwards the data of these years are combined fromdifferent publications). ‘Effective rates of assistance’ refers to‘assistance to an activity, net of the effects of tariffs andcertain other forms of government intervention which alter theprices of material inputs used by the industry’ (ProductivityCommission 1999: 60). This data is presented here in order toprovide an approximate indication of the level of reduction in therates of assistance. As displayed in Assistance Schedule 3 ‘motorvehicles and parts’ receive higher rates of assistance than all ofmanufacturing.
As a result of phased tariff reductions, ‘the effective rate ofassistance’ for the auto industry has been falling continuously.While the Automotive Competitiveness and Investment Scheme startedin 2001 as a program of assistance to auto manufacturers, AssistanceSchedule 3 shows that the rate of assistance has actually beendeclining since the Scheme’s inception. Later there is furtherdiscussion on this topic along with a discussion about the four carmanufacturers in Australia. The paper will now consider aparticular outcome of the above presented history of tariff andassistance reductions. This outcome is the increasing trade deficitthat Australia has been having in elaborately transformedmanufactures. The volumes of these items that Australia producesand exports are increasingly lower that what is imported into thecountry and the paper will present the related figures below.
Manufacturing in Australia, even in its present reduced state,contributes more to the economy than any other sector (see ABS8221.0 2006: 8-15). However, historically the numerous industrypolicies that have been in place have never covered all the sectorsthat need such assistance packages (Weiss 1998: 63). For small-sized manufacturers, for example, the tariff-reduction policies havebeen a sore point for many decades, as cheap imports continue to
13
undercut local prices (Dabrowski 2003: 34). Small and medium-sizedmanufacturers have been allowed to wither.
The process experienced by Australian industries under neo-liberalgovernance can be described as ‘deindustrialisation and long-termstructural decline’ (Lucarelli 2003: 99). Grabel argues that de-industrialisation is one of the outcomes of neo-liberal marketgovernance, whereby the manufacturing sector, unable to yield therate of profit that other sectors can, does not attract sufficientinvestment. Neo-liberal market governance promotes investment infinancial markets rather than in a production-led economy. As aresult ‘productive activities like manufacturing or infrastructureprojects simply cannot compete because they rarely offer theopportunity for massive capital gain that is associated withspeculative projects’ (Grabel 2002: 38).
The neo-liberal rule of the past three decades, first with theHawke and Keating governments, and then the successive Coalitiongovernments since 1996, has removed many of the industry supportmechanisms of the previous governments (AMWU 2003b: 36). One of theexceptions to this has been the auto and auto-parts manufacturingindustry which, despite the decrease in tariff protection fromimports, has also been assisted by government spending. As Jonesargues, industry policies under Howard continued to containcontradictory tendencies (Jones 2000: 60-70). The obvious exampleof this is the fact that the Automotive Competitiveness andInvestment Scheme (ACIS) was funded from tariffs on car and car partsimports (Marris 2002: 4). Tariff duties are used to prop up anindustry that is under threat of further decline as a result of thecontinuance of the tariff removal policies. From 2010 onwards, theACIS has been replaced with a new scheme the Global AutomotiveTransition Scheme [GATS] which complements the Green Car InnovationFund (Review of Australia’s Automotive Industry Final Report 2008:98). However this is outside the present discussion. ACIS shored
14
up, in the larger context of tariff reduction policies, the largestmanufacturing sector in Australia, one that employs thousands andcontributes to the nation’s skill, education and technology base.Similar funding programs have previously existed under differentassistance schemes. However, the sector continued to decline evenafter the introduction of the above scheme.
MMAL announced in May 2004 that its South Australia engine plantwould close, and declared that the remaining sole assembly plant mayalso face the same fate eventually. The company was tied to DaimlerChrysler at the time. Daimler Chrysler structure dissolved inOctober 2007. Daimler Chrysler used to own 37 per cent ofMitsubishi in Australia (see The Japan Times 2000: 14). After 2001,Mitsubishi Motor Corporation held 100 per cent of issued sharecapital of Mitsubishi Motors Limited Australia. Under the policyframework of the time, the federal government was planning to havereduced auto import tariffs to 10 per cent by January 2005. So, thecompany was unwilling to wait to see the effects of the tariffreduction. It scaled down its investment. Then in March 2008 itshut down the remaining manufacturing operation. Hence, the sectorcontinues to shrink.
Mitsubishi cited the continuing rise in the value of the A$ as oneof the reasons for its decision to abandon production in Australia(ABC Midday News 2008). Since the term of the first HowardCoalition government, industry assistance and protection in theAustralian market have been argued to be insufficient. This was apoint of debate in the months that led to the 2007 federal election.In the period leading up to the 2007 federal election, the policyplatform of Labor included plans for public investment in themanufacturing sector, in heavy industry high-volume job creationareas such as shipbuilding. The Howard Coalition government of thetime called this Labor policy platform industry ‘protectionist’which is a reference to the post-World War II period industry policy
15
in Australia. The continuing resources boom fuelled by Chinesedemand dampened the issue in the period leading to the 2010 federalelection.
The marginalisation of the Australian manufacturing base forms along drawn-out trend that is not limited to the 1996-2007 Coalitiongovernments. Inter-party conflicts on tariffs and trade policiesfrom the 1950s to the 1970s were replaced by bi-partisan support forneo-liberalism from the 1980s onwards among political andbureaucratic elites. The 1983-1996 Labor governments tried to runneo-liberalism concurrently with compensatory politics (Beeson andBell 2000: 312). However the electoral shift away from Labor removeddeficit-funded ‘welfare, labour-market and industry policies’ (Weiss1998: 191), and industry-assistance schemes began to be wound down.This was the Howard Coalition period. The end result has been adecrease in ETM exports. In the period set out in Table 1, Table1.1 and Table 1.2 it is possible to see the effects of thereduction in state intervention (under the Howard Coalitiongovernment) in the form of industry-assistance spending and tariffprotection. There is a correlation between government interventionin the market and the manufacture and export of ETMs (AMWU 2003b:36).
The above statistics for tariff reductions coincide with thedeficit figures for elaborately transformed manufactures.Australia’s manufacture trade [‘total manufactures’] has twocomponents: STMs (simply transformed manufactures) and ETMs. Thefive year trend (2002-2003 to 2005-2006) in ‘total manufactures’trade between Australia and the rest of the world is an increase of24 per cent in deficit (DFAT 2007: 12). Within that deficit the ETMdeficit is the largest part. The simple reason for this is thatETMs are high-value added products and hence cost more and whenthere is a trade deficit, the fluctuations in the value of A$ canadd an extra burden to the economy. Hence, the ETM trade deficit
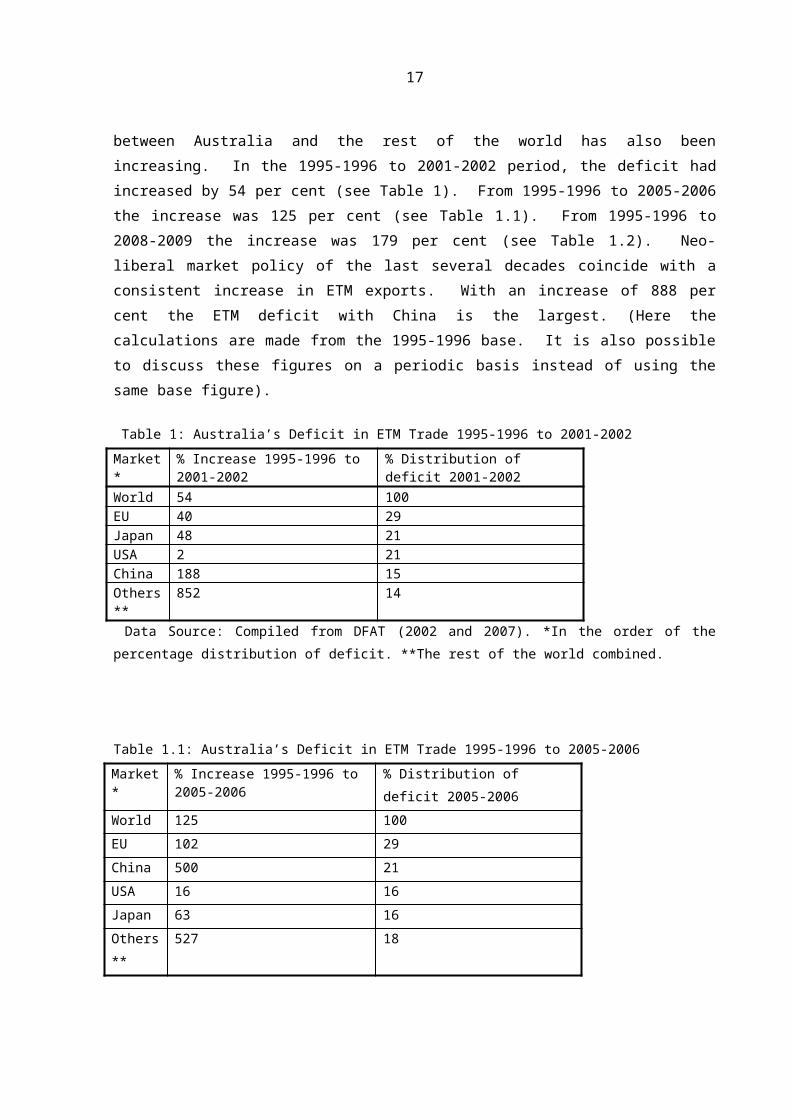
16
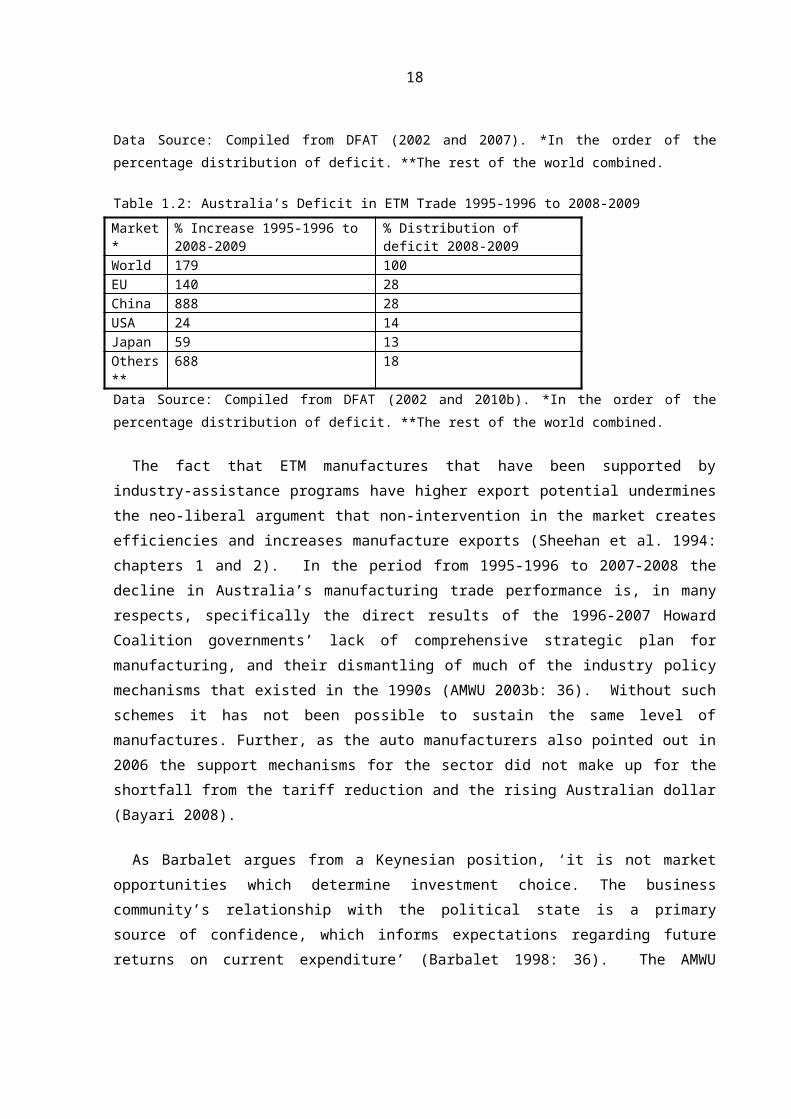
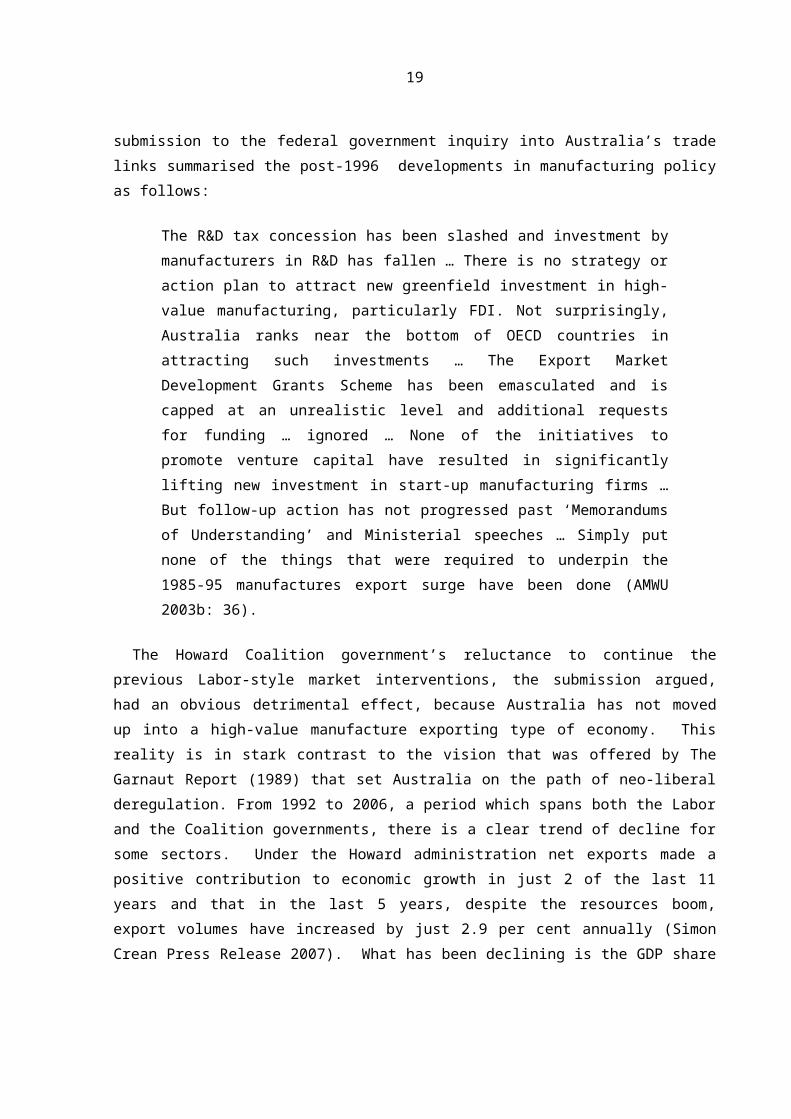
between Australia and the rest of the world has also beenincreasing. In the 1995-1996 to 2001-2002 period, the deficit hadincreased by 54 per cent (see Table 1). From 1995-1996 to 2005-2006the increase was 125 per cent (see Table 1.1). From 1995-1996 to2008-2009 the increase was 179 per cent (see Table 1.2). Neo-liberal market policy of the last several decades coincide with aconsistent increase in ETM exports. With an increase of 888 percent the ETM deficit with China is the largest. (Here thecalculations are made from the 1995-1996 base. It is also possibleto discuss these figures on a periodic basis instead of using thesame base figure).
Table 1: Australia’s Deficit in ETM Trade 1995-1996 to 2001-2002Market*
Data Source: Compiled from DFAT (2002 and 2010b). *In the order of thepercentage distribution of deficit. **The rest of the world combined.
The fact that ETM manufactures that have been supported byindustry-assistance programs have higher export potential underminesthe neo-liberal argument that non-intervention in the market createsefficiencies and increases manufacture exports (Sheehan et al. 1994:chapters 1 and 2). In the period from 1995-1996 to 2007-2008 thedecline in Australia’s manufacturing trade performance is, in manyrespects, specifically the direct results of the 1996-2007 HowardCoalition governments’ lack of comprehensive strategic plan formanufacturing, and their dismantling of much of the industry policymechanisms that existed in the 1990s (AMWU 2003b: 36). Without suchschemes it has not been possible to sustain the same level ofmanufactures. Further, as the auto manufacturers also pointed out in2006 the support mechanisms for the sector did not make up for theshortfall from the tariff reduction and the rising Australian dollar(Bayari 2008).
As Barbalet argues from a Keynesian position, ‘it is not marketopportunities which determine investment choice. The businesscommunity’s relationship with the political state is a primarysource of confidence, which informs expectations regarding futurereturns on current expenditure’ (Barbalet 1998: 36). The AMWU
18
submission to the federal government inquiry into Australia’s tradelinks summarised the post-1996 developments in manufacturing policyas follows:
The R&D tax concession has been slashed and investment bymanufacturers in R&D has fallen … There is no strategy oraction plan to attract new greenfield investment in high-value manufacturing, particularly FDI. Not surprisingly,Australia ranks near the bottom of OECD countries inattracting such investments … The Export MarketDevelopment Grants Scheme has been emasculated and iscapped at an unrealistic level and additional requestsfor funding … ignored … None of the initiatives topromote venture capital have resulted in significantlylifting new investment in start-up manufacturing firms …But follow-up action has not progressed past ‘Memorandumsof Understanding’ and Ministerial speeches … Simply putnone of the things that were required to underpin the1985-95 manufactures export surge have been done (AMWU2003b: 36).
The Howard Coalition government’s reluctance to continue theprevious Labor-style market interventions, the submission argued,had an obvious detrimental effect, because Australia has not movedup into a high-value manufacture exporting type of economy. Thisreality is in stark contrast to the vision that was offered by TheGarnaut Report (1989) that set Australia on the path of neo-liberalderegulation. From 1992 to 2006, a period which spans both the Laborand the Coalition governments, there is a clear trend of decline forsome sectors. Under the Howard administration net exports made apositive contribution to economic growth in just 2 of the last 11years and that in the last 5 years, despite the resources boom,export volumes have increased by just 2.9 per cent annually (SimonCrean Press Release 2007). What has been declining is the GDP share
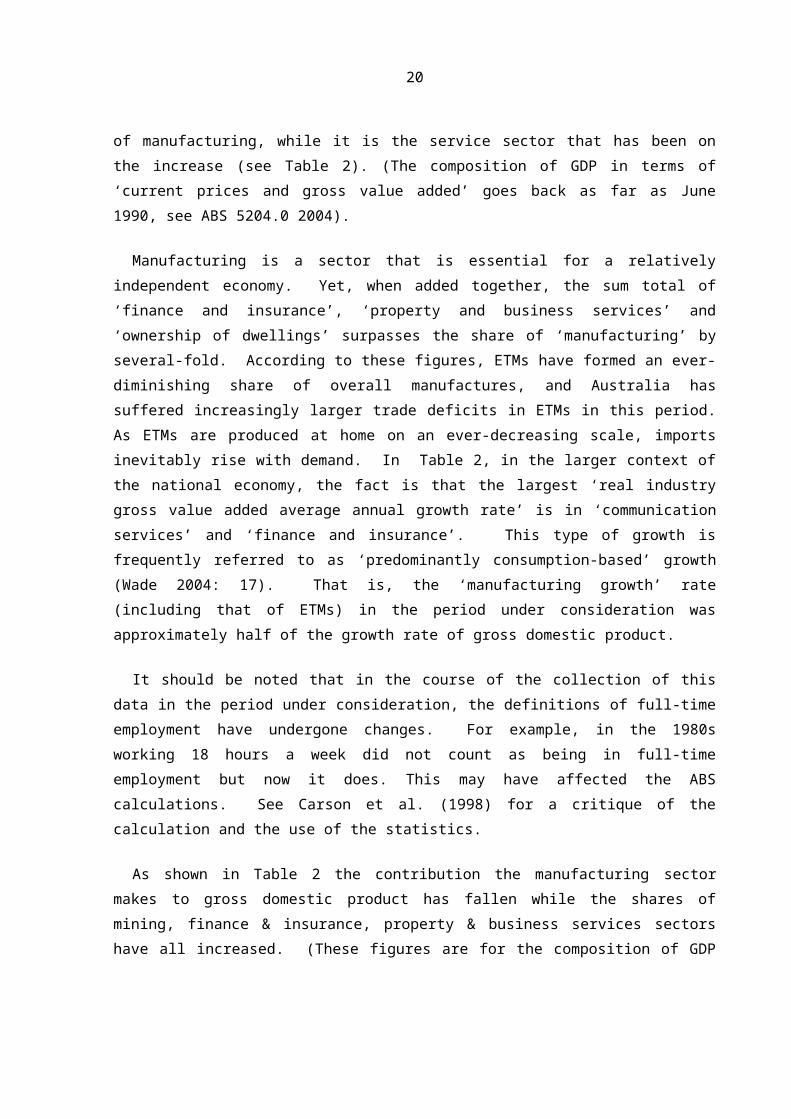
19
of manufacturing, while it is the service sector that has been onthe increase (see Table 2). (The composition of GDP in terms of‘current prices and gross value added’ goes back as far as June1990, see ABS 5204.0 2004).
Manufacturing is a sector that is essential for a relativelyindependent economy. Yet, when added together, the sum total of‘finance and insurance’, ‘property and business services’ and‘ownership of dwellings’ surpasses the share of ‘manufacturing’ byseveral-fold. According to these figures, ETMs have formed an ever-diminishing share of overall manufactures, and Australia hassuffered increasingly larger trade deficits in ETMs in this period.As ETMs are produced at home on an ever-decreasing scale, importsinevitably rise with demand. In Table 2, in the larger context ofthe national economy, the fact is that the largest ‘real industrygross value added average annual growth rate’ is in ‘communicationservices’ and ‘finance and insurance’. This type of growth isfrequently referred to as ‘predominantly consumption-based’ growth(Wade 2004: 17). That is, the ‘manufacturing growth’ rate(including that of ETMs) in the period under consideration wasapproximately half of the growth rate of gross domestic product.
It should be noted that in the course of the collection of thisdata in the period under consideration, the definitions of full-timeemployment have undergone changes. For example, in the 1980sworking 18 hours a week did not count as being in full-timeemployment but now it does. This may have affected the ABScalculations. See Carson et al. (1998) for a critique of thecalculation and the use of the statistics.
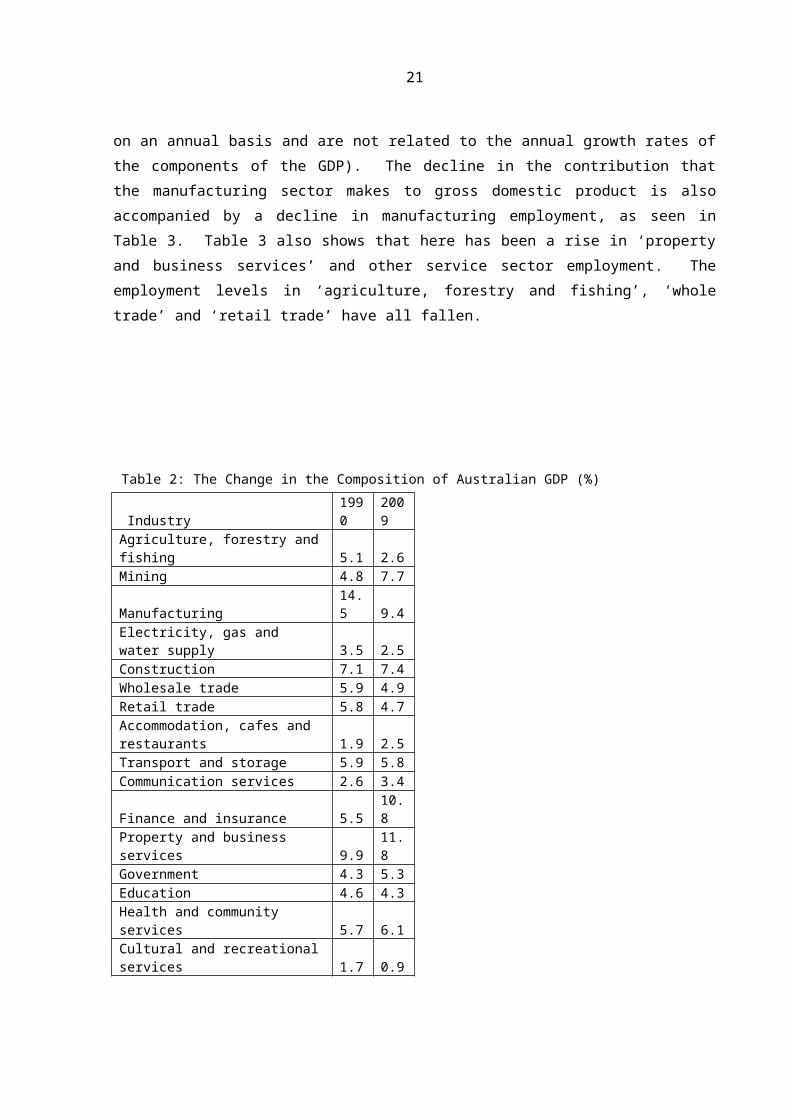
As shown in Table 2 the contribution the manufacturing sectormakes to gross domestic product has fallen while the shares ofmining, finance & insurance, property & business services sectorshave all increased. (These figures are for the composition of GDP
20
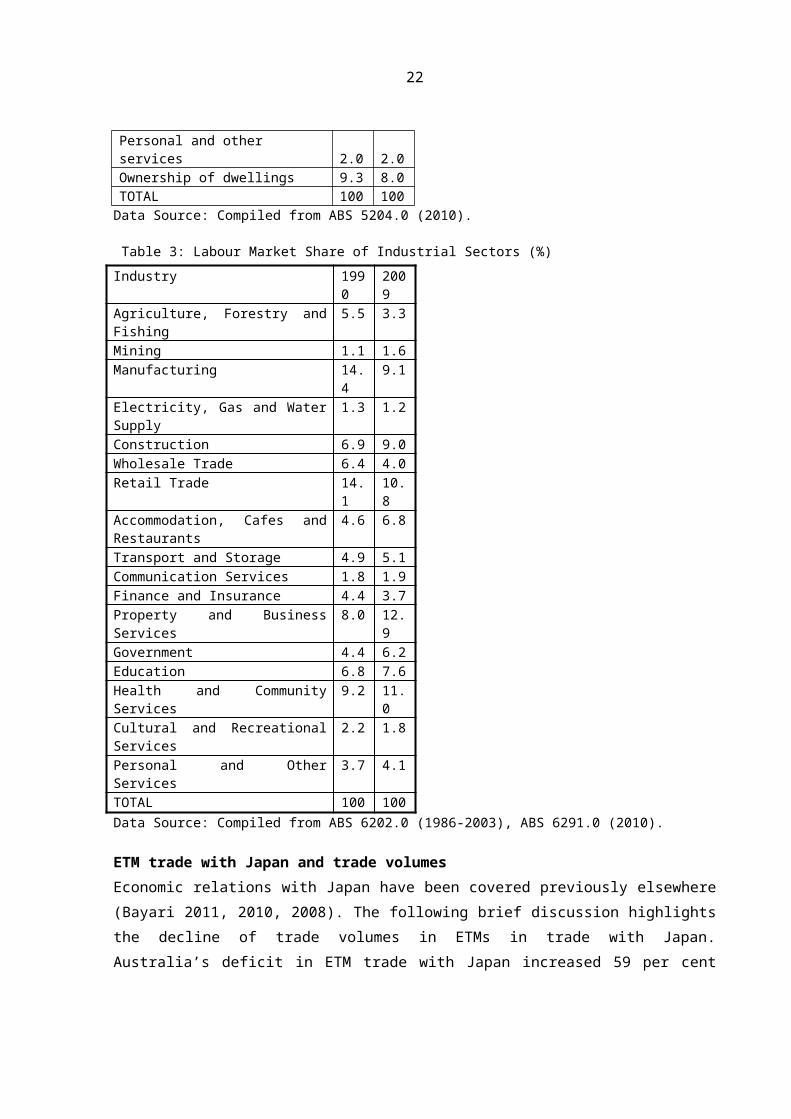
on an annual basis and are not related to the annual growth rates ofthe components of the GDP). The decline in the contribution thatthe manufacturing sector makes to gross domestic product is alsoaccompanied by a decline in manufacturing employment, as seen inTable 3. Table 3 also shows that here has been a rise in ‘propertyand business services’ and other service sector employment. Theemployment levels in ‘agriculture, forestry and fishing’, ‘wholetrade’ and ‘retail trade’ have all fallen.
Table 2: The Change in the Composition of Australian GDP (%)
Electricity, gas and water supply 3.5 2.5Construction 7.1 7.4Wholesale trade 5.9 4.9Retail trade 5.8 4.7Accommodation, cafes and restaurants 1.9 2.5Transport and storage 5.9 5.8Communication services 2.6 3.4
Finance and insurance 5.510.8
Property and business services 9.9
11.8
Government 4.3 5.3Education 4.6 4.3Health and community services 5.7 6.1Cultural and recreationalservices 1.7 0.9
21
Personal and other services 2.0 2.0Ownership of dwellings 9.3 8.0TOTAL 100 100Data Source: Compiled from ABS 5204.0 (2010).
Table 3: Labour Market Share of Industrial Sectors (%)Industry 199
02009
Agriculture, Forestry andFishing
5.5 3.3
Mining 1.1 1.6Manufacturing 14.
49.1
Electricity, Gas and WaterSupply
1.3 1.2
Construction 6.9 9.0Wholesale Trade 6.4 4.0Retail Trade 14.
110.8
Accommodation, Cafes andRestaurants
4.6 6.8
Transport and Storage 4.9 5.1Communication Services 1.8 1.9Finance and Insurance 4.4 3.7Property and BusinessServices
8.0 12.9
Government 4.4 6.2Education 6.8 7.6Health and CommunityServices
9.2 11.0
Cultural and RecreationalServices
2.2 1.8
Personal and OtherServices
3.7 4.1
TOTAL 100 100Data Source: Compiled from ABS 6202.0 (1986-2003), ABS 6291.0 (2010).
ETM trade with Japan and trade volumesEconomic relations with Japan have been covered previously elsewhere(Bayari 2011, 2010, 2008). The following brief discussion highlightsthe decline of trade volumes in ETMs in trade with Japan.Australia’s deficit in ETM trade with Japan increased 59 per cent
22
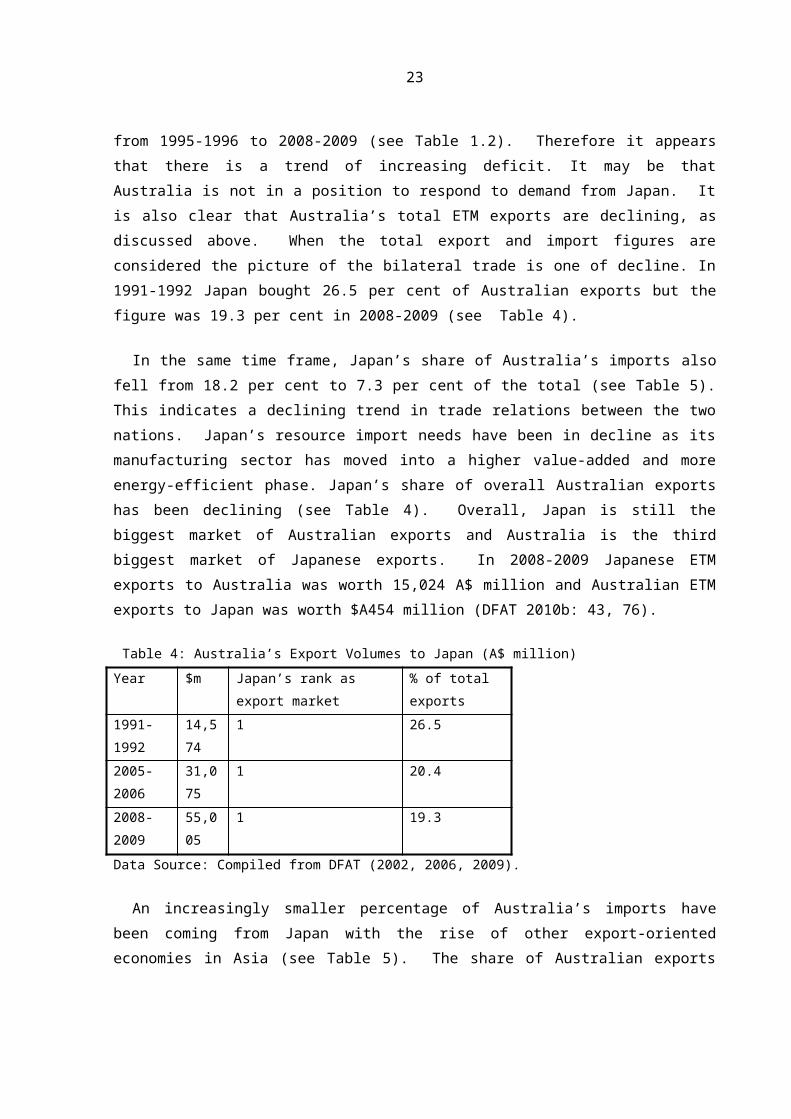
from 1995-1996 to 2008-2009 (see Table 1.2). Therefore it appearsthat there is a trend of increasing deficit. It may be thatAustralia is not in a position to respond to demand from Japan. Itis also clear that Australia’s total ETM exports are declining, asdiscussed above. When the total export and import figures areconsidered the picture of the bilateral trade is one of decline. In1991-1992 Japan bought 26.5 per cent of Australian exports but thefigure was 19.3 per cent in 2008-2009 (see Table 4).
In the same time frame, Japan’s share of Australia’s imports alsofell from 18.2 per cent to 7.3 per cent of the total (see Table 5).This indicates a declining trend in trade relations between the twonations. Japan’s resource import needs have been in decline as itsmanufacturing sector has moved into a higher value-added and moreenergy-efficient phase. Japan’s share of overall Australian exportshas been declining (see Table 4). Overall, Japan is still thebiggest market of Australian exports and Australia is the thirdbiggest market of Japanese exports. In 2008-2009 Japanese ETMexports to Australia was worth 15,024 A$ million and Australian ETMexports to Japan was worth $A454 million (DFAT 2010b: 43, 76).
Table 4: Australia’s Export Volumes to Japan (A$ million)Year $m Japan’s rank as
export market% of total exports
1991-1992
14,574
1 26.5
2005-2006
31,075
1 20.4
2008-2009
55,005
1 19.3
Data Source: Compiled from DFAT (2002, 2006, 2009).
An increasingly smaller percentage of Australia’s imports havebeen coming from Japan with the rise of other export-orientedeconomies in Asia (see Table 5). The share of Australian exports
23
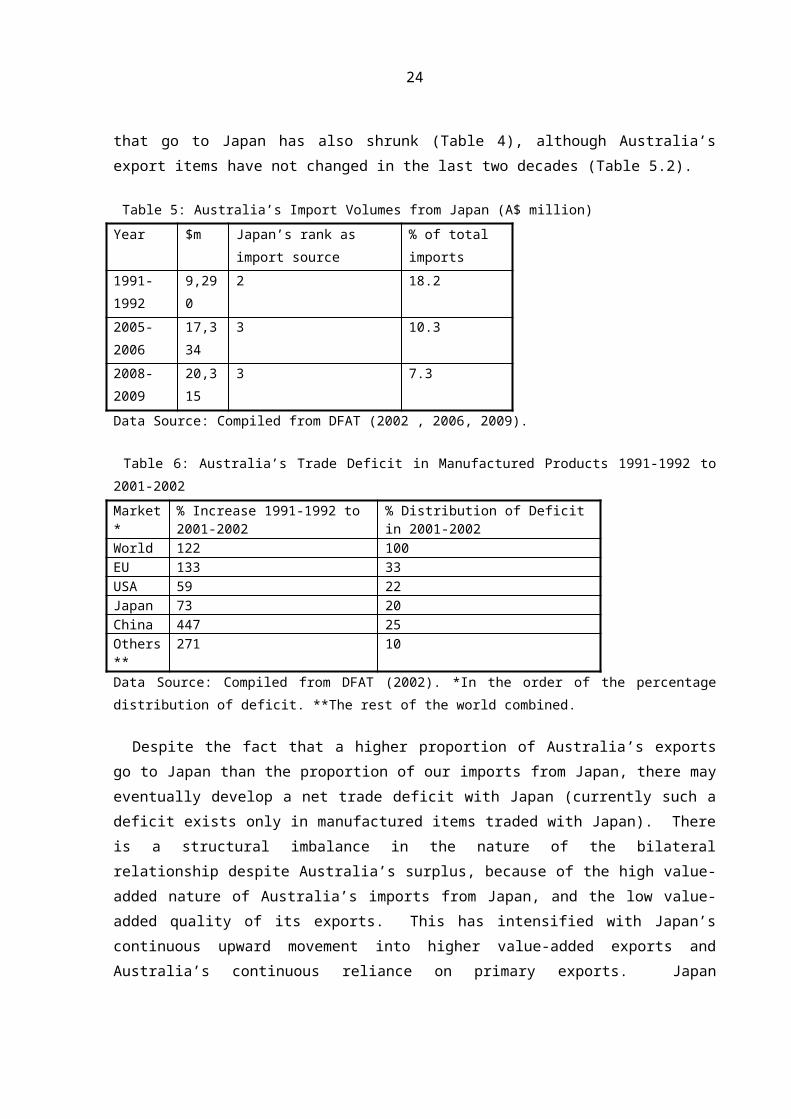
that go to Japan has also shrunk (Table 4), although Australia’sexport items have not changed in the last two decades (Table 5.2).
Table 5: Australia’s Import Volumes from Japan (A$ million)Year $m Japan’s rank as
import source% of total imports
1991-1992
9,290
2 18.2
2005-2006
17,334
3 10.3
2008-2009
20,315
3 7.3
Data Source: Compiled from DFAT (2002 , 2006, 2009).
Table 6: Australia’s Trade Deficit in Manufactured Products 1991-1992 to2001-2002Market*
Data Source: Compiled from DFAT (2002). *In the order of the percentagedistribution of deficit. **The rest of the world combined.
Despite the fact that a higher proportion of Australia’s exportsgo to Japan than the proportion of our imports from Japan, there mayeventually develop a net trade deficit with Japan (currently such adeficit exists only in manufactured items traded with Japan). Thereis a structural imbalance in the nature of the bilateralrelationship despite Australia’s surplus, because of the high value-added nature of Australia’s imports from Japan, and the low value-added quality of its exports. This has intensified with Japan’scontinuous upward movement into higher value-added exports andAustralia’s continuous reliance on primary exports. Japan
24
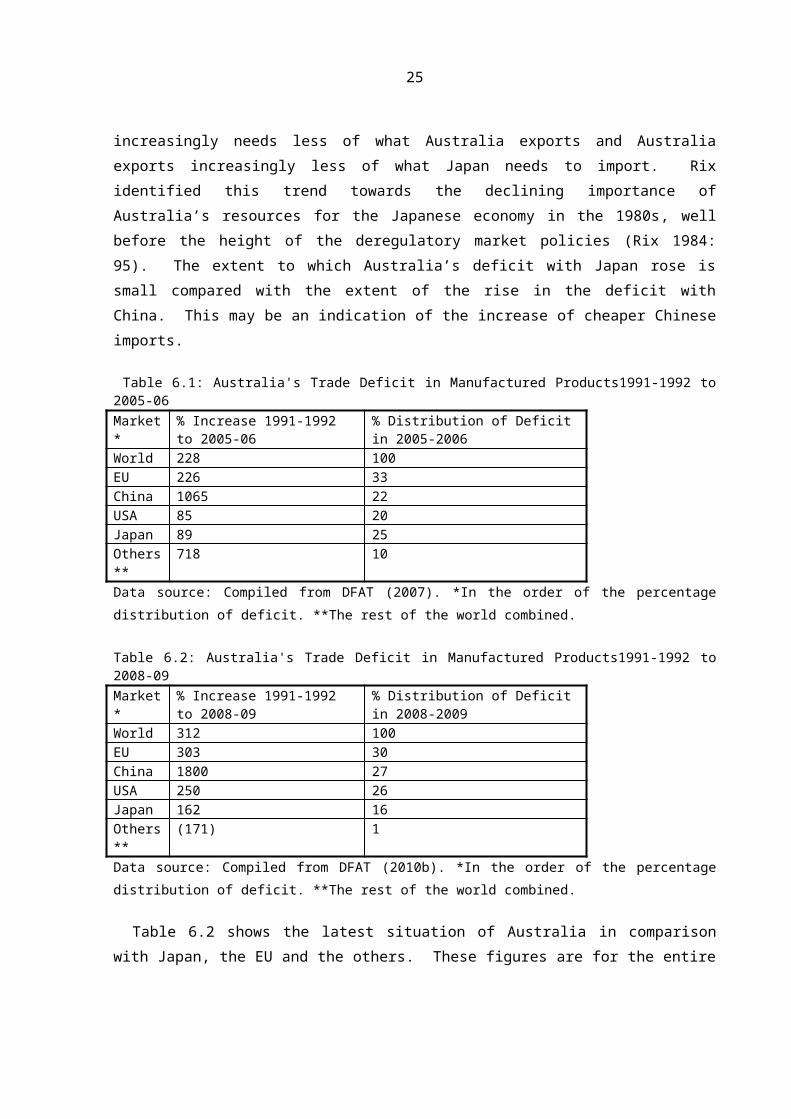
increasingly needs less of what Australia exports and Australiaexports increasingly less of what Japan needs to import. Rixidentified this trend towards the declining importance ofAustralia’s resources for the Japanese economy in the 1980s, wellbefore the height of the deregulatory market policies (Rix 1984:95). The extent to which Australia’s deficit with Japan rose issmall compared with the extent of the rise in the deficit withChina. This may be an indication of the increase of cheaper Chineseimports.
Table 6.1: Australia's Trade Deficit in Manufactured Products1991-1992 to2005-06Market*
Data source: Compiled from DFAT (2010b). *In the order of the percentagedistribution of deficit. **The rest of the world combined.
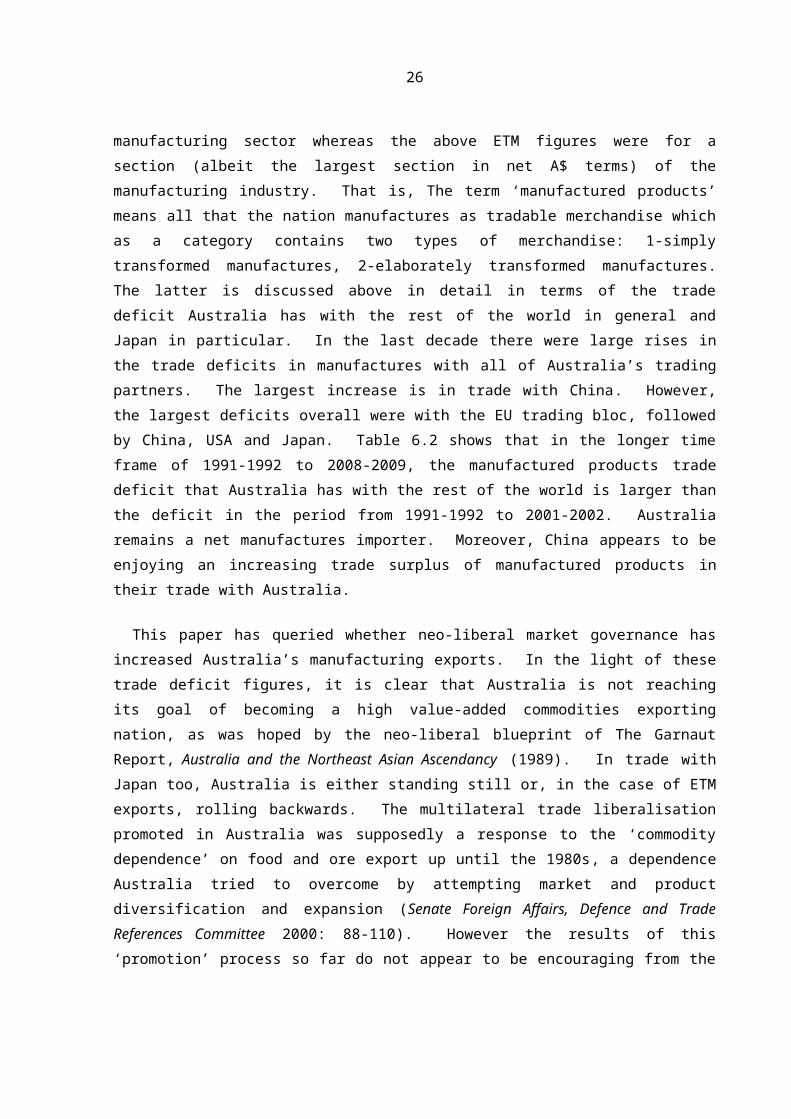
Table 6.2 shows the latest situation of Australia in comparisonwith Japan, the EU and the others. These figures are for the entire
25
manufacturing sector whereas the above ETM figures were for asection (albeit the largest section in net A$ terms) of themanufacturing industry. That is, The term ‘manufactured products’means all that the nation manufactures as tradable merchandise whichas a category contains two types of merchandise: 1-simplytransformed manufactures, 2-elaborately transformed manufactures.The latter is discussed above in detail in terms of the tradedeficit Australia has with the rest of the world in general andJapan in particular. In the last decade there were large rises inthe trade deficits in manufactures with all of Australia’s tradingpartners. The largest increase is in trade with China. However,the largest deficits overall were with the EU trading bloc, followedby China, USA and Japan. Table 6.2 shows that in the longer timeframe of 1991-1992 to 2008-2009, the manufactured products tradedeficit that Australia has with the rest of the world is larger thanthe deficit in the period from 1991-1992 to 2001-2002. Australiaremains a net manufactures importer. Moreover, China appears to beenjoying an increasing trade surplus of manufactured products intheir trade with Australia.
This paper has queried whether neo-liberal market governance hasincreased Australia’s manufacturing exports. In the light of thesetrade deficit figures, it is clear that Australia is not reachingits goal of becoming a high value-added commodities exportingnation, as was hoped by the neo-liberal blueprint of The GarnautReport, Australia and the Northeast Asian Ascendancy (1989). In trade withJapan too, Australia is either standing still or, in the case of ETMexports, rolling backwards. The multilateral trade liberalisationpromoted in Australia was supposedly a response to the ‘commoditydependence’ on food and ore export up until the 1980s, a dependenceAustralia tried to overcome by attempting market and productdiversification and expansion (Senate Foreign Affairs, Defence and TradeReferences Committee 2000: 88-110). However the results of this‘promotion’ process so far do not appear to be encouraging from the
26
point of view of the Australian market which, instead, has beensuffering trade deficits. There is a need to investigate thisdevelopment as part of a wider assessment of government policy onthe Australian market to establish whether the current state ofmarket performance (and hence the trade deficit in manufactures) istransitory or more in the nature of the capitalist market thatperforms at a less than optimum level when government assistance isinsufficient.
NOTES:1-A$ value calculations are based on current prices (i.e. notinflation adjusted).2-A$ values are for financial years (1 July-30 June).
BIBLIOGRAPHY
ABC Midday News 12:00 (2008) 7 February. New South Wales.
ABS 5204.0 (2010) Australian System of National Accounts 2009-2010. Canberra:Australian Bureau of Statistics.
ABS 5204.0 (2004) Australian System of National Accounts 2003-2004. Canberra:Australian Bureau of Statistics.
ABS 6202.0 (2003) Labour Force, Australia. Canberra: Australian Bureau ofStatistics.
ABS 6291.0 (2007) Labour Force-Detailed, Australia. Canberra: AustralianBureau of Statistics.
ABS 8221.0 (2006) Manufacturing Industry. Canberra. Australian Bureau ofStatistics.
ACTU (1987) Future Strategies for the Trade Union Movement. Canberra: AGPS.
27
ACTU-TDC Mission to Europe (1987) Australia Reconstructed. Canberra:AGPS.
AMC-Australian Manufacturing Council (1990) The Global Challenge: AustralianManufacturing in the 1990s. The Pappas Carter Evan Koop Report. Melbourne:AMC.
AMWU-Australian Manufacturing Workers’ Union (2003a) Submission to theSenate Foreign Affairs, Defence and Trade Committee Proposed Australia-United StatesFree Trade Agreement and General Agreement on Trade in Services. April.
AMWU-Australian Manufacturing Workers’ Union (2003b) ‘A PreliminaryAssessment of the Effect on Manufacturing in Australia’, pp. 31-38, in AMWU (2003) Submission to the Senate Foreign Affairs, Defence and TradeCommittee Proposed Australia-United States Free Trade Agreement and GeneralAgreement on Trade in Services. April.
Barbalet, J. M. (1998) ‘Business Confidence: A Macrosociology ofTime and Emotion’. Sociology Department. Faculty of Arts.Australian National University. Mimeo.
Barbalet, J. M. (2001) Emotion, Social Theory, and Social Structure. AMacrosociological Approach. Cambridge: Cambridge University Press.
Bayari, C. (2011) Japanese Hybrid Factories in Australia. The Japanese SystemTransferred. Berlin, London, Zurich: LIT Verlag.
Bayari, C. (2010) ‘Japanese Hybrid Factories in Australia: AnalysingLabor Relations and Reflecting on the Work of Tetsuo Abo’ Euro AsiaJournal of Management 39, 20(2): 111-134.
Bayari, C. (2008) ‘Japanese auto manufacturers in the Australianmarket and the government industry assistance spending’ OtemonJournal of Australian Studies 34: 87-107.
28
Beeson, M and S. Bell (2000) ‘Australia in the shadow of the AsianCrisis’, pp. 297-312 in R. Robison, M. Beeson, K. Jayasuriya andH. R. Kim (eds) Politics and Markets in the Wake of the Asian Crisis. Londonand New York: Routledge.
Beilharz, P. (1994) Transforming Labor Labour Tradition and the Labor Decade inAustralia. Melbourne: Cambridge University Press.
Capling, A. and B. Calligan (1992) Beyond the Protective State: The PoliticalEconomy of Australia’s Manufacturing Industry. Cambridge: CambridgeUniversity Press.
Carson, E., A. Jamrozik and T. Winefield (eds) (1998) Unemployment:Economic Promise and Political Will. Brisbane: Australian Economic Press.
Costa, M. and M. Duffy (1983) Labor, Prosperity and the Nineties. Beyond theBonsai Economy. Sydney: Federation Press.
Department of Innovation, Industry, Science and Research (2009)Automotive Supply Chain Development Program. Canberra: Commonwealth ofAustralia.
DFAT (2010a) Australia Fact Sheet, Japan Fact Sheet.
DFAT (2010b) Exports of Primary and Manufactured Goods 2008-2009. MarketInformation and Analysis Section. Canberra: DFAT.
DFAT (2009) Composition of Trade Australia 2008-09. Market Information andAnalysis Section. Canberra: DFAT.
DFAT (2007) Exports of Primary and Manufactured Goods 2005-2006. MarketInformation and Analysis Section. Canberra: DFAT.
DFAT (2006) Composition of Trade Australia 2005-2006. Market Information andAnalysis Section. Canberra: DFAT.
29
DFAT (2002) Exports of Primary and Manufactured Goods 2001-2002. MarketInformation and Analysis Section. Canberra: DFAT.
Fagan, R. H, and M. Webber (1999) Global Restructuring The AustralianExperience. Oxford: Oxford University Press.
Garnaut, R. (1989) Australia and the Northeast Asian Ascendancy. Canberra:Australian Government Publishing Service.
Grabel, I. (2002) ‘Neoliberal Finance and the Crisis in theDeveloping World’ Monthly Review 53(11) April: 34-47.
Higgott, R. and R. Robison (eds) (1985) South East Asia: Essays in The PoliticalEconomy of Structural Change. Routledge Kegan Paul: London.
The Japan Times (2000) ‘MMC to support Australian unit's capitalincrease’ November 29: 14.
Jones, E. (2002) ‘The Ascendancy of an Idealist Economics inAustralia’ Journal of Australian Political Economy 50: 44-71.
Jones, E. (2000) ‘The Howard Government’s Industry Policy’ EconomicPapers 19(3): 60-75.
Lucarelli, B. (2003) ‘Deindustrialisation under Labor: 1983-1996’Journal of Australian Political Economy 51: 77-102.
Maiden, S. (2003) ‘Schools dump dirt on blue collar trades’, TheAustralian November 7: 4.
Marris, S, (2002) ‘Drip-fed rebates power industry’ The WeekendAustralian, December 14-15: 4.
Pinkstone, B. (1992) Global Connections: A History of Exports and the AustralianEconomy Canberra: AGPS.
Review of Australia’s Automotive Industry Final Report (2008).Canberra: Commonwealth of Australia.
Rix, A. (1984) ‘National Power and Japanese Foreign Policy’, pp. 85-101 in A. Rix and R. Mouer (eds) Japan's Impact on the World. Nathan,Qld: JSAA.
Robison, R., K. Hewison and R. Higgott (1987) South East Asia in the 1980s,The Politics of Economic Crisis. Sydney: Allen Unwin.
Rodan, G. and K. Hewison and R. Robison (eds) (1997) The PoliticalEconomy of South East Asia. Oxford: Oxford University Press.
Sheehan, P. J. and N. Pappas and E. Cheng (1994) The Rebirth of AustralianIndustry: Australian Trade in Elaborately Transformed Manufactures. Centre forStrategic Economic Studies. Melbourne: University of Melbourne.
Senate Foreign Affairs, Defence and Trade References Committee(2000) Japan's Economy, Implications for Australia. Report 1 of the Senate ForeignAffairs, Defence and Trade References Committee. Canberra: The Parliament ofthe Commonwealth of Australia.
31
Stiglitz, J. (2002) Globalisation and its Discontents. London: Penguin.
Toner, P. (2004) ‘Manufacturing Industry in the Australian Economy’Journal of Australian Political Economy 45: 18-45.
Weiss, L. (1998) The Myth of the Powerless State. London: Polity Press.
Weller, S. and M. Webber (2001) ‘Precarious employment andoccupational change’, pp. 160-195 in Borland, J., B. Gregory & P.Sheehan (eds) Work Rich, Work Poor, Inequality and economic change in Australia.Melbourne: Centre for Strategic Economic Studies.
Wheelwright, E. L. (1978) Capitalism. Sydney: ANZ Book Co.
CITATION
Bayari, Celal (2011) Manufacturing, Market Policy andExports in Australia: Emulating the East AsianEconomic Miracle? East Asia: Comparative Perspective. 10(1):7-32. ISSN 1975 6135.