44
For updated information, please visit www.ibef.org March 2022 OIL & GAS
| Date post: | 04-Apr-2023 |
| Category: |
Documents |
| Upload: | khangminh22 |
| View: | 0 times |
| Download: | 0 times |
For updated information, please visit www.ibef.org
March 2022
OIL & GAS
2
Executive Summary 3
Advantage India 4
Market Overview and Trends 6
Sector Drivers 9
Recent Trends and Strategies 24
Growth Drivers 30
Opportunities 36
Key Industry Contacts 38
Appendix 40
Table of Contents
3
Executive summary
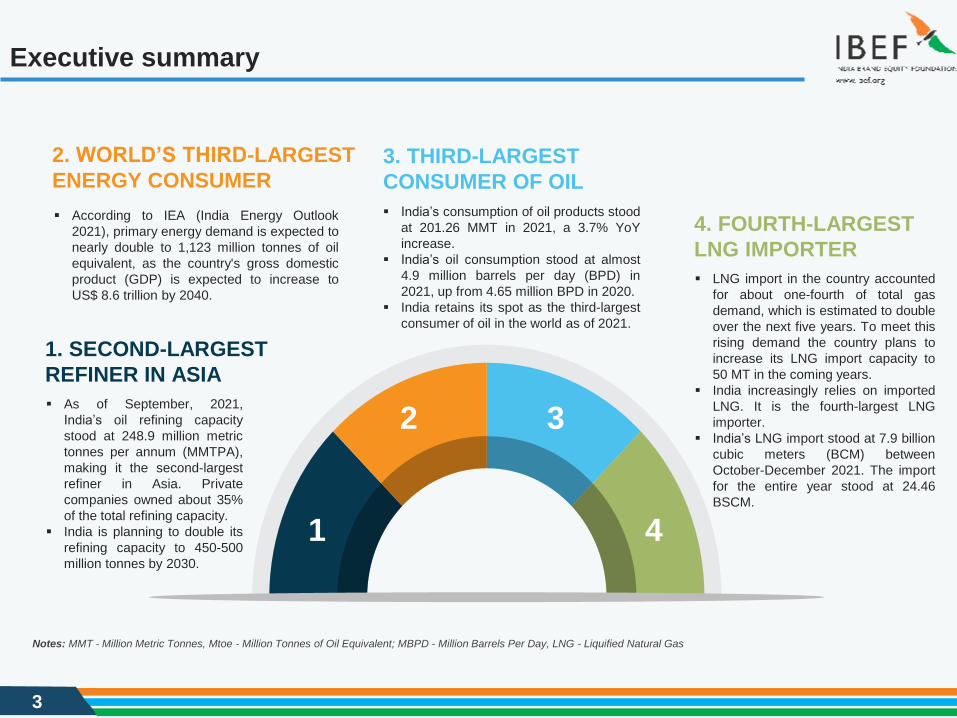
4. FOURTH-LARGEST
LNG IMPORTER
▪ LNG import in the country accounted
for about one-fourth of total gas
demand, which is estimated to double
over the next five years. To meet this
rising demand the country plans to
increase its LNG import capacity to
50 MT in the coming years.
▪ India increasingly relies on imported
LNG. It is the fourth-largest LNG
importer.
▪ India’s LNG import stood at 7.9 billion
cubic meters (BCM) between
October-December 2021. The import
for the entire year stood at 24.46
BSCM.
1. SECOND-LARGEST
REFINER IN ASIA
▪ As of September, 2021,
India’s oil refining capacity
stood at 248.9 million metric
tonnes per annum (MMTPA),
making it the second-largest
refiner in Asia. Private
companies owned about 35%
of the total refining capacity.
▪ India is planning to double its
refining capacity to 450-500
million tonnes by 2030.
3. THIRD-LARGEST
CONSUMER OF OIL
▪ India’s consumption of oil products stood
at 201.26 MMT in 2021, a 3.7% YoY
increase.
▪ India’s oil consumption stood at almost
4.9 million barrels per day (BPD) in
2021, up from 4.65 million BPD in 2020.
▪ India retains its spot as the third-largest
consumer of oil in the world as of 2021.
2. WORLD’S THIRD-LARGEST
ENERGY CONSUMER
▪ According to IEA (India Energy Outlook
2021), primary energy demand is expected to
nearly double to 1,123 million tonnes of oil
equivalent, as the country's gross domestic
product (GDP) is expected to increase to
US$ 8.6 trillion by 2040.
1
2 3
4
Notes: MMT - Million Metric Tonnes, Mtoe - Million Tonnes of Oil Equivalent; MBPD - Million Barrels Per Day, LNG - Liquified Natural Gas
4
Advantage India
5
Advantage India
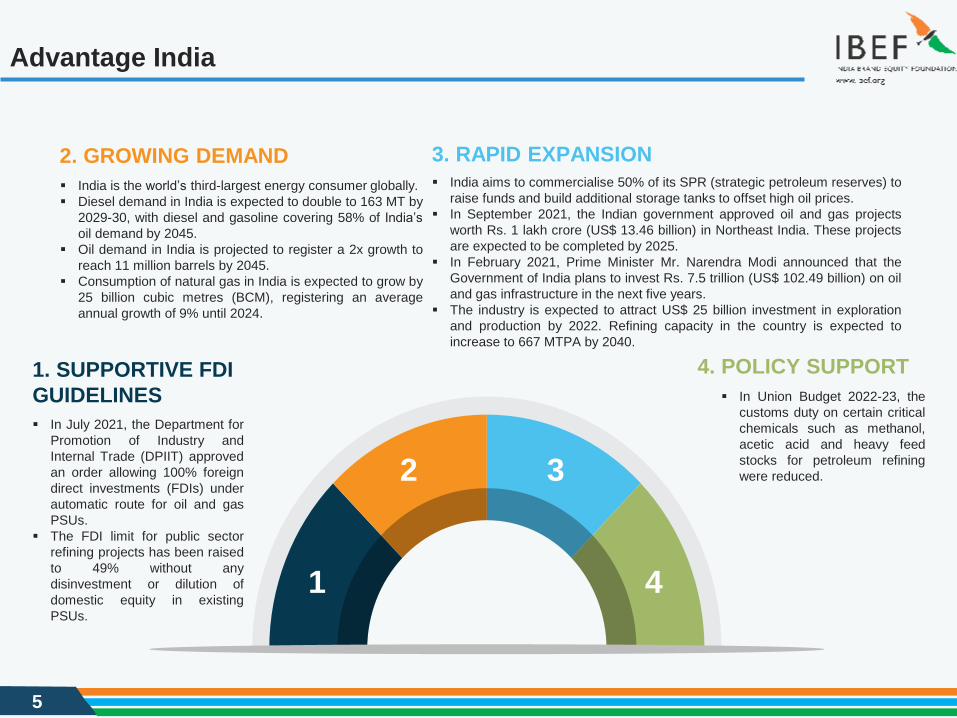
4. POLICY SUPPORT
▪ In Union Budget 2022-23, the
customs duty on certain critical
chemicals such as methanol,
acetic acid and heavy feed
stocks for petroleum refining
were reduced.
1. SUPPORTIVE FDI
GUIDELINES
▪ In July 2021, the Department for
Promotion of Industry and
Internal Trade (DPIIT) approved
an order allowing 100% foreign
direct investments (FDIs) under
automatic route for oil and gas
PSUs.
▪ The FDI limit for public sector
refining projects has been raised
to 49% without any
disinvestment or dilution of
domestic equity in existing
PSUs.
3. RAPID EXPANSION
▪ India aims to commercialise 50% of its SPR (strategic petroleum reserves) to
raise funds and build additional storage tanks to offset high oil prices.
▪ In September 2021, the Indian government approved oil and gas projects
worth Rs. 1 lakh crore (US$ 13.46 billion) in Northeast India. These projects
are expected to be completed by 2025.
▪ In February 2021, Prime Minister Mr. Narendra Modi announced that the
Government of India plans to invest Rs. 7.5 trillion (US$ 102.49 billion) on oil
and gas infrastructure in the next five years.
▪ The industry is expected to attract US$ 25 billion investment in exploration
and production by 2022. Refining capacity in the country is expected to
increase to 667 MTPA by 2040.
2. GROWING DEMAND
▪ India is the world’s third-largest energy consumer globally.
▪ Diesel demand in India is expected to double to 163 MT by
2029-30, with diesel and gasoline covering 58% of India’s
oil demand by 2045.
▪ Oil demand in India is projected to register a 2x growth to
reach 11 million barrels by 2045.
▪ Consumption of natural gas in India is expected to grow by
25 billion cubic metres (BCM), registering an average
annual growth of 9% until 2024.
1
2 3
4
6
Market Overview And Trends
7
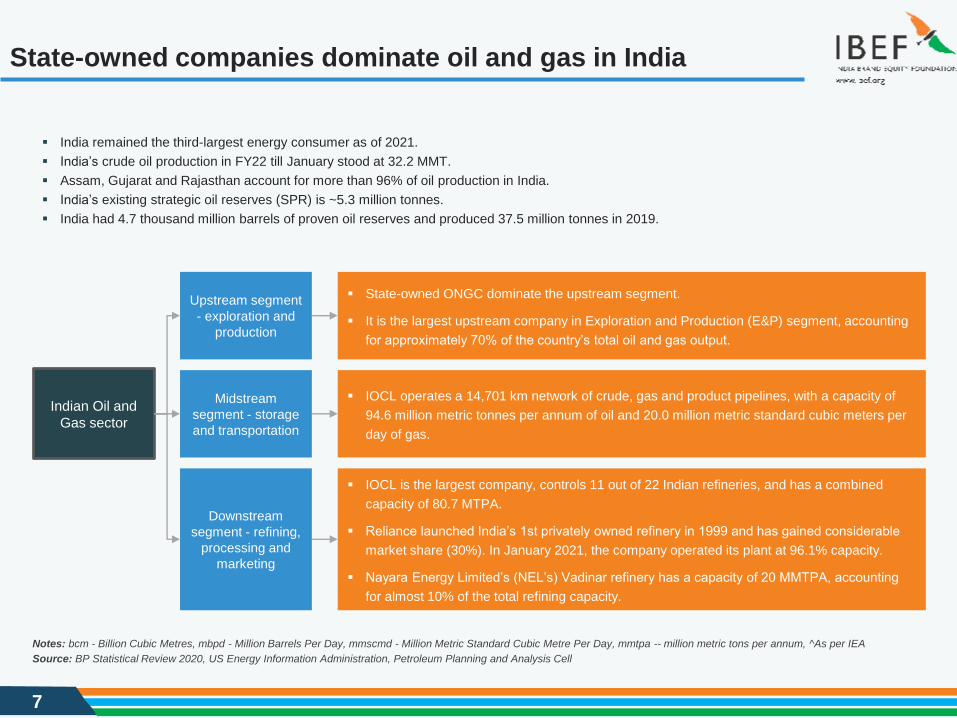
State-owned companies dominate oil and gas in India
▪ India remained the third-largest energy consumer as of 2021.
▪ India’s crude oil production in FY22 till January stood at 32.2 MMT.
▪ Assam, Gujarat and Rajasthan account for more than 96% of oil production in India.
▪ India’s existing strategic oil reserves (SPR) is ~5.3 million tonnes.
▪ India had 4.7 thousand million barrels of proven oil reserves and produced 37.5 million tonnes in 2019.
▪ State-owned ONGC dominate the upstream segment.
▪ It is the largest upstream company in Exploration and Production (E&P) segment, accounting
for approximately 70% of the country’s total oil and gas output.
▪ IOCL operates a 14,701 km network of crude, gas and product pipelines, with a capacity of
94.6 million metric tonnes per annum of oil and 20.0 million metric standard cubic meters per
day of gas.
▪ IOCL is the largest company, controls 11 out of 22 Indian refineries, and has a combined
capacity of 80.7 MTPA.
▪ Reliance launched India’s 1st privately owned refinery in 1999 and has gained considerable
market share (30%). In January 2021, the company operated its plant at 96.1% capacity.
▪ Nayara Energy Limited’s (NEL’s) Vadinar refinery has a capacity of 20 MMTPA, accounting
for almost 10% of the total refining capacity.
Indian Oil and
Gas sector
Upstream segment
- exploration and
production
Midstream
segment - storage
and transportation
Downstream
segment - refining,
processing and
marketing
Source: BP Statistical Review 2020, US Energy Information Administration, Petroleum Planning and Analysis Cell
Notes: bcm - Billion Cubic Metres, mbpd - Million Barrels Per Day, mmscmd - Million Metric Standard Cubic Metre Per Day, mmtpa -- million metric tons per annum, ^As per IEA
8
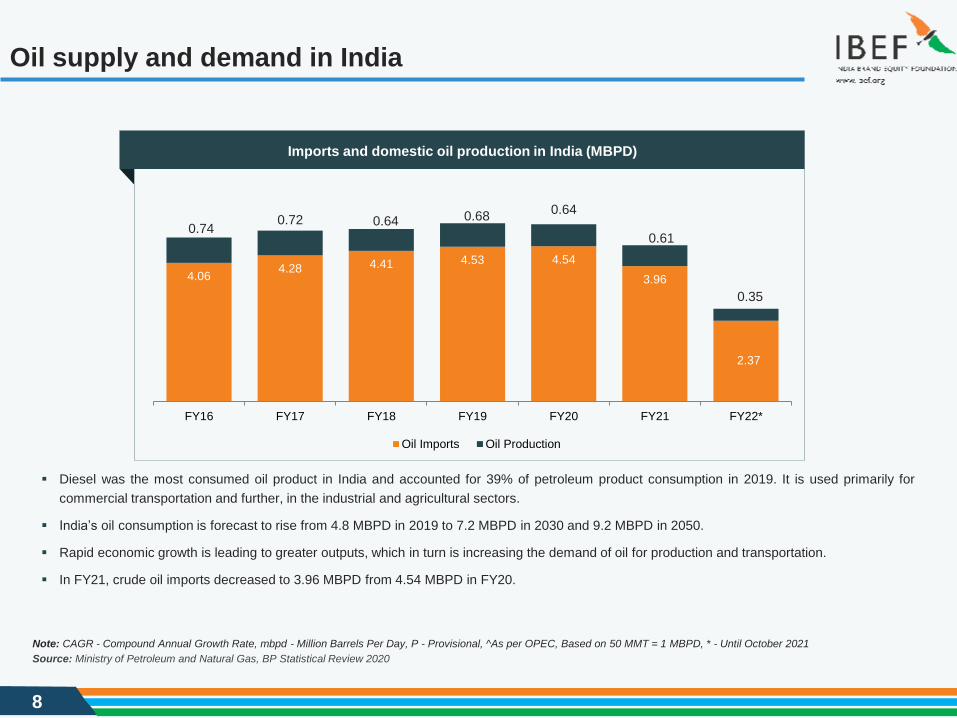
Oil supply and demand in India
Source: Ministry of Petroleum and Natural Gas, BP Statistical Review 2020
Note: CAGR - Compound Annual Growth Rate, mbpd - Million Barrels Per Day, P - Provisional, ^As per OPEC, Based on 50 MMT = 1 MBPD, * - Until October 2021
▪ Diesel was the most consumed oil product in India and accounted for 39% of petroleum product consumption in 2019. It is used primarily for
commercial transportation and further, in the industrial and agricultural sectors.
▪ India’s oil consumption is forecast to rise from 4.8 MBPD in 2019 to 7.2 MBPD in 2030 and 9.2 MBPD in 2050.
▪ Rapid economic growth is leading to greater outputs, which in turn is increasing the demand of oil for production and transportation.
▪ In FY21, crude oil imports decreased to 3.96 MBPD from 4.54 MBPD in FY20.
Imports and domestic oil production in India (MBPD)
4.064.28 4.41 4.53 4.54
3.96
2.37
0.740.72 0.64 0.68
0.64
0.61
0.35
FY16 FY17 FY18 FY19 FY20 FY21 FY22*
Oil Imports Oil Production

9
Sector Drivers
10
Gas supply and demand in India
64
,45
1
57
,36
7
52
,37
5
51
,30
0
52
,51
7
55
,69
7
59
,17
0
60
,79
8
64
,14
4
60
,64
5
38
,33
5
0
10000
20000
30000
40000
50000
60000
70000
FY
12
FY
13
FY
14
FY
15
FY
16
FY
17
FY
18
FY
19
FY
20
FY
21
FY
22*
Source: PPAC, BP Statistical Review 2020
Note: F - Forecast, bcm - Billion Cubic Metres, CAGR - Compound Annual Growth Rate, * - Until October 2021
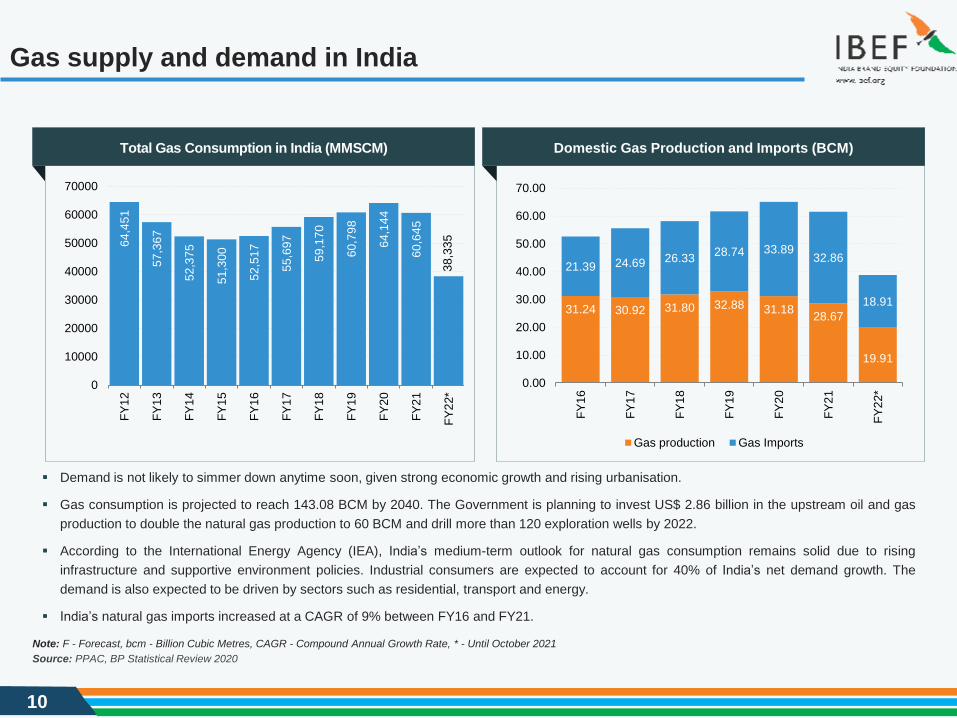
▪ Demand is not likely to simmer down anytime soon, given strong economic growth and rising urbanisation.
▪ Gas consumption is projected to reach 143.08 BCM by 2040. The Government is planning to invest US$ 2.86 billion in the upstream oil and gas
production to double the natural gas production to 60 BCM and drill more than 120 exploration wells by 2022.
▪ According to the International Energy Agency (IEA), India’s medium-term outlook for natural gas consumption remains solid due to rising
infrastructure and supportive environment policies. Industrial consumers are expected to account for 40% of India’s net demand growth. The
demand is also expected to be driven by sectors such as residential, transport and energy.
▪ India’s natural gas imports increased at a CAGR of 9% between FY16 and FY21.
Total Gas Consumption in India (MMSCM) Domestic Gas Production and Imports (BCM)
31.24 30.92 31.80 32.88 31.1828.67
19.91
21.39 24.69 26.3328.74 33.89
32.86
18.91
0.00
10.00
20.00
30.00
40.00
50.00
60.00
70.00
FY
16
FY
17
FY
18
FY
19
FY
20
FY
21
FY
22*
Gas production Gas Imports
11
Exports of petroleum products from India
60.5
65.5 66.8
61.165.7
56.8
34.9
0
10
20
30
40
50
60
70
80
FY
16
FY
17
FY
18
FY
19
FY
20
FY
21
FY
22*
Source: PPAC, BP Statistical Review 2020
Note: MMT - Million Metric Tonnes, P - Provisional, HSD - High speed Diesel, MS - Motor Spirit, ATF - Aviation Turbine Fuel, LPG - Liquefied Petroleum Gas, LDO - Light Diesel Oil, SKO -
Superior Kerosene Oil, LOBS - Lubricating Oil Base Stocks, ^Others includes Hexane, Benzene, MTO (Mineral Turpentine Oil), Sulphur, etc, *- Until October 2021
28
7
7,1
74
3,8
83
2,5
85
8
18
,21
0
- 2 1
,20
4
6
12
7
1,4
18
0
2,000
4,000
6,000
8,000
10,000
12,000
14,000
16,000
18,000
20,000
LP
G
MS
!
Na
phth
a$
AT
F#
SK
O
HS
D
LD
O
LO
BS
/ L
ub
e O
il
Fu
el O
il
Bitum
en
Pe
tco
ke
/ C
BF
S
Oth
ers
%
Product-wise Exports of Petroleum Products from India in FY22*
(thousand metric tonnes)
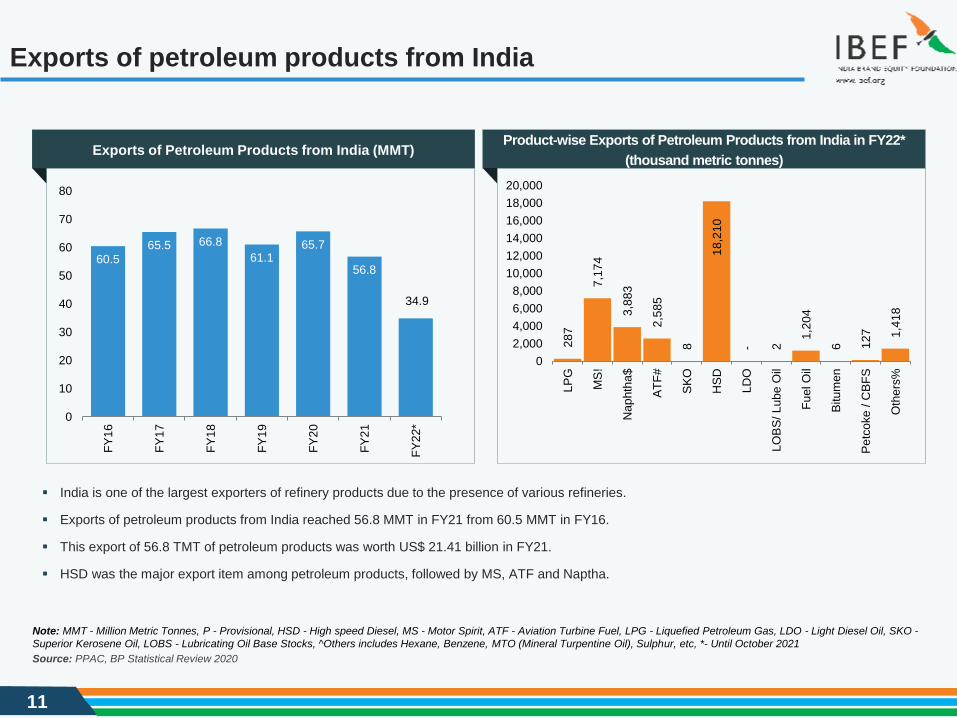
▪ India is one of the largest exporters of refinery products due to the presence of various refineries.
▪ Exports of petroleum products from India reached 56.8 MMT in FY21 from 60.5 MMT in FY16.
▪ This export of 56.8 TMT of petroleum products was worth US$ 21.41 billion in FY21.
▪ HSD was the major export item among petroleum products, followed by MS, ATF and Naptha.
Exports of Petroleum Products from India (MMT)
12
Upstream segment: crude oil and gas production… (1/2)
Source: Ministry of Petroleum and Natural Gas
Notes: MMT - Million Metric Tonne, JV - Joint Venture, P-Provisional, * - Until October 2021
Crude Oil Production (in MMT)
17.9 17.6 17.5 17.516.2
15.1
8.9
19.118.4 18.1 18.1
16.015.4
8.5
-
5
10
15
20
25
30
35
40
FY16 FY17 FY18 FY19 FY20 FY21 FY22*
Onshore Offshore
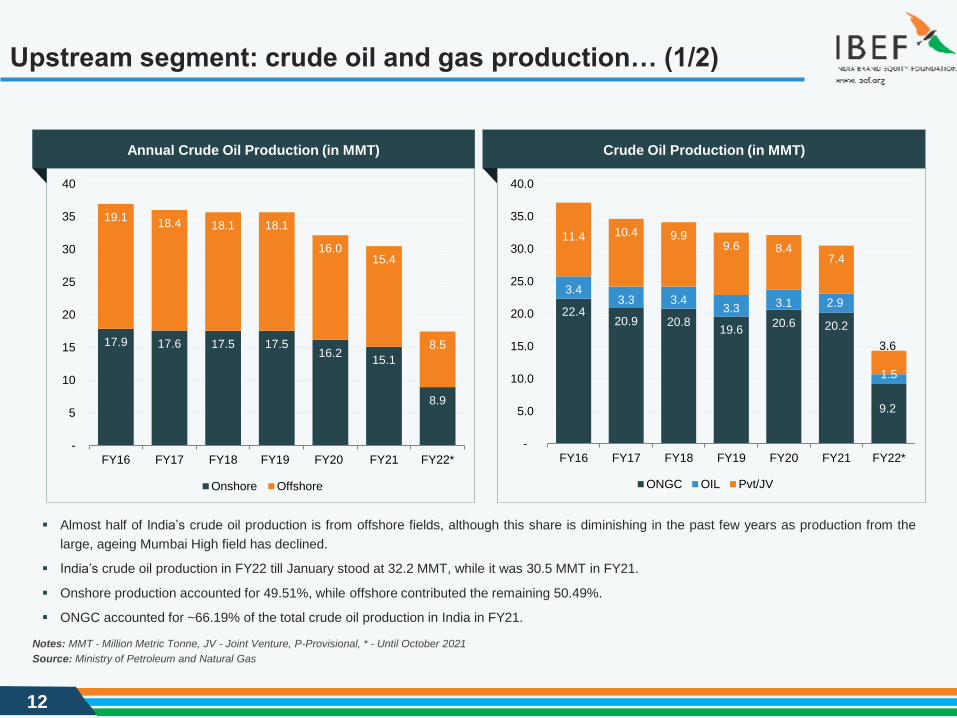
▪ Almost half of India’s crude oil production is from offshore fields, although this share is diminishing in the past few years as production from the
large, ageing Mumbai High field has declined.
▪ India’s crude oil production in FY22 till January stood at 32.2 MMT, while it was 30.5 MMT in FY21.
▪ Onshore production accounted for 49.51%, while offshore contributed the remaining 50.49%.
▪ ONGC accounted for ~66.19% of the total crude oil production in India in FY21.
22.420.9 20.8
19.620.6 20.2
9.2
3.43.3 3.4
3.3 3.1 2.9
1.5
11.4 10.4 9.99.6 8.4
7.4
3.6
-
5.0
10.0
15.0
20.0
25.0
30.0
35.0
40.0
FY16 FY17 FY18 FY19 FY20 FY21 FY22*
ONGC OIL Pvt/JV
Annual Crude Oil Production (in MMT)
13
Upstream segment: crude oil and gas production… (2/2)
Source: Ministry of Petroleum and Natural Gas
Note: JV - Joint Venture, ^Including CBM production, * - Until October 2021
8,5
77
.0
9,0
83
.8
8,8
76
.9
9,0
11
.7
8,7
95
.6
9,2
37
.5
9,2
93
.9
9,9
03
.9
10
,04
5.8
9,8
93
.4
9,6
01
.0
4,2
79
.0
43
,64
5.1
38
,47
4.8
31
,80
2.3
26
,39
5.2
24
,86
0.6
23
,01
1.7
22
,03
8.2
22
,01
0.6
22
,11
7.1
20
,63
1.1
18
,42
7.2
9,4
19
.2
0
5,000
10,000
15,000
20,000
25,000
30,000
35,000
40,000
45,000
50,000
FY
11
FY
12
FY
13
FY
14
FY
15
FY
16
FY
17
FY
18
FY
19
FY
20
FY
21
FY
22
Onshore^ Offshore2
1,1
77
22
,08
8
23
,42
9
24
,67
5
23
,74
6
21
,87
2
12,057
8,235 6,872 6,338 5,477
4,766
4,319
6,150
2,838 2,937 2,881 2,722
2,668
2,480
1,701
-
5,000
10,000
15,000
20,000
25,000
30,000
35,000
FY16 FY17 FY18 FY19 FY20 FY21 FY22*
ONGC Pvt/JV OIL
Annual Gas Production (million metric standard cubic metre)Annual Gas Production (million metric standard cubic metre)
14
Upstream segment: exploration and development activities
59
85
149
266
0
50
100
150
200
250
300
350
400
Offshore Onshore
Wells Meterage ('000 metres)
Source: Ministry of Petroleum and Natural Gas, BMI
Notes: P- Provisional, *OALP - Open Acreage Licensing Policy
63
338
165
649
0
200
400
600
800
1000
1200
Offshore Onshore
Wells Meterage ('000 metres)
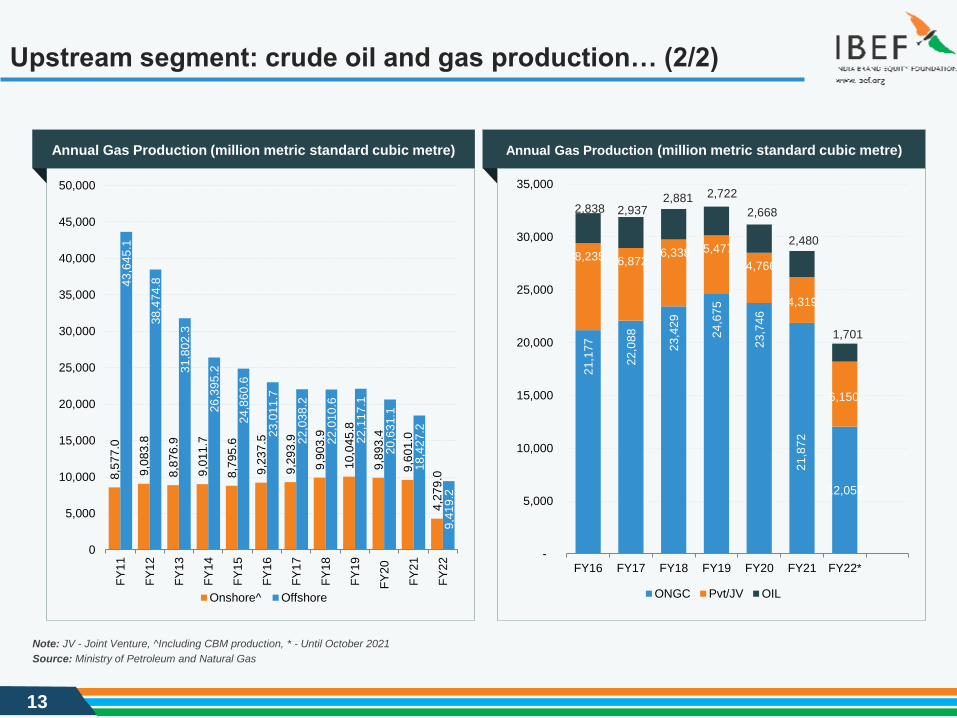
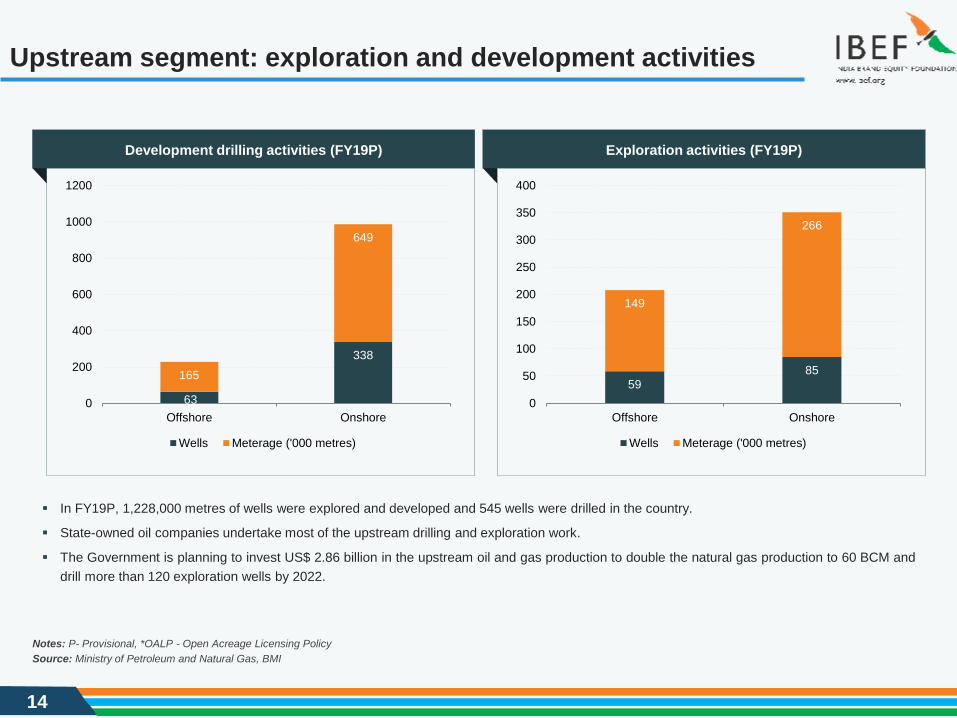
▪ In FY19P, 1,228,000 metres of wells were explored and developed and 545 wells were drilled in the country.
▪ State-owned oil companies undertake most of the upstream drilling and exploration work.
▪ The Government is planning to invest US$ 2.86 billion in the upstream oil and gas production to double the natural gas production to 60 BCM and
drill more than 120 exploration wells by 2022.
Development drilling activities (FY19P) Exploration activities (FY19P)
15
Pipelines: crude pipeline network
40.97%
32.86%
6.09%
20.08%
ONGC
IOC
OIL
Others*
50.88%
11.45%
12.31%
25.36%
IOCL
OIL
ONGC
Others*
Source: Ministry of Petroleum and Natural Gas
Note: km - Kilometre, mmtpa - Million Metric Tonnes Per Annum, *Others includes HMEL, BPCL and Cairn
Shares in Crude Pipeline Network by Capacity
(out of 147.9 mmtpa, as of November 01, 2021)
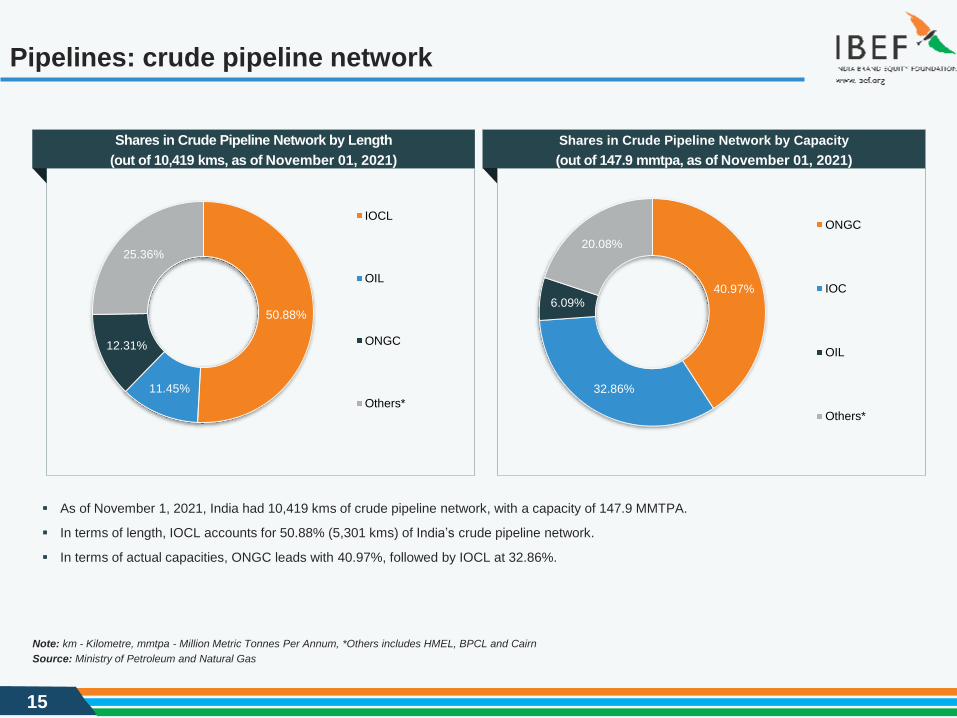
▪ As of November 1, 2021, India had 10,419 kms of crude pipeline network, with a capacity of 147.9 MMTPA.
▪ In terms of length, IOCL accounts for 50.88% (5,301 kms) of India’s crude pipeline network.
▪ In terms of actual capacities, ONGC leads with 40.97%, followed by IOCL at 32.86%.
Shares in Crude Pipeline Network by Length
(out of 10,419 kms, as of November 01, 2021)
16
Pipelines: existing pipelines in India
IOCL BPCL(1) HPCL(2) OIL ONGC Cairn HMEL Others (GAIL and Petronet India.) Total industry
Length (kms)
Product
Pipeline9,400 2,596 3,775 654 - - - 2,395 18,820
Crude oil
Pipeline5,301 937 - 1,193 1,283 688 1,017 - 10,419
Total 14,701 3,533 3,775 1,847 1,283 688 1,017 2,395 29,239
Capacity of Crude Oil Pipelines (mmtpa)
Product
Pipeline47.5 23.0 34.1 1.7 - - - 9.4 115.7
Crude oil
Pipeline48.6 7.8 - 9 60.6 10.7 11.3 - 147.9
Total 96.1 50.3 34.1 10.7 60.6 10.7 11.3 9.4 263.6
Source: Ministry of Petroleum and Natural Gas
Note: kms - Kilometres, mmtpa - Million Metric Tonnes Per Annum, (1)Includes Petronet Cochin-Coimbatore-Karur Product pipeline, (2)Includes Petronet Mangalore-Hassan-Bangalore
Product Pipeline
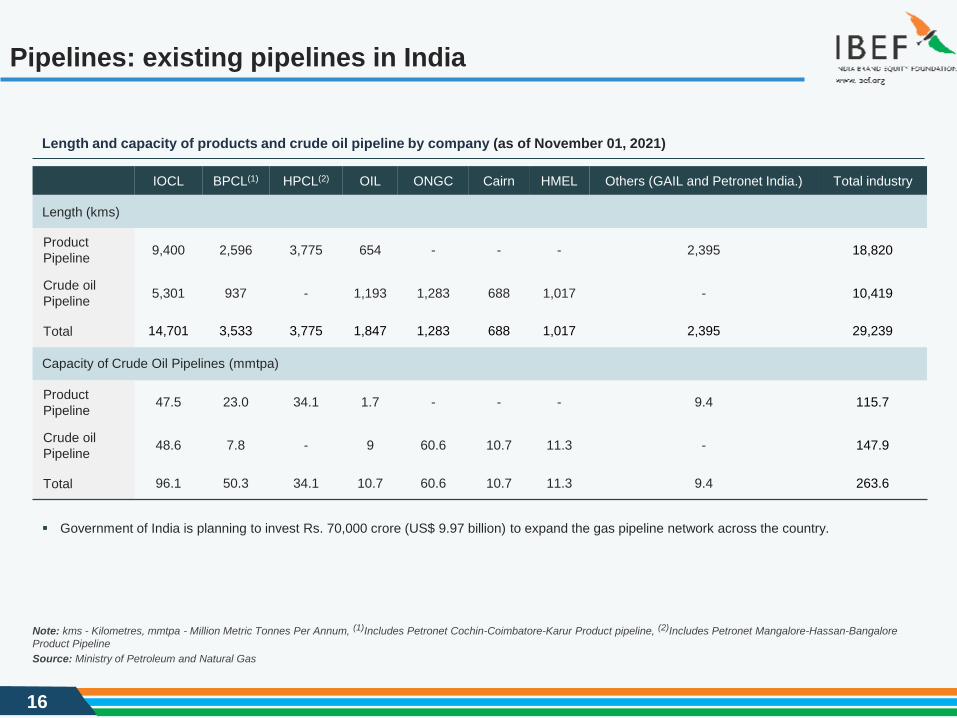
Length and capacity of products and crude oil pipeline by company (as of November 01, 2021)
▪ Government of India is planning to invest Rs. 70,000 crore (US$ 9.97 billion) to expand the gas pipeline network across the country.
17
Pipelines: refined products and LPG pipeline network
57.56%
8.19%
6.92%
4.78%
4.46%
18.08%GAIL
GIGL
GSPL
IOCL
PIL
Others
49.95%
20.06%
13.79%
3.48%
12.73%
IOC
HPCL
BPCL
OIL
Others
Source: Ministry of Petroleum and Natural Gas
Shares in Products Pipeline Network under Operation by
Length (out of 18,820 kms, as of November 01, 2021)
Shares in products pipeline network under operation by length
(out of 25,110 kms as of June 31, 2021)
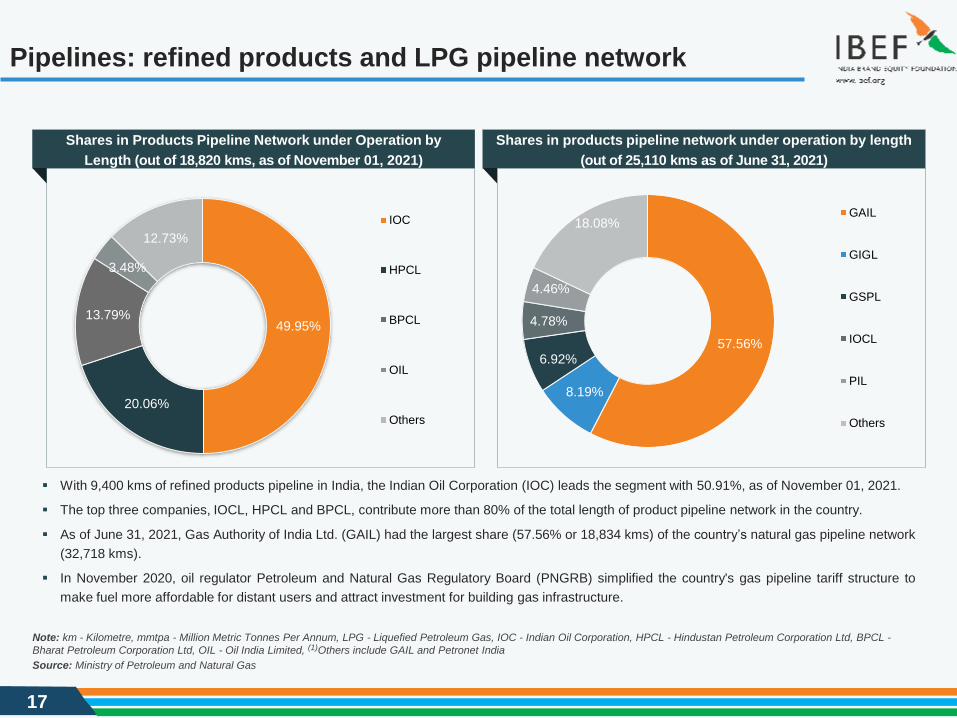
▪ With 9,400 kms of refined products pipeline in India, the Indian Oil Corporation (IOC) leads the segment with 50.91%, as of November 01, 2021.
▪ The top three companies, IOCL, HPCL and BPCL, contribute more than 80% of the total length of product pipeline network in the country.
▪ As of June 31, 2021, Gas Authority of India Ltd. (GAIL) had the largest share (57.56% or 18,834 kms) of the country’s natural gas pipeline network
(32,718 kms).
▪ In November 2020, oil regulator Petroleum and Natural Gas Regulatory Board (PNGRB) simplified the country's gas pipeline tariff structure to
make fuel more affordable for distant users and attract investment for building gas infrastructure.
Note: km - Kilometre, mmtpa - Million Metric Tonnes Per Annum, LPG - Liquefied Petroleum Gas, IOC - Indian Oil Corporation, HPCL - Hindustan Petroleum Corporation Ltd, BPCL -
Bharat Petroleum Corporation Ltd, OIL - Oil India Limited, (1)Others include GAIL and Petronet India
18
Downstream segment: refinery crude throughput… (1/2)
108.03 112.5 112.17 112.13 115.11 122.58 130.57 134.22 134.73144.20
154.30 160.77 169.16 164.80143.80
84.10
33.43 38.2948.54
74.4481.38 81.18
88.27 88.23 88.5388.66
91.09 91.16 88.04 89.50
78.00
48.70
0
50
100
150
200
250
300
FY
07
FY
08
FY
09
FY
10
FY
11
FY
12
FY
13
FY
14
FY
15
FY
16
FY
17
FY
18
FY
19
FY
20
FY
21
FY
22*
Public sector Private sector
Source: Ministry of Petroleum and Natural Gas
Note: MMT - Million Metric Tonne, Public Sector includes IOCL ,BPCL ,HPCL, CPCL and ONGC, Private sector includes RIL and NEL, * - Until November 01, 2021
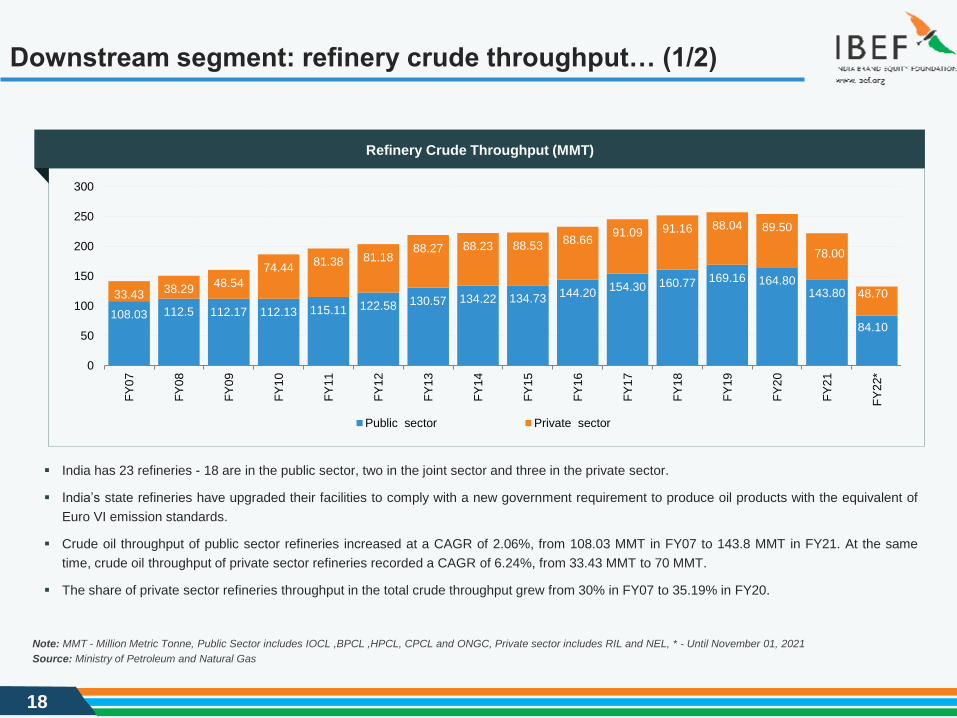
▪ India has 23 refineries - 18 are in the public sector, two in the joint sector and three in the private sector.
▪ India’s state refineries have upgraded their facilities to comply with a new government requirement to produce oil products with the equivalent of
Euro VI emission standards.
▪ Crude oil throughput of public sector refineries increased at a CAGR of 2.06%, from 108.03 MMT in FY07 to 143.8 MMT in FY21. At the same
time, crude oil throughput of private sector refineries recorded a CAGR of 6.24%, from 33.43 MMT to 70 MMT.
▪ The share of private sector refineries throughput in the total crude throughput grew from 30% in FY07 to 35.19% in FY20.
Refinery Crude Throughput (MMT)
19
28.23%
27.62%
14.30%
10.98%
8.10%
6.12%
4.66%IOC
RIL
BPCL
HPCL
NEL
ONGC
CPCL
Downstream segment: refinery crude throughput… (2/2)
11
6.8
9
12
0.0
7
12
0.0
7
12
0.0
7
12
0.0
7
13
5.0
7
13
9.0
0
14
2.1
0
14
2.0
7
16
1.7
0
16
2.1
0
15
8.7
076
.50
93
.00
95
.00
95
.00
95
.00
95
.00
95
.00
10
5.5
0
11
0.0
0
88
.20
88
.20
88
.20
0.00
50.00
100.00
150.00
200.00
250.00
300.00
Public sector Private sector (incl JV)
Source: Ministry of Petroleum and Natural Gas, PPAC
Total Installed Refinery Capacity (MMT)
Note: MMT - Million Metric Tonne; HPCL - Hindustan Petroleum Corporation Ltd, BPCL - Bharat Petroleum Corporation Ltd, OIL - Oil India Limited, ONGC - Oil and Natural Gas
Corporation, IOCL - Indian Oil Corporation Ltd, CPCL - Chennai Petroleum Corporation Limited, * - Until November 01, 2021
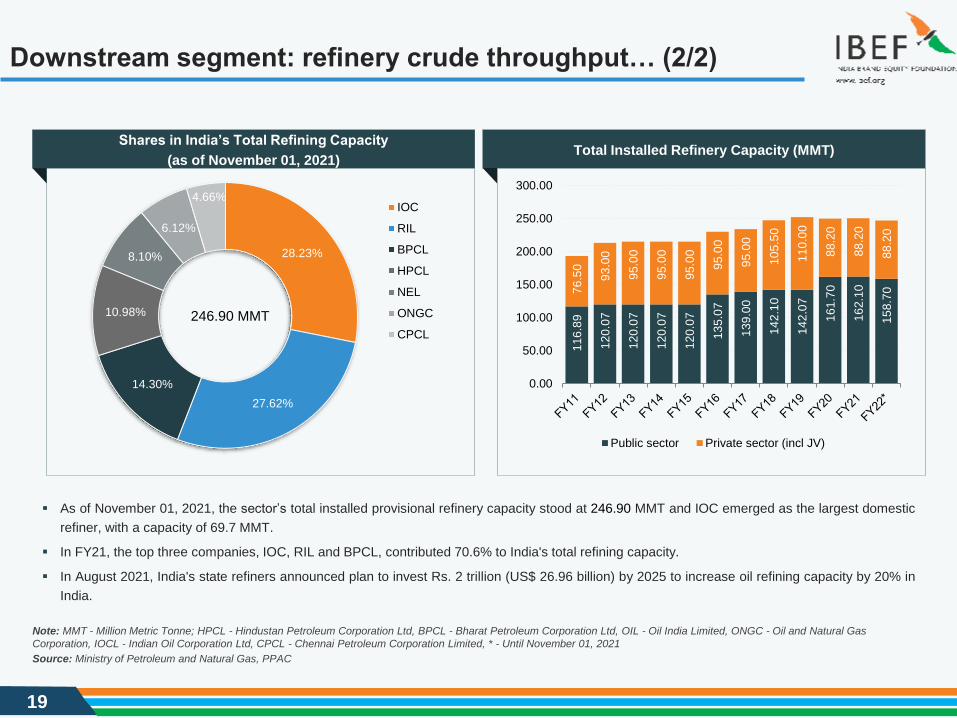
▪ As of November 01, 2021, the sector’s total installed provisional refinery capacity stood at 246.90 MMT and IOC emerged as the largest domestic
refiner, with a capacity of 69.7 MMT.
▪ In FY21, the top three companies, IOC, RIL and BPCL, contributed 70.6% to India's total refining capacity.
▪ In August 2021, India's state refiners announced plan to invest Rs. 2 trillion (US$ 26.96 billion) by 2025 to increase oil refining capacity by 20% in
India.
246.90 MMT
Shares in India’s Total Refining Capacity
(as of November 01, 2021)
20
Downstream segment: petroleum products
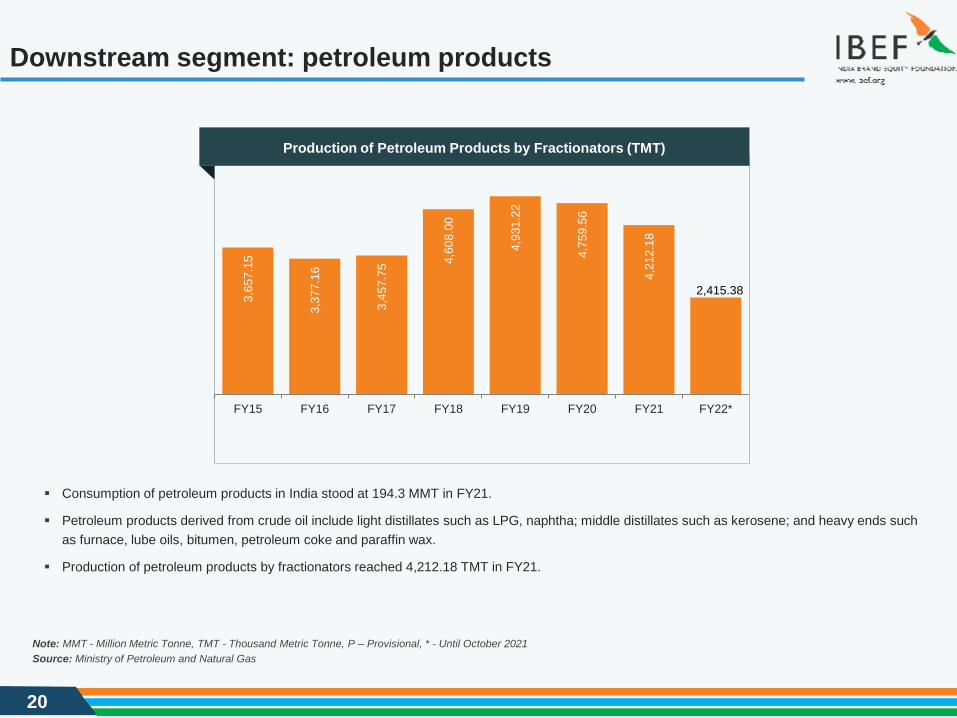
▪ Consumption of petroleum products in India stood at 194.3 MMT in FY21.
▪ Petroleum products derived from crude oil include light distillates such as LPG, naphtha; middle distillates such as kerosene; and heavy ends such
as furnace, lube oils, bitumen, petroleum coke and paraffin wax.
▪ Production of petroleum products by fractionators reached 4,212.18 TMT in FY21.
Source: Ministry of Petroleum and Natural Gas
3,6
57
.15
3,3
77
.16
3,4
57
.75
4,6
08
.00
4,9
31
.22
4,7
59
.56
4,2
12
.18
2,415.38
FY15 FY16 FY17 FY18 FY19 FY20 FY21 FY22*
Production of Petroleum Products by Fractionators (TMT)
Note: MMT - Million Metric Tonne, TMT - Thousand Metric Tonne, P – Provisional, * - Until October 2021
21
Downstream segment: distribution and marketing
85
.10
89
.57
97
.70
10
4.5
0
11
0.5
0
11
4.3
0
11
1.3
0
11
1.3
0
11
5.7
0
10
9.7
2
97
.36
97
.36
96
.61
10
7.5
8
10
2.3
6
10
7.5
0
93
.69
92
.47
0.0
50.0
100.0
150.0
200.0
250.0
FY14 FY15 FY16 FY17 FY18 FY19 FY20 FY21 FY22#
Product pipeline Natural Gas Pipeline*
Downstream distribution statistics (MMT)
Pipeline
Capacity (mmtpa)
as of
November 01, 2021
Length (kms)
as of
November 01, 2021
Crude Pipeline 147.9 10,419
Product Pipeline 112.2 18,465
Natural Gas Pipeline* 337.3 32,641
Note: MMT - Million Metric Tonne, mmtpa - Million Metric Tonnes Per Annum, OMC - Oil Marketing Companies, (P) - Provisional, PSU - Public Sector Unit, *- on June 2021 for natural gas
pipeline, #- on November 1, 2021 for product pipeline
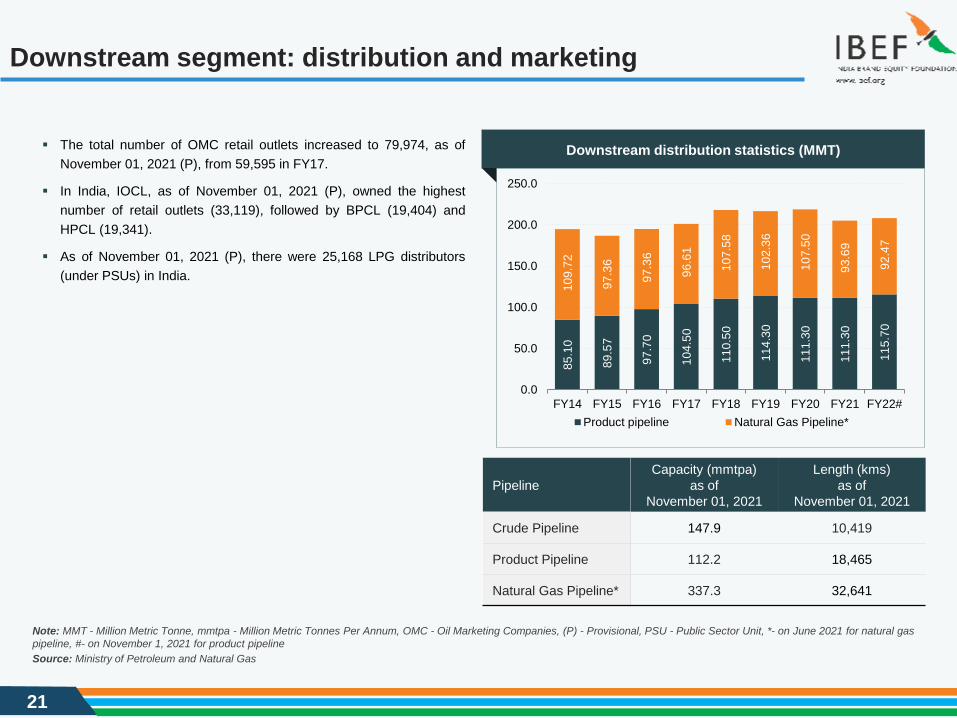
▪ The total number of OMC retail outlets increased to 79,974, as of
November 01, 2021 (P), from 59,595 in FY17.
▪ In India, IOCL, as of November 01, 2021 (P), owned the highest
number of retail outlets (33,119), followed by BPCL (19,404) and
HPCL (19,341).
▪ As of November 01, 2021 (P), there were 25,168 LPG distributors
(under PSUs) in India.
Source: Ministry of Petroleum and Natural Gas
22
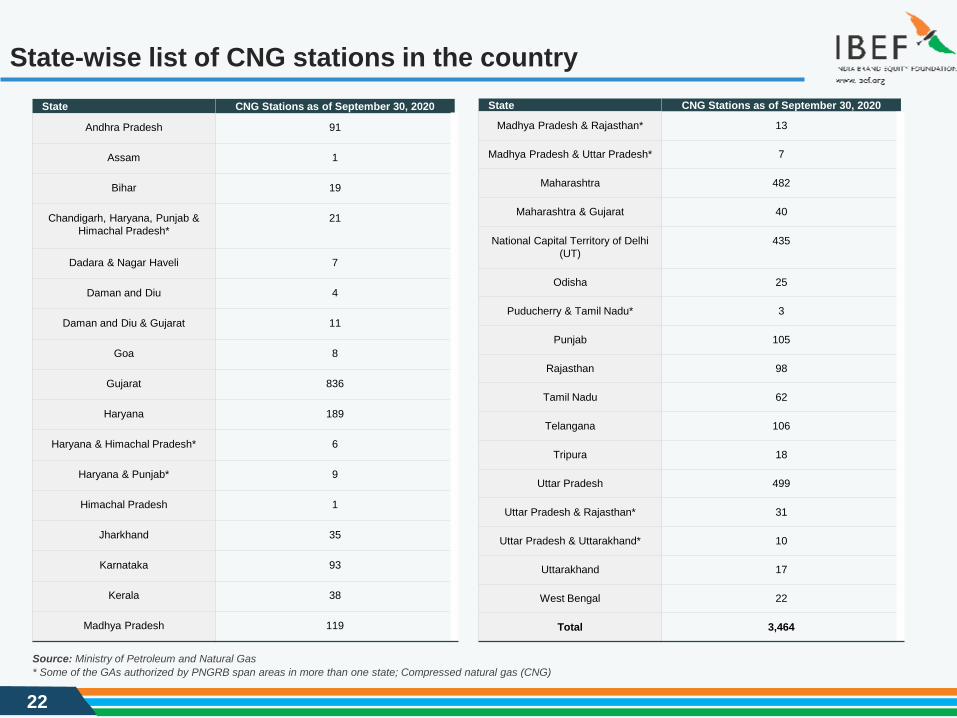
State-wise list of CNG stations in the country
Source: Ministry of Petroleum and Natural Gas
State CNG Stations as of September 30, 2020
Andhra Pradesh 91
Assam 1
Bihar 19
Chandigarh, Haryana, Punjab &
Himachal Pradesh*
21
Dadara & Nagar Haveli 7
Daman and Diu 4
Daman and Diu & Gujarat 11
Goa 8
Gujarat 836
Haryana 189
Haryana & Himachal Pradesh* 6
Haryana & Punjab* 9
Himachal Pradesh 1
Jharkhand 35
Karnataka 93
Kerala 38
Madhya Pradesh 119
State CNG Stations as of September 30, 2020
Madhya Pradesh & Rajasthan* 13
Madhya Pradesh & Uttar Pradesh* 7
Maharashtra 482
Maharashtra & Gujarat 40
National Capital Territory of Delhi
(UT)
435
Odisha 25
Puducherry & Tamil Nadu* 3
Punjab 105
Rajasthan 98
Tamil Nadu 62
Telangana 106
Tripura 18
Uttar Pradesh 499
Uttar Pradesh & Rajasthan* 31
Uttar Pradesh & Uttarakhand* 10
Uttarakhand 17
West Bengal 22
Total 3,464
* Some of the GAs authorized by PNGRB span areas in more than one state; Compressed natural gas (CNG)
23
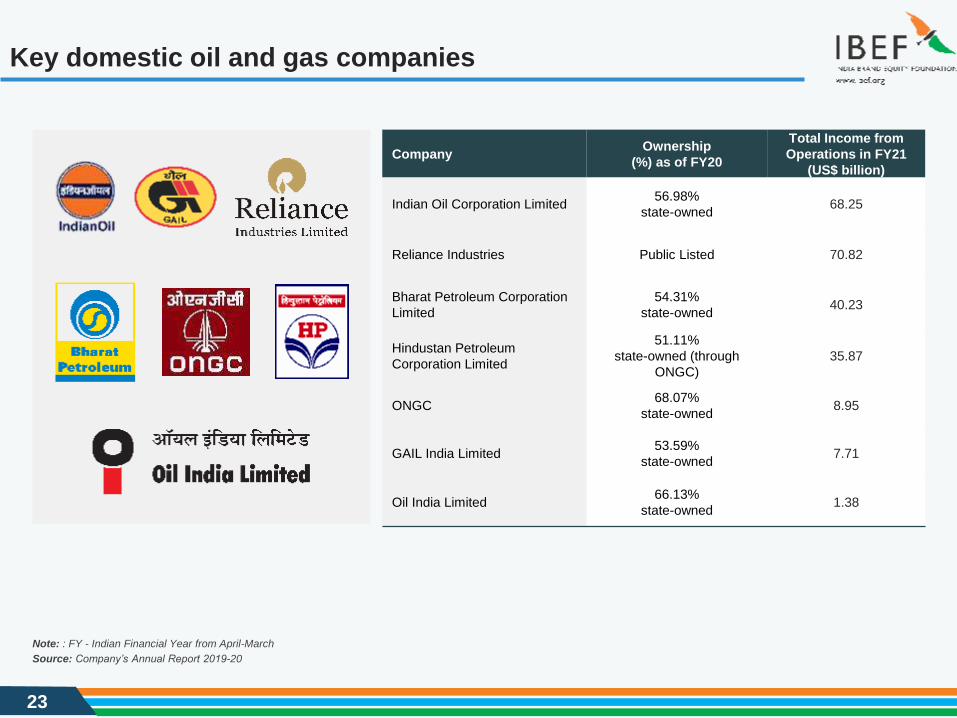
Key domestic oil and gas companies
Source: Company’s Annual Report 2019-20
CompanyOwnership
(%) as of FY20
Total Income from
Operations in FY21
(US$ billion)
Indian Oil Corporation Limited56.98%
state-owned68.25
Reliance Industries Public Listed 70.82
Bharat Petroleum Corporation
Limited
54.31%
state-owned40.23
Hindustan Petroleum
Corporation Limited
51.11%
state-owned (through
ONGC)
35.87
ONGC68.07%
state-owned8.95
GAIL India Limited53.59%
state-owned7.71
Oil India Limited66.13%
state-owned1.38
Note: : FY - Indian Financial Year from April-March

24
Recent Trends and Strategies
25
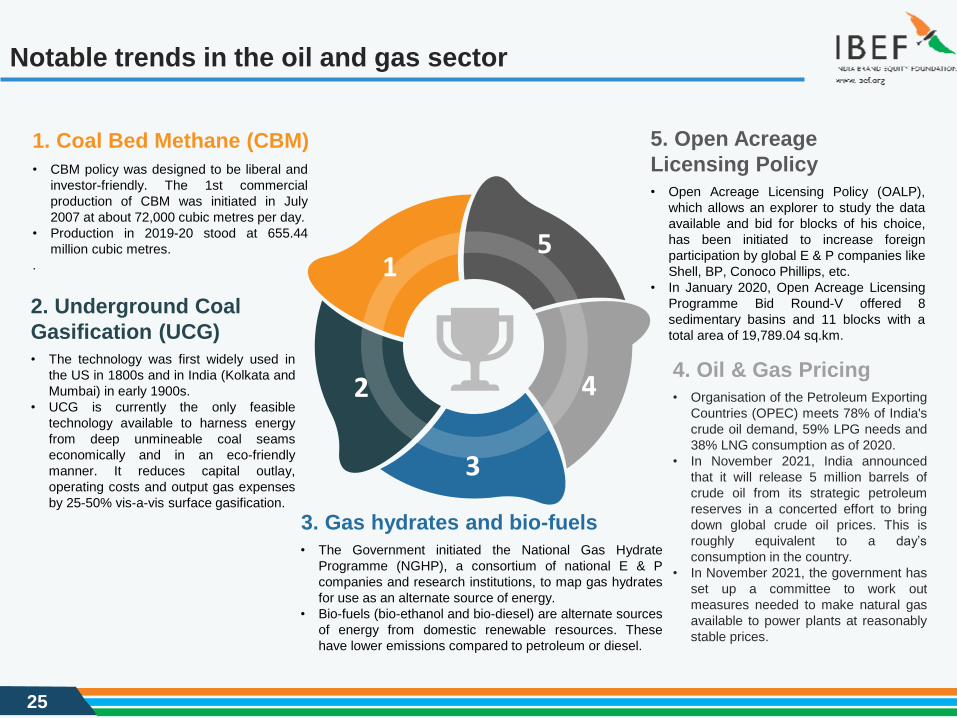
Notable trends in the oil and gas sector
5. Open Acreage
Licensing Policy• Open Acreage Licensing Policy (OALP),
which allows an explorer to study the data
available and bid for blocks of his choice,
has been initiated to increase foreign
participation by global E & P companies like
Shell, BP, Conoco Phillips, etc.
• In January 2020, Open Acreage Licensing
Programme Bid Round-V offered 8
sedimentary basins and 11 blocks with a
total area of 19,789.04 sq.km.
1. Coal Bed Methane (CBM)
• CBM policy was designed to be liberal and
investor-friendly. The 1st commercial
production of CBM was initiated in July
2007 at about 72,000 cubic metres per day.
• Production in 2019-20 stood at 655.44
million cubic metres.
.
5
4
3
2
1
4. Oil & Gas Pricing• Organisation of the Petroleum Exporting
Countries (OPEC) meets 78% of India's
crude oil demand, 59% LPG needs and
38% LNG consumption as of 2020.
• In November 2021, India announced
that it will release 5 million barrels of
crude oil from its strategic petroleum
reserves in a concerted effort to bring
down global crude oil prices. This is
roughly equivalent to a day’s
consumption in the country.
• In November 2021, the government has
set up a committee to work out
measures needed to make natural gas
available to power plants at reasonably
stable prices.
2. Underground Coal
Gasification (UCG)• The technology was first widely used in
the US in 1800s and in India (Kolkata and
Mumbai) in early 1900s.
• UCG is currently the only feasible
technology available to harness energy
from deep unmineable coal seams
economically and in an eco-friendly
manner. It reduces capital outlay,
operating costs and output gas expenses
by 25-50% vis-a-vis surface gasification.
3. Gas hydrates and bio-fuels
• The Government initiated the National Gas Hydrate
Programme (NGHP), a consortium of national E & P
companies and research institutions, to map gas hydrates
for use as an alternate source of energy.
• Bio-fuels (bio-ethanol and bio-diesel) are alternate sources
of energy from domestic renewable resources. These
have lower emissions compared to petroleum or diesel.
26
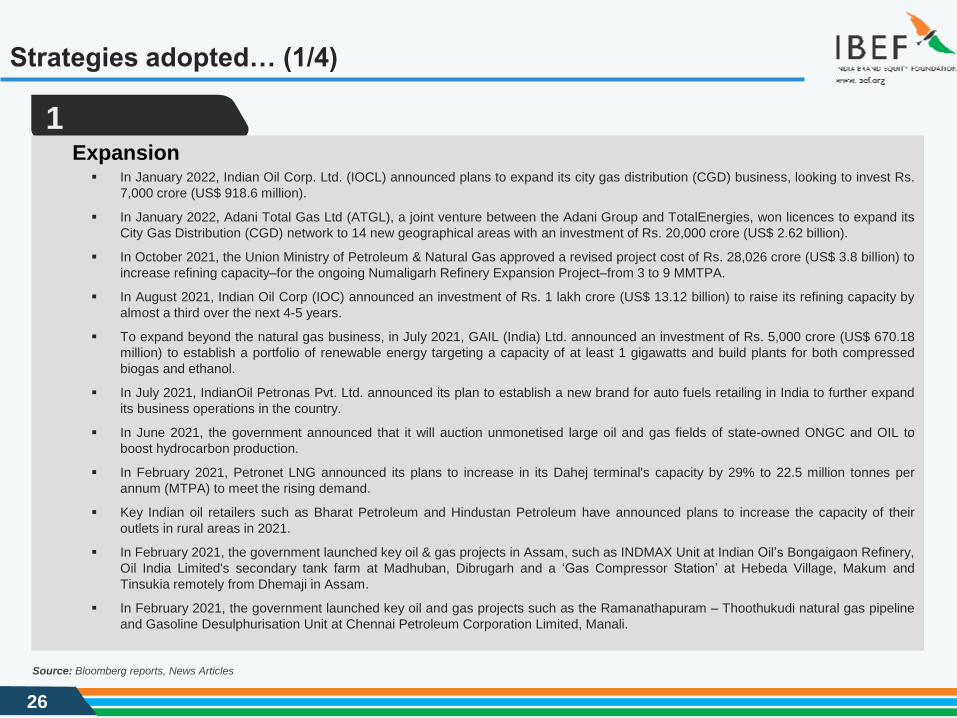
Strategies adopted… (1/4)
Source: Bloomberg reports, News Articles
1Expansion
▪ In January 2022, Indian Oil Corp. Ltd. (IOCL) announced plans to expand its city gas distribution (CGD) business, looking to invest Rs.
7,000 crore (US$ 918.6 million).
▪ In January 2022, Adani Total Gas Ltd (ATGL), a joint venture between the Adani Group and TotalEnergies, won licences to expand its
City Gas Distribution (CGD) network to 14 new geographical areas with an investment of Rs. 20,000 crore (US$ 2.62 billion).
▪ In October 2021, the Union Ministry of Petroleum & Natural Gas approved a revised project cost of Rs. 28,026 crore (US$ 3.8 billion) to
increase refining capacity–for the ongoing Numaligarh Refinery Expansion Project–from 3 to 9 MMTPA.
▪ In August 2021, Indian Oil Corp (IOC) announced an investment of Rs. 1 lakh crore (US$ 13.12 billion) to raise its refining capacity by
almost a third over the next 4-5 years.
▪ To expand beyond the natural gas business, in July 2021, GAIL (India) Ltd. announced an investment of Rs. 5,000 crore (US$ 670.18
million) to establish a portfolio of renewable energy targeting a capacity of at least 1 gigawatts and build plants for both compressed
biogas and ethanol.
▪ In July 2021, IndianOil Petronas Pvt. Ltd. announced its plan to establish a new brand for auto fuels retailing in India to further expand
its business operations in the country.
▪ In June 2021, the government announced that it will auction unmonetised large oil and gas fields of state-owned ONGC and OIL to
boost hydrocarbon production.
▪ In February 2021, Petronet LNG announced its plans to increase in its Dahej terminal's capacity by 29% to 22.5 million tonnes per
annum (MTPA) to meet the rising demand.
▪ Key Indian oil retailers such as Bharat Petroleum and Hindustan Petroleum have announced plans to increase the capacity of their
outlets in rural areas in 2021.
▪ In February 2021, the government launched key oil & gas projects in Assam, such as INDMAX Unit at Indian Oil’s Bongaigaon Refinery,
Oil India Limited's secondary tank farm at Madhuban, Dibrugarh and a ‘Gas Compressor Station’ at Hebeda Village, Makum and
Tinsukia remotely from Dhemaji in Assam.
▪ In February 2021, the government launched key oil and gas projects such as the Ramanathapuram – Thoothukudi natural gas pipeline
and Gasoline Desulphurisation Unit at Chennai Petroleum Corporation Limited, Manali.
27
Strategies adopted… (2/4)
Source: News Articles, techARC1
Notes: ISEER - Indian Seasonal Energy Efficiency Ratio
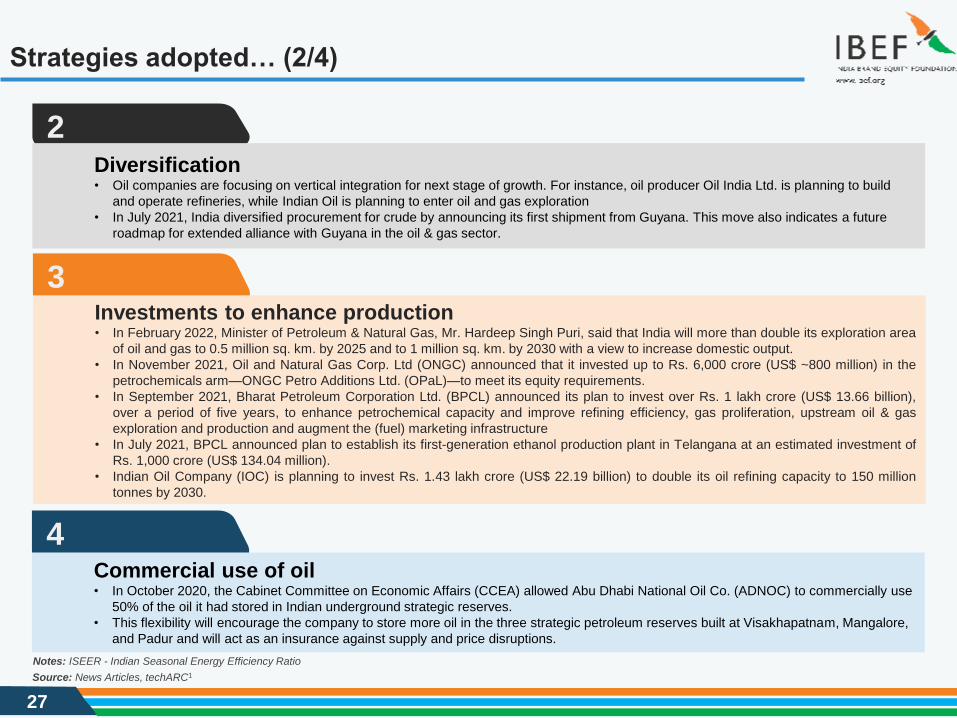
2Diversification• Oil companies are focusing on vertical integration for next stage of growth. For instance, oil producer Oil India Ltd. is planning to build
and operate refineries, while Indian Oil is planning to enter oil and gas exploration
• In July 2021, India diversified procurement for crude by announcing its first shipment from Guyana. This move also indicates a future
roadmap for extended alliance with Guyana in the oil & gas sector.
3Investments to enhance production• In February 2022, Minister of Petroleum & Natural Gas, Mr. Hardeep Singh Puri, said that India will more than double its exploration area
of oil and gas to 0.5 million sq. km. by 2025 and to 1 million sq. km. by 2030 with a view to increase domestic output.
• In November 2021, Oil and Natural Gas Corp. Ltd (ONGC) announced that it invested up to Rs. 6,000 crore (US$ ~800 million) in the
petrochemicals arm—ONGC Petro Additions Ltd. (OPaL)—to meet its equity requirements.
• In September 2021, Bharat Petroleum Corporation Ltd. (BPCL) announced its plan to invest over Rs. 1 lakh crore (US$ 13.66 billion),
over a period of five years, to enhance petrochemical capacity and improve refining efficiency, gas proliferation, upstream oil & gas
exploration and production and augment the (fuel) marketing infrastructure
• In July 2021, BPCL announced plan to establish its first-generation ethanol production plant in Telangana at an estimated investment of
Rs. 1,000 crore (US$ 134.04 million).
• Indian Oil Company (IOC) is planning to invest Rs. 1.43 lakh crore (US$ 22.19 billion) to double its oil refining capacity to 150 million
tonnes by 2030.
4Commercial use of oil• In October 2020, the Cabinet Committee on Economic Affairs (CCEA) allowed Abu Dhabi National Oil Co. (ADNOC) to commercially use
50% of the oil it had stored in Indian underground strategic reserves.
• This flexibility will encourage the company to store more oil in the three strategic petroleum reserves built at Visakhapatnam, Mangalore,
and Padur and will act as an insurance against supply and price disruptions.
28
Strategies adopted… (3/4)
Source: CEAMA, India Retail Report, Business Line, IMAP India, News Sources
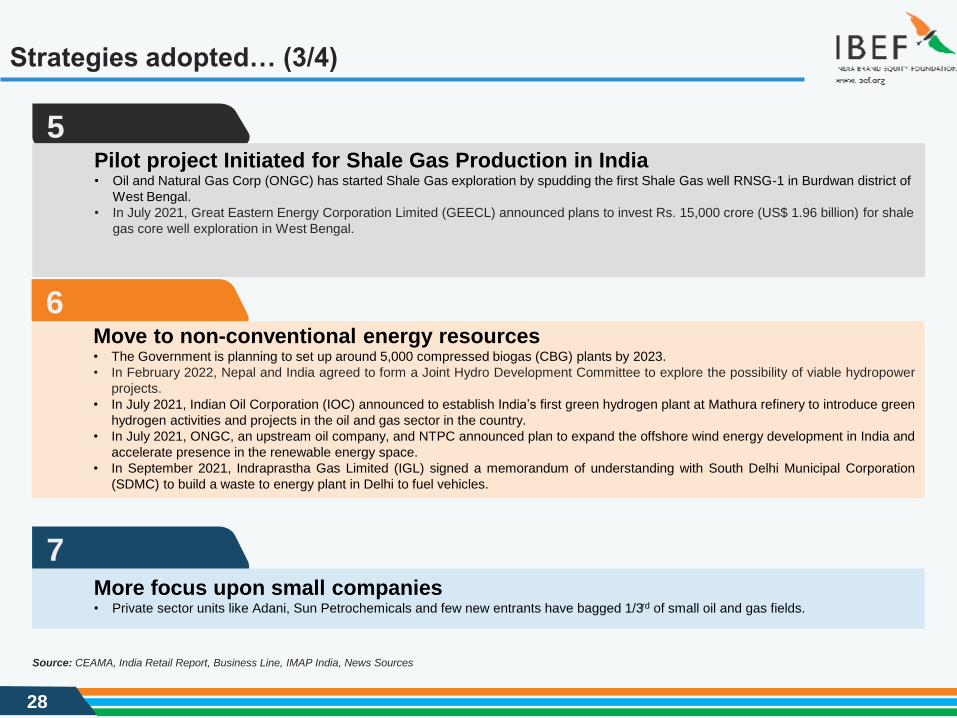
6Move to non-conventional energy resources• The Government is planning to set up around 5,000 compressed biogas (CBG) plants by 2023.
• In February 2022, Nepal and India agreed to form a Joint Hydro Development Committee to explore the possibility of viable hydropower
projects.
• In July 2021, Indian Oil Corporation (IOC) announced to establish India’s first green hydrogen plant at Mathura refinery to introduce green
hydrogen activities and projects in the oil and gas sector in the country.
• In July 2021, ONGC, an upstream oil company, and NTPC announced plan to expand the offshore wind energy development in India and
accelerate presence in the renewable energy space.
• In September 2021, Indraprastha Gas Limited (IGL) signed a memorandum of understanding with South Delhi Municipal Corporation
(SDMC) to build a waste to energy plant in Delhi to fuel vehicles.
7More focus upon small companies• Private sector units like Adani, Sun Petrochemicals and few new entrants have bagged 1/3rd of small oil and gas fields.
5Pilot project Initiated for Shale Gas Production in India• Oil and Natural Gas Corp (ONGC) has started Shale Gas exploration by spudding the first Shale Gas well RNSG-1 in Burdwan district of
West Bengal.
• In July 2021, Great Eastern Energy Corporation Limited (GEECL) announced plans to invest Rs. 15,000 crore (US$ 1.96 billion) for shale
gas core well exploration in West Bengal.
29
Strategies adopted… (4/4)
Source: CEAMA, India Retail Report, Business Line, IMAP India, News Sources
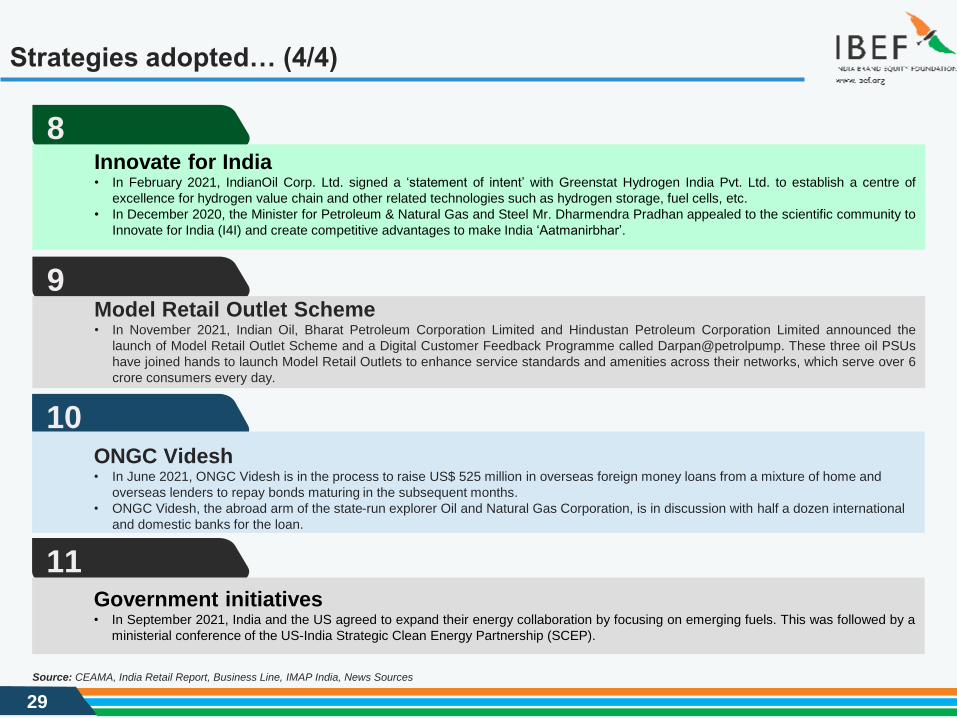
9Model Retail Outlet Scheme• In November 2021, Indian Oil, Bharat Petroleum Corporation Limited and Hindustan Petroleum Corporation Limited announced the
launch of Model Retail Outlet Scheme and a Digital Customer Feedback Programme called Darpan@petrolpump. These three oil PSUs
have joined hands to launch Model Retail Outlets to enhance service standards and amenities across their networks, which serve over 6
crore consumers every day.
8Innovate for India• In February 2021, IndianOil Corp. Ltd. signed a ‘statement of intent’ with Greenstat Hydrogen India Pvt. Ltd. to establish a centre of
excellence for hydrogen value chain and other related technologies such as hydrogen storage, fuel cells, etc.
• In December 2020, the Minister for Petroleum & Natural Gas and Steel Mr. Dharmendra Pradhan appealed to the scientific community to
Innovate for India (I4I) and create competitive advantages to make India ‘Aatmanirbhar’.
10ONGC Videsh• In June 2021, ONGC Videsh is in the process to raise US$ 525 million in overseas foreign money loans from a mixture of home and
overseas lenders to repay bonds maturing in the subsequent months.
• ONGC Videsh, the abroad arm of the state-run explorer Oil and Natural Gas Corporation, is in discussion with half a dozen international
and domestic banks for the loan.
11Government initiatives• In September 2021, India and the US agreed to expand their energy collaboration by focusing on emerging fuels. This was followed by a
ministerial conference of the US-India Strategic Clean Energy Partnership (SCEP).

30
Growth Drivers
31
Growth drivers
Source: Ministry of Petroleum and Natural Gas, US Energy Information Administration, BP Statistical Review of World 2015 Energy, June 2012; BMI
Notes: TCM - Trillion Cubic Metres, EandP - Exploration and Production
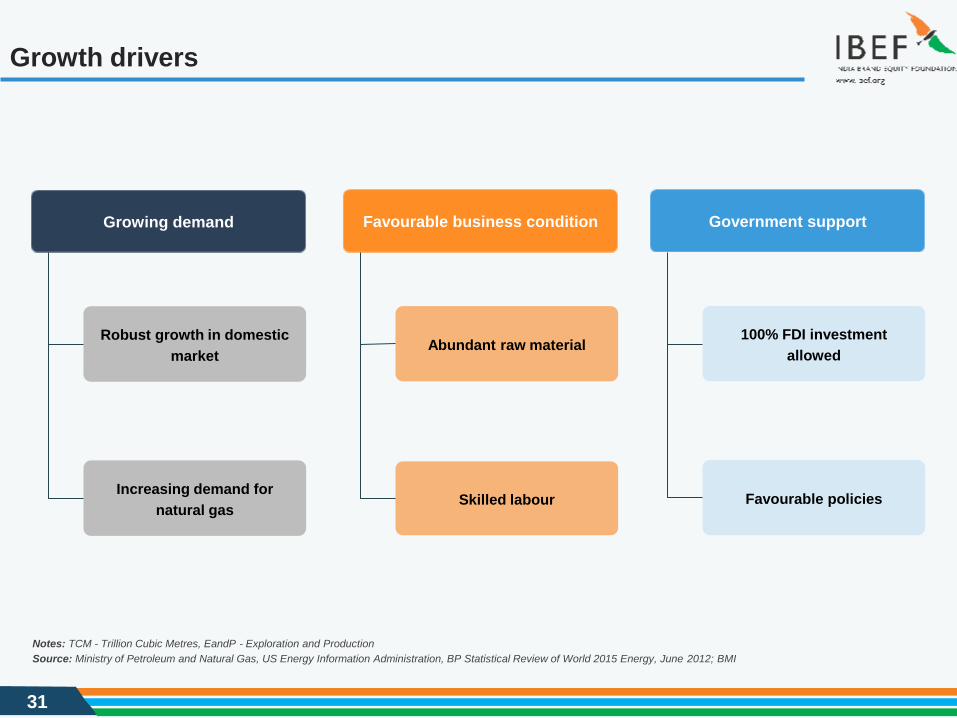
Growing demand
Robust growth in domestic
market
Increasing demand for
natural gas
Favourable business condition
Abundant raw material
Skilled labour
Government support
100% FDI investment
allowed
Favourable policies
32
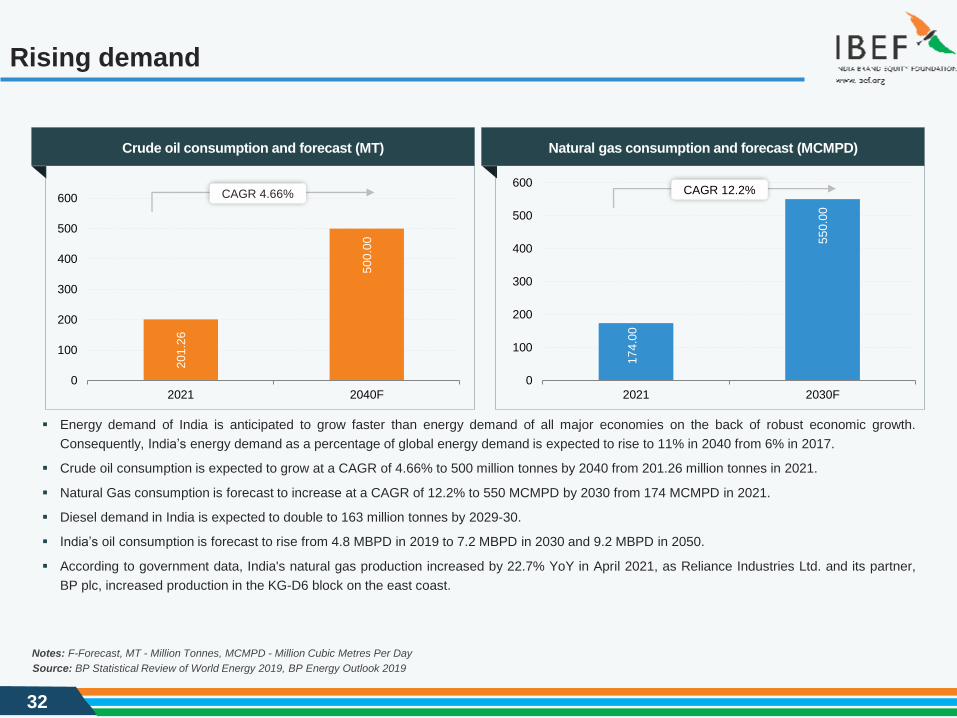
Rising demand
▪ Energy demand of India is anticipated to grow faster than energy demand of all major economies on the back of robust economic growth.
Consequently, India’s energy demand as a percentage of global energy demand is expected to rise to 11% in 2040 from 6% in 2017.
▪ Crude oil consumption is expected to grow at a CAGR of 4.66% to 500 million tonnes by 2040 from 201.26 million tonnes in 2021.
▪ Natural Gas consumption is forecast to increase at a CAGR of 12.2% to 550 MCMPD by 2030 from 174 MCMPD in 2021.
▪ Diesel demand in India is expected to double to 163 million tonnes by 2029-30.
▪ India’s oil consumption is forecast to rise from 4.8 MBPD in 2019 to 7.2 MBPD in 2030 and 9.2 MBPD in 2050.
▪ According to government data, India's natural gas production increased by 22.7% YoY in April 2021, as Reliance Industries Ltd. and its partner,
BP plc, increased production in the KG-D6 block on the east coast.
Source: BP Statistical Review of World Energy 2019, BP Energy Outlook 2019
Notes: F-Forecast, MT - Million Tonnes, MCMPD - Million Cubic Metres Per Day
Crude oil consumption and forecast (MT)
20
1.2
6
50
0.0
00
100
200
300
400
500
600
2021 2040F
Natural gas consumption and forecast (MCMPD)
17
4.0
0
55
0.0
0
0
100
200
300
400
500
600
2021 2030F
CAGR 4.66% CAGR 12.2%
33
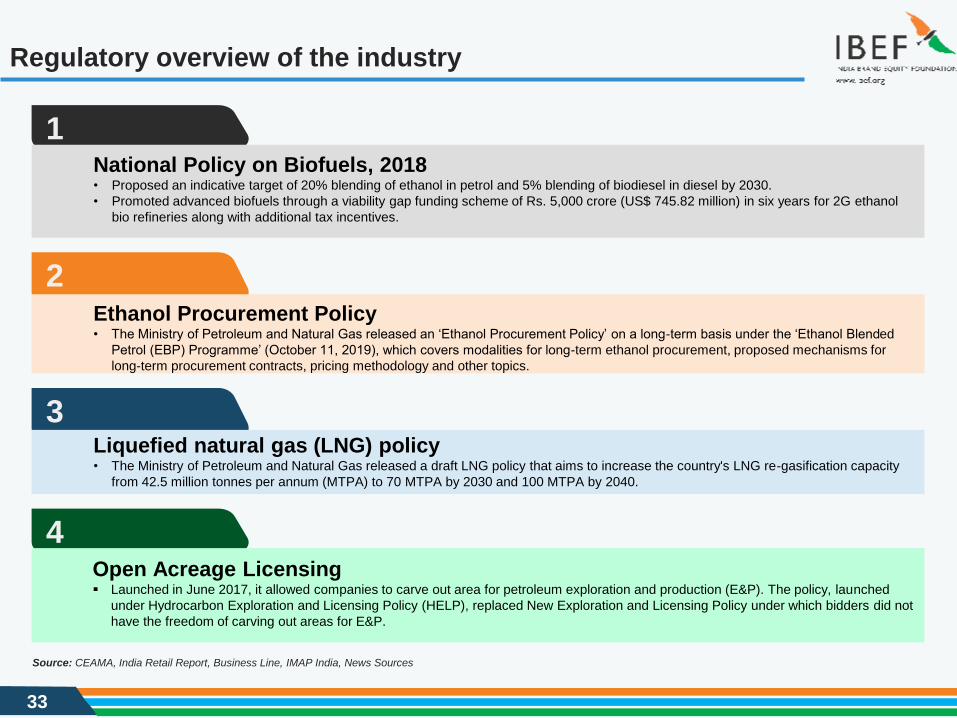
Regulatory overview of the industry
Source: CEAMA, India Retail Report, Business Line, IMAP India, News Sources
1National Policy on Biofuels, 2018• Proposed an indicative target of 20% blending of ethanol in petrol and 5% blending of biodiesel in diesel by 2030.
• Promoted advanced biofuels through a viability gap funding scheme of Rs. 5,000 crore (US$ 745.82 million) in six years for 2G ethanol
bio refineries along with additional tax incentives.
2Ethanol Procurement Policy• The Ministry of Petroleum and Natural Gas released an ‘Ethanol Procurement Policy’ on a long-term basis under the ‘Ethanol Blended
Petrol (EBP) Programme’ (October 11, 2019), which covers modalities for long-term ethanol procurement, proposed mechanisms for
long-term procurement contracts, pricing methodology and other topics.
3Liquefied natural gas (LNG) policy• The Ministry of Petroleum and Natural Gas released a draft LNG policy that aims to increase the country's LNG re-gasification capacity
from 42.5 million tonnes per annum (MTPA) to 70 MTPA by 2030 and 100 MTPA by 2040.
4Open Acreage Licensing▪ Launched in June 2017, it allowed companies to carve out area for petroleum exploration and production (E&P). The policy, launched
under Hydrocarbon Exploration and Licensing Policy (HELP), replaced New Exploration and Licensing Policy under which bidders did not
have the freedom of carving out areas for E&P.
34
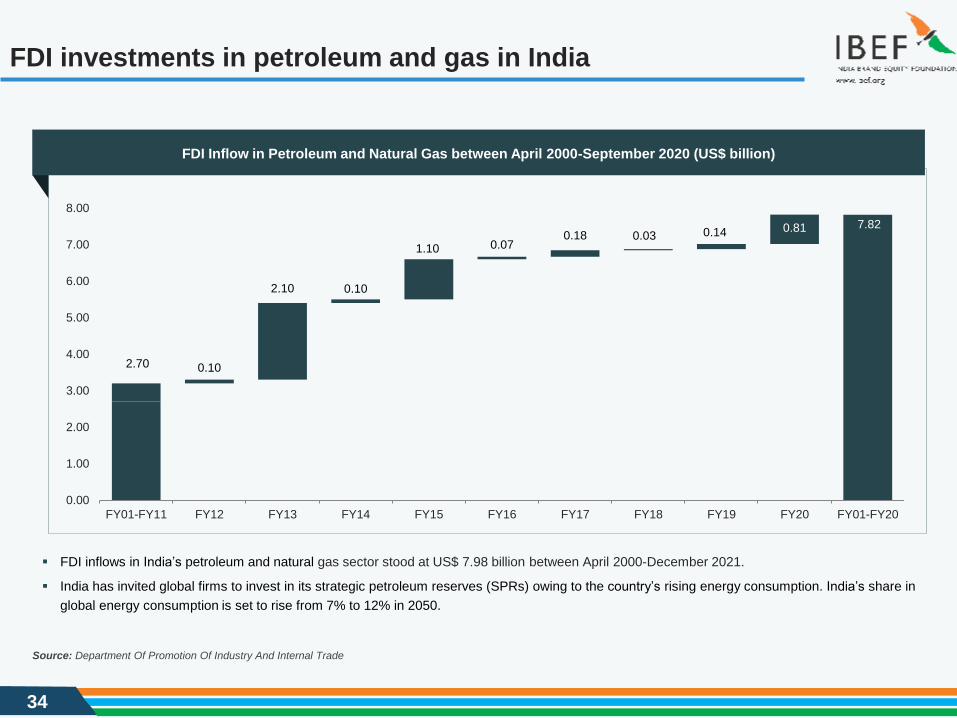
FDI investments in petroleum and gas in India
Source: Department Of Promotion Of Industry And Internal Trade
▪ FDI inflows in India’s petroleum and natural gas sector stood at US$ 7.98 billion between April 2000-December 2021.
▪ India has invited global firms to invest in its strategic petroleum reserves (SPRs) owing to the country’s rising energy consumption. India’s share in
global energy consumption is set to rise from 7% to 12% in 2050.
FDI Inflow in Petroleum and Natural Gas between April 2000-September 2020 (US$ billion)
2.70
7.82
0.10
2.10 0.10
1.10 0.070.18 0.03 0.14 0.81
0.00
1.00
2.00
3.00
4.00
5.00
6.00
7.00
8.00
FY01-FY11 FY12 FY13 FY14 FY15 FY16 FY17 FY18 FY19 FY20 FY01-FY20
35
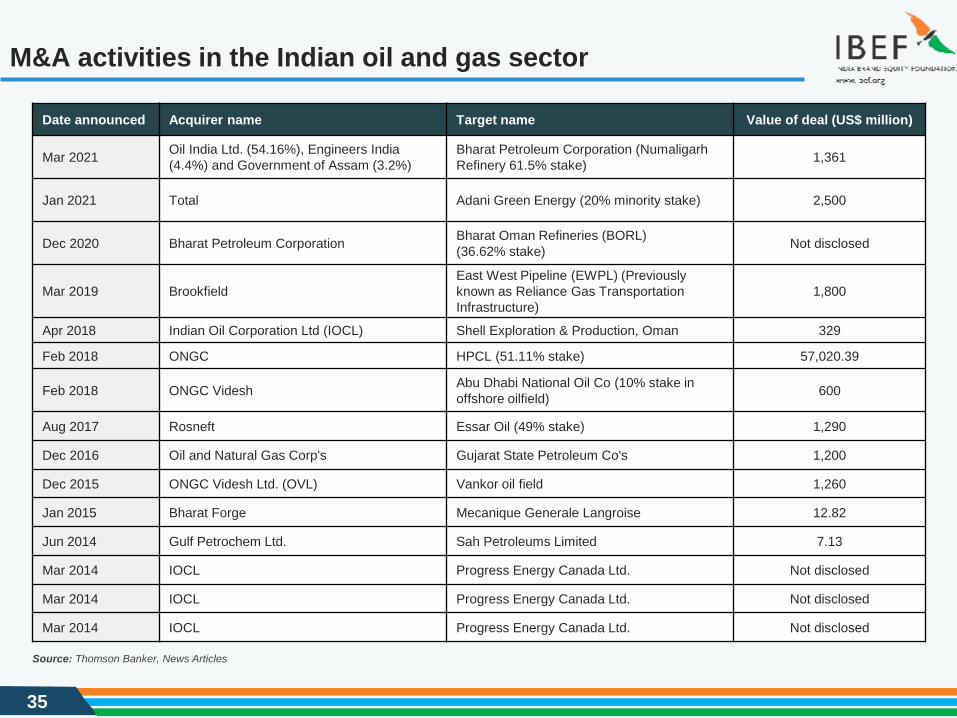
M&A activities in the Indian oil and gas sector
Source: Thomson Banker, News Articles
Date announced Acquirer name Target name Value of deal (US$ million)
Mar 2021Oil India Ltd. (54.16%), Engineers India
(4.4%) and Government of Assam (3.2%)
Bharat Petroleum Corporation (Numaligarh
Refinery 61.5% stake) 1,361
Jan 2021 Total Adani Green Energy (20% minority stake) 2,500
Dec 2020 Bharat Petroleum CorporationBharat Oman Refineries (BORL)
(36.62% stake)Not disclosed
Mar 2019 Brookfield
East West Pipeline (EWPL) (Previously
known as Reliance Gas Transportation
Infrastructure)
1,800
Apr 2018 Indian Oil Corporation Ltd (IOCL) Shell Exploration & Production, Oman 329
Feb 2018 ONGC HPCL (51.11% stake) 57,020.39
Feb 2018 ONGC VideshAbu Dhabi National Oil Co (10% stake in
offshore oilfield)600
Aug 2017 Rosneft Essar Oil (49% stake) 1,290
Dec 2016 Oil and Natural Gas Corp's Gujarat State Petroleum Co's 1,200
Dec 2015 ONGC Videsh Ltd. (OVL) Vankor oil field 1,260
Jan 2015 Bharat Forge Mecanique Generale Langroise 12.82
Jun 2014 Gulf Petrochem Ltd. Sah Petroleums Limited 7.13
Mar 2014 IOCL Progress Energy Canada Ltd. Not disclosed
Mar 2014 IOCL Progress Energy Canada Ltd. Not disclosed
Mar 2014 IOCL Progress Energy Canada Ltd. Not disclosed

36
Opportunities
37
Opportunities
2
1
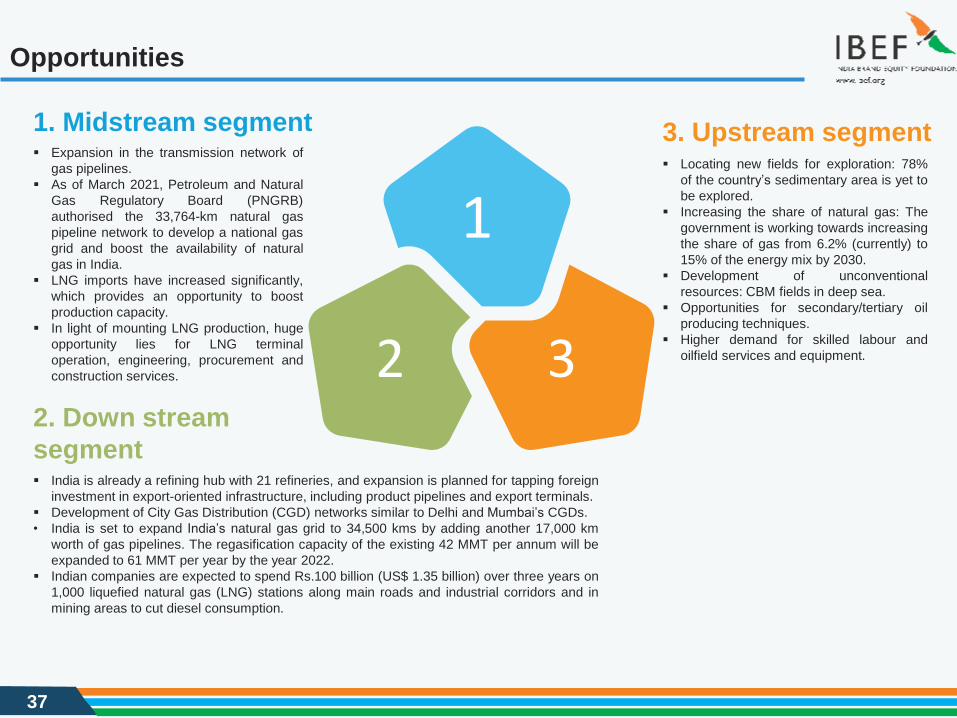
32. Down stream
segment▪ India is already a refining hub with 21 refineries, and expansion is planned for tapping foreign
investment in export-oriented infrastructure, including product pipelines and export terminals.
▪ Development of City Gas Distribution (CGD) networks similar to Delhi and Mumbai’s CGDs.
• India is set to expand India’s natural gas grid to 34,500 kms by adding another 17,000 km
worth of gas pipelines. The regasification capacity of the existing 42 MMT per annum will be
expanded to 61 MMT per year by the year 2022.
▪ Indian companies are expected to spend Rs.100 billion (US$ 1.35 billion) over three years on
1,000 liquefied natural gas (LNG) stations along main roads and industrial corridors and in
mining areas to cut diesel consumption.
3. Upstream segment▪ Locating new fields for exploration: 78%
of the country’s sedimentary area is yet to
be explored.
▪ Increasing the share of natural gas: The
government is working towards increasing
the share of gas from 6.2% (currently) to
15% of the energy mix by 2030.
▪ Development of unconventional
resources: CBM fields in deep sea.
▪ Opportunities for secondary/tertiary oil
producing techniques.
▪ Higher demand for skilled labour and
oilfield services and equipment.
1. Midstream segment▪ Expansion in the transmission network of
gas pipelines.
▪ As of March 2021, Petroleum and Natural
Gas Regulatory Board (PNGRB)
authorised the 33,764-km natural gas
pipeline network to develop a national gas
grid and boost the availability of natural
gas in India.
▪ LNG imports have increased significantly,
which provides an opportunity to boost
production capacity.
▪ In light of mounting LNG production, huge
opportunity lies for LNG terminal
operation, engineering, procurement and
construction services.

38
Key Industry Contacts
39
Contact information
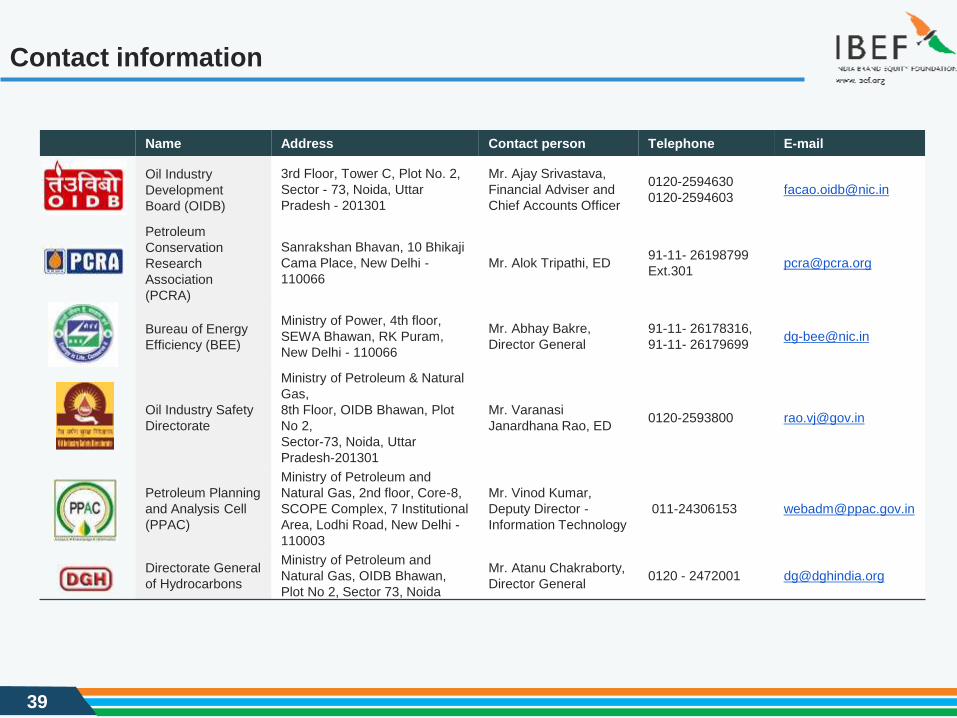
Name Address Contact person Telephone E-mail
Oil Industry
Development
Board (OIDB)
3rd Floor, Tower C, Plot No. 2,
Sector - 73, Noida, Uttar
Pradesh - 201301
Mr. Ajay Srivastava,
Financial Adviser and
Chief Accounts Officer
0120-2594630
Petroleum
Conservation
Research
Association
(PCRA)
Sanrakshan Bhavan, 10 Bhikaji
Cama Place, New Delhi -
110066
Mr. Alok Tripathi, ED91-11- 26198799
Bureau of Energy
Efficiency (BEE)
Ministry of Power, 4th floor,
SEWA Bhawan, RK Puram,
New Delhi - 110066
Mr. Abhay Bakre,
Director General
91-11- 26178316,
91-11- [email protected]
Oil Industry Safety
Directorate
Ministry of Petroleum & Natural
Gas,
8th Floor, OIDB Bhawan, Plot
No 2,
Sector-73, Noida, Uttar
Pradesh-201301
Mr. Varanasi
Janardhana Rao, ED0120-2593800 [email protected]
Petroleum Planning
and Analysis Cell
(PPAC)
Ministry of Petroleum and
Natural Gas, 2nd floor, Core-8,
SCOPE Complex, 7 Institutional
Area, Lodhi Road, New Delhi -
110003
Mr. Vinod Kumar,
Deputy Director -
Information Technology
011-24306153 [email protected]
Directorate General
of Hydrocarbons
Ministry of Petroleum and
Natural Gas, OIDB Bhawan,
Plot No 2, Sector 73, Noida
Mr. Atanu Chakraborty,
Director General0120 - 2472001 [email protected]
40
Appendix
41
Glossary
▪ B/D (or bpd): Barrels Per Day
▪ MBPD (or mbpd): Million Barrels Per Day
▪ BCM (or bcm): Billion Cubic Metres
▪ CBM: Coal Bed Methane
▪ CGD: City Gas Distribution
▪ EandP: Exploration and Production
▪ FDI: Foreign Direct Investment
▪ FY: Indian Financial Year (April to March)
▪ FY20 implies April 2019 to March 2020
▪ GoI: Government of India
▪ Rs.: Indian Rupee
▪ PM: Prime Minister
▪ LNG: Liquefied Natural Gas
▪ MMT (or MMT): Million Metric Tonne
▪ MMTPA (or mmtpa): Million Metric Tonnes Per Annum
▪ EBITDA: Earnings Before Interest Taxes Depreciation Amortisation
▪ NRL: Numaligarh Refinery Limited
▪ CPCL: Chennai Petroleum Corporation Limited
▪ HPCL: Hindustan Petroleum Corporation Limited
▪ BPCL: Bharat Petroleum Corporation Limited
42
Glossary
▪ IOC: Indian Oil Corporation Ltd
▪ EOL: Essar Oil Ltd
▪ RPL: Reliance Petroleum Limited
▪ MRPL: Mangalore Refinery and Petrochemicals Limited
▪ PCCK: Petronet Cochin-Coimbatore-Karur
▪ PMHB: Petronet Mangalore-Hassan-Bangalore
▪ OALP: Open Acreage Licensing Policy
▪ TOE (or toe): Tonnes of Oil Equivalent
▪ US$ : US Dollar
▪ ONGC: Oil and Natural Gas Corporation of India
▪ IOCL: Indian Oil Corporation Limited
▪ mn bbl: Million Barrels
▪ CAGR: Compound Annual Growth Rate
▪ JV: Joint Venture
▪ UCG: Underground Coal Gasification
▪ NGL: Natural Gas Liquids
▪ OMCs: Oil Marketing Companies
▪ NHGP: National Gas Hydrate Programme
▪ Wherever applicable, numbers have been rounded off to the nearest whole number
43
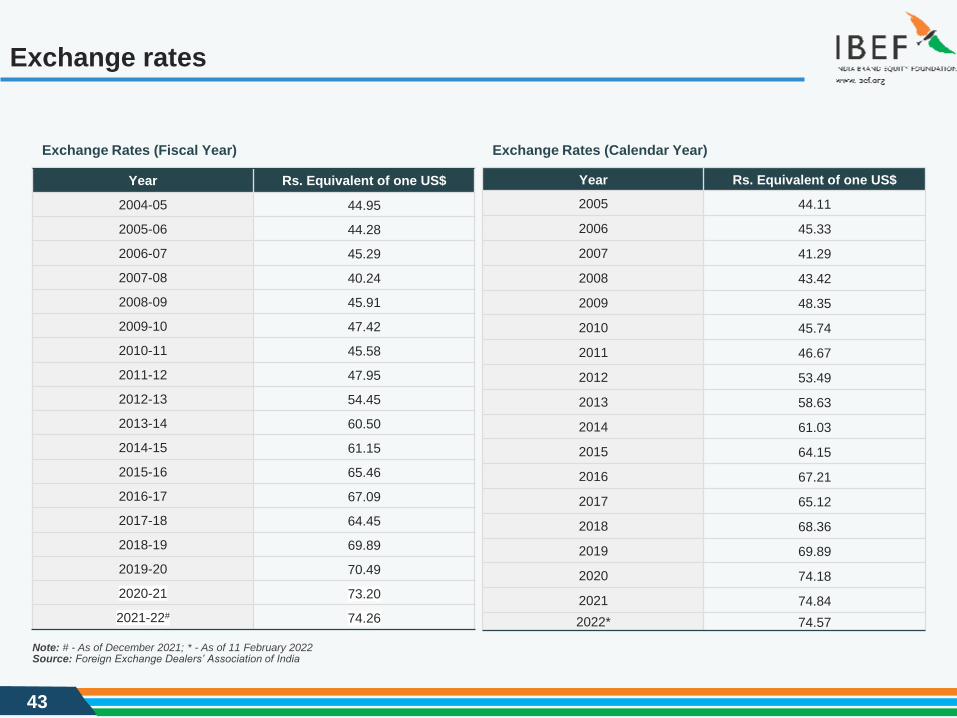
Exchange rates
Exchange Rates (Fiscal Year) Exchange Rates (Calendar Year)
Year Rs. Equivalent of one US$
2004-05 44.95
2005-06 44.28
2006-07 45.29
2007-08 40.24
2008-09 45.91
2009-10 47.42
2010-11 45.58
2011-12 47.95
2012-13 54.45
2013-14 60.50
2014-15 61.15
2015-16 65.46
2016-17 67.09
2017-18 64.45
2018-19 69.89
2019-20 70.49
2020-21 73.20
2021-22# 74.26
Source: Foreign Exchange Dealers’ Association of IndiaNote: # - As of December 2021; * - As of 11 February 2022
Year Rs. Equivalent of one US$
2005 44.11
2006 45.33
2007 41.29
2008 43.42
2009 48.35
2010 45.74
2011 46.67
2012 53.49
2013 58.63
2014 61.03
2015 64.15
2016 67.21
2017 65.12
2018 68.36
2019 69.89
2020 74.18
2021 74.84
2022* 74.57
44
Disclaimer
India Brand Equity Foundation (IBEF) engaged Aranca (Mumbai) Pvt. Ltd. to prepare/update this presentation.
All rights reserved. All copyright in this presentation and related works is solely and exclusively owned by IBEF, delivered during the course of
engagement under the Professional Service Agreement signed by the Parties. The same may not be reproduced, wholly or in part in any material
form (including photocopying or storing it in any medium by electronic means and whether or not transiently or incidentally to some other use of this
presentation), modified or in any manner communicated to any third party except with the written approval of IBEF.
This presentation is for information purposes only. While due care has been taken during the compilation of this presentation to ensure that the
information is accurate to the best of Aranca (Mumbai) Pvt. Ltd. and IBEF’s knowledge and belief, the content is not to be construed in any manner
whatsoever as a substitute for professional advice.
Aranca (Mumbai) Pvt. Ltd. and IBEF neither recommend nor endorse any specific products or services that may have been mentioned in this
presentation and nor do they assume any liability, damages or responsibility for the outcome of decisions taken as a result of any reliance placed on
this presentation.
Neither Aranca (Mumbai) Pvt. Ltd. nor IBEF shall be liable for any special, direct, indirect or consequential damages that may arise due to any act or
omission on the part of the user due to any reliance placed or guidance taken from any portion of this presentation.


