c Indian Academy of Sciences REVIEW ARTICLE Phylogeographic distribution of mitochondrial DNA macrohaplogroup M in India SUVENDU MAJI, S. KRITHIKA and T. S. VASULU ∗ Biological Anthropology Unit, Indian Statistical Institute, Kolkata 700 108, India Abstract Indian subcontinent harbours both the human mtDNA macrohaplogroups M and N, of which M is the most prevalent. In this study, we discuss the overall distribution of the various haplogroups and sub-haplogroups of M among the different castes and tribes to understand their diverse pattern with respect to geographical location and linguistic affiliation of the populations. An overview of about 170 studied populations, belonging to four distinct linguistic families and inhabiting different geographic zones, revealed wide diversity of about 22 major haplogroups of M. The tribal populations belonging to the same linguistic family but inhabiting different geographical regions (Dravidian and Austro–Asiatic speakers) exhibited differences in their haplogroup diversity. The northern and southern region castes showed greater diversity than the castes of other regions. [Maji S., Krithika S. and Vasulu T. S. 2009 Phylogeographic distribution of mitochondiral DNA macrohaplogroup M in India. J. Genet. 88, 127–139] Introduction The advancement in molecular biology has broadened our perspective on the origin and evolution of anatomically mod- ern humans, thereby furnishing substantial evidence in sup- port of the existing archeological, anthropological and other biological records (Cann et al. 1987; Excoffier and Langaney 1989; Ingman et al. 2000; Macaulay et al. 2005). In re- cent years, high-resolution-genetic markers (viz. autosomal, mtDNA and Y-chromosomal) have been utilized to test var- ious hypotheses related to past genetic history and evolution of man (Stringer and Andrews 1988; Vigilant et al. 1991; Rogers and Jorde 1995; Hammer et al. 1998; Templeton 2002; Hebsgaard et al. 2007). In particular, the complete sequencing of the 16,569 base pairs of human mitochon- drial genome reported by Anderson et al. (1981) widened the employment of mitochondrial DNA (mtDNA) as a genetic marker to investigate one of the major contentious issues, the time of origin and dispersal of man out of Africa to other con- tinents (Cann et al. 1987; Ingman et al. 2000; Macaulay et al. 2005). Also, the maternal inheritance pattern of mtDNA enables us to disentangle the maternal genetic history of human populations. In addition, several other features of *For correspondence. E-mail: [email protected]; [email protected]. mitochondrial genome, such as its high copy number, near- absence of genetic recombination and higher mutation rate (three to five times greater than nuclear DNA), make it a po- tent molecular genetic tool. Initially, studies on human mtDNA were based on re- striction fragment length polymorphisms (RFLPs) of ei- ther genomic DNA or mtDNA (Brown 1980; Denaro et al. 1981; Johnson et al. 1983; Cann et al. 1987; Scozzari et al. 1988; Excoffier and Langaney 1989), but with the ad- vent of polymerase chain reaction (PCR) and sequencing techniques, RFLP analysis of mtDNA PCR products and sequence analysis of the highly polymorphic noncoding re- gions, hypervariable regions I and II, took over (Vigilant et al. 1991; Hedges et al. 1992; Maddison et al. 1992; Tem- pleton 1992; Torroni et al. 1996, 1998; Watson et al. 1997; Macaulay et al. 1999; Quintana-Murci et al. 1999). Later, however, certain disadvantages of hypervariable regions, like back mutation, parallel substitution and mutation rate het- erogeneity led researchers to sequence the whole genome using high-throughput sequencing, wherein many informa- tive polymorphic sites are present, the numbers of back and parallel mutations are almost zero, and the problem of mu- tation rate heterogeneity is absent (Finnil¨ a et al. 2000; In- gman et al. 2000; Elson et al. 2001; Finnil¨ a and Majamaa Keywords. mtDNA; macrohaplogroup M; haplogroups; castes and tribes; linguistic families. Journal of Genetics, Vol. 88, No. 1, April 2009 127
Phylogeographic distribution of mitochondrial DNAmacrohaplogroup M in India
SUVENDU MAJI, S. KRITHIKA and T. S. VASULU∗
Biological Anthropology Unit, Indian Statistical Institute, Kolkata 700 108, India
Abstract
Indian subcontinent harbours both the human mtDNA macrohaplogroups M and N, of which M is the most prevalent. In thisstudy, we discuss the overall distribution of the various haplogroups and sub-haplogroups of M among the different castes andtribes to understand their diverse pattern with respect to geographical location and linguistic affiliation of the populations. Anoverview of about 170 studied populations, belonging to four distinct linguistic families and inhabiting different geographiczones, revealed wide diversity of about 22 major haplogroups of M. The tribal populations belonging to the same linguisticfamily but inhabiting different geographical regions (Dravidian and Austro–Asiatic speakers) exhibited differences in theirhaplogroup diversity. The northern and southern region castes showed greater diversity than the castes of other regions.
[Maji S., Krithika S. and Vasulu T. S. 2009 Phylogeographic distribution of mitochondiral DNA macrohaplogroup M in India. J. Genet. 88,127–139]
IntroductionThe advancement in molecular biology has broadened ourperspective on the origin and evolution of anatomically mod-ern humans, thereby furnishing substantial evidence in sup-port of the existing archeological, anthropological and otherbiological records (Cann et al. 1987; Excoffier and Langaney1989; Ingman et al. 2000; Macaulay et al. 2005). In re-cent years, high-resolution-genetic markers (viz. autosomal,mtDNA and Y-chromosomal) have been utilized to test var-ious hypotheses related to past genetic history and evolutionof man (Stringer and Andrews 1988; Vigilant et al. 1991;Rogers and Jorde 1995; Hammer et al. 1998; Templeton2002; Hebsgaard et al. 2007). In particular, the completesequencing of the 16,569 base pairs of human mitochon-drial genome reported by Anderson et al. (1981) widened theemployment of mitochondrial DNA (mtDNA) as a geneticmarker to investigate one of the major contentious issues, thetime of origin and dispersal of man out of Africa to other con-tinents (Cann et al. 1987; Ingman et al. 2000; Macaulay etal. 2005). Also, the maternal inheritance pattern of mtDNAenables us to disentangle the maternal genetic history ofhuman populations. In addition, several other features of
mitochondrial genome, such as its high copy number, near-absence of genetic recombination and higher mutation rate(three to five times greater than nuclear DNA), make it a po-tent molecular genetic tool.
Initially, studies on human mtDNA were based on re-striction fragment length polymorphisms (RFLPs) of ei-ther genomic DNA or mtDNA (Brown 1980; Denaro et al.1981; Johnson et al. 1983; Cann et al. 1987; Scozzari etal. 1988; Excoffier and Langaney 1989), but with the ad-vent of polymerase chain reaction (PCR) and sequencingtechniques, RFLP analysis of mtDNA PCR products andsequence analysis of the highly polymorphic noncoding re-gions, hypervariable regions I and II, took over (Vigilant etal. 1991; Hedges et al. 1992; Maddison et al. 1992; Tem-pleton 1992; Torroni et al. 1996, 1998; Watson et al. 1997;Macaulay et al. 1999; Quintana-Murci et al. 1999). Later,however, certain disadvantages of hypervariable regions, likeback mutation, parallel substitution and mutation rate het-erogeneity led researchers to sequence the whole genomeusing high-throughput sequencing, wherein many informa-tive polymorphic sites are present, the numbers of back andparallel mutations are almost zero, and the problem of mu-tation rate heterogeneity is absent (Finnila et al. 2000; In-gman et al. 2000; Elson et al. 2001; Finnila and Majamaa
Keywords. mtDNA; macrohaplogroup M; haplogroups; castes and tribes; linguistic families.
Journal of Genetics, Vol. 88, No. 1, April 2009 127
Suvendu Maji et al.
2001). Based on the mutation sites observed in the mitochon-drial genome in relation to the reference sequence (Ander-son et al. 1981; Andrews et al. 1999), individuals were cat-egorized into specific monophyletic clades or haplogroups,where haplogroups represent related groups of sequences de-fined by shared mutations. The mtDNA haplogroups mainlyfall into three macrohaplogroups, designated as L, M and N,distributions of which are geographically distinct.
L is the oldest macrohaplogroup, restricted to Africans,especially sub-Saharan African populations, and consists ofhaplogroups L0, L1, L2, L3, L4, L5, L6 and L7, of whichL3 radiated out of Africa in the form of macrohaplogroupsM and N around ∼60, 000 ybp (Quintana-Murci et al. 1999;Mishmar et al. 2003) and entered South Asia or Indian sub-continent, and later drifted to Southeast Asia and Australia.Recent studies suggest that Indian subcontinent had playeda major role in the early genetic history of mankind, whichcan possibly be understood by M and N distribution amongdifferent populations of India (Kivisild et al. 1999; Metspaluet al. 2004; Palanichamy et al. 2004; Thangaraj et al. 2006).
Macrohaplogroup M (489-10400-14783-15043), exclud-ing M1 which is east African, is distributed among mostsouth, east and north Asians, Amerindians (containing a mi-nority of north and central Amerindians and a majority ofsouth Amerindians), and many central Asians and Melane-sians. On the other hand, macrohaplogroup N (8701-9540-10398-10873-15301) has been reported among nearly allEuropeans, west Asians, North Africans and Australianaborigines as well as among east Asians, South Asians,Amerindians (containing a majority of north and centralAmerindians and a minority of south Amerindians), andPolynesians (Schurr et al. 1990; Ballinger et al. 1992; Chenet al. 1995; Torroni et al. 1996, 2001; Finnila et al. 2001; In-gman and Gyllensten 2001; Maca-Meyer et al. 2001, 2003;Salas et al. 2002; Kong et al. 2003; Mishmar et al. 2003).
Each of the mtDNA macrohaplogroups is widely diversi-fied in different regions of the globe with characteristic pat-terns of its own that are specific and unique to the region.Africa harbours the largest diversity of mtDNA haplogroups,comprising primarily of L and its haplogroups. Of the otherparts of the globe, the next highest mtDNA diversity (in theform of M and N distribution) is traced to South Asia, inparticular to Indian subcontinent (Basu et al. 2003; Metspaluet al. 2004; Palanichamy et al. 2004; Quintana-Murci et al.2004; Sun et al. 2006; Thangaraj et al. 2006; Chaubey et al.2007). This could be attributed to the major role that the In-dian subcontinent had played during early period of humanevolution after dispersal of man out of Africa. Among thetwo macrohaplogroups M and N, M is more prevalent andshows a wide diversity with deep-rooted lineages and region-specific unique types that are hardly reported in other regionsof the world. The wide mtDNA diversity observed in Indiansubcontinent is yet another dimension of biological and cul-tural diversity, that has been a unique feature of the Indianpopulations (Ratnagar 1995; Thapar 1995).
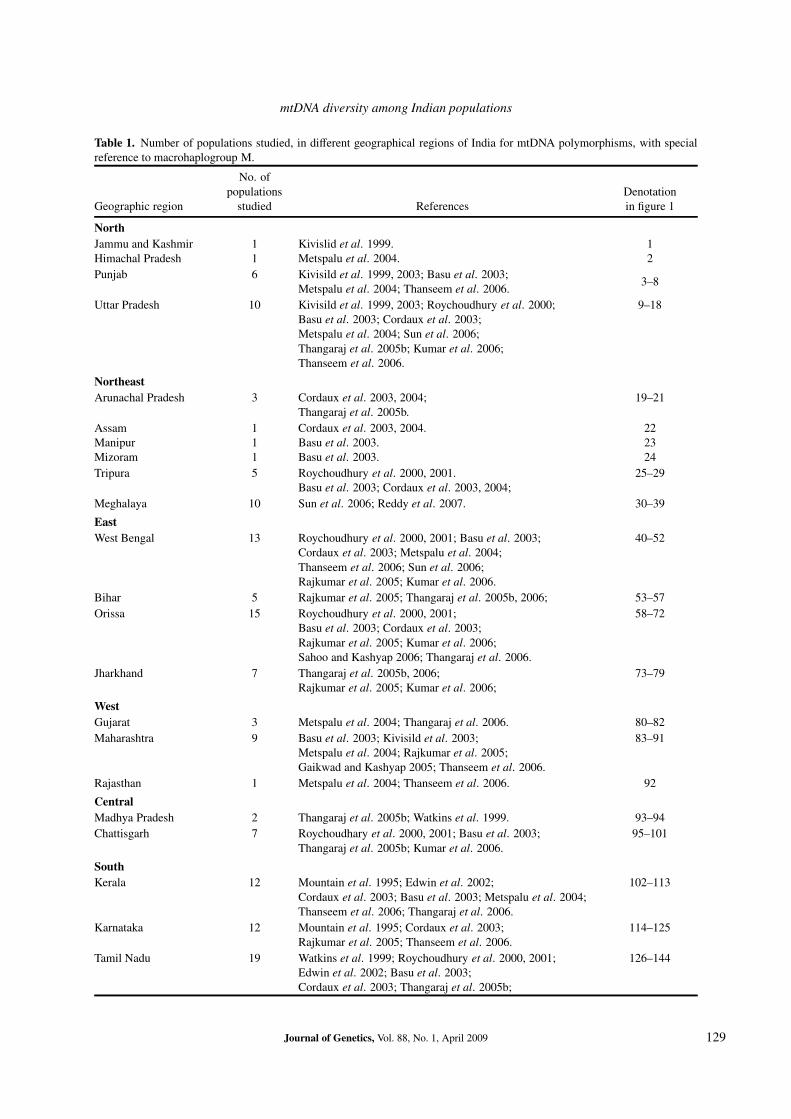
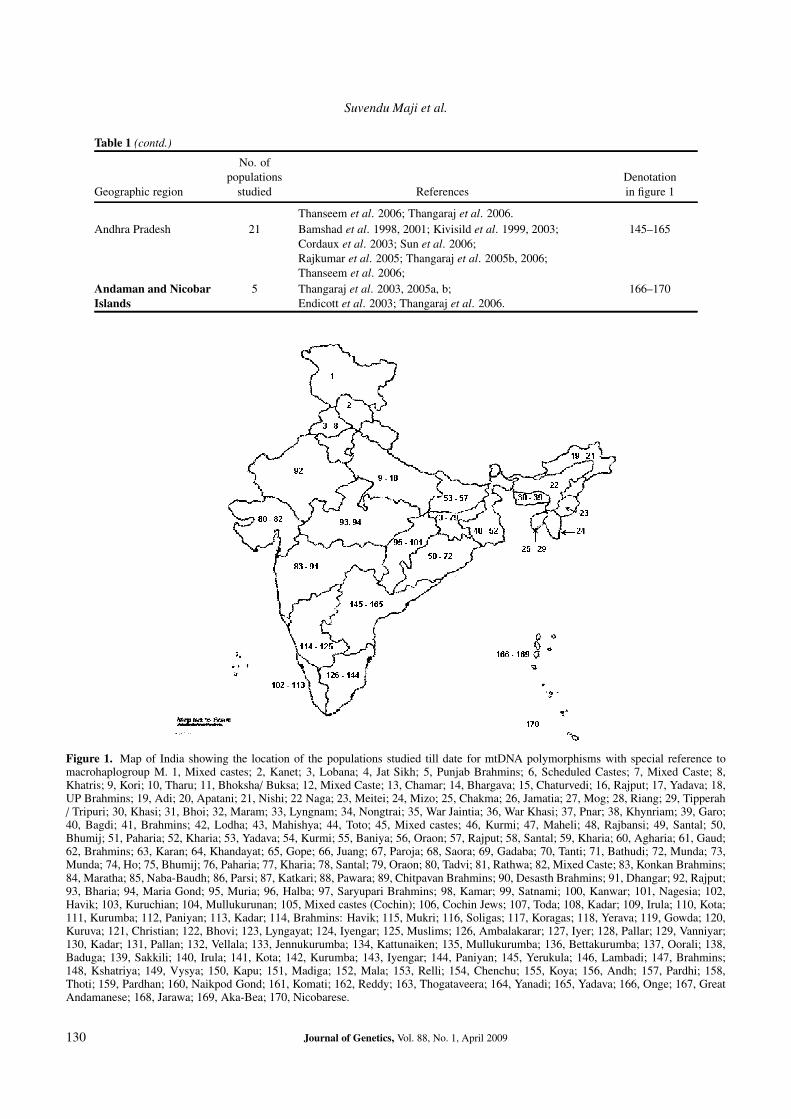
In this context, understanding the vast diversity ofIndian populations is of much significance in unraveling theregion specific diversity that could help in obtaining clarityabout the past genetic history and human migration fromIndian subcontinent to other regions, especially southeastAsia, Oceania and Australia. So far, mtDNA studies on In-dian populations have been sporadic and these have reportedmany haplogroups and sub-haplogroups of M in differentpopulations. However there is a dearth of a comprehen-sive overall view of vast diversity and distribution of M hap-logroups and its sub-haplogroups, and their variation acrosslinguistic, geographic and ethnic boundaries of the Indianpopulations. Such a comprehensive overview would aid inobtaining a glimpse of the entire M distribution in the sub-continent, which would enhance our understanding of thephylogeographic landscape of the populations and in turnwould facilitate the formulation of future studies on mtDNAin South Asia and elsewhere. The present study attemptsto comprehend the distribution of various haplogroups andsub-haplogroups of macrohaplogroup M and their associa-tion with the geography and linguistic affiliations of the pop-ulation of India. The details of the populations studied inIndia for the mtDNA polymorphisms and their geographicalaffiliation are summarized in table 1 and figure 1.
MacrohaplogroupM in Indian populationsStudies on mtDNA variation in India (Kivisild et al. 1999;Roychoudhury et al. 2000; Rajkumar et al. 2005) have re-ported the presence of macrohaplogroup M in a majority ofthe individuals (∼ 60%). The frequency of M was observedto be 58% among the caste and 72% among the tribal popula-tions (Bamshad et al. 1998, 2001; Kivisild et al. 1999, 2003;Roychoudhury et al. 2000, 2001; Basu et al. 2003; Metspaluet al. 2004). The origin of M has been controversial and sev-eral hypotheses have been put forward to explain its origin.Some authors have suggested a southwest Asian origin formacrohaplogroup M, followed by a back migration to Africa(Kivisild et al. 2003) while others support its African ances-try (Quintana-Murci et al. 1999).
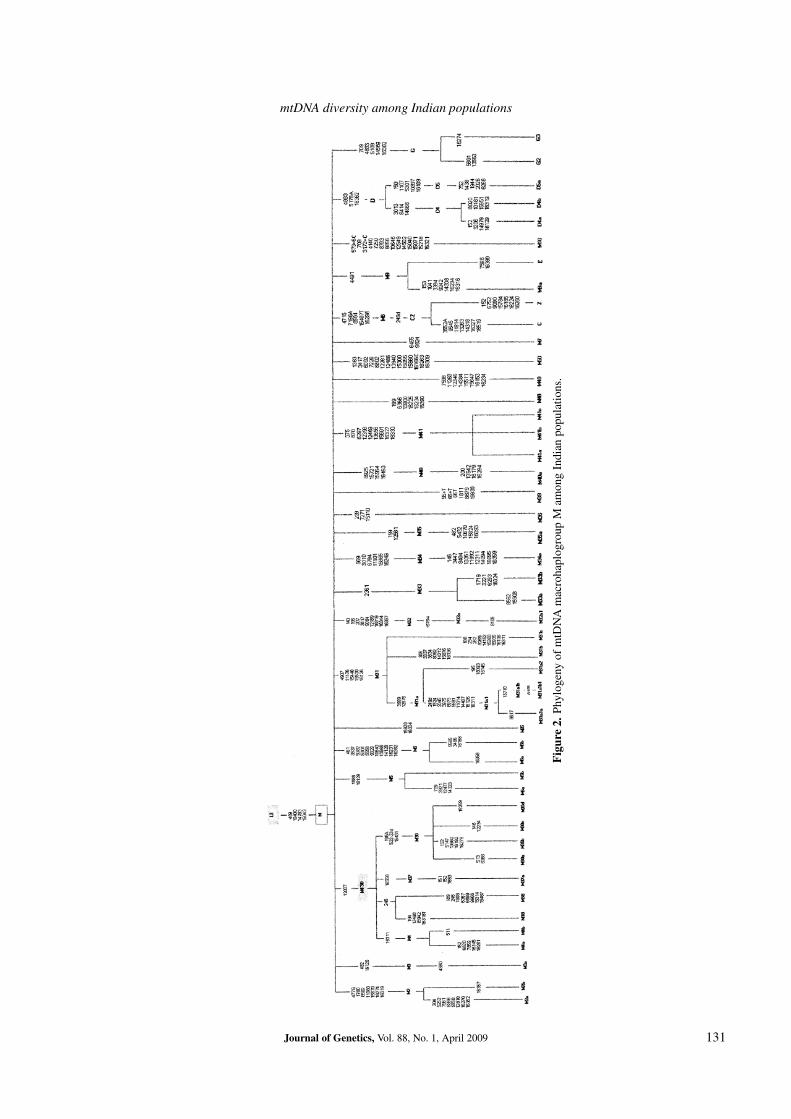
Among the defined haplogroups of M: M2, M3, M4,M5, M6, M18, M25, M30, M31, M32, M33, M34, M35,M36, M37, M38, M39, M40, M41, M48, M49 and M50 arethe India-specific lineages. The India-specific detailed phy-logeny of macrohaplogroup M is shown in figure 2.
Haplogroup M2
Haplogroup M2, defined by the motif 447G-1780-8502-11083-15670-16274-16319, consists of sub-haplogroupsM2a (5252-7961-8396-9758-12810-16270-16319) and M2b(16274-16319-16357) (Kivisild et al. 2003; Rajkumar et al.2005; Sun et al. 2006; Thangaraj et al. 2006). M2 hasbeen characterized to be the most ancient haplogroup inthe subcontinent and approximately one tenth of the In-dian haplogroup M fall into M2 (Kivisild et al. 2003).
128 Journal of Genetics, Vol. 88, No. 1, April 2009
mtDNA diversity among Indian populations
Table 1. Number of populations studied, in different geographical regions of India for mtDNA polymorphisms, with specialreference to macrohaplogroup M.
No. ofpopulations Denotation
Geographic region studied References in figure 1
NorthJammu and Kashmir 1 Kivislid et al. 1999. 1Himachal Pradesh 1 Metspalu et al. 2004. 2Punjab 6 Kivisild et al. 1999, 2003; Basu et al. 2003; 3–8
Metspalu et al. 2004; Thanseem et al. 2006.Uttar Pradesh 10 Kivisild et al. 1999, 2003; Roychoudhury et al. 2000; 9–18
Basu et al. 2003; Cordaux et al. 2003;Metspalu et al. 2004; Sun et al. 2006;Thangaraj et al. 2005b; Kumar et al. 2006;Thanseem et al. 2006.
NortheastArunachal Pradesh 3 Cordaux et al. 2003, 2004; 19–21
Thangaraj et al. 2005b.Assam 1 Cordaux et al. 2003, 2004. 22Manipur 1 Basu et al. 2003. 23Mizoram 1 Basu et al. 2003. 24Tripura 5 Roychoudhury et al. 2000, 2001. 25–29
Basu et al. 2003; Cordaux et al. 2003, 2004;Meghalaya 10 Sun et al. 2006; Reddy et al. 2007. 30–39
EastWest Bengal 13 Roychoudhury et al. 2000, 2001; Basu et al. 2003; 40–52
Cordaux et al. 2003; Metspalu et al. 2004;Thanseem et al. 2006; Sun et al. 2006;Rajkumar et al. 2005; Kumar et al. 2006.
Bihar 5 Rajkumar et al. 2005; Thangaraj et al. 2005b, 2006; 53–57Orissa 15 Roychoudhury et al. 2000, 2001; 58–72
Basu et al. 2003; Cordaux et al. 2003;Rajkumar et al. 2005; Kumar et al. 2006;Sahoo and Kashyap 2006; Thangaraj et al. 2006.
Jharkhand 7 Thangaraj et al. 2005b, 2006; 73–79Rajkumar et al. 2005; Kumar et al. 2006;
WestGujarat 3 Metspalu et al. 2004; Thangaraj et al. 2006. 80–82Maharashtra 9 Basu et al. 2003; Kivisild et al. 2003; 83–91
Metspalu et al. 2004; Rajkumar et al. 2005;Gaikwad and Kashyap 2005; Thanseem et al. 2006.
Rajasthan 1 Metspalu et al. 2004; Thanseem et al. 2006. 92
CentralMadhya Pradesh 2 Thangaraj et al. 2005b; Watkins et al. 1999. 93–94Chattisgarh 7 Roychoudhary et al. 2000, 2001; Basu et al. 2003; 95–101
Thangaraj et al. 2005b; Kumar et al. 2006.
SouthKerala 12 Mountain et al. 1995; Edwin et al. 2002; 102–113
Cordaux et al. 2003; Basu et al. 2003; Metspalu et al. 2004;Thanseem et al. 2006; Thangaraj et al. 2006.
Karnataka 12 Mountain et al. 1995; Cordaux et al. 2003; 114–125Rajkumar et al. 2005; Thanseem et al. 2006.
Tamil Nadu 19 Watkins et al. 1999; Roychoudhury et al. 2000, 2001; 126–144Edwin et al. 2002; Basu et al. 2003;Cordaux et al. 2003; Thangaraj et al. 2005b;
Journal of Genetics, Vol. 88, No. 1, April 2009 129
Suvendu Maji et al.
Table 1 (contd.)No. of
populations DenotationGeographic region studied References in figure 1
Thanseem et al. 2006; Thangaraj et al. 2006.Andhra Pradesh 21 Bamshad et al. 1998, 2001; Kivisild et al. 1999, 2003; 145–165
Cordaux et al. 2003; Sun et al. 2006;Rajkumar et al. 2005; Thangaraj et al. 2005b, 2006;Thanseem et al. 2006;
Andaman and Nicobar 5 Thangaraj et al. 2003, 2005a, b; 166–170Islands Endicott et al. 2003; Thangaraj et al. 2006.
130 Journal of Genetics, Vol. 88, No. 1, April 2009
mtDNA diversity among Indian populations
Figure2.
Phyl
ogen
yof
mtD
NA
mac
roha
plog
roup
Mam
ong
Indi
anpo
pula
tions
.
Journal of Genetics, Vol. 88, No. 1, April 2009 131
Suvendu Maji et al.
Thangaraj et al. (2006) estimated a coalescent time of around60, 200±8600 yr for M2 and 38, 000±10, 200 yr for its sub-clade M2a.
The frequency of M2 increases as we progress fromIndo–European speaking populations in the north (∼6% ofM) to Dravidian speaking populations in the south (∼13%of M) (Metspalu et al. 2004). M2 was reported in a Gowdaindividual of Karnataka (Rajkumar et al. 2005) and two in-dividuals of Thogataveera population from Andhra Pradesh(Sun et al. 2006). Although M2 is characteristic of the castepopulations of south India, the tribal populations: Chenchuand Koya also show high frequency of M2 (Kivisild et al.2003). A high frequency (19%) of haplogroup M2 was ob-served among the Austro–Asiatic speaking tribal populations(Basu et al. 2003); however, further analysis of the sequencesrevealed a corrected frequency of about 2% for M2 amongthe Austro–Asiatic speaking tribal groups of West Bengal(Metspalu et al. 2004). This frequency is comparable to M2frequency (>3%) in Indo–European speaking tribal popula-tions of Punjab and Uttar Pradesh, but significantly lowerthan its frequency (> 14%) among the Dravidian speakingpopulations of Andhra Pradesh.
M2 was completely absent among the Tibeto–Burmanspeaking tribals and exhibited high frequency among the trib-als of central India (Basu et al. 2003). The presence ofM2a was reported in individuals from Chenchu population ofAndhra Pradesh, Kuruva of Karnataka and Katkari of Maha-rashtra (Rajkumar et al. 2005). The sub-haplogroup also ex-hibited its presence in Reddy and Thogataveera populationsof Andhra Pradesh (Sun et al. 2006). M2a has also been re-ported in Karan and Gope populations of Orissa (Sahoo andKashyap 2006) and in two individuals of Maratha popula-tion from Western India (Gaikwad and Kashyap 2005). An-other sub-haplogroup of M2, M2b, defined by the presenceof T16357C mutation in addition to the M2 defining basalmutations, was reported in an individual from Kuruva popu-lation of Karnataka (Rajkumar et al. 2005).
Haplogroup M3
M3 (482-16126) was found to exhibit a high frequency of9.64% among the Dravidian speaking tribals of south India(Basu et al. 2003). In this study, however, the Dravidianspeaking tribes were mainly sampled from Tamil Nadu andincluded Irula, Kota, Kurumba and Toda tribes. M3 hap-logroup was also reported among the Chenchu and Koya ofAndhra Pradesh (Kivisild et al. 2003). It was also the mostfrequent haplogroup (17%) among the three tribal popula-tions (Pardhan, Naikpod and Andh) (Thanseem et al. 2006).Gaikwad and Kashyap (2005) observed M3 in Maratha pop-ulation of western India, and Sahoo and Kashyap (2006) re-ported the presence of M3 among the Khandayats of easternIndia. M3 was observed even among Paniya from Kerala(Thangaraj et al. 2006).
The classification of haplogroup M3, which was previ-ously characterized by a coding region mutation 4580 along
with the control region substitutions 482 and 16,126, wasrecently revised by Thangaraj et al. (2006). Their studysuggested that the mutation at 4580 arose later and thiswas represented as sub-haplogroup M3a. M3a was concen-trated in northwestern India (22% among Parsees of Mum-bai) suggesting that the region may have been the ancestralsource. High frequencies of M3a were also reported amongthe Rajputs of Rajasthan (14%), Brahmins of Uttar Pradesh(16%) (Metspalu et al. 2004), and in Karan and Juang pop-ulations of Orissa (Sahoo and Kashyap 2006). The coales-cence times of M3 and M3a was calculated to be 27,100 ±10,200 and 16, 400 ± 6100 yr, respectively (Thangaraj et al.2006).
Haplogroup M4
M4 (12007-16311) was estimated to have an overall fre-quency of ∼15% in India with complete absence amongAustro–Asiatic speaking tribals and exclusive presenceamong the Totos of West Bengal (Basu et al. 2003). Thehaplogroup has also been reported among the Dhangars andChitpavan-Brahmins of Maharashtra of western India (Gaik-wad and Kashyap 2005).
Haplogroup M4 shares the 12,007 transition with M18,M30, M37 and M38 and is thus included along with thesehaplogroups in a super-branch nested in M, named as M4′30.M4 consists of a sub-haplogroup M4a that is defined bytwo coding (6620 and 7859) and three control region (152,16145 and 16261) mutations in addition to M4 definingmutation sites (Thangaraj et al. 2006). M4a is sparselyspread in most of India with no obvious geographical cline.The sub-haplogroup was found in southeastern Tamil Naduand Andhra Pradesh but was completely absent among theneighbouring states of Karnataka and Kerala (Metspalu etal. 2004). M4a was also observed among caste popula-tions (Oriya Brahmins and Khandayat) and a tribe (Paroja) ofOrissa (Sahoo and Kashyap 2006). Thangaraj et al. (2006)reported the presence of M4a in Tadwi population of Gujarat.In addition, another sub-haplogroup of M4, M4b (511), wasobserved in samples of Thogataveera (Andhra Pradesh) andBrahmins (Uttar Pradesh) by Sun et al. (2006). The age ofM4 haplogroup was estimated to be 25, 700 ± 8100 yr andthat of its sub-haplogroups, M4a and M4b, was calculated tobe 15, 400 ± 6300 yr (Thangaraj et al. 2006). The coales-cence time of M4′30 was computed to be 61, 700 ± 12, 600yr (Thangaraj et al. 2006).
Haplogroup M5
M5 (1888-16129) was observed to be predominant amongthe castes rather than tribes (Basu et al. 2003). Sun et al.(2006) reported haplogroup M5 in individuals from Bhargavaand Chaturvedi (Brahmin) populations of Uttar Pradesh andfrom Thogataveera population of Andhra Pradesh. Individ-uals from Rajputs of Bihar and Muslims of Karnataka werealso found to harbour this haplogroup (Rajkumar et al. 2005).
132 Journal of Genetics, Vol. 88, No. 1, April 2009
mtDNA diversity among Indian populations
The haplogroup is also present in three predominant castepopulations of Maharashtra, namely, Maratha, Desasth Brah-min and Chitpavan Brahmin (Gaikwad and Kashyap 2005)and also among the caste groups of Orissa, viz., Oriya Brah-mins, Karan and Gope (Sahoo and Kashyap 2006). But incontrast to the predominance of M5 in caste populations, thetribe Koya displays the presence of M5 upto 32% (Kivisild etal. 2003). Even the tribes of Orissa (Juang, Saora and Paroja)show the presence of M5 but in comparatively low frequencyof about 5%–10% (Sahoo and Kashyap 2006).
The sub-haplogroup of M5, M5a (709-3921-12477-14323) was reported in individuals from Brahmin popu-lations of Uttar Pradesh and from Reddy populations ofAndhra Pradesh (Sun et al. 2006). Rajkumar et al. (2005)observed this sub-haplogroup in a Bhovi individual fromKarnataka of southern India and Thangaraj et al. (2006)found M5a in Gadaba population of Orissa. Another sub-haplogroup of M5, M5b was reported in Saora and Parojapopulations of Orissa (Sahoo and Kashyap 2006). The coa-lescence times of M5 and its sub-haplogroup M5a was esti-mated to be 52, 000 ± 14, 600 and 23, 100 ± 7700 yr, respec-tively (Thangaraj et al. 2006).
Haplogroup M6
M6 (461-3537-5082-5301-5558-9329-10640-13966-14128-16231-16362) is primarily found in the Indus valley andin the western shores of the Bay of Bengal and its sub-haplogroups M6a (16231-16356-16362) and M6b (5585-3486-16188-16231-16362) are concentrated towards thesouthwest and northeast part of India, respectively (Metspaluet al. 2004). M6 was observed in Saora and Paroja tribes ofOrissa by Sahoo and Kashyap (2006). The highest frequen-cies of M6a and M6b were found amongst the Mukri, sched-ule caste from Karnataka (17%) and in Kashmir (10%), re-spectively (Metspalu et al. 2004). In general, M6a was foundto be present in southeastern Tamil Nadu and Andhra Pradeshwhile absent in neighbouring states, Karnataka and Kerala(Metspalu et al. 2004). This was a major subclade amongthe Chenchu and Koya of Andhra Pradesh too (Kivisild et al.2003). M6a was also reported in Reddy of Andhra Pradesh(Sun et al. 2006); Maratha and Dhangar of Maharastra (Gaik-wad and Kashyap 2005) and Brahmins of Orissa (Sahoo andKashyap 2006). The age of the haplogroup M6 and its sub-haplogroup M6a was estimated to be 27, 600 ± 9700 and23, 100± 7700 yr, respectively (Thangaraj et al. 2006). M6bwas reported in Reddy population of Andhra Pradesh by Sunet al. (2006) and recently in a sample of Paniya from Ker-ala (Thangaraj et al. 2006). The lineage was found in fairlygood frequency among the Pardhan tribe of Andhra Pradesh,in a study by Thanseem et al. (2006). The coalescent timefor this sub-haplogroup was calculated to be 6000 ± 2100 yr(Metspalu et al. 2004).
Haplogroups M18 and M25
The M18 haplogroup was defined by Metspalu et al. (2004)based on the transversion at np 16318 and later the defini-tion was revised by Thangaraj et al. (2006). Presently, thehaplogroup is characterized by two coding region mutations(12498 and 15942) and an additional control region muta-tion (194). This haplogroup is spread at low frequenciesin India, except for the extreme northern region and alongthe coast of Arabian Sea. High incidence (33%) of the hap-logroup was reported in Austro–Asiatic speaking Lodha ofWest Bengal (Metspalu et al. 2004). A relatively high fre-quency of M18 (13% of M and 8.3% of the total) was ob-served in Pardhan of Andhra Pradesh, while it was com-pletely absent in Naikpod and Andh tribes (Thanseem et al.2006). M18 was also observed in Brahmins of Uttar Pradesh(Sun et al. 2006), Desasth Brahmin of Maharastra (Gaik-wad and Kashyap 2005) and Khandayat of Orissa (Sahoo andKashyap 2006). Oraon from Bihar was also found to possessthis haplogroup (Thangaraj et al. 2006). The coalescenceage of this haplogroup was estimated to be 20, 800± 8900 yr(Thangaraj et al. 2006).
Haplogroup M25 was tentatively named by Metspalu etal. (2004) based on a transition at np 16304 combined withG15928A mutation. Compared to M18, M25 is moderatelyfrequent in Kerala and Maharastra but hardly found in otherparts of the subcontinent. The haplogroup was reported inan individual of Naikpod Gond of Andhra Pradesh (Rajku-mar et al. 2005); Dhangar and Desasth Brahmins of Ma-harashtra (Gaikwad and Kashyap 2005) and Khandayat ofOrissa (Sahoo and Kashyap 2006). The lineage constituted9.5% of the total M lineages in Naikpods (Thanseem et al.2006). Coalescence estimates for this haplogroup is about20,100 ± 6800 yr (Thangaraj et al. 2006).
Haplogroup M30
Rajkumar et al. (2005) identified and designated a new lin-eage M30 (G12007A) and M30a (T195A and G15431A)based on complete mitochondrial genome sequencing of 23Indian samples. The mutations characterizing this lineagewas observed in five samples from eastern part of India, viz.,Bihar (Kurmi, Yadav and Baniya), West Bengal (Mahishya)and Orissa (Saora) and two samples from south India (Chris-tians of Karnataka and Lambadi of Andhra Pradesh). How-ever, later the definition of M30 was narrowed down by Sunet al. (2006) and M30 was later identified by the mutationsT195A and G15431A besides G12007A. The study recog-nized four sub-haplogroups of M30 viz, M30a, M30b, M30c,M30d based on the observed mutations sites.
An individual from Reddy population of Andhra Pradeshwas categorized into M30a; a sample of Thogataveera fromAndhra Pradesh was classified into M30b; M30c was foundin Thogataveera of Andhra Pradesh and Chaturvedi of Ut-tar Pradesh; M30d was identified among Bhargava of UttarPradesh and Thogataveera of Andhra Pradesh. Sahoo and
Journal of Genetics, Vol. 88, No. 1, April 2009 133
Suvendu Maji et al.
Kashyap (2006) reported haplogroup M30 in castes (OriyaBrahmin, Karan, Khandayat and Gope) and tribes (Juang andSaora) of Orissa. Saora exhibited a high frequency of ∼32%of M30 followed by Karan (∼24%), Oriya Brahmin (∼20%)and Juang (∼20%), while Khandayat and Gope showed alower frequency (∼ 6%) of M30. M30 was also present atlow frequencies (1.5%–2.5%) in Pardhan, Naikpod Gond andAndh tribal populations of Andhra Pradesh (Thanseem et al.2006). The coalescence time of haplogroup M30 was esti-mated to be 15, 400± 6300 yr and that of its sub-haplogroupsM30a and M30c were calculated to be 5100 ± 3600 yr. Theages of M30b and M30d were computed to be 4177 ± 2800and 12, 800 ± 5700 yr, respectively (Thangaraj et al. 2006).
Haplogroups M31 and M32
Rajkumar et al. (2005) defined another new haplogroup,M31, characterized by a substitution at A5319G, in four sam-ples, of Karnataka (Iyengar Brahmin and Lingayat), AndhraPradesh (Komati) and Maharashtra (Pawar). Thangaraj etal. (2005a) designated two new clades M31 (4907-11176-15440-15530) and M32 (3817-9064-12189-15754) by theanalysis of the complete mtDNA sequence of Onge and GreatAndamanese and suggested an in situ origin of these hap-logroups on the Andaman Island. The coalescence time ofM31 and M32 was estimated to be 3000 ± 2000 ybp and12000 ± 4000 ybp, respectively (Thangaraj et al. 2005a).
The Andaman-specific lineage M31 suggests two clear-cut population-specific subclades. Onge and Jarwa shareM31a1 branch (200 and 13710), while M31a2 (9617)clade is found only among the Great Andamanese in-dividuals (Thangaraj et al. 2006). Based on the com-ments of Palanichamy et al. (2006), Thangaraj et al.(2006) reconstructed the classification of M31 lineage byincluding a Rajbanshi sequence from Palanichamy et al.(2006). The Rajbanshi sample was categorized into the sub-haplogroup M31b (152-808-3337-3834-8092-14212-15440-15667-16126-16136) based on the coding region substitu-tions.
Later, Endicott et al. (2006) suggested some alter-ations in the phylogeny of M31 (4907-11176-15440-15530-16126) and M32 (143-195-207-3817-9064-12189-16319-16344-16357) haplogroups, based on the discovery of somenovel mutations and also revised the definition of theAndaman-specific M31a1 and M32 lineages. The phylogenyof haplogroup M31 now consists of M31a (3999-12876)and M31b (808-3337-3834-8092-14212-15876-16136), ofwhich M31b was reported in a Rajbanshi individual.M31a in turn includes M31a1 (249del-1524-2045-3975-8973-9581-11014-14407-16126-16311) and M31a2 (195-16093-16145). Two sub-clades of M31a1 were defined viz.,M31a1a (9617) and M31a1b (13710) among the speakers ofGreat Andamanese and Onge-Jarawa dialects, respectively.M31a1b1 of sub-clade M31a1b, was defined in a Jarawaindividual based on the coding region mutation 8108 apartfrom the mutations characterizing M31a1 and M31a1b lin-
eages. M31a2 was reported among the Lodha, Chenchuand Lambadi individuals. Recently, Reddy et al. (2007) re-ported a novel sub-haplogroup M31c (188-234-282-9269-14152-15300-15935-16136-16311), under the haplogroupM31, among the Austro–Asiatic Khasi populations (∼5%),with a maximum frequency among the Bhoi (∼17%). Thestudy also suggested a TMRCA of ∼ 40,000 ybp for M31haplogroup. Haplogroup M32 includes M32a (15754) and itssub-clade M32a1 (8108), reported among Great Andamaneseand Onge-Jarawa speakers, respectively.
Haplogroup M33
Haplogroup M33 is defined by the coding region substitu-tion at np 2361. Sun et al. (2006) reported this haplogroupin Rajbansi population of West Bengal and Brahmins of Ut-tar Pradesh. The haplogroup was reported in Naikpod andAndh populations (∼3 to 3.4%) but was completely absentin Pardhan (Thanseem et al. 2006). A sub-haplogroup ofM33, M33a (8562-15908), was reported in Tadvi popula-tion of Gujarat (Thangaraj et al. 2006) and among Khasi-Khumic populations (∼5%), with an exceptionally high fre-quency (∼55%) among the Garo of Meghalaya (Reddy et al.2007). Recently, a novel sub-haplogroup M33b (1719-3221-6293-16324) was reported by Reddy et al. (2007) amongPnar (∼22%), Lyngngam (∼2%), Khynriam (∼3%) and Garo(∼3%) tribes. The TMRCA of haplogroup M33 was reportedto be ∼50, 000 ybp (Reddy et al. 2007).
Haplogroups M34, M35, M36, M37, M38, M39 and M40
Sun et al. (2006) observed the motif 569-3010-6794-11101-15865-16249 in two mtDNAs of Brahmins of Uttar Pradesh,and categorized the motif into haplogroup M34. Thangaraj etal. (2006) reported sub-haplogroup M34a, in a random sam-ple drawn from Karnataka, characterized by six coding re-gion (3447-8404-10361-11992-12311-14094) and three con-trol region mutations (at sites 146, 16095 and 16359). Thecoalescence time of the haplogroups M34 and M34a werecomputed to be around 28, 400±8300 and 15, 400±6300 yr,respectively (Thangaraj et al. 2006).
Haplogroup M35 is recognized by two mutations (at sites199 and 12561) and its sub-haplogroup M35a is character-ized by another five mutations (at sites 482, 5432, 10670,15924 and16093). One sample from Thogataveera and twosamples from Reddy of Andhra Pradesh were categorizedinto haplogroups M35 and M35a, respectively (Sun et al.2006). M35 was also reported in Pardhan (0.52%) and Andh(6.06%) tribal populations of Andhra Pradesh (Thanseemet al. 2006). The coalescence times of the haplogroupsM35 and M35a were estimated to be 25, 700 ± 8100 and10, 300 ± 5100 yr, respectively (Thangaraj et al. 2006).
Three specific mutations (at sites 239, 7271 and 15110)define haplogroup M36 and this was reported in two samplesof Thogataveera population from Andhra Pradesh (Sun et al.2006). The coalescence time of the haplogroup was calcu-lated to be around 33, 400± 9300 yr (Thangaraj et al. 2006).
134 Journal of Genetics, Vol. 88, No. 1, April 2009
mtDNA diversity among Indian populations
Samples from Brahmins of Uttar Pradesh and Reddy ofAndhra Pradesh shared mutations 12007 and 10556, andhence were categorized into a novel haplogroup M37 (Sun etal. 2006). M37a, a sub-haplogroup of M37 was reported in asample of Rathwa (Gujarat) based on a single coding (7853)and two control region (151 and 152) mutations (Thangarajet al. 2006). The ages of the haplogroup M37 and sub-haplogroup M37a were estimated to be 28, 300±11, 900 and18, 000 ± 6800 yr, respectively (Thangaraj et al. 2006).
The motif of nine mutations, at sites 189, 246, 1808,6367, 6899, 9966, 12007, 15314 and 15497, designates hap-logroup M38 (Sun et al. 2006). The haplogroup was ob-served in Bhargava of Uttar Pradesh and Thogatveera ofAndhra Pradesh (Sun et al. 2006). Recently, Thanseem etal. (2006) reported this haplogroup in Pardhan (2.07%) andNaikpod Gond (1.14%) populations of Andhra Pradesh. Thecoalescence time of M38 was computed to be 21, 000 ±7100 yr (Thangaraj et al. 2006).
Haplogroup M39, characterized by a pronounced HVS-IImotif (55+T, 65+T and 66T) and three coding region muta-tions (at sites 1811, 8679 and 15938), was observed in Bhar-gava of Uttar Pradesh, Reddy and Thogataveera of AndhraPradesh (Sun et al. 2006). Thanseem et al. (2006) observeda frequency of 12.12% of M39 in Andh tribal population ofAndhra Pradesh, but the haplogroup was completely absentamong the other two studied populations, Pardhan and Naik-pod Gond. The coalescence time of M39 was calculated tobe 27, 600± 7300 yr (Thangaraj et al. 2006).
Haplogroup M40 consists of a specific motif composedof four mutations (at sites 8925, 15721, 15954 and 16463)and was observed in the samples of Reddy and Thogataveerapopulations of Andhra Pradesh. M40a, a sub-haplogroupof M40, was defined by Thangaraj et al. (2006). The sub-haplogroup is defined by a coding (13542) and three con-trol region (200-16179-16294) mutations. Thanseem et al.(2006) reported the presence of M40 in Pardhan (0.52%)of Andhra Pradesh, however the haplogroup was absent inNaikpod Gond and Andh populations that were includedin the study. The ages of the haplogroup M40 and sub-haplogroup M40a were computed to be 24, 100 ± 7700 and18, 000 ± 6800 yr, respectively (Thangaraj et al. 2006).
Haplogroup M41
Haplogroup M41 (six coding, 870-6297-12398-12469-13656-15601 and three control region, 375-16327-16330mutations) was reported in the samples of Pardhan fromAndhra Pradesh (Thangaraj et al. 2006). Recently, Thanseemet al. (2006) also reported the presence of M41 in Pardhan ofAndhra Pradesh (3.11%). The other two studied populations,Andh and Naikpod Gond, showed complete absence of thishaplogroup. The haplogroup was tentatively classified intothree sub-haplogroups M41a, M41b and M41c based on themutation sites observed. The age of M41 was calculated tobe 12, 800± 5700 yr (Thangaraj et al. 2006).
Haplogroups M48, M49 and M50
Three novel haplogroups, M48, M49 and M50, were recentlydefined by Reddy et al. (2007) among the Austro–AsiaticKhasi tribes. Haplogroup M48 (199-6366-15900-16225-16234-16390) was found at a frequency of about 11% amongthe Austro–Asiatic Khasi groups, ranging from zero in War-Jaintia to as high as 26% in Lyngngam, with a frequency of4% among the Garo of Meghalaya. Haplogroups M49 (7598-11263-12346-14384-15511-15647-16153-16234) and M50(1383-3417-6092-7226-8802-12281-12486-13940-15300-15055-15660-16166C-16263-16309) were found at an av-erage frequency of about 3% in the Khasi populations andwas completely absent in the Garo as well as in some of thesubgroups of Khasi.
Other minor haplogroups of M
Other M sub-haplogroups that are common in mainland eastAsia (M7, M8 (including C, Z), M9, D, G) have also beenreported in India at relatively lower frequencies. HaplogroupM8 is characterized by the transitions at 4715, 8584, 16298and transversions at 7196 and 15487 and consists of sub-haplogroups C, Z and M8a (Yao et al. 2002). M8c hasbeen reported in samples from Assam (2), Himachal Pradesh(1), Karnataka (1), Kerala (6), Nagaland (5), Tamil Nadu(2), Uttar Pradesh (1) and Tripura (6) and M8z have beenreported in sample from Assam (1), Himachal Pradesh (1)and Tripura (3); whereas M8a have not yet been reported(Metspalu et al. 2004). M9 is defined by a transition at 4491(Yao et al. 2002) and consists of two sub-haplogroups M9Eand M9a. The sub-haplogroup M9a have been reported insamples from Arunachal Pradesh (2), Assam (3), HimachalPradesh (1), Tripura (3) and Uttar Pradesh (1); whereas M9Ewas completely absent (Metspalu et al. 2004). M10 hap-logroup, first defined by Yao et al. (2002) in Han Chinese,was reported by Metspalu et al. (2004) in a single individ-ual from Assam. Haplogroup D (16362, 5178A) was cate-gorized into sub-haplogroups D4 and D5 which was furtherclassified into D4a, D4b and D5a, respectively by Yao et al.(2002). Haplogroup D was reported in samples of AndhraPradesh (1), Arunachal Pradesh (4), Assam (6), HimachalPradesh (2), Nagaland (4), Punjab (1), Tripura (17) and Ut-tar Pradesh (4) of which sub-haplogroup D4 was present insamples from Assam (2), Himachal Pradesh (1), Nagaland(3), Tripura (3) and Uttar Pradesh (2). The D4 sample fromHimachal Pradesh was further categorized into D4b basedon the coding region mutations. D5a, sub-haplogroup ofD5 was observed in Assam (2), Arunachal Pradesh (2) andTripura (7) of northeastern part of India. Haplogroup G wasreported in Assam (2), Himachal Pradesh (5), Kerala (1), Ut-tar Pradesh (2) and Tripura (1). Haplogroup G was furthercategorized into their respective sub-haplogroups; G2 waspresent in Assam, Himachal Pradesh and Uttar Pradesh, andG3 was reported in Himachal Pradesh (Metspalu et al. 2004).
Journal of Genetics, Vol. 88, No. 1, April 2009 135
Suvendu Maji et al.
OverviewIn recent years, many molecular genetic evidences from sev-eral populations inhabiting the Indian subcontinent has beenobtained to understand the unresolved population genetic is-sues related to the Indian populations and the peopling ofthe subcontinent (Mountain et al. 1995; Kivisild et al. 1999,2003; Roychoudhury et al. 2000, 2001; Basu et al. 2003;Cordaux et al. 2003, 2004; Thangaraj et al. 2003, 2005a,b,2006; Palanichamy et al. 2004; Sun et al. 2006). Thoughthe number of studies (∼ 170 populations) contributed arescanty, these studies do provide us glimpse of some cleartrends of the mtDNA diversity and help in investigating fur-ther insights into the past genetic history of man in India.
A majority of the populations (∼ 60%) belong to macro-haplogroup M, and a higher frequency of this macrohaplo-type is observed among tribes as compared to caste pop-ulations. Several India-specific haplogroups (∼ 22) of Mhave been found, and are probably of in situ origin. Themost ancient haplogroup M2 is reported among the Austro–Asiatic speaking Mundari, Dravidian (southern), and Indo–European speaking castes and tribes, but is completely ab-sent among Tibeto–Burman speakers. M3 is predominantamong southern Dravidian tribes; M4 is absent in Austro–Asiatic tribes and M5 is more a caste-specific haplogroup.Haplogroups M31 and M32 are mainly found among An-daman tribes, but however, the sub-haplogroup of M31,M31b shows presence in a Rajbanshi (West Bengal) sam-ple and another sub-haplogroup M31c is present among theKhasi-Khmuic speaking Austro–Asiatic tribes. Some novelhaplogroups especially M48, M49, M50 are found amongKhasi sub-tribes of the northeastern hills.
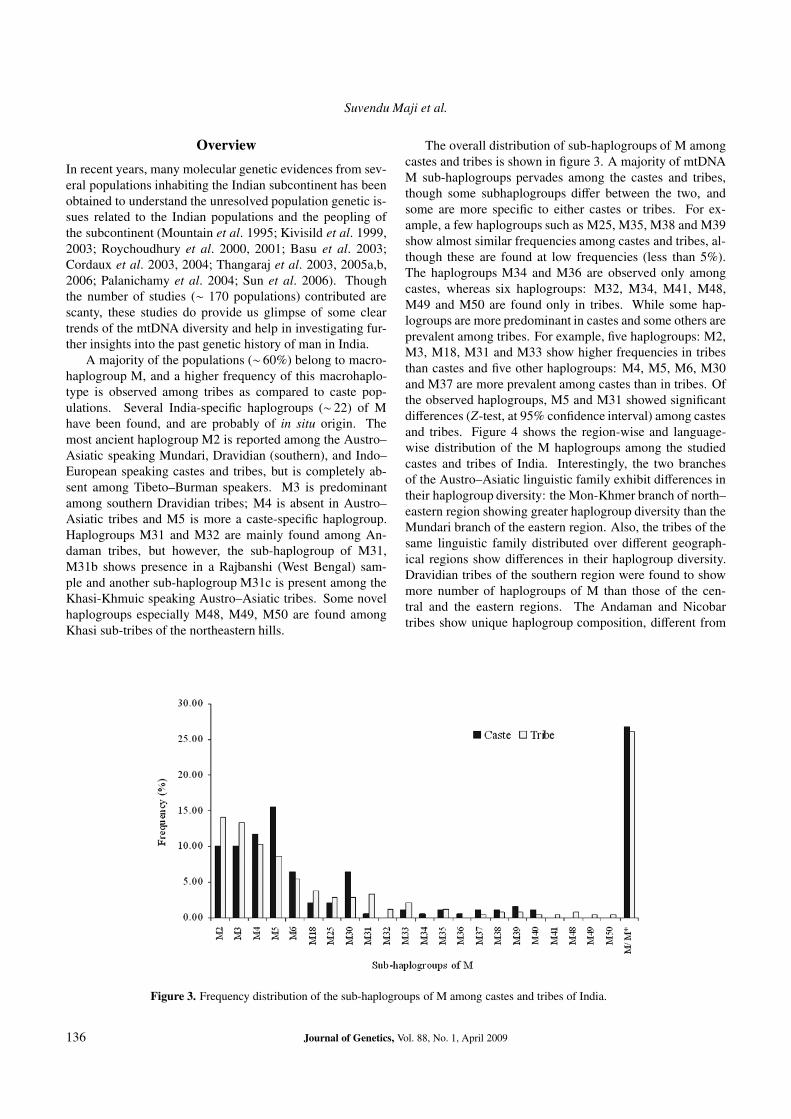
The overall distribution of sub-haplogroups of M amongcastes and tribes is shown in figure 3. A majority of mtDNAM sub-haplogroups pervades among the castes and tribes,though some subhaplogroups differ between the two, andsome are more specific to either castes or tribes. For ex-ample, a few haplogroups such as M25, M35, M38 and M39show almost similar frequencies among castes and tribes, al-though these are found at low frequencies (less than 5%).The haplogroups M34 and M36 are observed only amongcastes, whereas six haplogroups: M32, M34, M41, M48,M49 and M50 are found only in tribes. While some hap-logroups are more predominant in castes and some others areprevalent among tribes. For example, five haplogroups: M2,M3, M18, M31 and M33 show higher frequencies in tribesthan castes and five other haplogroups: M4, M5, M6, M30and M37 are more prevalent among castes than in tribes. Ofthe observed haplogroups, M5 and M31 showed significantdifferences (Z-test, at 95% confidence interval) among castesand tribes. Figure 4 shows the region-wise and language-wise distribution of the M haplogroups among the studiedcastes and tribes of India. Interestingly, the two branchesof the Austro–Asiatic linguistic family exhibit differences intheir haplogroup diversity: the Mon-Khmer branch of north–eastern region showing greater haplogroup diversity than theMundari branch of the eastern region. Also, the tribes of thesame linguistic family distributed over different geograph-ical regions show differences in their haplogroup diversity.Dravidian tribes of the southern region were found to showmore number of haplogroups of M than those of the cen-tral and the eastern regions. The Andaman and Nicobartribes show unique haplogroup composition, different from
Figure 3. Frequency distribution of the sub-haplogroups of M among castes and tribes of India.
136 Journal of Genetics, Vol. 88, No. 1, April 2009
mtDNA diversity among Indian populations
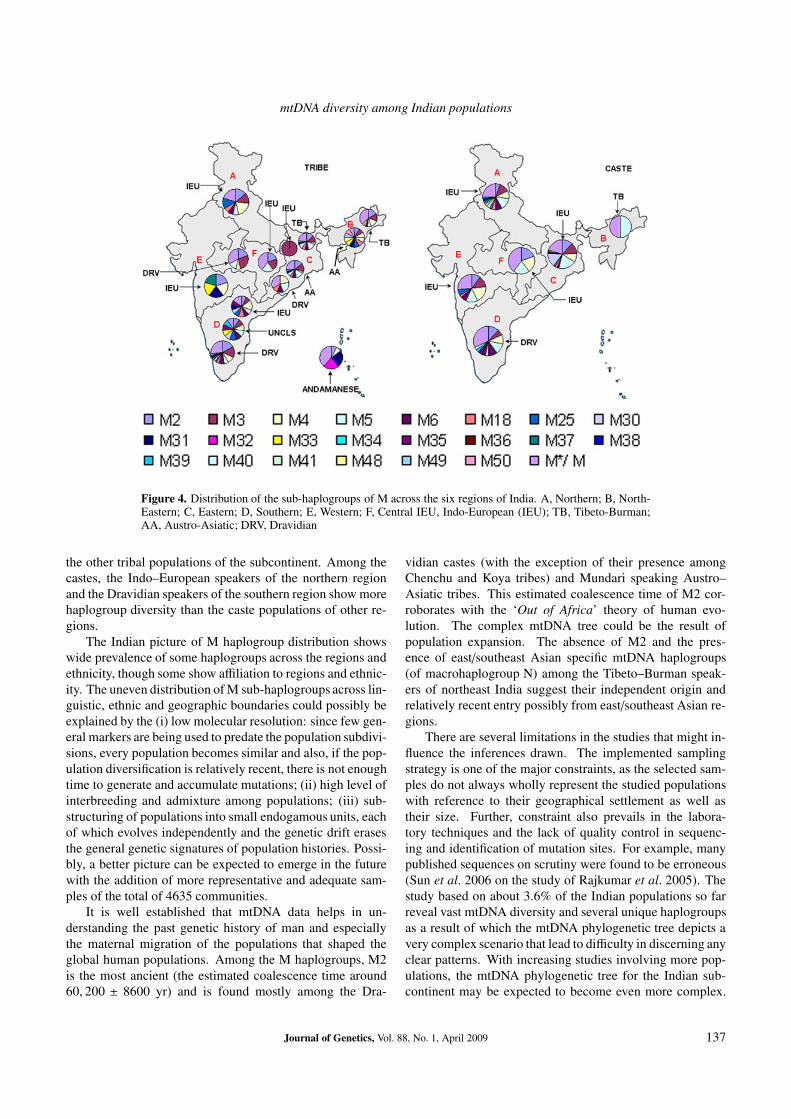
Figure 4. Distribution of the sub-haplogroups of M across the six regions of India. A, Northern; B, North-Eastern; C, Eastern; D, Southern; E, Western; F, Central IEU, Indo-European (IEU); TB, Tibeto-Burman;AA, Austro-Asiatic; DRV, Dravidian
the other tribal populations of the subcontinent. Among thecastes, the Indo–European speakers of the northern regionand the Dravidian speakers of the southern region show morehaplogroup diversity than the caste populations of other re-gions.
The Indian picture of M haplogroup distribution showswide prevalence of some haplogroups across the regions andethnicity, though some show affiliation to regions and ethnic-ity. The uneven distribution of M sub-haplogroups across lin-guistic, ethnic and geographic boundaries could possibly beexplained by the (i) low molecular resolution: since few gen-eral markers are being used to predate the population subdivi-sions, every population becomes similar and also, if the pop-ulation diversification is relatively recent, there is not enoughtime to generate and accumulate mutations; (ii) high level ofinterbreeding and admixture among populations; (iii) sub-structuring of populations into small endogamous units, eachof which evolves independently and the genetic drift erasesthe general genetic signatures of population histories. Possi-bly, a better picture can be expected to emerge in the futurewith the addition of more representative and adequate sam-ples of the total of 4635 communities.
It is well established that mtDNA data helps in un-derstanding the past genetic history of man and especiallythe maternal migration of the populations that shaped theglobal human populations. Among the M haplogroups, M2is the most ancient (the estimated coalescence time around60, 200 ± 8600 yr) and is found mostly among the Dra-
vidian castes (with the exception of their presence amongChenchu and Koya tribes) and Mundari speaking Austro–Asiatic tribes. This estimated coalescence time of M2 cor-roborates with the ‘Out of Africa’ theory of human evo-lution. The complex mtDNA tree could be the result ofpopulation expansion. The absence of M2 and the pres-ence of east/southeast Asian specific mtDNA haplogroups(of macrohaplogroup N) among the Tibeto–Burman speak-ers of northeast India suggest their independent origin andrelatively recent entry possibly from east/southeast Asian re-gions.
There are several limitations in the studies that might in-fluence the inferences drawn. The implemented samplingstrategy is one of the major constraints, as the selected sam-ples do not always wholly represent the studied populationswith reference to their geographical settlement as well astheir size. Further, constraint also prevails in the labora-tory techniques and the lack of quality control in sequenc-ing and identification of mutation sites. For example, manypublished sequences on scrutiny were found to be erroneous(Sun et al. 2006 on the study of Rajkumar et al. 2005). Thestudy based on about 3.6% of the Indian populations so farreveal vast mtDNA diversity and several unique haplogroupsas a result of which the mtDNA phylogenetic tree depicts avery complex scenario that lead to difficulty in discerning anyclear patterns. With increasing studies involving more pop-ulations, the mtDNA phylogenetic tree for the Indian sub-continent may be expected to become even more complex.
Journal of Genetics, Vol. 88, No. 1, April 2009 137
Suvendu Maji et al.
This raises the necessity for developing improved methodsof classification of the mtDNA haplogroups to obtain a bet-ter clarity of the mtDNA diversity of the Indian populations.
ReferencesAnderson S., Bankier A. T., Barrell B. G., de Bruijn M. H., Coul-
son A. R., Drouin J. et al. 1981 Sequence and organization of thehuman mitochondrial genome. Nature 290, 457–465.
Andrews R. M., Kubacka I., Chinnery P. F., Lightowlers R. N.,Turnbull D. M. and Howell N. 1999 Reanalysis and revisionsof the Cambridge reference sequence for human mitochondrialDNA. Nat. Genet. 23, 147.
Ballinger S. W., Schurr T. G., Torroni A., Gan Y. Y., Hodge J. A.,Hassan K. et al. 1992 Southeast Asian mitochondrial DNA anal-ysis reveals genetic continuity of ancient Mongoloid migrations.Genetics 130, 139–152.
Bamshad M. J., Watkins W. S., Dixon M. E., Jorde L. B., Rao B. B.,Naidu J. M. et al. 1998 Female gene flow stratifies Hindu castes.Nature 395, 651–652.
Bamshad M., Kivisild T., Watkins W. S., Dixon M. E., Ricker C. E.,Rao B. B. et al. 2001 Genetic evidence on the origins of Indiancaste populations. Genome Res. 11, 994–1004.
Basu A., Mukherjee N., Roy S., Sengupta S., Banerjee S.,Chakraborty M. et al. 2003 Ethnic India: a genomic view, withspecial reference to peopling and structure. Genome Res. 13,2277–2290.
Brown W. M. 1980 Polymorphism in mitochondrial DNA of hu-man as revealed by restriction endonuclease analysis. Proc. Natl.Acad. Sci. USA 77, 3605–3609.
Cann R. L., Stoneking M. and Wilson A. C. 1987 MitochondrialDNA and human evolution. Nature 325, 31–36.
Chaubey G., Metspalu M., Kivisild T. and Villems R. 2007 Peoplingof South Asia: investigating the caste-tribe continuum in India.BioEssays 29, 91–100.
Chen Y. S., Torroni A., Excoeffier L., Santachiara-Benerecetti A. S.and Wallace D. C. 1995 Analysis of mtDNA variation in Africanpopulation reveals the most ancient of all human continent-specific haplogroups. Am. J. Hum. Genet. 57, 133–149.
Cordaux R., Saha N., Bentley G. R., Aunger R., Sirajuddin S. M.and Stoneking M. 2003 Mitochondrial DNA analysis reveals di-verse histories of tribal populations from India. Eur. J. Hum.Genet. 11, 253–264.
Cordaux R., Weiss G., Saha N. and Stoneking M. 2004 The north-east Indian passageway: a barrier or corridor for human migra-tion? Mol. Biol. Evol. 21, 1525–1533.
Denaro M., Blanc H., Johnson M. J., Chen K. H., Wilmsen F.,Cavalli-Sforza L. L. and Wallace D. C. 1981 Ethnic variationin HpaI endonuclease cleavage patterns of human mitochondrialDNA. Proc. Natl. Acad. Sci. USA 78, 5768–5772.
Elson J. L., Andrews R. M., Chinnery P. F., Lightowlers R. N, Turn-bull D. M. and Howell N. 2001 Analysis of European mtDNAsfor recombination. Am. J. Hum. Genet. 68, 145–153.
Endicott P., Gilbert T. P., Stringer C., Laiueza-Fox C., WillerslevE., Hansen J. A. and Cooper A. 2003 The genetic origins of theAndaman Islanders. Am. J. Hum. Genet. 72, 178–184.
Endicott P., Metspalu M., Stringer C., Macaulay V., Cooper A. andSanchez J. J. 2006 Multiplexed SNP typing of ancient DNA clar-ifies the origin of Andaman haplogroups amongst south Asiantribal populations. PLoS One 1, e81.
Excoffier L. and Langaney A. 1989 Origin and differentiation ofhuman mitochondrial DNA. Am. J. Hum. Genet. 44, 73–85.
Finnila S. and Majamaa K. 2001 Phylogenetic analysis of mtDNAhaplogroup TJ in a Finnish population. J. Hum. Genet. 46, 64–69.
Finnila S., Hassinen I. E., Ala-Kokko L. and Majamaa K. 2000Phylogenetic network of the mtDNA haplogroup U in northernFinland based on sequence analysis of the complete coding re-gion by conformation-sensitive gel electrophoresis. Am. J. Hum.Genet. 66, 1017–1026.
Finnila S., Lehtonen M. S. and Majamaa K. 2001 Phylogenetic net-work for European mtDNA. Am. J. Hum. Genet. 68, 1475–1484.
Gaikwad S. and Kashyap V. K. 2005 Molecular insight into the gen-esis of ranked caste populations of western India based uponpolymorphisms across non-recombinant and recombinant re-gions in genome. BMC Genome Biol. 6, 10.
Hammer M. F., Karafet T., Rasanayagam A., Wood E. T., AltheideT. K., Jenkins T. et al. 1998 Out of Africa and back again: nestedcladistic analysis of human Y chromosome variation. Mol. Biol.Evol. 15, 427–441.
Hebsgaard M. B., Wiuf C. M., Gilbert T. P., Glenner H. and Willer-slev E. 2007 Evaluating Neanderthal genetics and phylogeny. J.Mol. Evol. 64, 50–60.
Hedges S. B., Kumar S., Tamura K. and Stoneking M. 1992 Humanorigins and analysis of mitochondrial DNA sequences. Science255, 737–739.
Ingman M. and Gyllensten U. 2001 Analysis of the complete hu-man mtDNA genome: methodology and inferences for humanevolution. J. Hered. 92, 454–461.
Ingman M., Kaessmann H., Paabo S. and Gyllensten U. 2000 Mi-tochondrial genome variation and the origin of modern humans.Nature 408, 708–713.
Johnson M. J., Wallace D. C., Ferris S. D., Ratazzi M. C. andCavalli-Sforza L. L. 1983 Radiation of human mitochondriaDNA types analyzed by restriction endonuclease cleavage pat-terns. J. Mol. Evol. 19, 255–271.
Kivisild T., Bamshad M. J., Kaldma K., Metspalu M., MetspaluE., Reidla M. et al. 1999 Deep common ancestry of Indian andwestern-Eurasian mitochondrial DNA lineages. Curr. Biol. 9,1331–1334.
Kivisild T., Rootsi S., Metspalu M., Mastana S., Kaldma K., ParikJ. et al. 2003 The genetic heritage of earliest settlers persist inboth the Indian tribal and caste populations. Am. J. Hum. Genet.72, 313–332.
Kong Q-P., Yao Y-G., Sun C., Bandelt H-J., Zhu C-L. and ZhangY-P. 2003 Phylogeny of East Asian mitochondrial DNA lineagesinferred from complete sequences. Am. J. Hum. Genet. 73, 671–676.
Kumar V., Langsiteh B. T., Biswas S., Babau J. P., Rao T. N.,Thangaraj K. et al. 2006 Asian and non-Asian origins of Mon-Khmer and Mundari speaking Austro-Asiatic populations of In-dia. Am. J. Hum. Biol. 18, 461–469.
Maca-Meyer N., Gonzalez A. M., Larruga J. M., Flores C. andCabrera V. C. 2001 Major genomic mitochondrial lineages de-lineate early human expansions. BMC Genet. 2, 13.
Maca-Meyer N., Gonzalez A. M., Pestano J., Flores C., Larruga J.M. and Cabrera V. C. 2003 Mitochondrial DNA transit betweenWest Asia and North Africa inferred from U6 phylogeography.BMC Genet. 4, 15.
Macaulay V., Richards M., Hickey E., Vega E., Cruciani F., GuidaV. et al. 1999 The emerging tree of West Eurasian mtDNAs: asynthesis of control-region sequences and RFLPs. Am. J. Hum.Genet. 64, 232–249.
Macaulay V., Hill C., Achilli A., Rengo C., Clarke D., MeehanW. et al. 2005 Single, rapid coastal settlement of Asia revealedby analysis of complete mitochondrial genomes. Science 308,1034–1036.
Maddison D. R., Ruvolo M. and Swofford D. L. 1992 Geographicorigins of human mitochondrial DNA: phylogenetic evidencefrom control region sequences. Syst. Biol. 41, 111–124.
138 Journal of Genetics, Vol. 88, No. 1, April 2009
mtDNA diversity among Indian populations
Metspalu M., Kivisild T., Metspalu E., Parik J., Hudjashov G.,Kaldma K. et al. 2004 Most of the extant mtDNA boundariesin South and Southwest Asia were likely shaped during the ini-tial settlement of Eurasia by anatomically modern humans. BMCGenet. 5, 26.
Mishmar D., Ruiz-Pesini E., Golik P., Macaulay V., Clark A.G.,Hosseini S. et al. 2003 Natural selection shaped regional mtDNAvariation in humans. Proc. Natl. Acad. Sci. 100, 171–176.
Mountain J. L., Hebert J. M, Bhattacharyya S., Underhill P. A.,Ottolenghi C., Gadgil M. and Cavalli-Sforza L. L. 1995 Demo-graphic history of India and mtDNA-sequence diversity. Am. J.Hum. Genet. 56, 979–992.
Palanichamy M. G., Sun C., Agrawal S., Bandelt H. J., Kong Q. P.and Khan F. 2004 Phylogeny of mitochondrial DNA macrohap-logroup N in India, based on complete sequencing: implicationsfor the peopling of south Asia. Am. J. Hum. Genet. 75, 966–978.
Palanichamy M. G., Agrawal S., Yao Y. G., Kong Q. P., Sun C,Khan F. et al. 2006 comment on “Reconstructing the origin ofAndaman islanders”. Science 311, 470.
Quintana-Murci L., Semino O., Bandelt H-J., Passarino G., McEl-reavey K. and Santachiara-Benerecetti A. S. 1999 Genetic ev-idence of an early exit of Homo sapiens from Africa througheastern Africa. Nat. Genet. 23, 437–441.
Quintana-Murci L., Chaix R., Wells R. S., Behar D. M., SayarH. and Scozzari R. 2004 Where West meets East: the complexmtDNA landscape of the southwest and central Asian corridor.Am. J. Hum. Genet. 74, 827–845.
Rajkumar R., Banerjee J., Gunturi H. B., Trivedi R. and KashyapV. K. 2005 Phylogeny and antiquity of M macrohaplogroup in-ferred from complete mtDNA sequence of Indian specific lin-eages. BMC Evol. Biol. 5, 26.
Ratnagar S. 1995 Archaeological perspectives of early Indian soci-eties. In Recent perspectives of early Indian history (ed. R. Tha-par), pp. 1–52. Popular Prakashan, Mumbai.
Rogers A. R. and Jorde L. B. 1995 Genetic evidence on modernhuman origins. Hum. Biol. 67, 1–36.
Reddy B. M., Langsteih B. T., Kumar V., Nagaraja T., Reddy A.N. S. and Meka A. 2007 Austro-Asiatic tribes of northeast Indiaprovide hitherto missing genetic link between south and south-east Asia. PLoS One 2, e1141.
Roychoudhury S., Roychoudhury S., Roy S., Dey B., ChakrabortyM., Roy M. et al. 2000 Fundamental genomic unity of ethnic In-dia is revealed by analysis of mitochondrial DNA. Curr. Sci. 79,1182–1192.
Roychoudhury S., Roy S., Basu A., Banerjee R., Vishwanathan H.,Usha Rani M. V. et al. 2001 Genomic structures and populationhistories of linguistically distinct tribal groups of India. Hum.Genet. 109, 339–350.
Sahoo S. and Kashyap V. K. 2006 Phylogeography of Mitochon-drial DNA and Y-Chromosome haplogroups reveal asymmetricgene flow in populations of Eastern India. Am. J. Phy. Anthropol.131, 84–97.
Salas A., Richaqrds M., De la Fe T., Lareu M. V., Sobrino B.,Sanchez-Diz P. et al. 2002 The making of the African mtDNAlandscape. Am. J. Hum. Genet. 71, 1082–1111.
Schurr T. G., Ballinger S. W., Can Y. Y., Hodce J .A., MerriwetherD. A., Lawrence D. N. et al. 1990 Amerindian mitochondrialDNAs have rare Asian mutations at high frequencies, suggestingthey derived from four primary maternal lineages. Am. J. Hum.Genet. 46, 613–623.
Scozzari R., Torroni A., Semino A., Sirugo G., Brega A. andSantachiara-Benerecetti A. S. 1988 Genetic studies on the Sene-gal population. I. Mitochondrial DNA polymorphisms. Am. J.Hum. Genet. 43, 534–544.
Stringer C. B. and Andrews P. 1988 Genetic and fossil evidence forthe origin of modern humans. Science 239, 1263–1268.
Sun C., Kong Q. P., Palinichamy M. G., Agrawal S., Bandelt H.J., Yao Y. G. et al. 2006 The dazzling array of basal branchesin the mtDNA macrohaplogroup M from India as referred fromcomplete genomes. Mol. Biol. Evol. 23, 683–690.
Templeton A. R. 1992 Human origins and analysis of mitochondrialDNA sequences. Science 255, 737.
Templeton A. 2002 Out of Africa again and again. Nature 416, 45–51.
Thangaraj K., Singh L., Reddy A. J., Rao R., Sehgal C. S., Under-hill P. A. et al. 2003 Genetic affinities of the Andaman Islanders,a vanishing human population. Curr. Biol. 13, 86–93.
Thangaraj K., Chaubey G., Kivisild T., Reddy A. G., Singh V. K.,Rasalkar A. and Singh L. 2005a Reconstructing the origin of An-daman Islanders. Science 308, 996.
Thangaraj K., Sridhar V., Kivisild T., Reddy A. G., Chaubey G. andSingh V. K. 2005b Different population histories of the Mundari-and Mon-Khmer-speaking Austro–Asiatic tribes inferred fromthe mtDNA 9-bp deletion/insertion polymorphism in Indian pop-ulations. Hum. Genet. 116, 507–517.
Thangaraj K., Chaubey G., Singh V., Vanniarajan A., Thanseem I.,Reddy A. G. and Singh L. 2006 In situ origin of deep rooting lin-eages of mitochondrial macrohaplogroup M in India. BMC Ge-nomics 7, 151.
Thanseem I., Thangaraj K., Chaubey G., Singh V. K., Bhaskar V. K.S. L. and Reddy B. M. 2006 Genetic affinities among the lowercaste and tribal groups of India: inference from Y chromosomeand mitochondrial DNA. BMC Genet. 7, 42.
Thapar R. 1995 The first millennium B. C. in northern India (upto the end of Mauryan period). In Recent perspectives of earlyIndian history (ed. R. Thapar), pp. 80–141. Popular Prakashan,Mumbai.
Torroni A., Huoponen K., Francalacci P., Petrozzi M., Morelli L.and Scozzari R. 1996 Classification of European mtDNAs froman analysis of three European populations. Genetics 144, 1835–1850.
Torroni A., Bandelt H. J., D’Urbano L., Lahermo P., Moral P., Sel-litto D. et al. 1998 mtDNA analysis reveals a major late Pale-olithic population expansion from southwestern to northeasternEurope. Am. J. Hum. Genet. 62, 1137–1152.
Torroni A., Rengo C., Guida V., Cruciani F., Sellitto D., Coppa A. etal. 2001. Do the four clades of the mtDNA haplogroup L2 evolveat different rates? Am. J. Hum. Genet. 69, 1348–1356.
Vigilant L., Stoneking M., Harpending H., Hawkes K. and WilsonA. C. 1991 African populations and the evolution of human mi-tochondrial DNA. Science 253, 1503–1507.
Watkins W. S., Bamshad M., Dixon M. E., Bhaskara Rao B., NaiduJ. M., Reddy P. G. et al. 1999 Multiple origin of the mtDNA 9 bpdeletion in populations of South India. Am. J. Phys. Anthropol.109, 147–158.
Watson E., Forster P., Richards M. and Bandelt H. J. 1997 Mito-chondrial footprints of human expansions in Africa. Am. J. Hum.Genet. 61, 691–704.
Yao Y. G., Kong Q. P., Bandelt H. J., Kivisild T. and Zheng Y. P.2002 Phylogeographic differentiation of mitochondrial DNA inHan Chinese. Am. J. Hum. Genet. 70, 635–651.
Received 3 April 2008, in revised form 13 June 2008; accepted 28 July 2008Published on the Web: 13 March 2009
Journal of Genetics, Vol. 88, No. 1, April 2009 139