Page 1
0
Preferences of Business Angel
Investors with regards to the
Assessment Criteria Size, Timing,
Industry, and Geography:
Evidence from the Netherlands
MASTER THESIS
Name: M.N. Dijk Student number: s1816233 Student mail: [email protected] Faculty: Behavioural, Management and Social Sciences (BMS) Study: MSc Business Administration Track: Financial Management First supervisor: Dr. Ir. M. Preziuso Second supervisor: Dr. Ir. W.J.A. van Heeswijk Date: 28-11-2021
Page 2
1
Abstract This study investigates the investment preferences of individual business angels in the Netherlands with regards
to the assessment criteria size, timing, industry, and geography. Data is acquired from the financial platform
Crunchbase and ten semi-structured interviews with business angels in the Netherlands. An explanatory mixed
method research has been conducted to answer the six hypotheses that have been formed after a study of
previous literature. The results show that business angels in the Netherlands prefer to invest in start-ups in the
seed phase, in an industry where the business angel has experience, mostly geographically close, and with an
average investment of 1.9 million Euros. In contrast to previous studies, this research did not find statistical
evidence for the timing of the investment (with regards to the development phase) to have an influence on the
size of the investment, except for some later-stage capital investments. The type of industry does not significantly
influence the size of the investment made by business angels in the Netherlands, except for investment made in
the Financial Technology industry. This research contributes to the scarce research of business angels’
preferences for investment criteria by adding findings of the business angel investment market in the
Netherlands. Limitations of this research are the small sample size and the opaqueness of the business angel
investment market. Future entrepreneurs and start-ups can reach out to business angels when only an idea
exists, since most business angels in the Netherlands find this already eligible. Another practical recommendation
from this study is that business angels should reach out to the networks of business angels and focus on business
angels that have experience in the industry of the start-up. Future research recommendations are to utilize
multiple financial platforms, to reach out to business angel networks, and to conduct a survey amongst individual
business angels in the Netherlands, in order to study other important investment criteria.
Keywords: business angel investment, individual angel, Netherlands, investment preferences, assessment
criteria, size, timing, industry, geography
Page 3
2
Acknowledgements
This master thesis, for the master study Business Administration at the University with a specialization in
Financial Management, is the final part of my studies. I got the opportunity to research the preferences of
business angels in the Netherlands. This research became an intensive but very interesting project in which I
learned a lot about business angel investing and the private funding market.
I would like to express my gratitude to my first supervisor, Dr. Ir. M. Preziuso, for his supervision and
constructive feedback during the entire process of this thesis research. I would like to extend my appreciation to
my second supervisor, Dr. Ir. W.J.A. van Heeswijk, for his feedback. I also want to thank all interview respondents
that were willing to offer me their help in providing insights into their preferences for investing in start-ups.
Lastly, I would like to thank my family and friends for helping me to stay motivated throughout my
studies and this master thesis.
Michelle Dijk.
Enschede, November 18th, 2021.
Page 4
3
Table of contents
1. Introduction .................................................................................................................................................... 6
1.1 Background information ........................................................................................................................ 6
1.2 Relevance and research question .......................................................................................................... 7
1.3 Structure ................................................................................................................................................ 8
2 Literature review ............................................................................................................................................. 9
2.1 Business angels: definitions, numbers and characteristics ........................................................................... 9
2.1.1 Definitions .............................................................................................................................................. 9
2.1.2 Numbers ................................................................................................................................................. 9
2.1.3 Characteristics ...................................................................................................................................... 10
2.2 The importance of business angels: the “funding gap” .............................................................................. 10
2.3 Preferences and development of hypotheses ............................................................................................ 11
2.3.1 Management team ............................................................................................................................... 11
2.3.2 Business plan and idea ......................................................................................................................... 12
2.3.3 Monitoring and risk .............................................................................................................................. 12
2.3.4 Coaching and mentoring ...................................................................................................................... 13
2.3.5 Exit strategy .......................................................................................................................................... 13
2.3.6 Syndication ........................................................................................................................................... 14
2.3.7 Size of the investment .......................................................................................................................... 15
2.3.8 Product development and timing ........................................................................................................ 15
2.3.9 Industry ................................................................................................................................................ 16
2.3.10 Geography .......................................................................................................................................... 17
3. Methodology ..................................................................................................................................................... 17
3.1 Research design .......................................................................................................................................... 18
3.2 Data collection ..................................................................................................................................... 18
3.2.1 Quantitative data collection ................................................................................................................. 19
3.2.2 Qualitative data collection ................................................................................................................... 19
3.3 Data analysis ............................................................................................................................................... 20
3.3.1 Quantitative data analysis .................................................................................................................... 20
3.3.2 Qualitative data analysis ...................................................................................................................... 22
Page 5
4
3.4 Hypothesis testing ....................................................................................................................................... 23
3.4.1 Hypothesis 1 ......................................................................................................................................... 23
3.4.2 Hypothesis 2 ......................................................................................................................................... 23
3.4.3 Hypothesis 3 ......................................................................................................................................... 23
3.4.4 Hypothesis 4 ......................................................................................................................................... 24
3.4.5 Hypothesis 5 ......................................................................................................................................... 24
3.4.6 Hypothesis 6 ......................................................................................................................................... 24
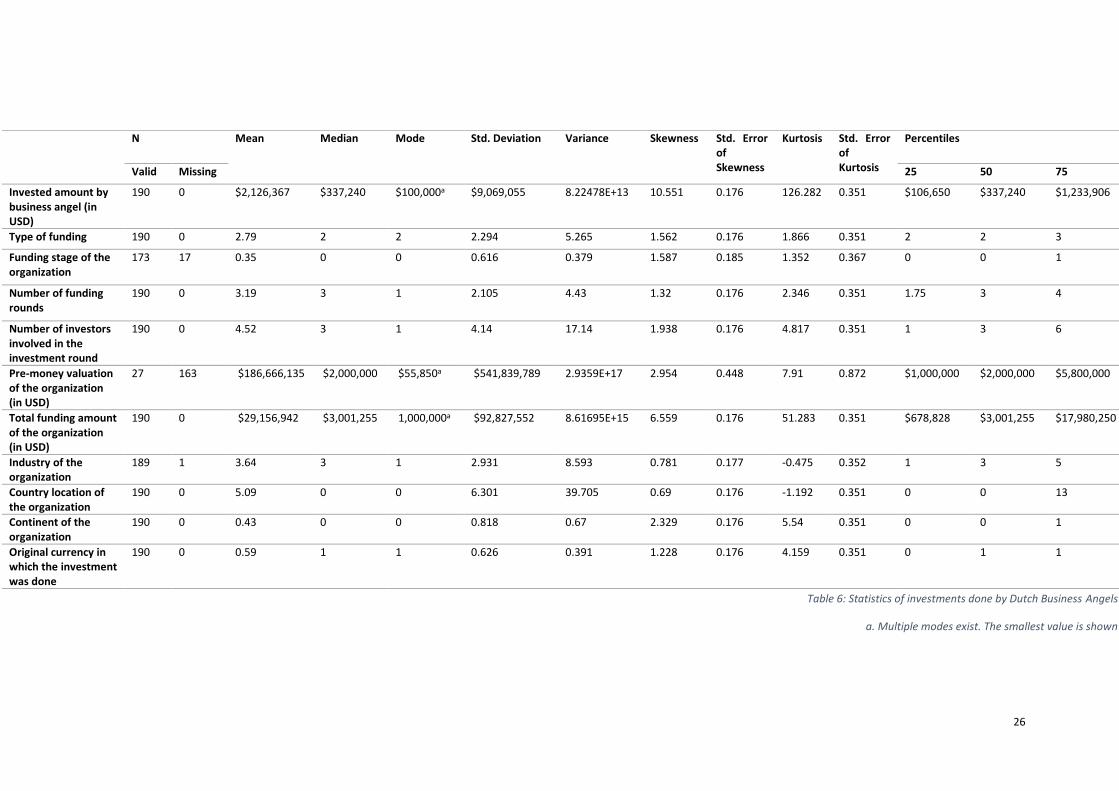
4. Results ........................................................................................................................................................... 25
4.1 Quantitative results ..................................................................................................................................... 25
4.1.1 Descriptive statistics ............................................................................................................................. 25
4.1.2 Independent sample t-test ................................................................................................................... 24
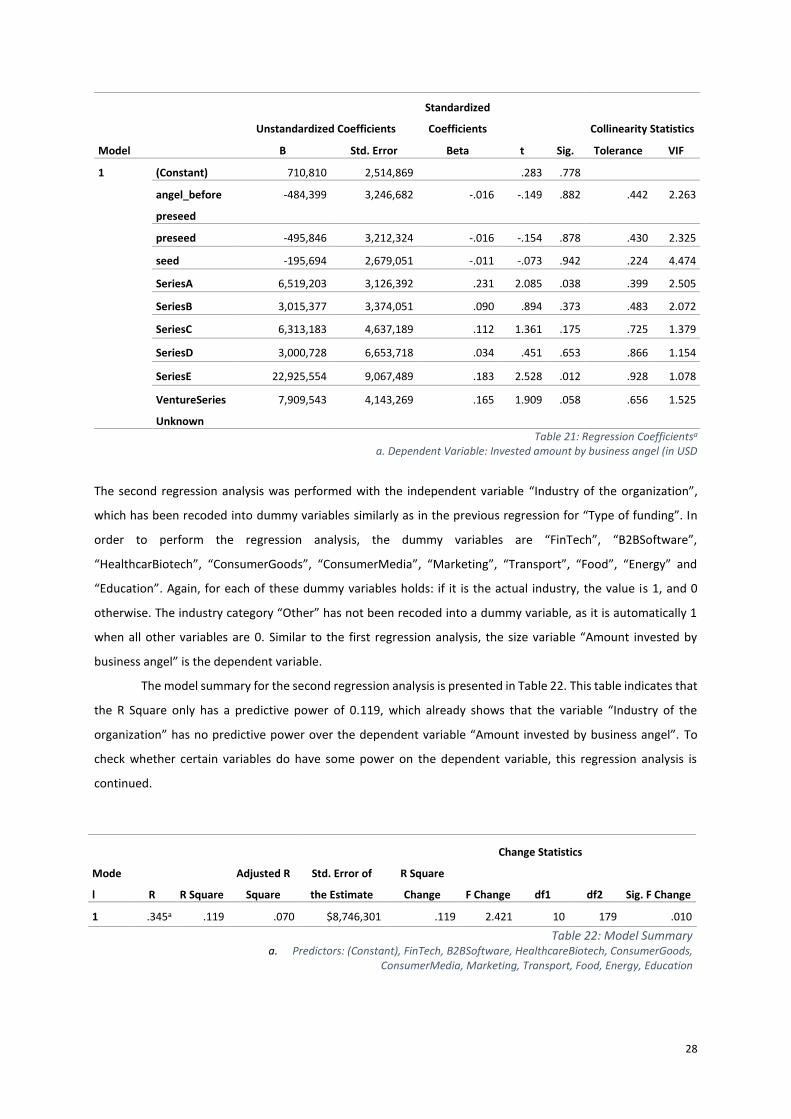
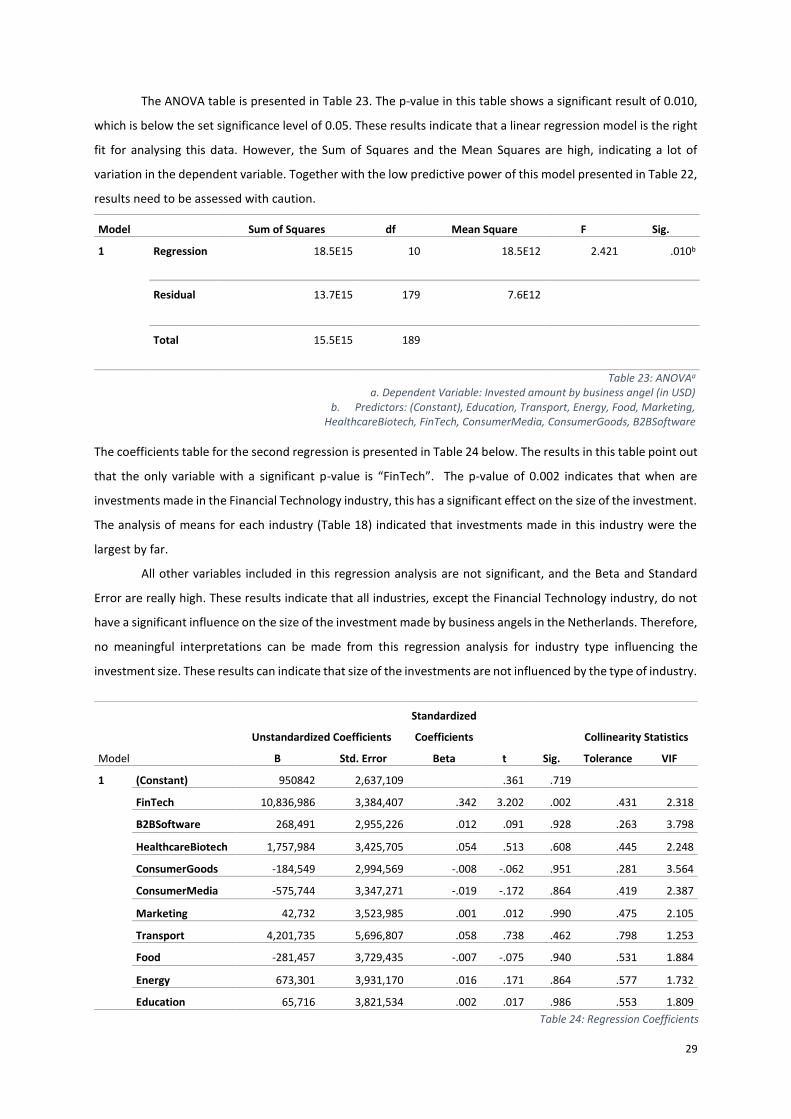
4.1.3 Regression analysis .............................................................................................................................. 26
4.2 Qualitative results ....................................................................................................................................... 30
4.2.1 General information ............................................................................................................................. 30
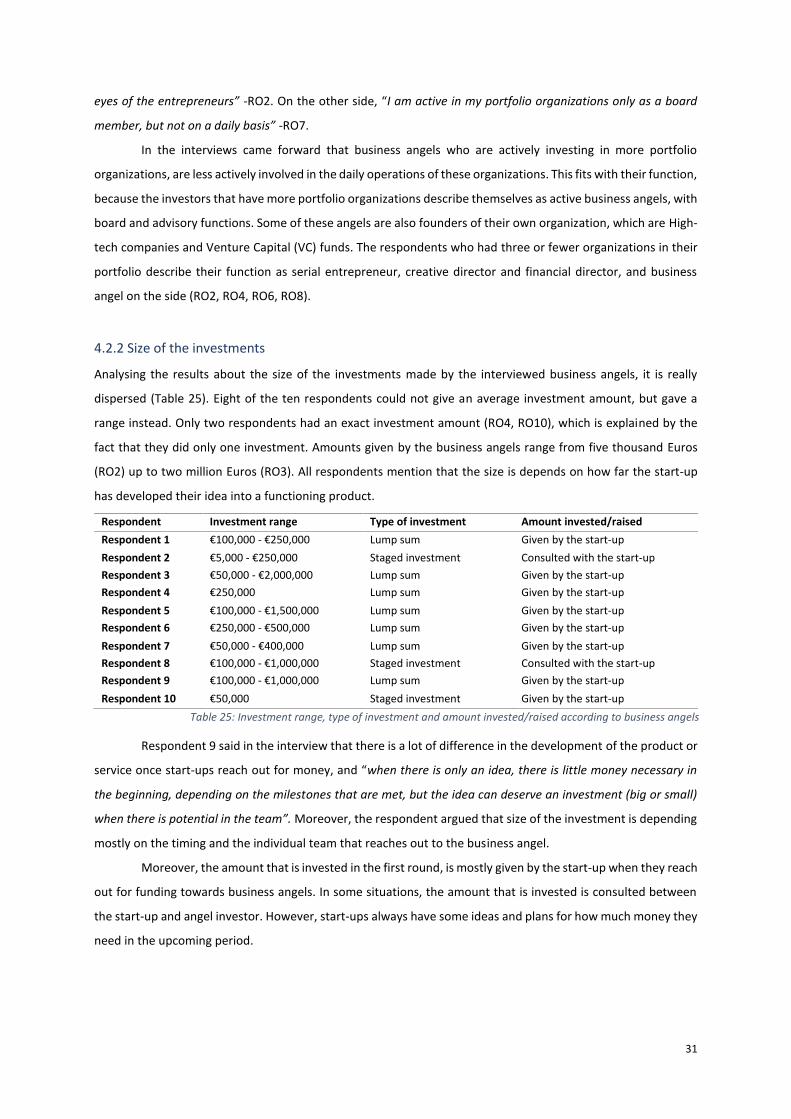
4.2.2 Size of the investments ........................................................................................................................ 31
4.2.3 Timing of the investments ................................................................................................................... 32
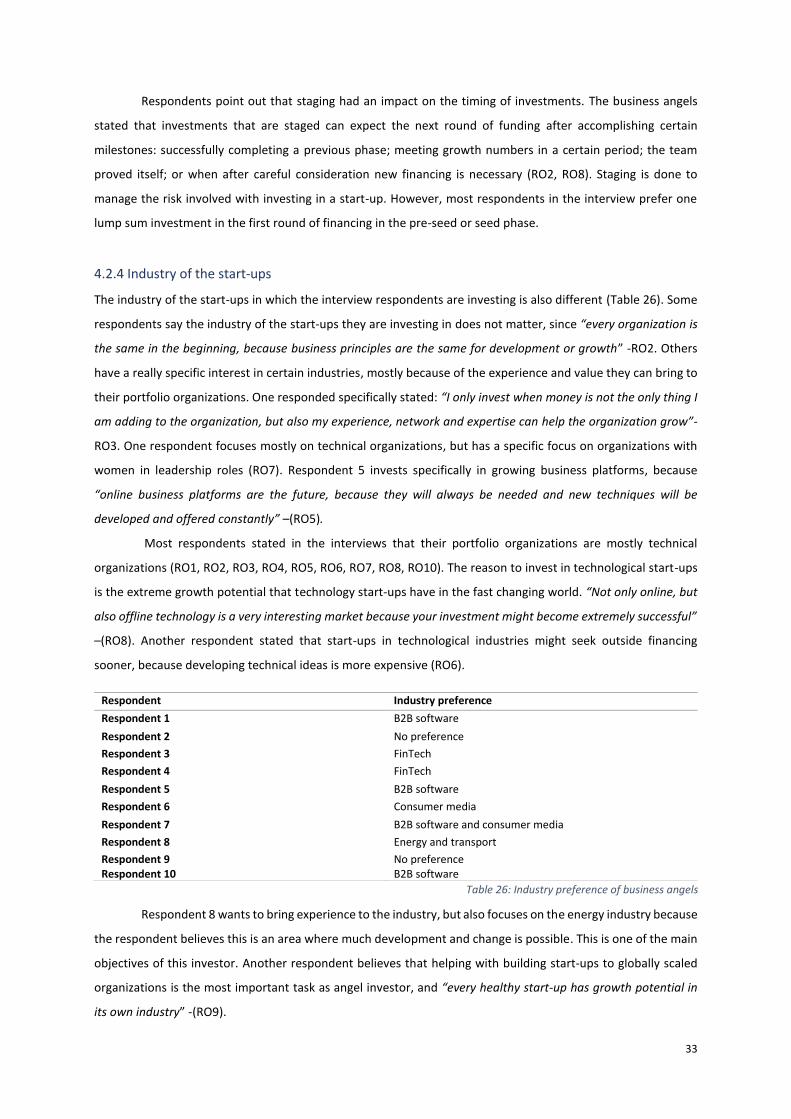
4.2.4 Industry of the start-ups ...................................................................................................................... 33
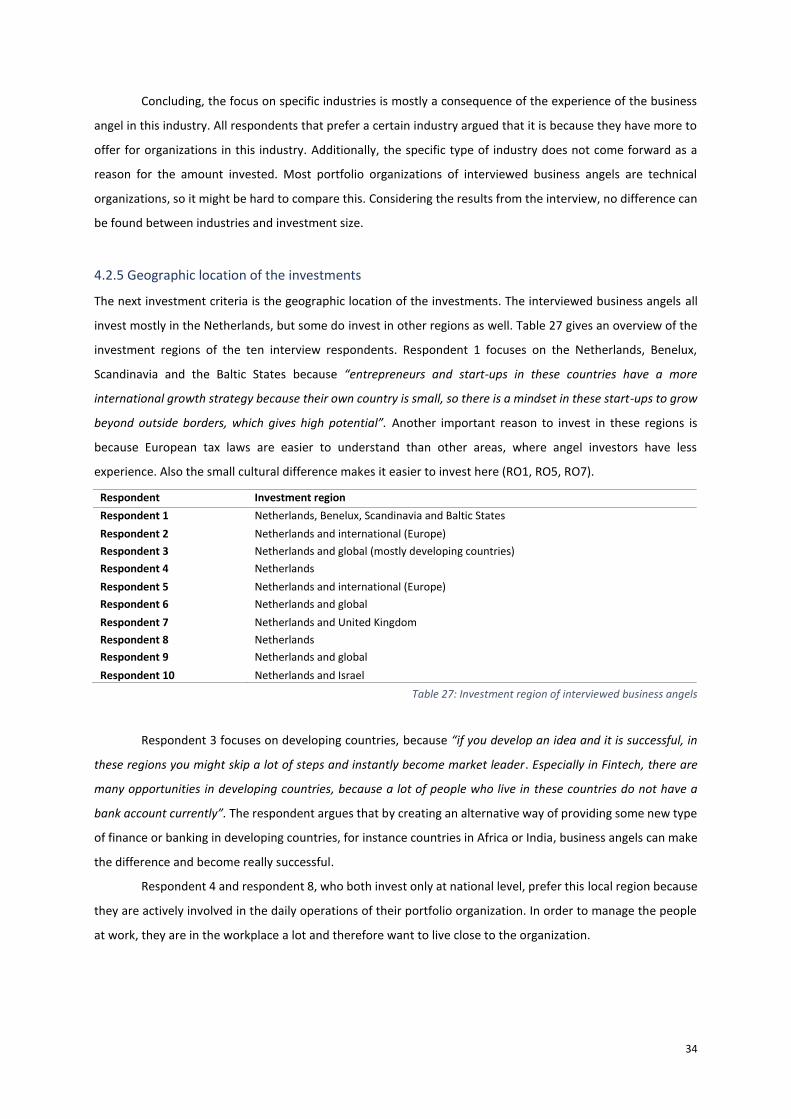
4.2.5 Geographic location of the investments .............................................................................................. 34
4.2.6 Criticism and other criteria .................................................................................................................. 36
4.3 Hypotheses .................................................................................................................................................. 37
4.3.1 Hypothesis 1 ......................................................................................................................................... 37
4.3.2 Hypothesis 2 ......................................................................................................................................... 38
4.3.3 Hypothesis 3 ......................................................................................................................................... 38
4.3.4 Hypothesis 4 ......................................................................................................................................... 39
4.3.5 Hypothesis 5 ......................................................................................................................................... 39
4.3.6 Hypothesis 6 ......................................................................................................................................... 40
5. Discussion and limitations ............................................................................................................................. 41
5.1 Discussion .................................................................................................................................................... 41
5.2 Limitations ................................................................................................................................................... 43
5.3 Recommendations ...................................................................................................................................... 44
Page 6
5
5.4 Contributions to existing literature ............................................................................................................. 44
6. Conclusion ..................................................................................................................................................... 46
7. References..................................................................................................................................................... 47
8. Appendices .................................................................................................................................................... 54
8.1 Appendix A: Interview questions ................................................................................................................ 54
Page 7
6
1. Introduction
1.1 Background information
Business angels are “high net worth individuals who invest their own money in small unlisted companies, with
no family connections, typically assuming a minority equity stake as well as active involvement in portfolio
companies” (Mason, 2008). They represent an important source of finance for start-ups and entrepreneurs in
the seed phase of business development. Business angels can help to fill the “funding gap” between the demand
and supply of early-stage equity capital (Mason & Harrison, 2000; Johnson & Sohl, 2012; Capizzi, 2015). Early-
stage equity capital is the first funding that entrepreneurs or start-ups receive, for instance money from friends
and family, money through crowdfunding, money from grants, business angel investments, and venture capital
funding (Alemany & Andreoli, 2018). Business angels are also called angels or angel investors.
In the last decades there has been increased attention from researchers to the dynamics of business
angel investments (Bonini et al., 2018). Research has established the importance of business angels in funding
entrepreneurs at the seed and early stages (Cumming & Zhang, 2019). However, the invisible nature of business
angel investing creates a research gap, which is a consequence of the lack of strong generalizable data (Edelman
et al., 2017).
According to the European Business Angel Network (2020), with a new record of 8.04 billion Euros of
investment, the business angel market claims to represent the largest share of early-stage investment in the
European market, approximately 60% of the total investments. Landström (1998) states that it is important to
stimulate new technology-oriented firms by providing equity from the informal risk capital market because these
start-ups are vehicles of economic growth and employment. The European Commission published concrete
figures on the high growth and raising numbers of start-ups and their funding in its Business Angel Funding Report
(Ali, 2017). Hence, for entrepreneurs and start-ups it is crucial to know how they can “access the business angel
market” (Landström & Sørheim, 2019). This study aims to clarify the preferences of business angels in the
Netherlands so that entrepreneurs and start-ups get more information on how to access this funding market.
Despite the growing interest in business angel investments, knowledge about specific assessment
criteria and preferences of these angels is relatively limited. Earlier research has concentrated primarily on
assessing which criteria are most important, but not on how certain criteria are considered when deciding to
invest in an organization or not. Before each investment, capital providers critically review organizations based
on their own assessment criteria. The ten most frequently mentioned assessment criteria are: 1) the business
idea, 2) market growth potential, 3) risk, 4) leadership and management, 5) development stage of the
product/service, 6) industry, 7) mentoring and coaching, 8) location, 9) exit strategy and 10) size (Becker-Blease
& Sohl, 2015; Ferrati & Muffatto, 2021).
Page 8
7
1.2 Relevance and research question
Whilst assessment criteria for equity capital providers are studied by many researchers, the focus is mostly on
venture capital (VC) firms, and the preferences of business angels specifically are underly researched (Ferrati &
Muffatto, 2021). Venture capital funds are “Temporary equity investors that provide capital in exchange for
equity (shares), to non-listed (private) companies” (Alemany & Andreoli, 2018). Venture capital firms invest in
organizations when revenues occurred and the first customers are established. It is important to study the
assessment criteria for business angels separately, since the objectives of angels investors and venture capitalists
differ, and so do the weights of factors in their investment decisions (Hsu et al., 2014).
Therefore, this research focuses on assessment criteria and preferences of business angels for their
investments. More specifically, this research will focus on the preferences of business angels living in the
Netherlands. The purpose of this research is to explore the preferences of Dutch business angels with regards to
their investment assessment criteria. Whilst in literature there are numerous important criteria that business
angels need to assess before investing in an organization, this research focuses on four specific assessment
criteria: size of the investments, preferred industries, timing of the investments with regards to product/service
development stage, and lastly, geography. These four criteria are chosen to study, because they can be tested
quantitatively with univariate statistics, and also qualitatively with interviews. The scope of this research does
not allow to study all investment criteria in depth.
In this study a contribution towards understanding the preferences of business angels in the
Netherlands is made, in order to provide a clear view for future start-ups and entrepreneurs on how to access
such funding. The central research question answered in this study will therefore be: “What are the preferences
of business angels in the Netherlands with regards to the assessment criteria size, timing, industry, and
geography?”
For this study, an explanatory mixed method approach will be used. Data will be gathered from the
Crunchbase platform, in order to get insights about the type and number of investments done by business angels
in the Netherlands. Crunchbase is a financial platform that provides business information about private and
public companies. Afterwards, several interviews will be conducted amongst business angels in the Netherlands,
to gain more insights into the specific preferences of business angels and to confirm the results of the
quantitative research or not.
This research contributes to the literature by extending previous studies on business angels’ investment
preferences in various ways. Firstly, this research focuses on business angels in the Netherlands, since no prior
research on the topic in this region has been found. Research conducted on business angel investments mostly
took place in the USA. Specific preferences for investment criteria are scarcely researched and therefore
interesting to study. Secondly, the results will enrich future start-ups and entrepreneurs with additional
information and knowledge about the business angel funding market and how to get its interest. Lastly, this
research can inform business angels in the Netherlands on their current practices and might be an incentive to
create a new conversation about current strategies.
Page 9
8
1.3 Structure
The remainder of this paper is structured as follows. Chapter 2 discusses relevant literature about business angel
investing and preferences of angel investors. Additionally, the hypotheses of this research are developed in the
last sections of this chapter. In Chapter 3, the methodology to execute this research is defined and explained.
Additionally, the data collection is described, as well as a description of the data used. This chapter also discusses
how the hypotheses will be tested. Chapter 4 presents all the results of this research, based on the descriptive
statistics, independent sample t-tests and regressions from the quantitative data analysis and based on the
qualitative data analysis from the interviews. Afterwards the defined hypotheses will be discussed. Chapter 5
represents the discussion of the results and limitations of this research, as well as addressing directions for future
research. Lastly, Chapter 6 presents the conclusion.
Page 10
9
2 Literature review
This chapter will consider all the relevant literature on the topic of business angel investing. It is organized as
follows. First, Section 2.1 introduces the relevant business angel literature on definitions, numbers and
characteristics. Thereafter, an overview will be made of the importance of business angel investing with regards
to the “funding gap” and entrepreneurship in section 2.2. Lastly, section 2.3 discusses several assessment criteria
studied in prior research, that business angels are applying. Afterwards the most interesting assessment criteria
that are researched in this thesis will be discussed, as well as the development of hypotheses.
2.1 Business angels: definitions, numbers and characteristics
2.1.1 Definitions
Angel financing is defined by Mason and Harrison (1999) as: “(in)formal venture capital-equity investments and
non-collateral forms of lending made by private individuals. . . using their own money, directly in unquoted
companies in which they have no family connection” (p.95). Mason and Harrison (2000) exclude money from
friends and family or “love” money, since investments made by close relatives or friends are based on different
considerations and criteria than the criteria used by external investors.
Another definition of business angels is that business angels are high net worth individuals that invest
capital in high-risk, high-return entrepreneurial ventures (Freear et al., 1994; Avdeitchikova et al., 2008). The
money invested can be a one-time injection of seed money, but it can also be ongoing support through multiple
phases of the entrepreneurial venture. Business angels can be separated into two types. Affiliated angels are
investors with whom the entrepreneur is acquainted or have some type of relationship with, such as neighbours
or colleagues. Non-affiliated angel investors do not have a relationship with the entrepreneur or business that
they are invested in (Edelman et al., 2017).
2.1.2 Numbers
The European Business Angel Network (EBAN) reported that the visible angel investment market grew from 745
million Euros in 2018 to 804 million Euros in 2019 (7.9 % growth), with over 3600 funding rounds last year and
approximately 34,500 angel investors across Europe (EBAN, 2020). The European Business Angel Network uses
the output of a study financed by the European Commission and carried out by CSES (Centre for Strategy and
Evaluation Services) to estimate the size of the visible and invisible business angel market. The visible business
angel investment market is about 10% of the total business angel investment market. The total size of the
business angel investment market increased to an estimated 8.04 billion Euros in 2019, which is a growth of
9.97%. In the last five years, the total investment market grew 7.1% on average. The total European early-stage
investment market is estimated to be worth 13.22 billion Euros, equal to approximately 60% of the investment
market. Venture capital firms are the other big investor in this early-stage investment market and cover 40% of
the investment market. The total business angel community in Europe is estimated at 345,000 business angels
and 404 Business Angel Networks (BAN).
Page 11
10
According to data gathered by the European Business Angel Network (2020) there are currently 19
business angel networks in the Netherlands, and approximately 1,200 active angel investors. In 2019, there have
been 43 visible business angel investments, with a total of 19.4 million Euros.
2.1.3 Characteristics
In the past few years, understanding the dynamics of business angel investments received increased attention
from academics and practitioners. However, these studies on business angels have faced several problems. First
and foremost, being the opaqueness of the market and therefore a lack of strong representative data on private
companies in most markets (Bonini et al., 2019; Edelman et al., 2017). Moreover, the representativeness of
survey-based samples is low (Harrison & Mason, 2008; Capizzi, 2015; Lerner 2018). Consequently, research
investigating the performance of angel-backed companies relies largely on small-case evidence (Hellman et al.,
2013; Kerr et al., 2014; Mason et al., 2016). For the same reason, Edelman et al. (2017) states that the business
angel investment market is an under-researched, dynamic and exciting form of seed capital for entrepreneurs,
where future researchers need to get engaged with.
The research into business angel investing is overall very scarce, due to the complexity of accessing data,
since there is no institutional infrastructure supporting this market. Assessing the “true” population is a big
problem in business angel research. This is caused by the fact that these private investors do need to disclose
information about their investments publicly, and because business angels are striving for anonymity creating an
“invisible market” that is difficult to estimate (Bonini et al., 2018; Cumming et al., 2019; Denis, 2004; Mason and
Harrison, 2000; Landström and Mason, 2016).
Another characteristic of business angel investing is the high risk involved with it, with in general no
prior sales and revenues or tangible assets to valuate (Dibrova, 2015). Also, the investments are subject to
dilution at the IPO (Initial Public Offering) of the start-up. In return, angel investors usually require a high rate of
return in exchange for their financing in these uncertain early stages of the business.
2.2 The importance of business angels: the “funding gap”
As mentioned beforehand, business angels are the main provider of seed capital to start-ups, thereby promoting
innovation and economic growth. Business angels can help to fill the “funding gap” between the demand and
supply of early-stage equity capital, (Mason & Harrison, 2000; Johnson & Sohl, 2012; Capizzi, 2015). Market data
from Europe provides evidence of the growing relevance of this type of investments (OECD, 2016; Invest Europe,
2017; EBAN, 2017). Bonini et al. (2018) states that business angels have become a major segment of the capital
market industry in the last decades. Consequently, angel investors have become crucial enablers for the
development of new, entrepreneurial firms and therefore a driving force of growth (Lahti & Keinonen, 2016;
OECD, 2016, Mason, 2009).
The “funding gap” that exists in financing start-ups is caused by the fact that these firms are capital
constrained due to their significantly high intrinsic riskiness and the fact that they consequently cannot finance
their investment needs through debt capital or other sources of financing facilities (Bonini et al., 2019). This view
is supported by Denis (2004), who also stated that one of the biggest challenges for start-ups is their ability to
Page 12
11
access capital in order to grow. Business angels appear to serve a complementary role in providing bridge-
financing to start-ups until these firms are in a position to receive venture capital financing.
Early-stage equity capital is divided into several stages (Alemany & Andreoli, 2018). Business angel
investments are investments made after money from friends and family and prior to venture capital (Sohl, 1999;
Mason & Harrison, 2000; Alemany & Andreoli, 2018). Elaborating on the funding stages of start-ups more
precisely, entrepreneurs first start with bootstrapping by raising whatever money they can from their own
personal sources of funding (Edelman et al., 2017). Secondly, entrepreneurs gather investments made by the
next group, referred to as the three-F’s: friends, family and fools (Kotha & George, 2012). Then start-ups can
receive money through crowdfunding, accelerators, or incubators (Alemany & Andreoli, 2018). Grants and public
funding are the next stage of early-stage equity capital. When those sources of finance are drained, start-ups
turn to business angels to seek for what is typically a larger investment. At this stage, debt financing typically not
is an option, since the entrepreneurial firms are usually not profitable and lack tangible assets (Denis, 2004).
When more capital is needed after the business angel funding round, entrepreneurs mostly turn to
venture capital funds (Edelman et al., 2017). Interestingly, Van Osnabrugge (2000) and Madill et al. (2015) show
that most firms that obtain venture capital funding, previously obtained angel investments, confirming the fact
that business angels play a crucial role in the success of a start-up.
2.3 Preferences and development of hypotheses
Assessment criteria and preferences of business angels for investing are underly researched, while previous
studies have focused more on venture capital and private equity investors (Ferrati & Muffatto, 2021). Frequently
mentioned assessment criteria are mentioned in the paragraphs below. Afterwards, the most important
assessment criteria in this research (size of the investment, timing of the investment, industry and geography)
are studied and six hypotheses will be formed in the end of the sections 2.3.7. till 2.3.10.
2.3.1 Management team
According to Becker-Blease and Sohl (2015), the most essential aspect for legitimacy of an organization to get
investments is a top management team. A top management team is based on industry experience, previous
experience of these entrepreneurs, size of the organization and education of the team. A good team provides
confidence towards investors, and is therefore important. This corresponds to the survey done by the European
Business Angel Network (EBAN, 2020), who states that angel investors are concentrating on the quality of the
management team as the main decisive factor serving as selection criterium to start an investment.
In the research of Ferrati & Muffatto (2021), it is stated that the entrepreneur and/or the management
team is the most important assessment criteria applied by equity investors. More specifically, the characteristics
of the entrepreneur and/or team should be considered. The four most important characteristics that should be
evaluated before investing in a start-up are the ability to evaluate and react to risk, the capacity to work hard,
honesty and integrity, and paying attention to details.
The discussion between researchers about what is the most important selection criteria reflects what
has been known since the first articles as the “jockey vs horse controversy” (MacMillan et al., 1985). The
Page 13
12
literature is split between researchers who argue that in the investment decisions investors rely mostly on the
jockey (the entrepreneur or management team), the horse (the business idea), the course (market growth
potential), or the odds (financials) (MacMillan et al., 1985).
2.3.2 Business plan and idea
Another important selection criteria for investing, according to Becker-Blease and Sohl (2015), is the business
plan. In contrast to this, Ferrati and Muffatto (2021) state that the potential market growth rate of the business
idea is the most important assessment criteria. A good business idea should be formulated into a well-defined
business plan. This is supported by the European Business Angel Network (2020), who found that growth-
potential and the idea/concept of the entrepreneurs are significantly crucial factors. Moreover, they state that
the business plan can also be worked out together, as opposed to the quality and setup of the management
team.
What is just as important, is the presentation or pitch of the entrepreneurs and their business plan.
Entrepreneurs tend to focus on products and technology, whilst business angels are more interested to know
whether there is a market for the product or service and whether the team is capable of executing the business
plan (EBAN, 2020). Hence, it is important for entrepreneurs and start-ups to consider the potential market that
can be reached in their pitch for investors, because this will increase their chances of getting funded.
A pitfall with regards to the business plan, is that entrepreneurs sometimes exaggerate future
expectations and growth potential (EBAN, 2020). Business angels, which are mostly experienced, cashed out
entrepreneurs themselves, quickly realize this and might question the valuations. This can create an environment
where trust and confidence is lacking, and therefore no investment will be made.
2.3.3 Monitoring and risk
As mentioned before, a major issue in investing in start-ups, which are mostly small, risky and informationally
opaque unlisted companies, is setting up appropriate monitoring mechanisms to reduce risks (Bonini et al.,
2019). These monitoring mechanisms are generally put in place in order to reduce the incentives for
opportunistic behaviour by the entrepreneur or management team of the financed start-up. However, the low
frequency of such “hard monitoring” due to high implementation costs and excessive design for relatively small
investments is highlighted in several studies. But, in these cases a possible substitute is represented by “soft
monitoring” mechanisms such as a business angel’s industry knowledge, geographical proximity, previous
investments and experiences and, most importantly, the interactions with entrepreneurs (Van Osnabrugge,
2000; Bonini & Capizzi, 2017).
On the other hand, several studies have highlighted the importance of the “nexus of trust” in the
relationship between the angel investor and the entrepreneur, since more monitoring over the start-up could
damage the trust-based relationship of the angel investor and the entrepreneur, which negatively impacts the
mutual perception on each other’s contribution to the firm and damaging future company performance
(Bammens & Collewaert, 2014; Chua & Wu, 2012; Strätling et al., 2012; Zacharakis et al., 2010).
Page 14
13
Business angels are generally providing capital to start-ups in which venture capital firms are not
interested, because of the mostly lower profitability and relatively high costs of due diligence, contracting and
monitoring that is associated with these start-ups (Jeng & Wells, 2000; Carpenter & Peterson, 2002; Mason,
2009). The profitability of business angel investments can be high, because of high risk factors with a high return.
However, start-ups have a higher chance of failing, because these organizations are developing business ideas
that might turn out poorly. Therefore, the overall profitability of business angel investments is lower because of
this portfolio.
Monitoring is also seen as a task for business angels, because of significant issues that can arise between
entrepreneurs and finance providers due to information asymmetries over the lifecycle of the firm. Therefore,
business angels dedicate considerable time and effort towards addressing these risks caused by problems of
adverse selection and moral hazard relating to their investments in entrepreneurial firms (Denis 2004).
Moreover, these risk factors can also negatively influence the decision to invest. According to the EBAN
(2020), high risk factors and exaggerated valuations were the two main reasons for business angels to not invest
in a start-up. With regards to high factor risk levels, this is dangerous for business angels since it is a clear sign
that the entrepreneur is either unaware of the risks embedded in their business plans, or they do not address
these risks properly.
2.3.4 Coaching and mentoring
While financial intermediaries such as banking or institutional investing are mostly passive (where investors
invest and remain quiet, while receiving management fees), angel investments (and venture capital investments)
are active (Van Osnabrugge, 2000). To manage the risks involved with a start-up, business angels can get actively
involved in the start-up once they made an investment (Edelman et al., 2017). As mentioned previously, angels
can do this by monitoring (getting involved in the day-to-day operations of the firm), or by providing active
coaching and mentoring to the entrepreneurs.
Whilst in the literature research on post-investment involvement of business angels is mainly based on
case studies and anecdotal evidence (Ardichvili et al., 2002; Politis, 2008; Macht & Robinson, 2009; Fili &
Grünberg, 2016), it is commonly accepted that angel investors are contributing to the financed start-ups through
coaching and mentoring, but also by providing a network and business opportunities and finetuning governance
and internal control systems of the start-up (Bonini et al., 2019). Some researchers argue that this providing
behaviour is explained by similarities in personal traits between business angels and entrepreneurs (Bonnet &
Wirtz, 2012; Goldfarb et al., 2014).
According to a survey conducted by the European Business Angel Network in 2019, the most important
assistance provided to portfolio companies by business angels are: advice, board meetings, operations,
introductions to networks and financial intermediation (EBAN, 2020).
2.3.5 Exit strategy
On average, business angel investors mainly have long-term investment horizons (EBAN, 2020). Therefore, angel
investments are also called “patient capital”, with holding periods of the investment lasting regularly five or more
Page 15
14
years. Dibrova (2015) states that business angels invest with a medium to long term set time-frame, with an
average holding period of three to seven years, that is also influenced by the prevailing economic conditions.
Exit-strategies that are most occurring for angel investors are a trade sale, a write-off or an Initial Public
Offering (IPO) (Dibrova, 2015). The least prevalent exit tend to be IPOs, followed by exit due to closing the
business. The most occurring exits are held through trade sales and buy-backs.
A common result in business angel research is that the process of achieving an exit is being largely
ignored by business angels, who do not have clear exit plans at the time of investing and are relaxed about the
timing of the exit (Landström, 1993; Mason et al., 2015). Timing of the exit is not a major concern for
independent business angels in general (Carpentier & Suret, 2015).
2.3.6 Syndication
One major trend that is broadly observed in the angel investment market is the emergence of syndicates, being
business angel groups and business angel networks (Bonini et al., 2019; EBAN, 2020). Angel investment
syndicates are business angels that can choose to invest together with other business angels in an organization,
with an investment amount of their choice. The difference with venture capital funds is that VC funds consist of
only two parties: general partners and limited partners, where an investor invests money that will be allocated
by the general partners.
The rising relevance of these syndicates combined with the professionalization and global growth of
Business Angel Networks (BAN) do create a strong motivation for more research, since it led to a transformation.
These syndicates can provide a network for new investment opportunities, but it also allows business angels to
co-invest more capital into a single firm, or starting business angels to invest less money when to cooperate
(Mason et al., 2016; Bonini et al., 2018).
One reason for the formation of syndicates presented in the literature is that business angel form
syndicates in order to invest substantially larger amounts into start-ups than solo investors, which can offer
competition to traditional sources of formal venture capital and banks (Block et al., 2019; Bonini et al., 2019).
Block et al. (2019) recently completed a research, where they analysed how personality traits of business angels
impact their syndication behaviour based upon combined data from Crunchbase (a financial platform) and
Twitter. Through data from Twitter, the researchers found that extraversion makes syndication more likely,
whereas conscientiousness reduces the likelihood of any type of syndication. The study of Block et al. (2019)
shows that the personality of a business angel has no direct impact on the performance of the investee company,
although syndication is positively correlated to survival, consistent with Bonini et al. (2019).
Syndication can also be beneficial to business angels, since investments are more likely to be pooled,
and costs of due diligence and monitoring can be spread among other business angels. Syndication makes it
possible to invest more in several start-ups, thereby creating a spread portfolio.
The previous six investment criteria are important to business angel investors, but these criteria are not more
intensively studied in this research. In the next four sections, the investment criteria that are in the scope of this
research will be presented, followed by hypotheses for these criteria.
Page 16
15
2.3.7 Size of the investment
Previous research has reported different findings on the average size of investments made by business angels.
According to the European Business Angel Network (2020), business angels invested mainly in start-ups
raising between 100,000-500,000 Euros. The average investment per company in Europe in 2019 was 220,000
Euros and the median investment 256,000 Euros. Moreover, most investments were done by angel syndicates,
where on average each investor committed 25,500 Euros. In syndicates, business angels have the autonomy how
much money they invest in which organizations.
The amount invested can also be split up, because angel investors can have different preferences for
investing in entrepreneurial firms. Some angel investors provide one lump-sum investment to the start-up, whilst
other do investments that are conducted over several rounds, conditional on pre-specified progress targets being
met, thereby reducing the risk of potential agency issues (Yung, 2019).
As noted by several researchers (Fenn et al., 1997; Denis, 2004; Wong, 2002), angel investors invest seed
capital at a very early stage of their development, explaining why investments made are relatively small.
Researchers have different perspectives on how small these investments are. Denis (2004) argues that
investments are made from 500,000 USD up to 2 million USD, but others dispute that (Van Osnabrugge, 2000).
The Business Angel Institute (2021) argues that business angels usually provide amounts of financing between
25,000 to 250,000 Euros, which is significantly smaller.
After assessing arguments from prior literature and research, the following hypothesis was developed
followed by the EBAN report (2020):
Hypothesis 1: If an individual business angel invests in a start-up, the average capital invested is between 100,000
and 500,000 Euros.
2.3.8 Product development and timing
Product development is the presence of a developed good or service, divided into categories based on the stage
of development (idea without a prototype, a prototype without sales, or sales and revenues occurred). Product
development and therefore the timing at which the investment is done, is one of the most important assessment
criteria (Becker-Blease & Sohl, 2015).
Mostly, the timing of business angel investments are all early-stage investments, typically done before
any revenues occur (Fenn et al., 1997). Mostly, business angels invest in the “seed” phase, which is the early
stages of development, where capital is illiquid and funds are relatively small (Denis, 2004; Alemany & Andreoli,
2018). There are no set rules on the amount of investments conducted in each stage. According to the European
Business Angel Network (2020), business angels usually do investments in the “pre-seed, seed and later stage”.
The EBAN uses the following guidelines. In the “pre-seed” phase, investments consist of a maximum of 100,000
Euros, and the product that is developed is only the idea. This phase accounted for 27% of all early-stage capital
investments made in Europe in 2019. Angels invested in the “seed” phase (with an investment ranging from
100,000 to 500,000 Euros) in 50% of all investments in 2019 (where there is an idea and sometimes also a
Page 17
16
prototype). Investments from 500,000 Euros till 5 million Euros are known as “later stage” investments (where
the first revenues occurred), and accounted for 23% of all investments in Europe in 2019.
“Timing” of the deals is about when the business angels are investing, in which phase of product/service
development the start-up organization is. According to Leach and Melicher (2020), start-ups have different types
of financing throughout the different stages of the firm life cycle. These types are classified as: seed financing,
start-up financing, first round financing, second round financing, and mezzanine finance. All these types of
financing are accompanied with growing amounts of funding. Business angels are a major source of financing in
the first three types (Robb & Robinson, 2012) when no revenues are created yet and there still is a lack of tangible
assets. Previous researchers agree on the fact that business angels facilitate capital in the funding gap, which is
mostly seed capital (Edelman et al., 2017; Wong, 2002; Mason & Harrison, 2005).
There are several researchers that study influences on investment size (Kadapakkam et al., 1998; Nor et
al., 2017; Gilchrist et al., 2005). This research investigates will investigate the influence of timing and industry on
investment size.
With the arguments and findings from these studies, the following hypotheses were defined:
Hypothesis 2: If the investment is done at a later stage, the size of the investment done by the business angel is
larger.
Hypothesis 3: If an organization receives equity capital from a business angel, then it is mostly in the seed phase.
2.3.9 Industry
The EBAN (2020) looked into data on more than 3,000 early-stage investments done in Europe in 2019, and found
that the sectors of “enterprise software” and “fintech” took the lead with regards to investments made in that
year, followed by “marketing” and “health” start-ups.
Enterprise software start-ups are companies who work with computer software to satisfy the needs of
organizational users. Fintech companies work on financial management solutions, payment software, investing
and banking, mortgages, insurance and cryptocurrency. Health start-ups are working on health platforms,
medical devices, biotechnological solutions and pharmaceutical solutions. Marketing companies are working on
advertisement technology (AdTech), customer relationship management, sales, marketing analysis and e-
commerce solutions.
Other researchers have highlighted the relevance of experience or familiarity with the industry of the
start-up for the business angel (Van Osnabrugge, 2000; Ferrati & Muffatto, 2021). Experience and familiarity are
deemed important, because with this knowledge the angel investors can better help the entrepreneurs with the
growth and expansion of their start-up in its industry. Much of the academic literature on business angel
investments does not indicate a preference for which type of industry that is however. This study tries to create
more clarity.
Therefore, the following hypotheses have been developed:
Hypothesis 4: If a start-up receives business angel funding, it is likely to operate in a technical industry.
Page 18
17
Hypothesis 5: The type of industry influences the size of the investment done by the business angel.
2.3.10 Geography
According to the European Business Angel Network (2020), business angels are keen to primarily invest within
their national borders. This can be explained partly by legal and regulatory specificities that other countries have
that are unclear to business angel investors. Business angels face different cultures and investment climates
when investing abroad. Edelman et al. (2017) points out that literature has shown that institutional factors such
as legal framework and culture influence the emergence and frequency of angel investments. Business angels (in
comparison to other capital providers like venture capitalists) are more sensitive to country-level legal conditions
and culture, and therefore mostly invest geographically close to themselves (Cumming & Zhang, 2018).
Geographically close indicates that the legal and cultural setting are similar to the country of the business angel
investor.
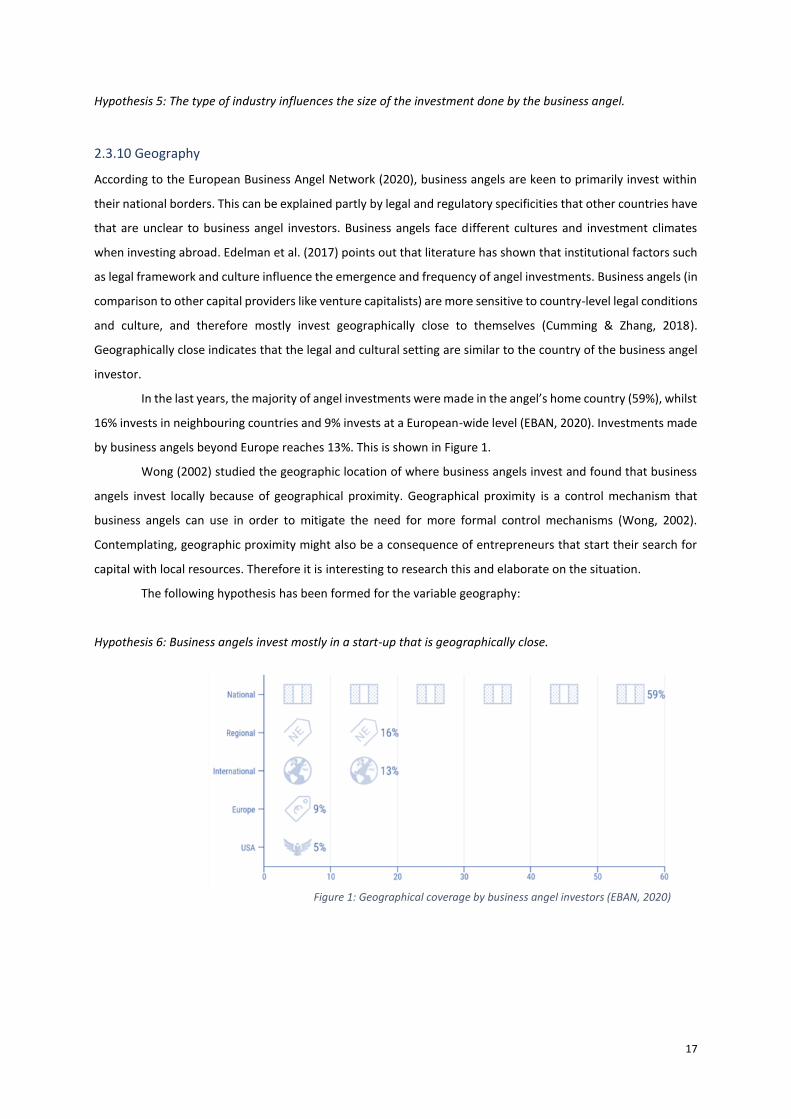
In the last years, the majority of angel investments were made in the angel’s home country (59%), whilst
16% invests in neighbouring countries and 9% invests at a European-wide level (EBAN, 2020). Investments made
by business angels beyond Europe reaches 13%. This is shown in Figure 1.
Wong (2002) studied the geographic location of where business angels invest and found that business
angels invest locally because of geographical proximity. Geographical proximity is a control mechanism that
business angels can use in order to mitigate the need for more formal control mechanisms (Wong, 2002).
Contemplating, geographic proximity might also be a consequence of entrepreneurs that start their search for
capital with local resources. Therefore it is interesting to research this and elaborate on the situation.
The following hypothesis has been formed for the variable geography:
Hypothesis 6: Business angels invest mostly in a start-up that is geographically close.
Figure 1: Geographical coverage by business angel investors (EBAN, 2020)
Page 19
18
3. Methodology
This chapter will address the issue of how this research is conducted. Firstly, in section 3.1, the research design
used in this research will be discussed, followed by a step-by-step explanation. Secondly, section 3.2, will
elaborate on how the data is collected, both for the quantitative data collection and the qualitative data
collection. Section 3.3 discusses how the quantitative- and qualitative data are analysed. Lastly, section 3.4
discusses for each developed hypothesis what methods are used and how it is tested.
3.1 Research design
The purpose of this research is to provide insights into the preferences of business angels in the Netherlands.
These insights can provide a clear overview for future start-ups and entrepreneurs on how to access this angel
investment market. The combination of the topics of business angel investment and their preferences is rather
unexplored. Accordingly, the following research question is formulated: “What are the preferences of business
angels in the Netherlands with regards to the assessment criteria size, timing, industry, and geography?”
The research question will be answered by means of a quantitative analysis, followed by a qualitative
methodology. This indicates that a mixed-method approach is applied to this study, which is a research design
where both quantitative and qualitative methods are used within the same study (Shorten & Smith, 2017). Mixed
methods research can provide a depth and breadth that a single approach may lack by itself (Ivankova & Creswell,
2009). Timing, weighting and mixing are three main characteristics on which procedures for collecting, analysing
and mixing quantitative and qualitative data are based (Creswell & Clark, 2007). In this study, an explanatory
sequential mixed method is applied with most weight on the quantitative analysis. The goal of this research is to
explain the quantitative results that were obtained first, by means of qualitative data that will be collected
through a small number of interviews. This triangulation can both enrich and confirm the results that are
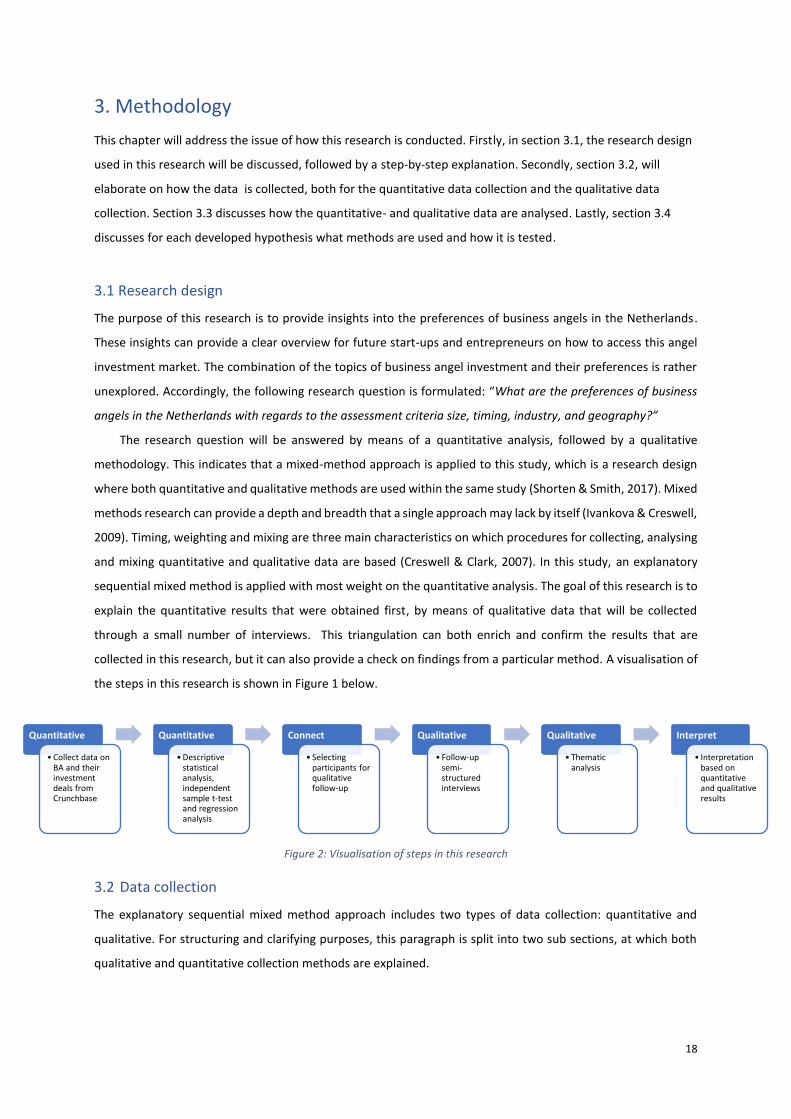
collected in this research, but it can also provide a check on findings from a particular method. A visualisation of
the steps in this research is shown in Figure 1 below.
3.2 Data collection
The explanatory sequential mixed method approach includes two types of data collection: quantitative and
qualitative. For structuring and clarifying purposes, this paragraph is split into two sub sections, at which both
qualitative and quantitative collection methods are explained.
Quantitative
• Collect data on BA and their investment deals from Crunchbase
Quantitative
• Descriptive statistical analysis, independent sample t-test and regression analysis
Connect
• Selecting participants for qualitative follow-up
Qualitative
• Follow-up semi-structured interviews
Qualitative
• Thematic analysis
Interpret
• Interpretation based on quantitative and qualitative results
Figure 2: Visualisation of steps in this research
Page 20
19
3.2.1 Quantitative data collection
Data on investment deals by Dutch business angels will be acquired from Crunchbase, in order to explore the
preferences of business angels in the Netherlands. Crunchbase is a platform that collects and verifies business
information about private and public companies. This business information includes data about investments,
funding, founding members, leadership, mergers and acquisitions and industry trends. Crunchbase is increasingly
used by the venture capital industry as a “premier data asset on the tech/start-up world” (Dalle et al., 2017, p.
5). Recently, the database is becoming increasingly popular with scholars and researchers for information on
financing and start-up activities around the world. The data from Crunchbase about private firms and individuals
is interesting, since the business angel market is not transparent. It is worthy to note that all data acquired from
Crunchbase is presented in their local currency, meaning that it is formatted in US Dollars (USD).
Firstly, data on Dutch business angels will be acquired from Crunchbase, which consists of both data on
individual angels and on angel groups. The data collected consists characteristics of these angels: the number of
investments made, the location, the gender, the preferred investment stage and the main job/function of the
business angel.
Afterwards, the data on Dutch business angels will be used to create a data sample of investments made
by these Dutch angels. Data is acquired about the timing of deals, the size of the investments, the industry, the
location, the revenue of the organization at that time, the total funding amount, the funding stage, the total
number of funding rounds and the number of investors.
The sample will be comprised of the data available in Crunchbase about deals from Dutch business
angels. The first seven reported deals took place from 1998-2007, whilst the majority of deals reported in
Crunchbase are from 2009-2021. This results in a total of 173 angels that invested in 233 deals in the Netherlands,
which will be analysed in this research. After evaluating the data sample, samples with missing data were
excluded from the sample. The remaining 190 deals will be considered in the quantitative analysis of the
investments of business angels. In the scope of this research, the focus is solely on individual business angels. As
a result, the sample of angels was adjusted to 164 business angels, after excluding angel groups and syndicates.
3.2.2 Qualitative data collection
In order to get in-depth understanding of the preferences of business angels, semi-structured interviews are
chosen so that preferences can be assessed on a personal level. The results from the qualitative data collection
will either confirm or contrast the quantitative data. Although the questions and interview guide in semi-
structured interviews are prepared beforehand, it is allowed to deviate from these questions. According to Kallio
et al. (2016), semi-structured interviews enable the interviewer to define follow-up questions based on the
participant’s response. This is helpful for elaborating more on important subjects.
The specific interview questions for the qualitative data collection will be formed after the analysis of
the quantitative data, in order to get the best insights into specific preferences, which can help answering the
central research question. Since the quantitative data will need more verification, the most important
assessment criteria will then be more profoundly researched and analysed in the qualitative research part of this
study. The interview questions are presented in Appendix A.
Page 21
20
Respondents for the interviews are approached on LinkedIn, with a small explanation of this research
and the purpose of the interview. Thirty respondents are approached, based on the number of investments they
made (either one to three investments, four to ten investments, or more than ten investments). When a
respondent agreed, a time and date was set for the interview. In the beginning of the interview, the researcher
briefly introduced herself and the topic of the research. Afterwards, some initial questions were asked to the
respondents about the personal characteristics and experiences. After that, the prepared questions are asked to
each respondent about preferences and characteristics of their angel investments. When necessary, the
researcher asked further about certain unclear answers.
The ten interviews were conducted in Dutch as it is the native language of the respondents. The
interviews were recorded and afterwards transcribed verbatim using the transcription software Amberscript.
After this, the researcher reviewed the transcripts for errors with the original audio recording. Quotes that are
relevant for this thesis will be translated into English. The original transcript is shared with the corresponding
respondent to confirm the contents of the transcript and to offer the possibility to revise aspects that might be
lost in audio or translation. Afterwards, the transcriptions are used for the qualitative data analysis.
3.3 Data analysis
Again, this Section is split into two sub sections, at which both quantitative and qualitative analysis methods are
explained.
3.3.1 Quantitative data analysis
The quantitative data analysis is split into three sections: descriptive statistics, independent sample t-test and
regression analysis.
3.3.1.A Descriptive statistics
The data gathered from Crunchbase will be uploaded into the statistical software SPSS and then analysed. First,
the descriptive statistics of the business angels will be analysed in order to get insights into specifics like the
average number of investments, most interesting investment stage timing, gender and the main job of the
business angel.
After that, the descriptive statistics of the investments made by these Dutch business angels will be
analysed. The univariate analysis is done with the following variables: timing of the investment, the total amount
invested, the invested amount by the business angel, the location and industry of the invested organization, (if
applicable) previous revenues, the number of investors in the specific round, and last whether previous funding
rounds were done. For the nominal variables, frequency tables will be used to look for consistencies in the data.
For the metric data, measures of location (mean, median, mode and skewness) and measures of variability
(variance, standard deviation, range and interquartile range) are used.
Page 22
21
3.3.1.B Independent sample t-test
The independent t-test is an inferential statistic that determines whether there is a statistically significant
difference between the means in two unrelated groups. There are several assumptions that need to be met in
order to do independent sample t-tests. First, the most critical assumption is that the dependent variable is
normally distributed. Second, the variance of the two groups investigated are the same as the variance of the
dependent variable. Third, it is assumed that the two samples are independent of each other, and fourth that
samples are drawn from the population at random. The fifth assumption is that in independent sample t-tests,
all observations must be independent of each other. The sixth and last assumption is that dependent variables
must be measured on an interval or ratio scale.
When all the assumptions are met, the hypotheses can be set. The null hypothesis for the independent
t-test is that the population means from the two unrelated groups are equal. It is assumed that the means of the
two groups are not significantly different. The alternative hypothesis assumes that the means of the two groups
are significantly different.
In this research it is investigated whether there is a statistically significant difference between the mean
investment size by business angels before 2017 and after 2017 until September of 2021. Consequently, the
sample of business angel deals is split up into two groups: 90 cases until 2017, and 100 cases from 2017 until
September of 2021. In this research, studying the differences between the two groups is interesting, to see
whether the mean investment size is up-to-date and not influenced by old investment behaviour. For start-ups
and entrepreneurs it is important to get a clear view on the current investment size of business angels, so
therefore the independence of periods is important to verify with help of this t-test. This is important for
Hypothesis 1, which focuses on the average investment size of individual business angels.
3.3.1.C Regression analysis
Regression analysis is a set of statistical methods used for the estimation of the relationships between a
dependent variable and one or more independent variables. Literature suggests multiple regression methods to
investigate relationships between various types of data, depending on the goal of the research (Osborne, 2000;
Mitton; 2020). The most frequently used regression is the Ordinary Least Squares (OLS) regression in corporate
finance research (Mitton, 2020). The OLS regression is seen as a popular method in research, as the method and
the respective outcomes could be easily comprehended and analysed in comparison to other methods.
OLS regression is a statistical method that estimates unknown parameters of independent variables in
a linear regression model, which means that the dependent variable is predicted by a linear combination of
independent variables (Osborne, 2000). As the name Ordinary Least Squares already states, minimizing the sum
of squares in the difference between the observed and predicted dependent variables is how the relationship
between the independent variables and the dependent variable is estimated. Meaning that the squared error
will be minimized, which results in a better explanatory power of the model.
To be able to use regression analysis, the first assumption that should be accounted for is that all
dependent and independent variables are metric, implying that the underlying values are continuous of nature.
Consequently, categorical, nominal and dichotomous variables cannot be used directly in multiple regression.
Page 23
22
For that reason, these types of variables need to be recoded into dummy variables (with the value 1 or 0), if the
researcher wants to include them in the research (Hair et al., 2014). However, this only applies to the
independent variables. When the dependent variable is non-metric, another type of regression technique needs
to be used, namely logistic regression. Nevertheless, in this master theses a metric dependent variable is used,
which consequently excludes the use of logistic regression.
Another assumption for using regression models in general is that the sample size has to be large enough
to ensure that the model has enough power at higher significance levels (at one percent or five percent). Henseler
(2019) states that the ratios between observations to variables is preferred to be twenty, but more is better.
Additionally, there should be no outliers in the dataset, which potentially distort the results.
OLS regression also has four specific assumptions that have to be met. First, linearity between the
independent and dependent variable has to be established by checking the scatter- or partial regression plots
(Henseler, 2019). Second, the error term is required to be homoscedastic, meaning that the error turn needs to
have equal variance. Otherwise, heteroscedasticity is assumed, which is a violation of the assumption for OLS
regression model. Homoscedasticity can be tested by performing a statistical test like Levene’s Test or by
analysing residual plots (Hair et al., 2014). Third, the error term needs to be uncorrelated with the independent
variables, as endogeneity issues arise. Fourth, the error terms must be normally distributed, also known as the
normality assumption. This could be checked by the histogram of the residuals, because if it looks nearly normal
the assumption is met.
In short, the OLS regression model is the most frequently used method in finance research (Mitton,
2020). More specifically, this regression model is used in prior research to test the effect of various variables on
investment size (Kadapakkam et al., 1998). It is a simple method to interpret the findings, as it allows to
investigate the effect of multiple independent variables on the metric independent variable.
In this research, it is important to use the OLS regression in order to test the influence of the timing of
investments and the industry type on the size of the investments made by business angels in the Netherlands.
3.3.2 Qualitative data analysis
In this section of the research, the qualitative data analysis will be performed. First, the interviews and notes will
be transcribed verbatim with the use of the software Amberscript. After the interview transcripts were created,
the transcripts were sent to the respondents for approval. When approval is received, the transcripts will be
reviewed and explored, followed by the process of creating initial codes for the transcripts. Afterwards, the codes
will be combined into themes and presented in a cohesive matter. The coding and results from this analysis will
then help support the quantitative data analysis, in order to gain more profound insights into the preferences of
business angels.
The results of the qualitative data analysis will be described in six different sections, according to the
overarching themes that were used in the interview. Important findings, quotes and mentionable results will be
translated into English and then described in a cohesive way. Afterwards, this data analysis will be used to
confirm and enrich the findings from the quantitative data analysis, but the qualitative results can also contradict
the findings of the quantitative research.
Page 24
23
3.4 Hypothesis testing
This section will describe how the hypotheses, that were formed in section 2.3, are tested. It is important to note
that not all hypotheses are tested with the use of the same method. In the following sections, the testing of each
hypothesis is explained briefly.
3.4.1 Hypothesis 1
The first hypothesis “If an individual business angel invests in a start-up, the average capital invested is between
100,000 and 500,000 Euros”. First, the descriptive statistics relevant for this hypothesis will be analysed, which
is the size of the investment in the variable “Amount invested by Business Angel”. Second, an independent
sample t-test is done to check for the accurateness of the investment size. Third, the results of the interviews are
used, to check whether the investment range of business angels is similar to the results of the quantitative data.
3.4.2 Hypothesis 2
The second hypothesis “If the investment is done at a later stage, the size of the investment done by the business
angel is larger”, is tested differently. Similar to the testing of the first hypothesis, the descriptive statistics of the
variables for investment size and investment timing will be analysed first. Then, investment timing is measured
with the variable “Type of funding”. After that, the hypothesis is tested by means of a regression analysis to see
whether the independent variable for investment timing is influencing the size of the investment done by the
business angels.
The formed hypothesis should be accepted or rejected based on the following terms. When the
regression coefficient has the correct hypothesized direction and is statistically significant, the null hypothesis
can be rejected, confirming the alternative hypothesis formed. When the null hypothesis cannot be rejected, the
alternative hypothesis should be rejected.
After the regression, the results from the interviews are compared to the results from the descriptive
statistics and regression analysis to either support or contradict the results and therefore this hypothesis.
3.4.3 Hypothesis 3
The third hypothesis is: “If an organization receives equity capital from a business angel, then it is mostly in the
seed phase”. This hypothesis is tested by means of an univariate analysis of the descriptive statistics for the
variable “Most preferred investment stage of the Business Angel” from the dataset of business angels, and the
variable “Type of funding” in the sample with business angel investment deals. Afterwards, the results are
compared with the results from the qualitative analysis, to see whether the hypothesis should be confirmed or
rejected.
Page 25
24
3.4.4 Hypothesis 4
In this section, it is explained how the fourth hypothesis is tested: “If a start-up receives business angel funding,
it is likely to operate in a technical industry”. First, the descriptive statistics for the variable “Industry of the
organization” are analysed univariately to see which industries are most preferred. Then, the results of the
interviews are compared to the qualitative results. The hypothesis will be tested with the results and will be
accepted or rejected, based on the evidence that was found in this research.
3.4.5 Hypothesis 5
The fifth hypothesis, “The type of industry influences the size of the investment done by the business angel”, is
also tested. For this hypothesis, the descriptive statistics will not be analysed again, as they are already analysed
for Hypothesis 1 and Hypothesis 4. Comparing the means of the investment size for the different industries will
be the first step in testing this hypothesis. Then a regression analysis is conducted. In this regression analysis, it
is investigated whether the independent variable “Industry of the organization” influences the dependent
variable “Invested amount by business angel. Again, the tested relationships are deemed statistically significant,
when their respective p-values, also known as probability values, are below <0.10, through preferably below
<0.05 or even <0.01.
Afterwards, the results from the interviews are used to support or contradict the results from the
quantitative data analysis, and to either accept or reject the hypothesis.
3.4.6 Hypothesis 6
The sixth and last hypothesis is that “Business angels invest mostly in a start-up that is geographically close”. This
hypothesis is tested by analysing the descriptive statistics for the variables “Country location of the organization”
and “Continent of the organization”. Afterwards, these results are compared with the results from the qualitative
results. Then, a conclusion will be made to either accept or reject this last hypothesis.
Chapter 3 discussed the methodology of this research. First, the research design has been explained, after which
the data collection for both the quantitative and qualitative part of the mixed method research were elaborated
on. Then, the data analysis for the quantitative part discussed the univariate analysis, the independent sample t-
tests and regression analyses that will be conducted. Afterwards, the qualitative data analysis was discussed.
Lastly, an overview of the hypotheses with their concerned testing methods was presented.
Page 26
25
4. Results
This chapter presents and discusses the most important results based on multiple analyses. First, section 4.1
discusses the quantitative results, starting with the descriptive statistics and followed by independent sample t-
tests, and afterwards the regression analysis. Second, section 4.2 presents the qualitative results. In section 4.3,
the hypotheses that were formed in chapter 2.3 will be discussed and rejected or accepted.
4.1 Quantitative results
This part of the chapter provides results for the quantitative research conducted in this study. All relevant
variables that were collected, are analysed in this chapter. It starts with the descriptive statistics about the
business angels in this sample, followed by an analysis into the investments done by these business angels. Then
the means for the variables for timing and industry are analysed with an independent sample t-test and
comparing means, after which two regression analyses will be conducted.
4.1.1 Descriptive statistics
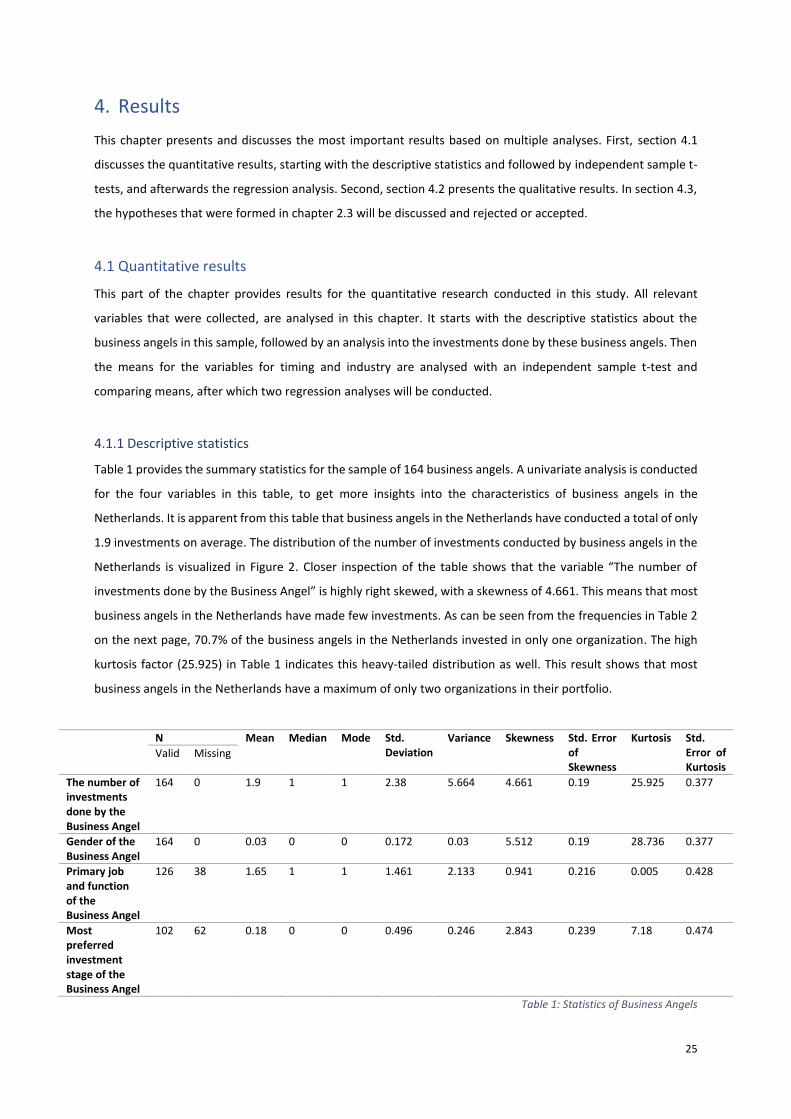
Table 1 provides the summary statistics for the sample of 164 business angels. A univariate analysis is conducted
for the four variables in this table, to get more insights into the characteristics of business angels in the
Netherlands. It is apparent from this table that business angels in the Netherlands have conducted a total of only
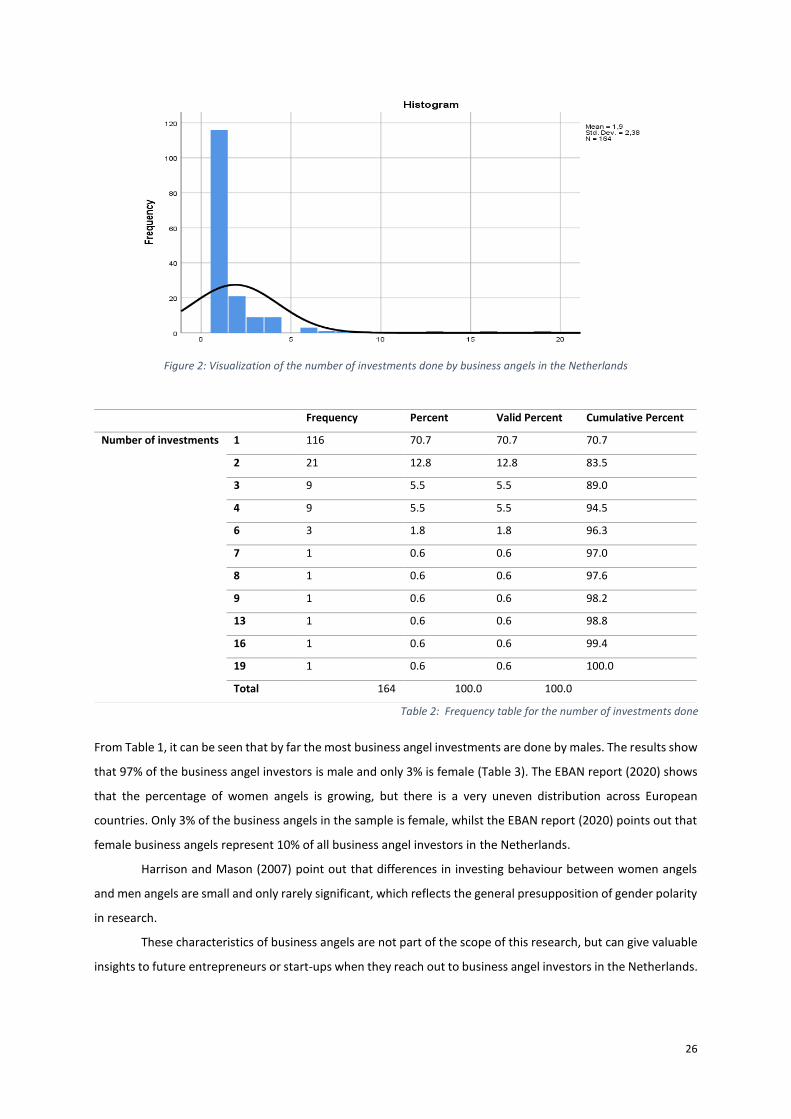
1.9 investments on average. The distribution of the number of investments conducted by business angels in the
Netherlands is visualized in Figure 2. Closer inspection of the table shows that the variable “The number of
investments done by the Business Angel” is highly right skewed, with a skewness of 4.661. This means that most
business angels in the Netherlands have made few investments. As can be seen from the frequencies in Table 2
on the next page, 70.7% of the business angels in the Netherlands invested in only one organization. The high
kurtosis factor (25.925) in Table 1 indicates this heavy-tailed distribution as well. This result shows that most
business angels in the Netherlands have a maximum of only two organizations in their portfolio.
N Mean Median Mode Std. Deviation
Variance Skewness Std. Error of Skewness
Kurtosis Std. Error of Kurtosis
Valid Missing
The number of investments done by the Business Angel
164 0 1.9 1 1 2.38 5.664 4.661 0.19 25.925 0.377
Gender of the Business Angel
164 0 0.03 0 0 0.172 0.03 5.512 0.19 28.736 0.377
Primary job and function of the Business Angel
126 38 1.65 1 1 1.461 2.133 0.941 0.216 0.005 0.428
Most preferred investment stage of the Business Angel
102 62 0.18 0 0 0.496 0.246 2.843 0.239 7.18 0.474
Table 1: Statistics of Business Angels
Page 27
26
Figure 2: Visualization of the number of investments done by business angels in the Netherlands
From Table 1, it can be seen that by far the most business angel investments are done by males. The results show
that 97% of the business angel investors is male and only 3% is female (Table 3). The EBAN report (2020) shows
that the percentage of women angels is growing, but there is a very uneven distribution across European
countries. Only 3% of the business angels in the sample is female, whilst the EBAN report (2020) points out that
female business angels represent 10% of all business angel investors in the Netherlands.
Harrison and Mason (2007) point out that differences in investing behaviour between women angels
and men angels are small and only rarely significant, which reflects the general presupposition of gender polarity
in research.
These characteristics of business angels are not part of the scope of this research, but can give valuable
insights to future entrepreneurs or start-ups when they reach out to business angel investors in the Netherlands.
Frequency Percent Valid Percent Cumulative Percent
Number of investments 1 116 70.7 70.7 70.7
2 21 12.8 12.8 83.5
3 9 5.5 5.5 89.0
4 9 5.5 5.5 94.5
6 3 1.8 1.8 96.3
7 1 0.6 0.6 97.0
8 1 0.6 0.6 97.6
9 1 0.6 0.6 98.2
13 1 0.6 0.6 98.8
16 1 0.6 0.6 99.4
19 1 0.6 0.6 100.0
Total 164 100.0 100.0
Table 2: Frequency table for the number of investments done
Page 28
27
The next result that can be concluded from this research is that business angels in the Netherlands have different
jobs next to their investment activities. In Table 4, the primary job and function of business angels in the
Netherlands are shown. This table indicates that 58.7% of angel investors have a (co)founding role as primary
job and function. That business angels are (co)founders of organizations, fits with the general assumption that
business angels are cashed-out entrepreneurs. 38.1% of business angels in the Netherlands are both
(co)founders and actively involved in an organization as Chief Executive Officers (CEO). Furthermore, 19% of
business angels is CEO of an organization that they did not found, whilst other business angels take on the role
of partner (7.1%), director (7.9%) or advisor (7.1%).
The functions of business angels within the organizations they invested in, are part of the mentoring
and monitoring task of business angels. Business angels can actively manage, monitor, and mentor their portfolio
organizations in order to minimize the risk of the investments made and improve the performances of these
organizations.
The jobs and functions of business angels in the Netherlands are not part of the scope of this research.
Similar to the other characteristic variables presented in Table 1, this is part of the clarification of characteristics
of business angels in the Netherlands.
Table 5 shows the frequency distribution for the variable “Preferred stage”, which indicates the timing
of the investment. The data from this research points out that 87.3% of business angels in the Netherlands prefer
to invest in the seed stage. Only 7.8% and 4.9% of the business angels in the Netherlands prefer to invest in early
stage or later stage ventures, respectively. This is similar to the analysed literature in Chapter 2, which found that
most business angels invest in the seed stage of organizations.
Frequency Percent Valid Percent Cumulative Percent
Gender of the Business Angel
Male 159 97.0 97.0 97.0
Female 5 3.0 3.0 100.0
Total 164 100.0 100.0
Table 3: Gender of the Business Angel
Frequency Percent Valid Percent Cumulative Percent
Primary job and function
(Co)Founder 26 15.9 20.6 20.6
(Co)Founder & CEO 48 29.3 38.1 58.7
CEO 24 14.6 19.0 77.8
Partner 9 5.5 7.1 84.9
Director 10 6.1 7.9 92.9
Advisor 9 5.5 7.1 100.0
Total 126 76.8 100.0
Missing System 38 23.2
Total 164 100.0
Table 4: Primary job and function of the Business Angel
Page 29
28
Table 5: Most preferred investment stage of the Business Angel
This section continues with a univariate analysis on the variables about investments conducted by business
angels in the Netherlands. The summary statistics for the data sample on investments made by business angels
in the Netherlands are presented in Table 6 on the next page. The variables that are enclosed in this table will be
evaluated individually afterwards, whilst referring to Table 6. Frequency tables will be used to elaborate further
on important findings on these variables.
The first variable that will be analysed is the size of the investment, measured by the variable “Invested
amount by business angel (in USD)”. As can be seen from the data in Table 6, the average investment done by
business angels in this sample is $2,126,367 (approximately 1.9 million Euros). This is significantly higher than
reported by the EBAN (2020), who stated that the mean investment done is 220,000 Euros (about 250,000 USD).
The statistics show a high variance, which shows that the amount invested in start-ups differs per
business angel. The standard deviation of the investment size variable is over four times higher than the mean.
A visualization of this variable is presented in Figure 3. The variable investment size is highly rightly skewed, as
indicated by the skewness level of 10.551. The kurtosis is extremely heavy-tailed with a score of 126.82. This
indicates that there are extreme outliers in the sample. This is reflected by the median investment size of
$337,240, which shows that 50% of all investment made by business angels are done with much lower amounts
than the average.
Figure 3: Size of the investment conducted by business angels in the Netherlands (in USD)
Frequency Percent Valid Percent Cumulative Percent
Preferred stage
Seed 89 54.3 87.3 87.3
Early Stage Venture 8 4.9 7.8 95.1
Later Stage Venture 5 3.0 4.9 100.0
Total 102 62.2 100.0
Missing System 62 37.8
Total 164 100.0
Page 30
26
N Mean Median Mode Std. Deviation Variance Skewness Std. Error of Skewness
Kurtosis Std. Error of Kurtosis
Percentiles
Valid Missing 25 50 75
Invested amount by business angel (in USD)
190 0 $2,126,367 $337,240 $100,000a $9,069,055 8.22478E+13 10.551 0.176 126.282 0.351 $106,650 $337,240 $1,233,906
Type of funding 190 0 2.79 2 2 2.294 5.265 1.562 0.176 1.866 0.351 2 2 3
Funding stage of the organization
173 17 0.35 0 0 0.616 0.379 1.587 0.185 1.352 0.367 0 0 1
Number of funding rounds
190 0 3.19 3 1 2.105 4.43 1.32 0.176 2.346 0.351 1.75 3 4
Number of investors involved in the investment round
190 0 4.52 3 1 4.14 17.14 1.938 0.176 4.817 0.351 1 3 6
Pre-money valuation of the organization (in USD)
27 163 $186,666,135 $2,000,000 $55,850a $541,839,789 2.9359E+17 2.954 0.448 7.91 0.872 $1,000,000 $2,000,000 $5,800,000
Total funding amount of the organization (in USD)
190 0 $29,156,942 $3,001,255 1,000,000a $92,827,552 8.61695E+15 6.559 0.176 51.283 0.351 $678,828 $3,001,255 $17,980,250
Industry of the organization
189 1 3.64 3 1 2.931 8.593 0.781 0.177 -0.475 0.352 1 3 5
Country location of the organization
190 0 5.09 0 0 6.301 39.705 0.69 0.176 -1.192 0.351 0 0 13
Continent of the organization
190 0 0.43 0 0 0.818 0.67 2.329 0.176 5.54 0.351 0 0 1
Original currency in which the investment was done
190 0 0.59 1 1 0.626 0.391 1.228 0.176 4.159 0.351 0 1 1
Table 6: Statistics of investments done by Dutch Business Angels
a. Multiple modes exist. The smallest value is shown
Page 31
27
The next variable that will be analysed is the variable “Type of funding”. Table 6 indicated that the both
the median and the mode for the timing of investments is 2, the seed phase. The skewness (1.562) points out
that the timing variable is highly rightly skewed (higher than 1.0), indicating that most investments are done in
the first phases. The kurtosis of 1.866 is considered acceptable (between -2 and 2) and proves a normal univariate
distribution.
The frequency table for the variable “Type of funding” is presented in Table 7. As can be seen from the
results in the table, 46.8% of all investments are made in the seed phase. 66.3% of all investments are conducted
up to and including the seed phase. These findings are consistent with previous studies that were presented in
Chapter 2, which showed that business angels are mostly investing in the seed phase. This table also points out
that 33.7% of the investments done by business angels in this sample is done in later stages. This is important
when considering that timing might influence the size of the investment.
Table 7: Type of funding
The current funding stages of the organizations that are analysed as part of the investments made by
business angels in the Netherlands are presented in Table 8. This table shows that 72.8% of the organizations are
still in the seed stage of funding, which is similar to what has been found in other research (Chapter 2). Whilst
19.7% of the investments of Dutch business angels is already an early stage venture with regards to their funding
stage, only 7.5% of the investments made is conducted as funding for later stage ventures. This can be explained
by the fact that some business angel investors were active in multiple funding rounds at the same organization.
Frequency Percent Valid Percent Cumulative Percent
Valid Seed 126 66.3 72.8 72.8
Early Stage Venture 34 17.9 19.7 92.5
Late Stage Venture 13 6.8 7.5 100.0
Total 173 91.1 100.0
Missing System 17 8.9
Total 190 100.0
Table 8: Funding stage of the organization
Analysing the variable “Number of funding rounds”, 24.7% of the investments made by business angels
in the Netherlands were conducted as the first funding for those organizations (Table 9). As reported in Table 6,
this is the mode, meaning that most organizations only received one round of funding. Another 20.5% of the
organizations already received two rounds of fundings, whilst 16.3% and 17.4% of the organizations received
Frequency Percent Valid Percent Cumulative Percent
Type of funding
Angel, before Pre-Seed 18 9.5 9.5 9.5
Pre-Seed 19 10.0 10.0 19.5
Seed 89 46.8 46.8 66.3
Series A 22 11.6 11.6 77.9
Series B 15 7.9 7.9 85.8
Series C 5 2.6 2.6 88.4
Series D 2 1.1 1.1 89.5
Series E 1 0.5 0.5 90.0
Venture - Series Unknown 7 3.7 3.7 93.7
Other 12 6.3 6.3 100.0
Total 190 100.0 100.0
Page 32
28
three and four rounds of funding, respectively. 21.1% of the organizations that were analysed based on
investments made by business angels in this sample already received five or more rounds of funding. This
corresponds to the data in Table 8, which indicated that 27.2% of investments is done in early stage or late stage
ventures.
Frequency Percent Valid Percent Cumulative Percent
Number of funding rounds
1 47 24.7 24.7 24.7
2 39 20.5 20.5 45.3
3 31 16.3 16.3 61.6
4 33 17.4 17.4 78.9
5 16 8.4 8.4 87.4
6 10 5.3 5.3 92.6
7 6 3.2 3.2 95.8
8 5 2.6 2.6 98.4
11 2 1.1 1.1 99.5
12 1 0.5 0.5 100.0
Total 190 100.0 100.0
Table 9: Number of funding rounds
The following variable that will be analysed is “Pre-money valuation”. A pre-money valuation is given
for organizations before the concerned investment, to establish the value of the organization. This data is not
available for all investments that were analysed in this research. The available data about pre-money valuations
of the organizations indicates that the mean pre-money valuation is 186 million USD (Table 6). The median is at
2 million USD. The skewness of 2.954 and kurtosis of 7.91 indicate, again, a rightly skewed distribution that is
heavy tailed. The results obtained from this research indicate that the organizations that have a pre-money
valuation are in a later stage of funding. This has been confirmed by literature, which states that start-ups cannot
be valued because of the lack of prior sales and revenue and also tangible assets (Bonini, 2019; Mason & Harrison,
2000). Only after a few investment rounds, a pre-money valuation can be made for start-ups.
The total funding amount of the organizations that were analysed in this sample has a mean of 29 million
USD (Table 6). The median is almost ten times lower, at about 3 million USD. This is pointed out by the skewness
factor of 6.559 and the high kurtosis of 51.283. The total funding amounts for the organizations in this sample
are dispersed, which can be explained by the dispersed number of funding rounds and funding stages of the
start-ups.
The data in Table 6 also presents the total number of funding rounds that the organizations had. The
mean funding rounds is 3.19. This is really close to the median of 3 funding rounds. The skewness of 1.32 and
kurtosis of 2.346 indicate that the variable is right skewed and tailed. The mode of 1 points out that most
organizations in this sample only had one funding round, indicating that the funding from business angels was
the first round of financing.
Page 33
29
Table 10 presents data on the preferred industries of business angel investors in the Netherlands. The
findings show a lot of dispersion in the different types of industries. The most popular industry is the Business-
to-Business (B2B) Software and Services (22.8%), followed by the Consumer Goods and Services industry (20.1%).
This is constant with the findings of the EBAN report (2020), which stated that the most popular industry in the
last decade is enterprise software. The industry of Consumer Goods and Services is the second largest industry,
with 20.1% of the investments in this sample. This is not reflected in the research by the EBAN (2020). The EBAN
stated that the Fintech industry, the Marketing industry and the Healthcare industry all represent about 10% of
the deals, and this is also presented in this data sample. This study indicated that a lot of these industries have a
high technological focus, by providing platforms or online service in their own industries.
Frequency Percent Valid Percent Cumulative Percent
Industry Financial Technology 17 8.9 9.0 9.0
B2B Software and Services 43 22.6 22.8 31.7
Healthcare and Biotechnology
16 8.4 8.5 40.2
Consumer Goods and Services
38 20.0 20.1 60.3
Consumer Media 18 9.5 9.5 69.8
Marketing 14 7.4 7.4 77.2
Transport 3 1.6 1.6 78.8
Food 11 5.8 5.8 84.7
Energy 9 4.7 4.8 89.4
Education 10 5.3 5.3 94.7
Other 10 5.3 5.3 100.0
Total 189 99.5 100.0
Missing System 1 0.5
Total 190 100.0
Table 11 provides the descriptive statistics for the location of the start-ups that the Dutch business
angels invested in. As shown in Table 11, 51.1% of all investments done by Dutch business angels is conducted
at the national level, in the Netherlands (Table 11). Research by the EBAN (2020) states that 59% of deals in 2019
was done in the Netherlands, 16% at regional level (neighbouring countries), 9% in the rest of Europe, 5% in the
USA and 13% in other, international countries. The small amount of 5% of investments done in the USA as
reported by the EBAN (2020), is in this sample significantly larger (22.1%). 7.4% of the business deals that are
analysed in this research are done at the international level, outside of Europe and the USA, which is lower than
the 13% stated by the EBAN.
Table 10: Industry of the organization
Page 34
30
Table 11: Country location of the organization
Table 12 points out the in which continent the investments by business angels in the Netherlands are
made. Analysing the continents that the business angels have invested in more specifically, the focus is mostly
on investments in Europe (70.5%) and a little on North America (22.1%). The investments made within Europe
are less than reported in the EBAN report (2020), which stated 84% of the investments of business angels in the
Netherlands are conducted in Europe. South America, Asia and Oceania can be neglected as important funding
continents, as they together consist of only 7.4% of all investments done by business angels in the Netherlands.
Closer inspection of the results reported in Table 11 and Table 12 shows that all the investments made in North
America are conducted in the USA.
Table 12: Continent of the organization
The next table is Table 13, in which the currency of investments in the sample is shown. Whilst 70.5% of
all deals are done in Europe (shown in Table 12), only 50% of the deals is done in Euros (Table 8). 22.1% of all
deals in this sample are done in the United States of America, which is only half of the 46.3% of all deals that are
done in USD. Currencies are not relevant for this research, but it shows that the investment market is focused
on international investments.
Frequency Percent Valid Percent
Cumulative Percent
Country Netherlands 97 51.1 51.1 51.1
Germany 6 3.2 3.2 54.2
United Kingdom 6 3.2 3.2 57.4
Belgium 1 0.5 0.5 57.9
France 6 3.2 3.2 61.1
Spain 5 2.6 2.6 63.7
Portugal 3 1.6 1.6 65.3
Austria 1 0.5 0.5 65.8
Sweden 1 0.5 0.5 66.3
Finland 2 1.1 1.1 67.4
Latvia 1 0.5 0.5 67.9
Luxembourg 1 0.5 0.5 68.4
India 3 1.6 1.6 70.0
United States of America 42 22.1 22.1 92.1
Brazil 4 2.1 2.1 94.2
Australia 3 1.6 1.6 95.8
Israel 3 1.6 1.6 97.4
Turkey 1 0.5 0.5 97.9
Switzerland 1 0.5 0.5 98.4
Thailand 1 0.5 0.5 98.9
Bosnia and Herzegovina 1 0.5 0.5 99.5
Denmark 1 0.5 0.5 100.0
Total 190 100.0 100.0
Frequency Percent Valid Percent Cumulative Percent
Continent Europe 134 70.5 70.5 70.5
North America 42 22.1 22.1 92.6
South America 4 2.1 2.1 94.7
Asia 8 4.2 4.2 98.9
Oceania 2 1.1 1.1 100.0
Total 190 100.0 100.0
Page 35
31
Closer inspection of Table 6 shows that the number of investors involved on average in a business angel
funding round is 4.52. This variable is rightly skewed (1.938) with a heavy tailed kurtosis (4.817). The median
shows that in 50% of all investments made by business angels in the Netherlands, there is a maximum of three
investors that invest together in the first round of seed financing. The mode shows that in most investment deals,
the angel investor is the only investor at that time.
As shown below in Table 14, the number of investors involved in the investment round is very dispersed.
In 25.3% of all deals, the business angel was the only investor in that round. However, it is really different across
all investments. This shows that most business angel investments are done by one or just a few investors (65.8%
of all investments is done with a maximum of four investors in that investment round). Only 13.2% of the
investment deals that are analysed in this research have more than ten investors in the investment round. An
important sidenote that has to be made is that this research is only considering individual angel investments, so
angel groups and syndicates are not part of this research. In these groups and syndicates, there are always over
10 investors involved.
Frequency Percent Valid Percent Cumulative Percent
Number of investors
1 48 25.3 25.3 25.3
2 26 13.7 13.7 38.9
3 30 15.8 15.8 54.7
4 21 11.1 11.1 65.8
5 13 6.8 6.8 72.6
6 6 3.2 3.2 75.8
7 11 5.8 5.8 81.6
8 7 3.7 3.7 85.3
9 3 1.6 1.6 86.8
10 10 5.3 5.3 92.1
11 2 1.1 1.1 93.2
12 2 1.1 1.1 94.2
13 5 2.6 2.6 96.8
14 2 1.1 1.1 97.9
19 1 0.5 0.5 98.4
20 1 0.5 0.5 98.9
21 1 0.5 0.5 99.5
25 1 0.5 0.5 100.0
Total 190 100.0 100.0
Table 14: Number of investors involved in the investment round
This section presented the univariate analysis of the characteristics of business angels in the Netherlands
and of important variables about business angel investments in the Netherlands.
Frequency Percent Valid Percent Cumulative Percent
Currency USD 88 46.3 46.3 46.3
EUR 95 50.0 50.0 96.3
GBP 5 2.6 2.6 98.9
CHF 1 0.5 0.5 99.5
AUD 1 0.5 0.5 100.0
Total 190 100.0 100.0
Table 13: Original currency in which the investment was done
Page 36
24
4.1.2 Independent sample t-test
In this section, the results of the independent sample t-test on timing of the investment are presented, as well
as the comparing of means for the different industry types. As stated in the methodology chapter, the
independent sample t-test is done to test the independence of periods in which business angels in the
Netherlands have invested. Therefore, the total sample of 190 deals was split into two samples. The first 90 cases
are business angel deals that took place prior to 2017, whilst the other 100 cases took place from 2017 till
September of 2021.
The group statistics for the variable “Invested amount by business angel (in USD)” are presented in Table
15. The results indicate that the mean of investments made by business angels in the Netherlands before 2017
is almost $900,000, or approximately €800,000 (not adjusted by inflation, as only 10% of the investments in this
group is conducted before 2007, 90% is from 2007-2017). The mean of the investments done from 2017 till
September 2021 is 3.2 million USD (2.9 million Euros). This indicates that the average investment size is larger in
the second period.
The standard deviations for the investment size are also presented in Table 15. The standard deviation
for the investment size of the period before 2017 is twice as high as the average investment size in this period
(1.6 million USD, or approximately 1.4 million Euros). The standard deviation of the period from 2017 till
September 2020 is almost four times as high as the average investment size in this period (12.3 million USD, or
approximately 11.8 million Euros). Moreover, the standard deviation for investments in the period after 2017 is
much higher than for investments before 2017, but both show extremely high standard deviations.
The period in the sample,
first or second half
N Mean Std. Deviation Std. Error Mean
Invested
amount by
business
angel (in USD)
Prior to 2017 90 $896,945 $1,634,248 $172,265
2017 till Sept 2021 100 $3,232,846 $12,329,101 $1,232,910
Table 15: Comparing means for investment size prior to 2017 and after 2017
In Table 16, the t-test results are presented. The null hypotheses assumes that the variances of the two groups
are approximately, which means that the distribution of investment amounts prior to 2017 is approximately
equal to the distribution of investment amounts from 2017 till September 2021. The alternate hypotheses states
that the two distributions are significantly different in shape. Considering the results of the Levene’s Test for
Equality of Variances, the Sig. value is 0.005. The set level of significance in this research is 0.05. The value of the
Levene’s Test is lower than 0.05, so the null hypothesis is rejected. Therefore it is assumed that the variances are
not equal, which is shown in Table 15 of well.
Page 37
25
Analysing the results of the independent sample t-test in Table 16, when equal variances are not
assumed, the significance level is 0.063. This is bigger than the set level of 0.05 as significance in this research.
Therefore, the null hypothesis is accepted, which means that the mean investment amount for the two groups
is not significantly different. This means that the period prior to 2017 and the period from 2017 till September
2021 do not have significantly different investment sizes.
For this research, another test is done to assess whether there are large differences in the mean
investment size. The different industry types of the organizations in which business angels in the Netherlands
invest are compared. The variables “Invested amount by business angel (in USD)” and “Industry of the
organization” are tested using comparing means. In Table 17, the case processing summary is shown. 189 cases
are included in this analysis.
Cases Included Cases Excluded Total
N Percent N Percent N Percent
Invested amount by business
angel (in USD) * Industry of
the organization
189 98.4% 3 1.6% 192 100.0%
Table 18 presents the mean of the invested amount by business angels in the Netherlands for each
industry. The results show that investments done in the Financial Technology industry are the highest, with 11.7
million USD. This industry is followed by the Transport industry, with an average investment of 5.1 million USD.
However, the transport industry mean is based on only three investments. The B2B Software and Service industry
received the most investments from business angels in the Netherlands, 43 out of 189 investments . The average
investment size in this industry is 1.2 million USD. Other industries in the sample have a mean investment size
around one million USD. Only the consumer media industry is way below, with an average investment amount
of 375,000 USD.
Levene's Test
for Equality
of Variances t-test for Equality of Means
F Sig. t df
Sig. (2-
tailed)
Mean
Difference
Std. Error
Difference
95% Confidence Interval of the
Difference
Lower Upper
Invested
amount by
business
angel (in
USD)
Equal variances
assumed
8.056 .005 -1.783 188 .076 -$2,335,902 $1,310,173 -$4,920,431 $248,628
Equal variances
not assumed -1.876 103 .063 -$2,335,902 $1,244,887 -$4,804,880 $133,077
Table 16: Independent samples test for investment size
Table 17: Case processing summary
Page 38
26
The results in Table 18 show a really high standard deviation for all industries, which shows that
investment size is varying a lot in each deal. The two industries with the highest mean investment size, Financial
Technology and Transport, also have the highest standard deviation. High standard deviations can indicate that
the investment size is random and not influenced by the industry, but further investigating is necessary. The next
section therefore presents a regression analysis.
Table 18: Comparing means of the invested amount by Business Angel (in USD) for each industry
This section discussed the results of the independent sample t-test for timing of the investment and compared
the means of investments made in different industries. It has been concluded from the independent sample t-
test for investment timing, that no significant differences exists between investments made in the period up to
2017 and the period from 2017 till September 2021. The results of the mean investment size for different
industries indicated a lot of variation in investment sizes between different industries.
4.1.3 Regression analysis
The regression analyses in this research are conducted to test whether the independent variables timing and
industry have an influence on the size of the investment made by business angels in the Netherlands.
The first regression analysis was performed with the “Invested amount by business angel” as the
dependent variable, and the timing as the independent variable. The timing variable “Type of funding” has been
recoded into dichotomous variables, in order to perform the regression analysis. Dichotomous variables are also
called dummy variables, which take on the value of 1 or 0. The dummy variables for early-stage equity capital
are “angel_beforepreseed”, “preseed”, and “seed”. The dummy variables included for later-stage equity capital
are “SeriesA”, “SeriesB”, “SeriesC”, “SeriesD”, “SeriesE” and “VentureSeriesUnknown”. For each dummy variable
holds: when this is the type of funding, the value is 1 and otherwise 0. The category “Other” has not been
recoded, as it is automatically 1 when all other dummy variables are 0.
Mean N Std. Deviation
Industry of the organization Financial Technology $11,787,828 17 $28,064,706
B2B Software and Services $1,219,333 43 $3,652,527
Healthcare and
Biotechnology
$2,708,826 16 $3,155,864
Consumer Goods and
Services
$766,293 38 $1,171,315
Consumer Media $375,099 18 $495,638
Marketing $993,574 14 $2,914,945
Transport $5,152,578 3 $8,545,411
Food $669,385 11 $1,411,054
Energy $1,624,144 9 $1,129,474
Education $1,016,558 10 $1,702,861
Other $1,044,646 10 $1,188,770
Total $2,137,550 189 $9,091,830
Page 39
27
In Table 19, the model summary is shown. The R Square of 0.121 indicates that 12.1% of the variance in
the dependent variable is explained by the independent variables, which is a very low score. The high Std. Error
of the Estimate indicates that the timing variables do not have a big influence on the investment size.
In Table 20, the ANOVA results are presented. The p-value of 0.005 points out that there are significant results,
because the value is less than the set level of significance of 0.05. This shows that a linear regression model is
the right fit for testing these independent variables for timing. Consequently, the regression model is continued.
b. Predictors: (Constant), angel_beforepreseed, preseed, seed, SeriesA, SeriesB, SeriesC, SeriesD, SeriesE, VentureSeriesUnknown
The results of the regression analysis are set out in Table 21. This table shows that most variables are not
statistically significant. Only the dummy variables “SeriesA” and “SeriesE” show a significant p-value (<0.05).
When investments are made in the Series A and the Series E funding rounds, this timing has a significant impact
on the size of the investment made by the business angels. The variable “VentureSeriesUnknown” is significant
at the 0.10 level, but this is only a weak significance. It has to be concluded that no meaningful interpretations
can be formed from this regression analysis because of the fact that many variables do not have a significant
influence on the size of the investment made by business angels. However, when the funding is conducted as a
Series A or Series E investment, there is a significant effect.
Model R R Square
Adjusted R
Square
Std. Error of
the Estimate
Change Statistics
R Square
Change F Change df1 df2 Sig. F Change
1 .348a .121 .077 $8,711,761 .121 2.758 9 180 .005
Table 19: Model Summaryb
a. Predictors: (Constant), angel_beforepreseed, preseed, seed, SeriesA, SeriesB, SeriesC, SeriesD, SeriesE, VentureSeriesUnknown
b. Dependent Variable: Invested amount by business angel (in USD)
Model Sum of Squares df Mean Square F Sig.
1 Regression 18.8E14 9 20.9E13 2.758 .005b
Residual 13.6E15 180 7.6E13
Total 15.5E15 189 Table 20: ANOVAa
a. Dependent Variable: Invested amount by business angel (in USD)
Page 40
28
Model
Unstandardized Coefficients
Standardized
Coefficients
t Sig.
Collinearity Statistics
B Std. Error Beta Tolerance VIF
1 (Constant) 710,810 2,514,869 .283 .778
angel_before
preseed
-484,399 3,246,682 -.016 -.149 .882 .442 2.263
preseed -495,846 3,212,324 -.016 -.154 .878 .430 2.325
seed -195,694 2,679,051 -.011 -.073 .942 .224 4.474
SeriesA 6,519,203 3,126,392 .231 2.085 .038 .399 2.505
SeriesB 3,015,377 3,374,051 .090 .894 .373 .483 2.072
SeriesC 6,313,183 4,637,189 .112 1.361 .175 .725 1.379
SeriesD 3,000,728 6,653,718 .034 .451 .653 .866 1.154
SeriesE 22,925,554 9,067,489 .183 2.528 .012 .928 1.078
VentureSeries
Unknown
7,909,543 4,143,269 .165 1.909 .058 .656 1.525
Table 21: Regression Coefficientsa a. Dependent Variable: Invested amount by business angel (in USD
The second regression analysis was performed with the independent variable “Industry of the organization”,
which has been recoded into dummy variables similarly as in the previous regression for “Type of funding”. In
order to perform the regression analysis, the dummy variables are “FinTech”, “B2BSoftware”,
“HealthcarBiotech”, “ConsumerGoods”, “ConsumerMedia”, “Marketing”, “Transport”, “Food”, “Energy” and
“Education”. Again, for each of these dummy variables holds: if it is the actual industry, the value is 1, and 0
otherwise. The industry category “Other” has not been recoded into a dummy variable, as it is automatically 1
when all other variables are 0. Similar to the first regression analysis, the size variable “Amount invested by
business angel” is the dependent variable.
The model summary for the second regression analysis is presented in Table 22. This table indicates that
the R Square only has a predictive power of 0.119, which already shows that the variable “Industry of the
organization” has no predictive power over the dependent variable “Amount invested by business angel”. To
check whether certain variables do have some power on the dependent variable, this regression analysis is
continued.
Mode
l R R Square
Adjusted R
Square
Std. Error of
the Estimate
Change Statistics
R Square
Change F Change df1 df2 Sig. F Change
1 .345a .119 .070 $8,746,301 .119 2.421 10 179 .010
Table 22: Model Summary a. Predictors: (Constant), FinTech, B2BSoftware, HealthcareBiotech, ConsumerGoods,
ConsumerMedia, Marketing, Transport, Food, Energy, Education
Page 41
29
The ANOVA table is presented in Table 23. The p-value in this table shows a significant result of 0.010,
which is below the set significance level of 0.05. These results indicate that a linear regression model is the right
fit for analysing this data. However, the Sum of Squares and the Mean Squares are high, indicating a lot of
variation in the dependent variable. Together with the low predictive power of this model presented in Table 22,
results need to be assessed with caution.
Model Sum of Squares df Mean Square F Sig.
1 Regression 18.5E15 10 18.5E12 2.421 .010b
Residual 13.7E15 179 7.6E12
Total 15.5E15 189
Table 23: ANOVAa
a. Dependent Variable: Invested amount by business angel (in USD) b. Predictors: (Constant), Education, Transport, Energy, Food, Marketing,
HealthcareBiotech, FinTech, ConsumerMedia, ConsumerGoods, B2BSoftware
The coefficients table for the second regression is presented in Table 24 below. The results in this table point out
that the only variable with a significant p-value is “FinTech”. The p-value of 0.002 indicates that when are
investments made in the Financial Technology industry, this has a significant effect on the size of the investment.
The analysis of means for each industry (Table 18) indicated that investments made in this industry were the
largest by far.
All other variables included in this regression analysis are not significant, and the Beta and Standard
Error are really high. These results indicate that all industries, except the Financial Technology industry, do not
have a significant influence on the size of the investment made by business angels in the Netherlands. Therefore,
no meaningful interpretations can be made from this regression analysis for industry type influencing the
investment size. These results can indicate that size of the investments are not influenced by the type of industry.
Model
Unstandardized Coefficients
Standardized
Coefficients
t Sig.
Collinearity Statistics
B Std. Error Beta Tolerance VIF
1 (Constant) 950842 2,637,109 .361 .719
FinTech 10,836,986 3,384,407 .342 3.202 .002 .431 2.318
B2BSoftware 268,491 2,955,226 .012 .091 .928 .263 3.798
HealthcareBiotech 1,757,984 3,425,705 .054 .513 .608 .445 2.248
ConsumerGoods -184,549 2,994,569 -.008 -.062 .951 .281 3.564
ConsumerMedia -575,744 3,347,271 -.019 -.172 .864 .419 2.387
Marketing 42,732 3,523,985 .001 .012 .990 .475 2.105
Transport 4,201,735 5,696,807 .058 .738 .462 .798 1.253
Food -281,457 3,729,435 -.007 -.075 .940 .531 1.884
Energy 673,301 3,931,170 .016 .171 .864 .577 1.732
Education 65,716 3,821,534 .002 .017 .986 .553 1.809
Table 24: Regression Coefficients
Page 42
30
This section presented two regression analyses. The first regression analysis tested the influence of investment
timing on the size of the investment made by business angels in the Netherlands. Only later-stage equity
investments conducted in SeriesA or SeriesE have a significant impact on the size of the investment. The second
regression analysis tested the influence of the industry of the organizations on the size of the investment made
by business angels in the Netherlands. The results indicated that almost no type of industry had a significant
impact on the size of the investment, except from the Financial Technology industry.
4.2 Qualitative results
This paragraph will discuss the preferences of Dutch business angels with regards to assessment criteria for
investing in start-ups, which is measured by conducting ten semi-structured interviews. The results of these
interviews are presented in separate sections, in which the findings are presented on six different topics: general
information, size of the investments, timing of the investments, industry of the start-ups, geographic locations
of the investments and lastly, criticism and other criteria.
4.2.1 General information
When asking respondents how many years they have been active as a business angel, all respondents indicated
that they have at least five years of experience (RO1, RO3, RO6, RO7, RO9, RO10), whilst some have been active
as a business angel for over 10 years (RO2, RO4, RO5, RO8). All respondents are Dutch, and currently living in the
Netherlands. However, the number of investments done by the business angels is really dispersed. Whilst some
angels did fifteen up to nineteen investments (RO3, RO1 & RO5), others did only one or two, respectively (RO4
& RO8, RO10). The other respondents are in between these number of investment, and did three to twelve
investments (RO2, RO6, RO7, RO9). All investors currently have at least one organization in their investment
portfolio, whilst some have a diverse portfolio of twelve or more organizations (RO1, RO3, RO5). Two business
angels currently have only one organization in their portfolio, because they are now investing through venture
capital funds, and not as independent investor anymore (RO8, RO10). “As partner in a venture capital fund, I do
my investments here and not as personal transactions anymore, so I can create a more diversified portfolio”-
RO10. Some respondents sold their shares in the start-ups successfully (RO1, RO3, RO9), but others were not as
successful, and one respondent argued that “business angel investing is always tricky, because you never know
how a start-up will turn out” -RO2. Therefore, success rates of business angel investors differ amongst the
respondents.
Another big difference amongst the respondents is the level of involvement. As stated in Chapter 2,
business angels can get actively involved in an organization in order to manage the risks of investing in a start-
up, by monitoring and mentoring. Several respondents are actively involved in the daily operations of the start-
ups they invested in, by working at the organization and managing other people (RO2, RO4, RO6, RO10). “I believe
it is the angel investor’s job to close the trap a bit before that the entrepreneurs fall into it. Therefore it is
important to be as involved as possible, and also because the financial aspects are subordinate to the idea in the
Page 43
31
eyes of the entrepreneurs” -RO2. On the other side, “I am active in my portfolio organizations only as a board
member, but not on a daily basis” -RO7.
In the interviews came forward that business angels who are actively investing in more portfolio
organizations, are less actively involved in the daily operations of these organizations. This fits with their function,
because the investors that have more portfolio organizations describe themselves as active business angels, with
board and advisory functions. Some of these angels are also founders of their own organization, which are High-
tech companies and Venture Capital (VC) funds. The respondents who had three or fewer organizations in their
portfolio describe their function as serial entrepreneur, creative director and financial director, and business
angel on the side (RO2, RO4, RO6, RO8).
4.2.2 Size of the investments
Analysing the results about the size of the investments made by the interviewed business angels, it is really
dispersed (Table 25). Eight of the ten respondents could not give an average investment amount, but gave a
range instead. Only two respondents had an exact investment amount (RO4, RO10), which is explained by the
fact that they did only one investment. Amounts given by the business angels range from five thousand Euros
(RO2) up to two million Euros (RO3). All respondents mention that the size is depends on how far the start-up
has developed their idea into a functioning product.
Respondent 9 said in the interview that there is a lot of difference in the development of the product or
service once start-ups reach out for money, and “when there is only an idea, there is little money necessary in
the beginning, depending on the milestones that are met, but the idea can deserve an investment (big or small)
when there is potential in the team”. Moreover, the respondent argued that size of the investment is depending
mostly on the timing and the individual team that reaches out to the business angel.
Moreover, the amount that is invested in the first round, is mostly given by the start-up when they reach
out for funding towards business angels. In some situations, the amount that is invested is consulted between
the start-up and angel investor. However, start-ups always have some ideas and plans for how much money they
need in the upcoming period.
Respondent Investment range Type of investment Amount invested/raised
Respondent 1 €100,000 - €250,000 Lump sum Given by the start-up
Respondent 2 €5,000 - €250,000 Staged investment Consulted with the start-up
Respondent 3 €50,000 - €2,000,000 Lump sum Given by the start-up
Respondent 4 €250,000 Lump sum Given by the start-up
Respondent 5 €100,000 - €1,500,000 Lump sum Given by the start-up
Respondent 6 €250,000 - €500,000 Lump sum Given by the start-up
Respondent 7 €50,000 - €400,000 Lump sum Given by the start-up
Respondent 8 €100,000 - €1,000,000 Staged investment Consulted with the start-up
Respondent 9 €100,000 - €1,000,000 Lump sum Given by the start-up
Respondent 10 €50,000 Staged investment Given by the start-up
Table 25: Investment range, type of investment and amount invested/raised according to business angels
Page 44
32
Most investors state that they invest all the money at once, in a lump sum investment to the start-up.
Three respondents prefer a staged investments, where certain milestones need to be met before the next round
of money becomes available to the organization (RO2, RO8, RO10). Respondent 8 stated that “staging
investments is valuable so organizations are considering expenses more. The milestones that are set require a
certain amount of growth and development, and new money is invested once the company is growing”.
Respondent 10 mentions that “the initial funding amount was split into two parts, because in the beginning there
was only an idea. More development was necessary before the rest of my investment was paid out, so I would
not risk all the money at once, if the start-up was not performing well”.
Concluding, the amount of money that is invested by the business angels is really different, but also
heavily depending on the timing when entrepreneurs or the start-up reach out to the business angels. Therefore
the size of the investment and timing arguments will be discussed more in the next section.
4.2.3 Timing of the investments
Considering the timing of investments showed to be really important for the size of the investment as well.
Timing of the investments was of big importance according to the interviewed business angels in this research.
The consensus was that in later stages, there is more money necessary for growth. All interviewed business
angels state that investments in later stages generally contain more money. Some respondents stated that they
focus on doing some investments in later stages in order to manage portfolio risk, but for these investments
more money is needed because of this later stage, because growth is costly and bigger steps need to be taken
(RO3, RO9, RO10). The same investors sometimes invest in the pre-seed phase already, when there is just an
idea.
Some respondents invest in an idea of entrepreneurs, sometimes when not even a legal entity has been
formed (RO3, RO9). These investors believe that a promising idea with a good team can be worth a risky
investment. “Sometimes you need to take a chance in order to become part of a huge success” -RO9. Another
respondent wants that the software has already been developed and launched, but no real turnover and
customer base is required yet (RO1). Respondent 2 thinks a feasible concept is enough, and sales are not
necessary to invest. “Just a good team might be enough” -(RO4). For some business angels, there needs to be an
interesting product and some development towards starting sales and revenue (RO6, RO8). Additionally, it needs
to be tested whether there is some potential and interest on the market for the product.
All respondents stated that their main investment activities are involved around first round financing of
start-ups, in the pre-seed or seed phase. In the interviews it showed that the concept of the seed phase was
explained differently by the business angels, since some did not anticipate there was a pre-seed phase, but this
fitted better with their investment behaviour.
Page 45
33
Respondents point out that staging had an impact on the timing of investments. The business angels
stated that investments that are staged can expect the next round of funding after accomplishing certain
milestones: successfully completing a previous phase; meeting growth numbers in a certain period; the team
proved itself; or when after careful consideration new financing is necessary (RO2, RO8). Staging is done to
manage the risk involved with investing in a start-up. However, most respondents in the interview prefer one
lump sum investment in the first round of financing in the pre-seed or seed phase.
4.2.4 Industry of the start-ups
The industry of the start-ups in which the interview respondents are investing is also different (Table 26). Some
respondents say the industry of the start-ups they are investing in does not matter, since “every organization is
the same in the beginning, because business principles are the same for development or growth” -RO2. Others
have a really specific interest in certain industries, mostly because of the experience and value they can bring to
their portfolio organizations. One responded specifically stated: “I only invest when money is not the only thing I
am adding to the organization, but also my experience, network and expertise can help the organization grow”-
RO3. One respondent focuses mostly on technical organizations, but has a specific focus on organizations with
women in leadership roles (RO7). Respondent 5 invests specifically in growing business platforms, because
“online business platforms are the future, because they will always be needed and new techniques will be
developed and offered constantly” –(RO5).
Most respondents stated in the interviews that their portfolio organizations are mostly technical
organizations (RO1, RO2, RO3, RO4, RO5, RO6, RO7, RO8, RO10). The reason to invest in technological start-ups
is the extreme growth potential that technology start-ups have in the fast changing world. “Not only online, but
also offline technology is a very interesting market because your investment might become extremely successful”
–(RO8). Another respondent stated that start-ups in technological industries might seek outside financing
sooner, because developing technical ideas is more expensive (RO6).
Respondent 8 wants to bring experience to the industry, but also focuses on the energy industry because
the respondent believes this is an area where much development and change is possible. This is one of the main
objectives of this investor. Another respondent believes that helping with building start-ups to globally scaled
organizations is the most important task as angel investor, and “every healthy start-up has growth potential in
its own industry” -(RO9).
Respondent Industry preference
Respondent 1 B2B software
Respondent 2 No preference
Respondent 3 FinTech
Respondent 4 FinTech
Respondent 5 B2B software
Respondent 6 Consumer media
Respondent 7 B2B software and consumer media
Respondent 8 Energy and transport
Respondent 9 No preference Respondent 10 B2B software
Table 26: Industry preference of business angels
Page 46
34
Concluding, the focus on specific industries is mostly a consequence of the experience of the business
angel in this industry. All respondents that prefer a certain industry argued that it is because they have more to
offer for organizations in this industry. Additionally, the specific type of industry does not come forward as a
reason for the amount invested. Most portfolio organizations of interviewed business angels are technical
organizations, so it might be hard to compare this. Considering the results from the interview, no difference can
be found between industries and investment size.
4.2.5 Geographic location of the investments
The next investment criteria is the geographic location of the investments. The interviewed business angels all
invest mostly in the Netherlands, but some do invest in other regions as well. Table 27 gives an overview of the
investment regions of the ten interview respondents. Respondent 1 focuses on the Netherlands, Benelux,
Scandinavia and the Baltic States because “entrepreneurs and start-ups in these countries have a more
international growth strategy because their own country is small, so there is a mindset in these start-ups to grow
beyond outside borders, which gives high potential”. Another important reason to invest in these regions is
because European tax laws are easier to understand than other areas, where angel investors have less
experience. Also the small cultural difference makes it easier to invest here (RO1, RO5, RO7).
Respondent 3 focuses on developing countries, because “if you develop an idea and it is successful, in
these regions you might skip a lot of steps and instantly become market leader. Especially in Fintech, there are
many opportunities in developing countries, because a lot of people who live in these countries do not have a
bank account currently”. The respondent argues that by creating an alternative way of providing some new type
of finance or banking in developing countries, for instance countries in Africa or India, business angels can make
the difference and become really successful.
Respondent 4 and respondent 8, who both invest only at national level, prefer this local region because
they are actively involved in the daily operations of their portfolio organization. In order to manage the people
at work, they are in the workplace a lot and therefore want to live close to the organization.
Respondent Investment region
Respondent 1 Netherlands, Benelux, Scandinavia and Baltic States
Respondent 2 Netherlands and international (Europe)
Respondent 3 Netherlands and global (mostly developing countries)
Respondent 4 Netherlands
Respondent 5 Netherlands and international (Europe)
Respondent 6 Netherlands and global
Respondent 7 Netherlands and United Kingdom
Respondent 8 Netherlands
Respondent 9 Netherlands and global
Respondent 10 Netherlands and Israel
Table 27: Investment region of interviewed business angels
Page 47
35
Four respondents stated specifically that they are not active as business angel in the USA (RO1, RO3,
RO5, RO7). All these respondents have the same reason for this: they believe “the market in the USA is overhyped
and start-ups are overvalued”. This makes the investments less profitable, but it also hard to get in between
other investors in this market. Another important factor is that the market is big, and many investors are there
already. “If you are not actively managing investments in the USA, it is hard to scout the good opportunities,
without becoming second pick (when USA business angels are not interested, the Dutch business angels get an
opportunity)” -RO3.
Respondent 1 mentioned that the UK has really big tax benefits for angel investors, and therefore the
angel investment market in the UK is really big. He believes that “if UK start-ups seek for business angel
investments outside the UK, whilst the market is so big, it might simply be because the start-up is not as
promising”. This fits the opinion of respondent 3, who mentioned to become second pick in international
markets. However, respondent 5 and respondent 7 are investing in the UK and do not agree with this. They found
these investments through their international network, who brought it to their interest.
Respondent 9 invested in start-ups in the Netherlands, but also in the USA, Germany, Jordan and Brazil.
These interesting opportunities were all found through the network of the investor. As mentioned in the previous
section, RO9 is focusing first and foremost on organizations that the angel can help grow globally. Where the
organizations are located is therefore becoming second.
When respondents were asked how they came to these start-ups they invested in, which are sometimes
located on the other side of the world, most respondents said the same thing: through their network. Most
respondents have a passive approach with regards to finding new investment opportunities. All respondents,
except respondent 8, think that the best opportunities and therefore most promising start-ups are brought to
their attention through their network. To have a good network is therefore really important as an angel investor.
Moreover, respondent 1, 6, 7 and 10 are both passive as actively looking for new opportunities. Examples given
by these angel investors are: being part of panels in start-up competitions, actively looking at tech conferences,
listening to pitches and reading through tech magazines and forums.
Respondent 8 found the organization himself, actively. He is also working in the organization now on a
daily basis, so he deviates from the rest of the respondents in his approach to find opportunities. He states that
“if you are not actively looking for opportunities, you will miss the best ones”. Respondent 7 is also actively
searching, because this angel investor believes it is important to look for diversity when possible, and “therefore
you have to take an active approach”.
RO3 and RO9 both state that it is hard to find start-ups in the seed or pre-seed phase, so whilst business
angels can be actively searching for new investment opportunities, these might not be visible. Respondent 3
argued that “is it really hard to be actively looking, because you cannot find them. Of course, I do not know who
is building something secretly in his attic, you need to hear that from someone”. When investing at a later stage,
start-ups can be mentioned as upcoming or promising organizations, and have a bigger chance of being visible
online (RO3, RO9).
Page 48
36
In short, most business angels invest in the Netherlands, and some also invest international, in Europe
or even globally. Business angels are mostly passive in finding new investment opportunities, and get attractive
business investment opportunities through their network.
4.2.6 Criticism and other criteria
Lastly, there is came forward some criticism and other criteria in the interviews. Firstly, there is a low degree of
organization in the Netherlands when it comes to business angel investors. The Business Angel Network
Nederland is a network, but it is not open for individual angels. According to respondent 1, “it is a group of 10
business angel organizations who form a network together”. The Dutch BAN does not host many trainings or help
in this field, which is contrary to some other business angel networks in Europe, for instance the Finnish Business
Angel Network, which is open for all angel investors. They host meetings, training sessions, brain storms and
informal gatherings to share knowledge with each other.
Another criteria is that a lot of angel investors in the Netherlands only invest in a couple of organizations,
instead of in more to create a well-diversified investment portfolio. RO3 states that “it is important to have a
diverse portfolio, so combine low risk investments that have low return with moderate risk investments with a
moderate return and also some high risk investments that can have a high return. You can balance investments
out in your portfolio, as long as you have investments in all categories”. Respondent 6 states that he does not
only seed investments, but also some at a later stage, in order to balance out the risks involved in investing in a
start-up. Moreover, respondent 5 mentions that a well balanced portfolio is created when business angels invest
in organizations with different stages of product development. On the contrary, respondent 4 only invested in
one organization, he does not really have a portfolio, and acknowledges this.
What is also stated as really important is that business angels are really open towards entrepreneurs
and start-ups, since the same is expected from the entrepreneurs. “It is not fair to withhold information, and
eventually it will come out, and then turn out badly” (RO2). It is stated by several respondents that clear guidelines
and expectations should be stated when a business angel invests in a start-up and gets actively involved (RO2,
RO4, RO6, RO10).
Another important issue that came forward is the lack of female involvement in both investment world
as in the entrepreneurial roles, according to Respondent 7. The respondent states that “there is a short in the
market for female leadership roles and female entrepreneurs”, so this angel investor is specifically investing in
start-ups with women with an entrepreneurial mindset, because the investor believes there should be more
inclusion in the investment ecosystem, both for female angel investors as for female entrepreneurs.
Respondent 10 left the business angel market, and is now active as a venture capital investor in a VC
fund. This investor believes “it is easier in VC funds to do investments together with other partners, to create a
bigger portfolio, since more capital is available for due diligence, spreading risks and investing in interesting
opportunities”. This former business angel states that it is really interesting to look at organizations who
previously received business angel funding, since this shows that other investors had faith in the organization,
and a higher success can be expected. The respondent states the following as well: “Start-ups should actively
look for angel investment, as it is promising for the future success of the organization as well” (RO10).
Page 49
37
To conclude, the beforementioned investment criteria are not set in stone, but business angels do have
specific preferences for the organizations before they invest in it. In the next chapter, the results from these
interviews together with the quantitative results are used to check the hypotheses.
4.3 Hypotheses
In this chapter, the results from both the quantitative and the qualitative analysis will be coupled with the
relevant hypothesis, in order to test whether the hypothesis should be accepted or rejected.
4.3.1 Hypothesis 1
The first hypothesis of this study is “If an individual business angel invests in a start-up, the average capital
invested is between 100,000 and 500,000 Euros”. In the univariate analysis of the variable investment size, the
mean of the investments was $2,126,367 (approximately 1.9 million Euros). This is much higher than the
hypothesis assumed. Additionally, the high kurtosis shows the variable distribution is heavy-tailed and the
skewness shows it is rightly skewed. This is confirmed by the median of the investment size, which is much lower
than the mean, with $337,240 (approximately 300,000 Euros). The 75% quartile statistics show that at 75% of
the investments, the investment made by business angels is $1,233,906 (approximately 1.1 million Euros). The
statistics of the variable for investment size indicated that only a few investments made by business angels
contain large amounts of funding, but most investments made by business angels in the Netherlands are smaller.
After the descriptive statistics for the investment size, the independent sample t-test was conducted.
The group statistics showed that the mean investment size from 2017 till September 2021 is 3.2 million USD,
whilst the mean investment size before 2017 is close to 900,000 USD. The standard deviation of the first group
(1.6 million USD) is smaller in comparison to the standard deviation of the second group (3.2 million USD).
The Levene’s Test for Equality of Variances shows that the null hypothesis had to be rejected, indicating
that no equal variances can be assumed for the t-test for equality of means. The significance level of 0.063 is
higher than the 0.05 level of significance set in this research. Consequently, the null hypothesis for the
independent sample t-test is accepted, indicating that there is no significant difference in the mean investment
size of the sample before 2017 and the sample from 2017 till September 2021.
Contemplating the results of the interviews with the respondents, the results from the univariate
analysis are supported. Most respondents invest within the range of this hypothesis on average. However, the
investment range of various respondents is larger than the average, as they occasionally invest larger amounts
in a start-up. Thus, the average capital invested by a business angel is higher than the most investments a
business angel does. Whilst most investments done are within the range of this hypothesis, business angels
sometimes invest significantly larger amounts in order to manage their portfolio risk, thereby influencing the
average investment size.
Concluding, when the results from the qualitative and the quantitative analysis are analysed, Hypothesis
1 has to be rejected. Whilst the mode of the investments made by business angels is within the range of the
hypothesis, the average investment made by business angels is higher, due to large investments done at later
stages in other start-ups.
Page 50
38
4.3.2 Hypothesis 2
The second hypothesis is: “If the investment is done at a later stage, the size of the investment done by the
business angel is larger”. Examining the descriptive statistics of the variables for investment size and investment
timing, some interesting results are shown. As in the previous section discussed, the average investment amount
is 1.2 million USD, but there is a rightly skewed and heavy-tailed distribution. For the timing variable, it is shown
that the most investments are done in the seed phase (72.8%), whilst only 7.5% of the investments is made in
later stage ventures.
A regression analysis was conducted to test the influence of the stage of investment on the size of the
investments done by business angels in the Netherlands. The results showed an adjusted R Square of 0.077,
which is a low score for explaining the variance in investment size by the timing of the investment. The results of
the ANOVA table showed a significant p-value, so a linear regression model is the right fit for testing the influence
of the independent variables on the dependent variable. However, the regression coefficients in Table 21
indicated that most variables did not have a significant p-value. Only investments done in the Series A and Series
E funding rounds have a significant influence on the investment size. It has to be concluded that no meaningful
interpretations can be formed from this regression analysis.
Interview respondents stated that when they made investments in start-ups at a later stage, the amount
was larger. There have been given several explanations for this. The most mentioned explanation is that growth
is costly and consequently, growth at later stages costs more money. Another explanation given is that in
technological start-ups the costs for developing and launching technology are significant. When the start-up
enters a later stage when the technology is launched and should be expanded to the market, a lot of new capital
is needed for this. The last explanation given by the interview respondents is that the risk in later stages is smaller,
because more historical information is available and tangible assets might arise. When the risk is lower, the
respondents are willing to invest more money.
Based on these results, the hypothesis is not rejected. Notwithstanding, the hypothesis cannot be
accepted, because no meaningful interpretations from the regression analysis could be formed. Only two funding
rounds have a significant effect on the investment size. More research would be crucial to support the findings
of the qualitative analysis to see whether the timing of the investment influences the size of the investment.
4.3.3 Hypothesis 3
The third hypothesis is: “If an organization receives equity capital from a business angel, then it is mostly in the
seed phase”. The descriptive statistics of the preferred investment stage of business angels in the Netherlands
indicate that 87.3% of business angels prefer to invest in the seed phase. Considering the investments made in
the sample, 66.3% of all investments were done up to and including the seed phase. Evaluating all the
organizations in the sample, 72.8% of the organizations were in the seed funding stage.
The interview results supported these findings. All business angels that were interviewed for this study
indicated that their investment activities focus mainly on financing start-ups in the pre-seed or seed phase. A few
business angels stated that they do mostly invest in start-ups in the seed phase, but sometimes they invest also
in later-stage ventures, in order to split the risk of their portfolio.
Page 51
39
Summarizing, business angels mostly invest in start-ups in the seed phase. Accordingly, Hypothesis 3 of
this research has to be accepted.
4.3.4 Hypothesis 4
The fourth hypothesis is: “If a start-up receives business angel funding, it is likely to operate in a technical
industry”. The univariate analysis of the industry type variable shows a lot of dispersion in the sample. The most
popular industries are the Business-to-Business Software industry and the Consumer Goods and Services
industry. After this, the Consumer Media industry, the Financial Technology industry and the Healthcare and
Biotechnology industry are most popular. Moreover, all of the start-ups from this data sample have a high focus
on technology and are mostly working on providing technological solutions in these industries.
Supporting the findings of the descriptive statistics, most interviewed business angels prefer
technological industries. Given justifications were: the potential higher reward when the start-up becomes
successful; larger growth potential on international markets; and since more focus shifts to online, more
platforms and technological replacements are invented. However, some business angels that were interviewed
did not have a real preference, as they believe the business principle is similar for each start-up.
The fourth hypothesis of this research is accepted, as most investments of business angels in the
Netherlands are done in technical industries. Additionally, business angels in the Netherlands focus on technical
start-ups in non-technical industries.
4.3.5 Hypothesis 5
The fifth hypothesis is: “The type of industry influences the size of the investment done by the business angel”.
The mean investment size for each industry was compared first. The results showed large differences for the
mean investment size in all industries. The standard deviations of the investment size are really high in all
industries, therefore it could be indicated that the size of the investment might not be influenced by the type of
industry.
Similarly to the first OLS regression, size of the investment is again the dependent variable in this second
regression. The industry variable has been recoded into dummy variables, before the regression could be
conducted. The Adjusted R Square indicated that the predictive power of the industry variable is really low
(0.070). A linear regression is the right model for analysing this data, as the p-value is significant. The coefficients
table of this regression indicate that only the “FinTech” dummy variable (a start-up in the Financial Technology
industry) has a significant influence on investment size. All other variables are not significant, concluding no
meaningful interpretations can be made from this regression analysis, since no relationship could been found
between investment size and type of industry. Only organizations in the Financial technology industry have a
significantly larger investment size.
In the qualitative analysis, industry did not came forward as a reason for the amount invested by the
business angel. Respondents mentioned that the wishes from entrepreneurs and timing effect the investment
size, but industry did not.
Page 52
40
In conclusion, Hypothesis 5 has to be rejected. There has not been found a strong relationship between
the type of industry and the size of the investment done by business angels in the Netherlands in this research.
4.3.6 Hypothesis 6
The sixth hypothesis is: “Business angels invest mostly in a start-up that is geographically close”. The univariate
analysis showed that 51.1% of all investments made by business angels in the Netherlands, are done in the
Netherlands. 70.5% of the business angels in this sample invested in Europe, mostly in neighbouring countries in
the Benelux, Germany, and the United Kingdom. A big outlier in the geographic location variable is that business
angels invested in the USA. 22.1% of the investments from the sample are conducted in the USA.
The results from the interviews indicated a similar investment approach. All interviewed respondents
invested in the Netherlands, but some invested also internationally or even globally. Respondents gave specific
explanations for their investment regions. Cultural and tax regulation differences were the most important
reason for investing nationally or internationally. Three respondents are actively involved in their portfolio
organizations and therefore invest close to home. Multiple respondents specifically state not the invest in the
USA, because of the risk of becoming second pick when not actively managing the USA start-up market.
The sixth hypothesis can be accepted based on the evidence from this research. Business angels invest
mostly in a start-up that is geographically close.
Page 53
41
5. Discussion and limitations
In this chapter, the results from the research will be further discussed. In the subchapters, the results of the
qualitative and quantitative analysis into the preferences of Dutch business angels will be interpreted and
discussed with the support of existing literature. Consequently, some research limitations will be discussed and
future research recommendations will be presented.
5.1 Discussion
This research focuses on investigating the preferences of business angels in the Netherlands for the investment
criteria size, timing, industry, and geography. Market data shows that the relevance of business angel
investments as the main provider of capital to start-ups is growing significantly (EBAN, 2017; OECD, 2016;EBAN,
2020). The research gap existing in business angel literature arises from the invisible nature of this type of capital
market (Harrison & Mason, 2008; Lerner et al., 2018). Prior research is mostly focused on anecdotal or case-
based evidence, hence making it difficult to find empirical confirmation for business angel investment practices
(Bonini et al., 2018; Landström & Mason, 2016).
To investigate the preferences of the business angels, this research heavily relies on the data collected.
Whilst individual business angels are investing solely and not cooperating with networks, the visibility in the
business angel investment market comes mostly from networks and angel syndicates (EBAN, 2020; Mason et al,
2016). The Italian Business Angel Network tried to estimate the total business angel market by using snowball
sampling, but agreed that no true population could be estimated because of the invisibility (Bonini et al., 2018).
In this research, the sample consisted of 190 deals, which is a small part of the actual business angel market in
the Netherlands. The EBAN report (2020) argued that 90% of the business angel market is invisible. Consequently,
using only the data from Cruncbase is not fully reliable and could result in bias.
Evidence in this research showed that the investment range of business angels in the Netherlands is
broad. The average investment made by business angels in this study was over four times larger than the
hypothesis of a range from 100,000 to 500,000 USD. This finding is consistent with that of Denis (2004), who
found that the average size of business angels’ investments tend to be around 50 thousand to 2 million USD. This
finding broadly supports the work of the study from Wong (2002), who reported a mean investment size for
business angel investments of 1 million USD. After the business angel funding round, start-ups in need of more
capital to grow will reach out to venture capital firms or private equity organizations. Venture capital firms and
private equity organizations fund substantially larger investments than business angels (Block et al., 2019; Capizzi
et al., 2019). This study has been unable to significantly demonstrate that investments done at later stage are
larger. It was interesting to study the influence of the timing on the investment size with a regression analysis,
to test whether this sample complements the literature. Whilst the predictive power of the model was low, it
appeared that certain funding rounds do have an influence on the size of the investment. Not all funding rounds
are influencing the investment size. However, there has been anecdotal qualitative evidence in this study that
supports this hypothesis.
Page 54
42
This research has confirmed that the most preferred investment stage of business angels in the
Netherlands is the seed phase. As multiple prior studies indicate, angel investors typically invest “seed capital”
(Fenn et al., 1997; Denis, 2004; Mason and Harrison, 2000; Capizzi, 2015). In contrast to earlier findings, however,
evidence of this research shows that business angel investors do not solely invest in the seed phase of start-ups.
This result may be explained by the fact that business angels invest in some later stage ventures in order to
manage portfolio risk (Mason et al., 2015).
Surprisingly, the sample in this study showed that a lot of business angels do not hold a well-diversified
portfolio. The results of this research are not in line with those of previous studies (Mason et al., 2015; Block et
al., 2019), because most investors only invested in one or a few start-ups. Interview respondents have different
perspectives on this matter, since several respondents actively invest in multiple organizations, but other
business angels invested in only one organization.
Prior studies have reported that the personality and the experience of business angels influences their
investment behaviour (Block et al., 2019; Bonini, 2019). In this study, evidence was found that business angels in
the Netherlands who prefer an industry base this on their previous experience in certain industries. In reviewing
the literature, no data was found on a preference of a business angel for a specific type of industry.
The regression analysis conducted to test the influence of industry on the size of the investments was
valuable, as it showed that most industries had no effect. The insignificant results of all industries except the
Financial Technology industry indicate that these industries do not have an effect on the size of the investment
made by business angels in the Netherlands. However, for Financial Technology the investment sizes are
significantly higher. This industry type does have a significant effect on the size of the investment. It was
important to still research the influence, even though the predictive power of the timing variable was low. After
the analysis, it appeared that there were some funding rounds that had an effect.
As mentioned in the literature review, business angels are mostly investing in start-ups that are
geographically close (Wong,2002; EBAN, 2020). The current study found that business angels in the Netherlands
invest mostly national. All interview respondents stated that they are investing in the Netherlands. This research
also found evidence that business angels are not solely investing geographically close, but also in other regions.
These findings might implicate that business angels nowadays have different methods for monitoring
organizations when they are not geographically close. To develop a full picture of the international investments
and how these are monitored, additional studies will be needed.
There is evidence suggesting that angel-backed companies perform better and have a higher survival
rate than start-ups that are not funded by business angels (Cumming et al., 2019). In this research, several
business angels are active as a partner in a venture capital fund. These respondents stated that when they are
searching for venture capital opportunities, they focus mostly on organizations that previously received business
angel funding. For this reason, entrepreneurs and start-ups should consider the preferences of business angels
and apply for business angel funding. This may be helpful in securing the success of the start-ups in retrieving
capital in later rounds (Van Osnabrugge, 2000; Madill et al., 2015).
Page 55
43
5.2 Limitations
The sample of this research exist of 190 deals, but the time span from 1998-2021 is really broad, since there are
not more publicly available deals to report about in the last years. For a representative quantitative analysis, it
would be better to study a larger data sample. Within this small sample size, it cannot be guaranteed that the
sample is representative for the whole business angel investment industry in the Netherlands. As a result, it
might be possible that the same research with another sample would result in different findings. Reliability
cannot be guaranteed due to the small sample.
Contemplating the qualitative part of this research, ten interviews with business angels is also a small
sample size for this analysis and cannot guarantee representativeness. The small sample size of interview
respondents was chosen, because the qualitative part of this research is focused on supporting the quantitative
study by gaining in-depth knowledge about the research topic through these interviews. Therefore, no large
numbers are necessary per se. To overcome this limitation in future research, a larger sample size of twenty
respondents should be selected so the representativeness of the business angel investment market is better.
Furthermore, interviewer bias might have occurred within the interviews, which implies that an
interviewer can influence the response of the respondents with statements, opinions, tone of voice, and question
order. For example, when the researcher presents certain numbers or solutions, the respondent might then to
falsely agree with this, which can lead to a false representation of the sample because of deviating results. To
minimize the risk of interview bias, it was ensured that the same questions are asked in each interview in the
same sequence. All interviews took part in a similar way, with a short introduction, the main questions and then
some space for additional questions by the respondent. Next to this, the formulated questions allow open
answers from the respondents. However, it remains hard to fully eliminate this bias when conducting interviews.
Moreover, the quantitative data found in this study is limited, because there is only limited metric data
available. It would be interesting for future research to check which start-ups receive financing from business
angels and which start-ups are not promising enough to get invested in by business angels. In this way, research
could be conducted on why these start-ups are most successful. However, in the current study all the investments
that are analysed are already part of the successful selection of start-ups, as they are approved and deemed
interesting by the business angels.
Another limitation of this research is the availability of data on business angel investments, because the
market is invisible. The data found on Crunchbase is helpful, but the true scope of angel investments done in the
Netherlands cannot be estimated or researched. Therefore it is hard to find a fully representative sample of what
the business angel investment market looks like, and what the specific preferences in this market are. Since there
is no obligation to report such investments for angel investments, and there does not exist a national database
for angel investor deals, a clear view of the market cannot be presented at all.
Page 56
44
5.3 Recommendations
The existing literature on preferences in assessment criteria has not focused on business angels specifically, and
not at all on the Netherlands. Therefore, further research is necessary to gain more knowledge on this research
topic. Based on this research, several recommendations for future research are stated.
The first recommendation is to expand this mixed method research to a larger sample within the
Netherlands. With a larger sample size of approximately 1000 investments, preferences of business angels with
regards to the assessment criteria for investments can be further researched to develop a more complete review
of the research topic. To conduct this research in a larger sample, the same research methodology can be used
as in this study. However, more quantitative data would be helpful to estimate the effect of factors like timing
and industry on investment size. Future research can consider to include data from other platforms like Pitchbook
or Dealroom, to get a better grasp on the total angel investment market in the Netherlands. The insights obtained
from other platforms might contribute to a larger sample of deals within the last years, so a more extensive
analysis can be performed to get a higher level of representativeness.
The second recommendation is consistent with the first recommendation, and would be to get a larger
data sample, by collaborating with business angel networks and angel syndicates. These networks consist of
angel groups that also conduct their own research among members. A lot of business angels are not active
individually, but invest together with other business angels in these angel groups or syndicates. Consequently,
the business angel investment market becomes more accessible for investors that do not have extensive
amounts to invest, but do want to support start-ups and entrepreneurs. Business angel networks and angel
syndicates might provide a data sample of business angel investors that you might otherwise not find because
of the not transparent market. It is expected that these groups and syndicates can provide more insights into the
selection process of successful start-ups, which will be useful for future entrepreneurs and start-ups when
searching for angel funding.
A third recommendation would be to do a survey amongst individual business angels in the Netherlands,
and specifically focus on why the angels decide to invest or not invest in a start-up. This might be useful for future
start-ups, in order to be aware of pitfalls they might run into when searching for angel funding. The data that is
collected in a survey can create a more in-depth view of the investment criteria preferences. By conducting a
survey, more insights can be gathered on other important investment criteria, for instance on the management
team or exits.
5.4 Contributions to existing literature
This research has multiple contributions to the existing literature. First, this research extends the literature about
business angel investing, because it provides new insights into preferences of business angels with regards to the
assessment criteria size, timing, industry and geography. The research collected and analysed data from the
Crunchbase financial database and from independent business angels in the Netherlands. The data analyses
explain what the preferences of Dutch business angels are by analysing both qualitative data into average
investment behaviour of business angels, but also clarify this behaviour with help of in-depth information
collected in the interviews.
Page 57
45
From a practical perspective, this research helps future entrepreneurs and start-ups by getting insights
into the investment behaviour and characteristics of Dutch business angels based on recent evidence. This can
help entrepreneurs and start-ups to understand important preferences in assessment criteria and they can use
this information for successfully obtaining capital from business angels in the future. An example of a helpful
insight to entrepreneurs or start-ups is to reach out to business angels that have experience in the same industry
as the start-up. Another example is that entrepreneurs or start-ups can reach out to business angel investors in
the beginning, since sometimes a good idea and team might be enough to be eligible for business angel funding.
Another practical result reported in this research is that business angels in the Netherlands get most of their
successful investment opportunities through their personal network, suggesting that entrepreneurs and start-
ups need to reach out to their networks.
Lastly, researching the topic of business angels’ investment preferences in the Netherlands has been
rarely done. This research explicitly researches the preferences of business angels for the investment criteria
size, timing, industry, and geography in the Netherlands and is therefore a unique example of a new interesting
field of research.
Page 58
46
6. Conclusion
The research objective of this study was to find the preferences of business angels in the Netherlands with
regards to the assessment criteria size, timing, industry, and geography when they invest in start-ups. The
research question belonging to this research objective is: “What are the preferences of business angels in the
Netherlands with regards to the assessment criteria size, timing, industry, and geography?”. After performing an
explanatory mixed method research, an answer to this research question can be concluded.
The findings of this research provide multiple insights for entrepreneurs and start-ups that want to reach
out to business angels in the Netherlands for early-stage equity capital. This study has identified several
preferences of business angels in the Netherlands. One of the more significant findings to emerge from this study
is that business angels in the Netherlands invest mostly in the seed phase of a start-up. The timing of the
investment conducted by business angels in the Netherlands does not significantly influence the size of the
investment, only for some later-stage equity capital investments.
The average amount invested by business angels in the Netherlands is diverse, but mostly depending on
the timing of the investment and the demand of the entrepreneurs. The most investments done are in the range
of 100,000 to 500,000 Euros, but the average amount invested is over four times higher (1.9 million Euros) due
to some larger later-stage investments by business angels in the Netherlands that spread their portfolio risk.
Additionally, this thesis has provided a deeper insight into the industry preferences of business angels
in the Netherlands. Evidence in this study showed that the industry preference of business angels is focused
mostly on their own experience and expertise. Analysing the collected data of this research, the Business-to-
Business Software industry and the Consumer Goods and Services industry are the most popular. The results
indicate several other industries receive significant amounts of funding from business angels in the Netherlands
as well. The type of industry is not influencing the size of the investment made by business angels in the
Netherlands, except for the Financial Technology industry. Investments made in this industry are significantly
larger.
This research has gone some way towards enhancing our understanding of business angel investments
in the Netherlands. Investments made by business angels in the Netherlands are largely geographically close, but
a lot of investors also invest internationally. The focus is mostly on start-ups within Europe, but also investments
in the USA are present.
Page 59
47
7. References
Alemany, L., & Andreoli, J. J. (Eds.). (2018). Entrepreneurial finance: the art and science of growing ventures.
Cambridge University Press.
Ali, S., Berger, M., Botelho, T., Duvy, J. N., Frencia, C., Gluntz, P., ... & Pellens, M. (2017). Understanding the nature
and impact of the business angels in funding research and innovation. ZEW-Gutachten und Forschungsberichte.
Ardichvili, A., Cardozo, R. N., Tune, K., & Reinach, J. (2002). The role angel investors in the assembly of non-
financial resources of new ventures: Conceptual framework and empirical evidence. Journal of Enterprising
Culture, 10(01), 39-65.
Avdeitchikova, S., Landström, H., & Månsson 1, N. (2008). What do we mean when we talk about business angels?
Some reflections on definitions and sampling. Venture Capital, 10(4), 371-394.
Bammens, Y., & Collewaert, V. (2014). Trust between entrepreneurs and angel investors: Exploring positive and
negative implications for venture performance assessments. Journal of Management, 40(7), 1980-2008.
Becker-Blease, J. R., & Sohl, J. E. (2015). New venture legitimacy: the conditions for angel investors. Small
Business Economics, 45(4), 735-749.
Block, J. H., Fisch, C. O., Obschonka, M., & Sandner, P. G. (2019). A personality perspective on business angel
syndication✰. Journal of Banking & Finance, 100, 306-327.
Bonini, S., & Capizzi, V. (2017). The effects of private equity investors on the governance of companies.
In Handbook of Research on Corporate Governance and Entrepreneurship. Edward Elgar Publishing.
Bonini, S., Capizzi, V., Valletta, M., & Zocchi, P. (2018). Angel network affiliation and business angels' investment
practices. Journal of Corporate Finance, 50, 592-608.
Bonini, S., Capizzi, V., & Zocchi, P. (2019). The performance of angel-backed companies. Journal of Banking &
Finance, 100, 328-345.
Bonnet, C., & Wirtz, P. (2012). Raising capital for rapid growth in young technology ventures: when business
angels and venture capitalists coinvest. Venture Capital, 14(2-3), 91-110.
Capizzi, V. (2015). The returns of business angel investments and their major determinants. Venture
Capital, 17(4), 271-298.
Carpenter, R. E., & Petersen, B. C. (2002). Capital market imperfections, high‐tech investment, and new equity
financing. The Economic Journal, 112(477), F54-F72.
Carpentier, C., & Suret, J. M. (2015). Angel group members' decision process and rejection criteria: A longitudinal
analysis. Journal of Business Venturing, 30(6), 808-821.
Chircop, J., Johan, S., & Tarsalewska, M. (2020). Does religiosity influence venture capital investment
decisions?. Journal of Corporate Finance, 62, 101589.
Chua, J. H., & Wu, Z. (2012). Value added by angel investors through post-investment involvement: Empirical
evidence and ownership implications,". Handbook of Entrepreneurial Finance.
Creswell, J. W., & Clark, P. (2019). VL (2007). Designing and conducting mixed methods research. In Thousand
Oaks, CA: Sage IOP Conf. Series: Earth and Environmental Science (Vol. 385, p. 012039).
Page 60
48
Cumming, D., Deloof, M., Manigart, S., & Wright, M. (2019). New directions in entrepreneurial finance. Journal
of Banking & Finance, 100, 252-260.
Cumming, D., & Zhang, M. (2019). Angel investors around the world. Journal of International Business
Studies, 50(5), 692-719.
Dalle, J. M., Den Besten, M., & Menon, C. (2017). Using Crunchbase for economic and managerial research.
Denis, D. J. (2004). Entrepreneurial finance: an overview of the issues and evidence. Journal of corporate
finance, 10(2), 301-326.
Dibrova, A. (2015). Business angel investments: risks and opportunities. Procedia-Social and Behavioral
Sciences, 207, 280-289.
EBAN (2020). Activity Report 2020. Available at: www.eban.org
EBAN, S. C. (2017). European Early Stage Market Statistics. Published in May.
Edelman, L. F., Manolova, T. S., & Brush, C. G. (2017). Angel investing: A literature review. Foundations and
Trends® in Entrepreneurship, 13(4-5), 265-439.
Europe, I. (2016). European private equity activity. Statistics on Fundraising, Investments & Divestments, 15,
2017.
EVCA (2014). EVCA Report 2014. Available at: www.evca.eu
Fenn, G. W., Liang, N., & Prowse, S. (1997). The private equity market: An overveiw. Financial Markets,
Institutions & Instruments, 6(4), 1-106.
Ferrati, F., & Muffatto, M. (2021). Reviewing equity investors’ funding criteria: a comprehensive classification
and research agenda. Venture Capital, 23(2), 157-178.
Fili, A., & Grünberg, J. (2016). Business angel post-investment activities: a multi-level review. Journal of
Management & Governance, 20(1), 89-114.
Freear, J., Sohl, J. E., & Wetzel Jr, W. E. (1994). Angels and non-angels: are there differences?. Journal of Business
venturing, 9(2), 109-123.
Fu, H., Yang, J., & An, Y. (2019). Made for each other: Perfect matching in venture capital markets. Journal of
Banking & Finance, 100, 346-358.
Gilchrist, S., Himmelberg, C. P., & Huberman, G. (2005). Do stock price bubbles influence corporate
investment?. Journal of Monetary Economics, 52(4), 805-827.
Goldfarb, B., Hoberg, D., Kirsch, D., & Triantis, A. (2014). Are Angels Differnt. An Analysis of Early Venture
Financing.
Gregson, G., Mann, S., & Harrison, R. (2013). Business angel syndication and the evolution of risk capital in a small
market economy: evidence from Scotland. Managerial and Decision Economics, 34(2), 95-107.
Hair, J. F., Black, W. C., Babin, B. J., & Anderson, R. E. (2014). Multivariate data analysis: Pearson new international
edition. Essex: Pearson Education Limited, 1(2).
Harrison, R. T., & Mason, C. M. (2008). Sampling and data collection in business angel research. Venture
Capital, 10(4), 305-308.
Henseler, J. (2019). Regression analysis - Technical lecture. Retrieved from https://drive.google.com/file/d/16W-
5hCpAad4AkbS5IAGRHUXWjrayb_BQ/view?usp=sharing
Page 61
49
Hellmann, T., Schure, P., & Vo, D. (2013). Angels and venture capitalists: Complements or substitutes?. NBER
Working Paper.
Hirsch, J., & Walz, U. (2019). The financing dynamics of newly founded firms. Journal of Banking & Finance, 100,
261-272.
Hsu, D. K., Haynie, J. M., Simmons, S. A., & McKelvie, A. (2014). What matters, matters differently: a conjoint
analysis of the decision policies of angel and venture capital investors. Venture Capital, 16(1), 1-25.
Ivankova, N. V., & Creswell, J. W. (2009). Mixed methods. Qualitative research in applied linguistics: A practical
introduction, 23, 135-161.
Jeng, L. A., & Wells, P. C. (2000). The determinants of venture capital funding: evidence across countries. Journal
of corporate Finance, 6(3), 241-289.
Johnson, W. C., & Sohl, J. (2012). Angels and venture capitalists in the initial public offering market. Venture
Capital, 14(1), 27-42.
Kadapakkam, P. R., Kumar, P. C., & Riddick, L. A. (1998). The impact of cash flows and firm size on investment:
The international evidence. Journal of banking & Finance, 22(3), 293-320.
Kerr, W. R., Lerner, J., & Schoar, A. (2014). The consequences of entrepreneurial finance: Evidence from angel
financings. The Review of Financial Studies, 27(1), 20-55.
Kotha, R., & George, G. (2012). Friends, family, or fools: Entrepreneur experience and its implications for equity
distribution and resource mobilization. Journal of business venturing, 27(5), 525-543.
Lahti, T., & Keinonen, H. (2016). Business angel networks: a review and assessment of their value to
entrepreneurship. Handbook of research on business angels.
Landström, H. (1993). Informal risk capital in Sweden and some international comparisons. Journal of Business
Venturing, 8(6), 525-540.
Landström, H. (1998). Informal investors as entrepreneurs: Decision-making criteria used by informal investors
in their assessment of new investment proposals. Technovation, 18(5), 321-333.
Landström, H., & Mason, C. (Eds.). (2016). Handbook of research on business angels. Edward Elgar Publishing.
Landström, H., & Sørheim, R. (2019). The ivory tower of business angel research. Venture Capital, 21(1), 97-119.
Leach, J. C., & Melicher, R. W. (2020). Entrepreneurial finance. Cengage Learning.
Lerner, J., Schoar, A., Sokolinski, S., & Wilson, K. (2018). The globalization of angel investments: Evidence across
countries. Journal of Financial Economics, 127(1), 1-20.
Macht, S. A., & Robinson, J. (2009). Do business angels benefit their investee companies?. International Journal
of Entrepreneurial Behavior & Research.
MacMillan, I. C., Siegel, R., & Narasimha, P. S. (1985). Criteria used by venture capitalists to evaluate new venture
proposals. Journal of Business venturing, 1(1), 119-128.
Madill, J. J., Haines, Jr, G. H., & RIding, A. L. (2005). The role of angels in technology SMEs: A link to venture
capital. Venture Capital, 7(2), 107-129.
Mason, C. (1999). Venture capital: Rationale, aims and scope.
Mason, C. M. (2008). The real venture capitalists: a review of research on business angels. Hunter Center for
Entrepreneurship, 1-55.
Page 62
50
Mason, C. M. (2009). Public policy support for the informal venture capital market in Europe: a critical
review. International small business Journal, 27(5), 536-556.
Mason, C., Harrison, R. T., & Botelho, T. (2015). Business angel exits: strategies and processes. In Research
Handbook on Entrepreneurial Finance. Edward Elgar Publishing.
Mason, C., Botelho, T., & Harrison, R. (2016). The transformation of the business angel market: empirical
evidence and research implications. Venture Capital, 18(4), 321-344.
Mason, C. M., & Harrison, R. T. (2000). The size of the informal venture capital market in the United
Kingdom. Small Business Economics, 15(2), 137-148.
Mason, C., Harrison, R. T., & Botelho, T. (2015). Business angel exits: strategies and processes. In Research
Handbook on Entrepreneurial Finance. Edward Elgar Publishing.
Mitton, T. (2020). Methodological variation in empirical corporate finance. Available at SSRN 3304875.
Nor, N. H. M., Nawawi, A., & Salin, A. S. A. P. (2017). The influence of board independence, board size and
managerial ownership on firm investment efficiency. Pertanika Journal of Social Science and Humanities, 25(3),
1039-1058.
OECD (2016). Business and Finance Outlook OECD Publishing. Available at: www.oecd.org
Osborne, J. W. (2000). Advantages of hierarchical linear modeling. Practical Assessment, Research, and
Evaluation, 7(1), 1.
Paul, S., & Whittam, G. (2010). Business angel syndicates: an exploratory study of gatekeepers. Venture
Capital, 12(3), 241-256.
Politis, D. (2008). Business angels and value added: what do we know and where do we go?. Venture
capital, 10(2), 127-147.
Shorten, A., & Smith, J. (2017). Mixed methods research: expanding the evidence base.
Robb, A. M., & Robinson, D. T. (2014). The capital structure decisions of new firms. The Review of Financial
Studies, 27(1), 153-179.
Sohl, J. E. (1999). The early-stage equity market in the USA. Venture Capital: An international journal of
entrepreneurial finance, 1(2), 101-120.
Strätling, R., Wijbenga, F. H., & Dietz, G. (2012). The impact of contracts on trust in entrepreneur–venture
capitalist relationships. International Small Business Journal, 30(8), 811-831.
Van Osnabrugge, M. (2000). A comparison of business angel and venture capitalist investment procedures: an
agency theory-based analysis. Venture Capital: An international journal of entrepreneurial finance, 2(2), 91-109.
Wong, A. Y. (2002). Angel finance: the other venture capital. Available at SSRN 941228.
Yung, C. (2019). Entrepreneurial manipulation with staged financing. Journal of Banking & Finance, 100, 273-282.
Zacharakis, A., Erikson, T., & George, B. (2010). Conflict between the VC and entrepreneur: the entrepreneur's
perspective. Venture Capital, 12(2), 109-126
Page 63
54
8. Appendices
8.1 Appendix A: Interview questions
Introduction to the topic
The aim of my study is to gain more insights into the preferences of Dutch business angels when investing.
In order to gain more insights into these 4 specific preferences, this interview is conducted.
Thus, I would like to know more about your investment preferences as a business angel.
General information
- How long have you been an angel investor?
- How many angel investments did you do?
- How many organizations are you currently financially involved in?
- How are you involved in these organizations?
- What is your main job title?
- Do you live in the Netherlands?
Size of the investments
- What is the average amount of your business angel investments?
- The average investment size of Dutch BA is €220.000 based on a research by the BAN Netherlands, can
you explain why you are similar/deviating from this?
- Are your investments close to your average investment amount or deviating?
- Do you invest lump sum or in stages?
- On what grounds do you decide to invest a certain amount of money?
- It shows that investments done in later stages are typically larger than in previous stages, did you
experience this yourself?
Timing of the investments
- At what stage do you typically invest in an organization (pre-seed, seed, Series A, etc.)?
- Which milestones need to be met by the organization before you are willing to invest in it?
- Which product development stage are you mostly investing in?
- Most business angel investments in the Netherlands are done in the seed stage, do you think this fits
with your own preferences and why?
Page 64
55
Industry of the start-ups
- Do you specifically invest in organizations in a certain industry? Why?
- Do you have experience in the industry of start-ups you invest in?
- Most investments in the Netherlands are done in the B2B software industry, Fintech and Consumer
goods and services, do you think this fits with your own preferences and why/why not?
Geographic location of the investments
- Where is the start-up located that you have invested in? Is this mostly regional, national, international,
global?
- How did you find this entrepreneur or start-up?
- Why do you invest in a certain area? Or why do you not have a preference?
- In my research it shows that 50% of all Dutch business angels invest in start-ups that are located in the
Netherlands, and 70% of all start-ups are in Europe. Can you recognize yourself in these findings or do
you feel different towards this and why? And 20% in the USA?
Criticism and other criteria
- What do you think is the most important criteria for investing in a start-up?
- Do you have any criticism on the business angel market?
Adjustments
- Is there something you would like to add?
- Are you interested in the results of my research?