arXiv:astro-ph/0508107v2 31 Oct 2005 Astronomy & Astrophysics manuscript no. kapferer˙hydro February 5, 2008 (DOI: will be inserted by hand later) Simulations of galactic winds and starbursts in galaxy clusters W. Kapferer 1 , C. Ferrari 1 , W. Domainko 1 , M. Mair 1 , T. Kronberger 1,2 , S. Schindler 1 , S. Kimeswenger 1 , E. van Kampen 1 , D. Breitschwerdt 3 & M. Ruffert 4 1 Institut f¨ ur Astrophysik, Leopold-Franzens-Universit¨at Innsbruck, Technikerstr. 25, A-6020 Innsbruck, Austria 2 Institut f¨ ur Astrophysik, Universit¨at G¨ottingen, Friedrich-Hund-Platz 1, D-37077 G¨ottingen, Germany 3 Institut f¨ ur Astronomie, T¨ urkenschanzstrasse 17, A-1180 Wien, Austria 4 School of Mathematics, University of Edinburgh, Edinburgh EH9 3JZ, Scotland, UK -/- Abstract. We present an investigation of the metal enrichment of the intra-cluster medium (ICM) by galactic winds and merger-driven starbursts. We use combined N-body/hydrodynamic simulations with a semi-numerical galaxy formation model. The mass loss by galactic winds is obtained by calculating transonic solutions of steady state outflows, driven by thermal, cosmic ray and MHD wave pressure. The inhomogeneities in the metal distribution caused by these processes are an ideal tool to reveal the dynamical state of a galaxy cluster. We present surface brightness, X-ray emission weighted temperature and metal maps of our model clusters as they would be observed by X-ray telescopes like XMM-Newton. We show that X-ray weighted metal maps distinguish between pre- or post-merger galaxy clusters by comparing the metallicity distribution with the galaxy-density distribution: pre- mergers have a metallicity gap between the subclusters, post-mergers a high metallicity between subclusters. We apply our approach to two observed galaxy clusters, Abell 3528 and Abell 3921, to show whether they are pre- or post-merging systems. The survival time of the inhomogeneities in the metallicity distribution found in our simulations is up to several Gyr. We show that galactic winds and merger-driven starbursts enrich the ICM very efficiently after z=1 in the central (∼ 3 Mpc radius) region of a galaxy cluster. Key words. Galaxies: clusters: general - Galaxies: abundances - Galaxies: interactions - Galaxies: ISM - X-ray: galaxies: clusters 1. Introduction Modern X-ray observations of galaxy clusters show clearly a non-uniform, non-spherical distribution of metals in the ICM (e.g. Schmidt et al. 2002; Furusho et al. 2003; Sanders et al. 2004; Fukazawa et al. 2004; Hayakawa et al. 2004). As heavy elements are only produced in stars the pro- cessed material must have been ejected into the intra- cluster medium (ICM) by cluster galaxies. The first sug- gested transfer-processes were galactic winds (De Young 1978) and ram-pressure stripping (Gunn & Gott 1972). Other processes like kinetic mass redistribution due to galaxy-galaxy interactions (Kapferer et al. 2005; Gnedin 1998), intra-cluster supernovae (Domainko et al. 2004) or jets of AGNs are the latest suggestions for enriching the ICM. In order to distinguish between the efficiency of the enrichment processes several approaches for simulations were carried out. De Lucia et al. (2004) used combined N-body and semi-analytical techniques to model the in- tergalactic and intracluster chemical enrichment due to Send offprint requests to : W. Kapferer, e-mail: [email protected]galactic winds. Another approach are Tree+SPH simula- tions of galaxy clusters (Tornatore et al. 2004) including galactic winds. Gnedin (1998) did combined softened la- grangian hydrodynamic (SLH) particle-particle/particle- mesh (P 3 M) simulations to investigate the contribution of galaxy-interactions on the enrichment of the ICM. A com- parison of the efficiency between ram-pressure stripping and quiet galactic winds was recently done by Schindler et al. (2005). Multiwavelength and spectroscopic observations of galaxy clusters help us to reveal the dynamical and evolutionary state of the system (Ferrari et al. 2005, Belsole et al. 2005). If there is no spectroscopic information for cluster galax- ies available, questions on substructures in galaxy clusters and their dynamical state are almost impossible to ad- dress. In this paper we show the possibilities of state of the art and planned future X-ray observations to obtain information about the dynamical state of a galaxy clus- ter. We model galactic winds and starbursts due to galaxy mergers as enrichment processes of the ICM. The result- ing X-ray surface brightness, temperature and metal maps
Transcript
arX
iv:a
stro
-ph/
0508
107v
2 3
1 O
ct 2
005
Astronomy & Astrophysics manuscript no. kapferer˙hydro February 5, 2008(DOI: will be inserted by hand later)
Simulations of galactic winds and starbursts in galaxy clusters
W. Kapferer1, C. Ferrari1, W. Domainko1, M. Mair1, T. Kronberger1,2, S. Schindler1, S. Kimeswenger1, E.van Kampen1, D. Breitschwerdt3 & M. Ruffert4
1Institut fur Astrophysik, Leopold-Franzens-Universitat Innsbruck, Technikerstr. 25, A-6020 Innsbruck, Austria2Institut fur Astrophysik, Universitat Gottingen, Friedrich-Hund-Platz 1, D-37077 Gottingen, Germany3Institut fur Astronomie, Turkenschanzstrasse 17, A-1180 Wien, Austria4School of Mathematics, University of Edinburgh, Edinburgh EH9 3JZ, Scotland, UK
-/-
Abstract. We present an investigation of the metal enrichment of the intra-cluster medium (ICM) by galactic windsand merger-driven starbursts. We use combined N-body/hydrodynamic simulations with a semi-numerical galaxyformation model. The mass loss by galactic winds is obtained by calculating transonic solutions of steady stateoutflows, driven by thermal, cosmic ray and MHD wave pressure. The inhomogeneities in the metal distributioncaused by these processes are an ideal tool to reveal the dynamical state of a galaxy cluster. We present surfacebrightness, X-ray emission weighted temperature and metal maps of our model clusters as they would be observedby X-ray telescopes like XMM-Newton. We show that X-ray weighted metal maps distinguish between pre- orpost-merger galaxy clusters by comparing the metallicity distribution with the galaxy-density distribution: pre-mergers have a metallicity gap between the subclusters, post-mergers a high metallicity between subclusters. Weapply our approach to two observed galaxy clusters, Abell 3528 and Abell 3921, to show whether they are pre-or post-merging systems. The survival time of the inhomogeneities in the metallicity distribution found in oursimulations is up to several Gyr. We show that galactic winds and merger-driven starbursts enrich the ICM veryefficiently after z=1 in the central (∼ 3 Mpc radius) region of a galaxy cluster.
Key words. Galaxies: clusters: general - Galaxies: abundances - Galaxies: interactions - Galaxies: ISM - X-ray:galaxies: clusters
1. Introduction
Modern X-ray observations of galaxy clusters show clearlya non-uniform, non-spherical distribution of metals in theICM (e.g. Schmidt et al. 2002; Furusho et al. 2003; Sanderset al. 2004; Fukazawa et al. 2004; Hayakawa et al. 2004).As heavy elements are only produced in stars the pro-cessed material must have been ejected into the intra-cluster medium (ICM) by cluster galaxies. The first sug-gested transfer-processes were galactic winds (De Young1978) and ram-pressure stripping (Gunn & Gott 1972).Other processes like kinetic mass redistribution due togalaxy-galaxy interactions (Kapferer et al. 2005; Gnedin1998), intra-cluster supernovae (Domainko et al. 2004) orjets of AGNs are the latest suggestions for enriching theICM. In order to distinguish between the efficiency of theenrichment processes several approaches for simulationswere carried out. De Lucia et al. (2004) used combinedN-body and semi-analytical techniques to model the in-tergalactic and intracluster chemical enrichment due to
galactic winds. Another approach are Tree+SPH simula-tions of galaxy clusters (Tornatore et al. 2004) includinggalactic winds. Gnedin (1998) did combined softened la-grangian hydrodynamic (SLH) particle-particle/particle-mesh (P3M) simulations to investigate the contribution ofgalaxy-interactions on the enrichment of the ICM. A com-parison of the efficiency between ram-pressure strippingand quiet galactic winds was recently done by Schindleret al. (2005).Multiwavelength and spectroscopic observations of galaxyclusters help us to reveal the dynamical and evolutionarystate of the system (Ferrari et al. 2005, Belsole et al. 2005).If there is no spectroscopic information for cluster galax-ies available, questions on substructures in galaxy clustersand their dynamical state are almost impossible to ad-dress. In this paper we show the possibilities of state ofthe art and planned future X-ray observations to obtaininformation about the dynamical state of a galaxy clus-ter. We model galactic winds and starbursts due to galaxymergers as enrichment processes of the ICM. The result-ing X-ray surface brightness, temperature and metal maps
2 W. Kapferer et al.: Galactic winds and starbursts in simulated galaxy clusters
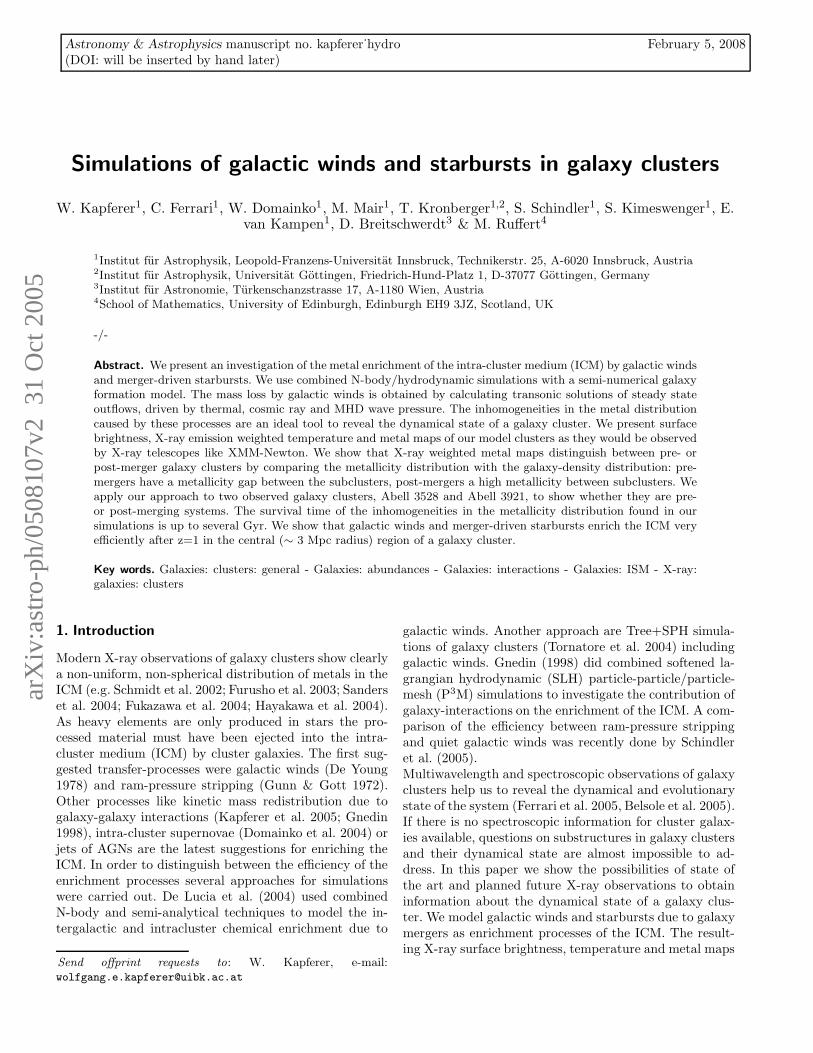
Fig. 1. Sketch of our computational scheme.
provide the key to understand the dynamics of mergingand relaxed galaxy clusters.
2. Simulations
2.1. Numerical methods
We use different code modules to calculate each of thecluster components appropriately. Figure 1 gives a shortoverview of our involved techniques to simulate the severalcomponents of a galaxy cluster.The non-baryonic component is calculated using an N-body tree code (Barnes & Hutt 1986) with constrainedrandom fields as initial conditions (Hoffman & Ribak1991), implemented by van de Weygaert & Bertschinger(1996). The N-body tree code provides the underlying evo-lution of the dark matter (DM) potential for the hydro-dynamic code and the orbits of the model cluster galax-ies. The properties of the galaxies are calculated by animproved version of the galaxy formation code of vanKampen et al. (1999). The adopted ΛCDM cosmology ischaracterized by ΩΛ=0.7, Ωm=0.3, σ8=0.93 and h=0.7.The mass resolution of our N-body simulation is in theorder of 1.5× 10¹⁰ M⊙ for all three model clusters with agravitational softening of 14 h−1 kpc. The improvementsto the galaxy formation model of van Kampen et al. (1999)mainly concern the star formation modes, which are a mix-ture of bursting and quiescent star formation. Most of therecent star formation is occurring in disks, following theSchmidt law with a threshold according to the Kennicuttcriterion, and most of the high-redshift star formationis resulting from merger-driven starbursts. The chemicalevolution of stars and both the hot and cold componentsare traced, where metals are assumed to be exchanged be-tween these components due to cooling, star formation,
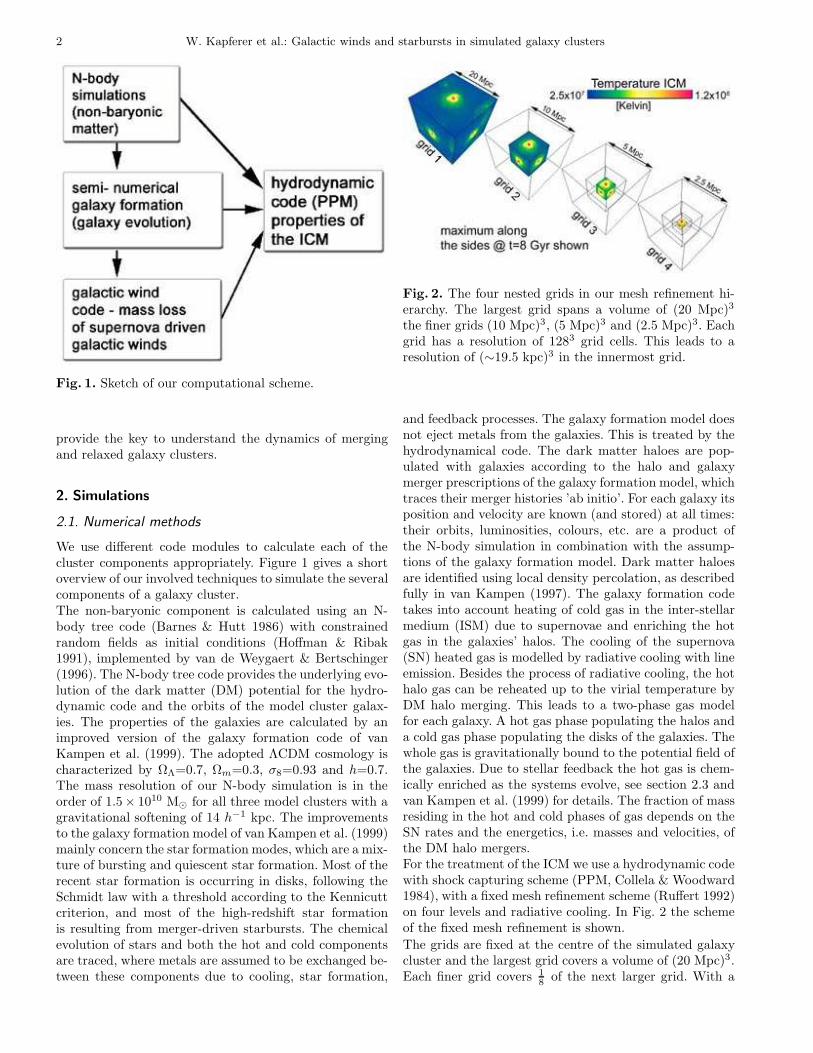
Fig. 2. The four nested grids in our mesh refinement hi-erarchy. The largest grid spans a volume of (20 Mpc)3
the finer grids (10 Mpc)3, (5 Mpc)3 and (2.5 Mpc)3. Eachgrid has a resolution of 1283 grid cells. This leads to aresolution of (∼19.5 kpc)3 in the innermost grid.
and feedback processes. The galaxy formation model doesnot eject metals from the galaxies. This is treated by thehydrodynamical code. The dark matter haloes are pop-ulated with galaxies according to the halo and galaxymerger prescriptions of the galaxy formation model, whichtraces their merger histories ’ab initio’. For each galaxy itsposition and velocity are known (and stored) at all times:their orbits, luminosities, colours, etc. are a product ofthe N-body simulation in combination with the assump-tions of the galaxy formation model. Dark matter haloesare identified using local density percolation, as describedfully in van Kampen (1997). The galaxy formation codetakes into account heating of cold gas in the inter-stellarmedium (ISM) due to supernovae and enriching the hotgas in the galaxies’ halos. The cooling of the supernova(SN) heated gas is modelled by radiative cooling with lineemission. Besides the process of radiative cooling, the hothalo gas can be reheated up to the virial temperature byDM halo merging. This leads to a two-phase gas modelfor each galaxy. A hot gas phase populating the halos anda cold gas phase populating the disks of the galaxies. Thewhole gas is gravitationally bound to the potential field ofthe galaxies. Due to stellar feedback the hot gas is chem-ically enriched as the systems evolve, see section 2.3 andvan Kampen et al. (1999) for details. The fraction of massresiding in the hot and cold phases of gas depends on theSN rates and the energetics, i.e. masses and velocities, ofthe DM halo mergers.For the treatment of the ICM we use a hydrodynamic codewith shock capturing scheme (PPM, Collela & Woodward1984), with a fixed mesh refinement scheme (Ruffert 1992)on four levels and radiative cooling. In Fig. 2 the schemeof the fixed mesh refinement is shown.
The grids are fixed at the centre of the simulated galaxycluster and the largest grid covers a volume of (20 Mpc)3.Each finer grid covers 1
8of the next larger grid. With a
W. Kapferer et al.: Galactic winds and starbursts in simulated galaxy clusters 3
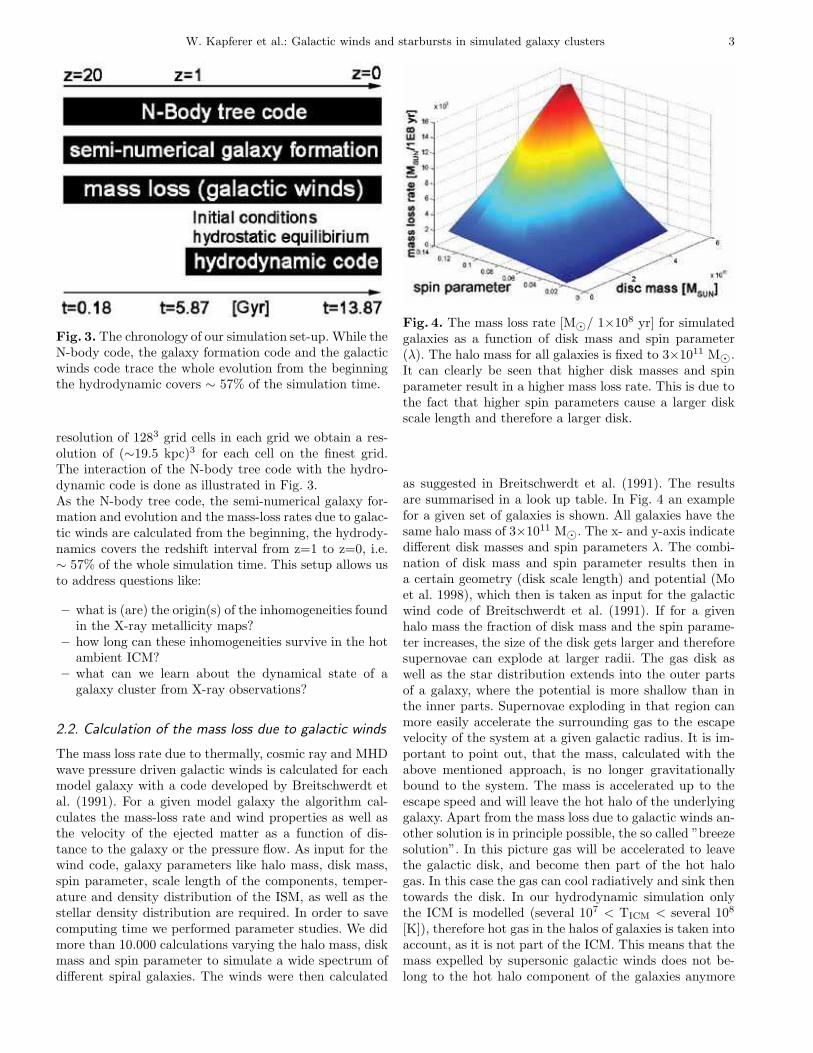
Fig. 3. The chronology of our simulation set-up. While theN-body code, the galaxy formation code and the galacticwinds code trace the whole evolution from the beginningthe hydrodynamic covers ∼ 57% of the simulation time.
resolution of 1283 grid cells in each grid we obtain a res-olution of (∼19.5 kpc)3 for each cell on the finest grid.The interaction of the N-body tree code with the hydro-dynamic code is done as illustrated in Fig. 3.As the N-body tree code, the semi-numerical galaxy for-mation and evolution and the mass-loss rates due to galac-tic winds are calculated from the beginning, the hydrody-namics covers the redshift interval from z=1 to z=0, i.e.∼ 57% of the whole simulation time. This setup allows usto address questions like:
– what is (are) the origin(s) of the inhomogeneities foundin the X-ray metallicity maps?
– how long can these inhomogeneities survive in the hotambient ICM?
– what can we learn about the dynamical state of agalaxy cluster from X-ray observations?
2.2. Calculation of the mass loss due to galactic winds
The mass loss rate due to thermally, cosmic ray and MHDwave pressure driven galactic winds is calculated for eachmodel galaxy with a code developed by Breitschwerdt etal. (1991). For a given model galaxy the algorithm cal-culates the mass-loss rate and wind properties as well asthe velocity of the ejected matter as a function of dis-tance to the galaxy or the pressure flow. As input for thewind code, galaxy parameters like halo mass, disk mass,spin parameter, scale length of the components, temper-ature and density distribution of the ISM, as well as thestellar density distribution are required. In order to savecomputing time we performed parameter studies. We didmore than 10.000 calculations varying the halo mass, diskmass and spin parameter to simulate a wide spectrum ofdifferent spiral galaxies. The winds were then calculated
Fig. 4. The mass loss rate [M⊙/ 1×10⁸ yr] for simulatedgalaxies as a function of disk mass and spin parameter(λ). The halo mass for all galaxies is fixed to 3×10¹¹ M⊙.It can clearly be seen that higher disk masses and spinparameter result in a higher mass loss rate. This is due tothe fact that higher spin parameters cause a larger diskscale length and therefore a larger disk.
as suggested in Breitschwerdt et al. (1991). The resultsare summarised in a look up table. In Fig. 4 an examplefor a given set of galaxies is shown. All galaxies have thesame halo mass of 3×10¹¹ M⊙. The x- and y-axis indicatedifferent disk masses and spin parameters λ. The combi-nation of disk mass and spin parameter results then ina certain geometry (disk scale length) and potential (Moet al. 1998), which then is taken as input for the galacticwind code of Breitschwerdt et al. (1991). If for a givenhalo mass the fraction of disk mass and the spin parame-ter increases, the size of the disk gets larger and thereforesupernovae can explode at larger radii. The gas disk aswell as the star distribution extends into the outer partsof a galaxy, where the potential is more shallow than inthe inner parts. Supernovae exploding in that region canmore easily accelerate the surrounding gas to the escapevelocity of the system at a given galactic radius. It is im-portant to point out, that the mass, calculated with theabove mentioned approach, is no longer gravitationallybound to the system. The mass is accelerated up to theescape speed and will leave the hot halo of the underlyinggalaxy. Apart from the mass loss due to galactic winds an-other solution is in principle possible, the so called ”breezesolution”. In this picture gas will be accelerated to leavethe galactic disk, and become then part of the hot halogas. In this case the gas can cool radiatively and sink thentowards the disk. In our hydrodynamic simulation onlythe ICM is modelled (several 107 < TICM < several 108
[K]), therefore hot gas in the halos of galaxies is taken intoaccount, as it is not part of the ICM. This means that themass expelled by supersonic galactic winds does not be-long to the hot halo component of the galaxies anymore
4 W. Kapferer et al.: Galactic winds and starbursts in simulated galaxy clusters
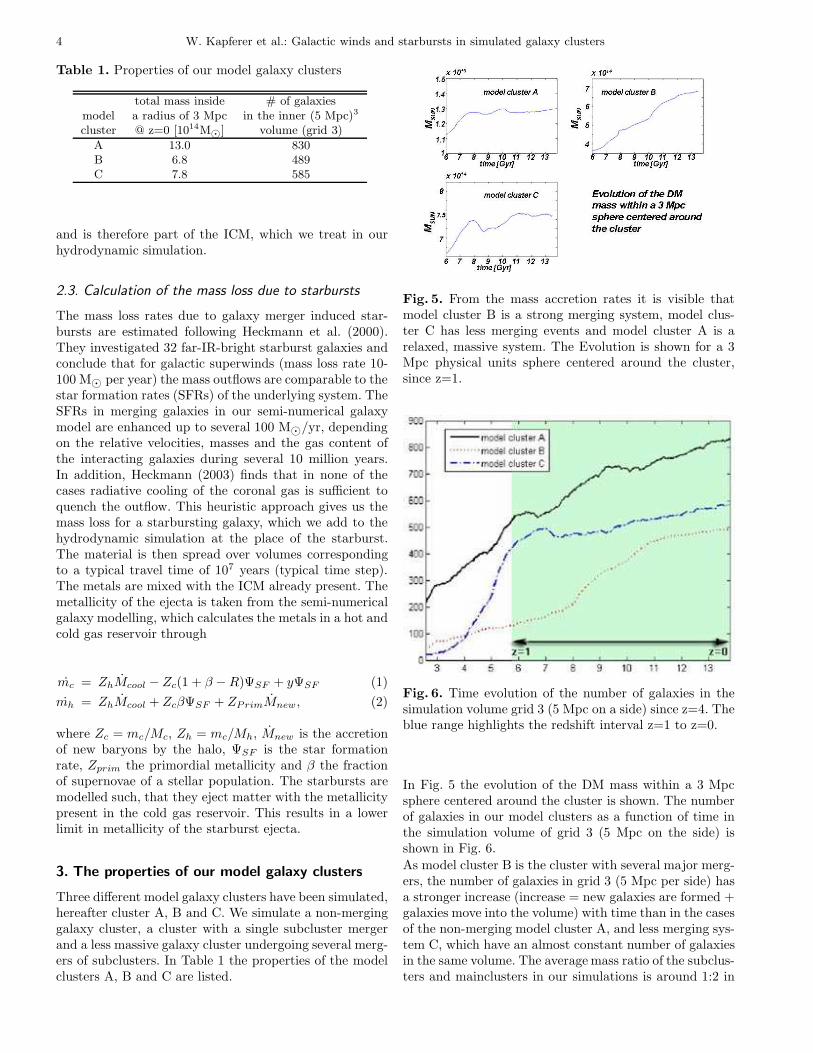
Table 1. Properties of our model galaxy clusters
total mass inside # of galaxiesmodel a radius of 3 Mpc in the inner (5 Mpc)3
cluster @ z=0 [1014M⊙] volume (grid 3)
A 13.0 830B 6.8 489C 7.8 585
and is therefore part of the ICM, which we treat in ourhydrodynamic simulation.
2.3. Calculation of the mass loss due to starbursts
The mass loss rates due to galaxy merger induced star-bursts are estimated following Heckmann et al. (2000).They investigated 32 far-IR-bright starburst galaxies andconclude that for galactic superwinds (mass loss rate 10-100 M⊙ per year) the mass outflows are comparable to thestar formation rates (SFRs) of the underlying system. TheSFRs in merging galaxies in our semi-numerical galaxymodel are enhanced up to several 100 M⊙/yr, dependingon the relative velocities, masses and the gas content ofthe interacting galaxies during several 10 million years.In addition, Heckmann (2003) finds that in none of thecases radiative cooling of the coronal gas is sufficient toquench the outflow. This heuristic approach gives us themass loss for a starbursting galaxy, which we add to thehydrodynamic simulation at the place of the starburst.The material is then spread over volumes correspondingto a typical travel time of 107 years (typical time step).The metals are mixed with the ICM already present. Themetallicity of the ejecta is taken from the semi-numericalgalaxy modelling, which calculates the metals in a hot andcold gas reservoir through
mc = ZhMcool − Zc(1 + β − R)ΨSF + yΨSF (1)
mh = ZhMcool + ZcβΨSF + ZPrimMnew, (2)
where Zc = mc/Mc, Zh = mc/Mh, Mnew is the accretionof new baryons by the halo, ΨSF is the star formationrate, Zprim the primordial metallicity and β the fractionof supernovae of a stellar population. The starbursts aremodelled such, that they eject matter with the metallicitypresent in the cold gas reservoir. This results in a lowerlimit in metallicity of the starburst ejecta.
3. The properties of our model galaxy clusters
Three different model galaxy clusters have been simulated,hereafter cluster A, B and C. We simulate a non-merginggalaxy cluster, a cluster with a single subcluster mergerand a less massive galaxy cluster undergoing several merg-ers of subclusters. In Table 1 the properties of the modelclusters A, B and C are listed.
Fig. 5. From the mass accretion rates it is visible thatmodel cluster B is a strong merging system, model clus-ter C has less merging events and model cluster A is arelaxed, massive system. The Evolution is shown for a 3Mpc physical units sphere centered around the cluster,since z=1.
Fig. 6. Time evolution of the number of galaxies in thesimulation volume grid 3 (5 Mpc on a side) since z=4. Theblue range highlights the redshift interval z=1 to z=0.
In Fig. 5 the evolution of the DM mass within a 3 Mpcsphere centered around the cluster is shown. The numberof galaxies in our model clusters as a function of time inthe simulation volume of grid 3 (5 Mpc on the side) isshown in Fig. 6.
As model cluster B is the cluster with several major merg-ers, the number of galaxies in grid 3 (5 Mpc per side) hasa stronger increase (increase = new galaxies are formed +galaxies move into the volume) with time than in the casesof the non-merging model cluster A, and less merging sys-tem C, which have an almost constant number of galaxiesin the same volume. The average mass ratio of the subclus-ters and mainclusters in our simulations is around 1:2 in
W. Kapferer et al.: Galactic winds and starbursts in simulated galaxy clusters 5
6 7 8 9 10 11 12 130
100
200
300
400
500
600
700
800
900
1000
time [Gyr]
mea
n ve
loci
ty [k
m/s
]
model cluster Amodel cluster Bmodel cluster C
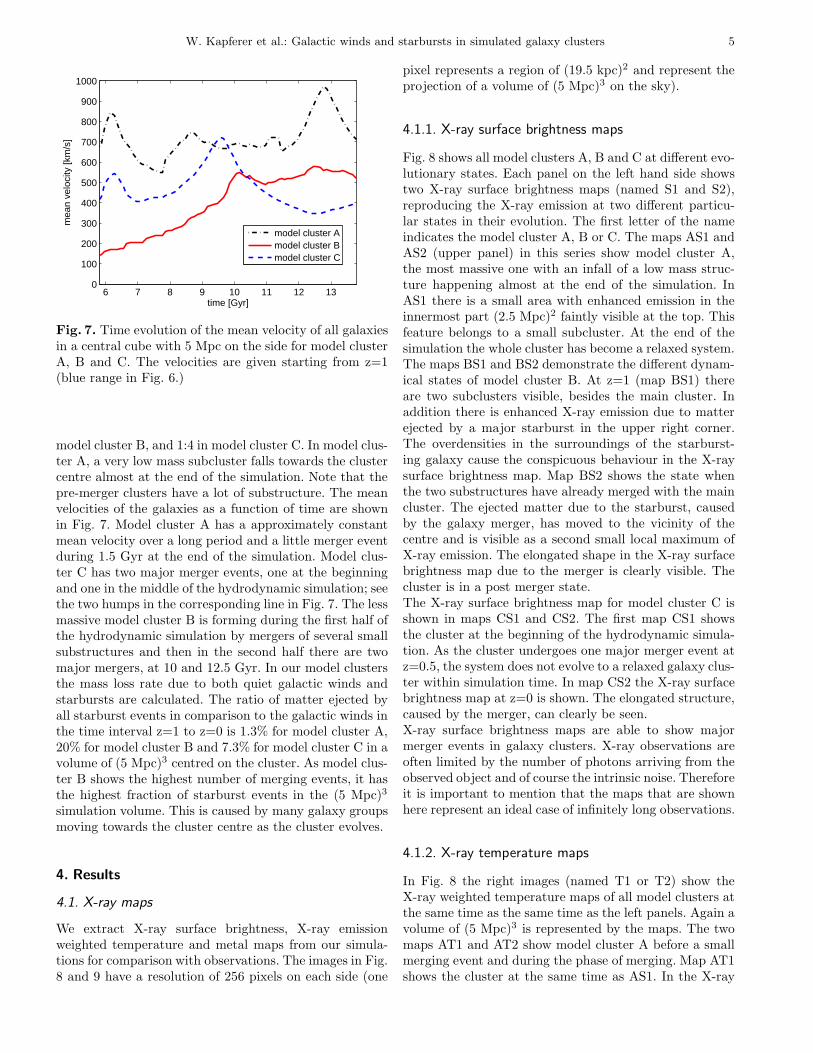
Fig. 7. Time evolution of the mean velocity of all galaxiesin a central cube with 5 Mpc on the side for model clusterA, B and C. The velocities are given starting from z=1(blue range in Fig. 6.)
model cluster B, and 1:4 in model cluster C. In model clus-ter A, a very low mass subcluster falls towards the clustercentre almost at the end of the simulation. Note that thepre-merger clusters have a lot of substructure. The meanvelocities of the galaxies as a function of time are shownin Fig. 7. Model cluster A has a approximately constantmean velocity over a long period and a little merger eventduring 1.5 Gyr at the end of the simulation. Model clus-ter C has two major merger events, one at the beginningand one in the middle of the hydrodynamic simulation; seethe two humps in the corresponding line in Fig. 7. The lessmassive model cluster B is forming during the first half ofthe hydrodynamic simulation by mergers of several smallsubstructures and then in the second half there are twomajor mergers, at 10 and 12.5 Gyr. In our model clustersthe mass loss rate due to both quiet galactic winds andstarbursts are calculated. The ratio of matter ejected byall starburst events in comparison to the galactic winds inthe time interval z=1 to z=0 is 1.3% for model cluster A,20% for model cluster B and 7.3% for model cluster C in avolume of (5 Mpc)3 centred on the cluster. As model clus-ter B shows the highest number of merging events, it hasthe highest fraction of starburst events in the (5 Mpc)3
simulation volume. This is caused by many galaxy groupsmoving towards the cluster centre as the cluster evolves.
4. Results
4.1. X-ray maps
We extract X-ray surface brightness, X-ray emissionweighted temperature and metal maps from our simula-tions for comparison with observations. The images in Fig.8 and 9 have a resolution of 256 pixels on each side (one
pixel represents a region of (19.5 kpc)2 and represent theprojection of a volume of (5 Mpc)3 on the sky).
4.1.1. X-ray surface brightness maps
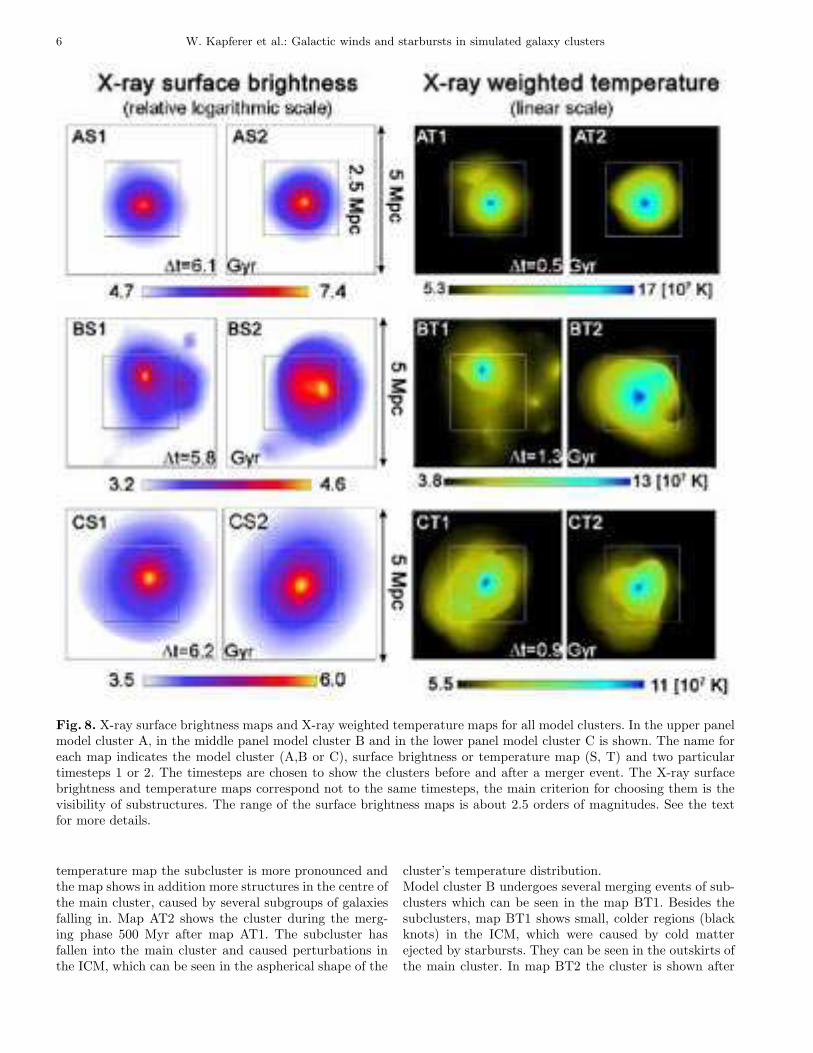
Fig. 8 shows all model clusters A, B and C at different evo-lutionary states. Each panel on the left hand side showstwo X-ray surface brightness maps (named S1 and S2),reproducing the X-ray emission at two different particu-lar states in their evolution. The first letter of the nameindicates the model cluster A, B or C. The maps AS1 andAS2 (upper panel) in this series show model cluster A,the most massive one with an infall of a low mass struc-ture happening almost at the end of the simulation. InAS1 there is a small area with enhanced emission in theinnermost part (2.5 Mpc)2 faintly visible at the top. Thisfeature belongs to a small subcluster. At the end of thesimulation the whole cluster has become a relaxed system.The maps BS1 and BS2 demonstrate the different dynam-ical states of model cluster B. At z=1 (map BS1) thereare two subclusters visible, besides the main cluster. Inaddition there is enhanced X-ray emission due to matterejected by a major starburst in the upper right corner.The overdensities in the surroundings of the starburst-ing galaxy cause the conspicuous behaviour in the X-raysurface brightness map. Map BS2 shows the state whenthe two substructures have already merged with the maincluster. The ejected matter due to the starburst, causedby the galaxy merger, has moved to the vicinity of thecentre and is visible as a second small local maximum ofX-ray emission. The elongated shape in the X-ray surfacebrightness map due to the merger is clearly visible. Thecluster is in a post merger state.The X-ray surface brightness map for model cluster C isshown in maps CS1 and CS2. The first map CS1 showsthe cluster at the beginning of the hydrodynamic simula-tion. As the cluster undergoes one major merger event atz=0.5, the system does not evolve to a relaxed galaxy clus-ter within simulation time. In map CS2 the X-ray surfacebrightness map at z=0 is shown. The elongated structure,caused by the merger, can clearly be seen.X-ray surface brightness maps are able to show majormerger events in galaxy clusters. X-ray observations areoften limited by the number of photons arriving from theobserved object and of course the intrinsic noise. Thereforeit is important to mention that the maps that are shownhere represent an ideal case of infinitely long observations.
4.1.2. X-ray temperature maps
In Fig. 8 the right images (named T1 or T2) show theX-ray weighted temperature maps of all model clusters atthe same time as the same time as the left panels. Again avolume of (5 Mpc)3 is represented by the maps. The twomaps AT1 and AT2 show model cluster A before a smallmerging event and during the phase of merging. Map AT1shows the cluster at the same time as AS1. In the X-ray
6 W. Kapferer et al.: Galactic winds and starbursts in simulated galaxy clusters
Fig. 8. X-ray surface brightness maps and X-ray weighted temperature maps for all model clusters. In the upper panelmodel cluster A, in the middle panel model cluster B and in the lower panel model cluster C is shown. The name foreach map indicates the model cluster (A,B or C), surface brightness or temperature map (S, T) and two particulartimesteps 1 or 2. The timesteps are chosen to show the clusters before and after a merger event. The X-ray surfacebrightness and temperature maps correspond not to the same timesteps, the main criterion for choosing them is thevisibility of substructures. The range of the surface brightness maps is about 2.5 orders of magnitudes. See the textfor more details.
temperature map the subcluster is more pronounced andthe map shows in addition more structures in the centre ofthe main cluster, caused by several subgroups of galaxiesfalling in. Map AT2 shows the cluster during the merg-ing phase 500 Myr after map AT1. The subcluster hasfallen into the main cluster and caused perturbations inthe ICM, which can be seen in the aspherical shape of the
cluster’s temperature distribution.Model cluster B undergoes several merging events of sub-clusters which can be seen in the map BT1. Besides thesubclusters, map BT1 shows small, colder regions (blackknots) in the ICM, which were caused by cold matterejected by starbursts. They can be seen in the outskirts ofthe main cluster. In map BT2 the cluster is shown after
W. Kapferer et al.: Galactic winds and starbursts in simulated galaxy clusters 7
1.3 Gyr of evolution. The subclusters have merged withthe main cluster and strong shocks in the ICM emerge,which are visible near the upper border of the indicated(2.5 Mpc)2 region. In the right upper corner of the (2.5Mpc)2 cube a cold feature is visible. This feature be-longs to ejected matter by a merger-driven starburst. Theejected matter has several 106 K and is therefore visible ascold inclusions in the ICM. The temperature of the ICMin the region of the starburst is calculated as a mixtureof hot ICM with a given density and the ejecta of thestarburst, which are assumed to have temperatures in theorder of several 106 K. As starbursts can transport a ma-jor amount of matter into the ICM, the density increasesand therefore the regions are visible in X-ray maps, seeFig. 8 - BS1.The last model cluster C has a major merger event, asis clearly visible in the X-ray weighted temperature map.Map CT1 shows the subcluster and in addition cold ma-terial on the opposite side of the main cluster, which be-longs to ejected matter from a starburst. In the centre ofthe main cluster there are several outward moving shocksshowing up as hotter shell-like regions, which were causedby several very small subcluster mergers. In map CT2 thesubcluster has merged with the main cluster (900 Myrlater).X-ray weighted temperature maps are better suited toinvestigate the dynamical state of a galaxy cluster thanthe X-ray surface brightness maps. If enough photons areavailable in the X-ray observations, combination of bothgives the best tool for investigating galaxy clusters in X-rays. The observed X-ray temperature maps of galaxycluster have a limited spatial resolution, because the num-bers of photons in real observations is limited.
4.1.3. X-ray metal maps
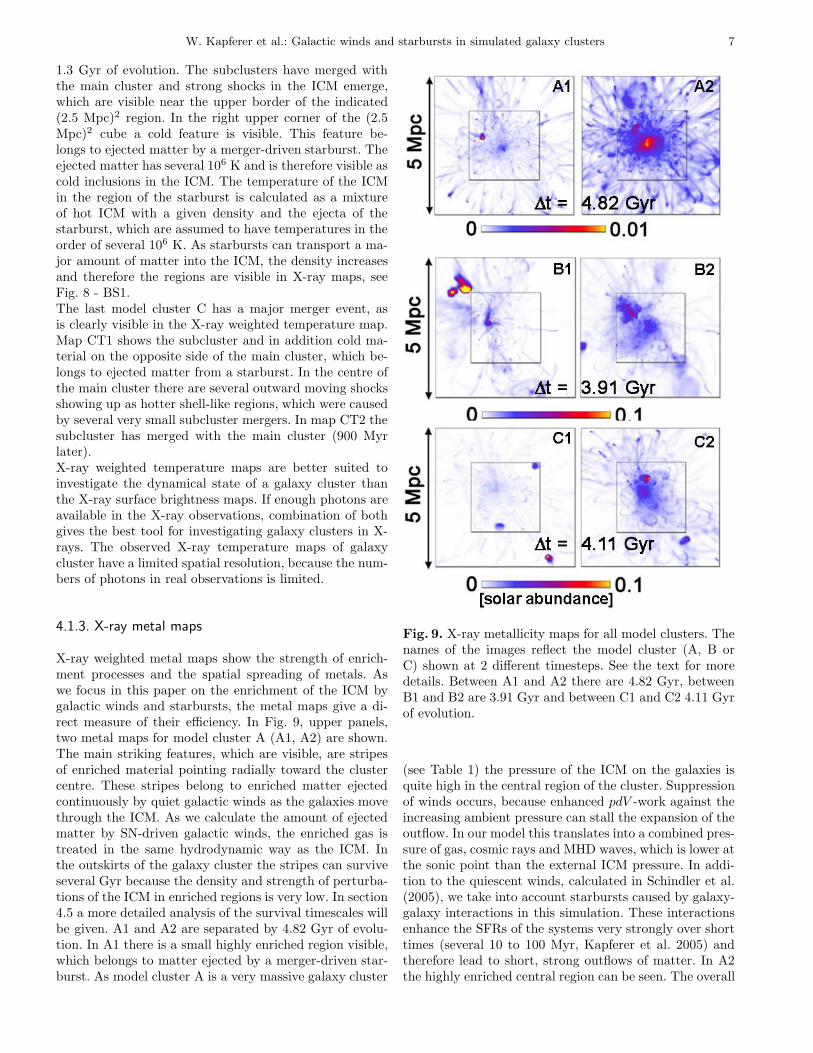
X-ray weighted metal maps show the strength of enrich-ment processes and the spatial spreading of metals. Aswe focus in this paper on the enrichment of the ICM bygalactic winds and starbursts, the metal maps give a di-rect measure of their efficiency. In Fig. 9, upper panels,two metal maps for model cluster A (A1, A2) are shown.The main striking features, which are visible, are stripesof enriched material pointing radially toward the clustercentre. These stripes belong to enriched matter ejectedcontinuously by quiet galactic winds as the galaxies movethrough the ICM. As we calculate the amount of ejectedmatter by SN-driven galactic winds, the enriched gas istreated in the same hydrodynamic way as the ICM. Inthe outskirts of the galaxy cluster the stripes can surviveseveral Gyr because the density and strength of perturba-tions of the ICM in enriched regions is very low. In section4.5 a more detailed analysis of the survival timescales willbe given. A1 and A2 are separated by 4.82 Gyr of evolu-tion. In A1 there is a small highly enriched region visible,which belongs to matter ejected by a merger-driven star-burst. As model cluster A is a very massive galaxy cluster
Fig. 9. X-ray metallicity maps for all model clusters. Thenames of the images reflect the model cluster (A, B orC) shown at 2 different timesteps. See the text for moredetails. Between A1 and A2 there are 4.82 Gyr, betweenB1 and B2 are 3.91 Gyr and between C1 and C2 4.11 Gyrof evolution.
(see Table 1) the pressure of the ICM on the galaxies isquite high in the central region of the cluster. Suppressionof winds occurs, because enhanced pdV -work against theincreasing ambient pressure can stall the expansion of theoutflow. In our model this translates into a combined pres-sure of gas, cosmic rays and MHD waves, which is lower atthe sonic point than the external ICM pressure. In addi-tion to the quiescent winds, calculated in Schindler et al.(2005), we take into account starbursts caused by galaxy-galaxy interactions in this simulation. These interactionsenhance the SFRs of the systems very strongly over shorttimes (several 10 to 100 Myr, Kapferer et al. 2005) andtherefore lead to short, strong outflows of matter. In A2the highly enriched central region can be seen. The overall
8 W. Kapferer et al.: Galactic winds and starbursts in simulated galaxy clusters
metallicity is very low in model cluster A, because of thesuppression of quiet galactic winds by ICM pressure ontothe galaxies in the central part (∼ (1 Mpc)3). Anotherinteresting feature is the second peak in the metal mapnear the cluster centre (near upper-left inner corner) inthe map A2 in Fig. 9, caused by the strong starburst fromabove. The material has not been mixed with the metalsat the centre of the main cluster. It has been mixed withgas in a volume of several tens of kpc. As shown in theprevious maps, model cluster A has a merger event andthe induced perturbations in the ICM cause the spatialshift of this enriched region to the upper left corner of theinnermost grid.In Fig. 9 B1 and B2, the X-ray metallicity maps of modelcluster B are shown. The left map shows the metallicitydistribution after 4 Gyr of evolution. Again two highlyenriched regions in the outskirts of the cluster are visi-ble. They belong to merger-driven starburst ejecta. Notethat the relative velocities of galaxies, which fall in groupstoward the galaxy cluster centre are significantly lower(several hundred km/s) than the relative velocities of thegalaxies interacting at the centre of the cluster poten-tial (thousands of km/s). As a consequence, the interac-tion times of galaxies in subgroups falling into the clus-ter potential are longer and merger events do have largertimescales to introduce perturbations into the inter-stellarmedium, which cause the higher SFRs. Therefore star-bursts due to galaxy-galaxy interactions are more effectivein subgroups, falling into the cluster potential, than in thecentral parts of the galaxy cluster. In the metal B2 mapthe ICM, enriched by the starburst, has efficiently mixedwith the surrounding ICM and moved towards the cen-tre of mass, i.e. into denser regions. As a consequence theaverage metallicities are lower than in the left map (B1),where the ICM was not so dense in the region, where thestarburst happened. Model cluster B is the least massivemodel cluster in our sample and does not suppress galac-tic winds in the central region. Although the cluster hasfewer galaxies, galactic winds and starbursts can enrichthe ICM an order of magnitude more efficiently than inmodel cluster A, the most massive cluster in our sample.This can be explained in terms of the ICM mass, whichhas to be enriched. A high gas mass exerts a higher pres-sure of the ICM onto the galaxies, especially in the central(1 Mpc)3 region. Although more massive galaxy clustershave more galaxies, the higher pressure of the ICM sup-presses the galactic winds of many systems in the centralregion. In addition, more ICM has to be enriched thanin the case of a less massive cluster, which leads to lowermetal abundances in our model cluster A.In Fig. 9 C1 and C2, the metal maps for the interme-diate mass model cluster C are shown. In principle theyfollow the same trend as in the case of model cluster B.Again the left map shows highly enriched regions due togalaxy-merger driven starburst ejecta. As in all the othermetal maps, the enriched trajectories of the galaxies canbe seen in the outskirts of the galaxy cluster. These stripescan survive several Gyr, depending on the properties and
6 7 8 9 10 11 12 130
0.002
0.004
0.006
0.008
0.01
0.012
0.014
0.016
0.018
0.02
time [Gyr]
sola
r ab
unda
nce
model cluster Amodel cluster Bmodel cluster C
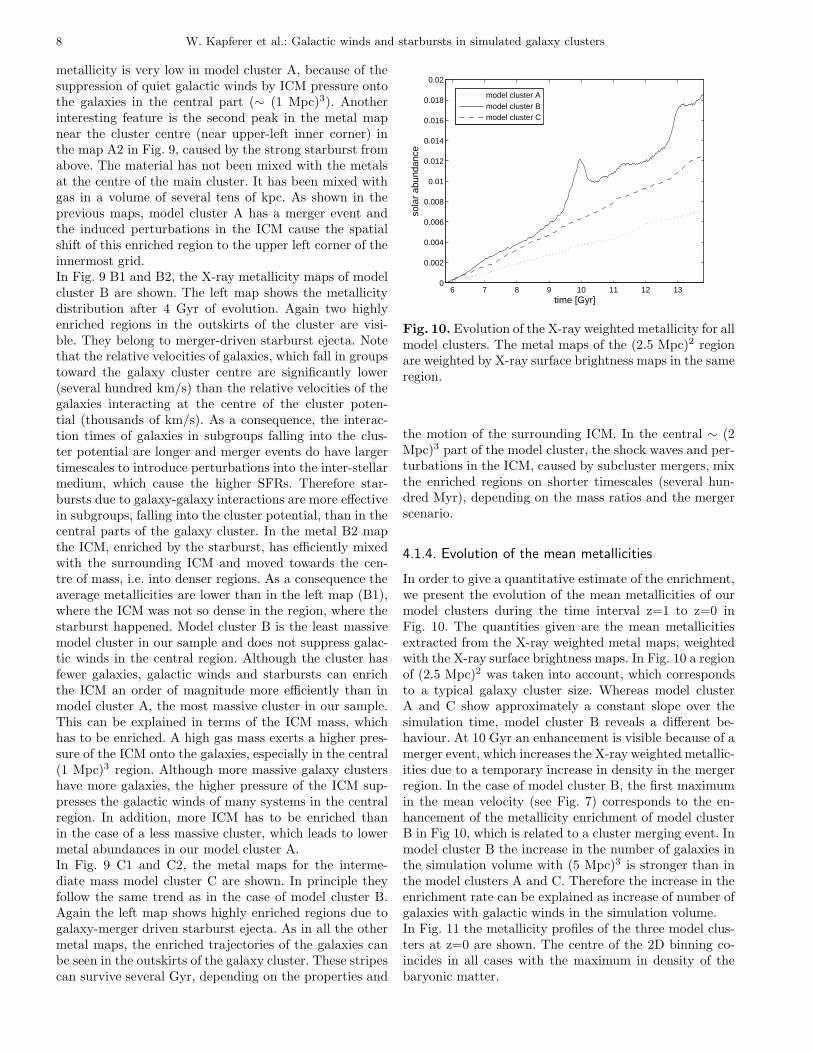
Fig. 10. Evolution of the X-ray weighted metallicity for allmodel clusters. The metal maps of the (2.5 Mpc)2 regionare weighted by X-ray surface brightness maps in the sameregion.
the motion of the surrounding ICM. In the central ∼ (2Mpc)3 part of the model cluster, the shock waves and per-turbations in the ICM, caused by subcluster mergers, mixthe enriched regions on shorter timescales (several hun-dred Myr), depending on the mass ratios and the mergerscenario.
4.1.4. Evolution of the mean metallicities
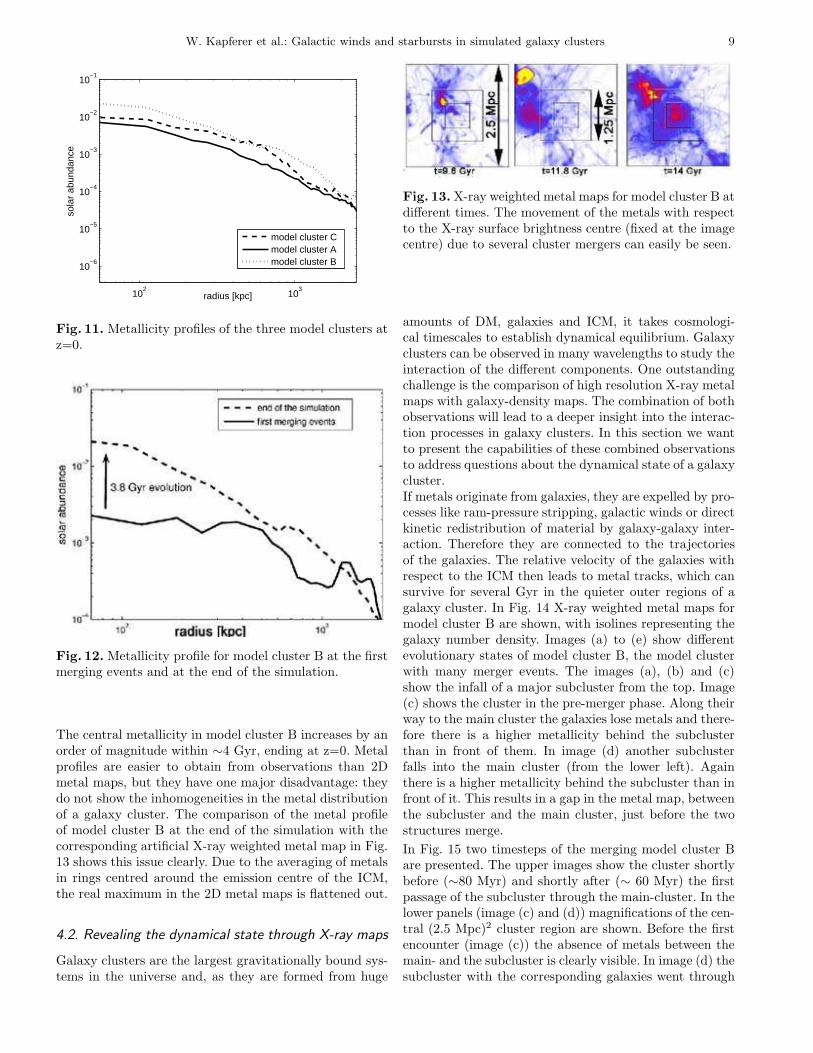
In order to give a quantitative estimate of the enrichment,we present the evolution of the mean metallicities of ourmodel clusters during the time interval z=1 to z=0 inFig. 10. The quantities given are the mean metallicitiesextracted from the X-ray weighted metal maps, weightedwith the X-ray surface brightness maps. In Fig. 10 a regionof (2.5 Mpc)2 was taken into account, which correspondsto a typical galaxy cluster size. Whereas model clusterA and C show approximately a constant slope over thesimulation time, model cluster B reveals a different be-haviour. At 10 Gyr an enhancement is visible because of amerger event, which increases the X-ray weighted metallic-ities due to a temporary increase in density in the mergerregion. In the case of model cluster B, the first maximumin the mean velocity (see Fig. 7) corresponds to the en-hancement of the metallicity enrichment of model clusterB in Fig 10, which is related to a cluster merging event. Inmodel cluster B the increase in the number of galaxies inthe simulation volume with (5 Mpc)3 is stronger than inthe model clusters A and C. Therefore the increase in theenrichment rate can be explained as increase of number ofgalaxies with galactic winds in the simulation volume.In Fig. 11 the metallicity profiles of the three model clus-ters at z=0 are shown. The centre of the 2D binning co-incides in all cases with the maximum in density of thebaryonic matter.
W. Kapferer et al.: Galactic winds and starbursts in simulated galaxy clusters 9
102
103
10−6
10−5
10−4
10−3
10−2
10−1
radius [kpc]
sola
r ab
unda
nce
model cluster Cmodel cluster Amodel cluster B
Fig. 11. Metallicity profiles of the three model clusters atz=0.
Fig. 12. Metallicity profile for model cluster B at the firstmerging events and at the end of the simulation.
The central metallicity in model cluster B increases by anorder of magnitude within ∼4 Gyr, ending at z=0. Metalprofiles are easier to obtain from observations than 2Dmetal maps, but they have one major disadvantage: theydo not show the inhomogeneities in the metal distributionof a galaxy cluster. The comparison of the metal profileof model cluster B at the end of the simulation with thecorresponding artificial X-ray weighted metal map in Fig.13 shows this issue clearly. Due to the averaging of metalsin rings centred around the emission centre of the ICM,the real maximum in the 2D metal maps is flattened out.
4.2. Revealing the dynamical state through X-ray maps
Galaxy clusters are the largest gravitationally bound sys-tems in the universe and, as they are formed from huge
Fig. 13. X-ray weighted metal maps for model cluster B atdifferent times. The movement of the metals with respectto the X-ray surface brightness centre (fixed at the imagecentre) due to several cluster mergers can easily be seen.
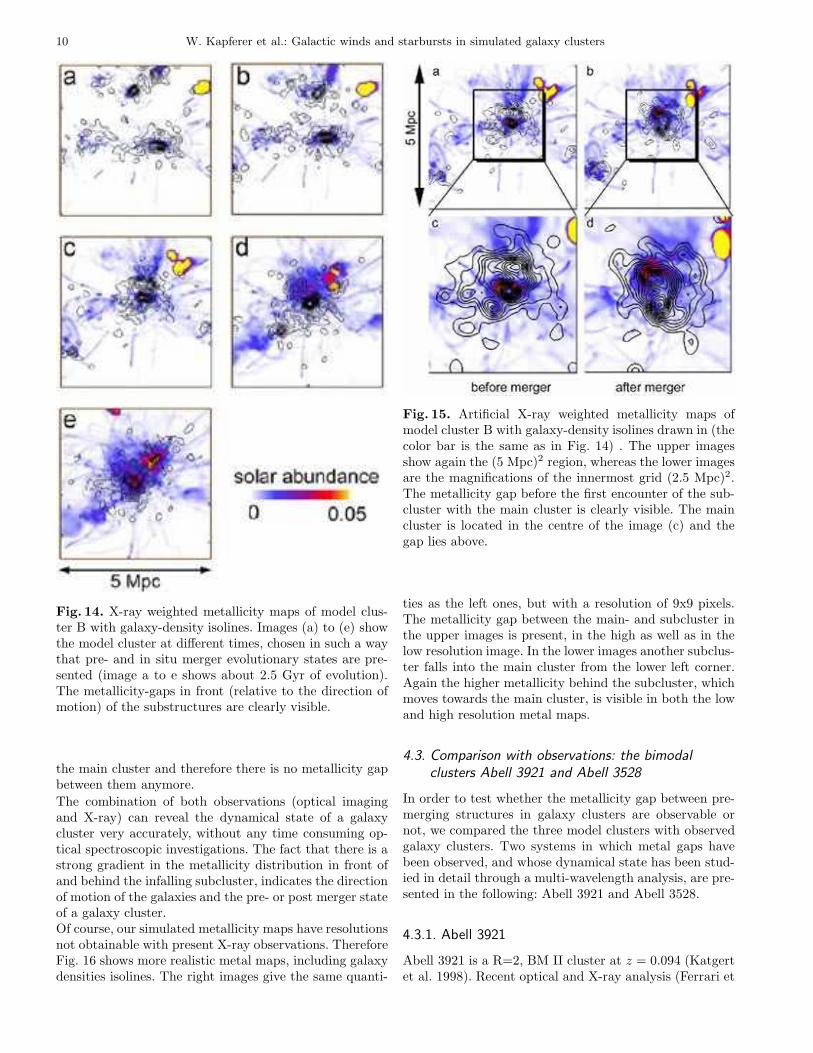
amounts of DM, galaxies and ICM, it takes cosmologi-cal timescales to establish dynamical equilibrium. Galaxyclusters can be observed in many wavelengths to study theinteraction of the different components. One outstandingchallenge is the comparison of high resolution X-ray metalmaps with galaxy-density maps. The combination of bothobservations will lead to a deeper insight into the interac-tion processes in galaxy clusters. In this section we wantto present the capabilities of these combined observationsto address questions about the dynamical state of a galaxycluster.If metals originate from galaxies, they are expelled by pro-cesses like ram-pressure stripping, galactic winds or directkinetic redistribution of material by galaxy-galaxy inter-action. Therefore they are connected to the trajectoriesof the galaxies. The relative velocity of the galaxies withrespect to the ICM then leads to metal tracks, which cansurvive for several Gyr in the quieter outer regions of agalaxy cluster. In Fig. 14 X-ray weighted metal maps formodel cluster B are shown, with isolines representing thegalaxy number density. Images (a) to (e) show differentevolutionary states of model cluster B, the model clusterwith many merger events. The images (a), (b) and (c)show the infall of a major subcluster from the top. Image(c) shows the cluster in the pre-merger phase. Along theirway to the main cluster the galaxies lose metals and there-fore there is a higher metallicity behind the subclusterthan in front of them. In image (d) another subclusterfalls into the main cluster (from the lower left). Againthere is a higher metallicity behind the subcluster than infront of it. This results in a gap in the metal map, betweenthe subcluster and the main cluster, just before the twostructures merge.
In Fig. 15 two timesteps of the merging model cluster Bare presented. The upper images show the cluster shortlybefore (∼80 Myr) and shortly after (∼ 60 Myr) the firstpassage of the subcluster through the main-cluster. In thelower panels (image (c) and (d)) magnifications of the cen-tral (2.5 Mpc)2 cluster region are shown. Before the firstencounter (image (c)) the absence of metals between themain- and the subcluster is clearly visible. In image (d) thesubcluster with the corresponding galaxies went through
10 W. Kapferer et al.: Galactic winds and starbursts in simulated galaxy clusters
Fig. 14. X-ray weighted metallicity maps of model clus-ter B with galaxy-density isolines. Images (a) to (e) showthe model cluster at different times, chosen in such a waythat pre- and in situ merger evolutionary states are pre-sented (image a to e shows about 2.5 Gyr of evolution).The metallicity-gaps in front (relative to the direction ofmotion) of the substructures are clearly visible.
the main cluster and therefore there is no metallicity gapbetween them anymore.
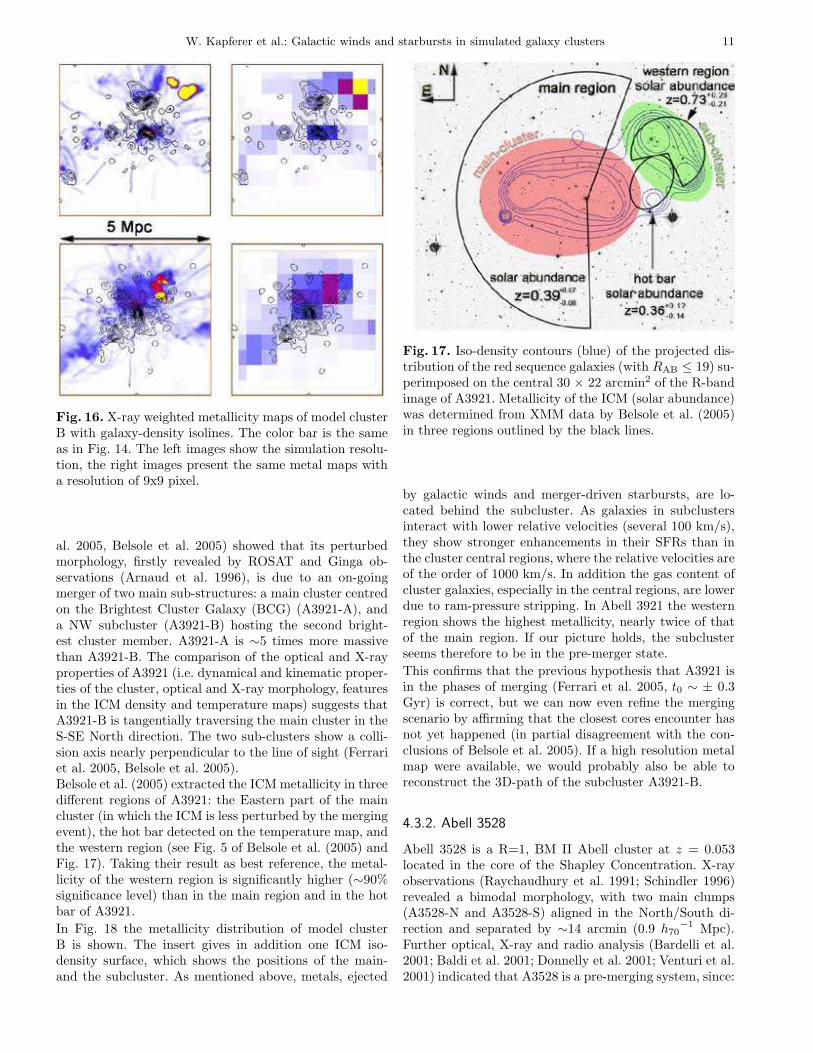
The combination of both observations (optical imagingand X-ray) can reveal the dynamical state of a galaxycluster very accurately, without any time consuming op-tical spectroscopic investigations. The fact that there is astrong gradient in the metallicity distribution in front ofand behind the infalling subcluster, indicates the directionof motion of the galaxies and the pre- or post merger stateof a galaxy cluster.Of course, our simulated metallicity maps have resolutionsnot obtainable with present X-ray observations. ThereforeFig. 16 shows more realistic metal maps, including galaxydensities isolines. The right images give the same quanti-
Fig. 15. Artificial X-ray weighted metallicity maps ofmodel cluster B with galaxy-density isolines drawn in (thecolor bar is the same as in Fig. 14) . The upper imagesshow again the (5 Mpc)2 region, whereas the lower imagesare the magnifications of the innermost grid (2.5 Mpc)2.The metallicity gap before the first encounter of the sub-cluster with the main cluster is clearly visible. The maincluster is located in the centre of the image (c) and thegap lies above.
ties as the left ones, but with a resolution of 9x9 pixels.The metallicity gap between the main- and subcluster inthe upper images is present, in the high as well as in thelow resolution image. In the lower images another subclus-ter falls into the main cluster from the lower left corner.Again the higher metallicity behind the subcluster, whichmoves towards the main cluster, is visible in both the lowand high resolution metal maps.
4.3. Comparison with observations: the bimodal
clusters Abell 3921 and Abell 3528
In order to test whether the metallicity gap between pre-merging structures in galaxy clusters are observable ornot, we compared the three model clusters with observedgalaxy clusters. Two systems in which metal gaps havebeen observed, and whose dynamical state has been stud-ied in detail through a multi-wavelength analysis, are pre-sented in the following: Abell 3921 and Abell 3528.
4.3.1. Abell 3921
Abell 3921 is a R=2, BM II cluster at z = 0.094 (Katgertet al. 1998). Recent optical and X-ray analysis (Ferrari et
W. Kapferer et al.: Galactic winds and starbursts in simulated galaxy clusters 11
Fig. 16. X-ray weighted metallicity maps of model clusterB with galaxy-density isolines. The color bar is the sameas in Fig. 14. The left images show the simulation resolu-tion, the right images present the same metal maps witha resolution of 9x9 pixel.
al. 2005, Belsole et al. 2005) showed that its perturbedmorphology, firstly revealed by ROSAT and Ginga ob-servations (Arnaud et al. 1996), is due to an on-goingmerger of two main sub-structures: a main cluster centredon the Brightest Cluster Galaxy (BCG) (A3921-A), anda NW subcluster (A3921-B) hosting the second bright-est cluster member. A3921-A is ∼5 times more massivethan A3921-B. The comparison of the optical and X-rayproperties of A3921 (i.e. dynamical and kinematic proper-ties of the cluster, optical and X-ray morphology, featuresin the ICM density and temperature maps) suggests thatA3921-B is tangentially traversing the main cluster in theS-SE North direction. The two sub-clusters show a colli-sion axis nearly perpendicular to the line of sight (Ferrariet al. 2005, Belsole et al. 2005).Belsole et al. (2005) extracted the ICM metallicity in threedifferent regions of A3921: the Eastern part of the maincluster (in which the ICM is less perturbed by the mergingevent), the hot bar detected on the temperature map, andthe western region (see Fig. 5 of Belsole et al. (2005) andFig. 17). Taking their result as best reference, the metal-licity of the western region is significantly higher (∼90%significance level) than in the main region and in the hotbar of A3921.
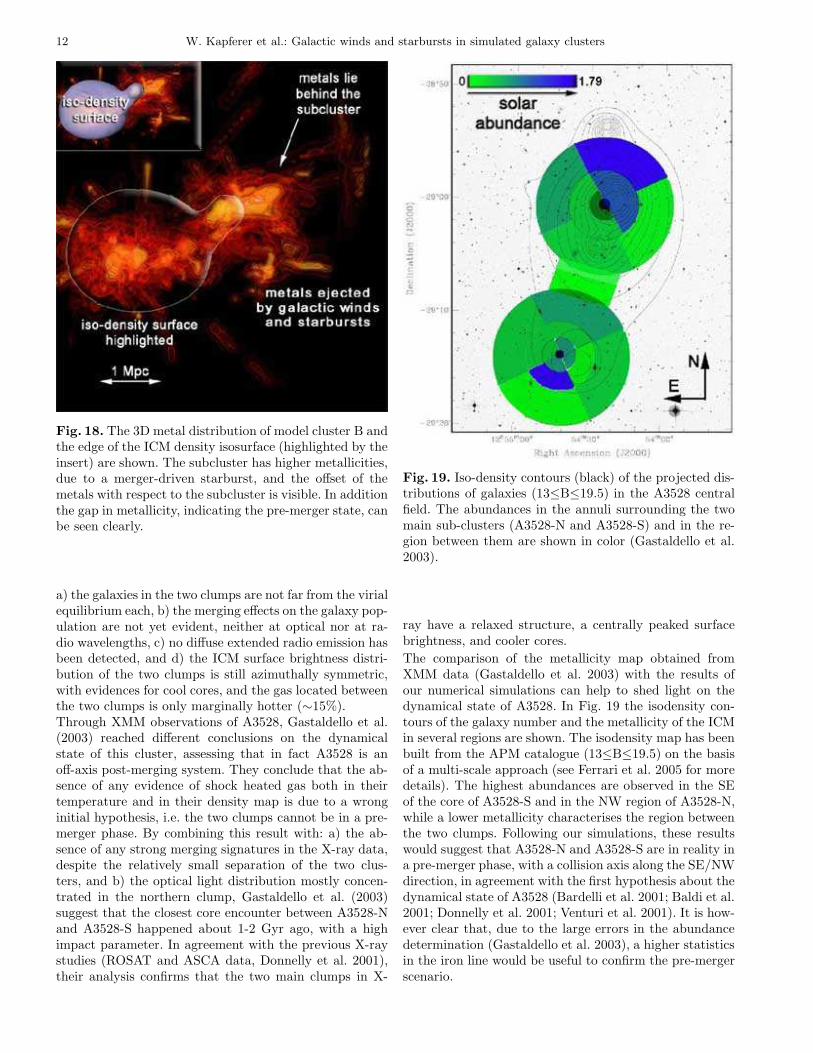
In Fig. 18 the metallicity distribution of model clusterB is shown. The insert gives in addition one ICM iso-density surface, which shows the positions of the main-and the subcluster. As mentioned above, metals, ejected
Fig. 17. Iso-density contours (blue) of the projected dis-tribution of the red sequence galaxies (with RAB ≤ 19) su-perimposed on the central 30 × 22 arcmin2 of the R-bandimage of A3921. Metallicity of the ICM (solar abundance)was determined from XMM data by Belsole et al. (2005)in three regions outlined by the black lines.
by galactic winds and merger-driven starbursts, are lo-cated behind the subcluster. As galaxies in subclustersinteract with lower relative velocities (several 100 km/s),they show stronger enhancements in their SFRs than inthe cluster central regions, where the relative velocities areof the order of 1000 km/s. In addition the gas content ofcluster galaxies, especially in the central regions, are lowerdue to ram-pressure stripping. In Abell 3921 the westernregion shows the highest metallicity, nearly twice of thatof the main region. If our picture holds, the subclusterseems therefore to be in the pre-merger state.
This confirms that the previous hypothesis that A3921 isin the phases of merging (Ferrari et al. 2005, t0 ∼ ± 0.3Gyr) is correct, but we can now even refine the mergingscenario by affirming that the closest cores encounter hasnot yet happened (in partial disagreement with the con-clusions of Belsole et al. 2005). If a high resolution metalmap were available, we would probably also be able toreconstruct the 3D-path of the subcluster A3921-B.
4.3.2. Abell 3528
Abell 3528 is a R=1, BM II Abell cluster at z = 0.053located in the core of the Shapley Concentration. X-rayobservations (Raychaudhury et al. 1991; Schindler 1996)revealed a bimodal morphology, with two main clumps(A3528-N and A3528-S) aligned in the North/South di-rection and separated by ∼14 arcmin (0.9 h70
−1 Mpc).Further optical, X-ray and radio analysis (Bardelli et al.2001; Baldi et al. 2001; Donnelly et al. 2001; Venturi et al.2001) indicated that A3528 is a pre-merging system, since:
12 W. Kapferer et al.: Galactic winds and starbursts in simulated galaxy clusters
Fig. 18. The 3D metal distribution of model cluster B andthe edge of the ICM density isosurface (highlighted by theinsert) are shown. The subcluster has higher metallicities,due to a merger-driven starburst, and the offset of themetals with respect to the subcluster is visible. In additionthe gap in metallicity, indicating the pre-merger state, canbe seen clearly.
a) the galaxies in the two clumps are not far from the virialequilibrium each, b) the merging effects on the galaxy pop-ulation are not yet evident, neither at optical nor at ra-dio wavelengths, c) no diffuse extended radio emission hasbeen detected, and d) the ICM surface brightness distri-bution of the two clumps is still azimuthally symmetric,with evidences for cool cores, and the gas located betweenthe two clumps is only marginally hotter (∼15%).Through XMM observations of A3528, Gastaldello et al.(2003) reached different conclusions on the dynamicalstate of this cluster, assessing that in fact A3528 is anoff-axis post-merging system. They conclude that the ab-sence of any evidence of shock heated gas both in theirtemperature and in their density map is due to a wronginitial hypothesis, i.e. the two clumps cannot be in a pre-merger phase. By combining this result with: a) the ab-sence of any strong merging signatures in the X-ray data,despite the relatively small separation of the two clus-ters, and b) the optical light distribution mostly concen-trated in the northern clump, Gastaldello et al. (2003)suggest that the closest core encounter between A3528-Nand A3528-S happened about 1-2 Gyr ago, with a highimpact parameter. In agreement with the previous X-raystudies (ROSAT and ASCA data, Donnelly et al. 2001),their analysis confirms that the two main clumps in X-
Fig. 19. Iso-density contours (black) of the projected dis-tributions of galaxies (13≤B≤19.5) in the A3528 centralfield. The abundances in the annuli surrounding the twomain sub-clusters (A3528-N and A3528-S) and in the re-gion between them are shown in color (Gastaldello et al.2003).
ray have a relaxed structure, a centrally peaked surfacebrightness, and cooler cores.
The comparison of the metallicity map obtained fromXMM data (Gastaldello et al. 2003) with the results ofour numerical simulations can help to shed light on thedynamical state of A3528. In Fig. 19 the isodensity con-tours of the galaxy number and the metallicity of the ICMin several regions are shown. The isodensity map has beenbuilt from the APM catalogue (13≤B≤19.5) on the basisof a multi-scale approach (see Ferrari et al. 2005 for moredetails). The highest abundances are observed in the SEof the core of A3528-S and in the NW region of A3528-N,while a lower metallicity characterises the region betweenthe two clumps. Following our simulations, these resultswould suggest that A3528-N and A3528-S are in reality ina pre-merger phase, with a collision axis along the SE/NWdirection, in agreement with the first hypothesis about thedynamical state of A3528 (Bardelli et al. 2001; Baldi et al.2001; Donnelly et al. 2001; Venturi et al. 2001). It is how-ever clear that, due to the large errors in the abundancedetermination (Gastaldello et al. 2003), a higher statisticsin the iron line would be useful to confirm the pre-mergerscenario.
W. Kapferer et al.: Galactic winds and starbursts in simulated galaxy clusters 13
4 6 8 10 120
200
400
600
800
1000
1200
1400
time [Gyr]
num
ber
of g
alax
ies
number of galaxies in (20 Mpc)3
number of galaxies in (5 Mpc)3
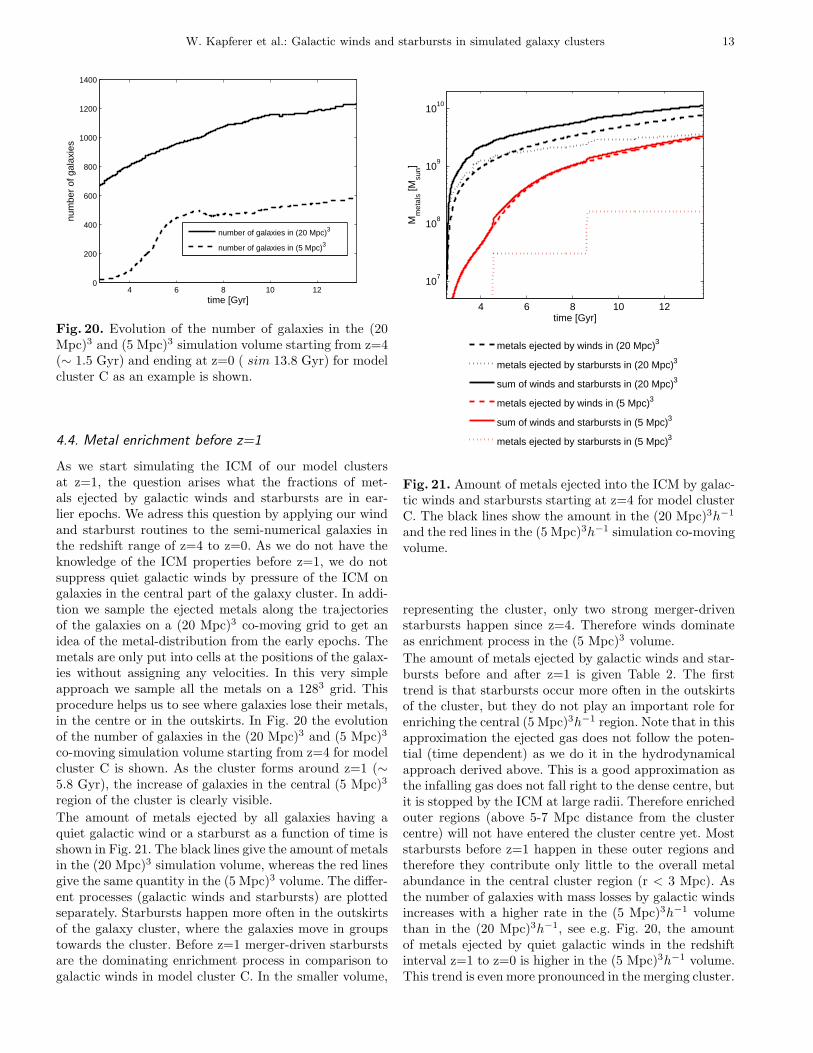
Fig. 20. Evolution of the number of galaxies in the (20Mpc)3 and (5 Mpc)3 simulation volume starting from z=4(∼ 1.5 Gyr) and ending at z=0 ( sim 13.8 Gyr) for modelcluster C as an example is shown.
4.4. Metal enrichment before z=1
As we start simulating the ICM of our model clustersat z=1, the question arises what the fractions of met-als ejected by galactic winds and starbursts are in ear-lier epochs. We adress this question by applying our windand starburst routines to the semi-numerical galaxies inthe redshift range of z=4 to z=0. As we do not have theknowledge of the ICM properties before z=1, we do notsuppress quiet galactic winds by pressure of the ICM ongalaxies in the central part of the galaxy cluster. In addi-tion we sample the ejected metals along the trajectoriesof the galaxies on a (20 Mpc)3 co-moving grid to get anidea of the metal-distribution from the early epochs. Themetals are only put into cells at the positions of the galax-ies without assigning any velocities. In this very simpleapproach we sample all the metals on a 1283 grid. Thisprocedure helps us to see where galaxies lose their metals,in the centre or in the outskirts. In Fig. 20 the evolutionof the number of galaxies in the (20 Mpc)3 and (5 Mpc)3
co-moving simulation volume starting from z=4 for modelcluster C is shown. As the cluster forms around z=1 (∼5.8 Gyr), the increase of galaxies in the central (5 Mpc)3
region of the cluster is clearly visible.
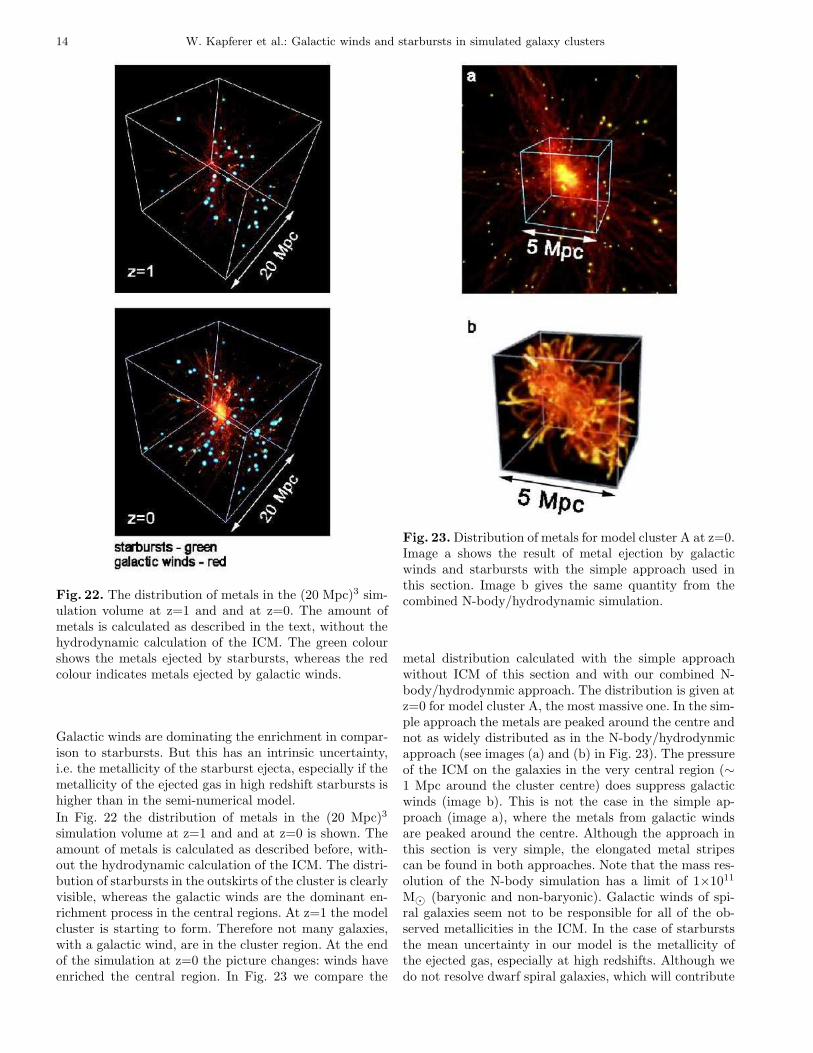
The amount of metals ejected by all galaxies having aquiet galactic wind or a starburst as a function of time isshown in Fig. 21. The black lines give the amount of metalsin the (20 Mpc)3 simulation volume, whereas the red linesgive the same quantity in the (5 Mpc)3 volume. The differ-ent processes (galactic winds and starbursts) are plottedseparately. Starbursts happen more often in the outskirtsof the galaxy cluster, where the galaxies move in groupstowards the cluster. Before z=1 merger-driven starburstsare the dominating enrichment process in comparison togalactic winds in model cluster C. In the smaller volume,
4 6 8 10 12
107
108
109
1010
time [Gyr]
Mm
etal
s [Msu
n]
metals ejected by winds in (20 Mpc)3
metals ejected by starbursts in (20 Mpc)3
sum of winds and starbursts in (20 Mpc)3
metals ejected by winds in (5 Mpc)3
sum of winds and starbursts in (5 Mpc)3
metals ejected by starbursts in (5 Mpc)3
Fig. 21. Amount of metals ejected into the ICM by galac-tic winds and starbursts starting at z=4 for model clusterC. The black lines show the amount in the (20 Mpc)3h−1
and the red lines in the (5 Mpc)3h−1 simulation co-movingvolume.
representing the cluster, only two strong merger-drivenstarbursts happen since z=4. Therefore winds dominateas enrichment process in the (5 Mpc)3 volume.
The amount of metals ejected by galactic winds and star-bursts before and after z=1 is given Table 2. The firsttrend is that starbursts occur more often in the outskirtsof the cluster, but they do not play an important role forenriching the central (5 Mpc)3h−1 region. Note that in thisapproximation the ejected gas does not follow the poten-tial (time dependent) as we do it in the hydrodynamicalapproach derived above. This is a good approximation asthe infalling gas does not fall right to the dense centre, butit is stopped by the ICM at large radii. Therefore enrichedouter regions (above 5-7 Mpc distance from the clustercentre) will not have entered the cluster centre yet. Moststarbursts before z=1 happen in these outer regions andtherefore they contribute only little to the overall metalabundance in the central cluster region (r < 3 Mpc). Asthe number of galaxies with mass losses by galactic windsincreases with a higher rate in the (5 Mpc)3h−1 volumethan in the (20 Mpc)3h−1, see e.g. Fig. 20, the amountof metals ejected by quiet galactic winds in the redshiftinterval z=1 to z=0 is higher in the (5 Mpc)3h−1 volume.This trend is even more pronounced in the merging cluster.
14 W. Kapferer et al.: Galactic winds and starbursts in simulated galaxy clusters
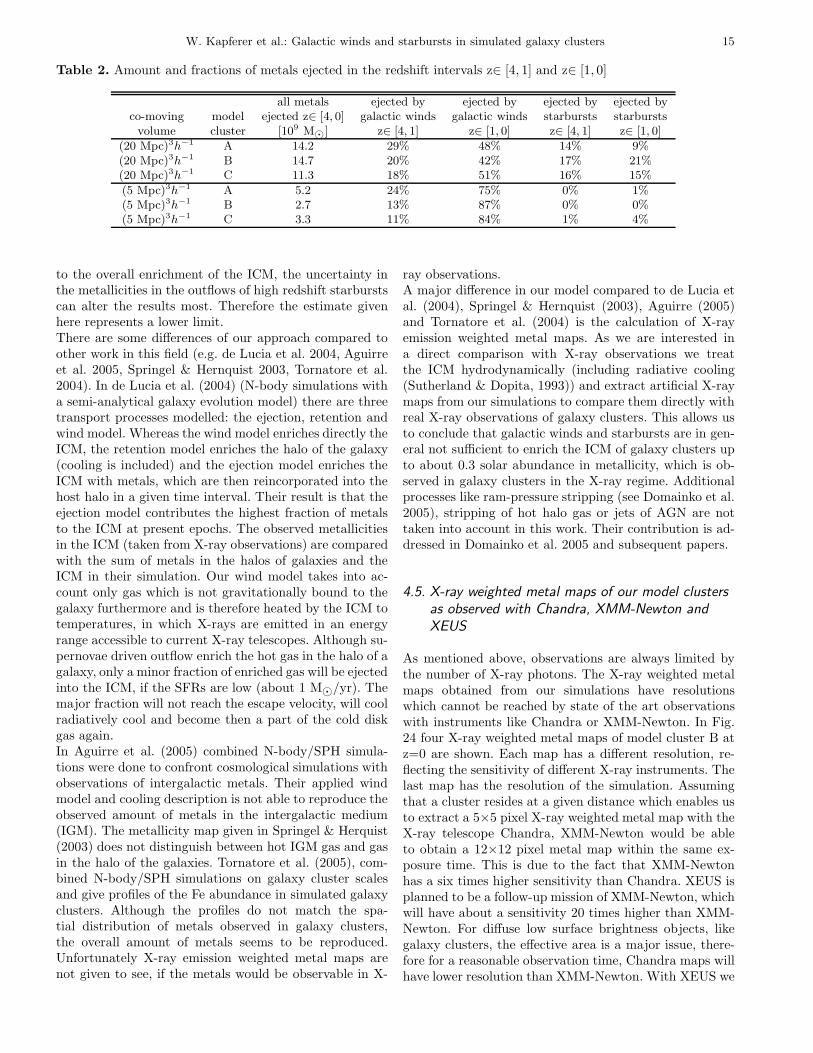
Fig. 22. The distribution of metals in the (20 Mpc)3 sim-ulation volume at z=1 and and at z=0. The amount ofmetals is calculated as described in the text, without thehydrodynamic calculation of the ICM. The green colourshows the metals ejected by starbursts, whereas the redcolour indicates metals ejected by galactic winds.
Galactic winds are dominating the enrichment in compar-ison to starbursts. But this has an intrinsic uncertainty,i.e. the metallicity of the starburst ejecta, especially if themetallicity of the ejected gas in high redshift starbursts ishigher than in the semi-numerical model.
In Fig. 22 the distribution of metals in the (20 Mpc)3
simulation volume at z=1 and and at z=0 is shown. Theamount of metals is calculated as described before, with-out the hydrodynamic calculation of the ICM. The distri-bution of starbursts in the outskirts of the cluster is clearlyvisible, whereas the galactic winds are the dominant en-richment process in the central regions. At z=1 the modelcluster is starting to form. Therefore not many galaxies,with a galactic wind, are in the cluster region. At the endof the simulation at z=0 the picture changes: winds haveenriched the central region. In Fig. 23 we compare the
Fig. 23. Distribution of metals for model cluster A at z=0.Image a shows the result of metal ejection by galacticwinds and starbursts with the simple approach used inthis section. Image b gives the same quantity from thecombined N-body/hydrodynamic simulation.
metal distribution calculated with the simple approachwithout ICM of this section and with our combined N-body/hydrodynmic approach. The distribution is given atz=0 for model cluster A, the most massive one. In the sim-ple approach the metals are peaked around the centre andnot as widely distributed as in the N-body/hydrodynmicapproach (see images (a) and (b) in Fig. 23). The pressureof the ICM on the galaxies in the very central region (∼1 Mpc around the cluster centre) does suppress galacticwinds (image b). This is not the case in the simple ap-proach (image a), where the metals from galactic windsare peaked around the centre. Although the approach inthis section is very simple, the elongated metal stripescan be found in both approaches. Note that the mass res-olution of the N-body simulation has a limit of 1×10¹¹
M⊙ (baryonic and non-baryonic). Galactic winds of spi-ral galaxies seem not to be responsible for all of the ob-served metallicities in the ICM. In the case of starburststhe mean uncertainty in our model is the metallicity ofthe ejected gas, especially at high redshifts. Although wedo not resolve dwarf spiral galaxies, which will contribute
W. Kapferer et al.: Galactic winds and starbursts in simulated galaxy clusters 15
Table 2. Amount and fractions of metals ejected in the redshift intervals z∈ [4, 1] and z∈ [1, 0]
all metals ejected by ejected by ejected by ejected byco-moving model ejected z∈ [4, 0] galactic winds galactic winds starbursts starburstsvolume cluster [109 M⊙] z∈ [4, 1] z∈ [1, 0] z∈ [4, 1] z∈ [1, 0]
(20 Mpc)3h−1 A 14.2 29% 48% 14% 9%(20 Mpc)3h−1 B 14.7 20% 42% 17% 21%(20 Mpc)3h−1 C 11.3 18% 51% 16% 15%
(5 Mpc)3h−1 A 5.2 24% 75% 0% 1%(5 Mpc)3h−1 B 2.7 13% 87% 0% 0%(5 Mpc)3h−1 C 3.3 11% 84% 1% 4%
to the overall enrichment of the ICM, the uncertainty inthe metallicities in the outflows of high redshift starburstscan alter the results most. Therefore the estimate givenhere represents a lower limit.There are some differences of our approach compared toother work in this field (e.g. de Lucia et al. 2004, Aguirreet al. 2005, Springel & Hernquist 2003, Tornatore et al.2004). In de Lucia et al. (2004) (N-body simulations witha semi-analytical galaxy evolution model) there are threetransport processes modelled: the ejection, retention andwind model. Whereas the wind model enriches directly theICM, the retention model enriches the halo of the galaxy(cooling is included) and the ejection model enriches theICM with metals, which are then reincorporated into thehost halo in a given time interval. Their result is that theejection model contributes the highest fraction of metalsto the ICM at present epochs. The observed metallicitiesin the ICM (taken from X-ray observations) are comparedwith the sum of metals in the halos of galaxies and theICM in their simulation. Our wind model takes into ac-count only gas which is not gravitationally bound to thegalaxy furthermore and is therefore heated by the ICM totemperatures, in which X-rays are emitted in an energyrange accessible to current X-ray telescopes. Although su-pernovae driven outflow enrich the hot gas in the halo of agalaxy, only a minor fraction of enriched gas will be ejectedinto the ICM, if the SFRs are low (about 1 M⊙/yr). Themajor fraction will not reach the escape velocity, will coolradiatively cool and become then a part of the cold diskgas again.In Aguirre et al. (2005) combined N-body/SPH simula-tions were done to confront cosmological simulations withobservations of intergalactic metals. Their applied windmodel and cooling description is not able to reproduce theobserved amount of metals in the intergalactic medium(IGM). The metallicity map given in Springel & Herquist(2003) does not distinguish between hot IGM gas and gasin the halo of the galaxies. Tornatore et al. (2005), com-bined N-body/SPH simulations on galaxy cluster scalesand give profiles of the Fe abundance in simulated galaxyclusters. Although the profiles do not match the spa-tial distribution of metals observed in galaxy clusters,the overall amount of metals seems to be reproduced.Unfortunately X-ray emission weighted metal maps arenot given to see, if the metals would be observable in X-
ray observations.A major difference in our model compared to de Lucia etal. (2004), Springel & Hernquist (2003), Aguirre (2005)and Tornatore et al. (2004) is the calculation of X-rayemission weighted metal maps. As we are interested ina direct comparison with X-ray observations we treatthe ICM hydrodynamically (including radiative cooling(Sutherland & Dopita, 1993)) and extract artificial X-raymaps from our simulations to compare them directly withreal X-ray observations of galaxy clusters. This allows usto conclude that galactic winds and starbursts are in gen-eral not sufficient to enrich the ICM of galaxy clusters upto about 0.3 solar abundance in metallicity, which is ob-served in galaxy clusters in the X-ray regime. Additionalprocesses like ram-pressure stripping (see Domainko et al.2005), stripping of hot halo gas or jets of AGN are nottaken into account in this work. Their contribution is ad-dressed in Domainko et al. 2005 and subsequent papers.
4.5. X-ray weighted metal maps of our model clusters
as observed with Chandra, XMM-Newton and
XEUS
As mentioned above, observations are always limited bythe number of X-ray photons. The X-ray weighted metalmaps obtained from our simulations have resolutionswhich cannot be reached by state of the art observationswith instruments like Chandra or XMM-Newton. In Fig.24 four X-ray weighted metal maps of model cluster B atz=0 are shown. Each map has a different resolution, re-flecting the sensitivity of different X-ray instruments. Thelast map has the resolution of the simulation. Assumingthat a cluster resides at a given distance which enables usto extract a 5×5 pixel X-ray weighted metal map with theX-ray telescope Chandra, XMM-Newton would be ableto obtain a 12×12 pixel metal map within the same ex-posure time. This is due to the fact that XMM-Newtonhas a six times higher sensitivity than Chandra. XEUS isplanned to be a follow-up mission of XMM-Newton, whichwill have about a sensitivity 20 times higher than XMM-Newton. For diffuse low surface brightness objects, likegalaxy clusters, the effective area is a major issue, there-fore for a reasonable observation time, Chandra maps willhave lower resolution than XMM-Newton. With XEUS we
16 W. Kapferer et al.: Galactic winds and starbursts in simulated galaxy clusters
Fig. 24. X-ray weighted metal maps as they would beobserved with Chandra, XMM-Newton and the next gen-eration X-ray telescope XEUS for a given exposure time.Lower right image: the real metal map. Different sensitiv-ity of the different missions yield different resolutions ofthe metal map.
will be able to resolve for the first time the metal distribu-tion in the ICM on the scales of single galaxies in nearbyclusters.
4.6. On the survival timescales of inhomogeneities in
the metallicity distribution
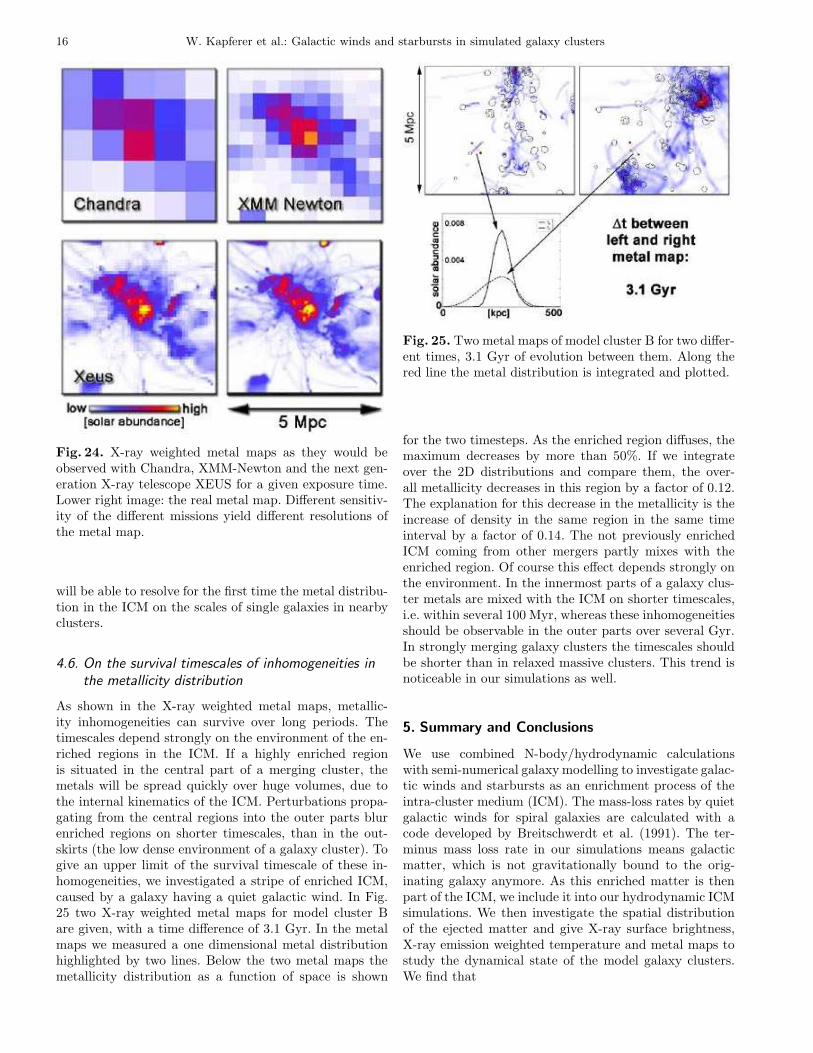
As shown in the X-ray weighted metal maps, metallic-ity inhomogeneities can survive over long periods. Thetimescales depend strongly on the environment of the en-riched regions in the ICM. If a highly enriched regionis situated in the central part of a merging cluster, themetals will be spread quickly over huge volumes, due tothe internal kinematics of the ICM. Perturbations propa-gating from the central regions into the outer parts blurenriched regions on shorter timescales, than in the out-skirts (the low dense environment of a galaxy cluster). Togive an upper limit of the survival timescale of these in-homogeneities, we investigated a stripe of enriched ICM,caused by a galaxy having a quiet galactic wind. In Fig.25 two X-ray weighted metal maps for model cluster Bare given, with a time difference of 3.1 Gyr. In the metalmaps we measured a one dimensional metal distributionhighlighted by two lines. Below the two metal maps themetallicity distribution as a function of space is shown
Fig. 25. Two metal maps of model cluster B for two differ-ent times, 3.1 Gyr of evolution between them. Along thered line the metal distribution is integrated and plotted.
for the two timesteps. As the enriched region diffuses, themaximum decreases by more than 50%. If we integrateover the 2D distributions and compare them, the over-all metallicity decreases in this region by a factor of 0.12.The explanation for this decrease in the metallicity is theincrease of density in the same region in the same timeinterval by a factor of 0.14. The not previously enrichedICM coming from other mergers partly mixes with theenriched region. Of course this effect depends strongly onthe environment. In the innermost parts of a galaxy clus-ter metals are mixed with the ICM on shorter timescales,i.e. within several 100 Myr, whereas these inhomogeneitiesshould be observable in the outer parts over several Gyr.In strongly merging galaxy clusters the timescales shouldbe shorter than in relaxed massive clusters. This trend isnoticeable in our simulations as well.
5. Summary and Conclusions
We use combined N-body/hydrodynamic calculationswith semi-numerical galaxy modelling to investigate galac-tic winds and starbursts as an enrichment process of theintra-cluster medium (ICM). The mass-loss rates by quietgalactic winds for spiral galaxies are calculated with acode developed by Breitschwerdt et al. (1991). The ter-minus mass loss rate in our simulations means galacticmatter, which is not gravitationally bound to the orig-inating galaxy anymore. As this enriched matter is thenpart of the ICM, we include it into our hydrodynamic ICMsimulations. We then investigate the spatial distributionof the ejected matter and give X-ray surface brightness,X-ray emission weighted temperature and metal maps tostudy the dynamical state of the model galaxy clusters.We find that
W. Kapferer et al.: Galactic winds and starbursts in simulated galaxy clusters 17
– there is a difference between the strength of the enrich-ment by galactic winds and starbursts in merging andin non-merging model clusters. Merging systems showmore galaxy-galaxy interactions, which cause morestarbursts. On the other hand galactic winds can besuppressed by the pressure of the ICM onto the galax-ies in relaxed clusters. As relaxed systems have moreICM to enrich, galactic winds are less effective. In oursimulations we find that galactic winds and starburstscan contribute up to 5% (merging cluster) to the ob-served metallicities in galaxy clusters in the redshiftinterval from z=1 to z=0 and up to 15% in the red-shift interval from z=4 to z=1.
– X-ray surface brightness, X-ray emission weightedtemperature and metal maps can give a deeper in-sight into the dynamical state of a galaxy cluster.Temperature and metal maps are harder to obtainin observations (limited by the number of X-ray pho-tons), but they yield a lot of information. We showthat especially the metal maps can help to distinguishbetween the pre- or post merger state of a galaxy clus-ter. Pre-mergers have a metallicity gap between thesubclusters, post-mergers have a high metallicity be-tween subclusters. This holds also if the resolution isreduced to 9x9 pixels in our artificial X-ray weightedmetallicity maps, which cover an area of (5 Mpc)2.
– the inhomogeneities which are introduced by galac-tic winds and starbursts into the ICM can survivefor a long time. In the outskirts of a galaxy cluster,where the variation in the density and the velocityfield of the ICM is less than in the inner parts, we findthat inhomogeneities can survive up to several Gyr.The timescales for the inhomogeneities are different formerging and non-merging galaxy clusters, because ofmixing by shocks, introduced by major merger events(in the ICM).
– metal enrichment of the ICM by galactic winds beforez=1 is not as strong as after z=1 in the cluster cen-tre ((5 Mpc)3h−1 volume), whereas for merger-drivenstarbursts there is no noticeable difference. Before z=1starbursts enrich the ICM on large scales at a compara-ble rate as galactic winds. As merger-driven starburstshappen more often in the outskirts of clusters, they en-rich the outer (larger r∼3 Mpc) regions of galaxy clus-ters. Galactic winds, on the other hand occur through-out the whole cluster, except for the densest innermostregions, where they might be suppressed by the highICM pressure.
Note that the metal maps in this paper are directly com-parable to observed metal maps, as we only take ejectedmatter into account for the enrichment processes, whichwould be observable in X-rays. The observed metallicitiesin galaxy clusters are one order of magnitude higher thanin our simulations. We believe that galactic winds are notable to produce the total observed amount of metals inthe ICM. Additional processes like ram-pressure stripping,hot halo gas stripping, jets of AGNs or intra-cluster super-
novae obviously play an important role as well. A majoruncertainty are the metallicities of the ejecta of high red-shift starbursts, which will be investigated in an upcomingpaper.
Acknowledgements
The authors are grateful to the anonymous ref-eree for his/her criticism that helped to improvethe paper. The authors acknowledge the AustrianScience Foundation (FWF) through grant numberP15868, UniInfrastrukturprogramm 2004 the bm:bwk”Konsortium Hochleistungsrechnen”, the bm:bwkAustrian Grid (Grid Computing) Initiative, the AustrianCouncil for Research and Technology Development andthe support of the European Commission’s ResearchInfrastructures activity of the Stucturing the EuropeanResearch Area programme, contract number RII3-CT-2003-506079 (HPC-Europa). In addition the authorsacknowledge the DFG grant Zi 663/6-1, the MarieCurie individual fellowship MEIF-CT-2003-900773 (CF)and the European Commission through grant numberHPRI-CT-1999-00026 (the TRACS Program at EPCC).Edmund Bertschinger and Rien van de Weygaert areacknowledged for providing their constrained randomfield code and Joshua Barnes and Piet Hut for their treecode. The authors would like to thank Sabine Kreidl formany useful discussions.
References
Aguirre, A., Schaye, J., Hernquist, L., Kay, S., Springel,V., & Theuns, T. 2005, ApJ, 620, L13Arnaud, M., Rothenflug, R., Bohringer, H., Neumann,D., & Yamashita, K. 1996, UV and X-ray Spectroscopyof Astrophysical and Laboratory Plasmas : Proceedingsof the Eleventh Colloquium on UV and X-ray ... heldon May 29-June 2, 1995, Nagoya, Japan. , UniversalAcademy Press, 1996. (Frontiers science series ; no. 15).,p.163, 163Baldi, A., Bardelli, S., & Zucca, E., 2001, 324, 509Bardelli, S., Zucca, E., & Baldi, A., 2001, MNRAS, 329,387Barnes, J., & Hut, P. 1986, Nature, 324, 446Belsole, E., Sauvageot, J.-L., Pratt, G. W., & Bourdin,H., 2005, A&A, 430, 385Breitschwerdt, D., McKenzie, J.F., Volk, H.J. 1991,A&A, 245, 79Colella, P., & Woodward, P.R. 1984, J. Comp. Phys., 54,174De Young, D.S. 1978, ApJ, 223, 47De Lucia, G., Kauffmann, G., & White, S. D. M., 2004,MNRAS, 349, 1101Domainko, W., Gitti, M., Schindler, S., & Kapferer, W.2004, A&A, 425, L21Domainko, W., Mair, M., Kapferer, et al., astro/ph-0507605
18 W. Kapferer et al.: Galactic winds and starbursts in simulated galaxy clusters
Donnelly, R.H., Forman, W., Jones, C., Quintana, H.,Ramirez, A., Churazov, E., & Gilfanov, M., 2001, ApJ,562, 254Ferrari, C., Benoist, C., Maurogordato, S., Cappi, A., &Slezak, E. 2005, A&A, 430, 19Fukazawa, Y., Kawano, N., & Kawashima, K. 2004, ApJ,606, L109Furusho, T., Yamasaki, N.Y., & Ohashi, T. 2003, ApJ,596, 181Gastaldello, F., Ettori, S., Molendi, S., Bardelli, S.,Venturi, T., & Zucca, E., 2003, A&A, 411, 21Gnedin, N.Y. 1998, MNRAS, 249, 407Gunn, J.E., & Gott, J.R.III 1972, ApJ, 176, 1Hayakawa, A., Furusho, T., Yamasaki, N.Y., Ishida, M.,& Ohashi, T. 2004, PASJ, 56, 743Heckman, T. M., Lehnert, M. D., Strickland, D. K., &Armus, L. 2000, APJS, 129, 493Heckman, T. M. 2003, RevMexAA 17, 47-55Kapferer, W., Knapp, A., Schindler, S., Kimeswenger, S.,& van Kampen, E. 2005, A&A, 438, 87Katgert, P., Mazure, A., den Hartog, R., Adami, C.,Biviano, A., & Perea, J., 1998, A&AS, 129, 399Martin, C.L., 19999, ApJ, 513, 156Mo, H. J., Mao, S., & White, S. D. M. 1998, MNRAS,295, 319Raychaudhury, S., Fabian, A.C., Edge, A.C., Jones, C.,& Forman, W., 1991, MNRAS, 248, 101Ruffert M. 1992, A&A, 265, 82Sanders, J.S., Fabian, A.C., Allen, S., & Schmidt, R.W.2004, MNRAS 349, 952Schindler, S., 1996, MNRAS, 280, 309Schindler, S., et al. 2005, A&A, 435, L25Schmidt R.W., Fabian A.C., Sanders J., 2002 MNRAS337,71Sutherland, R. S., & Dopita, M. A. 1993, ApJS, 88, 253Tornatore, L., Borgani, S., Matteucci, F., Recchi, S., &Tozzi, P., 2004, MNRAS, 349, L19van de Weygaert, R., & Bertschinger, E. 1996, MNRAS,281, 84van Kampen, E., 1997, in Clarke, D.A., West, M.J., eds.,12th ‘Kingston meeting’ on Theoretical Astrophysics:Computational Astrophysics, ASP Conference Series Vol.123, p. 231van Kampen, E., Jimenez, R., & Peacock, J.A. 1999,MNRAS, 310, 43Venturi, T., Bardelli, S., Zambelli, G.,Morganti, R., &Hunstead, R.W., 2001, MNRAS, 324, 1131