State of the Ecosystem 2020: Response Memo 11 March 2020 Introduction In the table below we summarize all comments and requests with sources. The Progress column briefly summarizes how we responded, with a more detailed response in the numbered Memo Section. In the Progress column, “SOE” indicates a change included in the report(s). Request Source Progress Memo Section Formal response to requests Both Councils This response memo. Introduction Consider report card like Alaska’s Both Councils SOE summary bullets (page 1). 1 Include summary visualization Both Councils SOE infographics (page 1-2). 2 Include uncertainty estimates for all indicators Both Councils SOE survey biomass uncertainty included; feedback requested for other indicators. 3 Include Downeast ME (Scotian Shelf EPU) NEFMC SOE survey biomass now includes most of downeast ME; human dimensions include downeast ME. 4 Link zooplankton abundance and or community composition to fish condition NEFMC SOE page 2 research spotlight. 5 Ocean acidification information Both Councils Work in progress to develop baseline and monitoring. 6 Gulf Stream Index/Labrador current interaction Both Councils SOE Labrador current and Gulf Stream indices now included in both reports. 7 Include source for PP estimates (satellite vs in situ) NEFMC SOE clarified that all PP estimates are from satellite. 8 Shellfish growth/distribution linked to climate (system productivity) MAFMC Project with R. Mann student to start late 2020. 9 Estuarine condition relative to power plants and temp MAFMC Inadequate resourses to address this year. 10 Frequency and occurrence of warm core rings MAFMC SOE added new indicator. 11 Cold pool index MAFMC SOE added new indicator. 12 Nutrient inputs and water quality near shore MAFMC SOE Chesapeake update; summary of data from National Estuarine Research Reserve network started, example info included here. 13 Link environmental and social, economic indicators NEFMC SOE added new PP required, habitat and wind overlap, page 2 conceptual model. 14 Quantitative overlap of wind area and habitat and fishing areas MAFMC SOE added new indicator for habitat and wind overlap, wind overlap with fisheries for next round. 15 Include links to Social Science websites NEFMC SOE link included in both reports. 16 Management complexity MAFMC Project started by summer student in 2018, needs further analysis. 17 South Atlantic Council managed species represented in recreational indices MAFMC SOE revised indicator and noted change in report. 18 Add social elements from overview conceptual model to NE conceptual model NEFMC Older general conceptual model replaced by specific links between indicators in report. 19 1
Transcript
State of the Ecosystem 2020: Response Memo 11 March 2020
Introduction
In the table below we summarize all comments and requests with sources. The Progress column briefly summarizeshow we responded, with a more detailed response in the numbered Memo Section. In the Progress column, “SOE”indicates a change included in the report(s).
Request Source Progress MemoSection
Formal response to requests Both Councils This response memo. IntroductionConsider report card like Alaska’s Both Councils SOE summary bullets (page 1). 1Include summary visualization Both Councils SOE infographics (page 1-2). 2Include uncertainty estimates forall indicators
Both Councils SOE survey biomass uncertaintyincluded; feedback requested forother indicators.
3
Include Downeast ME (ScotianShelf EPU)
NEFMC SOE survey biomass now includesmost of downeast ME; humandimensions include downeast ME.
4
Link zooplankton abundance andor community composition to fishcondition
NEFMC SOE page 2 research spotlight. 5
Ocean acidification information Both Councils Work in progress to developbaseline and monitoring.
6
Gulf Stream Index/Labradorcurrent interaction
Both Councils SOE Labrador current and GulfStream indices now included inboth reports.
7
Include source for PP estimates(satellite vs in situ)
NEFMC SOE clarified that all PP estimatesare from satellite.
MAFMC Project with R. Mann student tostart late 2020.
9
Estuarine condition relative topower plants and temp
MAFMC Inadequate resourses to addressthis year.
10
Frequency and occurrence of warmcore rings
MAFMC SOE added new indicator. 11
Cold pool index MAFMC SOE added new indicator. 12Nutrient inputs and water qualitynear shore
MAFMC SOE Chesapeake update; summaryof data from National EstuarineResearch Reserve network started,example info included here.
13
Link environmental and social,economic indicators
NEFMC SOE added new PP required,habitat and wind overlap, page 2conceptual model.
14
Quantitative overlap of wind areaand habitat and fishing areas
MAFMC SOE added new indicator forhabitat and wind overlap, windoverlap with fisheries for nextround.
15
Include links to Social Sciencewebsites
NEFMC SOE link included in both reports. 16
Management complexity MAFMC Project started by summer studentin 2018, needs further analysis.
17
South Atlantic Council managedspecies represented in recreationalindices
MAFMC SOE revised indicator and notedchange in report.
18
Add social elements from overviewconceptual model to NE conceptualmodel
NEFMC Older general conceptual modelreplaced by specific links betweenindicators in report.
19
1
State of the Ecosystem 2020: Response Memo
(continued)Request Source Progress Memo
Section
Avg. weight of diet components byfeeding group, mean stomachweight across feeding guilds
Both Councils Stomach fullness analysisstarted–species level; feedbackrequested.
20
North Atlantic Right Whale calfproduction indicator
NEFMC SOE added new indicator. 21
Distinguish managed species inreport
NEFMC SOE Council managed speciesseparated in landings figures.
22
Marine Mammal consumption MAFMC SOE added discussion of seal diets. 23Small pelagic abundance MAFMC SOE have survey planktivore time
series but would like to improve;see also SOE forage energy density.
24
Young of Year index from multiplesurveys
MAFMC SOE fish production from NEFSCtrawl; feedback reqested on how toexpand.
25
Biomass of sharks MAFMC HMS provided landings for 3 yearsand working on full time series, stilllooking for source of biomass data.
26
Diversity metric for NEFSC trawlsurvey
NEFMC Need to reconcile different surveyvessel catchabilites or split byvessel.
27
Ecosystem risk score MAFMC SOE PP required, marine heatwaves are steps towards this;feedback requested for otherdesired analyses.
28
Inflection points for indicators Both Councils SOE warm core rings; generalanalysis of combined indicatorsinitiated but not yet finished.
29
Responses to comments
1 Report Card
Both Councils asked for a summary “report card” similar to that used in Alaska [1]. The first page of each of thisyear’s SOE reports summarizes the key messages with icons showing the message theme (e.g., commercial fisheries,fishing communities, forage species, system productivity, etc). At present, we synthesized key findings on bothexisting and new indicators. We welcome suggestions for indicators that should always be tracked in this section,and for further refinements to make this summary more useful.
2 Summary Visualization
Both Councils asked for a summary visualization. The first page of each SOE report uses icons developed to helpvisualize different report components. The second page of each SOE report has both a map visualizing the keyoceanographic features mentioned in the report along with fishing communities, and a conceptual model visualizingpotential linkages between report indicators. The conceptual model is discussed further under point 5 below.
2
State of the Ecosystem 2020: Response Memo
3 Uncertainty Estimates
Both Councils asked for uncertainty estimates to be included with indicators. As a first step, we included surveydesign-based uncertainty estimates1 for all surveys where we had haul specific information (all but the inshoreME-NH survey). Including this uncertainty led to a different approach to the data, looking for true departures fromexpected stable dynamics at the functional group level, and provided insight into which trends were potentiallynoteworthy. Survey biomass uncertainty is included in each SOE (p. 15-16 MAFMC and p. 16-19 NEFMC).
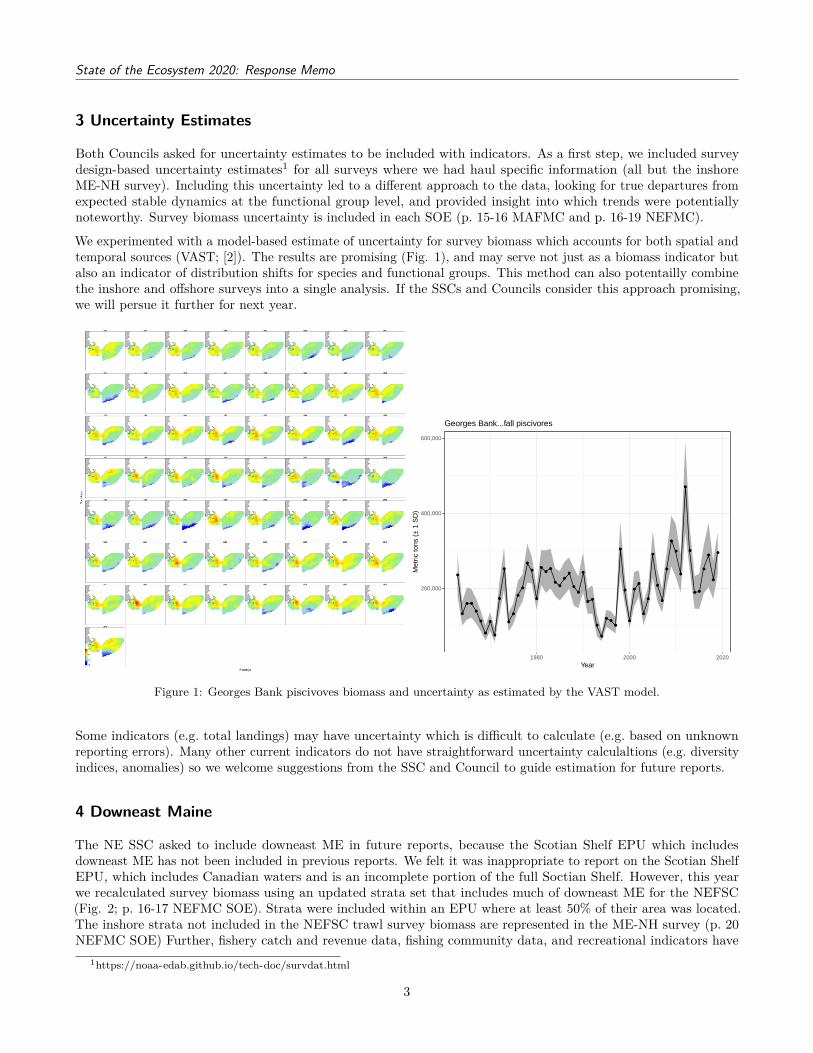
We experimented with a model-based estimate of uncertainty for survey biomass which accounts for both spatial andtemporal sources (VAST; [2]). The results are promising (Fig. 1), and may serve not just as a biomass indicator butalso an indicator of distribution shifts for species and functional groups. This method can also potentailly combinethe inshore and offshore surveys into a single analysis. If the SSCs and Councils consider this approach promising,we will persue it further for next year.
●
●
● ●
●
●
●
●
●
●
●
●
●
●
●
●
●
●
●
●
●
●
●
●
●
●
●
●
●●
●
●
●●
●
●
●
●
●
●
●
●
●
●
●
●
●
●
●
●
●
● ●
●
●
●
●
200,000
400,000
600,000
1980 2000 2020Year
Met
ric to
ns (
± 1
SD
)Georges Bank...fall piscivores
Figure 1: Georges Bank piscivoves biomass and uncertainty as estimated by the VAST model.
Some indicators (e.g. total landings) may have uncertainty which is difficult to calculate (e.g. based on unknownreporting errors). Many other current indicators do not have straightforward uncertainty calculaltions (e.g. diversityindices, anomalies) so we welcome suggestions from the SSC and Council to guide estimation for future reports.
4 Downeast Maine
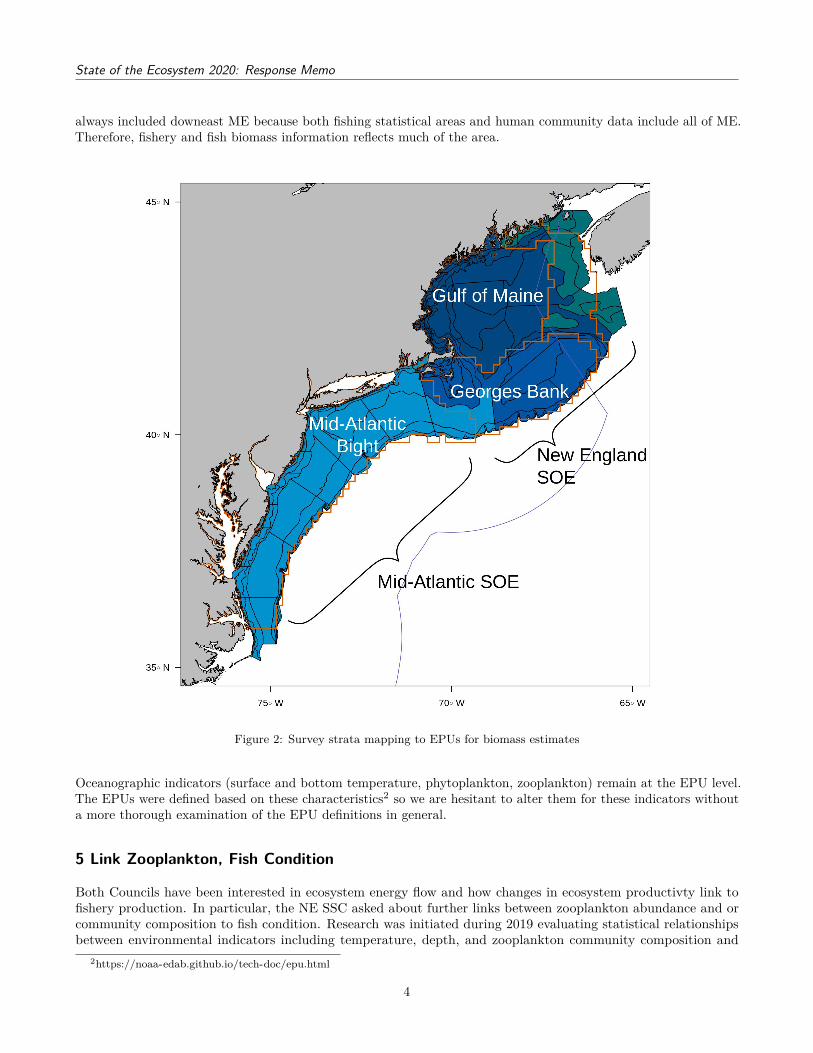
The NE SSC asked to include downeast ME in future reports, because the Scotian Shelf EPU which includesdowneast ME has not been included in previous reports. We felt it was inappropriate to report on the Scotian ShelfEPU, which includes Canadian waters and is an incomplete portion of the full Soctian Shelf. However, this yearwe recalculated survey biomass using an updated strata set that includes much of downeast ME for the NEFSC(Fig. 2; p. 16-17 NEFMC SOE). Strata were included within an EPU where at least 50% of their area was located.The inshore strata not included in the NEFSC trawl survey biomass are represented in the ME-NH survey (p. 20NEFMC SOE) Further, fishery catch and revenue data, fishing community data, and recreational indicators have
always included downeast ME because both fishing statistical areas and human community data include all of ME.Therefore, fishery and fish biomass information reflects much of the area.
Figure 2: Survey strata mapping to EPUs for biomass estimates
Oceanographic indicators (surface and bottom temperature, phytoplankton, zooplankton) remain at the EPU level.The EPUs were defined based on these characteristics2 so we are hesitant to alter them for these indicators withouta more thorough examination of the EPU definitions in general.
5 Link Zooplankton, Fish Condition
Both Councils have been interested in ecosystem energy flow and how changes in ecosystem productivty link tofishery production. In particular, the NE SSC asked about further links between zooplankton abundance and orcommunity composition to fish condition. Research was initiated during 2019 evaluating statistical relationshipsbetween environmental indicators including temperature, depth, and zooplankton community composition and
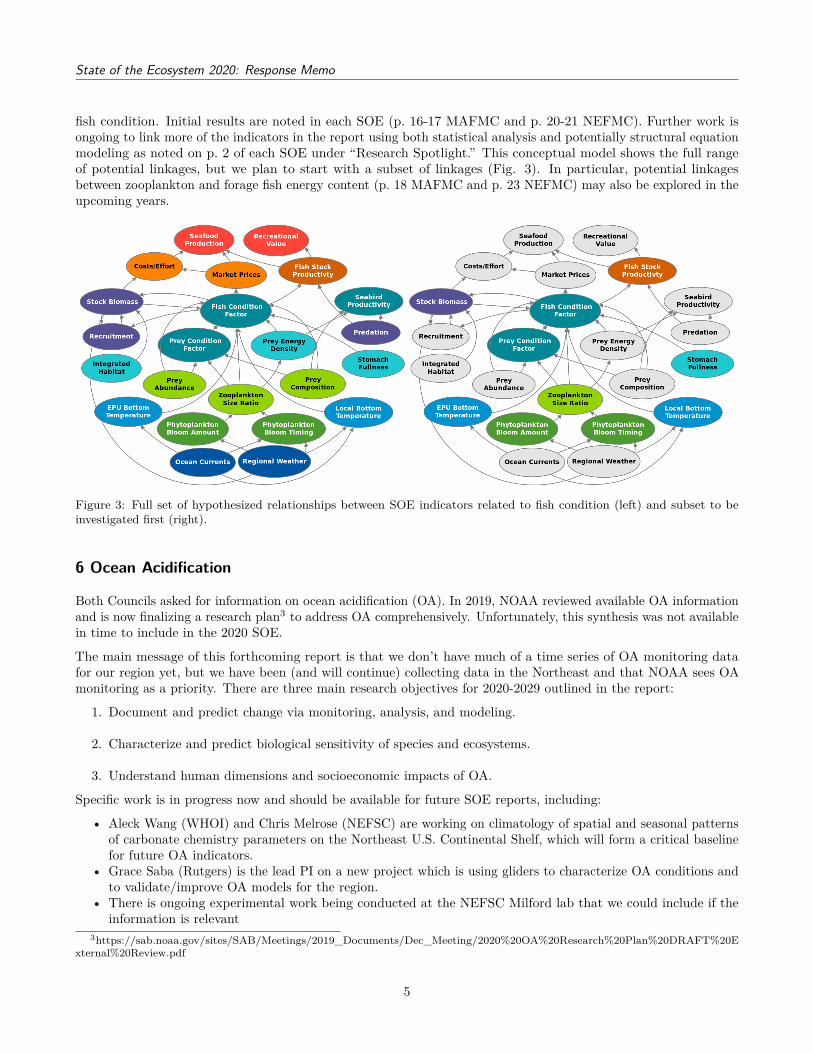
fish condition. Initial results are noted in each SOE (p. 16-17 MAFMC and p. 20-21 NEFMC). Further work isongoing to link more of the indicators in the report using both statistical analysis and potentially structural equationmodeling as noted on p. 2 of each SOE under “Research Spotlight.” This conceptual model shows the full rangeof potential linkages, but we plan to start with a subset of linkages (Fig. 3). In particular, potential linkagesbetween zooplankton and forage fish energy content (p. 18 MAFMC and p. 23 NEFMC) may also be explored in theupcoming years.
Figure 3: Full set of hypothesized relationships between SOE indicators related to fish condition (left) and subset to beinvestigated first (right).
6 Ocean Acidification
Both Councils asked for information on ocean acidification (OA). In 2019, NOAA reviewed available OA informationand is now finalizing a research plan3 to address OA comprehensively. Unfortunately, this synthesis was not availablein time to include in the 2020 SOE.
The main message of this forthcoming report is that we don’t have much of a time series of OA monitoring datafor our region yet, but we have been (and will continue) collecting data in the Northeast and that NOAA sees OAmonitoring as a priority. There are three main research objectives for 2020-2029 outlined in the report:
1. Document and predict change via monitoring, analysis, and modeling.
2. Characterize and predict biological sensitivity of species and ecosystems.
3. Understand human dimensions and socioeconomic impacts of OA.
Specific work is in progress now and should be available for future SOE reports, including:
• Aleck Wang (WHOI) and Chris Melrose (NEFSC) are working on climatology of spatial and seasonal patternsof carbonate chemistry parameters on the Northeast U.S. Continental Shelf, which will form a critical baselinefor future OA indicators.
• Grace Saba (Rutgers) is the lead PI on a new project which is using gliders to characterize OA conditions andto validate/improve OA models for the region.
• There is ongoing experimental work being conducted at the NEFSC Milford lab that we could include if theinformation is relevant
Until a climatology and time series of OA measurements is available for comparison, we can include other informationon OA in the SOE as it becomes available. We welcome feedback and suggestions from the SSC and Council onwhat information would be most useful.
7 Gulf Stream and Labrador Current
Both Councils were interested in large scale ocean current interactions and requested additional information on theGulf Stream Index and Labrador current. We have expanded this section and included information on both GulfStream warm core rings (see point 11) and on the decreasing proportion of Labrador Current water entering theGulf of Maine in both SOE reports this year (p. 20-22 MAFMC and p. 24-26 NEFMC).
8 Primary Production Source
The NE SSC asked that we include sources for primary production estimates (satellite vs in situ). We have noted inthe SOE that primary production and chlorophyll estimates are satellite-derived (p. 25 MAFMC and p. 31 NEFMC),and continue to include full methods in our technical documentation4.
9 Shellfish Growth
The MAFMC requested that we investigate how shellfish growth and distribution information could be linked toclimate indicators and possibly ecosystem productivity. While this request was beyond our capacity to addressthis year, we are working with Dr. Roger Mann to host his student working on shellfish growth at NEFSC and tofacilitate integration of SOE climate indicators with this work later this year or early next.
10 Power Plants
The MAFMC requested that we investigate estuarine condition relative to power plants and plant-driven changes inwater temperature. This request was beyond our capacity to address this year. However, we have initiated work onestuarine water quality in general (see point 13).
11 Warm Core Rings
The MA SSC requested information on the frequency and occurrence of Gulf Stream warm core rings. We haveadded an indicator based on [3], [4],and [5] to both SOE reports (p. 20-21 MAFMC and p. 24-25 NEFMC). Wewelcome further comments on the utility of this new indicator.
12 Cold Pool Index
The MA SSC requested a cold pool index. We have added an indicator of cold pool temperature to the MAFMCSOE report, because the cold pool was considered most relevant to the MAB EPU (p. 23 MAFMC). However, if theNEFMC is interested in this index (because some managed species such as winter flounder occupy this habitat) wecan include it in future NEFMC SOE reports. We welcome further comments on the utility of this new indicator.
The MAFMC requested information on nutrient inputs and water quality near shore and in estuaries. Whilethe Chesapeake water quality index from the 2019 report was not yet updated by the contributor, we includedinformation on the Chesapeake Bay low salinity event in 2018-2019 with notes on how it affected Chesapeake Bayliving resources in the SOE (p. 19-20 MAFMC).
This year we started a collaboration with the National Esturarine Research Reserve (NERR) network to assembleinformation. Here we provide examples of the types of information available and ask for feedback on what type ofinformation would be most useful.
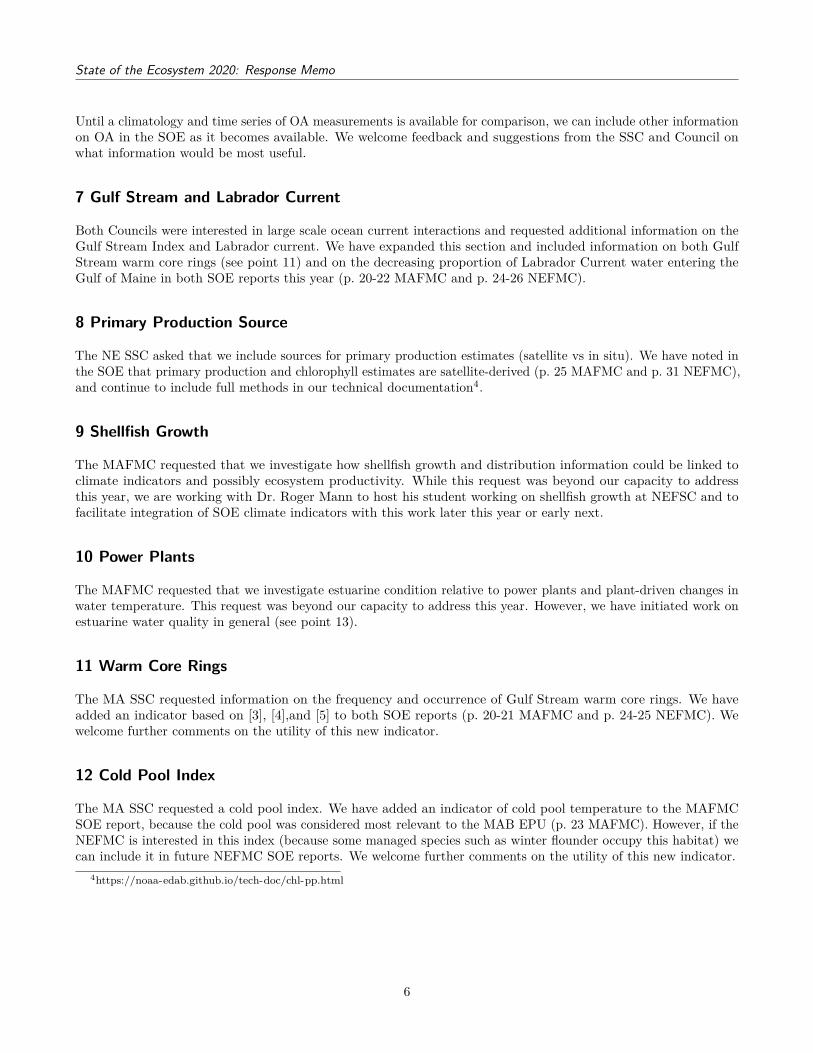
There are NERRs all around the US (Fig. 4), so the first decision is which ones to include. A reasonable startingpoint might be all of the NERRs from ME to NC, but other locations may be of interest. Then, status for a certainindicator could be mapped across all of the selected NERRs as in Fig. 4.
Figure 4: National Estuarine Research Reserve locations in the US, with trend indicators for an example metric: Trianglepointing up = increasing trend; Triangle pointing down = decreasing trend, Flat line = no trend.
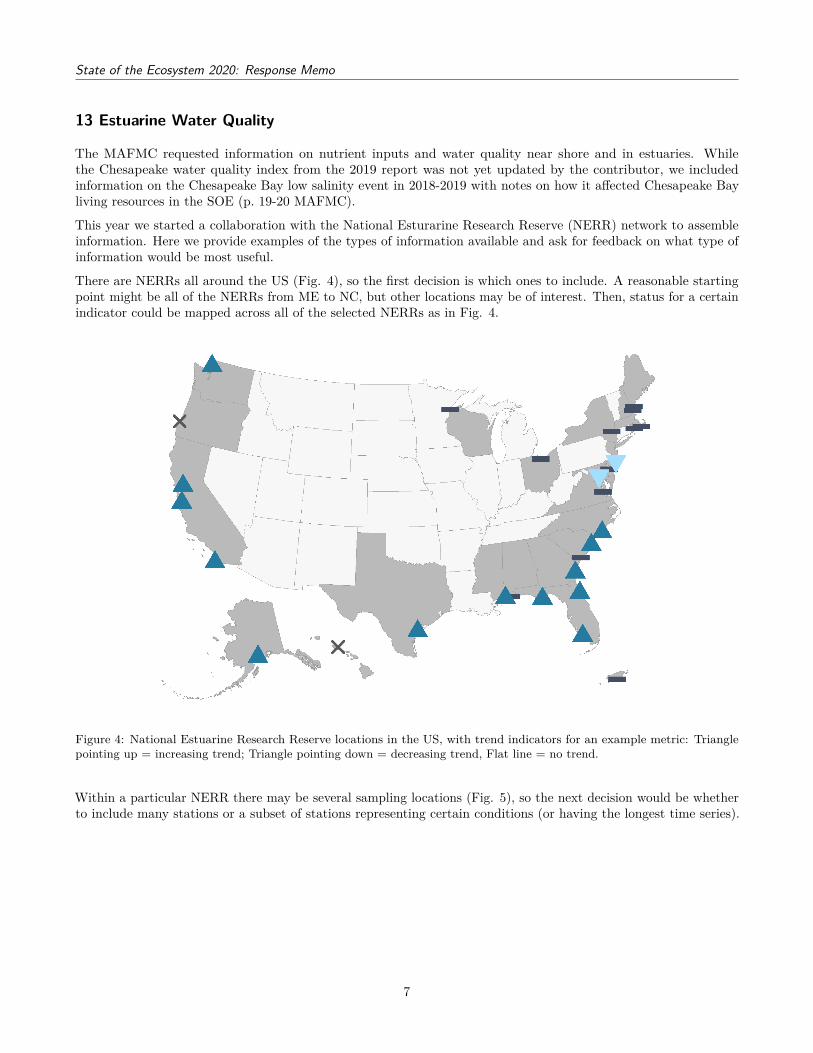
Within a particular NERR there may be several sampling locations (Fig. 5), so the next decision would be whetherto include many stations or a subset of stations representing certain conditions (or having the longest time series).
7
State of the Ecosystem 2020: Response Memo
Figure 5: Waquit Bay National Estuarine Research Reserve map with sampling locations.
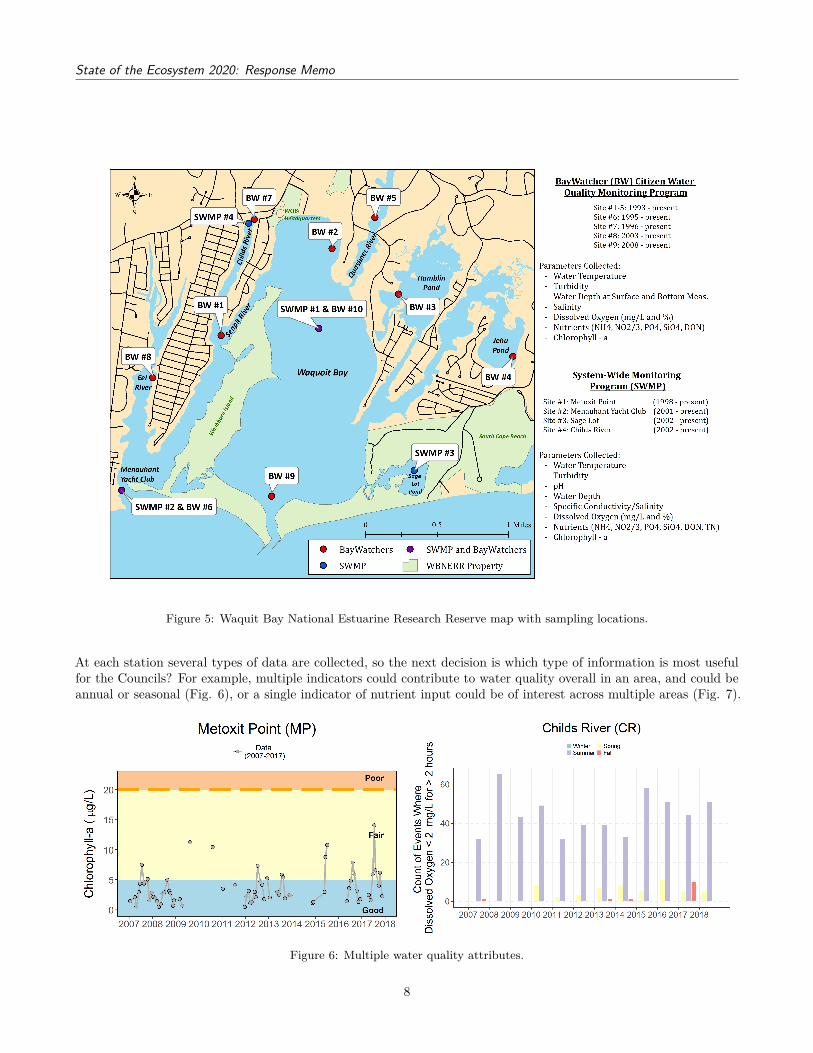
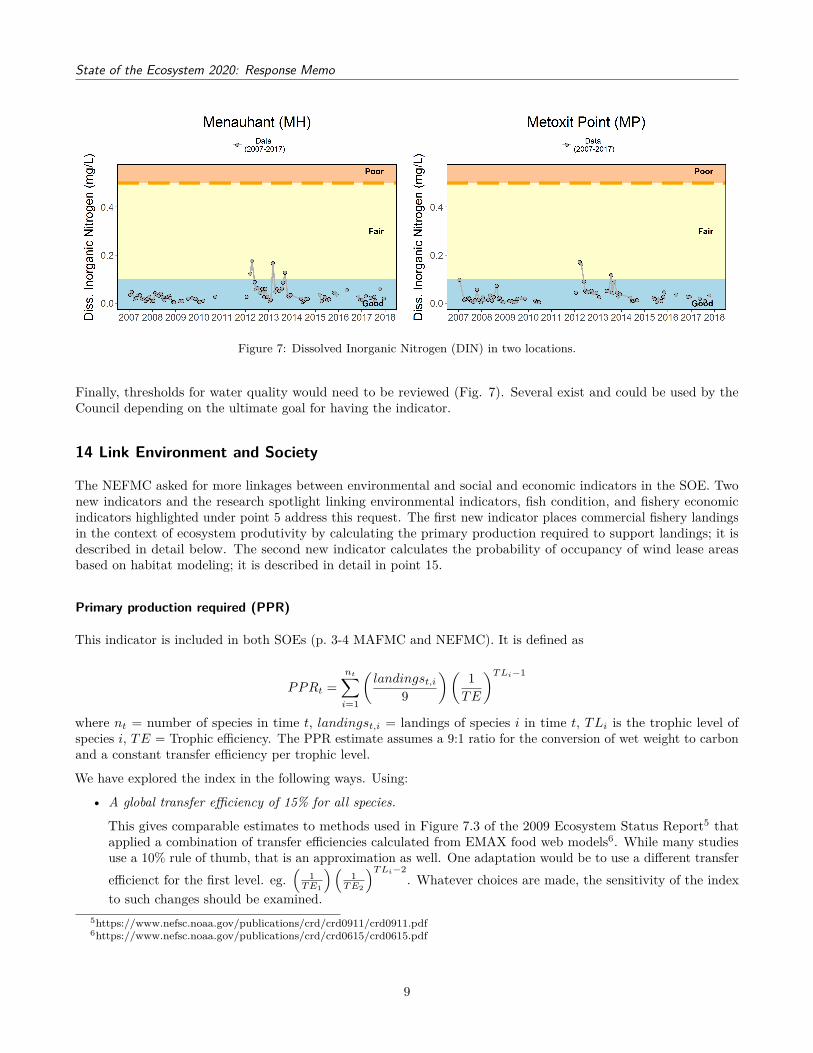
At each station several types of data are collected, so the next decision is which type of information is most usefulfor the Councils? For example, multiple indicators could contribute to water quality overall in an area, and could beannual or seasonal (Fig. 6), or a single indicator of nutrient input could be of interest across multiple areas (Fig. 7).
Figure 6: Multiple water quality attributes.
8
State of the Ecosystem 2020: Response Memo
Figure 7: Dissolved Inorganic Nitrogen (DIN) in two locations.
Finally, thresholds for water quality would need to be reviewed (Fig. 7). Several exist and could be used by theCouncil depending on the ultimate goal for having the indicator.
14 Link Environment and Society
The NEFMC asked for more linkages between environmental and social and economic indicators in the SOE. Twonew indicators and the research spotlight linking environmental indicators, fish condition, and fishery economicindicators highlighted under point 5 address this request. The first new indicator places commercial fishery landingsin the context of ecosystem produtivity by calculating the primary production required to support landings; it isdescribed in detail below. The second new indicator calculates the probability of occupancy of wind lease areasbased on habitat modeling; it is described in detail in point 15.
Primary production required (PPR)
This indicator is included in both SOEs (p. 3-4 MAFMC and NEFMC). It is defined as
PPRt =nt∑
i=1
(landingst,i
9
)(1
TE
)T Li−1
where nt = number of species in time t, landingst,i = landings of species i in time t, TLi is the trophic level ofspecies i, TE = Trophic efficiency. The PPR estimate assumes a 9:1 ratio for the conversion of wet weight to carbonand a constant transfer efficiency per trophic level.
We have explored the index in the following ways. Using:
• A global transfer efficiency of 15% for all species.
This gives comparable estimates to methods used in Figure 7.3 of the 2009 Ecosystem Status Report5 thatapplied a combination of transfer efficiencies calculated from EMAX food web models6. While many studiesuse a 10% rule of thumb, that is an approximation as well. One adaptation would be to use a different transferefficienct for the first level. eg.
(1
T E1
)(1
T E2
)T Li−2. Whatever choices are made, the sensitivity of the index
to such changes should be examined.5https://www.nefsc.noaa.gov/publications/crd/crd0911/crd0911.pdf6https://www.nefsc.noaa.gov/publications/crd/crd0615/crd0615.pdf
This is probably not realistic. You wouldn’t expect to see changes in the landing the same year as changes inprimary production. This needs to be explored, either using specific lags in time (which may prove problematicsince species lower on the food chain will be effected by shorter lags in time versus species higher up the chain)or by adopting some weighted scheme.
• A threshold of 80% for landings.
It would be a good idea to explore the sensitivity of the index for other threshold levels. Of course the higherthe threshold used would imply that less common species will then contribute to the index.
• Combined vertebrates and invertebrates.
The landings in some of the EPUs are dominated by invertebrates (Lobster, Clams) which may play a significantpart in driving this index. Creating two additional indices, one for vertebrates and one for invertebrates maybe an interesting avenue. This will of course imply the inclusion of many other lesser caught species into theindex. It will also involve partitioning the landings into vertebrates and invertebrates.
Other comments
• Some classifications in the commercial fisheries database are not at the species level. Some are Genus, Familyor even higher orders, some are just general unclassified. eg. (DOGFISH, UNC, FLATFISH, Argentinidae).Most of these cases are associated with lower landings. However if we increase the threshold and/or splitlandings into vertebrates and invertebrates we will encounter more of these classifications. They will need tobe assigned a trophic level which may cause complications and/ or subjective decision making.
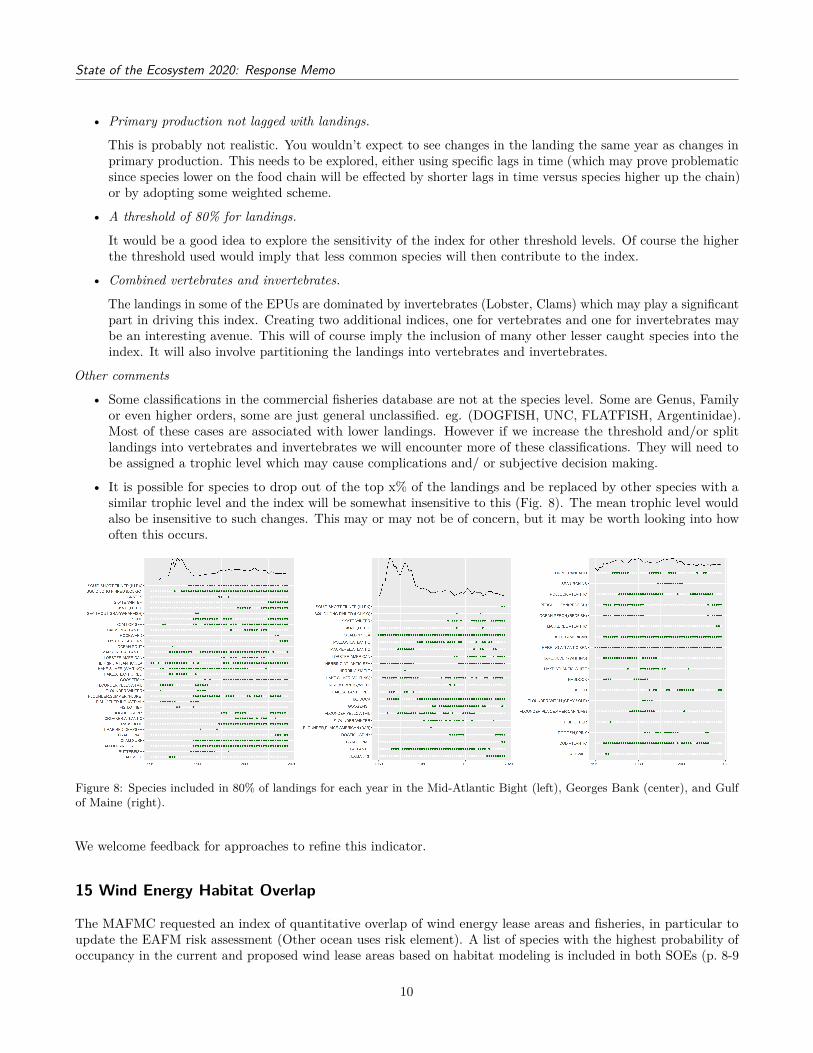
• It is possible for species to drop out of the top x% of the landings and be replaced by other species with asimilar trophic level and the index will be somewhat insensitive to this (Fig. 8). The mean trophic level wouldalso be insensitive to such changes. This may or may not be of concern, but it may be worth looking into howoften this occurs.
Figure 8: Species included in 80% of landings for each year in the Mid-Atlantic Bight (left), Georges Bank (center), and Gulfof Maine (right).
We welcome feedback for approaches to refine this indicator.
15 Wind Energy Habitat Overlap
The MAFMC requested an index of quantitative overlap of wind energy lease areas and fisheries, in particular toupdate the EAFM risk assessment (Other ocean uses risk element). A list of species with the highest probability ofoccupancy in the current and proposed wind lease areas based on habitat modeling is included in both SOEs (p. 8-9
10
State of the Ecosystem 2020: Response Memo
MAFMC and p. 9 NEFMC). This indicator can be refined to meet the needs of both Councils. In future reports weplan to include the overlap of current fisheries with wind lease areas as well.
16 Other Social Science Indicators
The NE SSC asked that we include links to NMFS Social Science indicator websites. These links have been includedin both reports (p. 8 MAFMC and p. 9 NEFMC).
17 Management Complexity
The MAFMC asked for indicators of management complexity for use in the EAFM risk assessment. An NEFSCsummer student started work on this in 2018, but we have lacked capacity to finish the project since then. Ifresources allow we will continue the project, and guidance for further indicator developmet is welcome.
18 SAFMC and ASMFC Species
The MAFMC asked that South Atlantic Council and Atlantic States Marine Fisheries Commission-managed speciesbe represented in recreational catch diversity indices. This has been done and the updated indicator is included inboth SOE reports (p. 7-8 MAFMC and NEFMC).
In addition, NEFSC survey data was analyzed to determine if South Atlantic Council-managed species have becomemore common in the survey over time. This indicator has also been included in both SOE reports (p. 14-15 MAFMCand p. 15-16 NEFMC).
19 Conceptual Model Social Elements
The NEFMC requested that social elements from the overview conceptual model shown in presentations be added tothe New England conceptual model included in the printed SOE report. While this would be a useful update, all ofthe previous conceptual models have been replaced by different summary visualizations requested by the Councils(see points 1 and 2).
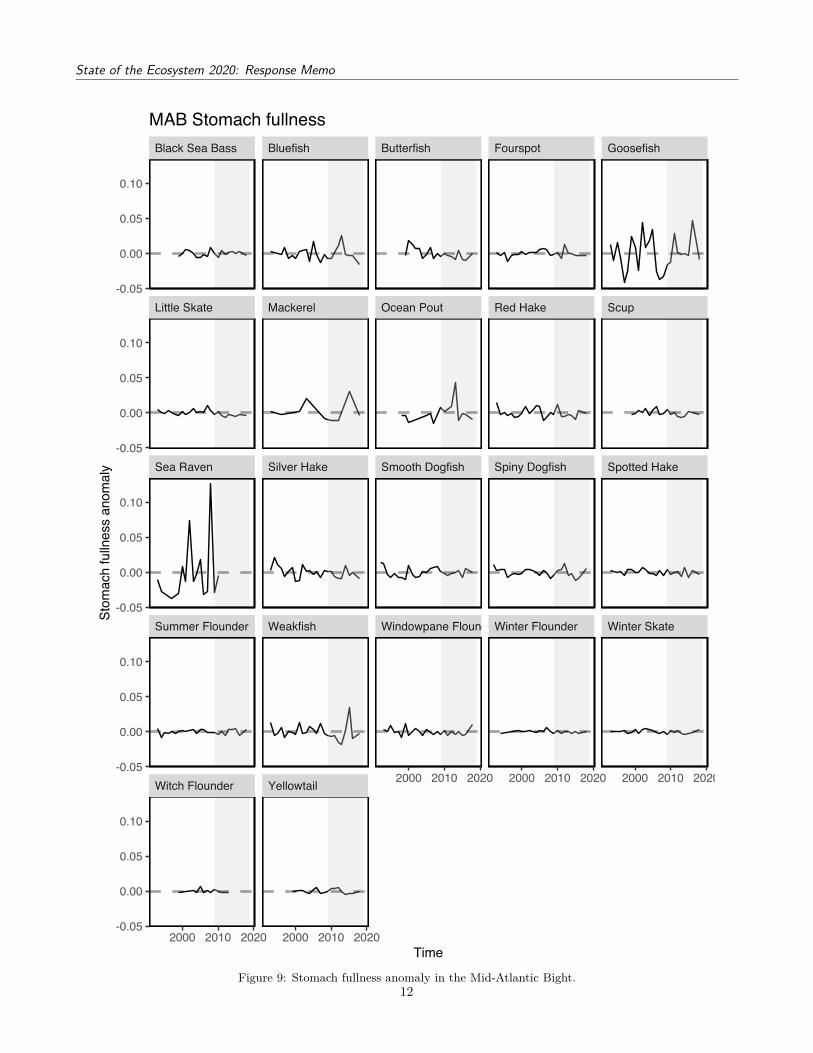
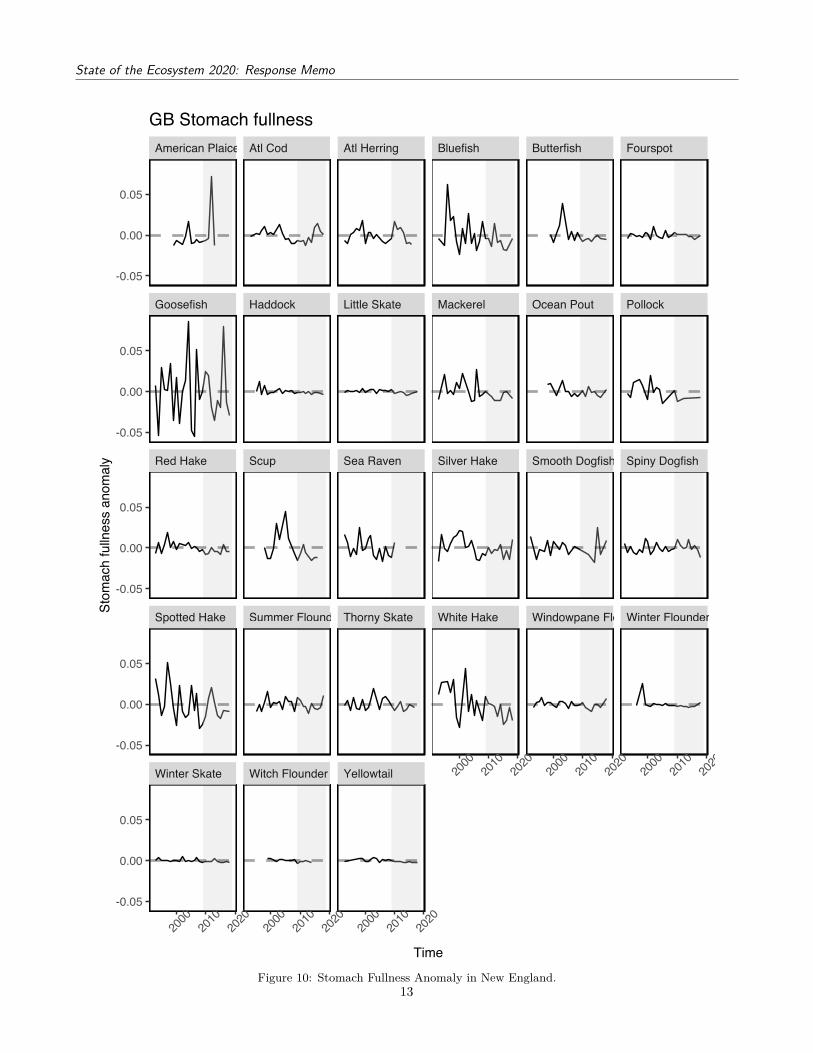
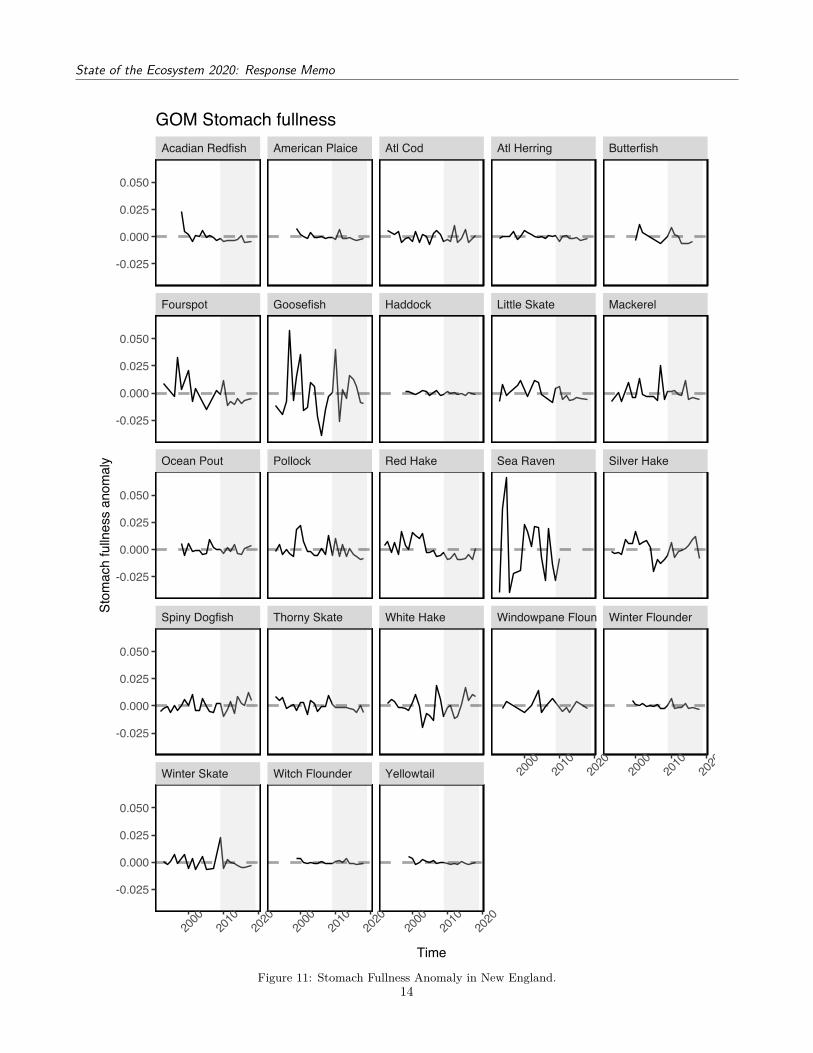
20 Fish Diet Indicators
Both Councils were interested in indicators related to fish diet data. For example, average weight of diet componentsby feeding group, and mean stomach weight across feeding guilds were mentioned. We initiated exploratory analysisof diet information this year, and present examples of the types of information available to seek feedback on how theCounicls would like indicators developed further.
On NEFSC surveys, most stomach estimates are taken as a volume measure, but there is a standard conversionincluded in the diet database that gives an approximate stomach weight. This estimated stomach weight was usedto calculate stomach fullness (a ratio of stomach weight to fish weight for non-empty stomach samples). Stomachfullness may be a better measure than absolute stomach weight if combining across species into a feeding guild,otherwise big animals with heavier stomachs will dominate the index. Here, stomach fullness was expressed as anannual anomaly for each species in each region. This shows which species have adequate data for inclusion in atime series, and suggests there are not obvious common stomach fullness anomalies across species. We welcomesuggestions to clarify methods and objectives for fish stomach data indicators.
Goosefish Haddock Little Skate Mackerel Ocean Pout Pollock
American Plaice Atl Cod Atl Herring Bluefish Butterfish Fourspot
2000
2010
2020
2000
2010
2020
2000
2010
2020
2000
2010
2020
2000
2010
2020
2000
2010
2020
-0.05
0.00
0.05
-0.05
0.00
0.05
-0.05
0.00
0.05
-0.05
0.00
0.05
-0.05
0.00
0.05
Time
Sto
ma
ch
fu
llne
ss a
no
ma
lyGB Stomach fullness
Figure 10: Stomach Fullness Anomaly in New England.13
State of the Ecosystem 2020: Response Memo
Winter Skate Witch Flounder Yellowtail
Spiny Dogfish Thorny Skate White Hake Windowpane FlounderWinter Flounder
Ocean Pout Pollock Red Hake Sea Raven Silver Hake
Fourspot Goosefish Haddock Little Skate Mackerel
Acadian Redfish American Plaice Atl Cod Atl Herring Butterfish
2000
2010
2020
2000
2010
2020
2000
2010
2020
2000
2010
2020
2000
2010
2020
-0.025
0.000
0.025
0.050
-0.025
0.000
0.025
0.050
-0.025
0.000
0.025
0.050
-0.025
0.000
0.025
0.050
-0.025
0.000
0.025
0.050
Time
Sto
ma
ch
fu
llne
ss a
no
ma
lyGOM Stomach fullness
Figure 11: Stomach Fullness Anomaly in New England.14
State of the Ecosystem 2020: Response Memo
21 Right Whale Calves
The NEFMC requested a North Atlantic Right Whale calf production indicator. This indicator has been added toboth SOE reports (p. 10-11 MAFMC and NEFMC).
22 Distinguish Managed Species
The NEFMC requested that managed species be distinguished in the report. Both SOE reports summarize landingsas a whole and by Council-managed species in aggregate (p. 4-5 MAFMC and p. 4-6 NEFMC). A table listingwhich species are managed by which entity is included in each SOE report (Table 4 in both reports). Status ofCouncil-managed species is reported in each SOE (p. 30 MAFMC and p. 38 NEFMC) with jointly managed speciesindicated.
23 Marine Mammal Consumption
The MAFMC was interested in estimates of marine mammal consumption. While there have been no updated reportsof total marine mammal consumption for the US Northeast Shelf ecosystem since 2015 [6], new diet studies are inprogress. We included updated information on seal diets in both SOE reports (p. 11-12 MAFMC and NEFMC).Once completed, these diet studies combined with mammal population estimates could be used to update marinemammal consumption estimates.
24 Small Pelagic Abundance
The MAFMC requested indices of small pelagic abundance. While the SOE includes survey biomass estimates ofplanktivores (p. 15-16 MAFMC and p. 16-20 NEFMC), we would like to improve on these indices. Combining surveyinformation using VAST models as described under point 3 may improve indices for small pelagics, but species notsampled by bottom trawl surveys remain problematic. We welcome feedback on other sources of information toaddress small pelagic abundance.
Forage energy content is another important consideration which may affect predators as much as fluctuations inabundance. This year we have included initial information on forage energy content in the SOE reports (p. 18MAFMC and p. 23 NEFMC) which highlights the potential for seasonal and interannual variability in energy content.We plan to develop forage energy content indicators as this time series develops, and welcome feedback on how bestto do so.
25 Young of Year Index
The MA SSC was interested in a young of year index from multiple surveys. We have included the fish productivityindex in both SOE reports (p. 17-18 MAFMC and p. 21-23 NEFMC), which calculates the number of small fish perbiomass of large fish of the same species from NEFSC surveys. This index has been reported previously to MAFMC,and intermittently to NEFMC. We recognize that this is not strictly a young of year index, and it is from a singlesurvey. We seek guidance from the SSC on how to refine this index; would a similar index of small fish numbers tolarge fish biomass from the NEAMAP survey data be useful? Or would an index of young of year without biomassof larger fish be more useful? If so, how would we best combine species or select species for the index? And shouldwe try to combine surveys or report them separately?
26 Shark Biomass
The MAFMC requested information on biomass of sharks, as fishermen had reported encountering more blacktip,spinner, and sandbar sharks each summer. We were able to obtain catch data from the Highly Migratory Species
15
State of the Ecosystem 2020: Response Memo
group at NMFS Headquarters for the past 3 years, and the group is working on assembling a longer time series forfuture reports. We did not print the 3 year time series in the SOE reports, but visualizations are available along withother commercial landings7. To date, we have been unable to get biomass information on sharks at the coastwidelevel. We welcome suggestions for sources of this information.
27 Trawl Survey Species Diversity
The NE SSC requested a species diversity metric based on NEFSC trawl survey data. We have included such ametric in past reports (2017), but were concerned that apparent differences in diversity prior to and after 2008 maybe driven by differences in survey vessels. While species-specific cpue and sizes have calibration coefficents betweensurvey vessels, the number of species captured by the vessels has no known calibration coefficient.
We could calculate diversity indices for Albatross and Bigelow years separately to avoid this issue, and will do so ifthe Councils would find these separate indices useful.
28 Ecosystem Risk Score
The MAFMC requested work towards an ecosystem-level risk score. This system level score could augmentinformation on individual risk elements already included in the MAFMC EAFM risk assessment, which is updatedannually. Multiple indicators could be combined to form an integrated risk score (as discussed by the MAFMCEcosystem and Ocean Planning Committee when evaluting this EAFM risk assessment), and many integrated scoreshave been suggested in the scientific literature. We seek further guidance on how best to develop an integratedecosystem risk score for the MAFMC and NEFMC.
In the meantime, the primary production required to support landings introduced in this year’s SOEs (p. 3-4MAFMC and NEFMC, and see point 14 above) may contribute to an overall ecosystem risk score. While there isno established threshold for primary production required, fisheries would likely pose higher ecosystem risk if theyrequire very high proportions of primary production. We welcome comments and suggestions from the Councils tocontinue this work.
Similarly, the new SOE marine heat wave indicator (p. 23-25 MAFMC and p. 28-31 NEFMC) may contribute toan overall ecosystem risk score from a climate/environmental perspective, as it measures the frequency of extremetemperature conditions in each EPU which pose risks to ecological and fishing communities. This could be integratedwith existing climate vulnerability information and/or other report indicators to assess risk. Ultimately, the Council’sobjectives for this risk score will determine the components used.
29 Thresholds and Inflection Points
Both Councils have been interested in ecosystem-level thresholds and determining where indicators reach inflectionpoints, suggesting changes in trends of concern. The SOEs include statistical analysis to determine where indicatorshave significant increasing or decreasing trends. However, based on a recent simulation analysis, we are confident intrend assessment only for time series of 30 years or more [7].
Where evidence is strong for shifts, we have looked at state changes rather than trends. The new Gulf Stream warmcore ring indicator (p. 20-21 MAFMC and p. 24-25 NEFMC, and see point 11 above) shows a state change in warmcore ring production based on a recent publication [5].
Some SOE indicators, such as the new marine heat wave cumulative intensity indicator in the Gulf of Maine (SOEFigure 35 on p. 29 NEFMC) have both significant trends and visually obvious shifts that could reflect a change instate for that indicator, which could be confirmed with further statistical analysis. Work is ongoing to determinestatistically where shifts or changepoints across multiple indicators have ocurred, but was not ready for inclusion inthis year’s reports. We welcome comments and guidance from the Councils on the types of analysis that would bemost useful: changepoints for individual indicators, or across many indicators, or both?
1. Zador SG, Holsman KK, Aydin KY, Gaichas SK. Ecosystem considerations in Alaska: The value of qualitativeassessments. ICES Journal of Marine Science: Journal du Conseil. 2016; fsw144. doi:10.1093/icesjms/fsw144
2. Thorson JT. Guidance for decisions using the Vector Autoregressive Spatio-Temporal (VAST) package in stock,ecosystem, habitat and climate assessments. Fisheries Research. 2019;210: 143–161. doi:10.1016/j.fishres.2018.10.013
3. Andres M. On the recent destabilization of the Gulf Stream path downstream of Cape Hatteras. GeophysicalResearch Letters. 2016;43: 9836–9842. doi:10.1002/2016GL069966
4. Gawarkiewicz G, Todd R, Zhang W, Partida J, Gangopadhyay A, Monim M-U-H, et al. The Chang-ing Nature of Shelf-Break Exchange Revealed by the OOI Pioneer Array. Oceanography. 2018;31: 60–70.doi:10.5670/oceanog.2018.110
5. Gangopadhyay A, Gawarkiewicz G, Silva ENS, Monim M, Clark J. An Observed Regime Shift in the Formationof Warm Core Rings from the Gulf Stream. Scientific Reports. 2019;9: 1–9. doi:10.1038/s41598-019-48661-9
6. Smith LA, Link JS, Cadrin SX, Palka DL. Consumption by marine mammals on the Northeast U.S. Continentalshelf. Ecological Applications. 2015;25: 373–389. doi:10.1890/13-1656.1
7. Hardison S, Perretti CT, DePiper GS, Beet A. A simulation study of trend detection methods for integratedecosystem assessment. ICES Journal of Marine Science. 2019;76: 2060–2069. doi:10.1093/icesjms/fsz097