Page 1
www.elsevier.com/locate/tecto
Tectonophysics 379 (2004) 183–198
Striated and pitted pebbles as paleostress markers: an example from
the central transect of the Betic Cordillera (SE Spain)
Patricia Ruano*, Jesus Galindo-Zaldıvar
Departamento de Geodinamica, Universidad de Granada, Fuentenueva s/n, 18071 Granada, Spain
Received 19 May 2003; accepted 3 November 2003
Abstract
Striated and pitted pebbles provide scarce structures that preserve information on the stresses that their host rocks have
undergone. This information can be obtained by the measurement of a large number of microfaults with striae and solution
marks within a small rock volume. For non-rotational deformation, the statistical procedures for microfault analysis provide a
valid tool for determining the overprinting of successive stress ellipsoids, including their axial ratios and the orientations of the
main axes. The trends of compressions obtained from striae can be compared with the determinations from the pole of pebble
solution pits. However, in complex tectonics settings, the solution pits of several deformation phases are mixed and only striae
analysis allows overprinted paleostresses to be accurately distinguished. The analysis of several pebbles from the same outcrop,
including five from moderately complex settings, allows determination of the homogeneity of the paleostresses at outcrop scale,
the detection of redeposited pebbles, and supports the results of microtectonic analysis for large areas. Solution mark
distributions on pebbles depend on the burial and tectonic stresses. Conglomerates from shallow levels, such as those from
Quaternary fluvial terraces, only record horizontal compressional solution marks because the minimum vertical stress needed to
develop these structures are not reached by burial.
In the central Betic Cordillera, striated and pitted pebbles are composed of carbonate surrounded by a matrix containing
siliciclastic elements. The study of several outcrops located across a transect of the Cordillera shows a change in the recent stress
field. While conglomerates near the Internal–External zone boundary show extensional stresses that may be related to the uplift
of the Cordillera since Tortonian times, the outcrops located in the External Zone and up to the mountain front indicate the
existence of horizontal NW–SE and NE–SW compressions related to prolate ellipsoids. These two compression directions,
which affect conglomerates up to the Quaternary in the same outcrop, may be produced by a local permutation of stress axes,
which in general indicates NW–SE compression related to the Eurasia–Africa plate boundary convergence, but which locally
may switch to an orthogonal compression.
D 2004 Elsevier B.V. All rights reserved.
Keywords: Striated pebbles; Pitted pebbles; Paleostress determination; Betic cordillera; Stress permutation
0040-1951/$ - see front matter D 2004 Elsevier B.V. All rights reserved.
doi:10.1016/j.tecto.2003.11.001
* Corresponding author. Tel: +34-958243351; fax: +34-
958248527.
E-mail address: [email protected] (P. Ruano).
1. Introduction
Striae, solution pits, and polished surfaces on
pebbles, in spite of their low abundance, have been
recognized since the end of the 19th century (Werner,
1802; Hughes, 1895). Such features have generally
Page 2
P. Ruano, J. Galindo-Zaldıvar / Tectonophysics 379 (2004) 183–198184
been grouped under the collective heading of striated
pebbles, because they generally develop together and
until the last quarter of the 20th century, work was
mainly focussed on their origin (Judson and Barks,
1961). Although there are many processes that may
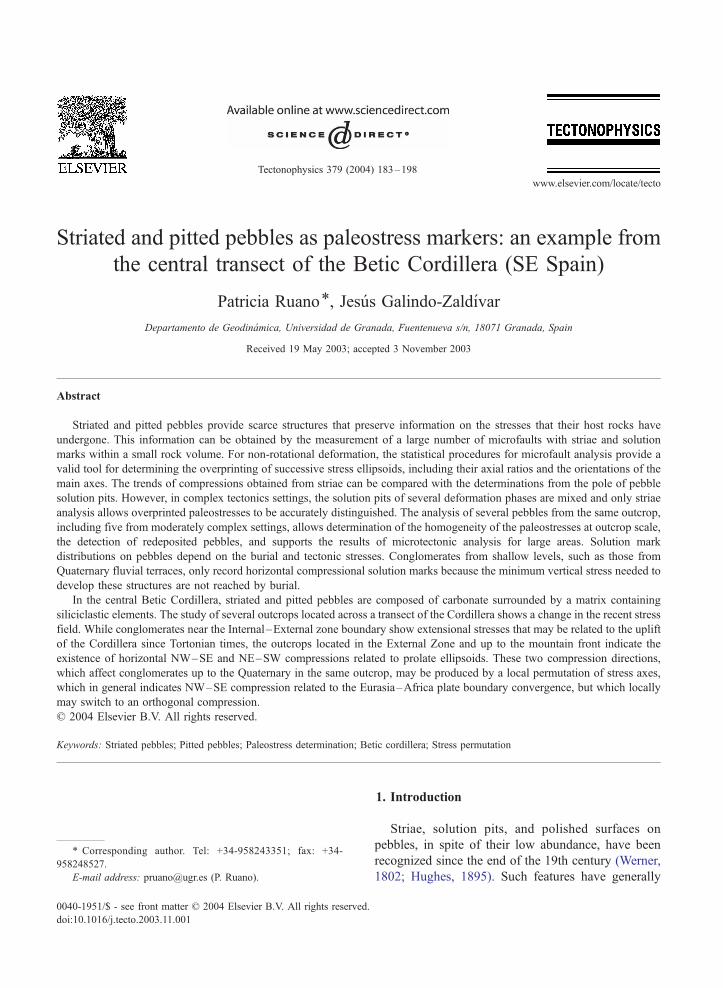
Fig. 1. (a) Geological setting of the Betic-Rif Cordillera. (b) Location of stu
(A), Manzanil (M), Trinchera (T), Tocon (TO), Pinos (P), Trevenque (TR
produce striae, such as wind or water currents, an
origin due to tectonic motion or compaction has been
suggested for most examples. Polished surfaces and
striae can form as a consequence of the relative
motion of small sized abrasive matrix particles against
died outcrops in the central transect of the Betic Cordillera. Alhama
), Alcala (AL) and Jaen (J).
Page 3
P. Ruano, J. Galindo-Zaldıvar / Tectonophysics 379 (2004) 183–198 185
the pebble surface. The degree of polish is higher on
planar surfaces, as well as in hard pebbles in contact
with fine grained matrix (Clifton, 1965).
Solution marks are found on the contact between
carbonate pebbles and result from pressure solution
processes (Sorby, 1863; Trurnit, 1968). The develop-
ment of solution pits in carbonate pebbles requires a
minimum pressure of 10 MPa (McEwen, 1978).
Photoelastic experiments indicate that the stress
increases above the mean stress in the contacts among
neighbouring pebbles (e.g. Stromgard, 1973; Ramsay
and Lisle, 2001), and this could facilitate pressure
solution. Additionally, the siliciclastic matrix particles
may create solution pits in the pebble surfaces (Este-
vez et al., 1982). The trend of the maximum com-
pression can be determined from solution marks that
coincide with the pole of convergence of the striae on
pebbles (Sanz de Galdeano and Estevez, 1981;
Schrader, 1988). These structures have been used in
regional studies, such as in the Nice Arch area
(Campredon et al., 1977) and within the Betic Cor-
dillera (Sanz de Galdeano, 1980; Estevez et al., 1982).
The surface of the pebbles represents a weak
discontinuity that aids brittle deformation. Faults that
affect conglomerate layers have segments that are
preferentially located along pebble surfaces and can
be used for paleostress determinations (Petit et al.,
1985; Hippolyte, 2001). In these cases, the striae in
the pebbles are restricted to the surfaces that are in
contact with the fault. The study of the striae orienta-
tions on pebble surfaces has been mainly developed
from a theoretical point of view (Schrader, 1988;
Taboada, 1993). Although, at first glance, striae all
around a pebble can be seen as forced, being incom-
patible with Bott’s equation, when matrix has a brittle
behaviour, theoretical models have been based on the
Bott (1959) equation and consider a single stress state
that affects a pebble of spherical shape. In non-
rotational deformation settings, elements of symmetry
for striae orientations coincide with the main axes of
stress and strain ellipsoids and the striae pattern varies
relative to the axial ratio of the stress ellipsoids
(Schrader, 1988; Taboada, 1993). However, these
authors did not develop practical applications for
paleostress determinations. The only extensive at-
tempt to determine paleostress ellipsoids from striated
pebbles was done by Rodrıguez-Pascua and de Vice-
nte (1998) in conglomerates from the Iberian Moun-
tain range (NE Spain) and this was unsuccessful due
to the scarce amount of measured data and hetero-
geneities that produce poor analytical solutions.
The main aim of this contribution is to analyze, in
practice, the suitability of striated and pitted pebbles
developed in non-rotational deformation fields for
determining paleostresses in moderately complex
regions and discuss the problems that arise. A second
goal of this study is to present new data on recent
paleostresses across the Betic Cordillera that may
contribute to understanding of the mechanisms of
deformation that have been active during its recent
evolution.
Striated pebbles have been found in several outcrops
located across a central transect through the Betic
Cordillera (Fig. 1). The Betic and Rif Cordillera are
Alpine mountain chains located in the western Medi-
terranean at the Eurasian–African plate boundary.
In this region, there has been recent NW–SE conver-
gence of about 4 mm/year (DeMets et al., 1990). The
Betic Cordillera shows a complex evolution that
includes post-Tortonian uplift related to normal
faulting in the Internal Zone and mainly NW–SE
compression, in the External Zone (Galindo-Zaldıvar
et al., 1993; Ruano et al., in press), as in the
foreland (Jabaloy et al., 2003). The present-day
stress field reconstructed from earthquake focal
mechanisms indicates complex heterogeneous
stresses, including simultaneous extension and com-
pression in neighbouring areas (Galindo-Zaldıvar et
al., 1999; Ruano et al., 2000).
2. Geological setting of striated and pitted pebble
outcrops
The Betic Cordillera is formed by Internal and
External zones, which are differentiated by the degree
of metamorphism and the age of the rocks (Fig. 1a).
The Internal Zone is formed by the superposition of
several metamorphic complexes extending back to the
Paleozoic. ‘‘Flysch’’ units crop-out between the Inter-
nal and External zones. The External Zone is formed
by mainly carbonate rocks of Mesozoic and Cenozoic
age grouped in several tectonic units.
In order to determine the recent stress field across
the chosen transect of the Betic Cordillera (Fig. 1),
conglomerates belonging to Neogene Basins, with
Page 4
P. Ruano, J. Galindo-Zaldıvar / Tectonophysics 379 (2004) 183–198186
ages ranging from Burdigalian up to the Quaternary
have been examined to see if they contain striated
pebbles. We have studied conglomerates from differ-
ent tectonic settings, ranging from near the Internal–
External zone boundary to the foreland basin. These
conglomerates have undergone a variable burial and
tectonic history, which allows one to check the meth-
odology. All the striated pebbles are carbonates,
mainly limestone, and in general, they show a low
degree of cementation.
The southernmost outcrops are located in the
Granada depression (Fig. 1b), which was filled by
Miocene and Quaternary detrital rocks, marls, calcar-
enites and lacustrine limestones. This depression may
be considered as a half-graben bounded to the north
and east by normal faults (Ruano et al., 2000).
The Trevenque outcrop (Fig. 1b) is located in
Tortonian conglomerates interlayered with marine
calcarenites belonging to the basal levels of the
Granada Basin fill and is located within the Internal
Zone of the Betic Cordillera. It is a pebble-supported
conglomerate, with bedding dipping at a low angle to
the northwest, and the pebbles consist mainly of
marble. The matrix consists of carbonate and silici-
clastic components. About 15 pebbles from this out-
crop have been observed in detail and show similar
structures. Marine Tortonian rocks cover the Exter-
nal–Internal zone contact and reach heights of more
than 1500 m above sea level, providing evidence for
fast and recent uplift of the Cordillera. This conglom-
erate has been buried by nearly 1000 m.
The Alhama de Granada outcrop, where the bed-
ding is horizontal, consists of Late Tortonian–Messi-
nian conglomerates and is located near the contact
between External and Internal zones of the Cordillera.
In this outcrop of mud-supported conglomerates, 12
pebbles were selected for striation analysis. Taking
into account their stratigraphic position, the maximum
burial undergone by these rocks was several hundreds
of meters but less than in the Trevenque outcrop.
Several outcrops (Manzanil, Trinchera, Tocon and
Pinos; Fig. 1b) are located within Plio-Quaternary
conglomerates in alluvial fans and fluvial terraces on
the northern border of the Granada depression. Sanz
de Galdeano (1980) and Estevez et al. (1982) first
identified the Tocon and Pinos outcrops. All these
outcrops lie near a major fault, that has a normal slip
component and forms the northern boundary of the
Granada depression. The load supported by these
rocks was very low, with a maximum burial of several
tens of meters. These rocks consist of pebble- and
matrix-supported conglomerates and the bedding is
subhorizontal, except in the Pinos outcrop, where dips
of 37j towards the ESE are preserved. The number of
studied pebbles ranges from five to six in each
outcrop, except in Manzanil, where measurements
from eight different pebbles have been integrated.
The Alcala la Real depression is a complex syn-
form filled by Neogene and Quaternary rocks located
on rocks from the External Zone. Striated pebbles
have been found in a pebble-supported conglomerate
of Late Burdigalian–Early Langhian age, with bed-
ding dipping 22j towards the NNE and that has
undergone a maximum burial about 400 m. Only
one pebble was studied due to the scarcity of striae.
The Jaen outcrop, in the front of the mountain
range, is located in a fluvial Late Messinian to
Pliocene conglomerate, where the bedding is subhor-
izontal. It is difficult to estimate the maximum burial
that may reach a hundred of meters. Five pebbles have
been analyzed from this mud-supported conglomerate.
The present-day mountain front does not seem to be
very active, because it has a high sinuosity and recent
deformations are not intense (Ruano et al., in press).
3. Surface structures on pebbles and paleostresses
The pebble surfaces from these outcrops are pol-
ished and contain solution pits and striae (Figs. 2 and
3). The degree of polish varies independently of the
tectonic context. In general, the degree of polish is
higher in hard pebbles surrounded by a fine grained
matrix. Solution pits were identified on most of the
pebbles (Fig. 2b), formed by the interaction of differ-
ent pebbles or small size matrix particles of the
conglomerate, whose surface distribution, quantity,
shape and size varied from pebble to pebble and
between outcrops. Generally, the solution pits are
approximately concentrated on opposed poles of the
pebble (Fig. 2b), suggesting an axis parallel to the
maximum compressive stress (Estevez et al., 1976;
Campredon et al., 1977). In extreme cases, like in the
Trevenque outcrop, rounded solution marks occur
along the whole surface of the pebble (Fig. 2c) The
size of these marks is very variable, with a maximum
Page 5
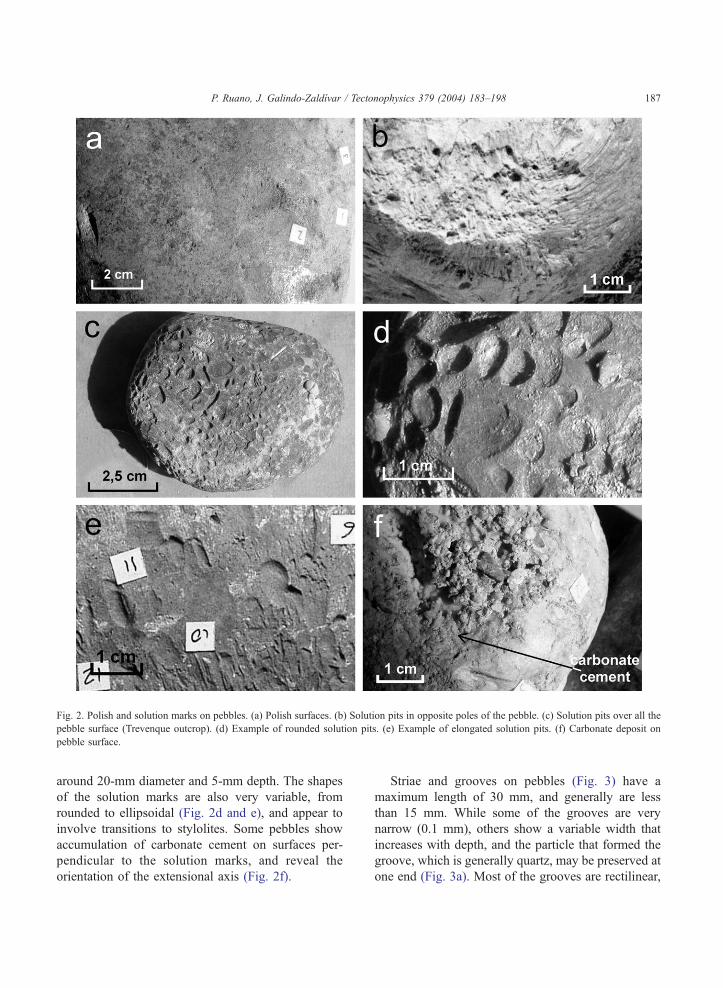
Fig. 2. Polish and solution marks on pebbles. (a) Polish surfaces. (b) Solution pits in opposite poles of the pebble. (c) Solution pits over all the
pebble surface (Trevenque outcrop). (d) Example of rounded solution pits. (e) Example of elongated solution pits. (f) Carbonate deposit on
pebble surface.
P. Ruano, J. Galindo-Zaldıvar / Tectonophysics 379 (2004) 183–198 187
around 20-mm diameter and 5-mm depth. The shapes
of the solution marks are also very variable, from
rounded to ellipsoidal (Fig. 2d and e), and appear to
involve transitions to stylolites. Some pebbles show
accumulation of carbonate cement on surfaces per-
pendicular to the solution marks, and reveal the
orientation of the extensional axis (Fig. 2f).
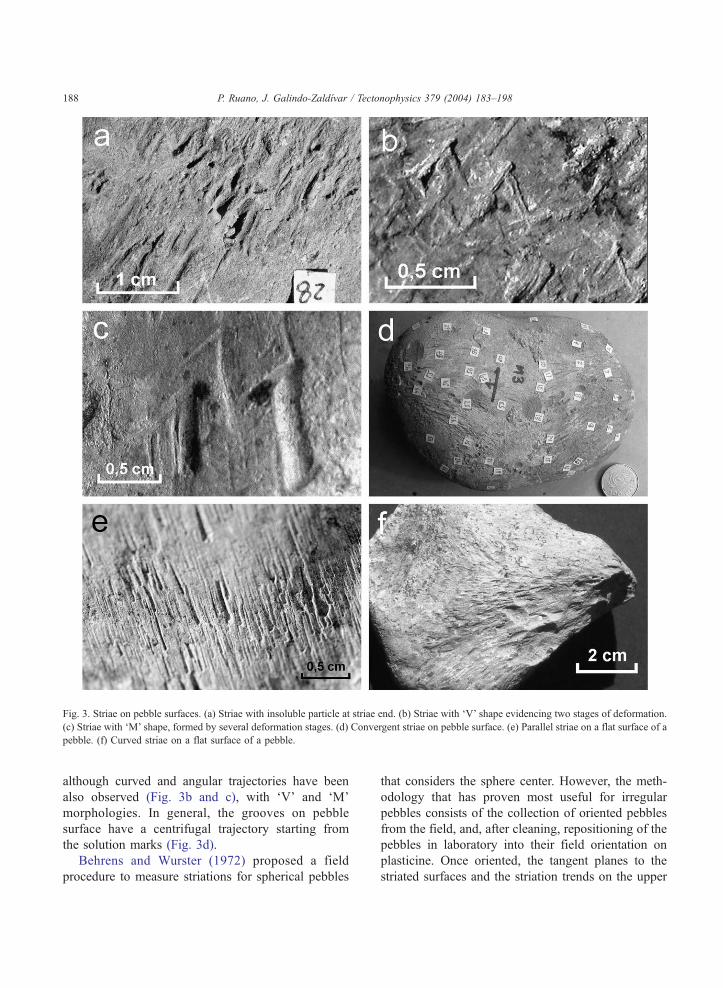
Striae and grooves on pebbles (Fig. 3) have a
maximum length of 30 mm, and generally are less
than 15 mm. While some of the grooves are very
narrow (0.1 mm), others show a variable width that
increases with depth, and the particle that formed the
groove, which is generally quartz, may be preserved at
one end (Fig. 3a). Most of the grooves are rectilinear,
Page 6
Fig. 3. Striae on pebble surfaces. (a) Striae with insoluble particle at striae end. (b) Striae with ‘V’ shape evidencing two stages of deformation.
(c) Striae with ‘M’ shape, formed by several deformation stages. (d) Convergent striae on pebble surface. (e) Parallel striae on a flat surface of a
pebble. (f) Curved striae on a flat surface of a pebble.
P. Ruano, J. Galindo-Zaldıvar / Tectonophysics 379 (2004) 183–198188
although curved and angular trajectories have been
also observed (Fig. 3b and c), with ‘V’ and ‘M’
morphologies. In general, the grooves on pebble
surface have a centrifugal trajectory starting from
the solution marks (Fig. 3d).
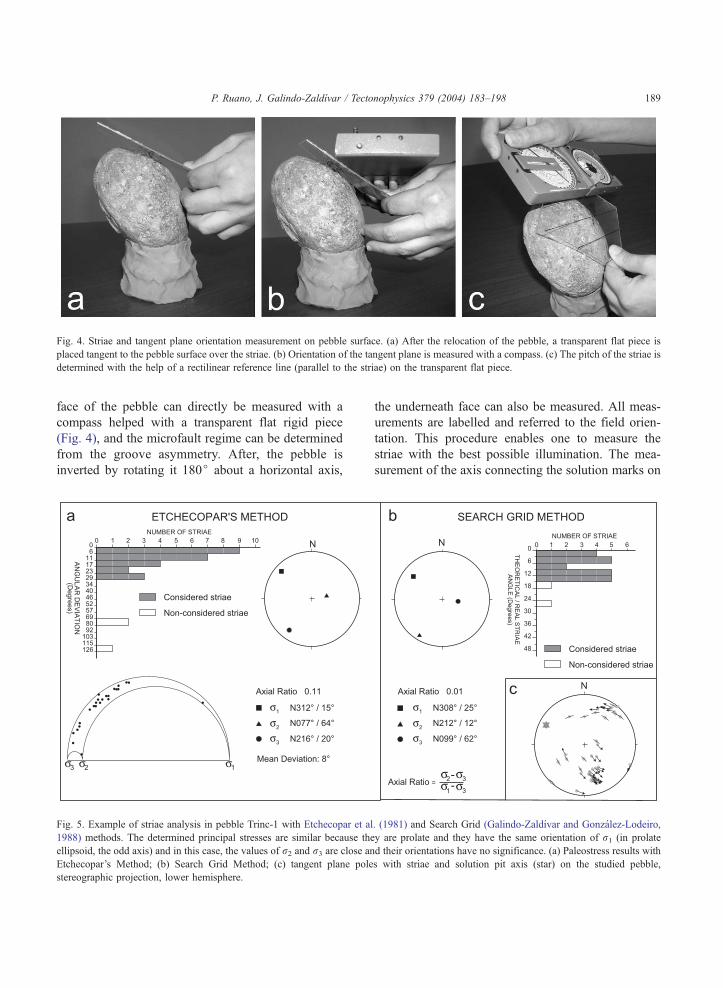
Behrens and Wurster (1972) proposed a field
procedure to measure striations for spherical pebbles
that considers the sphere center. However, the meth-
odology that has proven most useful for irregular
pebbles consists of the collection of oriented pebbles
from the field, and, after cleaning, repositioning of the
pebbles in laboratory into their field orientation on
plasticine. Once oriented, the tangent planes to the
striated surfaces and the striation trends on the upper
Page 7
Fig. 4. Striae and tangent plane orientation measurement on pebble surface. (a) After the relocation of the pebble, a transparent flat piece is
placed tangent to the pebble surface over the striae. (b) Orientation of the tangent plane is measured with a compass. (c) The pitch of the striae is
determined with the help of a rectilinear reference line (parallel to the striae) on the transparent flat piece.
P. Ruano, J. Galindo-Zaldıvar / Tectonophysics 379 (2004) 183–198 189
face of the pebble can directly be measured with a
compass helped with a transparent flat rigid piece
(Fig. 4), and the microfault regime can be determined
from the groove asymmetry. After, the pebble is
inverted by rotating it 180j about a horizontal axis,
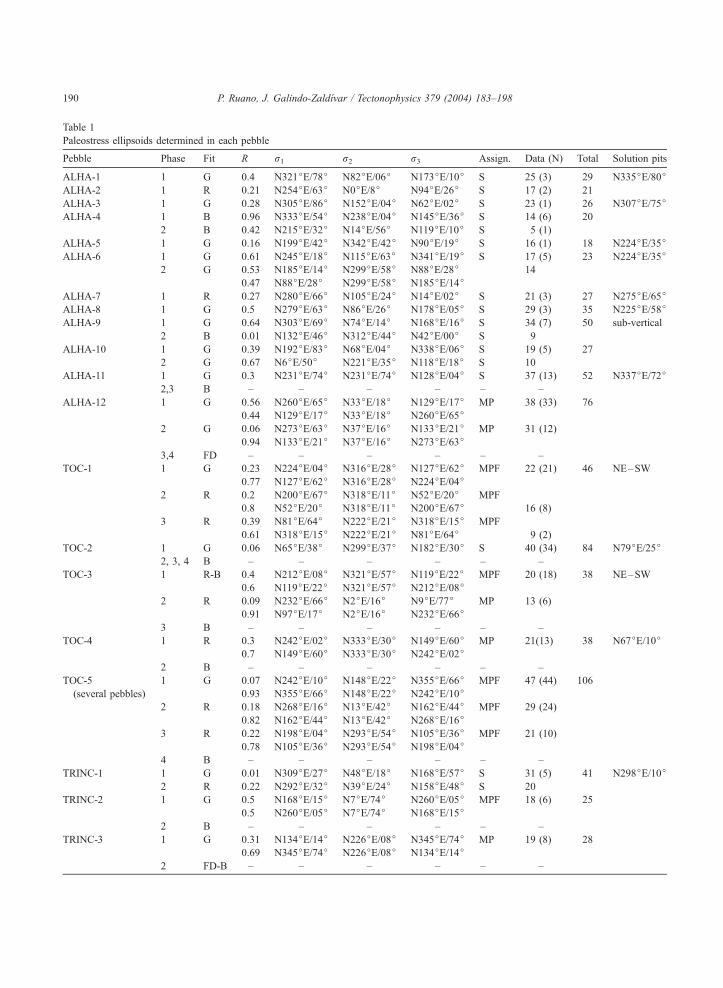
Fig. 5. Example of striae analysis in pebble Trinc-1 with Etchecopar et al
1988) methods. The determined principal stresses are similar because the
ellipsoid, the odd axis) and in this case, the values of r2 and r3 are close anEtchecopar’s Method; (b) Search Grid Method; (c) tangent plane pole
stereographic projection, lower hemisphere.
the underneath face can also be measured. All meas-
urements are labelled and referred to the field orien-
tation. This procedure enables one to measure the
striae with the best possible illumination. The mea-
surement of the axis connecting the solution marks on
. (1981) and Search Grid (Galindo-Zaldıvar and Gonzalez-Lodeiro,
y are prolate and they have the same orientation of r1 (in prolate
d their orientations have no significance. (a) Paleostress results with
s with striae and solution pit axis (star) on the studied pebble,
Page 8
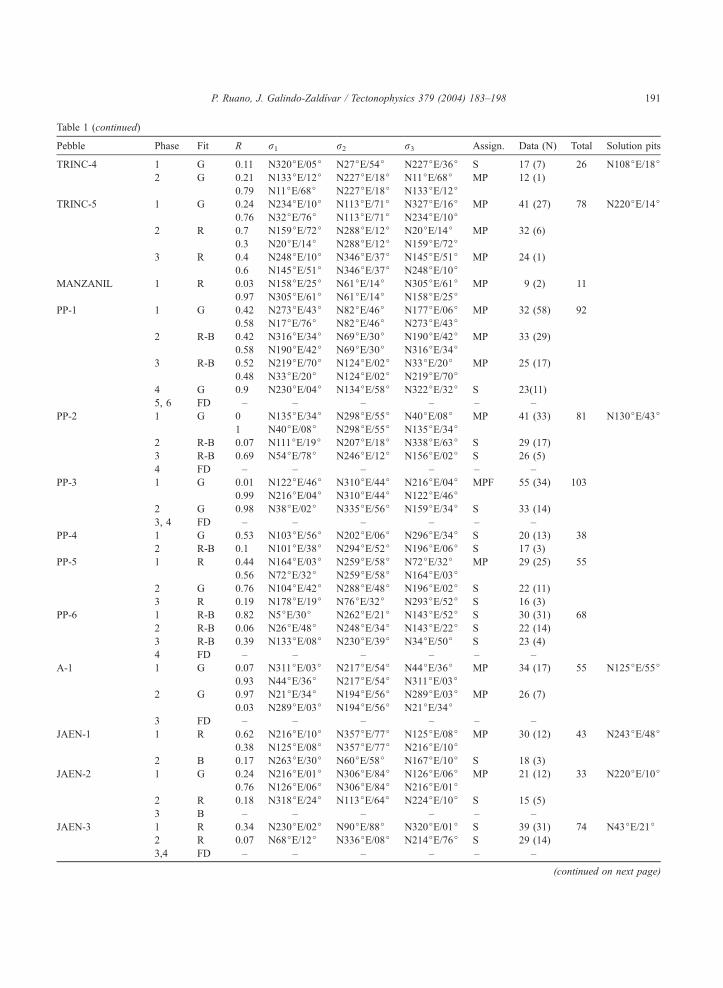
Table 1
Paleostress ellipsoids determined in each pebble
Pebble Phase Fit R r1 r2 r3 Assign. Data (N) Total Solution pits
ALHA-1 1 G 0.4 N321jE/78j N82jE/06j N173jE/10j S 25 (3) 29 N335jE/80jALHA-2 1 R 0.21 N254jE/63j N0jE/8j N94jE/26j S 17 (2) 21
ALHA-3 1 G 0.28 N305jE/86j N152jE/04j N62jE/02j S 23 (1) 26 N307jE/75jALHA-4 1 B 0.96 N333jE/54j N238jE/04j N145jE/36j S 14 (6) 20
2 B 0.42 N215jE/32j N14jE/56j N119jE/10j S 5 (1)
ALHA-5 1 G 0.16 N199jE/42j N342jE/42j N90jE/19j S 16 (1) 18 N224jE/35jALHA-6 1 G 0.61 N245jE/18j N115jE/63j N341jE/19j S 17 (5) 23 N224jE/35j
2 G 0.53 N185jE/14j N299jE/58j N88jE/28j 14
0.47 N88jE/28j N299jE/58j N185jE/14jALHA-7 1 R 0.27 N280jE/66j N105jE/24j N14jE/02j S 21 (3) 27 N275jE/65jALHA-8 1 G 0.5 N279jE/63j N86jE/26j N178jE/05j S 29 (3) 35 N225jE/58jALHA-9 1 G 0.64 N303jE/69j N74jE/14j N168jE/16j S 34 (7) 50 sub-vertical
2 B 0.01 N132jE/46j N312jE/44j N42jE/00j S 9
ALHA-10 1 G 0.39 N192jE/83j N68jE/04j N338jE/06j S 19 (5) 27
2 G 0.67 N6jE/50j N221jE/35j N118jE/18j S 10
ALHA-11 1 G 0.3 N231jE/74j N231jE/74j N128jE/04j S 37 (13) 52 N337jE/72j2,3 B – – – – – –
ALHA-12 1 G 0.56 N260jE/65j N33jE/18j N129jE/17j MP 38 (33) 76
0.44 N129jE/17j N33jE/18j N260jE/65j2 G 0.06 N273jE/63j N37jE/16j N133jE/21j MP 31 (12)
0.94 N133jE/21j N37jE/16j N273jE/63j3,4 FD – – – – – –
TOC-1 1 G 0.23 N224jE/04j N316jE/28j N127jE/62j MPF 22 (21) 46 NE–SW
0.77 N127jE/62j N316jE/28j N224jE/04j2 R 0.2 N200jE/67j N318jE/11j N52jE/20j MPF
0.8 N52jE/20j N318jE/11j N200jE/67j 16 (8)
3 R 0.39 N81jE/64j N222jE/21j N318jE/15j MPF
0.61 N318jE/15j N222jE/21j N81jE/64j 9 (2)
TOC-2 1 G 0.06 N65jE/38j N299jE/37j N182jE/30j S 40 (34) 84 N79jE/25j2, 3, 4 B – – – – – –
TOC-3 1 R-B 0.4 N212jE/08j N321jE/57j N119jE/22j MPF 20 (18) 38 NE–SW
0.6 N119jE/22j N321jE/57j N212jE/08j2 R 0.09 N232jE/66j N2jE/16j N9jE/77j MP 13 (6)
0.91 N97jE/17j N2jE/16j N232jE/66j3 B – – – – – –
TOC-4 1 R 0.3 N242jE/02j N333jE/30j N149jE/60j MP 21(13) 38 N67jE/10j0.7 N149jE/60j N333jE/30j N242jE/02j
2 B – – – – – –
TOC-5 1 G 0.07 N242jE/10j N148jE/22j N355jE/66j MPF 47 (44) 106
(several pebbles) 0.93 N355jE/66j N148jE/22j N242jE/10j2 R 0.18 N268jE/16j N13jE/42j N162jE/44j MPF 29 (24)
0.82 N162jE/44j N13jE/42j N268jE/16j3 R 0.22 N198jE/04j N293jE/54j N105jE/36j MPF 21 (10)
0.78 N105jE/36j N293jE/54j N198jE/04j4 B – – – – – –
TRINC-1 1 G 0.01 N309jE/27j N48jE/18j N168jE/57j S 31 (5) 41 N298jE/10j2 R 0.22 N292jE/32j N39jE/24j N158jE/48j S 20
TRINC-2 1 G 0.5 N168jE/15j N7jE/74j N260jE/05j MPF 18 (6) 25
0.5 N260jE/05j N7jE/74j N168jE/15j2 B – – – – – –
TRINC-3 1 G 0.31 N134jE/14j N226jE/08j N345jE/74j MP 19 (8) 28
0.69 N345jE/74j N226jE/08j N134jE/14j2 FD-B – – – – – –
P. Ruano, J. Galindo-Zaldıvar / Tectonophysics 379 (2004) 183–198190
Page 9
Table 1 (continued)
Pebble Phase Fit R r1 r2 r3 Assign. Data (N) Total Solution pits
TRINC-4 1 G 0.11 N320jE/05j N27jE/54j N227jE/36j S 17 (7) 26 N108jE/18j2 G 0.21 N133jE/12j N227jE/18j N11jE/68j MP 12 (1)
0.79 N11jE/68j N227jE/18j N133jE/12jTRINC-5 1 G 0.24 N234jE/10j N113jE/71j N327jE/16j MP 41 (27) 78 N220jE/14j
0.76 N32jE/76j N113jE/71j N234jE/10j2 R 0.7 N159jE/72j N288jE/12j N20jE/14j MP 32 (6)
0.3 N20jE/14j N288jE/12j N159jE/72j3 R 0.4 N248jE/10j N346jE/37j N145jE/51j MP 24 (1)
0.6 N145jE/51j N346jE/37j N248jE/10jMANZANIL 1 R 0.03 N158jE/25j N61jE/14j N305jE/61j MP 9 (2) 11
0.97 N305jE/61j N61jE/14j N158jE/25jPP-1 1 G 0.42 N273jE/43j N82jE/46j N177jE/06j MP 32 (58) 92
0.58 N17jE/76j N82jE/46j N273jE/43j2 R-B 0.42 N316jE/34j N69jE/30j N190jE/42j MP 33 (29)
0.58 N190jE/42j N69jE/30j N316jE/34j3 R-B 0.52 N219jE/70j N124jE/02j N33jE/20j MP 25 (17)
0.48 N33jE/20j N124jE/02j N219jE/70j4 G 0.9 N230jE/04j N134jE/58j N322jE/32j S 23(11)
5, 6 FD – – – – – –
PP-2 1 G 0 N135jE/34j N298jE/55j N40jE/08j MP 41 (33) 81 N130jE/43j1 N40jE/08j N298jE/55j N135jE/34j
2 R-B 0.07 N111jE/19j N207jE/18j N338jE/63j S 29 (17)
3 R-B 0.69 N54jE/78j N246jE/12j N156jE/02j S 26 (5)
4 FD – – – – – –
PP-3 1 G 0.01 N122jE/46j N310jE/44j N216jE/04j MPF 55 (34) 103
0.99 N216jE/04j N310jE/44j N122jE/46j2 G 0.98 N38jE/02j N335jE/56j N159jE/34j S 33 (14)
3, 4 FD – – – – – –
PP-4 1 G 0.53 N103jE/56j N202jE/06j N296jE/34j S 20 (13) 38
2 R-B 0.1 N101jE/38j N294jE/52j N196jE/06j S 17 (3)
PP-5 1 R 0.44 N164jE/03j N259jE/58j N72jE/32j MP 29 (25) 55
0.56 N72jE/32j N259jE/58j N164jE/03j2 G 0.76 N104jE/42j N288jE/48j N196jE/02j S 22 (11)
3 R 0.19 N178jE/19j N76jE/32j N293jE/52j S 16 (3)
PP-6 1 R-B 0.82 N5jE/30j N262jE/21j N143jE/52j S 30 (31) 68
2 R-B 0.06 N26jE/48j N248jE/34j N143jE/22j S 22 (14)
3 R-B 0.39 N133jE/08j N230jE/39j N34jE/50j S 23 (4)
4 FD – – – – – –
A-1 1 G 0.07 N311jE/03j N217jE/54j N44jE/36j MP 34 (17) 55 N125jE/55j0.93 N44jE/36j N217jE/54j N311jE/03j
2 G 0.97 N21jE/34j N194jE/56j N289jE/03j MP 26 (7)
0.03 N289jE/03j N194jE/56j N21jE/34j3 FD – – – – – –
JAEN-1 1 R 0.62 N216jE/10j N357jE/77j N125jE/08j MP 30 (12) 43 N243jE/48j0.38 N125jE/08j N357jE/77j N216jE/10j
2 B 0.17 N263jE/30j N60jE/58j N167jE/10j S 18 (3)
JAEN-2 1 G 0.24 N216jE/01j N306jE/84j N126jE/06j MP 21 (12) 33 N220jE/10j0.76 N126jE/06j N306jE/84j N216jE/01j
2 R 0.18 N318jE/24j N113jE/64j N224jE/10j S 15 (5)
3 B – – – – – –
JAEN-3 1 R 0.34 N230jE/02j N90jE/88j N320jE/01j S 39 (31) 74 N43jE/21j2 R 0.07 N68jE/12j N336jE/08j N214jE/76j S 29 (14)
3,4 FD – – – – – –
(continued on next page)
P. Ruano, J. Galindo-Zaldıvar / Tectonophysics 379 (2004) 183–198 191
Page 10
Table 1 (continued)
Pebble Phase Fit R r1 r2 r3 Assign. Data (N) Total Solution pits
JAEN-4 1 R-B 0.6 N317jE/10j N169jE/78j N48jE/06j MPF 25 (18) 45 N184jE/14j0.4 N48jE/06j N169jE/78j N317jE/10j
2 B – – – – – –
JAEN-5 1 G 0.37 N224jE/02j N123jE/80j N314jE/10j S 32 (35) 68 N19jE/58j2 R 0.32 N300jE/26j N30jE/00j N120jE/64j MP 19 (18)
0.68 N120jE/64j N30jE/00j N300jE/26j3 R 0.17 N66jE/04j N246jE/86j N336jE/01j S 30 (7)
4 FD – – – – – –
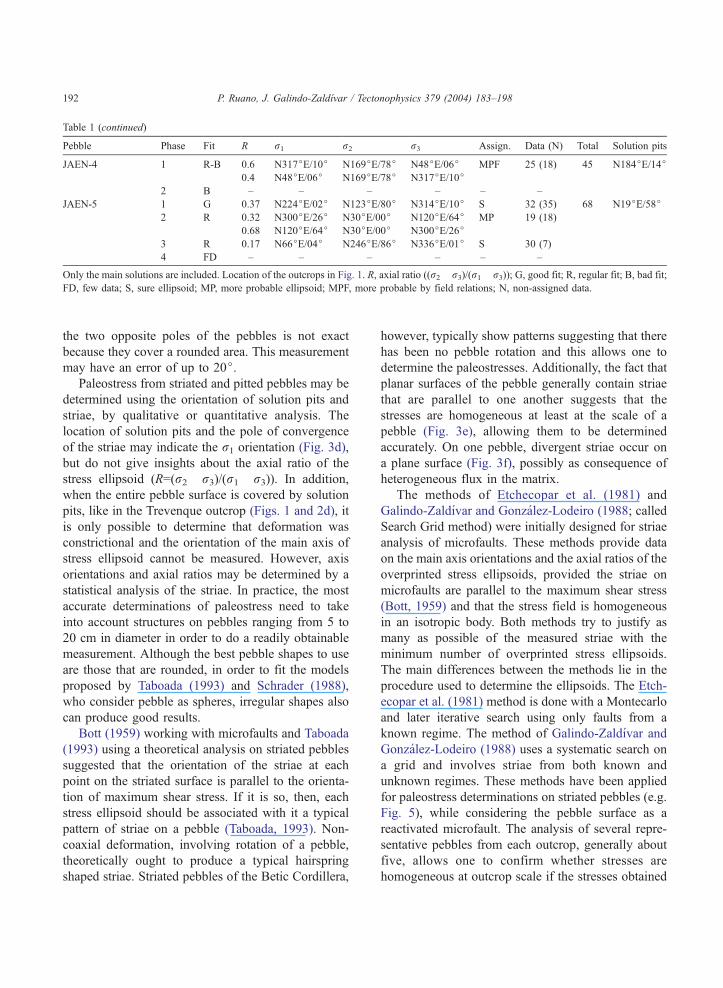
Only the main solutions are included. Location of the outcrops in Fig. 1. R, axial ratio ((r2� r3)/(r1� r3)); G, good fit; R, regular fit; B, bad fit;FD, few data; S, sure ellipsoid; MP, more probable ellipsoid; MPF, more probable by field relations; N, non-assigned data.
P. Ruano, J. Galindo-Zaldıvar / Tectonophysics 379 (2004) 183–198192
the two opposite poles of the pebbles is not exact
because they cover a rounded area. This measurement
may have an error of up to 20j.Paleostress from striated and pitted pebbles may be
determined using the orientation of solution pits and
striae, by qualitative or quantitative analysis. The
location of solution pits and the pole of convergence
of the striae may indicate the r1 orientation (Fig. 3d),
but do not give insights about the axial ratio of the
stress ellipsoid (R=(r2� r3)/(r1� r3)). In addition,
when the entire pebble surface is covered by solution
pits, like in the Trevenque outcrop (Figs. 1 and 2d), it
is only possible to determine that deformation was
constrictional and the orientation of the main axis of
stress ellipsoid cannot be measured. However, axis
orientations and axial ratios may be determined by a
statistical analysis of the striae. In practice, the most
accurate determinations of paleostress need to take
into account structures on pebbles ranging from 5 to
20 cm in diameter in order to do a readily obtainable
measurement. Although the best pebble shapes to use
are those that are rounded, in order to fit the models
proposed by Taboada (1993) and Schrader (1988),
who consider pebble as spheres, irregular shapes also
can produce good results.
Bott (1959) working with microfaults and Taboada
(1993) using a theoretical analysis on striated pebbles
suggested that the orientation of the striae at each
point on the striated surface is parallel to the orienta-
tion of maximum shear stress. If it is so, then, each
stress ellipsoid should be associated with it a typical
pattern of striae on a pebble (Taboada, 1993). Non-
coaxial deformation, involving rotation of a pebble,
theoretically ought to produce a typical hairspring
shaped striae. Striated pebbles of the Betic Cordillera,
however, typically show patterns suggesting that there
has been no pebble rotation and this allows one to
determine the paleostresses. Additionally, the fact that
planar surfaces of the pebble generally contain striae
that are parallel to one another suggests that the
stresses are homogeneous at least at the scale of a
pebble (Fig. 3e), allowing them to be determined
accurately. On one pebble, divergent striae occur on
a plane surface (Fig. 3f), possibly as consequence of
heterogeneous flux in the matrix.
The methods of Etchecopar et al. (1981) and
Galindo-Zaldıvar and Gonzalez-Lodeiro (1988; called
Search Grid method) were initially designed for striae
analysis of microfaults. These methods provide data
on the main axis orientations and the axial ratios of the
overprinted stress ellipsoids, provided the striae on
microfaults are parallel to the maximum shear stress
(Bott, 1959) and that the stress field is homogeneous
in an isotropic body. Both methods try to justify as
many as possible of the measured striae with the
minimum number of overprinted stress ellipsoids.
The main differences between the methods lie in the
procedure used to determine the ellipsoids. The Etch-
ecopar et al. (1981) method is done with a Montecarlo
and later iterative search using only faults from a
known regime. The method of Galindo-Zaldıvar and
Gonzalez-Lodeiro (1988) uses a systematic search on
a grid and involves striae from both known and
unknown regimes. These methods have been applied
for paleostress determinations on striated pebbles (e.g.
Fig. 5), while considering the pebble surface as a
reactivated microfault. The analysis of several repre-
sentative pebbles from each outcrop, generally about
five, allows one to confirm whether stresses are
homogeneous at outcrop scale if the stresses obtained
Page 11
P. Ruano, J. Galindo-Zaldıvar / Tectonophysics 379 (2004) 183–198 193
in several of the pebbles are similar. A complete
paleostress determination is made on each single
pebble. Several determinations from several pebbles
can be compared at the same locality. If they are
consistent, the confidence in the results is far greater
than with faults.
The results obtained from eight selected pebbles
with enough determination of fault regimes are very
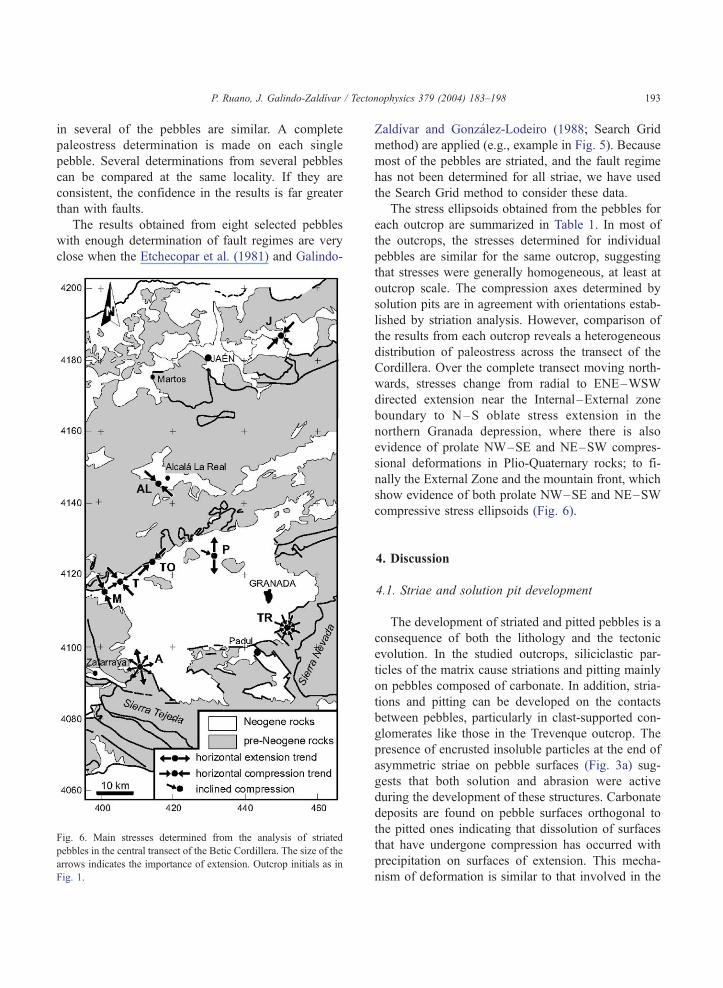
close when the Etchecopar et al. (1981) and Galindo-
Fig. 6. Main stresses determined from the analysis of striated
pebbles in the central transect of the Betic Cordillera. The size of the
arrows indicates the importance of extension. Outcrop initials as in
Fig. 1.
Zaldıvar and Gonzalez-Lodeiro (1988; Search Grid
method) are applied (e.g., example in Fig. 5). Because
most of the pebbles are striated, and the fault regime
has not been determined for all striae, we have used
the Search Grid method to consider these data.
The stress ellipsoids obtained from the pebbles for
each outcrop are summarized in Table 1. In most of
the outcrops, the stresses determined for individual
pebbles are similar for the same outcrop, suggesting
that stresses were generally homogeneous, at least at
outcrop scale. The compression axes determined by
solution pits are in agreement with orientations estab-
lished by striation analysis. However, comparison of
the results from each outcrop reveals a heterogeneous
distribution of paleostress across the transect of the
Cordillera. Over the complete transect moving north-
wards, stresses change from radial to ENE–WSW
directed extension near the Internal–External zone
boundary to N–S oblate stress extension in the
northern Granada depression, where there is also
evidence of prolate NW–SE and NE–SW compres-
sional deformations in Plio-Quaternary rocks; to fi-
nally the External Zone and the mountain front, which
show evidence of both prolate NW–SE and NE–SW
compressive stress ellipsoids (Fig. 6).
4. Discussion
4.1. Striae and solution pit development
The development of striated and pitted pebbles is a
consequence of both the lithology and the tectonic
evolution. In the studied outcrops, siliciclastic par-
ticles of the matrix cause striations and pitting mainly
on pebbles composed of carbonate. In addition, stria-
tions and pitting can be developed on the contacts
between pebbles, particularly in clast-supported con-
glomerates like those in the Trevenque outcrop. The
presence of encrusted insoluble particles at the end of
asymmetric striae on pebble surfaces (Fig. 3a) sug-
gests that both solution and abrasion were active
during the development of these structures. Carbonate
deposits are found on pebble surfaces orthogonal to
the pitted ones indicating that dissolution of surfaces
that have undergone compression has occurred with
precipitation on surfaces of extension. This mecha-
nism of deformation is similar to that involved in the
Page 12
P. Ruano, J. Galindo-Zaldıvar / Tectonophysics 379 (2004) 183–198194
development of stylolites and tension gashes. In
practice, it is easier to observe striae and pits (indi-
cating r1) than the cement accumulations (showing
r3), because when the pebble is extracted from the
outcrop, it usually breaks along the contact between
the cement and the pebble surface and any zones of
calcite precipitation are lost. However, the trajectories
of the striae appear to be independent of the mecha-
nism of striation development, depending only on the
tectonic evolution.
The distribution of solution structures on pebble
surfaces is variable in different outcrops. In carbonate
pebbles, a minimum pressure of 10 MPa is needed to
develop solution structures (McEwen, 1978). This
pressure is reached with a load of 300–400 m of
sedimentary rocks with mean densities around 2.5 to
2.6 g/cm3, when there is no confining pore fluid
pressure. The Trevenque, Alhama de Granada, Alcala
la Real and probably Jaen outcrops have probably
reached these conditions. The Trevenque outcrop
shows solution marks over the whole of the pebble
surface and constitutes an extreme example indicating
that this minimum pressure has been overpassed in all
directions. However, the development of striated peb-
bles in conglomerates of fluvial terraces that have
never been subjected to a high load, such as the
outcrop located in the northern part of the Depression
of Granada (Manzanil, Trichera, Tocon and Pinos),
indicates that compressional settings may develop
striated pebbles at shallow levels. In all these out-
crops, horizontal compression may have been also
amplified at the contact between pebbles and with the
insoluble particles of the matrix such that it exceeded
the minimum pressure for solution mark development
that has not been reached due to the vertical burial
stress.
4.2. Paleostress determination
Avigorous debate on the possibility of determining
paleostresses from structural observations has devel-
oped in recent years. Paleostresses cannot be directly
measured in the field, but their consequences are
certainly observed. Bott (1959) argued that the max-
imum shear stress on a plane is parallel to the striae
and this is considered, for most paleostress determi-
nation methods, to be the key assumption from which
the stress direction can be inferred. For the accurate
determination of paleostresses, the structures mea-
sured should not have undergone rotation. In addition,
it is well known that stresses are greatly perturbed
near major faults. Short slip during a deformation
involving little rotation of the pebbles provides the
most favourable setting for paleostress determination,
together with the presence of a large number of
different oriented striae.
Striated and pitted pebbles have been considered a
good marker for the determination of the trend of
maximum compression (Sanz de Galdeano and Este-
vez, 1981) and also, theoretically, as an appropriate
structure to determine paleostress axial ratios
(Schrader, 1988; Taboada, 1993) in single stage
deformations. However, previous attempts to use
striae orientation for paleostress determination
(Rodrıguez-Pascua and de Vicente, 1998), using the
Right Dihedra (Angelier and Mechler, 1977), Slip
Model (Reches, 1983; De Vicente, 1988), Stress
inversion (Reches, 1987; Reches et al., 1992) and
the Delvaux (1993) methods have resulted in very
inaccurate determinations, and this structure is con-
sidered unsuitable for paleostress determinations
from striae.
However, striated pebbles are a suitable structure
for the acquisition of tens, and even hundreds of striae
measures on a curved surface over a very small rock
volume that approaches the conditions necessary for
paleostress determination. Taking into account the
short slip on surfaces, each small area of the striated
surface may be considered, in practice, as a small flat
microfault. Striae can be considered in these small
segments as rectilinear, although they describe curved
trajectories if all striae on the pebble surface are
considered. Fault planes are regarded in this approach
as planes tangential to the pebble surfaces at the
location of each striae. In all the studied outcrops,
stable paleostresses solutions, including the orienta-
tion of the main axes of the stress ellipsoid and the
axial ratios, have been found using the Etchecopar et
al. (1981) and the Search Grid methods, based on Bott
(1959) analysis (Figs. 5 and 6; Table 1) on individual
pebbles. These outcrops are affected by polyphase
deformation because ‘M’ and ‘V’ striae shapes (Fig.
3b and c) have been found indicating two overprinted
deformation stages. ‘M’ striae probably formed by
contiguous ‘V’ shapes. In these cases, rectilinear seg-
ments of ‘M’ and ‘V’ striae have been considered for
Page 13
P. Ruano, J. Galindo-Zaldıvar / Tectonophysics 379 (2004) 183–198 195
paleostress determination. With respect to pebble
shape, in the more general irregular pebbles, a higher
representation of the flat surfaces is found in diagrams
of striae orientation, but no differences have been
found from stress determinations.
In practice, it is necessary to keep in mind that a
large number of striae are considered from each
pebble, and, therefore, a relatively high number of
stress ellipsoids are required to explain the entirety of
the grooves. Those that explain the greatest number of
striae, determined in the first stages of the analysis, are
considered to have the most tectonic significance.
Those that explain the least number of striae are
considered to be a consequence of measurement errors
or small stress perturbations. To be certain of the
validity of the paleostress determination, at least five
pebbles from each outcrop should be studied to check
the consistency of the results. Our work has shown
this number produces reproducible results in several
pebbles from the same outcrop. This check detects the
presence of any resedimented pebbles, which would
of course give anomalous paleostress determinations.
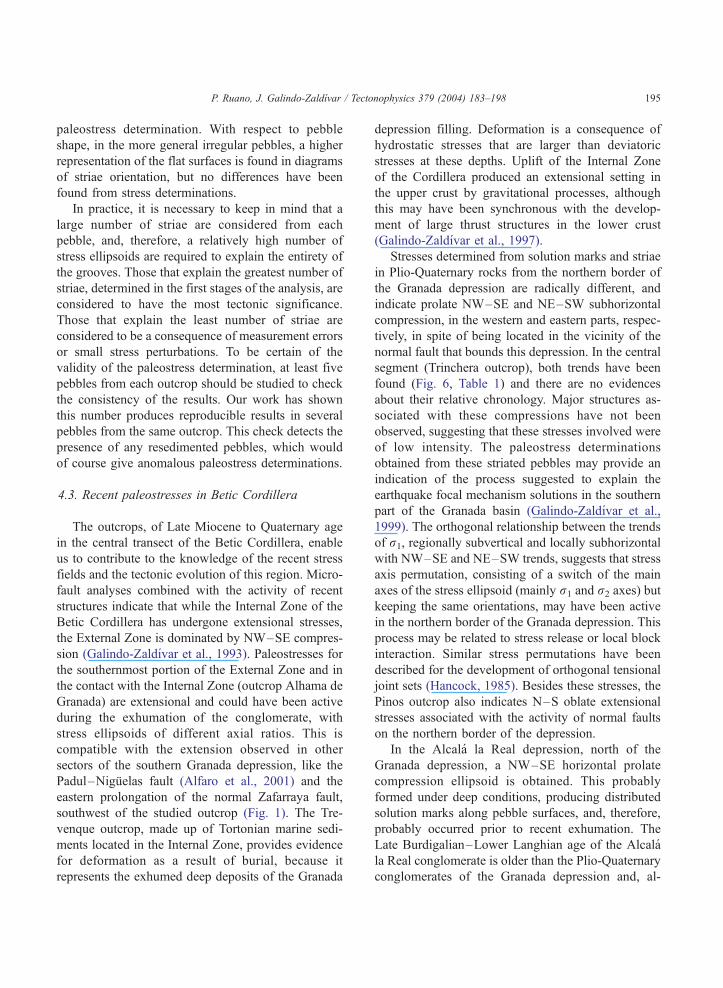
4.3. Recent paleostresses in Betic Cordillera
The outcrops, of Late Miocene to Quaternary age
in the central transect of the Betic Cordillera, enable
us to contribute to the knowledge of the recent stress
fields and the tectonic evolution of this region. Micro-
fault analyses combined with the activity of recent
structures indicate that while the Internal Zone of the
Betic Cordillera has undergone extensional stresses,
the External Zone is dominated by NW–SE compres-
sion (Galindo-Zaldıvar et al., 1993). Paleostresses for
the southernmost portion of the External Zone and in
the contact with the Internal Zone (outcrop Alhama de
Granada) are extensional and could have been active
during the exhumation of the conglomerate, with
stress ellipsoids of different axial ratios. This is
compatible with the extension observed in other
sectors of the southern Granada depression, like the
Padul–Niguelas fault (Alfaro et al., 2001) and the
eastern prolongation of the normal Zafarraya fault,
southwest of the studied outcrop (Fig. 1). The Tre-
venque outcrop, made up of Tortonian marine sedi-
ments located in the Internal Zone, provides evidence
for deformation as a result of burial, because it
represents the exhumed deep deposits of the Granada
depression filling. Deformation is a consequence of
hydrostatic stresses that are larger than deviatoric
stresses at these depths. Uplift of the Internal Zone
of the Cordillera produced an extensional setting in
the upper crust by gravitational processes, although
this may have been synchronous with the develop-
ment of large thrust structures in the lower crust
(Galindo-Zaldıvar et al., 1997).
Stresses determined from solution marks and striae
in Plio-Quaternary rocks from the northern border of
the Granada depression are radically different, and
indicate prolate NW–SE and NE–SW subhorizontal
compression, in the western and eastern parts, respec-
tively, in spite of being located in the vicinity of the
normal fault that bounds this depression. In the central
segment (Trinchera outcrop), both trends have been
found (Fig. 6, Table 1) and there are no evidences
about their relative chronology. Major structures as-
sociated with these compressions have not been
observed, suggesting that these stresses involved were
of low intensity. The paleostress determinations
obtained from these striated pebbles may provide an
indication of the process suggested to explain the
earthquake focal mechanism solutions in the southern
part of the Granada basin (Galindo-Zaldıvar et al.,
1999). The orthogonal relationship between the trends
of r1, regionally subvertical and locally subhorizontal
with NW–SE and NE–SW trends, suggests that stress
axis permutation, consisting of a switch of the main
axes of the stress ellipsoid (mainly r1 and r2 axes) but
keeping the same orientations, may have been active
in the northern border of the Granada depression. This
process may be related to stress release or local block
interaction. Similar stress permutations have been
described for the development of orthogonal tensional
joint sets (Hancock, 1985). Besides these stresses, the
Pinos outcrop also indicates N–S oblate extensional
stresses associated with the activity of normal faults
on the northern border of the depression.
In the Alcala la Real depression, north of the
Granada depression, a NW–SE horizontal prolate
compression ellipsoid is obtained. This probably
formed under deep conditions, producing distributed
solution marks along pebble surfaces, and, therefore,
probably occurred prior to recent exhumation. The
Late Burdigalian–Lower Langhian age of the Alcala
la Real conglomerate is older than the Plio-Quaternary
conglomerates of the Granada depression and, al-
Page 14
P. Ruano, J. Galindo-Zaldıvar / Tectonophysics 379 (2004) 183–198196
though both conglomerates have the same compres-
sion trend, the difference in age does not allow them
to be directly related to one another. However, this
suggests that this compression has recurred during
mountain range development since the Miocene.
In front of the Betic Cordillera, the Late Messi-
nian–Pliocene Jaen outcrop, deformed probably under
several hundreds of meters depth, registers a NE–SW
prolate compression that contrasts with the present-day
regional stresses and with the stresses that have acted
from the Miocene in adjacent areas, such as the Sierra
of Cazorla (Galindo-Zaldıvar et al., 1993). Although
these stresses seem to be anomalous with respect to
regional structures, they are compatible with other
minor structures observed in this mountain front as
sinistral E–O faults.
Data presented in this contribution show that the
recent state of stresses is heterogeneous and affected
by switching principal stress axes, but maintains the
same NW–SE orientation, prevailing extension to-
wards the Internal Zone and compression toward the
External Zone. These stresses are compatible with the
development of the Betic Cordillera in the context of
NW–SE convergence between the Eurasia and Africa
plates. In this context of crustal thickening, compres-
sional stresses are related to the development of large
folds in whole cordillera and thrusting that deform the
External Zone at shallow levels and the Internal Zone
at deep levels, while extension is produced at shallow
depths during the uplift in the Internal Zone.
5. Conclusions
Striated and pitted carbonate pebbles, surrounded
by siliciclastic fragments, constitute useful structures
for paleostress studies. These include the determina-
tion of the orientation of the main axes and axial ratio
of stress ellipsoids, taking into account that in a small
rock volume, it is possible to obtain a high number of
striae orientations. The best practical procedure
involves sampling five pebbles per outcrop for rocks
affected by polyphase deformation of minor complex-
ity, and then repositioning them in the laboratory to
make the measurements. The pebble shape is not
significant in paleostress determination and both
spherical pebbles, as in theoretical models, and irreg-
ularly shaped pebbles may be used. Methods based on
Bott’s (1959) equation, that were initially designed for
microfault analysis, yield accurate paleostress results
for each pebble. The consistency of paleostresses in
different pebbles from the same outcrop confirms the
validity of the results and prevents the possibility of
including redeposited striated pebbles in the samples.
An independent check is provided by the consistency
between the results obtained from striae and those
obtained from solution marks.
The distribution of pits on pebbles depends on the
burial and tectonic stresses. For deep levels, where
burial was greater than 400 m, pits may develop over
the whole of the pebble surface, especially in clast-
supported conglomerates. However, for shallow lev-
els, pits and striae only develop during horizontal
compression, when the maximum compressional stress
exceeds the minimum value required for solution.
The study of several striated pebble outcrops of
Miocene–Quaternary age along a central transect of
the Betic Cordillera provides new insight on paleo-
stress distributions. While the Internal Zone shows
evidence of radial extension, in the northern Gran-
ada depression, there is evidence of N–S oblate
extension orthogonal to a major normal fault. In
addition, NW–SE and NE–SW prolate compression
ellipsoids have been found from conglomerates of
different ages along this border of the Depression
and in the External Zone. These two compression
direction affects rocks as young as the Plio-Quater-
nary fluvial terrace deposits of the northern Granada
depression although there is no clear chronological
relationship.
The paleostresses determined are compatible with a
tectonic model in which uplift of the Cordillera was the
consequence of NW–SE compressional structures
developed by the convergence between the Eurasian
and African plate boundary, which dominate deforma-
tion in the External Zone. In the Internal Zone,
compression at depth produced uplift and extensional
stresses, with subvertical compression at shallow lev-
els probably by gravitational effects. In addition,
switching of stress axes between vertical, NW–SE
and NE–SW horizontal orientations has occurred
which is also suggested by earthquake focal mecha-
nisms in the southern Granada depression and revealed
by striated pebbles from the northern border of the
Granada depression. These data indicate that during
the recent evolution of the Betic Cordillera, the stresses
Page 15
P. Ruano, J. Galindo-Zaldıvar / Tectonophysics 379 (2004) 183–198 197
have been heterogeneous and not allow the establish-
ment of large tectonic phases for whole the Cordillera.
Acknowledgements
The constructive reviews in the last stage of this
research by Dr. T. H. Bell and Dr. F. Gonzalez Lodeiro
have greatly improved this contribution. Also the
comments by Dr. N. Fry and Dr. L. Arlegui have
enhanced the quality of the paper. Thanks are due to
Dr. A. Jabaloy for the helpful contribution on the field
work. This research was supported by project BTE-
2000-1490-C02-01 of the CICYT.
References
Alfaro, P., Galindo-Zaldıvar, J., Jabaloy, A., Lopez-Garrido, A.C.,
Sanz de Galdeano, C., 2001. Evidence for the activity and pale-
oseismicity of the Padul fault (Betic Cordillera, southern Spain).
Acta Geol. Hisp. 36 (3–4), 283–295.
Angelier, J., Mechler, P., 1977. Sur une methode graphique de
recherche des contraintes principales egalement utilisable en
tectonique et en seismologie: la methode des diedres droits.
Bull. Soc. Geol. Fr. 7, XIX (6), 1309–1318.
Behrens, M., Wuster, P., 1972. Tektonische Untersuchungen an
Molasse-Gerollen. Geol. Rundsch. 61, 1019–1037.
Bott, M.H.P., 1959. The mechanics of oblique slip faulting. Geol.
Mag. XCVI (2), 109–117.
Campredon, R., Franco, M., Guiannerini, G., Gigot, T., Irr, F.,
Lanteaueme, M., Spini, H., Tapoul, J.F., 1977. Les deformations
de conglomerats pliocenes de l’Arc de Nice (chaines subalpines
meridionales). C. R. Somm. Soc. Geol. Fr. 2, 75–77.
Clifton, H.E., 1965. Tectonic polish of pebbles. J. Sediment. Petrol.
35 (4), 867–873.
Delvaux, D., 1993. The Tensor program for paleostress reconstruc-
tion: examples from the east African and the Baikal rift zones.
Terra Nova 5, 216.
DeMets, C., Gordon, R.G., Argus, D.F., Stein, S., 1990. Current
plate motions. Geophys. J. Int. 101, 425–478.
De Vicente, G., 1988. The e/KV diagram. An application of the
‘‘Slip model’’ to the populational fault analysis. Rev. Soc. Geol.
Esp. 1, 97–112.
Estevez, A., Lopez-Garrido, A.C., Sanz de Galdeano, C., 1976.
Estudio de las deformaciones recientes en el sector del Negratın
(Depresion de Guadix–Baza), Reunion sobre la geodinamica de
las Cordilleras Beticas y Mar de Alboran. University of Gran-
ada, Granada, pp. 165–195.
Estevez, A., Rodrıguez-Fernandez, J., Sanz de Galdeano, C., Vera,
J.A., 1982. Evidencia de una fase compresiva de edad Torto-
nense en el sector central de las Cordilleras Beticas. Estud. Geol.
38, 55–60.
Etchecopar, A., Vasseur, G., Daignieres, M., 1981. An inverse prob-
lem in microtectonics for the determination of stress tensors
from fault striation analysis. J. Struct. Geol. 3 (1), 51–65.
Galindo-Zaldıvar, J., Gonzalez-Lodeiro, F., 1988. Faulting phase
differentiation by means of computer search on a grid pattern.
Ann. Tecton. 2, 90–97.
Galindo-Zaldıvar, J., Gonzalez-Lodeiro, F., Jabaloy, A., 1993.
Stress and paleostress in the Betic-Rif Cordilleras (Miocene to
present-day). Tectonophysics 227, 105–126.
Galindo-Zaldıvar, J., Jabaloy, A., Gonzalez-Lodeiro, F., Aldaya, F.,
1997. Crustal structure of the central sector of the Betic Cordil-
lera (SE Spain). Tectonics 16 (1), 18–37.
Galindo-Zaldıvar, J., Jabaloy, A., Serrano, I., Morales, J., Gonzalez-
Lodeiro, F., Torcal, F., 1999. Recent and present-day stresses in
the Granada Basin (Betic Cordilleras): example of a late Mio-
cene–present-day extensional basin in a convergent plate boun-
dary. Tectonics 18 (4), 686–702.
Hancock, P.L., 1985. Brittle microtectonics: principles and practice.
J. Struct. Geol. 7 (3/4), 437–457.
Hippolyte, J.C., 2001. Paleostress and neotectonic analysis of
sheared conglomerates: Southwest Alps and Southern Apen-
nines. J. Struct. Geol. 23, 421–429.
Hughes, T.M., 1895. Criticism of the geological evidence for the
recurrence of the Ice Ages. Conditions of the surface of the
boulders and the solid rock. Proc. Camb. Philos. Soc. 8, 98–112.
Jabaloy, A., Galindo-Zaldıvar, J., Gonzalez-Lodeiro, F., 2003. Pa-
laeostress evolution of the Iberian Peninsula (Late Carbonifer-
ous to present-day). Tectonophysics 357 (1–4), 159–186.
Judson, S., Barks, R.E., 1961. Microstriations on polished pebbles.
Am. J. Sci. 259, 371–381.
McEwen, T.J., 1978. Diffusional mass transfer processes in pitted
pebbles conglomerates. Contrib. Mineral. Petrol. 67, 405–415.
Petit, J.P., Raynaud, S., Cautru, J.P., 1985. Microtectonique casante
lors du plissement d’un conglomerat (Mio-Pliocene du Haut
Atlas-Maroc). Bull. Soc. Geol. Fr. 8 (3), 415–421.
Ramsay, J.G., Lisle, R., 2001. Modern structural geology: Applica-
tions of continuum mechanics in structural geology, vol. 3. Aca-
demic Press, Londres. 1061 pp.
Reches, Z., 1983. Faulting of rocks in three-dimensional strain
fields: II. Theoretical analysis. Tectonophysics 95, 133–156.
Reches, Z., 1987. Determination of the tectonic stress tensor from
slip along faults that obey the Coulomb yield condition. Tec-
tonics 7, 849–861.
Reches, Z., Baer, G., Hatzor, Y., 1992. Constraints on the strength
of the Upper Crust from stress inversion of fault slip data.
J. Geophys. Res. 97 (B9), 12481–12493.
Rodrıguez-Pascua, M.A., de Vicente, G., 1998. Analisis de paleo-
esfuerzos en cantos de depositos conglomeraticos terciarios de
la Cuenca de Zaorejas (Rama Castellana de la Cordillera Iber-
ica). Rev. Soc. Geol. Esp. 11 (1–2), 169–180.
Ruano, P., Galindo-Zaldıvar, J., Jabaloy, A., (in press), Recent tec-
tonic structures in a transect of the central Betic Cordillera.
PAGEOPH.
Ruano, P., Galindo-Zaldıvar, J., Jabaloy, A., 2000. Evolucion geo-
logica desde el Mioceno del sector noroccidental de la depresion
de Granada (Beticas Cordilleras). Rev. Soc. Geol. Esp. 13 (1),
143–155.
Page 16
P. Ruano, J. Galindo-Zaldıvar / Tectonophysics 379 (2004) 183–198198
Sanz de Galdeano, C., 1980. La neotectonica del Norte de la De-
presion de Granada. Estud. Geol. 36, 255–261.
Sanz de Galdeano, C., Estevez, A., 1981. Estriaciones tectonicas en
cantos de conglomerados. Su estudio en las Depresiones de
Granada y Guadix–Baza. Estud. Geol. 37, 227–232.
Schrader, F., 1988. Symmetry of pebble-deformation involving sol-
ution pits and slip-lineations in the northern Alpine Molasse
Basin. J. Struct. Geol. 10 (1), 41–52.
Sorby, J.C., 1863. Uber Kalkstein-Geschiebe mit Eindrucken.
Neues Jahrb. Mineral. 1983, 801–807.
Stromgard, K.E., 1973. Stress distribution during formation of bou-
dinage and pressure shadows. Tectonophysics 16, 215–248.
Taboada, A., 1993. Stress and strain from striated pebbles. Theo-
retical analysis of striations on a rigid spherical body linked to a
symmetrical tensor. J. Struct. Geol. 15 (11), 1315–1330.
Trurnit, P., 1968. Pressure solution phenomena in detrital rocks.
Sediment. Geol. 2, 89–114.
Werner, T.J., 1802. Geognostische Wahrnebmung uber die Entste-
hung des Lahnthales und der Berge bei Wetzlar. Ann. Soc. Ges.
Mineral. Jena 1, 103–110.