The Active Human Gut Microbiota Differs from the Total Microbiota Francesc Peris-Bondia 1,2 , Amparo Latorre 1,2 , Alejandro Artacho 1 , Andre ´s Moya 1,2 , Giuseppe D’Auria 1,2 * 1 Joint Unit of Research in Genomics and Health, Centre for Public Health Research (CSISP) - Cavanilles Institute for Biodiversity and Evolutionary Biology (University of Valencia), Valencia, Spain, 2 Centro de Investigacio ´ n en Red en Epidemiologı ´a y Salud Pu ´ blica (CIBEResp), Barcelona, Spain Abstract The human gut microbiota is considered one of the most fascinating reservoirs of microbial diversity hosting between 400 to 1000 bacterial species distributed among nine phyla with Firmicutes, Bacteroidetes and Actinobacteria representing around 75 % of the diversity. One of the most intriguing issues relates to understanding which microbial groups are active players in the maintenance of the microbiota homeostasis. Here, we describe the diversity of active microbial fractions compared with the whole community from raw human fecal samples. We studied four healthy volunteers by 16S rDNA gene pyrosequencing. The fractions were obtained by cell sorting based on bacterial RNA concentration. Bacterial families were observed to appear or disappear on applying a cell sorting method in which flow cytometry was used to evaluate the active cells by pyronin-Y staining of RNA. This method was able to detect active bacteria, indicating that the active players differed from that observed in raw fecal material. Generally, observations showed that in the active fractions, the number of reads related to Bacteroidetes decreased whereas several families from Clostridiales (Firmicutes) were more highly represented. Moreover, a huge number of families appeared as part of the active fraction when cell sorting was applied, indicating reads that are simply statistically hidden by the total reads. Citation: Peris-Bondia F, Latorre A, Artacho A, Moya A, D’Auria G (2011) The Active Human Gut Microbiota Differs from the Total Microbiota. PLoS ONE 6(7): e22448. doi:10.1371/journal.pone.0022448 Editor: Markus M. Heimesaat, Charite ´ , Campus Benjamin Franklin, Germany Received April 13, 2011; Accepted June 22, 2011; Published July 28, 2011 Copyright: ß 2011 Peris-Bondia et al. This is an open-access article distributed under the terms of the Creative Commons Attribution License, which permits unrestricted use, distribution, and reproduction in any medium, provided the original author and source are credited. Funding: This work was funded by grant CP09/00049 Miguel Servet, Instituto de Salud Carlos III, Spain to GD; by projects SAF2009-13032-C02-01 from the Spanish Ministery for Science and Innovation (MCINN), BFU2008-04501-E from Spanish Ministery for Science and Innovation (MCINN) in the frame of ERA-Net PathoGenoMics and Prometeo/2009/092 from Conselleria D’Educacio ´ Generalitat Valenciana, Spain, to AM. FPB is recipient of a fellowship from the University of Valencia. FCM-FACS experiments were carried out using facilities at the Servei Central de Suport a la Investigacio ´ Experimental (SCSIE), University of Valencia. The funders had no role in study design, data collection and analysis, decision to publish, or preparation of the manuscript. Competing Interests: The authors have declared that no competing interests exist. * E-mail: [email protected]Introduction The human gastrointestinal tract (GIT) hosts one of the most complex microbial communities, which has come under intensive research in recent years by applying culture-dependent and - independent methods [1–4]. The human gut microbiota (HGM) is a complex community in which the extremely high diversity undergoes a functional homogenization. Human gut transcrip- tomic related studies, highlighted as main functional roles of the gut microbiota are related to nutrient processing, energy production and synthesis of cellular components [5]. HGM is notoriously dominated by Firmicutes and Bacteroidetes phyla [2,6,7]. However, the functional relevance of a given taxa is not necessarily associated to its numerical dominance and taxa that represent a minority in terms of number may play important functional roles, as well as being a reservoir of key genes considering that several degradation enzymes are not coded by human genome [8]. Recent studies have shown that microbiota imbalances (dysbiosis) are associated with a wide variety of health problems. Inflammatory bowel disease, obesity, atopic syndromes, various forms of colitis, and even autism, have been linked to disruptions in human-associated microbiota, or alterations in the intimate cross-talk between microbiota and human cells [9–14]. Regarding obesity, Turnbaugh and collaborators observed an abnormal bloom of a specific phylum that is normally present at low concentrations in healthy individuals [15]. Also, inflammatory bowel disease, ulcerative colitis, and pouchitis have been related to changes in the gastrointestinal flora with an increase of anaerobe Gram-negative bacteria as potentially ‘‘harmful’’ microbiota colonizers versus the ‘‘protective’’ ones [16]. A general issue that deserves further investigation is to ascertain which taxa in the HGM are really metabolically active. The study of natural microbial communities, particularly those associated to humans, is a hard task with major culture-related difficulties [17]. During the last 20 years, culture-independent identification techniques have been a big step forward in the analysis of the environmental microbial communities, as well as that associated with higher organisms. At present, the HGM is mainly studied by analyzing fecal samples, which are relatively easy to retrieve and to work with. However, there are reports of important findings showing that bacteria present in the intestinal biofilms taken from biopsy samples differ in composition from those observed in fecal ones [18–20]. Fecal samples are generally studied using direct approaches like 16S rDNA clone libraries or metagenomics [21–23]. However, the conventional DNA-based approach is unable to differentiate between viable, not viable and dead bacterial cells [24,25]. Studies carried out on diverse types of natural samples have reported important differences in microbial composition when an RNA- based approach is applied [26–28]. Another feature complicating PLoS ONE | www.plosone.org 1 July 2011 | Volume 6 | Issue 7 | e22448
Transcript
The Active Human Gut Microbiota Differs from the TotalMicrobiotaFrancesc Peris-Bondia1,2, Amparo Latorre1,2, Alejandro Artacho1, Andres Moya1,2, Giuseppe D’Auria1,2*
1 Joint Unit of Research in Genomics and Health, Centre for Public Health Research (CSISP) - Cavanilles Institute for Biodiversity and Evolutionary Biology (University of
Valencia), Valencia, Spain, 2 Centro de Investigacion en Red en Epidemiologıa y Salud Publica (CIBEResp), Barcelona, Spain
Abstract
The human gut microbiota is considered one of the most fascinating reservoirs of microbial diversity hosting between 400to 1000 bacterial species distributed among nine phyla with Firmicutes, Bacteroidetes and Actinobacteria representingaround 75 % of the diversity. One of the most intriguing issues relates to understanding which microbial groups are activeplayers in the maintenance of the microbiota homeostasis. Here, we describe the diversity of active microbial fractionscompared with the whole community from raw human fecal samples. We studied four healthy volunteers by 16S rDNA genepyrosequencing. The fractions were obtained by cell sorting based on bacterial RNA concentration. Bacterial families wereobserved to appear or disappear on applying a cell sorting method in which flow cytometry was used to evaluate the activecells by pyronin-Y staining of RNA. This method was able to detect active bacteria, indicating that the active players differedfrom that observed in raw fecal material. Generally, observations showed that in the active fractions, the number of readsrelated to Bacteroidetes decreased whereas several families from Clostridiales (Firmicutes) were more highly represented.Moreover, a huge number of families appeared as part of the active fraction when cell sorting was applied, indicating readsthat are simply statistically hidden by the total reads.
Citation: Peris-Bondia F, Latorre A, Artacho A, Moya A, D’Auria G (2011) The Active Human Gut Microbiota Differs from the Total Microbiota. PLoS ONE 6(7):e22448. doi:10.1371/journal.pone.0022448
Editor: Markus M. Heimesaat, Charite, Campus Benjamin Franklin, Germany
Received April 13, 2011; Accepted June 22, 2011; Published July 28, 2011
Copyright: � 2011 Peris-Bondia et al. This is an open-access article distributed under the terms of the Creative Commons Attribution License, which permitsunrestricted use, distribution, and reproduction in any medium, provided the original author and source are credited.
Funding: This work was funded by grant CP09/00049 Miguel Servet, Instituto de Salud Carlos III, Spain to GD; by projects SAF2009-13032-C02-01 from theSpanish Ministery for Science and Innovation (MCINN), BFU2008-04501-E from Spanish Ministery for Science and Innovation (MCINN) in the frame of ERA-NetPathoGenoMics and Prometeo/2009/092 from Conselleria D’Educacio Generalitat Valenciana, Spain, to AM. FPB is recipient of a fellowship from the University ofValencia. FCM-FACS experiments were carried out using facilities at the Servei Central de Suport a la Investigacio Experimental (SCSIE), University of Valencia. Thefunders had no role in study design, data collection and analysis, decision to publish, or preparation of the manuscript.
Competing Interests: The authors have declared that no competing interests exist.
thermophilic, cellulose-/cellobiose-digesting bacteria, which was
originally isolated from methanogenic sludge [42]. Other
frequently recruited species, identified since 1977, were C.
irregulare, a bile salt degrading bacteria, and C. sporosphaeroides, a
heavy hydrogen producer (does not produce H2S), which is unable
to convert pyruvate to butyrate, but rather, is able to convert
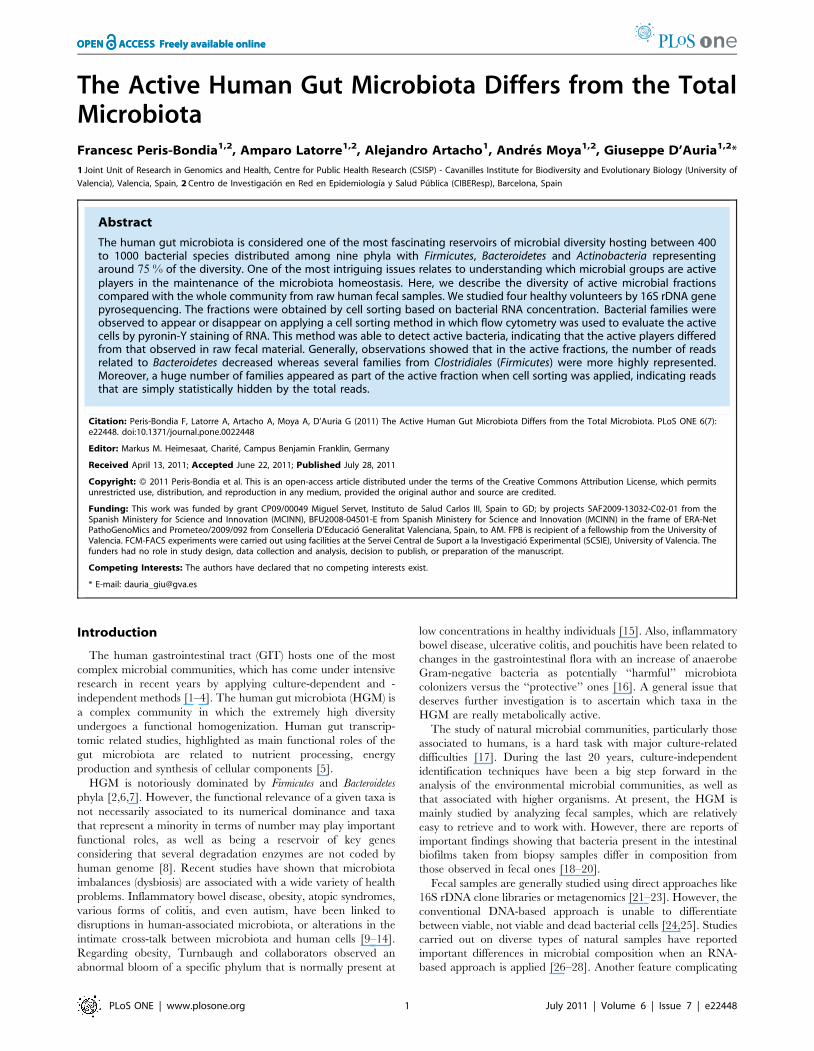
Figure 1. Sequencing overview. The image shows a general overview of the sequencing results. Abbreviations are defined as follow. Activefractions: PA, pyronin-Y activated; LC, low Cy5; HC, high Cy5. Total fractions: FS, Fecal Suspension; R, Ring fraction (see Methods section). Panel Areports the number of reads obtained from each sample/fraction. Panel B shows ‘‘violin plots’’ reporting on the X-axis the density of sequences at agiven percentage of similarity (Y-axis) of the best matches from the database (see Methods section). Panel C reports the ordered percentagedistribution of families for each sample/fraction; the gray dotted line labeled as ‘‘1 %’’ defines the threshold used to define the two categories of URBand ORB.doi:10.1371/journal.pone.0022448.g001
Table 1. Variance analysis.
SourceVar Df SumsOfSqs MeanSqs F.Model R2 Pr(wF)
ACTIVES vs TOTALS 1.00 0.31 0.31 6.66 0.17 910{4 ***
SAMPLES 3.00 0.82 0.27 5.83 0.45 910{4 ***
FRACTIONS 3.00 0.11 0.04 0.77 0.06 0.69
Residuals 12.00 0.57 0.05 0.31
Total 19.00 1.81 1.00
The table shows the dependency of the diversity in relation to the three main grouping factors: active fractions versus total fractions, samples, and fractions. Thevariance analysis was performed with 1000 permutations. Active-versus-total and samples grouping criteria showed statistically significative differences. Columnsdescribe: Source of variation, degrees of freedom, sequential sums of squares, mean squares, F statistics, partial R-squared and P values.doi:10.1371/journal.pone.0022448.t001
Studying the Active Human Gut Microbiota
PLoS ONE | www.plosone.org 3 July 2011 | Volume 6 | Issue 7 | e22448
lactate to propionate, a relatively rare, but not unique, property
[43]. Another commonly shared Clostridiaceae species found in
active fractions and in total fractions too, was Anoxinatronum
sibiricum which was first described as an alkaliphilic saccharolytic
anaerobe isolated from a natural cellulolytic community of
Nizhnee Beloe (Transbaikal region) [44]. Several other
Clostridium-related reads have been found but were not common
to all samples. Lachnospiraceae (from ORB) were significantly the
most abundant in active fractions. For instance, reads related to
Coprococcus members (species C. catus, C. comes and C. eutactus) were
retrieved prevalently in all active fractions from all samples;
Coprococcus are gram-positive, anaerobic cocci active carbohydrates
fermenters and producers of butyric and acetic acids with formic
or propionic and/or lactic acids [45]. Other commonly recruited
species from Lachnospiraceae were Hespellia porcina and H. stercorisuis,
both able to grow on glucose, maltose, mannose, sucrose, fructose
and xylose as energy sources, although the former is also able to
metabolize arabinose and inositol while the latter can also grow on
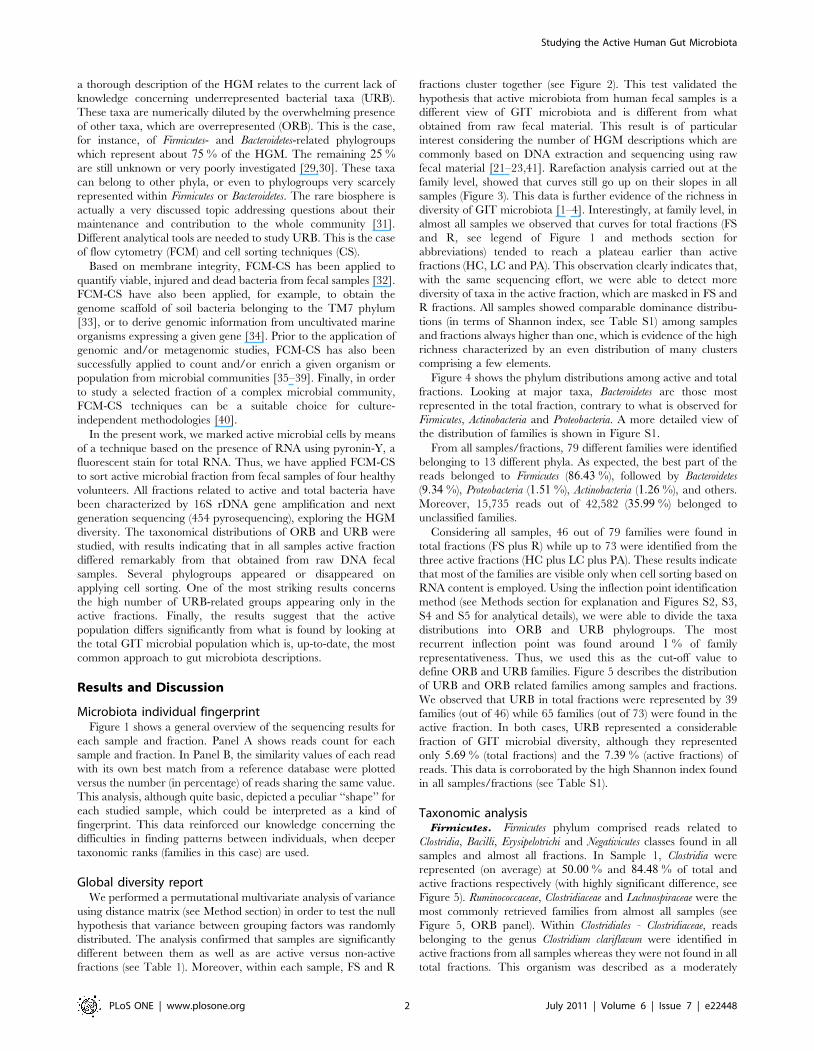
Figure 2. Cluster analysis among samples. Picture shows cluster analysis carried out for families table normalized to percentage. Clusters wereobtained applying Bray-Curtis distance and complete agglomeration method.doi:10.1371/journal.pone.0022448.g002
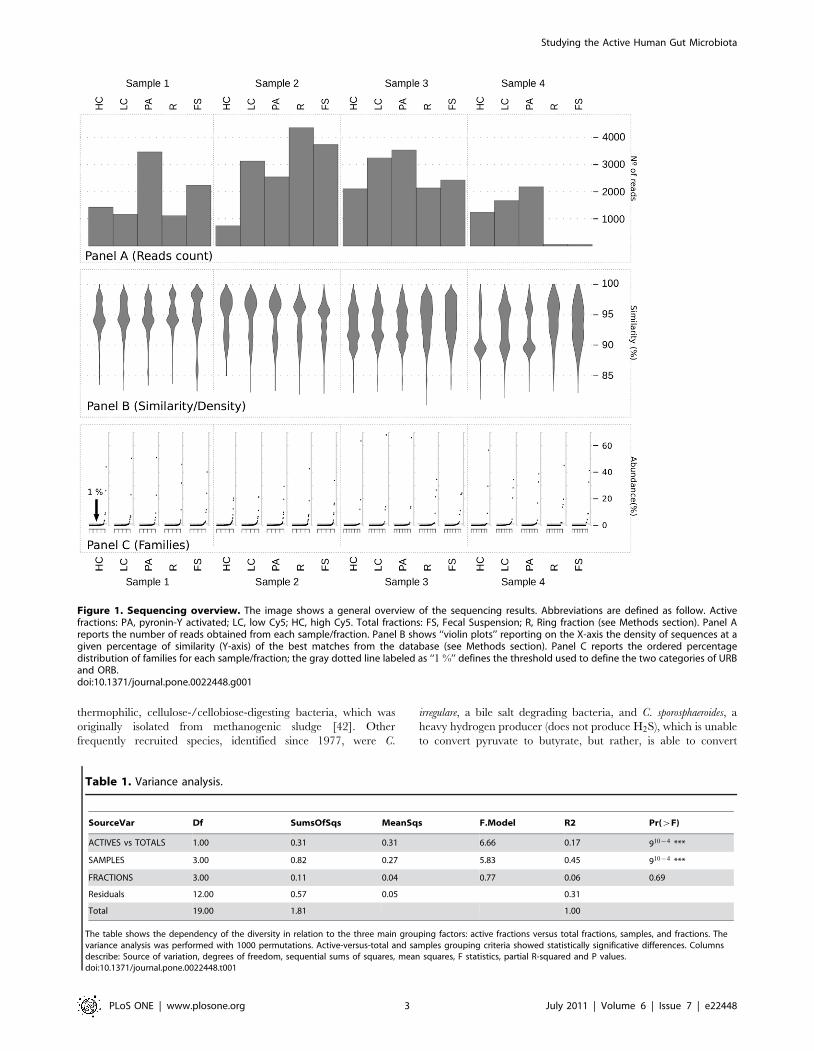
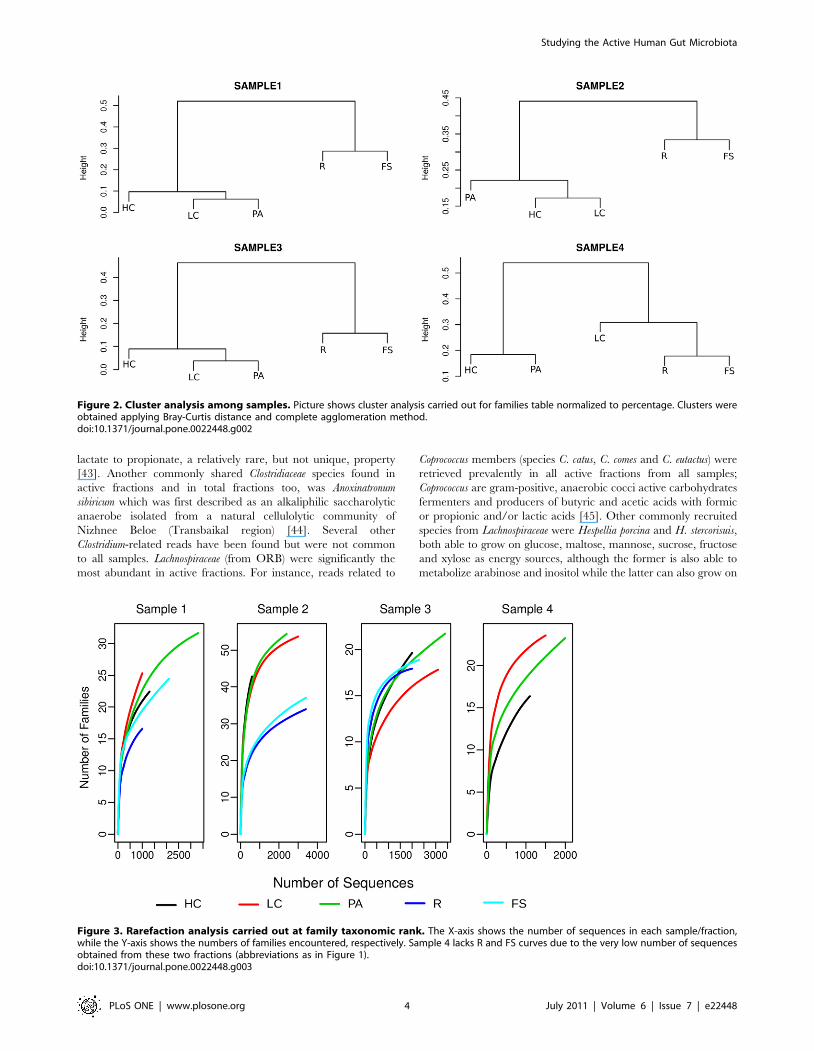
Figure 3. Rarefaction analysis carried out at family taxonomic rank. The X-axis shows the number of sequences in each sample/fraction,while the Y-axis shows the numbers of families encountered, respectively. Sample 4 lacks R and FS curves due to the very low number of sequencesobtained from these two fractions (abbreviations as in Figure 1).doi:10.1371/journal.pone.0022448.g003
Studying the Active Human Gut Microbiota
PLoS ONE | www.plosone.org 4 July 2011 | Volume 6 | Issue 7 | e22448
maltose, inulin and trehalose [54]. Other common Ruminococcaceae
were Ruminococcus bromii, R. flavefaciens and R. gauvreauii, which are
known as normal commensal components of HGM, some of
which play a protective role [55]. Also Blautia sp. were commonly
found in all samples. Other underrepresented Clostridiales families
were related to Clostridiales family XI which were found in higher
abundance when associated to pathological status [56]; Clostridiales
family XII whose genera are characterized by very heterogeneous
phenotypes; Clostridiales family XIII, Clostridiales family XVIII,
Gracilibacteraceae, Peptostreptococcaceae, etc.
Although we identified several families belonging to the orders
Bacillales and Lactobacillales, from Bacilli we did not find any family
common to all fractions. Finally, Selenomonadales, from Negativicute,
were URB retrieved from all samples.
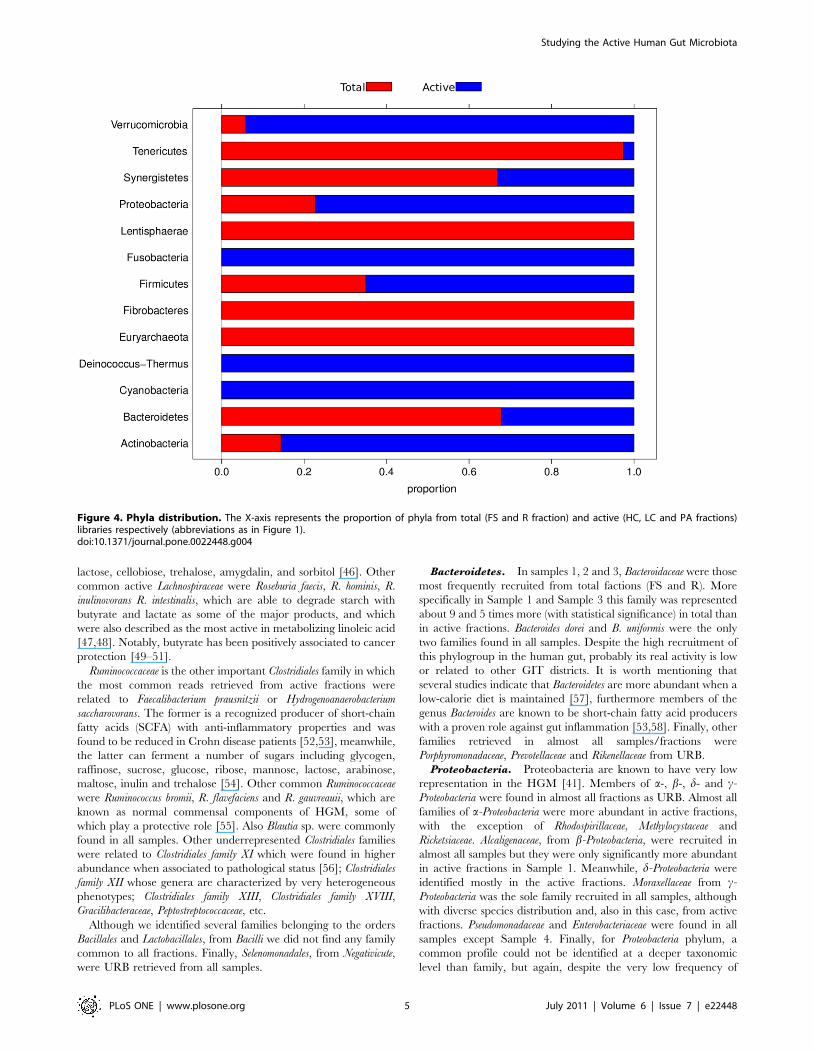
Bacteroidetes. In samples 1, 2 and 3, Bacteroidaceae were those
most frequently recruited from total factions (FS and R). More
specifically in Sample 1 and Sample 3 this family was represented
about 9 and 5 times more (with statistical significance) in total than
in active fractions. Bacteroides dorei and B. uniformis were the only
two families found in all samples. Despite the high recruitment of
this phylogroup in the human gut, probably its real activity is low
or related to other GIT districts. It is worth mentioning that
several studies indicate that Bacteroidetes are more abundant when a
low-calorie diet is maintained [57], furthermore members of the
genus Bacteroides are known to be short-chain fatty acid producers
with a proven role against gut inflammation [53,58]. Finally, other
families retrieved in almost all samples/fractions were
Porphyromonadaceae, Prevotellaceae and Rikenellaceae from URB.
Proteobacteria. Proteobacteria are known to have very low
representation in the HGM [41]. Members of a-, b-, d- and c-
Proteobacteria were found in almost all fractions as URB. Almost all
families of a-Proteobacteria were more abundant in active fractions,
with the exception of Rhodospirillaceae, Methylocystaceae and
Ricketsiaceae. Alcaligenaceae, from b-Proteobacteria, were recruited in
almost all samples but they were only significantly more abundant
in active fractions in Sample 1. Meanwhile, d-Proteobacteria were
identified mostly in the active fractions. Moraxellaceae from c-
Proteobacteria was the sole family recruited in all samples, although
with diverse species distribution and, also in this case, from active
fractions. Pseudomonadaceae and Enterobacteriaceae were found in all
samples except Sample 4. Finally, for Proteobacteria phylum, a
common profile could not be identified at a deeper taxonomic
level than family, but again, despite the very low frequency of
Figure 4. Phyla distribution. The X-axis represents the proportion of phyla from total (FS and R fraction) and active (HC, LC and PA fractions)libraries respectively (abbreviations as in Figure 1).doi:10.1371/journal.pone.0022448.g004
Studying the Active Human Gut Microbiota
PLoS ONE | www.plosone.org 5 July 2011 | Volume 6 | Issue 7 | e22448
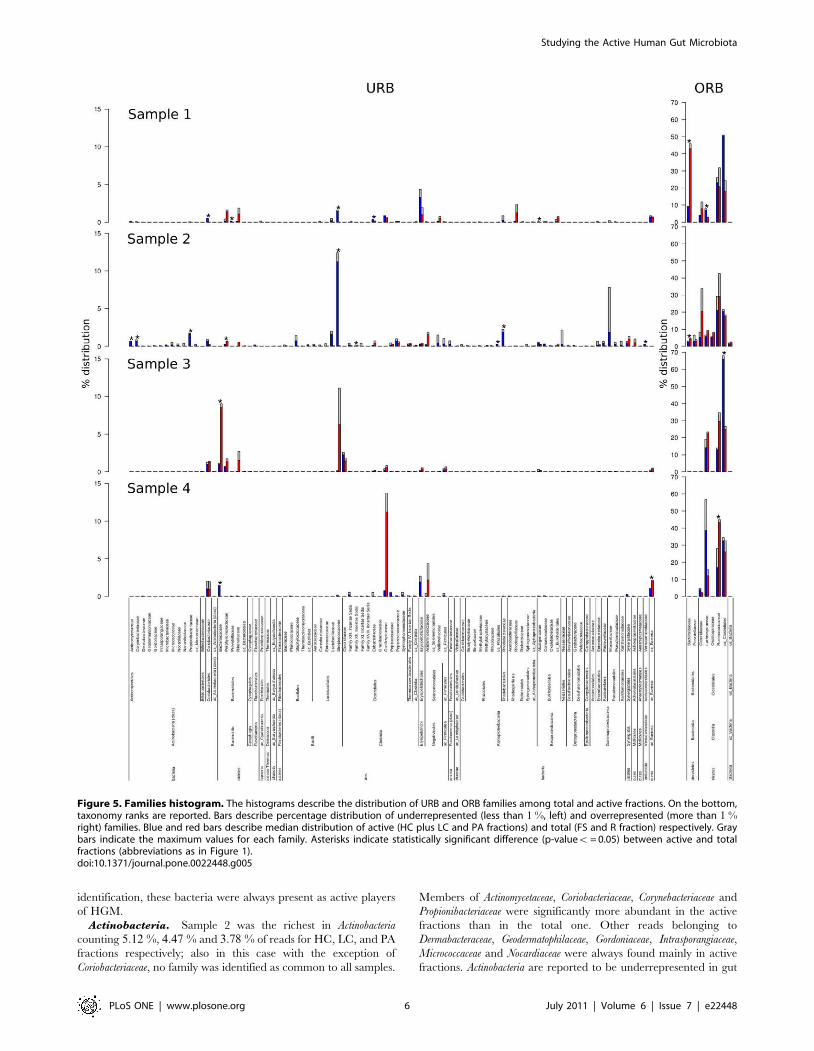
Micrococcaceae and Nocardiaceae were always found mainly in active
fractions. Actinobacteria are reported to be underrepresented in gut
Figure 5. Families histogram. The histograms describe the distribution of URB and ORB families among total and active fractions. On the bottom,taxonomy ranks are reported. Bars describe percentage distribution of underrepresented (less than 1 %, left) and overrepresented (more than 1 %right) families. Blue and red bars describe median distribution of active (HC plus LC and PA fractions) and total (FS and R fraction) respectively. Graybars indicate the maximum values for each family. Asterisks indicate statistically significant difference (p-valuev = 0.05) between active and totalfractions (abbreviations as in Figure 1).doi:10.1371/journal.pone.0022448.g005
Studying the Active Human Gut Microbiota
PLoS ONE | www.plosone.org 6 July 2011 | Volume 6 | Issue 7 | e22448
phylogenetic descriptions, although there is evidence of their active
role as demonstrated by FISH-related studies [30,59]. For a
detailed view on distribution of families see Figure 5.
ConclusionsThe RNA-based cell sorting approach enables the HGM total
and active population to be clearly differentiated. The pyronin-Y-
based sorting methodology provides more detailed information of
the complex HGM community, highlighting the presence of active
underrepresented bacteria hidden by the over represented ones. At
family level the active fractions tend to cluster together
independently of the sample. Finally, altogether the data clearly
show that the functional microbiome should not be deduced
uniquely from DNA-based experiments using raw fecal samples.
Methods
Sample collection and microbial fractions preparationFecal samples were obtained from four healthy human
volunteers (three male and one female) between 25 and 35 years
old, resident in Valencia (Spain). All volunteers follow a
Mediterranean diet. The volunteers involved in this study
provided their written informed consent. The study was approved
by the Ethics and Research Committee of Centre for Public
Health Research (CSISP) of Valencia, Spain. None of the
volunteers had intestinal organic disorders or recent treatment
with antibiotics. Samples were collected in sterile 30 ml screw-cap
Bioinformatics and statistic analysesEach fraction was initially dereplicated using CDHIT software
[63] in order to remove those reads with the same length and
sequence, considering the PERMUTAG as part of the sequence.
MIDs and PERMUTAGs were finally removed leaving a dataset
of 42,582 clean reads with an average length of 492.97 nt. The
phylogenetic assignment was carried out by software developed ad-
hoc in our laboratory based on the last common ancestor (LCA)
algorithm (available at https://github.com/emepyc/Blast2lca).
Descriptive and statistical analyses were carried out with the R
statistic package [64].
The analysis of variance (Table 1) was carried out on
normalized taxonomy table having samples in rows and families
in columns. Bray-Curtis distances were calculated. The obtained
matrix was then used to perform the analysis of variance following
various grouping criteria. ‘‘ACTIVES vs TOTALS’’ shows the
analysis of variance grouping data by active fractions (PA, HC and
LC) versus total fractions (FS and R). ‘‘SAMPLES’’ line describes
the significance of variance grouping the taxonomy matrix by
sample. ‘‘FRACTIONS’’ describes variance among the five
fractions. Stars indicates highly significant values. The analysis
was performed by Adonis method from Vegan R package [64,65]
with 1000 permutations.
A mathematical approach was employed to define if a given
family belonged to the URB or ORB fraction respectively. To do
so, for each sample/fraction, the list of family abundance values
was sorted and the value corresponding to the last inflection point
was used as cut-off. The reads belonging to active (HC, LC and
PA) and total fractions (R and FS) were respectively summarized
and median values were used to perform the Welch Two Sample t-
test which is an adaptation of the Student’s t-test intended for use
with two samples having possibly unequal variances.
Flow cytometry data were analyzed with R package flowCore
and flowViz from Bioconductor [64,66–68].
Accession numbersSequences were deposited in NCBI Sequence Read Archive
(SRA) database (SRP005393).
Supporting Information
Figure S1 Clustering analysis. The figure shows the
heatmap built on abundance values of families (in percentage)
for each sample/fraction. Legend describes percentage ranges;
blue gradient goes exponentially from 0.0001 to 1 representing
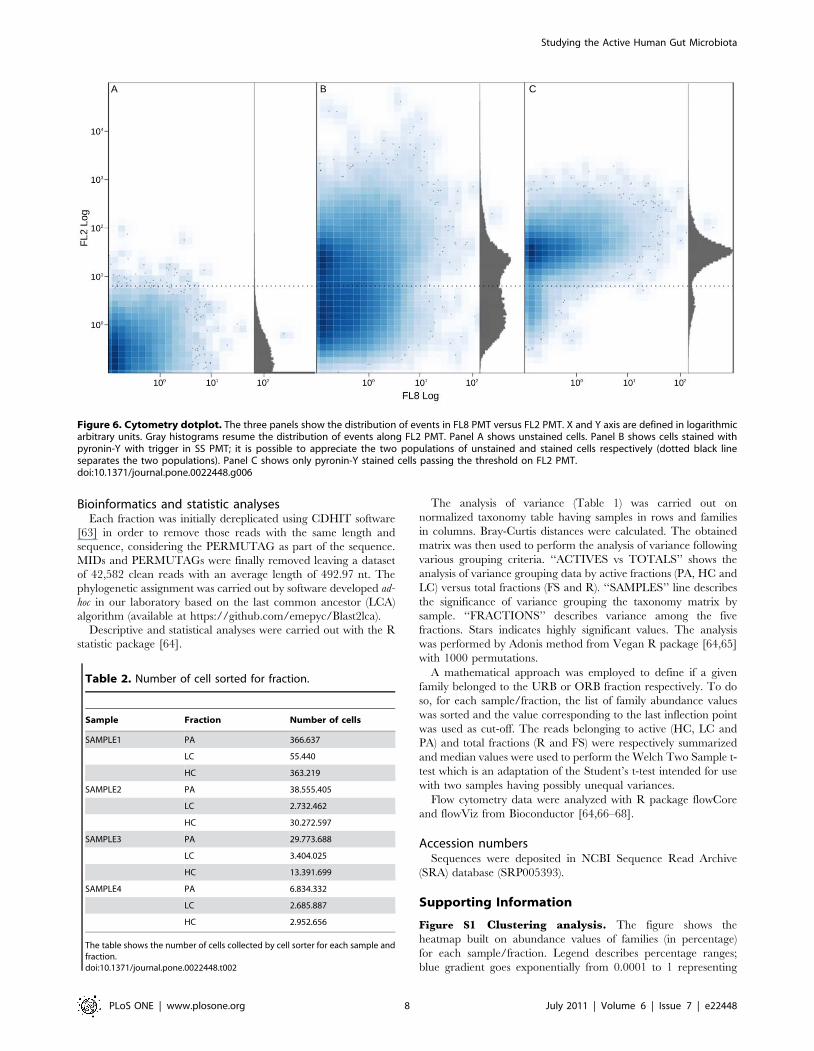
Figure 6. Cytometry dotplot. The three panels show the distribution of events in FL8 PMT versus FL2 PMT. X and Y axis are defined in logarithmicarbitrary units. Gray histograms resume the distribution of events along FL2 PMT. Panel A shows unstained cells. Panel B shows cells stained withpyronin-Y with trigger in SS PMT; it is possible to appreciate the two populations of unstained and stained cells respectively (dotted black lineseparates the two populations). Panel C shows only pyronin-Y stained cells passing the threshold on FL2 PMT.doi:10.1371/journal.pone.0022448.g006
Table 2. Number of cell sorted for fraction.
Sample Fraction Number of cells
SAMPLE1 PA 366.637
LC 55.440
HC 363.219
SAMPLE2 PA 38.555.405
LC 2.732.462
HC 30.272.597
SAMPLE3 PA 29.773.688
LC 3.404.025
HC 13.391.699
SAMPLE4 PA 6.834.332
LC 2.685.887
HC 2.952.656
The table shows the number of cells collected by cell sorter for each sample andfraction.doi:10.1371/journal.pone.0022448.t002
Studying the Active Human Gut Microbiota
PLoS ONE | www.plosone.org 8 July 2011 | Volume 6 | Issue 7 | e22448
ecology of the gastrointestinal tract: from phylogeny to function. Curr Issues
Intest Microbiol 5: 31–47.19. Macfarlane S, Dillon JF (2007) Microbial biofilms in the human gastrointestinal
tract. J Appl Microbiol 102: 1187–1196.20. Durban A, Abellan JJ, Jimenez-Hernandez N, Ponce M, Ponce J, et al. (2011)
Assessing gut microbial diversity from feces and rectal mucosa. Microb Ecol 61:
123–133.21. Hattori M, Taylor TD (2009) The human intestinal microbiome: a new frontier
of human biology. DNA Res 16: 1–12.22. Hsiao WW, Fraser-Liggett CM (2009) Human microbiome project–paving the
way to a better understanding of ourselves and our microbes. Drug DiscovToday 14: 331–333.
23. Peterson J, Garges S, Giovanni M, McInnes P, Wang L, et al. (2009) The nih
human microbiome project. Genome Res 19: 2317–2323.24. Burtscher C, Wuertz S (2003) Evaluation of the use of pcr and reverse
transcriptase pcr for detection of pathogenic bacteria in biosolids from anaerobicdigestors and aerobic composters. Appl Environ Microbiol 69: 4618–4627.
25. Cordova-Kreylos AL, Cao Y, Green PG, Hwang HM, Kuivila KM, et al. (2006)
Diversity, composition, and geographical distribution of microbial communitiesin california salt marsh sediments. Appl Environ Microbiol 72: 3357–3366.
26. Josephson KL, Gerba CP, Pepper IL (1993) Polymerase chain reaction detectionof nonviable bacterial pathogens. Appl Environ Microbiol 59: 3513–3515.
27. Daffonchio D, Borin S, Brusa T, Brusetti L, van der Wielen PW, et al. (2006)Stratified prokaryote network in the oxic-anoxic transition of a deep-sea
halocline. Nature 440: 203–207.
28. Gentile G, Giuliano L, D, Auria G, et al. (2006) Study of bacterial communitiesin Antarctic coastal waters by a combination of 16s rrna and 16s rdna
sequencing. Environ Microbiol 8: 2150–2161.29. Suau A, Bonnet R, Sutren M, Godon JJ, Gibson GR, et al. (1999) Direct analysis
of genes encoding 16s rrna from complex communities reveals many novel
molecular species within the human gut. Appl Environ Microbiol 65:4799–4807.
30. Lay C, Rigottier-Gois L, Holmstrom K, Rajilic M, Vaughan EE, et al. (2005)Colonic microbiota signatures across five northern european countries. Appl
Environ Microbiol 71: 4153–4155.31. Lennon J, Jones S (2011) Microbial seed banks: the ecological and evolutionary
implications of dormancy. Nature Reviews Microbiology 9: 119–130.
32. Ben-Amor K, Heilig H, Smidt H, Vaughan EE, Abee T, et al. (2005) Geneticdiversity of viable, injured, and dead fecal bacteria assessed by fluorescence-
activated cell sorting and 16s rrna gene analysis. Appl Environ Microbiol 71:4679–4689.
33. Podar M, Abulencia CB, Walcher M, Hutchison D, Zengler K, et al. (2007)
Targeted access to the genomes of low-abundance organisms in complexmicrobial communities. Appl Environ Microbiol 73: 3205–3214.
34. Stepanauskas R, Sieracki ME (2007) Matching phylogeny and metabolism in theuncultured marine bacteria, one cell at a time. Proc Natl Acad Sci U S A 104:
Analysis of bacterial function by multi-colour fluorescence flow cytometry and
single cell sorting. J Microbiol Methods 42: 97–114.36. Zoetendal EG, Ben-Amor K, Harmsen HJ, Schut F, Akkermans AD, et al.
(2002) Quantification of uncultured ruminococcus obeum-like bacteria inhuman fecal samples by fluorescent in situ hybridization and flow cytometry
using 16s rrna-targeted probes. Appl Environ Microbiol 68: 4225–4232.
37. Collado MC, Calabuig M, Sanz Y (2007) Differences between the fecalmicrobiota of coeliac infants and healthy controls. Curr Issues Intest Microbiol
8: 9–14.38. McHugh IO, Tucker AL (2007) Flow cytometry for the rapid detection of
bacteria in cell culture production medium. Cytometry A 71: 1019–1026.
39. Heine F, Stahl F, Struber H, Wiacek C, Benndorf D, et al. (2009) Prediction offlocculation ability of brewing yeast inoculates by flow cytometry, proteome
analysis, and mrna profiling. Cytometry A 75: 140–147.40. Muller S, Nebe-von Caron G (2010) Functional single-cell analyses: flow
cytometry and cell sorting of microbial populations and communities. FEMSMicrobiol Rev 34: 554–587.
41. Wu GD, Lewis JD, Hoffmann C, Chen YY, Knight R, et al. (2010) Sampling
and pyrosequencing methods for characterizing bacterial communities in thehuman gut using 16s sequence tags. BMC Microbiol 10: 206.
cellulose-/cellobiose-digesting bacteria isolated from methanogenic sludge.
Int J Syst Evol Microbiol 59: 1764–1770.43. Mahony DE, Meier CE, Macdonald IA, Holdeman LV (1977) Bile salt
degradation by nonfermen-tative clostridia. Appl Environ Microbiol 34:419–423.
44. Garnova ES, Zhilina TN, Tourova TP, Lysenko AM (2003) Anoxynatronumsibiricum gen.nov., sp.nov. alkaliphilic saccharolytic anaerobe from cellulolytic
community of nizhnee beloe (transbaikal region). Extremophiles 7: 213–220.
45. Holdeman L, Moore W (1974) New genus, coprococcus, twelve new species, andemended descriptions of four previously described species of bacteria from
human feces. Int J Syst Bacteriol 24: 260–277.
46. Whitehead TR, Cotta MA, Collins MD, Lawson PA (2004) Hespellia stercorisuisgen. nov., sp. nov. and hespellia porcina sp. nov., isolated from swine manure
storage pits. Int J Syst Evol Microbiol 54: 241–245.
47. Devillard E, McIntosh FM, Duncan SH, Wallace RJ (2007) Metabolism oflinoleic acid by human gut bacteria: different routes for biosynthesis of
48. Duncan SH, Hold GL, Barcenilla A, Stewart CS, Flint HJ (2002) Roseburiaintestinalis sp. nov., a novel saccharolytic, butyrate-producing bacterium from
human faeces. Int J Syst Evol Microbiol 52: 1615–1620.
49. Tan HT, Tan S, Lin Q, Lim TK, Hew CL, et al. (2008) Quantitative and
temporal proteome analysis of butyrate-treated colorectal cancer cells. Mol Cell
Proteomics 7: 1174–1185.
50. Comalada M, Bailon E, de Haro O, Lara-Villoslada F, Xaus J, et al. (2006) The
effects of short-chain fatty acids on colon epithelial proliferation and survivaldepend on the cellular phenotype. J Cancer Res Clin Oncol 132: 487–497.
51. Louis P, Duncan SH, McCrae SI, Millar J, Jackson MS, et al. (2004) Restricted
distribution of the butyrate kinase pathway among butyrate-producing bacteriafrom the human colon. J Bacteriol 186: 2099–2106.
52. Sokol H, Pigneur B, Watterlot L, Lakhdari O, Bermdez-Humarn LG, et al.
(2008) Faecalibacterium prausnitzii is an anti-inflammatory commensalbacterium identified by gut microbiota analysis of crohn disease patients. Proc
Natl Acad Sci U S A 105: 16731–16736.
53. Scheppach W, Weiler F (2004) The butyrate story: old wine in new bottles? Curr
Opin Clin Nutr Metab Care 7: 563–567.
54. Song L, Dong X (2009) Hydrogenoanaerobacterium saccharovorans gen. nov.,sp. nov., isolated from H2-producing UASB granules. Int J Syst Evol Microbiol
59: 295–299.
55. Kang S, Denman SE, Morrison M, Yu Z, Dore J, et al. (2010) Dysbiosis of fecalmicrobiota in Crohn’s disease patients as revealed by a custom phylogenetic
microarray. Inflamm Bowel Dis 16: 2034–2042.
56. Price LB, Liu CM, Melendez JH, Frankel YM, Engelthaler D, et al. (2009)
Community analysis of chronic wound bacteria using 16S rRNA gene-based
pyrosequencing: impact of diabetes and antibiotics on chronic woundmicrobiota. PLoS ONE 4: e6462.
57. Ley RE, Turnbaugh PJ, Klein S, Gordon JI (2006) Microbial ecology: humangut microbes associated with obesity. Nature 444: 1022–1023.
58. De Filippo C, Cavalieri D, Di Paola M, Ramazzotti M, Poullet JB, et al. (2010)
Impact of diet in shaping gut microbiota revealed by a comparative study inchildren from Europe and rural Africa. Proc Natl Acad Sci USA 107:
14691–14696.
59. Harmsen HJM, Raangs GC, He T, Degener JE, Welling GW (2002) Extensiveset of 16s rrna-based probes for detection of bacteria in human feces. Appl
Environ Microbiol 68: 2982–2990.
60. Ausubel F, Brent R, Kinston R, Moore D, Seidman J, et al. (1992) Current
protocol in molecular biology. pp 2.1.1–2.4.5.
61. Lane DDJ, Stackenbrandt E, Goodfellow M (1991) 16S/23S rRNA sequencing.John Wiley and Sons, nucleic acid techniques in bacterial systematics edition
115-175.
62. Niu B, Fu L, Sun S, Li W (2010) Artificial and natural duplicates inpyrosequencing reads of metagenomic data. BMC Bioinformatics 11: 187.
63. Li W, Godzik A (2006) Cd-hit: a fast program for clustering and comparing large
sets of protein or nucleotide sequences. Bioinformatics 22: 1658–1659.
64. R Development Core Team (2010) R: A Language and Environment for
Statistical Computing. R Foundation for Statistical Computing. Vienna, Austria,Available: http://www.R-project.org. ISBN 3-900051-07-0.
Variations of bacterial populations in human feces measured by fluorescent insitu hybridization with group-specific 16s rrna-targeted oligonucleotide probes.
Appl Environ Microbiol 64: 3336–3345.
71. Rochet V, Rigottier-Gois L, Rabot S, Dor J (2004) Validation of fluorescent insitu hybridization combined with flow cytometry for assessing interindividual
variation in the composition of human fecal microflora during long-term storageof samples. J Microbiol Methods 59: 263–270.
flexibacter-bacteroides- specific 16s ribosomal dna-targeted oligonucleotideprobes reveal high bacterial diversity in river taff epilithon. Appl Environ
Microbiol 68: 201–210.
73. Weller R, Glckner FO, Amann R (2000) 16s rrna-targeted oligonucleotideprobes for the in situ detection of members of the phylum cytophaga-