JOURNAL OF GEOPHYSICAL RESEARCH, VOL. 89, NO. B6, PAGES 4597-4611, JUNE 10, 1984 THE ATMOSPHERIC INVENTORY OF XENON AND NOBLE GASES IN SHALES: THE PLASTIC BAG EXPERIMENT T. •. Bernatowicz, F. A. Podosek, M. Honda and F. E. Kramer McDonnell Center for the Space Sciences, Washington University Abstract. Noble gases in five shales have explain the origin of the planetary pattern, but been examined in the traditional protocol for none have gained general acceptance and none trapped gas analysis and also in a new protocol makes an adequate prediction of absolute abun- in which the shales are sealed in air prior to dance levels. The or/gin (perhaps origins) of analysis. The second protocol eliminates the planetary noble gases thus remains a mystery possibility of gas loss in the preanalysis la- Nevertheless, the planetary pattern of noble boratory vacuum exposure characteristic of the gas abundances in bulk meteorites seems ubiqui- traditional protocol. This • experiment is tous. Essentially, all chondrites, and many non- designed to further test the ''shale hy- chondrites as well, have at least some recogniz- pothesis,'' which stipulates that atmospheric no- able Xe; Xe depletion factors, relative to cosmic ble gases occur in the same proportions as abundances, are characteristically in the range ''planetary'' gases in meteorites and that the 10 -4 to 10 -s. Primordial gases lighter than Xe factor of approximately 23 deficiency of air Xe cannot always be resolved from nuclear components relative to planetary Xe is made up by Xe stored produced in situ, but when they can be they occur in shales or other sedimentary rbcks. Previously in planetary proportions. The only known excep- available data do not support this hypothesis but ticns (not very common) are instances of so- could be criticized as possibly seriously un- called "'solar'' noble gases, which are acquired derestimating shale Xe contents because of exper- in direct exposure to the solar wind. The imental limitations. The procedure used in this characteristic feature of the solar abundance study circumvents these limitations, and the pattern is nearly constant depletion for all the results still do not support the shale hy- gases. pothesis. From these results it appears quite In view of the ubiquity of the planetary noble unlikely that sedimentary rocks can account for gas pattern in meteorites and the absence of any the hypothesized missing Xe and, unless some oth- other analog (except the solar pattern) it is er atmospheric reservoir can be found to contain reasonable to expect that noble gas abundances in it, it correspondingly appears that the best the larger terrestrial planets, specifically the working hypothesis is that atmospheric noble earth, should also follow the planetary pattern. gases are simply not planetary. If so, either The only readily quantified noble gas reservoir the chemical history of the earth must account in the earth is the atmosphere, as it has proved for preferential storage of Xe in the earth's in- rather difficult to construct a quantitative in- terior or solar nebula process responsible for ventcry for the interior on the basis of igneous noble gas incorporation in solids were signifi- rock analyses. The atmospheric abundances of Ne. cantly different for meteorites and the earth. At, and Kr agree rather well with this expecta- tion. Their relative abundances are well withi d Introduction the range observed in metecritic planetary gases (whence the name ''planetary''). Their absolute This paper is concerned with one aspect of the abundances (atmospheric inventory divided by the problem of the extent to which noble gases in the mass of the earth) are within the meteorite range earth's atmosphere are analogous to those in as well. The atmospheric abundance pattern is meteorites. Noble gases in meteorites occur in clearly not solar: the 2øNe/S4Kr ratio in air is variable elemental proportions and with a wealth 25, a factor of 2 x 10 -4 lower than the cosmic of isotopic structure complications which indi- abundance ratio (•1.2 x 10s). cate the presence of distinct nucleosynthetic The atmosphere is deficient in He, by several components. We are concerned here with a coatset orders of magnitude when compared to what would scale on which such effects are relatlvely sub- be expected by extension of the planetary pat- tle, however. As an empirical generalization it tern. This presents no puzzle: He degassed into is found that the relative abundances of noble the atmosphere escapes from the earth in geologi- gases in bulk meteorites define a characteristic cally short times (•1 Ma) and there is no evi- pattern usually designated ''planetary.'' The dence against the hypothesis that primordial He basic feature of the planetary pattern is pro- was originally present in planetary proportion to gressively greater depletion of lighter gases, the other noble gases. The atmosphere is also i.e., relative to cosmic abundances, Kr is more deficient in Xe by more than an order of magni- depleted than Xe, Ar more so than Kr, etc. The tude when compared to what would be expected by pattern is steep, accruing to He depletion more extension of the planetary pattern. In view of than five orders of magnitude greater than Xe de- the strength of the chemical analogies between pletion. Several models have been put forward to earth and meteorites in general and for Ne, and Kr in particular, it is reasonable to at least investigate the possibility that in some Copyright 1984 by the American Geophysical Union. sense the atmospheric Xe abundance really is planetary and that some special explanation can Paper number 4B0263. be invoked to account for the deficiency of Xe in 0148-0227 / 84/0 04B-0263•05.00 a it. 4597
Transcript
JOURNAL OF GEOPHYSICAL RESEARCH, VOL. 89, NO. B6, PAGES 4597-4611, JUNE 10, 1984
THE ATMOSPHERIC INVENTORY OF XENON AND NOBLE GASES IN SHALES: THE PLASTIC BAG EXPERIMENT
T. •. Bernatowicz, F. A. Podosek, M. Honda and F. E. Kramer
McDonnell Center for the Space Sciences, Washington University
Abstract. Noble gases in five shales have explain the origin of the planetary pattern, but been examined in the traditional protocol for none have gained general acceptance and none trapped gas analysis and also in a new protocol makes an adequate prediction of absolute abun- in which the shales are sealed in air prior to dance levels. The or/gin (perhaps origins) of
analysis. The second protocol eliminates the planetary noble gases thus remains a mystery. possibility of gas loss in the preanalysis la- Nevertheless, the planetary pattern of noble boratory vacuum exposure characteristic of the gas abundances in bulk meteorites seems ubiqui- traditional protocol. This • experiment is tous. Essentially, all chondrites, and many non- designed to further test the ''shale hy- chondrites as well, have at least some recogniz- pothesis,'' which stipulates that atmospheric no- able Xe; Xe depletion factors, relative to cosmic ble gases occur in the same proportions as abundances, are characteristically in the range ''planetary'' gases in meteorites and that the 10 -4 to 10 -s. Primordial gases lighter than Xe factor of approximately 23 deficiency of air Xe cannot always be resolved from nuclear components relative to planetary Xe is made up by Xe stored produced in situ, but when they can be they occur in shales or other sedimentary rbcks. Previously in planetary proportions. The only known excep- available data do not support this hypothesis but ticns (not very common) are instances of so- could be criticized as possibly seriously un- called "'solar'' noble gases, which are acquired derestimating shale Xe contents because of exper- in direct exposure to the solar wind. The imental limitations. The procedure used in this characteristic feature of the solar abundance study circumvents these limitations, and the pattern is nearly constant depletion for all the results still do not support the shale hy- gases. pothesis. From these results it appears quite In view of the ubiquity of the planetary noble unlikely that sedimentary rocks can account for gas pattern in meteorites and the absence of any the hypothesized missing Xe and, unless some oth- other analog (except the solar pattern) it is er atmospheric reservoir can be found to contain reasonable to expect that noble gas abundances in it, it correspondingly appears that the best the larger terrestrial planets, specifically the working hypothesis is that atmospheric noble earth, should also follow the planetary pattern. gases are simply not planetary. If so, either The only readily quantified noble gas reservoir the chemical history of the earth must account in the earth is the atmosphere, as it has proved for preferential storage of Xe in the earth's in- rather difficult to construct a quantitative in- terior or solar nebula process responsible for ventcry for the interior on the basis of igneous noble gas incorporation in solids were signifi- rock analyses. The atmospheric abundances of Ne. cantly different for meteorites and the earth. At, and Kr agree rather well with this expecta-
tion. Their relative abundances are well withi d Introduction the range observed in metecritic planetary gases
(whence the name ''planetary''). Their absolute This paper is concerned with one aspect of the abundances (atmospheric inventory divided by the
problem of the extent to which noble gases in the mass of the earth) are within the meteorite range earth's atmosphere are analogous to those in as well. The atmospheric abundance pattern is meteorites. Noble gases in meteorites occur in clearly not solar: the 2øNe/S4Kr ratio in air is variable elemental proportions and with a wealth 25, a factor of 2 x 10 -4 lower than the cosmic of isotopic structure complications which indi- abundance ratio (•1.2 x 10s). cate the presence of distinct nucleosynthetic The atmosphere is deficient in He, by several components. We are concerned here with a coatset orders of magnitude when compared to what would scale on which such effects are relatlvely sub- be expected by extension of the planetary pat- tle, however. As an empirical generalization it tern. This presents no puzzle: He degassed into is found that the relative abundances of noble the atmosphere escapes from the earth in geologi- gases in bulk meteorites define a characteristic cally short times (•1 Ma) and there is no evi- pattern usually designated ''planetary.'' The dence against the hypothesis that primordial He basic feature of the planetary pattern is pro- was originally present in planetary proportion to gressively greater depletion of lighter gases, the other noble gases. The atmosphere is also i.e., relative to cosmic abundances, Kr is more deficient in Xe by more than an order of magni- depleted than Xe, Ar more so than Kr, etc. The tude when compared to what would be expected by pattern is steep, accruing to He depletion more extension of the planetary pattern. In view of than five orders of magnitude greater than Xe de- the strength of the chemical analogies between pletion. Several models have been put forward to earth and meteorites in general and for Ne,
and Kr in particular, it is reasonable to at least investigate the possibility that in some
Copyright 1984 by the American Geophysical Union. sense the atmospheric Xe abundance really is planetary and that some special explanation can
Paper number 4B0263. be invoked to account for the deficiency of Xe in 0148-0227 / 84/0 04B-0263•05.00 a it.
4597
4598 Bernatowicz et al.: Xe Inventory in Shales
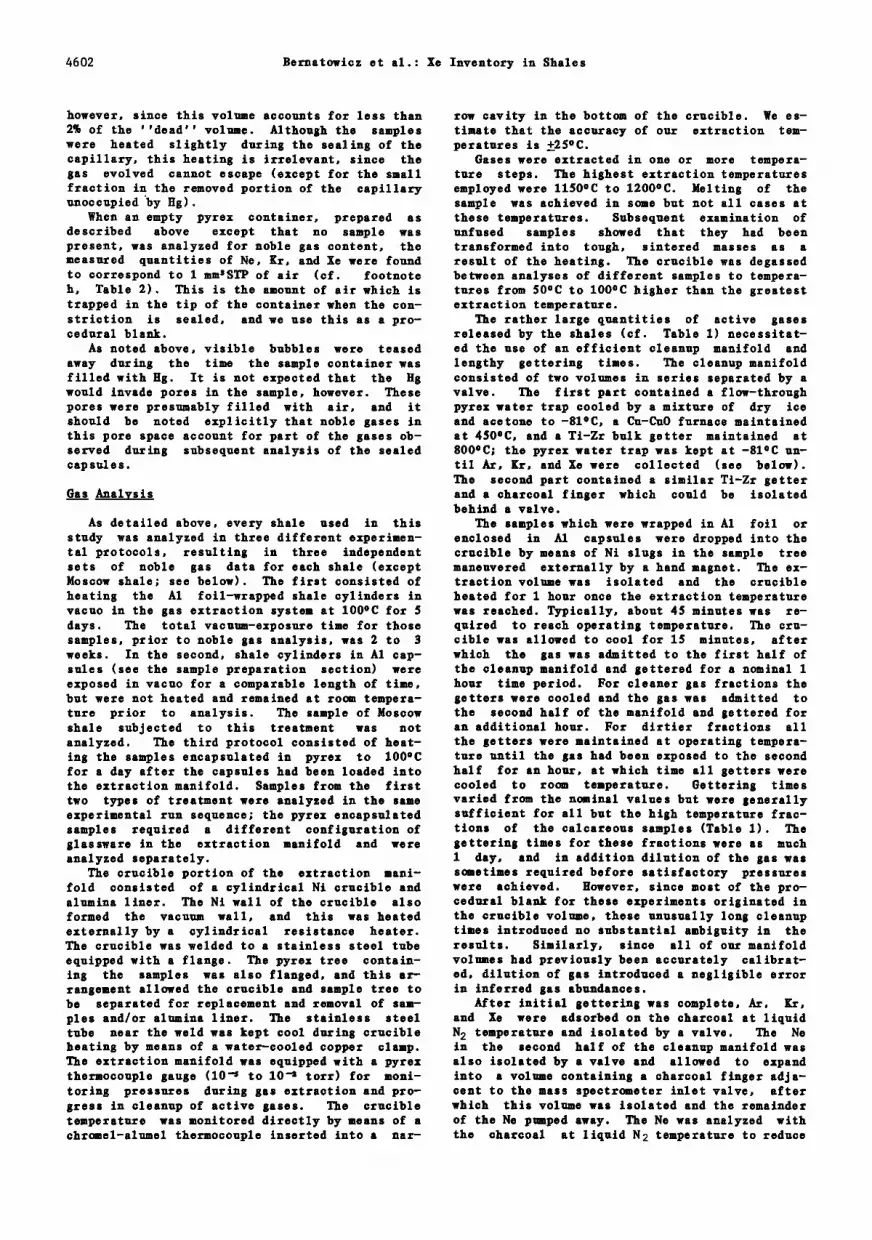
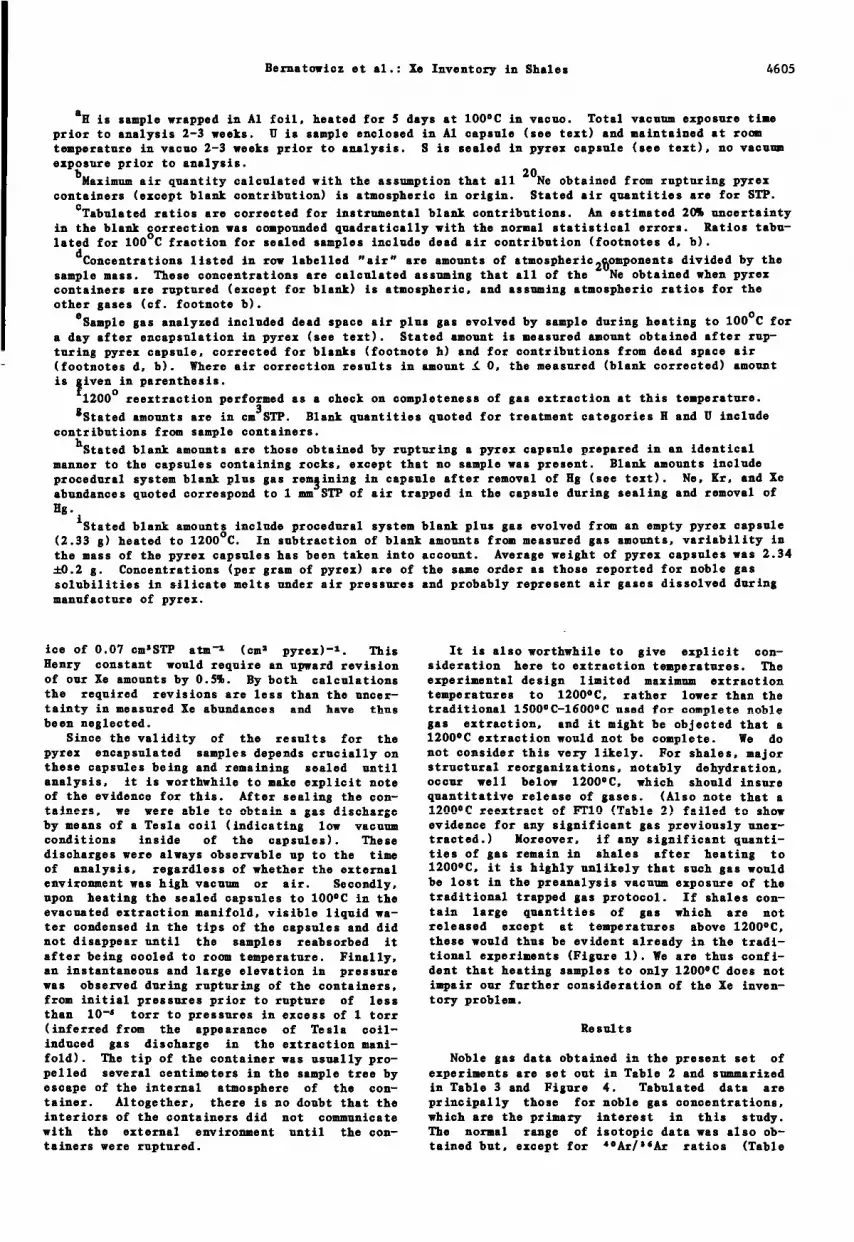
To quantify the Xe deficiency, we will adopt The arguments of Canalas et al. [1968] and for planetary composition the ratio •3øXe/84Kr = Fanale and Cannon [1971] are certainly suggestive 0.125, the value given by Mazor et al. [1970] but, in our opinion, quantitatively inadequate (for type CII carbonaceous chondrites). Mazor et and at best inconclusive. Still, the shale hy- al. estimate the typical variation for carbona- pothesis evidently gained the status of a con- ceous chondrlte planetary composition to'be about sensus, presumably because it is attractively 30•. in Xe/Kr. In air, 13øXe/84Kr = 0.00545, a plausible and because -it is essentially a factor of 23 lower than the nominal planetary ''null'' hypothesis in that it involves the value and far outside the range of variation ob- fewest and/or simplest assumptions needed to ac- served in meteorites. The effect is not subtle. count for the effect. Thus if the shale hy-
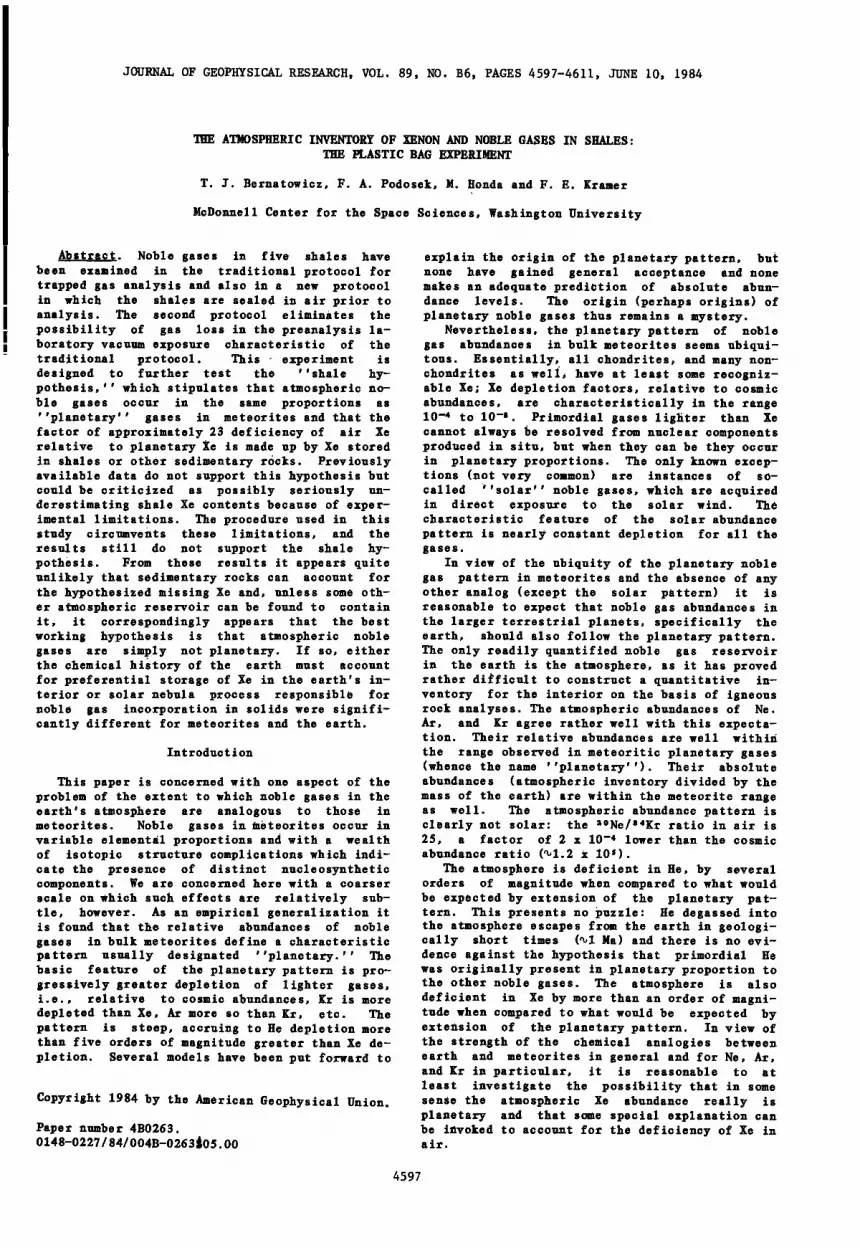
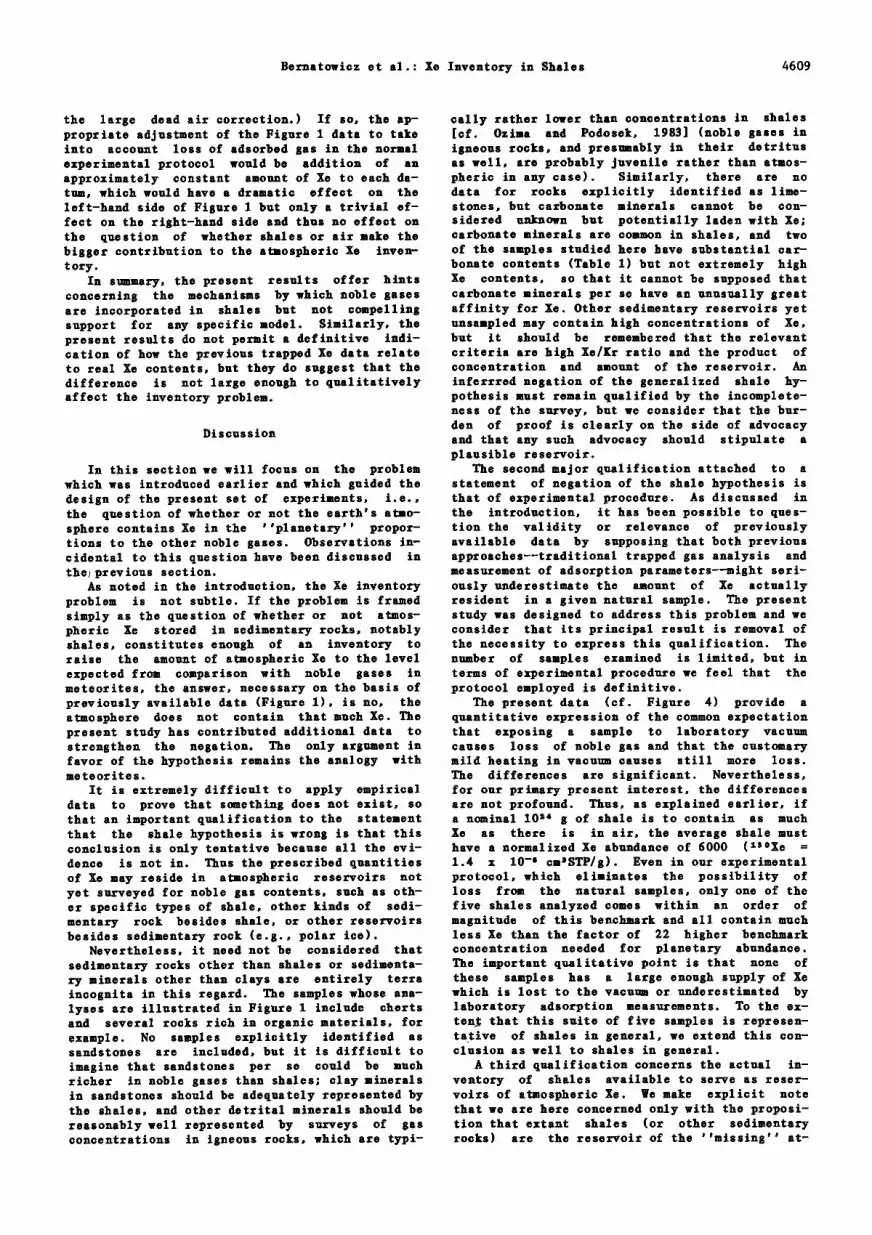
It has been a common opinion that the meteor- pothesis is correct, no special case need be made ite analogy holds and that some special explana- for the ultimate origin of Xe in the earth (still tion can account for the apparent deficiency of unknown, but at least plausibly the same as in Xe in the atmosphere. Indeed, the most commonly meteorites) nor for its geochemical history in accepted special explanation is that even for no- the earth. ble gases, at least Xe, air is too restricted a More recently, Podosek et al. [1980] criti- representative of the atmosphere in the general cized the shale hypothesis [also see Bernatowicz geochemical sense of ''excess volatiles.'' Thus and Podosek, 1978] as unsupported by available major volatiles such as H, C, S, C1, etc. are ex- experimental data. The argument is simple: cess voiatiles which are properly considered part shales are often very rich in Xe but still not of the atmosphere but which are mostly resident rich enough. The relevant data are shown in Fig- in surface reservoirs other than air, viz the ure 1, which includes all published Xe concentra- ocean and sedimentary rocks. The same might be ticns in sedimentary rocks. true for Xe. Besides air itself, however, the For a qualitative appreciation of Xe concen- only atmospheric Xe inventory easy to quantify is trations it is convenient to use a normalization the amount dissolved in seawater. This is small, based on air abundance. The air inventory of however, only 4 - 5 % of the air inventory, and 13øXe is 1.40 x 1016 cm3STP; dividing by the mass does not affect the problem. Emphasis has thus of the earth gives an equivalent concentration of been laid on sedimentary rocks, specifically 2.35 x 10 -•z cm3STP/g of 13øXe. We will use shales. Below we will use the term ''shale hy- ''normalized abundance'' (of 13øXe) to denote the pothesis'' to designate the proposition that the ratio of measured •3øXe concentration in any atmosphere actually does contain all the Xe given rock to this reference concentration. Nor- necessaEy to raise th• Xe/Kr ratio to planetary realized as well as absolute abundances are shown proportions but that most of this Xe is in shales in Figure 1. rather than air. The hypothesis is easily gen- For quantitative assessment we will take the eralized to include other types of sedimentary amount of shale extant on the earth to be approx- rocks or any other surface reservoir, but shale imately 10 z4 g [Wedepohl, 1969]. This is about is the prime candidate. To be valid, the hy- 1/6000 of the mass of the earth. Thus if shales pothesis must account for 22 times the air inven- are to account for as much Xe as air does, the tory of Xe in shales or some other reservoir. weighted average normalized abundance of lie in Such a reservoir must also be strongly preferen- shales must be 6000. If shales are to account tially enriched in lie relative to Kr and the oth- for enough Xe to make up the shortfall from er gases, since the relevant criterion is the planetary proportions, the average normalized lie/l•r ratio, not the absolute amount of Xe. abundance must be 1.3 x 10⁵ a factor of 22
The shale hypothesis was first suggested by higher. As seen in Figure 1, lie abundances in Canalas et al. [1965], who observed shales to be sedimentary rocks range over more than four ord- rich in trapped Xe in both an absolute sense and ers of magnitude, and their distribution is not in the sense of preferential enrichment of Xe re- normal. In such circumstances it is not possible lative to Kr and the lighter gases. A strong to calculate a quantitatively satisfactory inven- preferential enrichment of Xe in shales has since tory. (tualitatively (and subjectively), a mean been found to be general, but the quantitative value somewhere around a normalized abundance of arguments of Canalas et al. are indefensible be- 103 is suggested. This would correspond to a cause they assumed the existence of an exorbitant shale Xe inventory in the range of 10-20• of the amount of shale (see the discussion section). air Xe inventory. This is not trivial, but it is Subsequently, the shale hypothesis was strongly small compared to the magnitudes sought. Even so advocated by Fanale and Cannon [1971]. They cit- tentative a conclusion must be tempered with the ed the trapped Xe data of Canalas et al. in sup- recognition that the data in Figure 1 are by no port of the hypothesis and further suggested that means a representative sampling. The sample pc- trapped gases in shales might originate in or be pulation in Figure 1 is strongly skewed toward mediated by physical adsorption. The specific and displays duplicate analyses of unusual types values that Fanale and Cannon used to evaluate which for one reason or another were thought to the shales hypothesis were actually based on ad- be interesting subjects for noble gas analysis. sorption rather than any trapped gas analysis: On the basis of trapped gas measurements it they estimated shale Xe contents by Xe adsorption seems unlikely that shales can account for as (at 0øC under the partial pressure in air) on a much Xe as air does. Only four analyses yield specific shale. Their calculations can be criti- normalized abundances above the benchmark 6000, cized as involving parameter choices favorable to and only one of these is a normal shale; the oth- the hypothesis, but even so their calculations ers are rare types (thucholite and shungite) are equivalent to a shale Xe inventory 3 times which are presumably unimportant in the total in- the atmospheric inventory, still rather short of ventcry. No sample yet analyzed has a normalized the planetary abundance target. abundance as high as 1.3 x 10⁵ and on such
Bernatowicz et al.: Xe Inventory in Shales 4599
13øXe(cmSSTP/g) • 4 '2 6' • •' •d' ,•7
, I I I I I I
6000 13xlO 5
, , 0 • d' id io' •o • d • io •
NO•IZ•
Fig. 1. Histogram of published Xe concentrations in sedimentary rocks (sh = shale, oh = ohert, k = kerogen, ms = marine sediment, th = thuoholite, o = coal, sg = shungite, ba = barite). •e upper scale gives absolute concentrations of lSøXe; the lower scale gives equivalent normalized abun- dance: absolute concentration divided by 2.3• x 10 -1• omsSTP/g, which is the air inventory of lSøXe divided by the mass of the earth. All data are for ''trapped'' gas analyzed in the tradi- tional protocol involving heating in•vaouo prior to collection of gas for analysis. •e H series data (Table 3) from this study are included; references for other data are given by Ozima and Podosek [1983]. The marke• at normalized abun- dance 6000 indicates the concentration that the
average shale must have if the Xe inventory approximately 10 • g of shale is to equal the Xe inventory in air; the marker at normalized abun- dance 1.3 x 10 s indicates the concentration the
for the hypothesized planetary Xe in the atmo-
grounds the shale hypothesis must be considered to fail.
A more serious qualification of a different sort must be expressed, however. The customary understanding of the amount of gas ''in'' a given sample is that of ''trapped'' noble gas. It is important, however, to make explicit the usually implicit operational definition that trapped gas is that which is observed in a mass spectrometer (or other instrument) after liberation of gases (usually by heating) from the sample in a labora- tory vacuum system. This involves sto•age of the sample, prior to analysis, for periods of hours to months in the laboratory vacuum. During this exposure any gas released from the sample is lost. Usually, any such ''loosely bound'' noble gas is regarded as (atmospheric) contamination and its loss as a desirable end. In most oases,
loss of volatiles in preliminary vacuum exposure is intentionally promoted by heating, e.g., to •100øC, for hours to days. All the data exhibit- ed in Figure 1, indeed, all trapped noble gas data for any rock, have been analyzed with such a protocol involving preliminary exposure to vacu- um.
Laboratory experience indicates that the the
effect of heating and vacuum exposure is particu- larly marked for shales. Phinney [1972], for ex- ample suggested that different ''trapped'' Xe concentrations in two samples of the same shale might be attributed to different vacuum storage times and thus different degrees of gas loss. In the present context the relevant point is that some of the noble gases present ''in'' a sample in nature may be lost in the p•eliminary vacuum exposure and that the normal noble gas measure- ments (Figure 1) may underestimate, perhaps seri- ously, the Xe inventory in shales [of. Podosek et al., 1981; 01ive• and Manuel, 1981].
The most obvious and likely candidate for gas lost in the normal laboratory protocol is that which is simply physically adsorbed and would be quickly lost during the initial evacuation. (The amount of adsorbed gas is, in essence, the basis of the Fanale and Cannon [1971] inventory esti- mate.) To evaluate the importance of adsorbed Xe, Podosek et al. [1981] measured Xe adsorption parameters for several shales. Their results led to an estimated avesage concentration of adsorbed 13øXe of about 3 x'10 -9 om3STP/g, a normalized abundance of about 1500, for adsorption at sur- face temperatures (0-25øC) under the present at- mosphere. The ocrresponding inventory is about 25• of the ai• inventory. The ocrresponding con- clusion is the same as for trapped Xe: the shale inventory of adsorbed lie is probably nontrivial in comparison with the air inventory but still far short of the amount needed to raise atmos-
pheric lie to planetary proportions. This conclusion is also quite tentative.
Aside from the limited data base for shale ad- sorption parameters, there are a number of poten- tial effects which could make shales better or worse adsorbers of Xe in nature than in the la-
boratory. Among the probable effects which would make shales poorer sotbents in nature, and thus lower the inventory estimate, are elevated tem- pe-o+--es .... pore elysure ..... r overburden and the presence of competing sotbates (laboratory measurements of Xe adsorption were performed in vacuum). Podosek et al. [1981] also suggested that simple physical adsorption might make a con- tribution to what would normally be considered trapped gases in shales. If gases are adsorbed on interior surfaces connected with the exterior
of the sample only by long and very narrow (of the order of interlayer spacing in clays) chan- nels, gas atoms must execute a long random walk to escape from the sample, and adsorption slows down the speed of the walk. The overall speed might be sufficiently slow that the gas survives until analysis, thus appearing to be trapped. The same effect might also account for continuous liberation of gases from shales over long periods of vacuum storage. If this effect is at all im- portant, the converse inference is that du•ing the limited time available for a laboratory meas- urement of adsorption parameters, gas may not be able to reach and be adsorbed on these same inte-
rior surfaces. Thus these is the possibility that given geological times, shales in nature might be better sotbents, perhaps much better sotbents, than they appear to be in the laborato- ry.
Estimates of the Xe inventory in shales by the two approaches noted above, trapped gas analysis and adsorption parameterization, yield rather
4600 Bernatowicz et al.: Xe Inventory in Shales
comparable results: perhaps a nontrivial frac- tion of the air lie inventory, but, on the basis of the actual data available, certainly not enough to account for planetary proportions of Xe in the atmosphere. In both cases, however, it is possible to raise objections that the experimen- tal protocol might lead to underestimation of the amount of Xe present in shales in nature.
In this paper we report noble gas contents in shales analyzed by a modified experimental proto- col designed to eliminate the ambiguities re- ferred to above. Sample handling is minimal and the samples are as close to their natural state as possible. The key step is that prior to analysis the samples are sealed in air. Figura- tively, the samples are sealed inside a ''plastic bag, ' ' without heating or vacuum exposure, such that whatever gases are in the sample in nature remain inside the ''bag.'' The sealed samples are then analyzed in the normal way except that the sea1 is not broken until the laboratory vacu- um manifold is closed and all noble gases present in the capsule, including all those in the sam- ple, can be collected and analyzed. This simple expedient assures that all the gases ''in'' or ''on'' the sample are available for analysis. There is no prior vacuum exposure and no argu- ments need be made nor questions asked about mechanism of incorporation or degassing nor about distribution of gases within the sample. It is important to note that this experimental protocol will overestimate the gas content in the sample and so allow setting upper limits in inventory cffl cul a t ions.
Experimental Procedures
Samp 1 ß s
The shale samples used in this study were ob- tained from the rock collection of the Department of Earth Sciences at Washington University, with the exception of Fig Tree shale. The Fig Tree sample was obtained from O. K. Manuel of the University of Missouri at Rolla and had been the subject of previous noble gas analyses by Canalas et al. [1968] and Oliver and Manuel [1981]. The
Fig Tree sample was specifically chosen because prior analyses indicate it to be relatively rich in lie and we wanted at least one such sample in this study. None of the other samples has hith- erto been analyzed for noble gases. Sample selection was made mostly on the basis of availa- bility, but an effort was made to achieve a shale suite with a broad spectrum of geological ages and petrologic types. The ages, provenances, and physical characteristics of our samples are presented in Table 1.
Sample Preparation
Since one of the goals of the present investi- gation was to determine the noble gas contents of shale samples which were as close to their natur- al conditions as was practicable, effort was tak- en to avoid any alteration of the samples beyond physical reduction of size and the unavoidable changes in humidity from field to laboratory en- vironment.
TABLE 1. Sample Characterization
Sampl ß
Sub- Sample Density Weight % Weight
sample Weight, g p, g/cm 3a Carbonate b H20 Fig Tree
shale
FTA1 0.923
FT1 0.926 2.61 1.1 0.5 c FT10 0.455
Pleistocene PCA2 0.720
claystone PCL4 0.792 1.75 <0.1 5.7 d PC10 0.599
Lag onda LAGA1 shale LAG4
LAG10
0.908
0.865 2.27 0.19 7.0 d 0.546
Pottsville POT3 1.055 shale POT2 0.747
POT11 0.894
2.94 21
•/oscow •/SH2 0.989 shale •/SH10 0.775 2.54 24
Description
Precambrian, Onverwacht Group, South Africa. Black, carbonace ous shale.
Pleistocene, Los Angeles Basin, Calif. Grey, silty claystone.
Pennsylvanian, St. Louis County, Mo. Red, ferruginous shale.
Devonian, Erie County, N.Y. Grey, calcareous shale.
Density, H_O and CO_ contents were determined from pieces (not aliquots) of samples analyzed for noble gases. Absence of an entry indicates that the quantity was not measured.
aDensity determined from geometrical measurement of several precisely machined right cylinders of the. rock and from sample masses. Absolute uncertainties in the densities are œ i 5%.
•Carbonate abundances determined using the gasometric method of Hulsemann [196•]. Tabulated values assume that the carbonate is exclusively CaCO.. Absolute analytical uncertainty is œ b•.
CCalculated from weight loss of sample healed for a day at 300øC. Cumulative weight loss at 600øC was.5%, probably mainly reflecting loss of hydrocarbons.
aCalculated from weight loss of samples heated for a day at 600øC.
Bernatowicz et al.: Xe Inventory in Shales 4601
Samples which were used for density determina- tions (cf. Table 1) and intended for preanalysis vacuum exposure were cored from the bulk rock by means of an air cooled diamond corer (8 mm I.D.)
and the ends of the ocres were flattened by abrasive paper. A suite of these right cylinders was wrapped in A1 foil and loaded into the gas extraction manifold of the mass spectrometer. A second suite of these ocres was loaded into A1
capsules, each precisely machined to the dimen- sions of a particular sample. Each capsule con- sisted of a cyolindrical ''jar'' (0.25 mm wall) threaded at the open end and a threaded lid con- taining a 0.5 mm disc of In, which served as a gasket. The samples, when loaded into these cap- sules, were flush with the lip of the container, and sealing of the container was accomplished by compression of the In against a I mm wide sealing annulus forming the lip of the container. These containers were intended to prevent evacuation of the samples prior to gas analysis. A set of identical A1 capsules, containing inverted hollow A1 cylinders to simulate the presence of the sam- ple rook cylinders, was also loaded into the ex- traction system. The purpose of these capsules was to provide a known quantity of air which could be utilized to ascertain whether any leak- age of gas from the capsules had occurred. Pre- vious testing of completely empty A1 capsules had indicated that a good sea1 could be achieved by this design, but the air sample containers, which were analyzed after the capsules containing rocks, were found to be empty. Subsequent test- ing of similar capsules indicated that the pres- ence of the sample interfered with the gasket sea1 and that the A1 capsules containing shales must have been rapidly evacuated in the gas ex- traction manifold. Although these samples are thus useless for the principal purpose of the present experiment, they do provide data on the
8 mm PYREX TUBING I [
<=C
• • Icm
SAMPLE • B
I mm CAPILLARY <--' A
CLAMP PLASTIC HOSE ! D • To Hg Reservoir
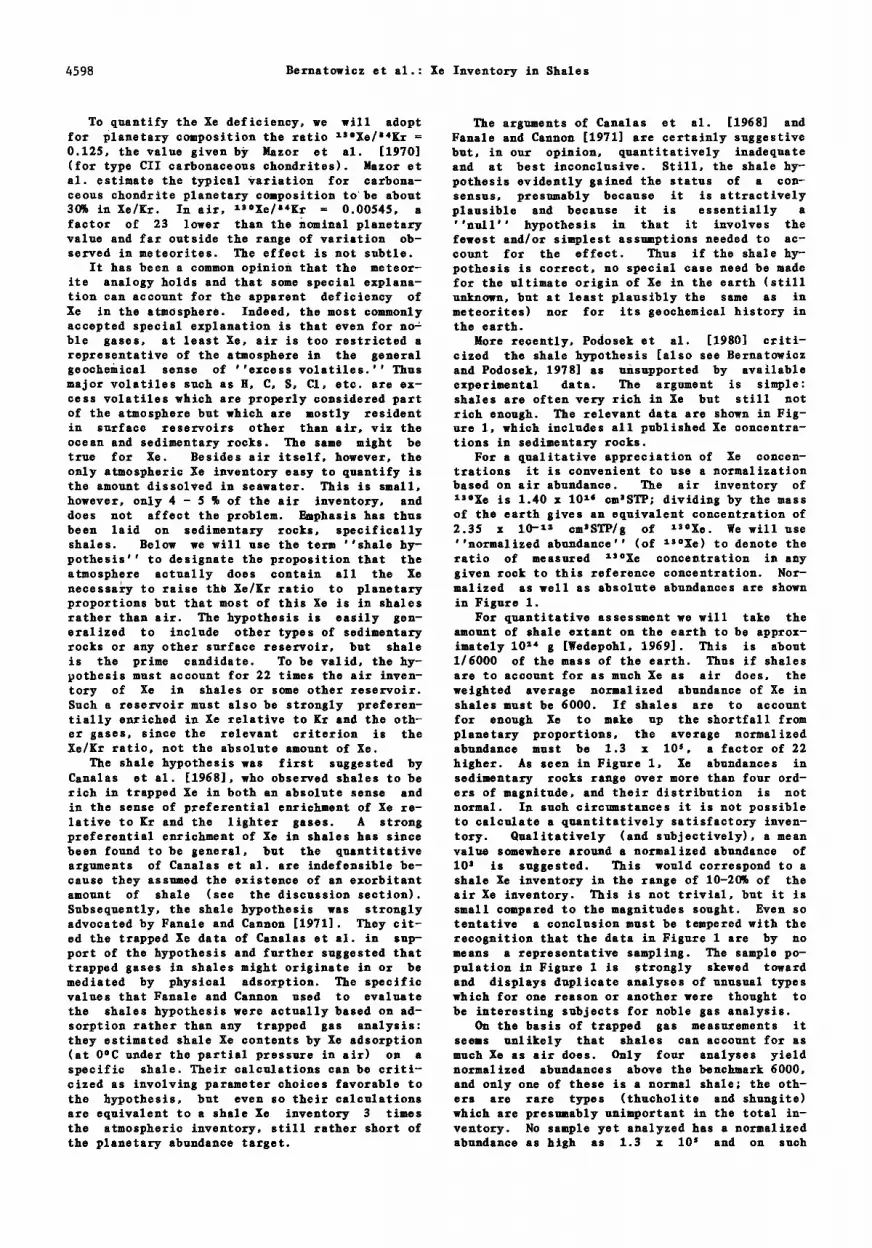
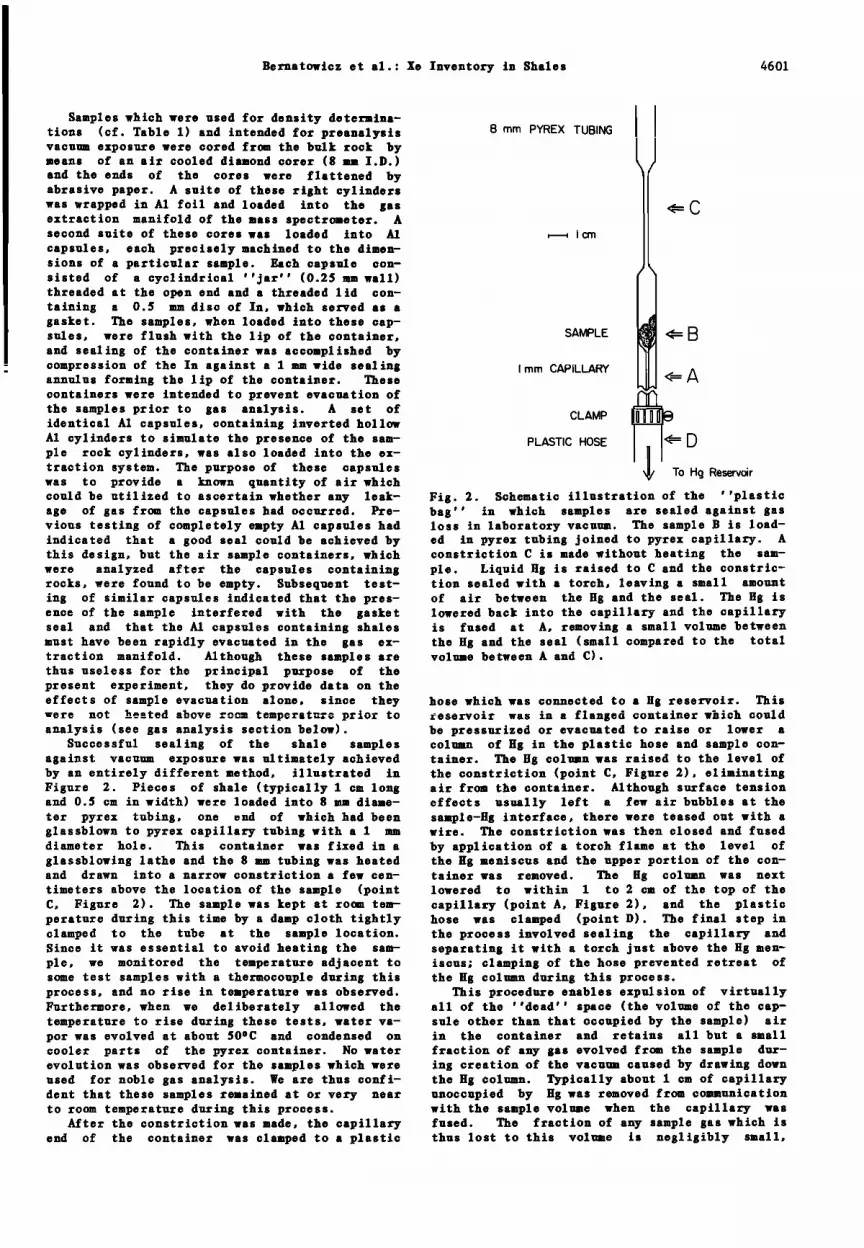
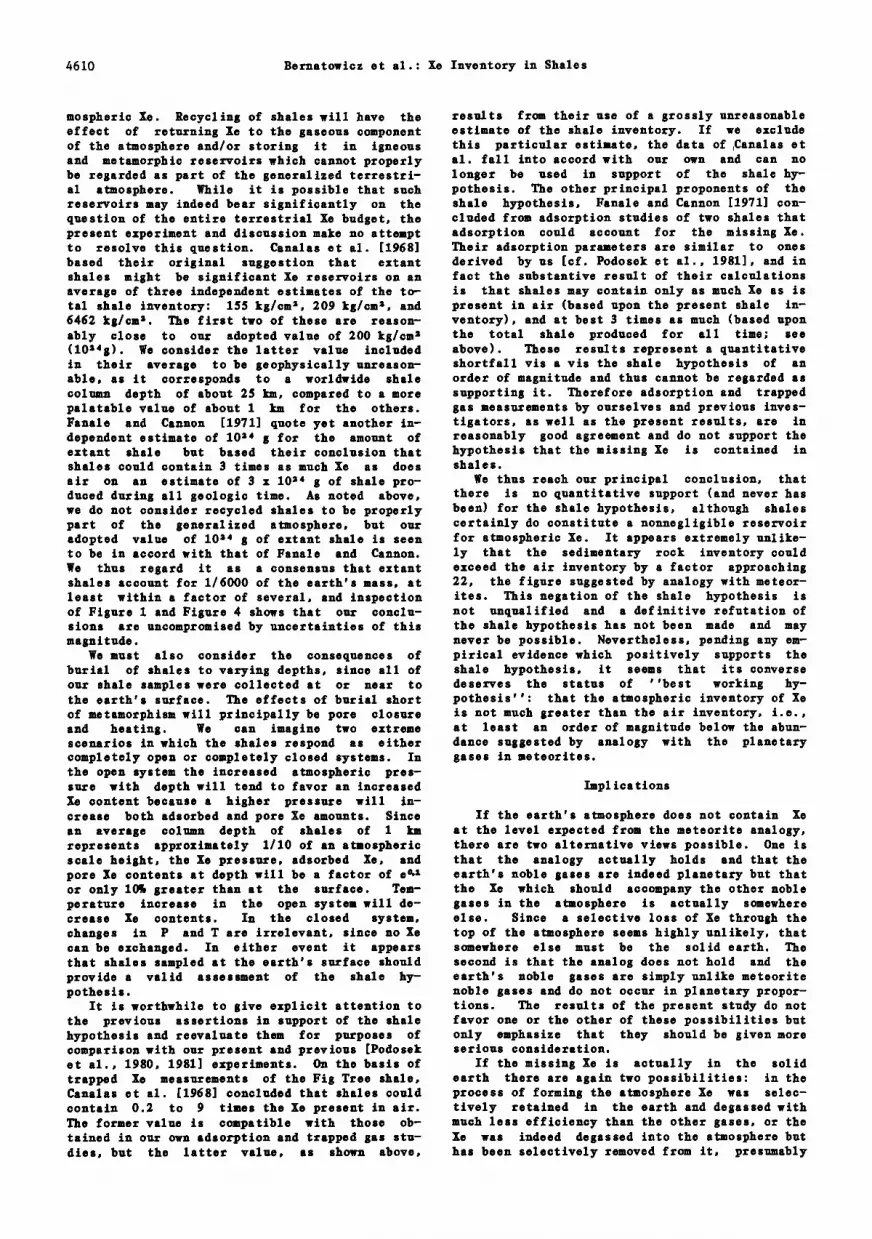
Fig. 2. Schematic illustration of the ''plastic bag'' in which samples are sealed against gas loss in laboratory vacuum. The sample B is load- ed in pyrex tubing joined to pyrex capillary. A constriction C is made without heating the sam- ple. Liquid Hg is raised to C and the constric- tion sealed with a torch, leaving a small amount of air between the Hg and the sea1. The Hg is lowered back into the capillary and the capillary is fused at A, removing a small volume between the Hg and the sea1 (small compared to the total volume between A and C).
effects of sample evacuation alone, since they hose which was connected to a Hg reservoir. This w,r•. •n• 'h•.n•,,,.1 n•,,• room tempcra+--e prior to analysis (see •as analysis section below).
Successful sealint of the shale sample s aiainst vacu• exposure was ultimately achieved by an entirely different method, illustrated Fiiure 2. Pieces of shale (typically I cm lon• and 0.5 cm in width) were loaded into 8 n diame-
ter pyrex tubin t, cam end of which had been ilassblown to pyrex capillary tubin• with a I mm diameter hole. •is container was fixed in a
s1assblowin• lathe and the 8 • tubins was heated and drawn into a narrow constriction a few cen-
timeters above the location of the sample (point C, Fisure 2). •e sample was kept at ro• tern-
reservoir was in a flanged container which could be pressurized or evacuated to raise or lower a column of Hg in the plastic hose and sample con- tainer. The Hg column was raised to the level of the constriction (point C, Figure 2), eliminating air from the container. Although surface tension effects usually left a few air bubbles at the sample-Hg interface, there were teased out with a wire. The constriction was then closed and fused
by application of a torch flame at the level of the Hg meniscus and the upper portion of the con- tainer was removed. The Hg column was next lowered to within 1 to 2 cm of the top of the capillary (point A, Figure 2), and the plastic
perature during this time by a damp cloth tightly hose was clamped (point D). The final step in clamped to the tube at the sample location. Since it was essential to avoid heating the sam- ple, we monitored the temperature adjacent to some test samples with a thermocouple during this process, and no rise in temperature was observed. Furthermore, when we deliberately allowed the temperature to rise during these tests, water va- por was evolved at about 50øC and condensed on cooler parts of the pyrex container. No water evolution was observed for the samples which were used for noble gas analysis. We are thus confi- dent that these samples remained at or very near to room temperature during this process.
After the constriction was made, the capillary end of the container was clamped to a plastic
the process involved sealing the capillary and separating it with a torch just above the Hg men- iscus; clamping of the hose prevented retreat of the Hg column during this process.
This procedure enables expulsion of virtually all of the ''dead'' space (the volume of the cap- sule other than that occupied by the sample) air in the container and retains all but a small
fraction of any gas evolved from the sample dur- ing creation of the vacuum caused by drawing down the Hg column. Typically about Iom of capillary unoccupied by Hg was removed from communication with the sample volume when the capillary was fused. The fraction of any sample gas which is thus lost to this volume is negligibly small,
4602 Bernatowicz et al.: Xe Inventory in Shales
however, since this volume accounts for less than row cavity in the bottom of the crucible. We es- 2% of the ''dead'' volume. Although the samples timate that the accuracy of our extraction tem- were heated slightly during the sealing of the peratures is +_25øC. capillary, this heating is irrelevant, since the Gases were extracted in one or more tempera- gas evolved cannot escape (except for the small ture steps. The highest extraction temperatures fraction in the removed portion of the capillary employed were 1150øC to 1200øC. •lelting of the unoccupied 'by Hg). sample was achieved in some but not all cases at
When an empty pyrex container, prepared as these temperatures. Subsequent examination of described above except that no sample was unfused samples showed that they had been present, was analyzed for noble gas content, the transformed into tough, sintered masses as a measured quantities of Ne, Kr, and Xe were found result of the heating. The crucible was degassed to correspond to I mm3STP of air (cf. footnote between analyses of different samples to tempera- h, Table 2). This is the amount of air which is tures from 50øC to 100øC higher than the greatest trapped in the tip of the container when the con- extraction temperature. striction is sealed, and we use this as a pro- The rather large quantities of active gases cedural blank. released by the shales (cf. Table 1) necessitat-
As noted above, visible bubbles were teased ed the use of an efficient cleanup manifold and away during the time the sample container was lengthy gettering times. The cleanup manifold filled with Hg. It is not expected that the Hg consisted of two volumes in series separated by a would invade pores in the sample, however. These valve. The first part contained a flow-through pores were presumably filled with air, and it pyrex water trap cooled by a mixture of dry ice should be noted explicitly that noble gases in and acetone to-81øC, a Cu-CuO furnace maintained this pore space account for part of the gases ob- at 450øC, and a Ti-7.r bulk getter maintained at served during subsequent analysis of the sealed 800øC; the pyrex water trap was kept at -81øC un- capsules. til A•, lit, and Xe were collected (see below).
The second part contained a similar Ti-7.r getter Gas Analysis and a charcoal finger which could be isolated
behind a valve.
As detailed above, every shale used in this The samples which were wrapped in A1 foil or study was analyzed in three different experlinen- enclosed in A1 capsules were dropped into the tal protocols, resulting in three independent crucible by means of Ni slugs in the sample tree sets of noble gas data for each shale (except maneuvered externally by a hand magnet. The ex- •1oscow shale; see below). The first consisted of traction volume was isolated and the crucible
heating the A1 foil-wrapped shale cylinders in heated for ! hour once the extraction temperature vacuo in the gas extraction system at 100øC for 5 was reached. Typically, about 45 minutes was re- days. The total vacuum-exposure time for those quired to reach operating temperature. The cru- samples, prior to noble gas analysis, was 2 to 3 cible was allowed to cool for 15 minutes, after weeks. In the second, shale cylinders in A1 cap- which the gas was admitted to the first half of sules (see the sample preparation section) were the cleanup manifold and gettered for a nominal exposed in vacuo for a comparable length of time, hour time period. For cleaner gas fractions the but were not heated and remained at room tempera- getters were cooled and the gas was admitted to ture prior to analysis. The sample of l•oscow the second half of the manifold and gettered for shale subjected to this treatment was not an additional hour. For dirtier fractions all analyzed. The third protocol consisted of heat- the getters were maintained at operating tempera- ing the samples encapsulated in pyrex to 100øC ture until the gas had been exposed to the second for a day after the capsules had been loaded into half for an hour, at which time all getters were the extraction manifold. Samples from the first cooled to room temperature. Gettering times two types of treatment were analyzed in the same varied from the nominal values but were generally experimental run sequence; the pyrex encapsulated sufficient for all but the high temperature frac- samples required a different configuration of tions of the calcareous samples (Table 1). The glassware in the extraction manifold and were gettering times for these fractions were as much analyzed separately. I day, and in addition dilution of the gas was
The crucible portion of the extraction mani- sometimes required before satisfactory pressures fold consisted of a cylindrical Ni crucible and were achieved. However, since most of the pro- alumina liner. The Ni wall of the crucible also cedural blank for these experiments originated in formed the vacuum wall, and this was heated the crucible volume, these unusually long cleanup externally by a cylindrical resistance heater. times introduoed no substantial ambiguity in the The crucible was welded to a stainless steel tube results. Similarly, since all of our manifold equipped with a flange. The pyrex tree contain- volumes had previously been accurately calibrat- ing the samples was also flanged, and this at- ed, dilution of gas introduced a negligible error rangement allowed the crucible and sample tree to in inferred gas abundances. be separated for replacement and removal of sam- After initial gettering was complete, A•, ples and/or alumina liner. The stainless steel and Xe were adsorbed on the charcoal at liquid tube near the weld was kept cool during crucible N 2 temperature and isolated by a valve. The Ne heating by means of a water-cooled copper clamp. in the second half of the cleanup manifold was The extraction manifold was equipped with a pyrex also isolated by a valve and allowed to expand thermocouple gauge (10 '• to 10 '• tort) for moni- into a volume containing a charcoal finger adja- toting pressures during gas extraction and pro- cent to the mass spectrometer inlet valve, after gress in cleanup of active gases. The crucible which this volume was isolated and the remainder temperature was monitored directly by means of a of the Ne pumped away. The Ne was analyzed with chromel-alumel thermocouple inserted into a nat- the charcoal at liquid N2 temperature to reduce
Bernatowicz et al.: Xe Inventory in Shales 4603
4øAr•-• interference. Ar was desorbed by warming by means of externally manipulated Ni slugs. The the charcoal to-81øC and allowing the gas to ex- gas evolved from the ruptured containers was pro- pand into the second half of the cleanup mani- cessed and analyzed as described above. This fold. The charcoal was again isolated and the ''extraction'' is nominally considered to have rest of the A• was transferred to another char- been made at 100øC (Table 2), since the sealed coal at liquid N 2 temperature and stored for capsules were heated to 100øC before rupture. later analysis. The remainder of the Ar on the After this ''100øC '' analysis, gases remaining in cleanup system charcoal was removed by exposing the extraction manifold (Ne plus residual active the charcoal (at-81øC) to a pump for 5 minutes. gases) were pumped away and the crucible volume Finally, ]It and Xe were desorbed at 150øC and isolated overnight. The sample and pyrex capsule transferred to a volume adjacent to the mass were subsequently dropped into the crucible and spectrometer. This gas was partitioned by means melted without any additional pumping, and the of a valve into two unequal volumes, the larger evolved gas was collected and analyzed. of which was used for Xe analysis and the smaller It is important to consider here the possible of which was used for ]It analysis. For the dir- effect of exposure of the sealed samples to a tier fractions of gas the gettering was usually pump between the ''100øC '' and melt fractions, not carried to completion during the initial in- since there is the possibility that this pro- let to the cleanup manifold, and in these cases cedure might also remove adsorbed Xe from the the individual noble gas fractions were gettered samples. We consider it unlikely that this is of for 15 minutes with the bulk getter in the second significance for a number of reasons. Firstly, half of the cleanup manifold. Additional getter- since the time that the sample is exposed to a ing was provided by the series of flash getters pump (typically one half hour or less) is short which are a permanent part of our gas processing compared to the time previously taken for cleanup manifolds. and collection of the sample gas (3-4 hours), if
Two mass spectrometers were used in these gas desorption occurs on time scales less than or analyses, one equipped with an electron multi- comparable to several hours, we would already plier, which was used to analyze Ne, Kr, and Xe, have collected more than 80% of any desorbing gas and the other which was used in a Faraday cup before pumping. For longer time scales, desorp- mode for Ar analysis. Both machines are glass tion during pump exposure would be quantitatively Reynolds-type spectrometers (4.5 inch radius, 600 negligible. Secondly, for a nominal Henry con- sector, single focusing). Methods of gas stant for Xe adsorption on shales of 1 cm3STP/g analysis and data reduction are given in detail atto [Podosek et al., 1981], we calculate that by Drozd [1974]. Additional mass spectrometric about half of any adsorbed Xe would already have details are given in the footnotes to Table 2. evolved in the gas phase during the two weeks
Gas quantities were determined by the usual between partial evacuation of the pyrex capsules peak height comparison, with sensitivities call- (by Hg withdrawal prior to sealing the capsules) brated by analyzing pipetted aliquots of air. and rupturing. We are thus confident that the Gas concentrations reported here differ from removal of residual Ne by pumping does not those given in a previous report by Bernatowicz compromise our experimental results. et al. [1983], subsequent to which we discovered We have also considered the possibility that a progressive leak in our calibration gas pi- adsorption of Xe on the pyrex water trap might pette, which caused us to overestimate instrumen- lead to an underestimate of Xe abundances in our tal sensitivities. This problem was corrected, samples. From previous adsorption studies [Pc- and gas abundances measured on standard samples dosek et al., 1981] we estimate an upper limit (e.g., hbg3r, Bjurbole) are in satisfactory for the Henry constant of Xe adsorption at the agreement with previous measurements in other la- trap temperature (-81øC) of 0.4 cm3STP atm-•(cm" boratories as well as this one. Tabulated quan- pyrex) -•. From the surface area of our water titles of Ne. ][r. and Xe are accurate within an trap (150 cm") and the volume of the system corn- estimated 2• uncertainty. Ar quantities are municating with the trap we calculate that this somewhat more uncertain. As noted above, the Ne, maximum Henry constant would require at most a 3% ][r, and Xe released by the rupture of our blank upward revision in our measured Xe amounts. pyrex container were present in air proportions, Since the water trap collected an opaque film of as expected. At, however, was lower than air water ice for all samples studied (except Fig proportions by about 50%. We suspect that this. Tree), we also conducted several Xe adsorption is a calibration problem resulting from the pres- experiments on the water trap in the presence of ence of extraneous gas in the Ar fraction for the water evolved from sample PC10 (cf. Tables I and pyrex container which would not have been present 2) to assess the possibility that the trap might in our normal calibration pipettes. Since the be a better Xe sotbent in the presence of water spectrometer response depends on the total pres- ice. A known quantity of Xe was admitted to the sure, the instrumental sensitivity would be lower first half of the cleanup manifold containing the than for our calibrations (where Ar predom- water trap with the water from PC10 condensed as inates), which is the sense of the effect. We ice at-81øC. The volume was isolated and the thus must consider it possible that quoted Ar trap was allowed to warm to room temperature. abundances for the samples are systematically The water was then re-condensed at -81øC in the low, perhaps by as much as a factor of 2. presence of the Xe, after which the residual Xe
The experimental procedure for the pyrex en- was collected and measured. The volume was then capsulated samples was essentially the same as isolated again, the water released into the gas that described above, except for the following phase and recondensed at-81oC, and residual Xe variations. Prior to analysis the gas extraction collected. From several such experiments we at- manifold was isolated and the pyrex capsule was rived at an average Henry constant for Xe adsorp- ruptured by breaking off the tip of the container tion on pyrex (at -81øC) in the presence of water
4604 Bernatowicz et al.: Xe Inventory in Shales
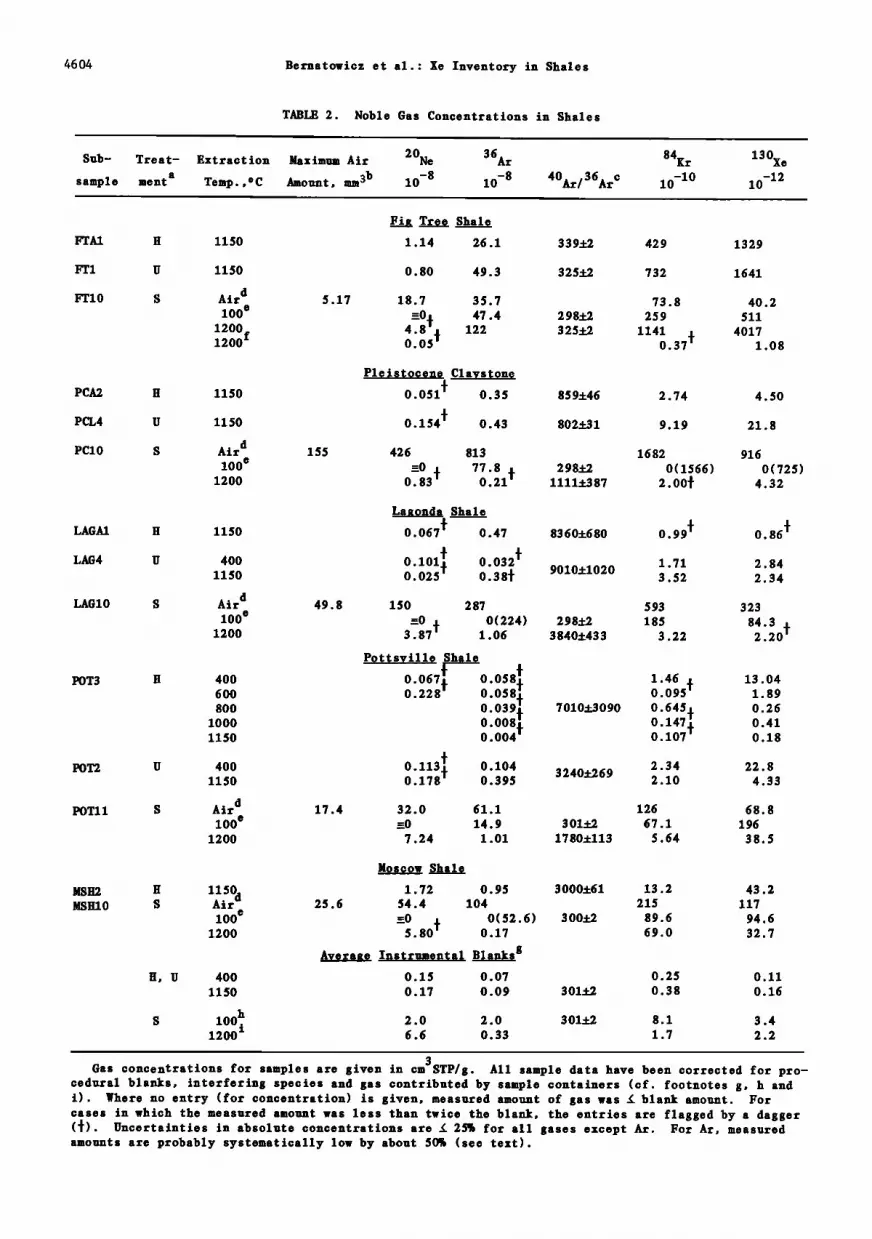
TABLE 2. Noble Gas Concentrations in Shales
Sub-
sample
Treat- Extraction a
ment Temp., o C
Maximum Air 20Ne 36At Amount, mm 3b 10 -8 10 -8 40At/36ARC
Average Instrumental Blanks g 0.15 0.07 0.25 0.11 0.17 0.09 301+2 0.38 0.16
2.0 2.0 30l.f./ 8.1 3.4
6.6 0.33 1.7 2.2
3 Gas concentrations for samples are given in cm STP/g. All sample data have been corrected for pro-
cedural blanks, interfering species and gas contributed by sample containers (cf. footnotes g, h and i). Where no entry (for concentration) is given, measured amount of gas was • blank amount. For cases in which the measured amount was less than twice the blank, the entries are flagged by a dagger (•). Uncertainties in absolute concentrations are • 25% for all gases except At. For At, measured amounts are probably systematically low by about 50% (see text).
Bernatowicz et al.: Xe Inventory in Shales 4605
aH is sample wrapped in A1 foil, heated for 5 days at 100øC in vaouo. Total vacuum exposure time prior to analysis 2-3 weeks. U is sample enclosed in A1 capsule (see text) and maintained at room temperature in vacuo 1-3 weeks prior to analysis. S is sealed in pyrex capsule (see text), no vacuum exposure prior to analysis.
bMaximum air quantity calculated with the assumption that all 20Ne obtained from rupturing pyrex containers (except blank contribution) is atmospheric in origin. Stated air quantities are for STP.
øTabulated ratios are corrected for instrumental blank contributions. An estimated 20% uncertainty in the blank correction was compounded quadratically with the normal statistical errors. Ratios tabu- lated for 100øC fraction for sealed samples include dead air contribution (footnotes d, b).
dconcentrations listed in row labelled "air"are amounts of atmospherio•.•omponents divided by the sample mass. These concentrations are calculate assuming that all of the --Ne obtained when pyrex containers are ruptured (except for blank) is atmospheric, and assuming atmospheric ratios for the other gases (cf. footnote b).
eSample gas analyzed included dead space air plus gas evolved by sample during heating to 100øC for a day after encapsulation in pyrex (see text). Stated amount is measured amount obtained after rup- turing pyrex capsule, corrected for blanks (footnote h) and for contributions from dead space air (footnotes d, b). Where air correction results in amount œ 0, the measured (blank corrected) amount
is •iven in parenthesis. -1200 ø reextraotion performed as a check on completeness of gas extraction at this temperature. gStated amounts are in cm3STP. Blank quantities quoted for treatment categories H and U include
contributions from sample containers.
hstated blank amounts are those obtained by rupturing a pyrex capsule prepared in an identical manner to the capsules containing rocks, except that no sample was present. Blank amounts include
procedural system blank plus gas remaining in capsule after removal of Hg (see text). Ne, Kr, and Xe abundances quoted ocrrespond to i mm STP of air trapped in the capsule during sealing and removal of Hg.
i Stated blank amounts include procedural system blank plus gas evolved from an empty pyrex capsule
(2.33 g) heated to 1200øC. In subtraction of blank amounts from measured gas amounts, variability in the mass of the pyrex capsules has been taken into account. Average weight of pyrex capsules was 2.34 +0.2 g. Concentrations (per gram of pyrex) are of the same order as those reported for noble gas solubilities in silicate melts under air pressures and probably represent air gases dissolved during manufacture of pyrex.
ice of 0.07 cmsSTP atto -• (cm 2 pyrex)-•. This It is also worthwhile to give explicit con- Henry constant would require an upward revision sideration here to extraction temperatures. The of our Xe amounts by 0.5%. By both calculations experimental design limited maximum extraction the required revisions are less than the unoer- temperatures to 1200øC, rather lower than the tainty in measured Xe abundances and have thus traditional 1500øC-1600øC used for complete _noble been neglected. gas extraction, and it might be objected that a
Since the validity of the results for the 1200øC extraction would not be complete. We do pyrex encapsulated samples depends crucially on not consider this very likely. l•or shales, major these capsules being and remaining sealed until structural reorganizations, notably dehydration, analysis, it is worthwhile to make explicit note occur well below 1200øC, which should insure of the evidence for this. After sealing the con- quantitative release of gases. (Also note that a taine.•s, we were able to obtain a gas dlsoharge by means of a Tesla coil (indicating low vacuum conditions inside of the capsules). These discharges were always observable up to the time of analysis, regardless of whether the external environment was high vacuum or air. Secondly, upon heating the sealed capsules to 100øC in the evacuated extraction manifold, visible liquid wa- ter condensed in the tips of the capsules and did not disappear until the samples reabsorbed it after being cooled to room temperature. l•inally, an instantaneous and large elevation in pressure was observed during rupturing of the containers, from initial pressures prior to rupture of less than 10 -• tort to pressures in excess of i tort (inferred from the appearance of Tesla coil- induced gas discharge in the extraction mani- fold). The tip of the container was usually pro- pelled several centimeters in the sample tree by escape of the internal atmosphere of the con- tainer. Altogether, there is no doubt that the interiors of the containers did not communicate
with the external environment until the con-
tainers were ruptured.
l•nno• ..extract •½ FT10 ITo•!• 2• foiled to show
evidence for any significant gas previously unex- tracted.) Moreover, if any significant quanti- ties of gas remain in shales after heating to 1200øC, it is highly unlikely that such gas would be lost in the preanalysis vacuum exposure of the traditional trapped gas protocol. If shales con- tain large quantities of gas which are not released except at temperatures above 1200øC, these would thus be evident already in the tradi- tional experiments (Figure 1). We are thus confi- dent that heating samples to only 1200øC does not impair our further consideration of the Xe inven- tory problem.
Re s ul t s
Noble gas data obtained in the present set of experiments are set out in Table 2 and summarized in Table 3 and l•igure 4. Tabulated data are principally those for noble gas concentrations, which are the primary interest in this study. The normal range of isotopic data was also ob- tained but, except for 4øAr/36Ar ratios (Table
4606 Bernatowicz et al.: lie Inventory in Shales
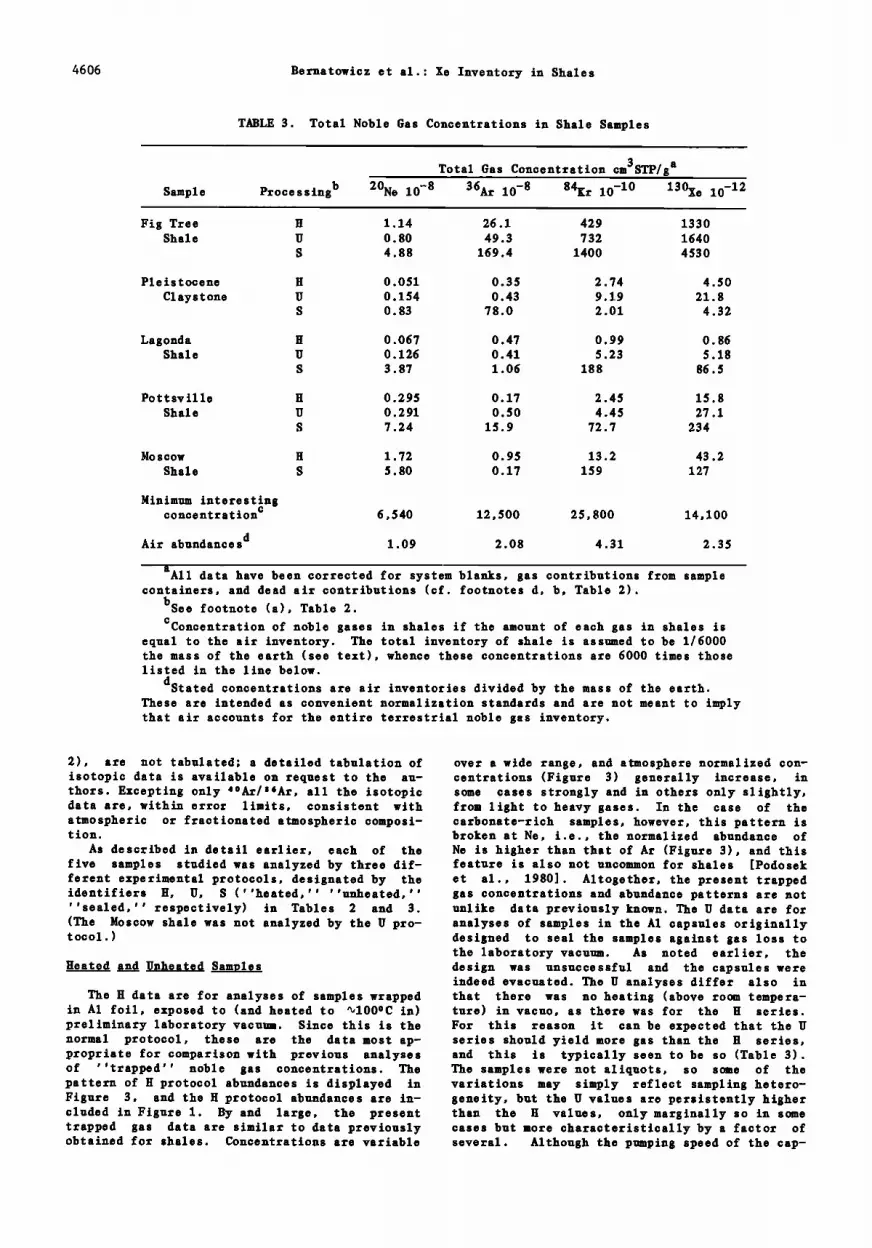
TABLE 3. Total Noble 6as Concentrations in Shale Samples
Sample
Total Gas Concentration cm3STP/g a Processing b 20Ne 10 -8 36At 10 -8 84œr 10 -10 130Xe 10-12
Fig Tree H 1.14 26.1 429 1330 Shale U 0.80 49.3 732 1640
S 4.88 169.4 1400 4530
Pleistocene H 0.051 0.35 2.74 4.50
C1 ays t one U 0.154 0.43 9.19 21.8 S 0.83 78.0 2.01 4.32
Lagonda H 0.067 0.47 0.99 0.86 Shale U 0.126 0.41 5.23 5.18
S 3.87 1.06 188 86.5
Pottsviile H 0.295 0.17 2.45 15.8 Shale U 0.291 0.50 4.45 27.1
S 7.24 15.9 72.7 234
•Io scow H 1.72 O. 95 13.2 43.2
Shale S 5.80 0.17 159 127
Minimum interesting concent r a tion c 6,540 12,500 25,800 14,100
d Air abundances 1.09 2.08 4.31 2.35
aAll data have been corrected for system blanks, gas contributions from sample containers, and dead air contributions (cf. footnotes d, b, Table 2).
b See footnote (a), Table 2.
c
Concentration of noble gases in shales if the amount of each gas in shales is equal to the air inventory. The total inventory of shale is assumed to be 1/6000 the mass of the earth (see text), whence these concentrations are 6000 times those listed in the line below.
d Stated concentrations are air inventories divided by the mass of the earth.
These are intended as convenient normalization standards and are not meant to imply that air accounts for the entire terrestrial noble gas inventory.
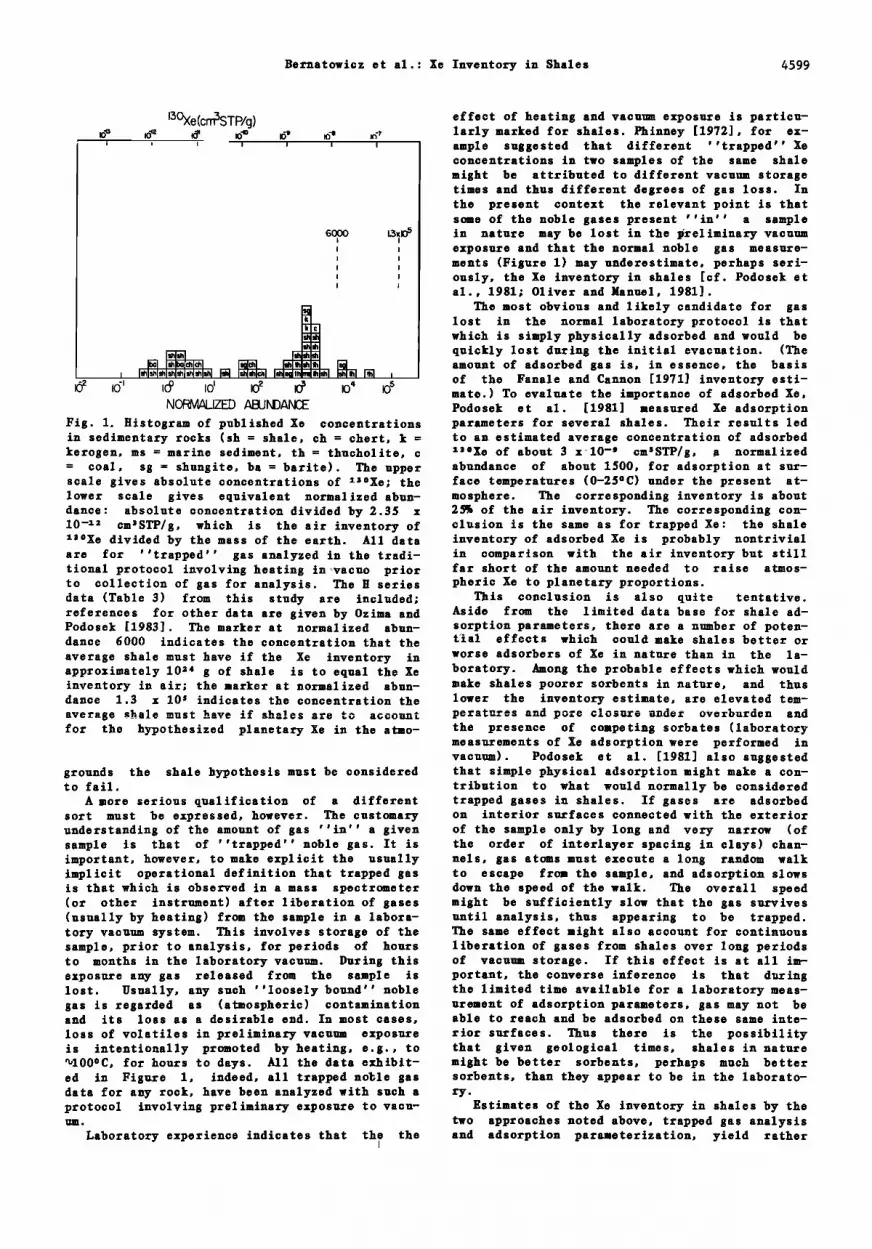
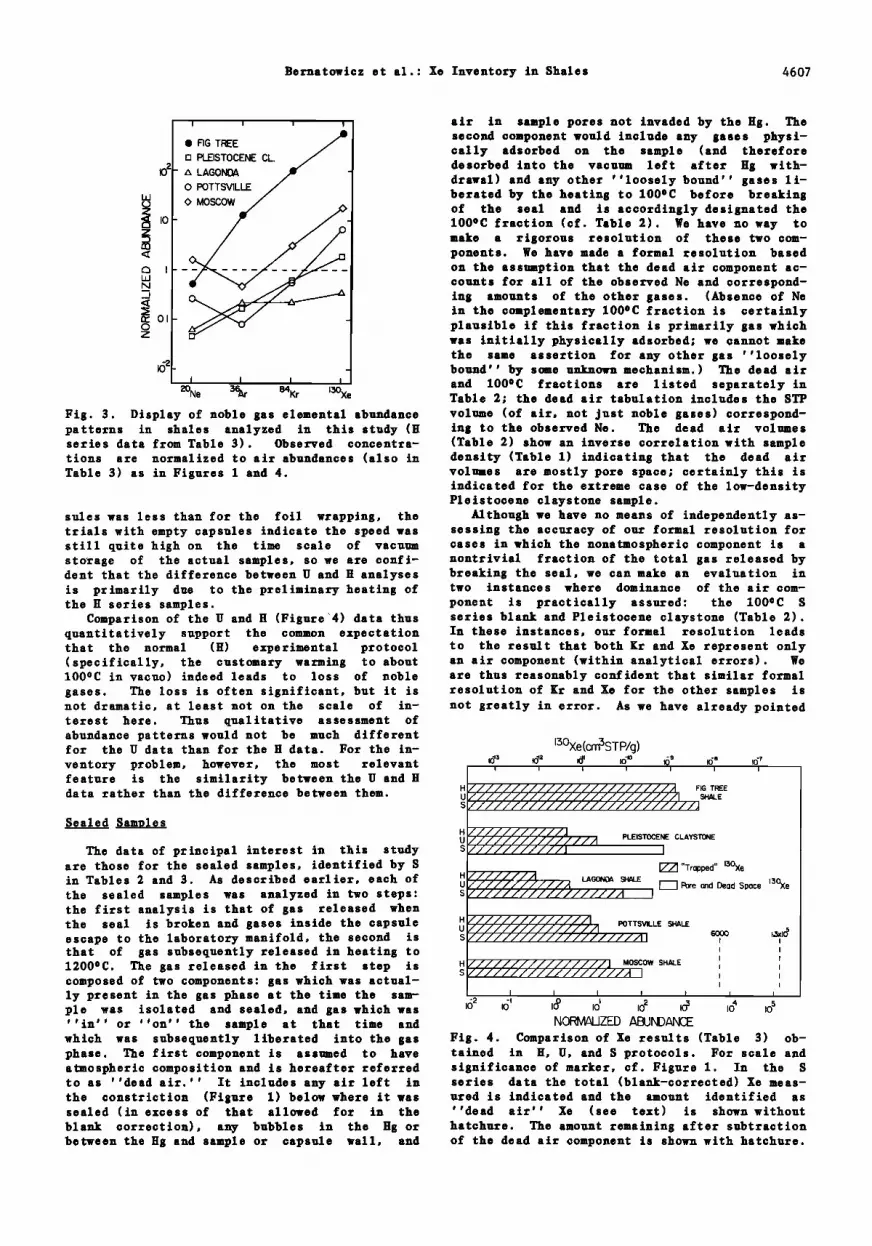
2), are not tabulated; a detailed tabulation of over a wide range, and atmosphere normalized con- isotopic data is available on request to the au- centrations (Figure 3) generally increase, in thors. Excepting only 4øAr/S•Ar, all the isotopic some cases strongly and in others only slightly, data are, within error limits, consistent with from light to heavy gases. In the case of the atmospheric or fractionated atmospheric composi- carbonate-rich samples, however, this pattern is tion. broken at Ne, i.e., the normalized abundance of
As described in detail earlier, each of the Ne is higher than that of Ar (Figure 3), and this five samples studied was analyzed by three dif- feature is also not uncommon for shales [Podosek ferent experimental protocols, designated by the et al., 1980]. Altogether, the present trapped identifiers H, U, S (''heated,'' ''unheated,'' gas concentrations and abundance patterns are not ''sealed,'' respectively) in Tables 2 and 3. unlike data previously known. The U data are for (The Moscow shale was not analyzed by the U pro- analyses of samples in the A1 capsules originally tocol.) designed to sea1 the samples against gas loss to
the laboratory vacuum. As noted earlier, the Heated and Unheated Samples design was unsuccessful and the capsules were
indeed evacuated. The U analyses differ also in The H data are for analyses of samples wrapped that there was no heating (above room tempera-
in A1 foil, exposed to (and heated to %100øC in) ture) in vacuo, as there was for the H series. preliminary laboratory vacuum. Since this is the For this reason it can be expected that the U normal protocol, these are the data most ap- series should yield more gas than the H series, propriate for comparison with previous analyses and this is typically seen to be so (Table 3). of ''trapped'' noble gas concentrations. The The samples were not aliquots, so some of the pattern of H protocol abundances is displayed in variations may simply reflect sampling hetero- Figure 3, and the H protocol abundances are in- geneity, but the U values are persistently higher cluded in Figure 1. By and large, the present than the H values, only marginally so in some trapped gas data are similar to data previously cases but more characteristically by a factor of obtained for shales. Concentrations are variable several. Although the pumping speed of the cap-
Bernatowicz et al.: Xe Inventory in Shales 4607
I I I I
• o MOSCOW I0 -
- 0.1
i i i i
20Ne 36Ar 84Kr 130Xe
air in sample pores not invaded by the Hi. The second component would include any gases physi- cally adsorbed on the sample (and therefore desorbed into the vacuum left after Hg with- drawal) and any other ''loosely bound'' gases li- berated by the heating to 100øC before breaking of the sea1 and is accordingly designated the 100øC fraction (cf. Table 2). We have no way to make a rigorous resolution of these two com- ponents. We have made a formal resolution based on the assumption that the dead air component ac- counts for all of the observed Ne and correspond- ing amounts of the other gases. (Absence of Ne in the complementary 100øC fraction is certainly plausible if this fraction is primarily gas which was initially physically adsorbed; we cannot make the same assertion for any other gas ''loosely bound'' by some unknown mechanism.) The dead air and 100øC fractions are listed separately in Table 2; the dead air tabulation includes the STP
l•ig. 3. Display of noble gas elemental abundance volume (of air, not just noble gases) correspond- patterns in shales analyzed in this study (H ing to the observed Ne. The dead air volumes series data from Table 3). Observed concentra- (Table 2) show an inverse correlation with sample ticns are normalized to air abundances (also in density (Table 1) indicating that the dead air Table 3) as in 1;igures 1 and 4. volumes are mostly pore space; certainly this is
indicated for the extreme case of the low-density Pleistocene claystone sample.
sules was less than for the foil wrapping, the Although we have no means of independentlyas- trials with empty capsules indicate the speed was sessing the accuracy of our formal resolution for still quite high on the time scale of vacuum cases in which the nonatmospheric component is a storage of the actual samples, so we are confi- nontrivial fraction of the total gas released by dent that the difference between U and H analyses breaking the sea1, we can make an evaluation in is primarily due to the preliminary heating of two instances where dominance of the air corn- the H series samples. ponent is practically assu•ed: the 100øC S
Comparison of the U and H (Figure :4) data thus series blank and Pleistocene claystone (Table 2). quantitatively support the common expectation In these instances, our formal resolution leads that the normal (H) experimental protocol to the result that both œr and Xe represent only (specifically, the customary warming to about an air component (within analytical errors). We 100oC in vacuo) indeed leads to loss of noble are thus reasonably confident that similar formal gases. The loss is often signiœicant, but it is resolution of œr and Xe for the other samples is not dramatic, at least not on the scale of in- not greatly in error. As we have already pointed terest here. Thus qualitative assessment of abundance patterns would not be much different for the U data than for the H data. For the in-
ventory problem, however, the most relevant feature is the similarity between the U and H data rather than the difference between them.
Sealed Samples
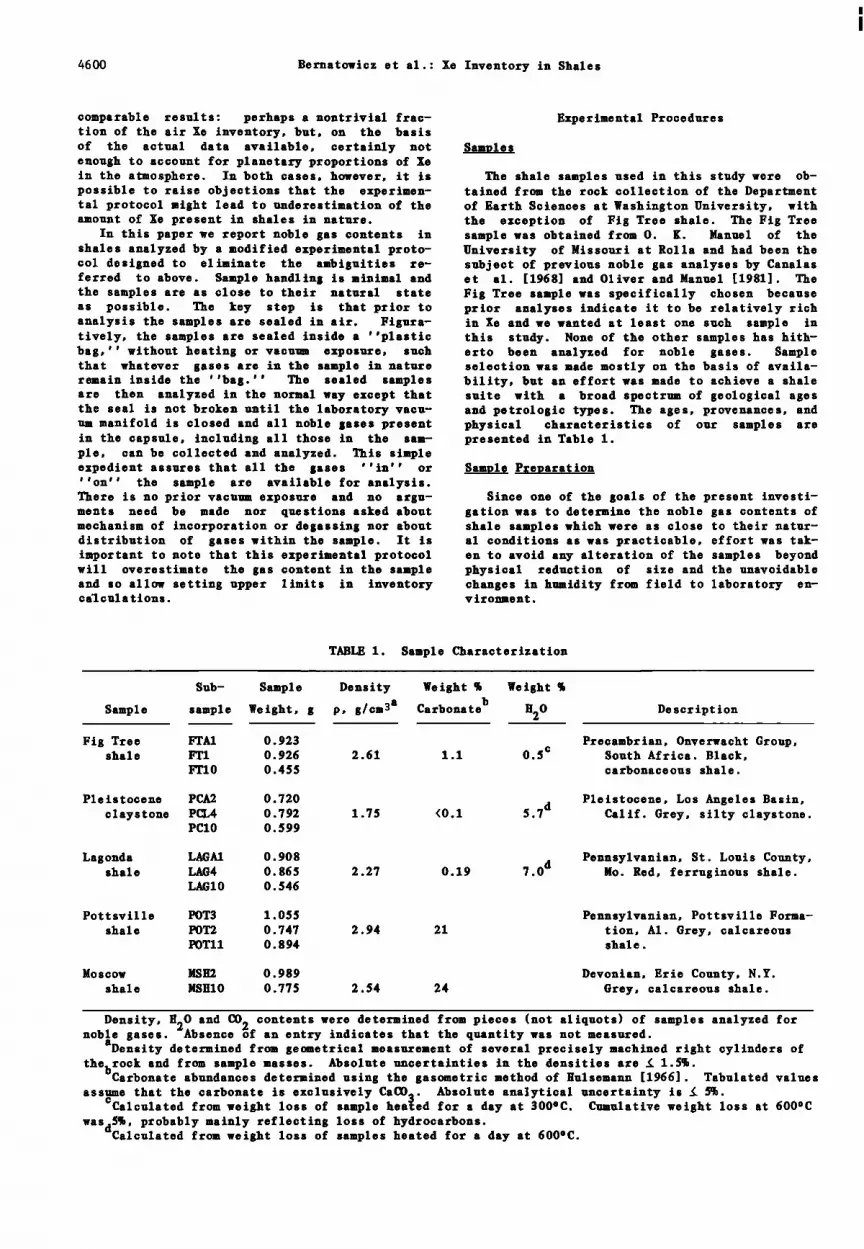
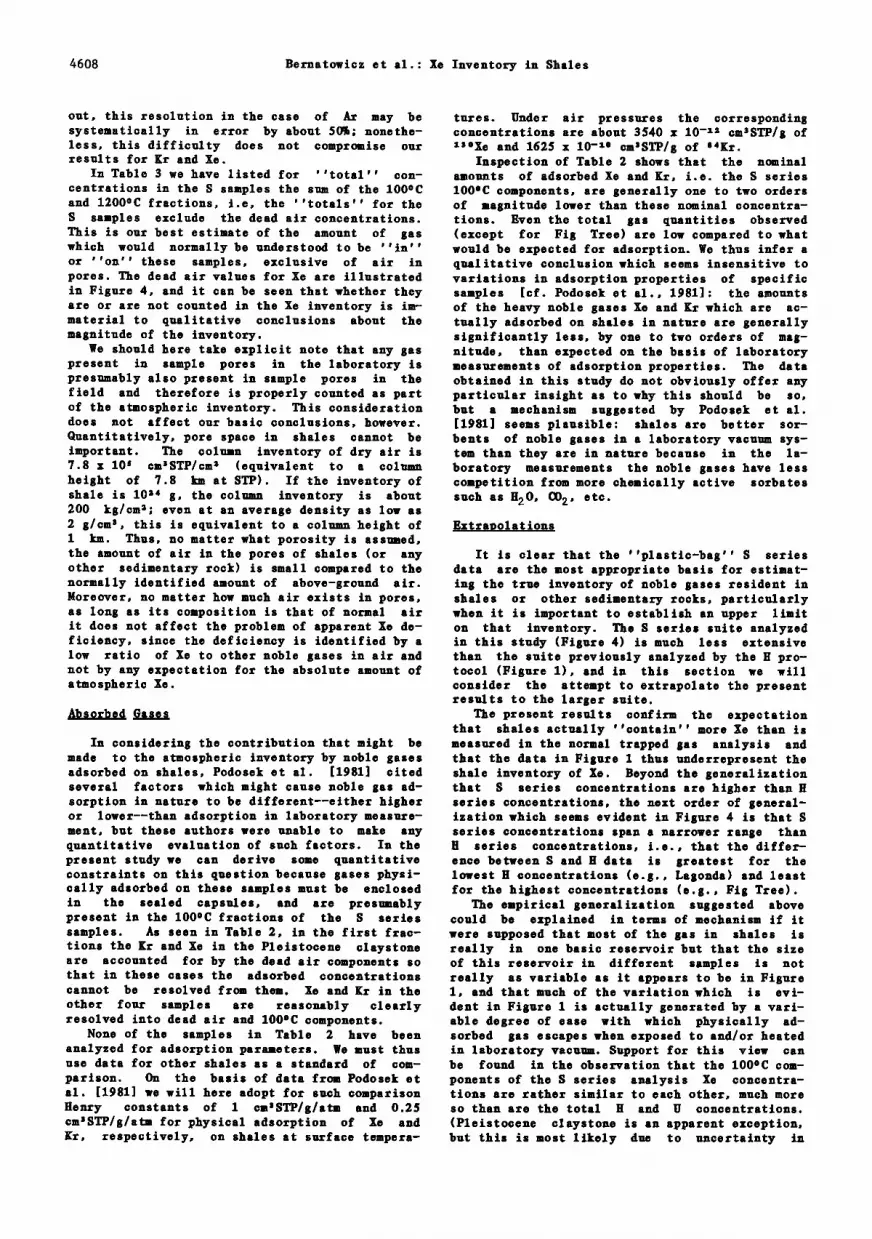
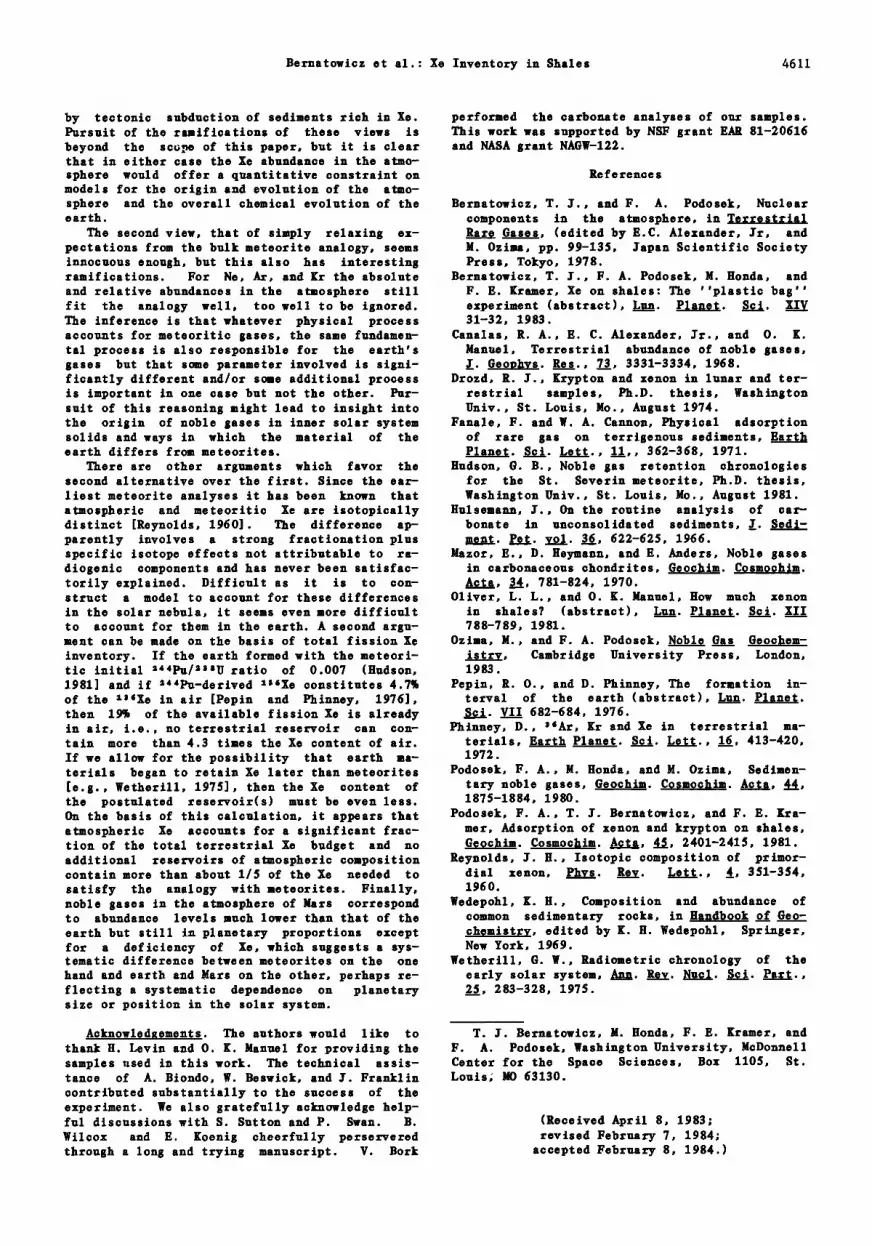
The data of principal interest in this study are those for the sealed samples, identified by S in Tables 2 and 3. As described earlier, each of the sealed samples was analyzed in two steps: the first analysis is that of gas released when the sea1 is broken and gases inside the capsule escape to the laboratory manifold, the second is that of gas subsequently released in heating to 1200øC. The gas released in the first step is composed of two components: gas which was actual- ly present in the gas phase at the time the sam- ple was isolated and sealed, and gas which was ''in'' or ''on'' the sample at that time and
130Xe(cm3STP/g)
I i I I I I i I H FIG TREE
s V/////////////////////////,I //////////,/z/-//-//////,,/1 PLEISTOCENE CLAYSTONE ///////////J I
which was subsequently liberated into the gas l•ig. 4. Comparison of Xe results (Table 3) ob- phase. The first component is assumed to have tained in H, U, and S protocols. Nor scale and atmospheric composition and is hereafter referred significance of marker, cf. 1;igure 1. In the S to as ''dead air.'' It includes any air left in series data the total (blank-corrected) Xe meas- the constriction (1;igure 1) below where it was ured is indicated and the amount identified as sealed (in excess of that allowed for in the ''dead air'' Xe (see text) is shown without blank correction), any bubbles in the Hg or hatchute. The amount remaining after subtraction between the Hg and sample or capsule wall, and of the dead air component is shown with hatchute.
4608 Bernatowicz et al.: Xe Inventory in Shales
out, this resolution in the case of Ar may be tures. Under air pressures the corresponding systematically in error by about 50%; nonethe- concentrations are about 3540 x 10 -x" cmsSTP/g of less, this difficulty does not compromise our xSøXe and 1625 x 10 -lø cmSSTP/g of 84Kr. results for Kr and Xe. Inspection of Table 2 shows that the nominal
In Table 3 we have listed for ''total'' con- amounts of adsorbed Xe and Kr, i.e. the S series centrations in the S samples the sum of the 100oC 100øC components, are generally one to two orders and 1200oC fractions, i.e, the ''totals'' for the of magnitude lower than these nominal concentra- S samples exclude the dead air concentrations. tions. Even the total gas quantities observed This is our best estimate of the amount of gas (except for Fig Tree) are low compared to what which would normally be understood to be ''in'' would be expected for adsorption. We thus infer a or ''on'' these samples, exclusive of air in qualitative conclusion which seems insensitive to pores. The dead air values for Xe are illustrated variations in adsorption properties of specific in Figure 4, and it can be seen that whether they samples [cf. Podosek et al., 1981]: the amounts are or are not counted in the Xe inventory is im- of the heavy noble gases Xe and Kr which are ac- material to qualitative conclusions about the tually adsorbed on shales in nature are generally magnitude of the inventory. significantly less, by one to two orders of mag-
We should here take explicit note that any gas nitude, than expected on the basis of laboratory present in sample pores in the laboratory is measurements of adsorption properties. The data presumably also present in sample pores in the obtained in this study do not obviously offer any field and therefore is properly counted as part particular insight as to why this should be so, of the atmospheric inventory. This consideration but a mechanism suggested by Podosek et al. does not affect our basic conclusions, however. [1981] seems plausible: shales are better sot- Quantitatively, pore space in shales cannot be bents of noble gases in a laboratory vacuum sys- important. The column inventory of dry air is tem than they are in nature because in the la- 7.8 x l0 s cmSSTP/cm" (equivalent to a column boratory measurements the noble gases have less height of 7.8 km at STP). If the inventory of competition from more chemically active sotbates shale is 1024 g, the column inventory is about such as H20, CO 2, etc. 200 kg/cm2; even at an average density as low as 2 g/cm s, this is equivalent to a column height of Extrapolations I kin. Thus, no matter what porosity is assumed, the amount of air in the pores of shales (or any It is clear that the ''plastic-bag'' S series other sedimentary rock) is small compared to the data are the most appropriate basis for estimat- normally identified amount of above-ground air. ing the true inventory of noble gases resident in bioreover, no matter how much air exists in pores, shales or other sedimentary rocks, particularly as long as its composition is that of normal air when it is important to establish an upper limit it does not affect the problem of apparent Xe de- on that inventory. The S series suite analyzed ficiency, since the deficiency is identified by a in this study (Figure 4) is much less extensive low ratio of Xe to other noble gases in air and than the suite previously analyzed by the H pro- not by any expectation for the absolute amount of tocol (Figure 1), and in this section we will atmospheric Xe. consider the attempt to extrapolate the present
results to the larger suite. Absorbed Gases The present results confirm the expectation
that shales actually ''contain'' more Xe than is In considering the contribution that might be measured in the normal trapped gas analysis and
made to the atmospheric inventory by noble gases that the data in Figure I thus underrepresent the adsorbed on shales, Podosek et al. [1981] cited shale inventory of Xe. Beyond the generalization several factors which might cause noble gas ad- that S series concentrations are higher than H sorption in nature to be different--either higher series concentrations, the next order of general- or lower--than adsorption in laboratory measure- ization which seems evident in Figure 4 is that S ment, but these authors were unable to make any series concentrations span a narrower range than quantitative evaluation of such factors. In the H series concentrations, i.e., that the differ- present study we can derive some quantitative ence between S and H data is greatest for the constraints on this question because gases physi- lowest H concentrations (e.g., Lagonda) and least cally adsorbed on these samples must be enclosed for the highest concentrations (e.g., Fig Tree). in the sealed capsules, and are presumably The empirical generalization suggested above present in the 100oC fractions of the S series could be explained in terms of mechanism if it samples. As seen in Table 2, in the first frac- were supposed that most of the gas in shales is tions the Kr and Xe in the Pleistocene claystone really in one basic reservoir but that the size are accounted for by the dead air components so of this reservoir in different samples is not that in these cases the adsorbed concentrations really as variable as it appears to be in Figure cannot be resolved from them. Xe and Kr in the 1, and that much of the variation which is evi- other four samples are reasonably clearly dent in Figure 1 is actually generated by a yard- resolved into dead air and 100oC components. able degree of ease with which physically ad-
None of the samples in Table 2 have been sotbed gas escapes when exposed to and/or heated analyzed for adsorption parameters. We must thus in laboratory vacuum. Support for this view can use data for other shales as a standard of corn- be found in the observation that the 100øC com- parison. On the basis of data from Podosek et ponents of the S series analysis Xe concentra- al. [1981] we will here adopt for such comparison tions are rather similar to each other, much more Henry constants of I cmSSTP/g/atm and 0.25 so than are the total H and U concentrations. cmsSTP/g/atm for physical adsorption of Xe and (Pleistocene claystone is an apparent exception, Kr, respectively, on shales at surface tempera- but this is most likely due to uncertainty in
Bernatowicz et al.: Xe Inventory in Shales 4609
the lasge dead air correction.) If so, the ap- cally rather lower than concentsations in shales psopriate adjustment of the Figure 1 data to take [cf. Ozima and Podosek, 1983] (noble gases in into account loss of adsorbed gas in the normal igneous socks, and presumably in their detritus experimental protocol would be addition of an as well, are probably juvenile rather than atmos- approximately constant amount of lie to each da- pheric in any case). Similarly, there are no turn, which would have a dramatic effect on the data for rocks explicitly identified as lime- left-hand side of Figure i but only a trivial el- stones, but carbonate minerals cannot be con- fect on the right-hand side and thus no effect on sidered unknown but potentially laden with lie; the question of whether shales or air make the carbonate minerals are common in shales, and two bigger contribution to the atmospheric Xe inven- of the samples studied here have substantial car- tory. bonate contents (Table 1) but not extremely high
In summary, the present results offer hints lie contents, so that it cannot be supposed that concerning the mechanisms by which noble gases carbonate minerals per se have an unusually great are incorporated in shales but not compelling affinity for Xe. Other sedimentary reservoirs yet support for any specific model. Similarly, the unsampled may contain high conoentrations of Xe, present results do not permit a definitive indi- but it should be remembered that the relevant cation of how the previous trapped Xe data relate criteria are high lie/i•r ratio and the product of to real Xe contents, but they do suggest that the concentration and amount of the reservoir. An difference is not large enough to qualitatively inferfred negation of the genesalized shale hy- affect the inventory problem. pothesis must remain qualified by the incomplete-
ness of the survey, but we consider that the bur-
Discussion den of proof is clearly on the side of advocacy and that any such advocacy should stipulate a plausible reservoir.
In this section we will focus on the problem The second major qualification attached to a which was introduced earlier and which guided the statement of negation of the shale hypothesis is design of the present set of experiments, i.e., that of experimental procedure. As discussed in the question of whether os not the easth's atmo- the introduction, it has been possible to ques- sphere contains Xe in the ''planetary'' propor- tion the validity or relevance of previously tions to the other noble gases. Observations in- available data by supposing that both previous cidental to this question have been discussed in approaches--traditional trapped gas analysis and the•previous section. measurement of adsorption parameters--might seri-
As noted in the introduction, the Xe inventory ously underestimate the amount of Xe actually problem is not subtle. If the problem is framed resident in a given natural sample. The present simply as the question of whether or not atmos- study was designed to address this problem and we pheric Xe stored in sedimentary rocks, notably consider that its principal result is removal of shales, constitutes enough of an inventory to the necessity to express this qualification. The raise the amount of atmospheric Xe to the level number of samples examined is limited, but in expected from comparison with noble gases in terms of experimental procedure we feel that the meteorites, the answer, necessary on the basis of protocol employed is definitive. previously available data (Figure 1), is no, the The present data (cf. Figure 4) provide a atmosphere does not contain that much Xe. The quantitative expression of the common expectation present study has contributed additional data to that exposing a sample to laboratory vacuum strengthen the negation. The only argument in causes loss of noble gas and that the customary favor of the hypothesis remains the analogy with mild heating in vacuum causes still more loss. meteorites. The differences are significant. Nevertheless,
It is extremely difficult to apply empirical for our primary present interest, the differences data to prove that something does not exist, so are not profound. Thus, as explained earlier, if that an important qualification to the statement a nominal 1024 g of shale is to contain as much that the shale hypothesis is wrong is that this Xe as there is in air, the average shale must conclusion is only tentative because all the evi- have a normalized Xe abundance of 6000 (•3øXe = dence is not in. Thus the prescribed quantities 1.4 x 10 -s cm3STP/g). Even in our experimental of Xe may reside in atmospheric reservoirs not protocol, which eliminates the possibility of yet susveyed for noble gas contents, such as oth- loss from the natural samples, only one of the er specific types of shale, other kinds of sedi- five shales analyzed comes within an order of mentary rock besides shale, or other reservoirs magnitude of this benchmark and all contain much besides sedimentary rock (e.g., polar ice). less Xe than the factor of 22 higher benchmark
Nevestheless, it need not be considered that concentration needed for planetary abundance. sedimentary rocks other than shales or sedimenta- The important qualitative point is that none of sy minerals other than clays are entirely terra these samples has a large enough supply of Xe incognita in this regard. The samples whose ana- which is lost to the vacuum or underestimated by lyses are illustrated in Figure 1 include cherts laboratory adsorption measurements. To the ex- and several rocks rich in organic materials, for ten• that this suite of five samples is represen- example. No samples explicitly identified as tatire of shales in general, we extend this con- sandstones are included, but it is difficult to clusion as well to shales in general. imagine that sandstones per se could be much A third qualification concerns the actual in- richer in noble gases than shales; clay minerals yentory of shales available to serve as reset- in sandstones should be adequately represented by volts of atmospheric Xe. We make explicit note the shales, and other detsital minerals should be that we are here concerned only with the proposi- reasonably well represented by surveys of gas tion that extant shales (or other sedimentary concentrations in igneous rocks, which ase typi- rocks) are the reservoir of the ''missing'' at-
4610 Bernatowicz et al.: Xe Inventory in Shales
mospheric Xe. Recycling of shales will have the results from their use of a grossly unreasonable effect of returning Xe to the gaseous component estimate of the shale inventory. If we exclude of the atmosphere and/or storing it in igneous this particular estimate, the data of iCanalas et and metamorphic reservoirs which cannot properly al. fall into accord with our own and can no be regarded as part of the generalized terrestri- longer be used in support of the shale hy- al atmosphere. While it is possible that such potheals. The other principal proponents of the reservoirs may indeed bear significantly on the shale hypothesis, Fanale and Cannon [1971] con- question of the entire terrestrial Xe budget, the cluded from adsorption studies of two shales that present experiment and discussion make no attempt adsorption could account for the missing Xe. to resolve this question. Canalas et al. [1968] Their adsorption parameters are similar to ones based their original suggestion that extant derived by us [cf. Podosek et al., 1981], and in shales might be significant Xe reservoirs on an fact the substantive result of their calculations average of three independent estimates of the to- is that shales may contain only as much Xe as is tal shale inventory: 155 kg/cm l, 209 kg/cm l, and present in air (based upon the present shale in- 6462 kg/cm •. The first two of these are reason- ventcry), and at best 3 times as much (based upon ably close to our adopted value of 200 kg/cm ß the total shale produced for all time; see (10•4g). We consider the latter value included above). These results represent a quantitative in their average to be geophysically unreason- shortfall visa vis the shale hypothesis of an able, as it corresponds to a worldwide shale order of magnitude and thus cannot be regarded as column depth of about 25 kin, compared to a more supporting it. Therefore adsorption and trapped palatable value of about I km for the others. gas measurements by ourselves and previous inves- Fanale and Cannon [1971] quote yet another in- rigatots, as well as the present results, are in dependent estimate of 10 •4 g for the amount of reasonably good agreement and do not support the extant shale but based their conclusion that hypothesis that the missing Xe is contained in shales could contain 3 times as much Xe as does shales.
air on an estimate of 3 x 10 • g of shale pro- We thus reach our principal conclusion, that duced during all geologic time. As noted above, there is no quantitative support (and never has we do not consider recycled shales to be properly been) for the shale hypothesis, although shales part of the generalized atmosphere, but our certainly do constitute a nonnegligible reservoir adopted value of 10 • g of extant shale is seen for atmospheric Xe. It appears extremely unlike- to be in accord with that of Fanale and Cannon. ly that the sedimentary rock inventory could We thus regard it as a consensus that extant exceed the air inventory by a factor approaching shales account for 1/6000 of the earth's mass, at 22, the figure suggested by analogy with meteor- least within a factor of several, and inspection ites. This negation of the shale hypothesis is of Figure 1 and Figure 4 shows that our conclu- not unqualified and a definitive refutation of sicns are uncompromised by uncertainties of this the shale hypothesis has not been made and may magnitude. never be possible. Nevertheless, pending any era-
We must also consider the consequences of pirical evidence which positively supports the burial of shales to varying depths, since all of shale hypothesis, it seems that its converse our shale samples were collected at or near to deserves the status of ''best working hy- the earth's surface. The effects of burial short pothesis'': that the atmospheric inventory of Xe of metamorphism will principally be pore closure is not much greater than the air inventory, i.e., and heating. We can imagine two extreme at least an order of magnitude below the abun- scenarios in which the shales respond as either dance suggested by analogy with the planetary completely open or completely closed systems. In gases in meteorites. the open system the increased atmospheric pres- sure with depth will tend to favor an increased Implications Xe content because a higher pressure will in- crease both adsorbed and pore Xe amounts. Since If the earth's atmosphere does not contain Xe an average column depth of shales of I km at the level expected from the meteorite analogy, represents approximately 1/10 of an atmospheric there are two alternative views possible. One is scale height, the Xe pressure, adsorbed Xe, and that the analogy actually holds and that the pore Xe contents at depth will be a factor of e• earth's noble gases are indeed planetary but that or only 10• greater than at the surface. Tern- the Xe which should accompany the other noble perature increase in the open system will de- gases in the atmosphere is actually somewhere crease Xe contents. In the closed system, else. Since a selective loss of Xe through the changes in P and T are irrelevant, since no Xe top of the atmosphere seems highly unlikely, that can be exchanged. In either event it appears somewhere else must be the solid earth. The that shales sampled at the earth's surface should second is that the analog does not hold and the provide a valid assessment of the shale by- earth's noble gases are simply unlike meteorite potheals. noble gases and do not occur in planetary propor-
It is worthwhile to give explicit attention to ticns. The results of the present study do not the previous assertions in support of the shale favor one or the other of these possibilities but hypothesis and reevaluate them for purposes of only emphasize that they should be given more comparison with our present and previous [Podosek serious consideration. et al., 1980, 1981] experiments. On the basis of If the missing Xe is actually in the solid trapped Xe measurements of the Fig Tree shale, earth there are again two possibilities: in the Canalas et al. [1968] concluded that shales could process of forming the atmosphere Xe was selec- contain 0.2 to 9 times the Xe present in air. tively retained in the earth and degassed with The former value is compatible with those ob- much less efficiency than the other gases, or the tagned in our own adsorption and trapped gas stu- Xe was indeed degassed into the atmosphere but dies, but the latter value, as shown above, has been selectively removed from it, presumably
Bernatowicz et al.: Xe Inventory in Shales 4611
by tectonic subduction of sediments rich in lie. performed the carbonate analyses of our samples. Pursuit of the ramifications of these views is This work was supported by NSF grant EAR 81-20616 beyond the soo.•e of this paper, but it is clear and NASA grant NAGW-122. that in either case the Xe abundance in the atmo-
sphere would offer a quantitative constraint on References models for the origin and evolution of the atmo- sphere and the overall chemical evolution of the Bernatowicz, T. Y., and F. A. Podosek, Nuclear earth. components in the atmosphere, in Terrestrial
The second view, that of simply relaxing ex- Rare Gases, (edited by B.C. Alexander, Yr, and pectations from the bulk meteorite analogy, seems M. Ozima, pp. 99-135, Yapan Scientific Society innocuous enough, but this also has interesting Press, Tokyo, 1978. ramifications. For Ne, At, and Kr the absolute Bernatowicz, T. Y., F. A. Podosek, M. Honda, and
and relative abundances in the atmosphere still F.E. Kramer, Xe on shales: The ''plastic bag'' fit the analogy well, too well to be ignored. experiment (abstract), Lun. Planet. Sol. XI¾ The inference is that whatever physical process 31-32, 1983. accounts for metecritic gases, the same fundamen- Canalas, R. A., E.C. Alexander, Yr., and O. K. tal process is also responsible for the earth's Manuel, Terrestrial abundance of noble gases, gases but that some parameter involved is signi- !. Geophys. Res., 7__•, 3331-3334, 1968. fioantly different and/or some additional process Drozd, R. Y., Krypton and xenon in lunar and ter- is important in one case but not the other. Put- restrial samples, Ph.D. thesis, Washington suit of this reasoning might lead to insight into Univ., St. Louis, Mo., August 1974. the origin of noble gases in inner solar system Fanale, F. and W. A. Cannon, Physical adsorption solids and ways in which the material of the of rare gas on terrigenous sediments, Earth earth differs from meteorites. Planet. Sol. Lett., 11,, 362-368, 1971.
There are other arguments which favor the Hudson, 6. B., Noble gas retention ohronologies second alternative over the first. Since the ear- for the St. Severin meteorite, Ph.D. thesis,
liest meteorite analyses it has been known that Washington Univ., St. Louis, Mo., August 1981. atmospheric and metecritic Xe are isotopically Hulsemann, Y., On the routine analysis of oar- distinct KReyholds, 1960]. The difference ap- bonate in unconsolidated sediments, •_. Sedi- patently involves a strong fractionation plus ment. Pet. vol. 36, 622-625, 1966. specific isotope effects not attributable to ra- Mazor, E., D. Heymann, and E. Anders, Noble gases diogenic components and has never been satisfac- in carbonaceous chondrites, Gecohim. Cosmochim. torily explained. Difficult as it is to con- Acta, 34, 781-824, 1970. struot a model to account for these differences Oliver, L. L., and O.K. Manuel, How much xenon in the solar nebula, it seems even more difficult in shales? (abstract), Lun. Planet. Sol. III to account for them in the earth. A second argu- 788-789, 1981. ment can be made on the basis of total fission lie Ozima, M., and F. A. Podosek, Noble 6as Gecohem- inventory. If the earth formed with the meteori- istry, Cambridge University Press, London, tic initial •44Pu/•aU ratio of 0.007 (Hudson, 1983. 1981] and if •4•Pu-derived •GXe constitutes 4.7% Pepin, R. 0., and D. Phinney, The formation in- of the •GXe in air [Pepin and Phinney, 1976], terra1 of the earth (abstract), Lun. Planet. then 19% of the available fission lie is already Sci. VII 682-684, 1976. in air, i.e., no terrestrial reservoir can con- Phinney, D., •Ar, Kr and Xe in terrestrial ma- rain more than 4.3 times the Xe content of air. terials, Earth Planet. Sci. Lett., 16, 413-420, If we allow for the possibility that earth ma- 1972. terials began to retain Xe later than meteorites Podosek, F. A., M. Honda, and M. Ozima, Sedimen- [e.g., Wetherill, 1975], then the Xe content of tary noble gases, 6eochim. Cosmochim. Acta, 44, the postulated reservoir(s) must be even less. 1875-1884, 1980. On the basis of this calculation, it appears that Podosek, F. A., T. Y. Bernatowioz, and F. E. Kra- atmospheric Xe accounts for a significant frac- met, Adsorption of xenon and krypton on shales, tion of the total terrestrial lie budget and no 6eochim. Cosmochim. Acta, 4__•5, 2401-2415, 1981. additional reservoirs of atmospheric composition Reynolds, Y. H., Isotopic composition of primor- contain more than about 1/5 of the Xe needed to dial xenon, Phys. R.ev. Lett., 4, 351-354, satisfy the analogy with meteorites. Finally, 1960. noble gases in the atmosphere of Mars ocrrespond Wedepohl, K. H., Composition and abundance of to abundance levels much lower than that of the common sedimentary rocks, in Handbook of 6eo- earth but still in planetary proportions except chemistry, edited by K. H. Wedepohl, Springer, for a deficiency of lie, which suggests a sys- New York, 1969. tematio difference between meteorites on the one Wetherill, 6. W., Radiometric chronology of the hand and earth and Mars on the other, perhaps re- early solar system, Ann. R.ev. Nuol. Sol. Part., flecting a systematic dependence on planetary 2_•5, 283-328, 1975. size or position in the solar system.
Acknowledgements. The authors would like to T.Y. Bernatowicz, M. Honda, F. E. Kramer, and thank H. Levin and O.K. Manuel for providing the F. A. Podosek, Washington University, McDonnell samples nsed in this work. The technical assis- Center for the Space Sciences, Box 1105, St. tahoe of A. Biondo, W. Beswick, and Y. Franklin Louis; MO 63130. contributed substantially to the success of the experiment. We also gratefully acknowledge help- ful discussions with S. Sutton and P. Swan. B. (Received April 8, 1983; Wilcox and E. Koenig cheerfully perservered revised February 7, 1984; through a long and trying manuscript. V. Bork accepted February 8, 1984.)