Contents lists available at SciVerse ScienceDirect
Catalysis Today
j ourna l ho me p ag e: www.elsev ier .com/ lo cate /ca t tod
he reactions of ethanol on TiO2 and Au/TiO2 anatase catalysts
.M. Nadeemb, G.I.N. Waterhouseb, H. Idrissa,∗
Department of Chemistry, University of Aberdeen, Aberdeen, UKSchool of Chemical Sciences, University of Auckland, Auckland, New Zealand
r t i c l e i n f o
rticle history:eceived 10 June 2011eceived in revised form 13 August 2011ccepted 16 August 2011vailable online 13 October 2011
eywords:iO2
thanol-TPDenzene formationthanol dehydrogenation
a b s t r a c t
The surface reactions of ethanol over TiO2 and Au/TiO2 nanoparticle catalysts were systematically investi-gated by temperature programmed desorption (TPD) and infra-red (IR) spectroscopic studies, in order tounderstand the effect of adding gold on the surface chemistry. Transmission Electron Microscopy (TEM)indicated that Au particles were mostly less than 10 nm in size; TiO2 was of pure anatase form (XRD) ofabout 15–20 nm in size. Ethanol TPD on H2-reduced TiO2 showed that most reaction products desorbed inone single desorption domain at ca. 660 K. The main reaction product was ethylene (with a carbon selec-tivity of about 70%); other minor products were acetaldehyde, butene, and crotonaldehyde in decreasingorder of yield. Ethanol TPD over H2-reduced Au/TiO2 was considerably different. First, a large fraction ofthe reaction products desorbed around 600 K; second the main desorption product was observed to bebenzene. Infrared spectroscopy indicated that at room temperature both ethanol (1262 cm−1, 1310 cm−1,
−1
cetaldehyde condensation and 1398 cm ; due to O–H bending, CH2 wagging, and CH3 symmetric deformation modes, respectively)and ethoxide species (1047 cm−1, 1073 cm−1, 1093 cm−1, and 1122 cm−1; due to the stretching modesof CO and CC) are present with the former disappearing faster than the latter. In addition bands at 1634and 1658 cm−1 attributed to �(C–O), �(C C) and �(CH3) of adsorbed crotonaldehyde are seen when theethanol dosed surface was flashed to 570 K. A scheme for the formation of the reaction products on TiO2
in wh
and Au/TiO2 is proposed
. Introduction
The study of the reactions of alcohols on TiO2 has manymportant technological applications. Ethanol, in particular, maye exploited as renewable energy carrier for generating hydro-en as well as a renewable feed for specialty chemicals. Inddition, alcohols in general can act as simple model contam-nants to test environmental cleaning strategies, one of whichs photo-mineralization of organic contaminants to CO2. Ethanolhoto-reaction on M/TiO2 (where M is a transition metal) for hydro-en production has been studied in some detail over the last decade1–6] and it was found that Au/TiO2 anatase has very high activity.he dark catalytic and non catalytic reactions of ethanol have beennvestigated previously over a wide range of model and real cat-lytic surfaces [7–17]. These studies indicated that ethanol adsorbsissociatively to initially produce ethoxides and surface hydrox-ls; the ethoxides are attached to surface metal cations while theydrogen ions are attached to surface oxygen anions. These ethox-
des generally undergo dehydrogenation and dehydration to givecetaldehyde and ethylene, respectively, depending on the naturef the oxide [7]. The factors effecting these two reactions include
acid/basic site density [7,8], bond energy [7], electronegativity dif-ference [7], Madelung potential of oxygen anions and metal cations[9], and the oxygen electronic polarisability of the oxides [10]. Ingeneral, large metal cation–oxygen anion bond energy (i.e. a largeMadelung potential of oxygen anions), will favour dehydration overdehydrogenation. TiO2 in that regard fits these requirements andhas been shown to produce large amounts of ethylene as comparedto acetaldehyde. Other products mostly resulting from acetalde-hyde have also been observed for the reaction of ethanol over metaloxides. These include: crotonaldehyde (formed by �-aldolisationof acetaldehyde) [18], ethyl acetate (formed by dimerisation oftwo acetaldehyde molecules), acetates (formed by direct oxida-tion of acetaldehyde) [2], benzene (an intriguing reaction initiallyobserved on Pt/CeO2 and proposed to occur via a series of condensa-tion steps (�-aldolisation) to give a C6 unsaturated compounds thatundergo dehydration followed by cyclisation steps to ultimatelyyield the thermodynamically stable compound, benzene) [19,20],furan [21] and butenes [7].
The deposition of gold nano-particles on TiO2 for catalyticapplications has been pursued for over a decade [22–43]. Sincethe pioneering work of Haruta which demonstrated the unique
catalytic activity of Au/TiO2 for the selective low-temperatureCO oxidation [33], the number of reports describing the use ofAu/TiO2 as heterogeneous catalyst for thermal reactions has grownconsiderably. These works have elaborated how to prepare Au
anoparticles with a narrow size distribution strongly anchoredn the surface of TiO2 nanoparticles. Au/TiO2 materials also havenormous promise as UV light driven photo-catalysts. Owing to thextensive research that has been conducted relating to Au nano-articles supported on different metal oxides, a general consensusow exists on several aspects of the Au-oxide system. The size ofhe gold particles substantially affects the catalytic activity, and theold clusters must be smaller than 5 nm for high catalytic activityo occur. However, in a very recent study it was observed that 5 nmimit is not needed for photo-catalytic hydrogen production fromthanol over Au/TiO2 [6].
The aim of this work is to further understand the reactions ofthanol on titania supported Au nanoparticle catalysts. This paperxplores the effect of added Au nanoparticles on the decomposi-ion mechanisms of ethanol on TiO2 in dark conditions in order tourther probe into the specific chemical reaction pathways.
. Experimental
.1. Catalyst preparation
TiO2 anatase nano-particles were prepared by the sol–gelydrolysis of Ti(IV) isopropoxide and TiO2-supported gold nano-article catalysts (Au loading = 8 wt.%) were prepared by theeposition–precipitation method with urea as follows. Anataseanoparticles were prepared by the sol–gel hydrolysis of Ti(IV)
sopropoxide. Briefly, Ti(IV) isopropoxide (284.4 g) was dissolvedn isopropanol at 20 ◦C. Under vigorous stirring, milli Q water washen added slowly dropwise to the Ti(IV) isopropoxide solutionesulting in the hydrolysis of the alkoxide and precipitation ofydrous titanium oxides. The final molar ratio of water:Ti(IV)
sopropoxide in the reaction mixture was 55.5:1. The suspensionas then left stirring for 24 h. The particles were subsequently col-
ected by vacuum filtration, washed repeatedly with isopropanol,nd then air dried for 2 days at 20 ◦C. Anatase nanoparticles werehen obtained upon calcination of the dried powders at 400 ◦Cor 2 h. The micron sized anatase powder used in this work wasbtained from BDH chemicals. Titania-supported gold nanoparticleatalysts were prepared by the deposition–precipitation with ureaDPU) method. Under vigorous stirring, titania (2.5 g) was addedo a 250 mL aqueous solution containing HAuCl4·3H2O (1.1 mMor Au loadings of 2%) and urea (0.42 M). The suspensions of TiO2articles were then heated to 85 ◦C, and kept at this temperaturender continuous stirring for 8 h. The Au(III) impregnated titaniasere collected by vacuum filtration, washed repeatedly with milli
water, dried for 2 days at 20 ◦C in a dessicator over silica gel, andhen calcined at 300 ◦C for 1 h to thermally reduce surface Au(III)ations to Au metal.
Detailed account of synthesis procedures for these mate-ials can be found in a previous work [5]. The BET surfacereas for all catalysts did not deviate from that of TiO2 anataselone (107 ± 5 m2 gCatal
−1), while the cumulative pore volume.26 cm3 g−1 and average pore radius 4.0 nm typical for the anataseiO2 support were also unchanged. XRD indicated that TiO2as pure anatase. XPS analyses were performed on a Kratosxis Ultra spectrometer using mono-chromatized Al K� X-rays
h� = 1486.6 eV) and with the hemispherical electron energy ana-yzer operated in the hybrid lens mode. The take-off angle
ith respect to the specimen surface was 90◦. The charge-ompensating low-energy electron system was used to minimizepecimen charging during X-ray irradiation. The binding energy
cale was calibrated using adventitious hydrocarbon referencingC 1s = 284.7 eV). TEM data for the characterization of the sam-le was collected at ANSTO (Sydney, Australia) using a JEOL 2010FEM. Specimens were supported on carbon coated copper grids for
oday 182 (2012) 16– 24 17
analysis. Details of the analyses were reported in other studies [5,6]and will be outlined in brief below when needed to explain theresults.
2.2. Infra-red spectroscopy
Infra-red spectra were obtained using a Nicolet (Nexus) Fouriertransform spectrometer. Infrared spectra of adsorbed species wereobtained at a resolution of 4 cm−1 with 256 scans per spectrum. Theadsorption of ethanol on sample catalysts was performed in a tem-perature programmable stainless steel IR cell. The sample catalystswere pressed into self-supporting discs (ca. 10 mm in diameter),and mounted into a gold-plated brass sample holder in the centreof the cell. The cell was equipped with removable CaF2 windows(32 mm diameter, 4 mm thick) sealed with Viton O-rings. A typeK thermocouple, welded into the centre of the cell in close prox-imity to the catalyst disc, was used to monitor the temperature.The cell was then connected to a vacuum line, and maintained ata base pressure (ca. 10−6 Torr) with a diffusion pump backed bya roughing pump. To remove surface contaminants, the TiO2 andAu/TiO2 catalysts were annealed under 20 Torr of oxygen at 673 Kovernight, followed by evacuation under vacuum for 1 h while cool-ing to 300 K. Ethanol was injected via a vacuum line connected tothe IR cell. After exposure the cell was pumped down to <10−5 Torr.The surface temperature was then raised in specific increments.When the desired temperature was reached, the cell was thencooled to 300 K before collection of a spectrum. Spectra presentedin this work are obtained by subtracting the spectrum of the catalystsample prior to adsorption, from that of the sample after ethanoladsorption.
2.3. Temperature programmed desorption (TPD)
A detailed account of experimental procedures and the equip-ment used in the TPD studies can be found in previous works [5].In brief it is as follows: 50 mg of catalyst was placed in a quartzU-shaped fixed bed reactor connected to a vacuum system witha typical base pressure of 1 × 10⁻⁷ Torr maintained by a diffusionpump with a liquid N2 trap. The whole system was connected toa Spectra Vision quadrupole mass spectrometer to monitor themasses of interest. The mass spectrometer had a mass range from 1to 200 amu, and could monitor 12 masses at one time when run inprofile mode. Linear temperature ramping at a rate of 20 K min−1
was achieved by using an accurate temperature ramping unit whichconsisted of a Kaif digital temperature controller integrated with aglass lined furnace and a K type thermocouple. Prior to TPD, thecatalysts were reduced under H2 at 673 K for 4 h or more. A rangeof different dosages of ethanol (ranging from 50 �L to 0.2 �L) wasstudied. It was found that 2–5 �L of ethanol are sufficient for surfacesaturation. The TPD presented in this work is conducted at satura-tion coverage. Ethanol was allowed to adsorb and equilibrate withthe catalyst surface for 15 min. The reactor was pumped down toremove weakly adsorbed ethanol on the catalyst surface, as wellas on the walls of the reactor, for 30 min. In addition, the ethanolmass fragment m/z = 31 (CH2OH)+ was monitored until the baseline is again reached. Different mass fragments were recorded asfunction of temperature to monitor the desorption of products i.e.ethanol (m/z = 31, 29, 45, and 27), acetaldehyde (m/z = 29, 44, 15,and 43), ethylene (m/z = 28 and 27), methane (m/z = 16 and 15)water (m/z = 18 and 17), H2 (m/z = 2), CO (m/z = 28 and 16), CO2(m/z = 44) as a function of temperature. Relative yields of all des-orption products were determined following references [44] for the
mass spectrometer sensitivity factor and [13,18,19] for the calcu-lation method.
UV–Vis Spectra were performed using a Shimadzu double-beam UV-2100 spectrophotometer. The UV spectrophotometer
1 lysis Today 182 (2012) 16– 24
wi2pwina
3
armt2fit[
3
3
ahdTtoreTsce
3
H1fTa5taa
smateat4mstotab
280 380 480 580 680 780
Benzene, m/e 77
Ethylene, m/e 27 x 0.2
Crotonaldehyde, m/e 70 x 10
Furan, m/e 68 x 20
Acetaldehyde, m/e 29
Methane, m/e 15
Ethanol, m/e 31
CO2, m/e 44 x 5
Butene, m/e 56
Temperature, K
Mas
s Sp
ectr
omet
er re
spon
se, (
A.U
.)
8 A.M. Nadeem et al. / Cata
as equipped with an integrating sphere, having a 60-mmnternal diameter. Spectra were measured in the range of40–500 nm at a slit width of 2 nm. Au/TiO2 and TiO2 (anatase) sam-les were imprinted onto anhydrous barium sulfate powder, whichas used as a support for UV reflectance spectroscopy. BaSO4 is an
nert, non-absorbing solid standard, which is an essential compo-ent of reflectance accessory. The baseline was done using BaSO4s the reference.
. Results and discussion
The Au/TiO2 catalyst was characterized by TEM, XRD, XPS, BETnd diffuse reflectance UV–Vis measurements. XPS of the Au 4fegion for Au/TiO2 catalyst did not show deviation with respect toetallic Au [6] in agreement with a recent work using environmen-
al XPS [45]. The BET surface area and pore sizes are given in Section while XRD revealed the anatase phase of TiO2 as well as broadeatures typical for nanocrystalline Au. Diffuse reflectance UV–Visndicated the surface plasmon resonance of Au at ca. 560 nm similaro those observed recently by other workers for Au/TiO2 materials46]. TEM of Au/TiO2 catalyst is presented and discussed below.
.1. Adsorption and reactions of ethanol on Au/TiO2
.1.1. Temperature programmed desorption studiesEthanol TPD was performed on both the TiO2 and Au/TiO2 cat-
lysts. Preliminary results indicated that prior treatment underydrogen or oxygen at atmospheric pressure slightly affected theistribution and desorption temperature of the reaction products.he effect was more pronounced with increasing Au loading. Reac-ion products always desorbed at lower temperatures in the casef oxygen treated (oxidized) catalysts as compared to hydrogeneduced catalysts. In this study, we are interested in examining theffect of added metallic Au on the surface reactions of ethanol oniO2. As a result, only results of the H2-reduced catalysts are pre-ented and discussed in this work while those of the O2-treatedatalysts will be provided in a separate study because of their rel-vance to other photo-catalytic processes.
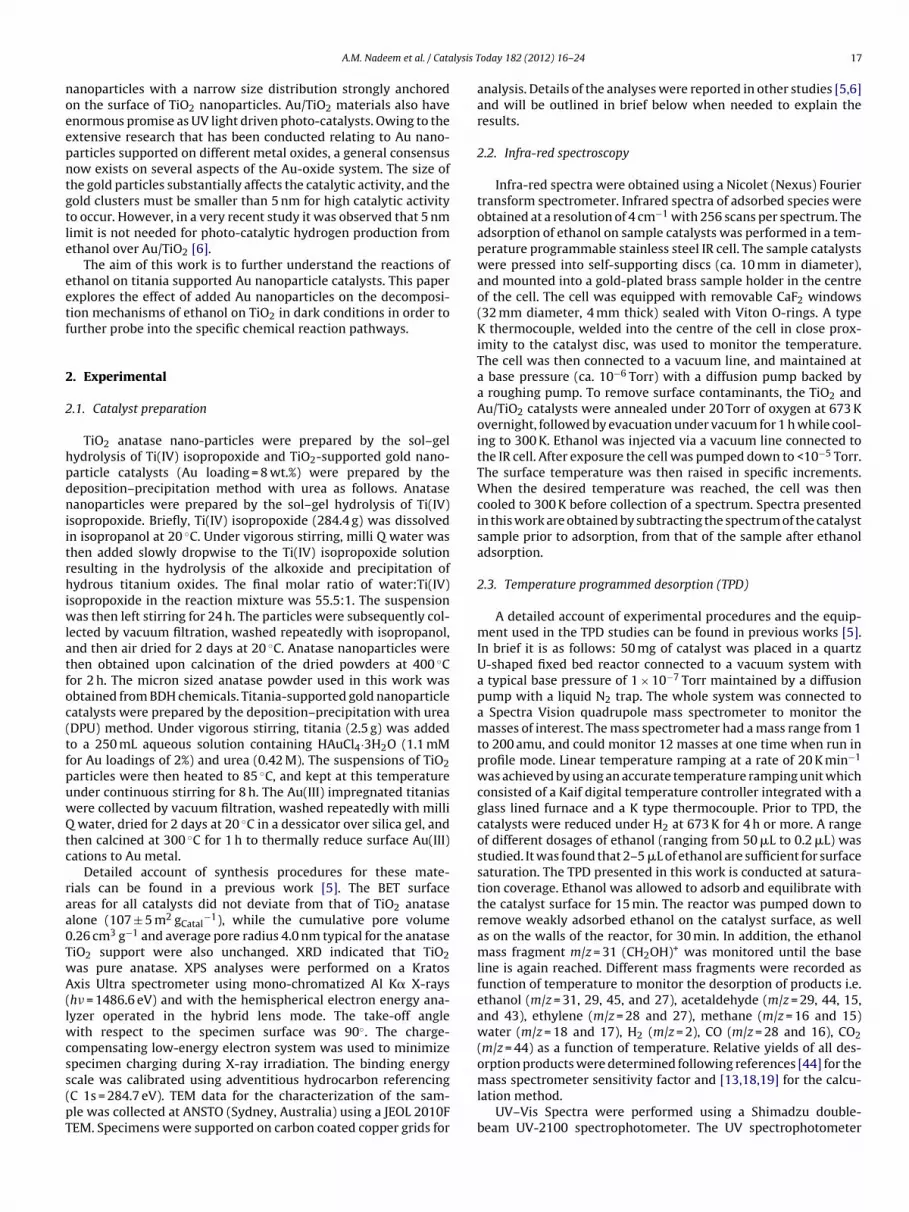
.1.2. Ethanol reactions on TiO2−xTPD products profile following ethanol adsorption at 300 K on
2-treated TiO2 (reduction ocuured at 673 K over night under about0 mL/min H2 1 atm.) is shown in Fig. 1. Based on the catalyst sur-ace area (107 m2/gCatal) and number density of 5-fold coordinatedi atoms on a TiO2 surface (2 Ti atoms per 38.76 A2 = 5.16 × 10¹⁸ Titoms per 1 m2), the number of Ti atoms available on the surface in0 mg of TiO2 loaded in the TPD reactor is equal to ca. 3 × 10¹⁹. Sincehe amount of ethanol used was 1 �L (1.03 × 10¹⁹ molecules) andssuming that all the ethanol molecules in 1 �L of ethanol dosedre adsorbed, the coverage is ca. 0.4.
The reactivity of aliphatic alcohols with TiO2 powders has beentudied by using a number of different techniques and pretreat-ents, including temperature programmed desorption [5,47,48],
nd references therein]. In general, adsorption is largely dissocia-ive yielding alkoxides and surface hydroxyl groups. In this workthanol is seen to desorb in the temperature domain 380–700 Knd accounted for 3.8% of the total product desorbed. The desorp-ion profile can be de-convoluted to two peaks a small one at about60 K followed by a large desorption at about 620 K. The large peakight be attributed to ethoxide and hydroxyl recombination on
urface oxygen defects. The most pronounced desorption signal ishat of ethylene at 665 K contributing 71.7% of the total product des-
rbed. Assuming that surface coverage was initially about 0.4, thenhe number of sites involved in ethoxide conversion to ethylene isbout 0.3. Ethylene is formed by ethoxide dehydration which cane linked to ethoxides adsorbed on oxygen defected sites. Because
Fig. 1. TPD profile of different desorption products after ethanol adsorption at roomtemperature on H2-reduced anatase TiO2 nanoparticles.
the number of oxygen defects sites prior to adsorption cannot rea-sonably exceed 30% the dehydration reaction can be due in part toadditional defects created during TPD. These defects can be createddue to the removal of surface water as follows:
CH3CH2OH(g) + Tis–Os → CH3CH2OTis + OH(a) (1)
2OH(a) → H2O(g) + VO (2)
(a) for adsorbed; VO for surface oxygen vacancy; s for surface.It is clear from the above equations that the number of VO is at
maximum ½ of the number of ethoxides/ethanol(a) and thereforecan be at maximum equal to a surface coverage of 0.2. Thereforethe formation of ethylene can be liked to a combination of surfaceoxygen defects created prior to adsorption and those formed duringTPD among other factors.
A smaller fraction of ethoxides gave acetaldehyde by dehy-drogenation (4%). It has been seen numerous times that thedehydrogenation reaction is far weaker on TiO2 compared to thedehydration reaction. One can view this reaction as due to theremoval of a hydride from the ethoxide as follows:
CH3CH2O(a) + OH(a) → CH3CHO(g) + H2(g) + Os (3)
(a) for adsorbed; s for surface; (g) gas phase.It is important to emphasize that the hydrogen removed from
the ethoxide is a hydride (H�−, i.e. a negatively charged H) thatrecombines with the hydrogen ion (H�+) of the hydroxide to formH2. The amount of acetaldehyde desorbing is not a true indicator ofthe extent of the dehydrogenation reaction on a reduced TiO2 sur-face. There are other reactions which compete with acetaldehydedesorption. The most important of which has been observed pre-viously on a reduced TiO2 single crystal: the reductive coupling ofcarbonyl compounds to olefins known as McMurry reaction. Fig. 1
and Table 1 indicate considerable desorption of butene (9.6%) thatis formed via the following reaction:
Very small amount of methane with carbon selectivity of 0.5% wasalso detected. CO2 was detected only at the highest temperature of650 K.
T and HT indicate total carbon% yield at low temperature and high temperature dohe carbon yield involves the corrected peak area of a desorbing product times its nhis case).
ogether with butene desorption there is also a small desorptionf crotonaldehyde (0.4%) via �-aldolisation (condensation of twocetaldehyde molecules followed by dehydration). Therefore therue activity of TiO2 to acetaldehyde is close to 20% (taking intoccount reaction stoichiometry of the formation of butene androtonaldehyde). In other words, the ratio dehydration to dehy-rogenation is around 3. Intriguing is a non negligible amount ofenzene formation. Benzene production was previously seen fromthanol during TPD on other surfaces [13,19,20] but has not yeteen reported on H2-reduced TiO2. This reaction will be discussed
n more detail below in the case of Au/TiO2 catalyst as the additionf Au increases benzene formation considerably.
A small amount of methane with overall carbon selectivity of.9% desorbed at high temperature. CO2 was seen to desorb in traceuantities at 610 K. This latter might have come from the high tem-erature decomposition of surface carbonates seen in IR studiesdiscussed below).
These results indicate that like previous studies on both single-rystal rutile TiO2 (1 1 0) and (0 0 1) [11,49] and TiO2 polycrystallineurfaces [5,47,48], alcohols decompose on reduced TiO2 nanopar-icle surfaces to produce surface-bound ethoxides, which areemoved via two reaction channels during temperature pro-rammed desorption experiments.
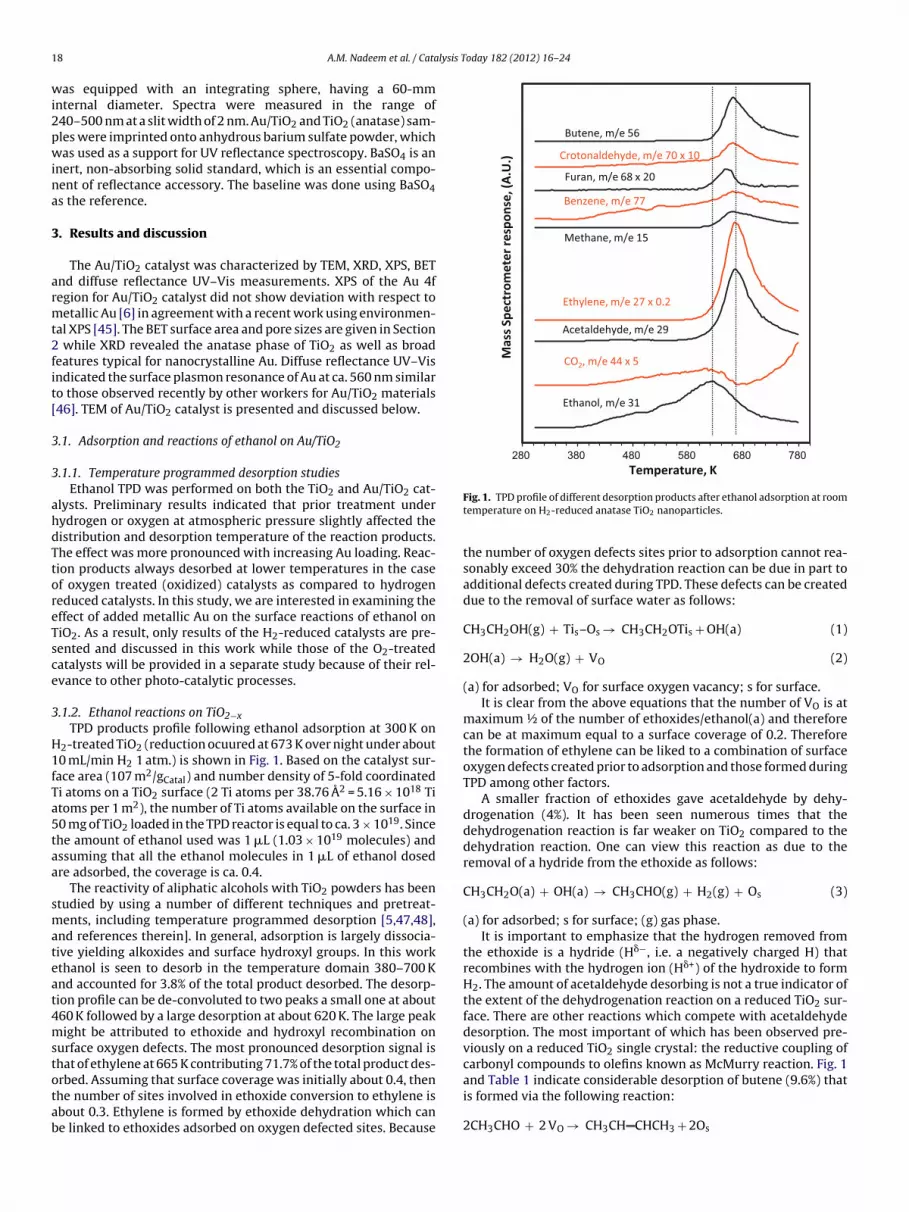
.1.3. Ethanol reactions on Au/TiO2−xFig. 2 shows TEM images of the 8 wt.% Au/TiO2 catalyst. Most
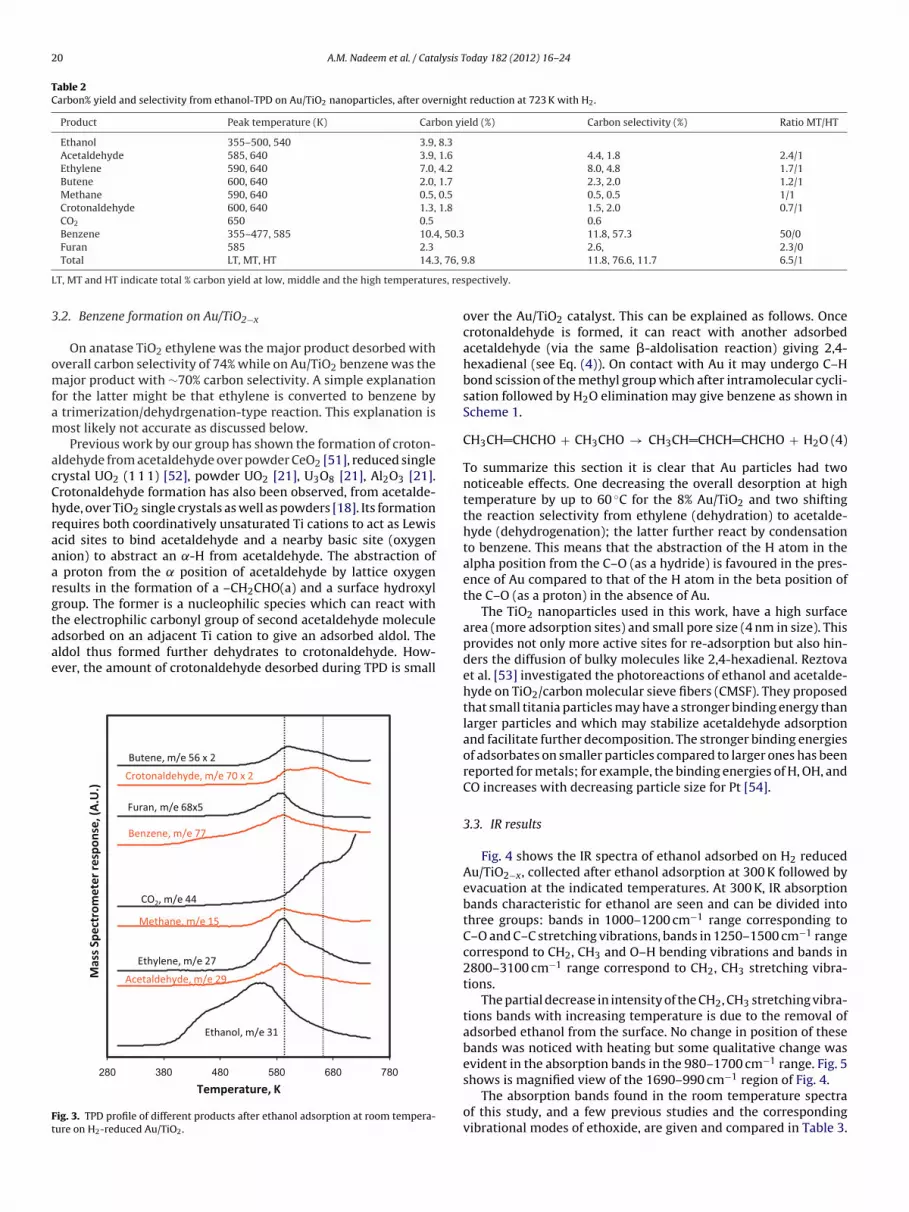
old particles are of similar sizes, less than ca. 10 nm. As seen previ-usly, the deposition with urea preparation method produces smallold particles in good contact with the TiO2 anatase support, event high Au loadings [6]. The TPD product profile following ethanoldsorption at 300 K on H2-treated Au/TiO2 is shown in Fig. 3.
In a previous study, the effect of Au loading on ethanol TPDeaction products was conducted for a series of H2-treated Au/TiO2Anatase) nanoparticle catalysts with 1, 2, 4 and 8 wt.% Au loading50]. In general, Au loading affected the TPD desorption prod-cts temperature and distribution gradually. However the effectf added Au was most pronounced on the 8 wt.% Au catalyst as isresented here. We have previously studied this series of 0–8 wt.%u/TiO2 (Anatase) catalysts by TEM and XPS [6]. In general Au parti-le sizes increase with increasing Au loading from 1 to 8 wt.% whileo change in the XPS Au 4f binding energies are seen when com-ared to that of bulk Au metal (binding energy of the XPS Au 4f at4.0 eV).
Un-reacted ethanol (m/z 31) started to desorb at 380 K veryimilar to pure TiO2 nano-particles, however, conversion to other
roducts is seen about 60 K lower than in case of TiO2 alone. Theverall desorption of un-reacted ethanol is found to be 12% of theotal carbon yield. Benzene was also desorbed at 380 K contribut-ng 10.4% carbon yield at this temperature range and 50.3% at 585 K
s, respectively.r of carbon. The carbon selectivity is the same taking away the reactant (ethanol in
with other desorption products at higher temperature domain.Aside from benzene and ethanol, no other product was seen todesorb in the 380 K temperature domain.
The majority of the products desorbed at temperatures above580 K in two desorption domains. In the case of pure TiO2, only onedesorption domain was observed. It can be noticed that Au load-ing shifts the product desorptions in the high temperature domaintowards lower temperature. However there are still some desorp-tion occurring due to TiO2 sites not in proximity of Au. Thereforeit appears that ethoxide species close to Au particles react differ-ently than those on TiO2 alone. The carbon selectivity for productsdesorbing at ∼590 K was found equal to 76.6% while that at 640 Kis equal to 11.7% for products desorbing. Carbon yields and carbonselectivities at the individual desorption temperatures are sum-marized in Table 2. It can be noticed that for the Au/TiO2 catalyst,benzene is the most dominant desorption product with a total car-bon selectivity of 69.1%, most of which desorbed at 590 K alongwith ethylene (dehydration), acetaldehyde (dehydrogenation), andother minor products including butene, crotonaldehyde and furan.
Fig. 2. TEM image of 8 wt.% Au/TiO2 anatase. The square in the main picture is mag-nified and presented at the top right corner to highlight Au particles on top of theTiO2 support.
T, MT and HT indicate total % carbon yield at low, middle and the high temperatur
.2. Benzene formation on Au/TiO2−x
On anatase TiO2 ethylene was the major product desorbed withverall carbon selectivity of 74% while on Au/TiO2 benzene was theajor product with ∼70% carbon selectivity. A simple explanation
or the latter might be that ethylene is converted to benzene by trimerization/dehydrgenation-type reaction. This explanation isost likely not accurate as discussed below.Previous work by our group has shown the formation of croton-
ldehyde from acetaldehyde over powder CeO2 [51], reduced singlerystal UO2 (1 1 1) [52], powder UO2 [21], U3O8 [21], Al2O3 [21].rotonaldehyde formation has also been observed, from acetalde-yde, over TiO2 single crystals as well as powders [18]. Its formationequires both coordinatively unsaturated Ti cations to act as Lewiscid sites to bind acetaldehyde and a nearby basic site (oxygennion) to abstract an ˛-H from acetaldehyde. The abstraction of
proton from the position of acetaldehyde by lattice oxygenesults in the formation of a –CH2CHO(a) and a surface hydroxylroup. The former is a nucleophilic species which can react withhe electrophilic carbonyl group of second acetaldehyde molecule
dsorbed on an adjacent Ti cation to give an adsorbed aldol. Theldol thus formed further dehydrates to crotonaldehyde. How-ver, the amount of crotonaldehyde desorbed during TPD is small
280 380 480 580 680 780
Benzene, m/e 77
Ethylene, m/e 27
Crotonaldehyde, m/e 70 x 2
Furan, m/e 68x5
Acetaldehyde, m/e 29
Methane, m/e 15
Ethanol, m/e 31
CO2, m/e 44
Butene, m/e 56 x 2
Mas
s Sp
ectr
omet
er re
spon
se, (
A.U
.)
Temperature, K
ig. 3. TPD profile of different products after ethanol adsorption at room tempera-ure on H2-reduced Au/TiO2.
.8 11.8, 76.6, 11.7 6.5/1
pectively.
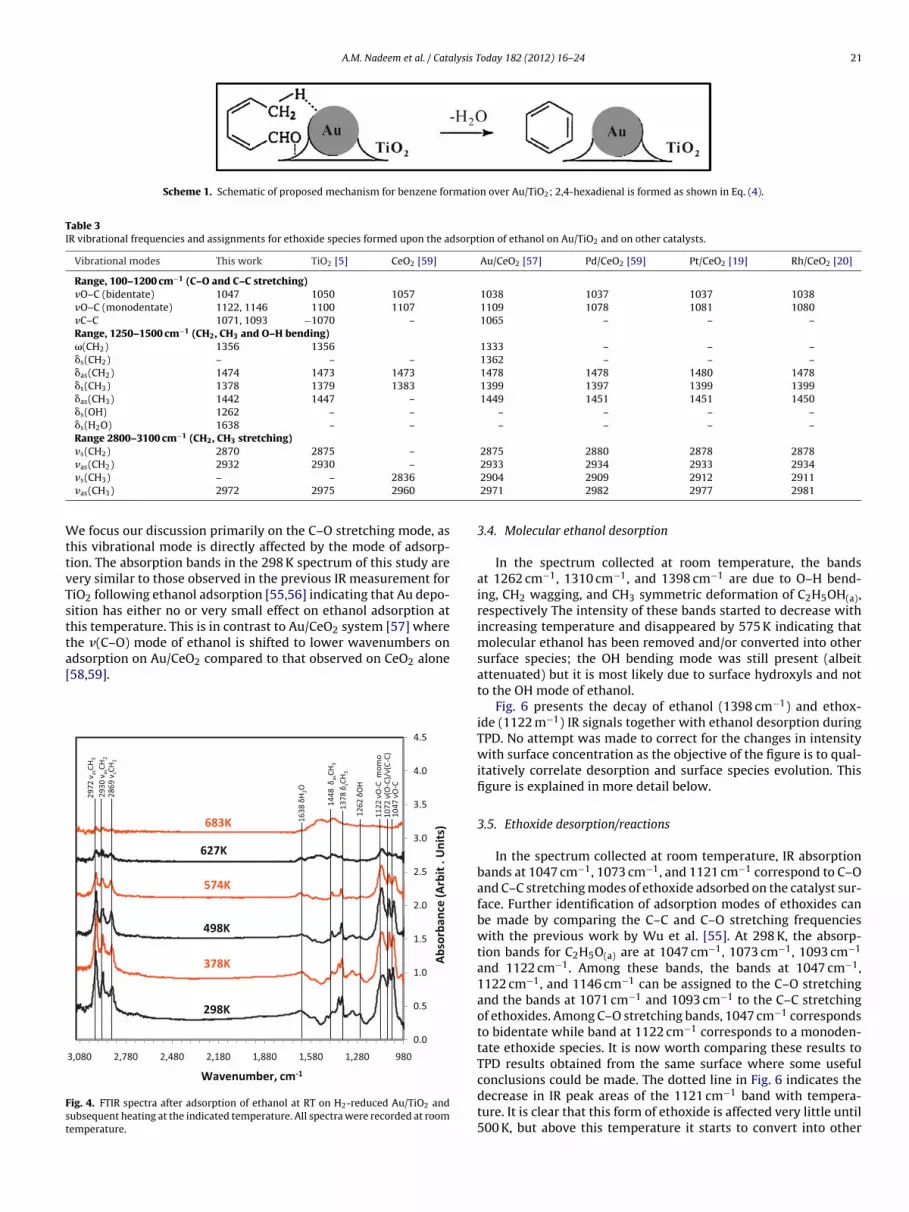
over the Au/TiO2 catalyst. This can be explained as follows. Oncecrotonaldehyde is formed, it can react with another adsorbedacetaldehyde (via the same �-aldolisation reaction) giving 2,4-hexadienal (see Eq. (4)). On contact with Au it may undergo C–Hbond scission of the methyl group which after intramolecular cycli-sation followed by H2O elimination may give benzene as shown inScheme 1.
CH3CH CHCHO + CH3CHO → CH3CH CHCH CHCHO + H2O (4)
To summarize this section it is clear that Au particles had twonoticeable effects. One decreasing the overall desorption at hightemperature by up to 60 ◦C for the 8% Au/TiO2 and two shiftingthe reaction selectivity from ethylene (dehydration) to acetalde-hyde (dehydrogenation); the latter further react by condensationto benzene. This means that the abstraction of the H atom in thealpha position from the C–O (as a hydride) is favoured in the pres-ence of Au compared to that of the H atom in the beta position ofthe C–O (as a proton) in the absence of Au.
The TiO2 nanoparticles used in this work, have a high surfacearea (more adsorption sites) and small pore size (4 nm in size). Thisprovides not only more active sites for re-adsorption but also hin-ders the diffusion of bulky molecules like 2,4-hexadienal. Reztovaet al. [53] investigated the photoreactions of ethanol and acetalde-hyde on TiO2/carbon molecular sieve fibers (CMSF). They proposedthat small titania particles may have a stronger binding energy thanlarger particles and which may stabilize acetaldehyde adsorptionand facilitate further decomposition. The stronger binding energiesof adsorbates on smaller particles compared to larger ones has beenreported for metals; for example, the binding energies of H, OH, andCO increases with decreasing particle size for Pt [54].
3.3. IR results
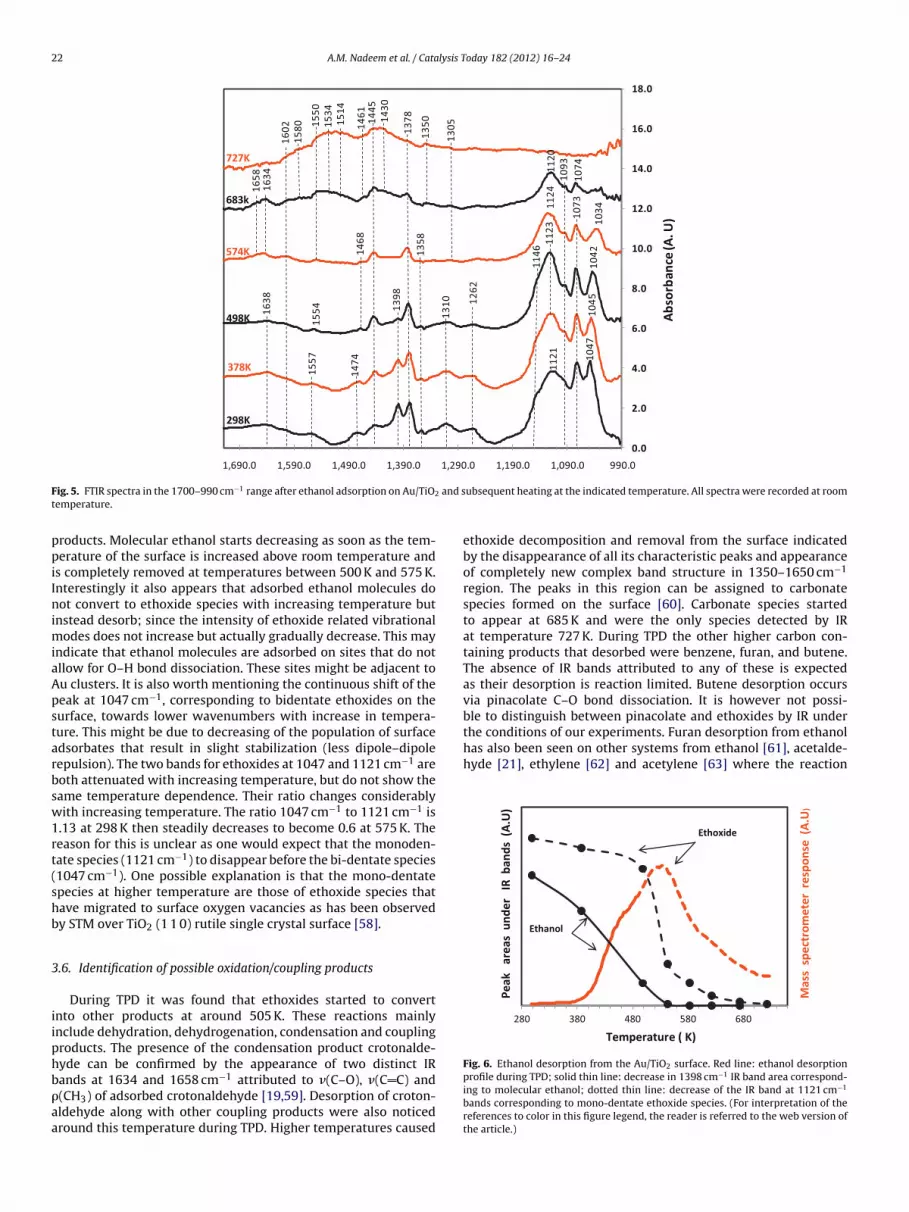
Fig. 4 shows the IR spectra of ethanol adsorbed on H2 reducedAu/TiO2−x, collected after ethanol adsorption at 300 K followed byevacuation at the indicated temperatures. At 300 K, IR absorptionbands characteristic for ethanol are seen and can be divided intothree groups: bands in 1000–1200 cm−1 range corresponding toC–O and C–C stretching vibrations, bands in 1250–1500 cm−1 rangecorrespond to CH2, CH3 and O–H bending vibrations and bands in2800–3100 cm−1 range correspond to CH2, CH3 stretching vibra-tions.
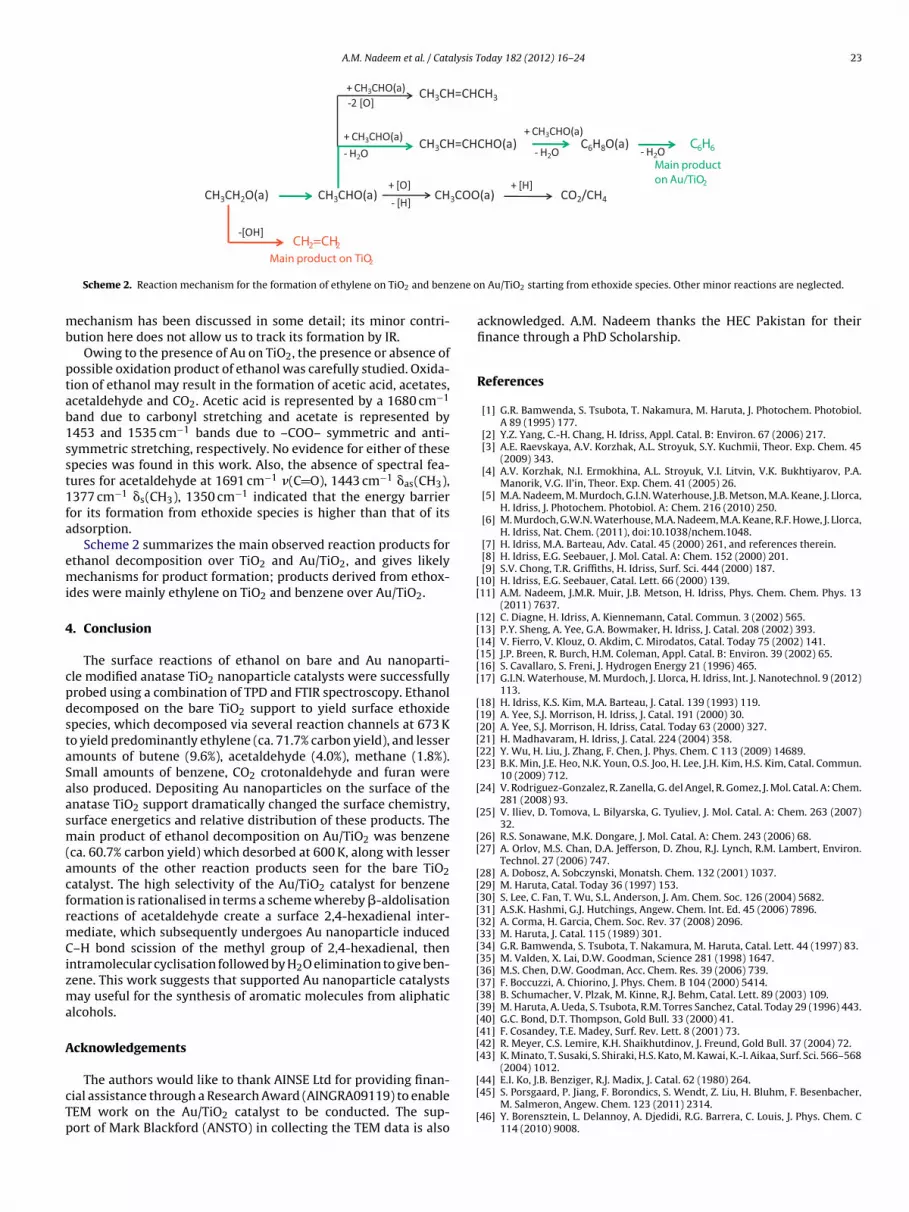
The partial decrease in intensity of the CH2, CH3 stretching vibra-tions bands with increasing temperature is due to the removal ofadsorbed ethanol from the surface. No change in position of thesebands was noticed with heating but some qualitative change wasevident in the absorption bands in the 980–1700 cm−1 range. Fig. 5
shows is magnified view of the 1690–990 cm−1 region of Fig. 4.
The absorption bands found in the room temperature spectraof this study, and a few previous studies and the correspondingvibrational modes of ethoxide, are given and compared in Table 3.
e focus our discussion primarily on the C–O stretching mode, ashis vibrational mode is directly affected by the mode of adsorp-ion. The absorption bands in the 298 K spectrum of this study areery similar to those observed in the previous IR measurement foriO2 following ethanol adsorption [55,56] indicating that Au depo-ition has either no or very small effect on ethanol adsorption athis temperature. This is in contrast to Au/CeO2 system [57] wherehe �(C–O) mode of ethanol is shifted to lower wavenumbers on
dsorption on Au/CeO2 compared to that observed on CeO2 alone58,59].
0.0
0.5
1.0
1.5
2.0
2.5
3.0
3.5
4.0
4.5
9801,2801,5801,8802,1802,4802,7803,080
683K
627K
574K
498K
378K
298K
Abs
orba
nce
(Arb
it .
Uni
ts)
Wavenumber, cm-1
ig. 4. FTIR spectra after adsorption of ethanol at RT on H2-reduced Au/TiO2 andubsequent heating at the indicated temperature. All spectra were recorded at roomemperature.
In the spectrum collected at room temperature, the bandsat 1262 cm−1, 1310 cm−1, and 1398 cm−1 are due to O–H bend-ing, CH2 wagging, and CH3 symmetric deformation of C2H5OH(a),respectively The intensity of these bands started to decrease withincreasing temperature and disappeared by 575 K indicating thatmolecular ethanol has been removed and/or converted into othersurface species; the OH bending mode was still present (albeitattenuated) but it is most likely due to surface hydroxyls and notto the OH mode of ethanol.
Fig. 6 presents the decay of ethanol (1398 cm−1) and ethox-ide (1122 m−1) IR signals together with ethanol desorption duringTPD. No attempt was made to correct for the changes in intensitywith surface concentration as the objective of the figure is to qual-itatively correlate desorption and surface species evolution. Thisfigure is explained in more detail below.
3.5. Ethoxide desorption/reactions
In the spectrum collected at room temperature, IR absorptionbands at 1047 cm−1, 1073 cm−1, and 1121 cm−1 correspond to C–Oand C–C stretching modes of ethoxide adsorbed on the catalyst sur-face. Further identification of adsorption modes of ethoxides canbe made by comparing the C–C and C–O stretching frequencieswith the previous work by Wu et al. [55]. At 298 K, the absorp-tion bands for C2H5O(a) are at 1047 cm−1, 1073 cm−1, 1093 cm−1
and 1122 cm−1. Among these bands, the bands at 1047 cm−1,1122 cm−1, and 1146 cm−1 can be assigned to the C–O stretchingand the bands at 1071 cm−1 and 1093 cm−1 to the C–C stretchingof ethoxides. Among C–O stretching bands, 1047 cm−1 correspondsto bidentate while band at 1122 cm−1 corresponds to a monoden-tate ethoxide species. It is now worth comparing these results toTPD results obtained from the same surface where some useful
conclusions could be made. The dotted line in Fig. 6 indicates thedecrease in IR peak areas of the 1121 cm−1 band with tempera-ture. It is clear that this form of ethoxide is affected very little until500 K, but above this temperature it starts to convert into other
the conditions of our experiments. Furan desorption from ethanolhas also been seen on other systems from ethanol [61], acetalde-hyde [21], ethylene [62] and acetylene [63] where the reaction
280 380 480 580 680
Mas
ssp
ectr
omet
er r
espo
nse
(A.U
)
Peak
ar
eas
und
er
IR b
ands
(A
.U)
Temperature ( K)
Ethanol
Ethoxide
Fig. 6. Ethanol desorption from the Au/TiO2 surface. Red line: ethanol desorption
ig. 5. FTIR spectra in the 1700–990 cm−1 range after ethanol adsorption on Au/TiO2
emperature.
roducts. Molecular ethanol starts decreasing as soon as the tem-erature of the surface is increased above room temperature and
s completely removed at temperatures between 500 K and 575 K.nterestingly it also appears that adsorbed ethanol molecules doot convert to ethoxide species with increasing temperature but
nstead desorb; since the intensity of ethoxide related vibrationalodes does not increase but actually gradually decrease. This may
ndicate that ethanol molecules are adsorbed on sites that do notllow for O–H bond dissociation. These sites might be adjacent tou clusters. It is also worth mentioning the continuous shift of theeak at 1047 cm−1, corresponding to bidentate ethoxides on theurface, towards lower wavenumbers with increase in tempera-ure. This might be due to decreasing of the population of surfacedsorbates that result in slight stabilization (less dipole–dipoleepulsion). The two bands for ethoxides at 1047 and 1121 cm−1 areoth attenuated with increasing temperature, but do not show theame temperature dependence. Their ratio changes considerablyith increasing temperature. The ratio 1047 cm−1 to 1121 cm−1 is
.13 at 298 K then steadily decreases to become 0.6 at 575 K. Theeason for this is unclear as one would expect that the monoden-ate species (1121 cm−1) to disappear before the bi-dentate species1047 cm−1). One possible explanation is that the mono-dentatepecies at higher temperature are those of ethoxide species thatave migrated to surface oxygen vacancies as has been observedy STM over TiO2 (1 1 0) rutile single crystal surface [58].
.6. Identification of possible oxidation/coupling products
During TPD it was found that ethoxides started to convertnto other products at around 505 K. These reactions mainlynclude dehydration, dehydrogenation, condensation and couplingroducts. The presence of the condensation product crotonalde-yde can be confirmed by the appearance of two distinct IR
ands at 1634 and 1658 cm−1 attributed to �(C–O), �(C C) and(CH3) of adsorbed crotonaldehyde [19,59]. Desorption of croton-ldehyde along with other coupling products were also noticedround this temperature during TPD. Higher temperatures caused
ubsequent heating at the indicated temperature. All spectra were recorded at room
ethoxide decomposition and removal from the surface indicatedby the disappearance of all its characteristic peaks and appearanceof completely new complex band structure in 1350–1650 cm−1
region. The peaks in this region can be assigned to carbonatespecies formed on the surface [60]. Carbonate species startedto appear at 685 K and were the only species detected by IRat temperature 727 K. During TPD the other higher carbon con-taining products that desorbed were benzene, furan, and butene.The absence of IR bands attributed to any of these is expectedas their desorption is reaction limited. Butene desorption occursvia pinacolate C–O bond dissociation. It is however not possi-ble to distinguish between pinacolate and ethoxides by IR under
profile during TPD; solid thin line: decrease in 1398 cm−1 IR band area correspond-ing to molecular ethanol; dotted thin line: decrease of the IR band at 1121 cm−1
bands corresponding to mono-dentate ethoxide species. (For interpretation of thereferences to color in this figure legend, the reader is referred to the web version ofthe article.)
Scheme 2. Reaction mechanism for the formation of ethylene on TiO2 and benz
echanism has been discussed in some detail; its minor contri-ution here does not allow us to track its formation by IR.
Owing to the presence of Au on TiO2, the presence or absence ofossible oxidation product of ethanol was carefully studied. Oxida-ion of ethanol may result in the formation of acetic acid, acetates,cetaldehyde and CO2. Acetic acid is represented by a 1680 cm−1
and due to carbonyl stretching and acetate is represented by453 and 1535 cm−1 bands due to –COO– symmetric and anti-ymmetric stretching, respectively. No evidence for either of thesepecies was found in this work. Also, the absence of spectral fea-ures for acetaldehyde at 1691 cm−1 �(C O), 1443 cm−1 �as(CH3),377 cm−1 �s(CH3), 1350 cm−1 indicated that the energy barrieror its formation from ethoxide species is higher than that of itsdsorption.
Scheme 2 summarizes the main observed reaction products forthanol decomposition over TiO2 and Au/TiO2, and gives likelyechanisms for product formation; products derived from ethox-
des were mainly ethylene on TiO2 and benzene over Au/TiO2.
. Conclusion
The surface reactions of ethanol on bare and Au nanoparti-le modified anatase TiO2 nanoparticle catalysts were successfullyrobed using a combination of TPD and FTIR spectroscopy. Ethanolecomposed on the bare TiO2 support to yield surface ethoxidepecies, which decomposed via several reaction channels at 673 Ko yield predominantly ethylene (ca. 71.7% carbon yield), and lessermounts of butene (9.6%), acetaldehyde (4.0%), methane (1.8%).mall amounts of benzene, CO2 crotonaldehyde and furan werelso produced. Depositing Au nanoparticles on the surface of thenatase TiO2 support dramatically changed the surface chemistry,urface energetics and relative distribution of these products. Theain product of ethanol decomposition on Au/TiO2 was benzene
ca. 60.7% carbon yield) which desorbed at 600 K, along with lessermounts of the other reaction products seen for the bare TiO2atalyst. The high selectivity of the Au/TiO2 catalyst for benzeneormation is rationalised in terms a scheme whereby �-aldolisationeactions of acetaldehyde create a surface 2,4-hexadienal inter-ediate, which subsequently undergoes Au nanoparticle induced
–H bond scission of the methyl group of 2,4-hexadienal, thenntramolecular cyclisation followed by H2O elimination to give ben-ene. This work suggests that supported Au nanoparticle catalystsay useful for the synthesis of aromatic molecules from aliphatic
lcohols.
cknowledgements
The authors would like to thank AINSE Ltd for providing finan-ial assistance through a Research Award (AINGRA09119) to enableEM work on the Au/TiO2 catalyst to be conducted. The sup-ort of Mark Blackford (ANSTO) in collecting the TEM data is also
[[
[
n Au/TiO2 starting from ethoxide species. Other minor reactions are neglected.
acknowledged. A.M. Nadeem thanks the HEC Pakistan for theirfinance through a PhD Scholarship.
References
[1] G.R. Bamwenda, S. Tsubota, T. Nakamura, M. Haruta, J. Photochem. Photobiol.A 89 (1995) 177.
Manorik, V.G. Il’in, Theor. Exp. Chem. 41 (2005) 26.[5] M.A. Nadeem, M. Murdoch, G.I.N. Waterhouse, J.B. Metson, M.A. Keane, J. Llorca,
H. Idriss, J. Photochem. Photobiol. A: Chem. 216 (2010) 250.[6] M. Murdoch, G.W.N. Waterhouse, M.A. Nadeem, M.A. Keane, R.F. Howe, J. Llorca,
H. Idriss, Nat. Chem. (2011), doi:10.1038/nchem.1048.[7] H. Idriss, M.A. Barteau, Adv. Catal. 45 (2000) 261, and references therein.[8] H. Idriss, E.G. Seebauer, J. Mol. Catal. A: Chem. 152 (2000) 201.[9] S.V. Chong, T.R. Griffiths, H. Idriss, Surf. Sci. 444 (2000) 187.10] H. Idriss, E.G. Seebauer, Catal. Lett. 66 (2000) 139.11] A.M. Nadeem, J.M.R. Muir, J.B. Metson, H. Idriss, Phys. Chem. Chem. Phys. 13
(2011) 7637.12] C. Diagne, H. Idriss, A. Kiennemann, Catal. Commun. 3 (2002) 565.13] P.Y. Sheng, A. Yee, G.A. Bowmaker, H. Idriss, J. Catal. 208 (2002) 393.14] V. Fierro, V. Klouz, O. Akdim, C. Mirodatos, Catal. Today 75 (2002) 141.15] J.P. Breen, R. Burch, H.M. Coleman, Appl. Catal. B: Environ. 39 (2002) 65.16] S. Cavallaro, S. Freni, J. Hydrogen Energy 21 (1996) 465.17] G.I.N. Waterhouse, M. Murdoch, J. Llorca, H. Idriss, Int. J. Nanotechnol. 9 (2012)
113.18] H. Idriss, K.S. Kim, M.A. Barteau, J. Catal. 139 (1993) 119.19] A. Yee, S.J. Morrison, H. Idriss, J. Catal. 191 (2000) 30.20] A. Yee, S.J. Morrison, H. Idriss, Catal. Today 63 (2000) 327.21] H. Madhavaram, H. Idriss, J. Catal. 224 (2004) 358.22] Y. Wu, H. Liu, J. Zhang, F. Chen, J. Phys. Chem. C 113 (2009) 14689.23] B.K. Min, J.E. Heo, N.K. Youn, O.S. Joo, H. Lee, J.H. Kim, H.S. Kim, Catal. Commun.
10 (2009) 712.24] V. Rodriguez-Gonzalez, R. Zanella, G. del Angel, R. Gomez, J. Mol. Catal. A: Chem.
281 (2008) 93.25] V. Iliev, D. Tomova, L. Bilyarska, G. Tyuliev, J. Mol. Catal. A: Chem. 263 (2007)
32.26] R.S. Sonawane, M.K. Dongare, J. Mol. Catal. A: Chem. 243 (2006) 68.27] A. Orlov, M.S. Chan, D.A. Jefferson, D. Zhou, R.J. Lynch, R.M. Lambert, Environ.
Technol. 27 (2006) 747.28] A. Dobosz, A. Sobczynski, Monatsh. Chem. 132 (2001) 1037.29] M. Haruta, Catal. Today 36 (1997) 153.30] S. Lee, C. Fan, T. Wu, S.L. Anderson, J. Am. Chem. Soc. 126 (2004) 5682.31] A.S.K. Hashmi, G.J. Hutchings, Angew. Chem. Int. Ed. 45 (2006) 7896.32] A. Corma, H. Garcia, Chem. Soc. Rev. 37 (2008) 2096.33] M. Haruta, J. Catal. 115 (1989) 301.34] G.R. Bamwenda, S. Tsubota, T. Nakamura, M. Haruta, Catal. Lett. 44 (1997) 83.35] M. Valden, X. Lai, D.W. Goodman, Science 281 (1998) 1647.36] M.S. Chen, D.W. Goodman, Acc. Chem. Res. 39 (2006) 739.37] F. Boccuzzi, A. Chiorino, J. Phys. Chem. B 104 (2000) 5414.38] B. Schumacher, V. Plzak, M. Kinne, R.J. Behm, Catal. Lett. 89 (2003) 109.39] M. Haruta, A. Ueda, S. Tsubota, R.M. Torres Sanchez, Catal. Today 29 (1996) 443.40] G.C. Bond, D.T. Thompson, Gold Bull. 33 (2000) 41.41] F. Cosandey, T.E. Madey, Surf. Rev. Lett. 8 (2001) 73.42] R. Meyer, C.S. Lemire, K.H. Shaikhutdinov, J. Freund, Gold Bull. 37 (2004) 72.43] K. Minato, T. Susaki, S. Shiraki, H.S. Kato, M. Kawai, K.-I. Aikaa, Surf. Sci. 566–568
(2004) 1012.
44] E.I. Ko, J.B. Benziger, R.J. Madix, J. Catal. 62 (1980) 264.45] S. Porsgaard, P. Jiang, F. Borondics, S. Wendt, Z. Liu, H. Bluhm, F. Besenbacher,
M. Salmeron, Angew. Chem. 123 (2011) 2314.46] Y. Borensztein, L. Delannoy, A. Djedidi, R.G. Barrera, C. Louis, J. Phys. Chem. C
114 (2010) 9008.
2 lysis T
[[
[[[
[[[
[[
[[
4 A.M. Nadeem et al. / Cata
47] V.S. Lusvardi, M.A. Barteau, W.E. Farneth, J. Catal. 153 (1995) 41.48] V.S. Lusvardi, M.A. Barteau, W.R. Dolinger, W.E. Farneth, J. Phys. Chem. 100
(1996) 18183.49] K.S. Kim, M.A. Barteau, J. Mol. Catal. 63 (1990) 103.50] M.A. Nadeem, G.I.N. Waterhouse, J.B. Metson, J. Llorca, H. Idriss; in preparation.
51] H. Idriss, C. Diagne, J.P. Hindermann, A. Kiennemann, M.A. Barteau, J. Catal. 155
(1995) 219.52] S.V. Chong, H. Idriss, J. Vac. Sci. Technol. A 19 (2001) 1933.53] T. Reztova, C.-H. Chang, J. Koresh, H. Idriss, J. Catal. 185 (1999) 223.54] S. Mukerjee, J. McBreen, J. Electroanal. Chem. 448 (1998) 163.
[[[[[
oday 182 (2012) 16– 24
55] W.-C. Wu, C.-C. Chuang, J.-L. Lin, J. Phys. Chem. B 104 (2000) 8719.56] G.A.M. Hussein, N. Sheppard, M.I. Zaki, R.B. Fahim, J. Chem. Soc. Faraday Trans.
87 (1991) 2655.57] P.Y. Sheng, G.A. Bowmaker, H. Idriss, Appl. Catal. A: Gen. 261 (2004) 171.58] H. Idriss, Platinum Metals Review 48 (2004) 105.
59] A. Yee, S.J. Morrison, H. Idriss, J. Catal. 186 (1999) 279.60] G. Busca, V. Lorenzelli, Mater. Chem. 7 (1982) 89.61] H. Madhavaram, H. Idriss, J. Catal. 184 (1999) 553.62] H. Madhavaram, H. Idriss, Stud. Surf. Sci. Catal. 110 (1997) 265.63] H. Madhavaram, H. Idriss, J. Catal. 206 (2002) 155.