Unclassified DEELSA/ELSA/WD(98)7 Organisation de Coopération et de Développement Economiques OLIS : 21-Jan-1999 Organisation for Economic Co-operation and Development Dist. : 27-Jan-1999 __________________________________________________________________________________________ English text only DIRECTORATE FOR EDUCATION, EMPLOYMENT, LABOUR AND SOCIAL AFFAIRS EMPLOYMENT, LABOUR AND SOCIAL AFFAIRS COMMITTEE LABOUR MARKET AND SOCIAL POLICY - OCCASIONAL PAPERS N°36 HEALTH OUTCOMES IN OECD COUNTRIES: A FRAMEWORK OF HEALTH INDICATORS FOR OUTCOME-ORIENTED POLICYMAKING Melissa Jee and Zeynep Or 73724 Document complet disponible sur OLIS dans son format d’origine Complete document available on OLIS in its original format Unclassified DEELSA/ELSA/WD(98)7 English text only
Transcript
Unclassified DEELSA/ELSA/WD(98)7
Organisation de Coopération et de Développement Economiques OLIS : 21-Jan-1999Organisation for Economic Co-operation and Development Dist. : 27-Jan-1999__________________________________________________________________________________________
English text onlyDIRECTORATE FOR EDUCATION, EMPLOYMENT, LABOUR AND SOCIAL AFFAIRSEMPLOYMENT, LABOUR AND SOCIAL AFFAIRS COMMITTEE
LABOUR MARKET AND SOCIAL POLICY - OCCASIONAL PAPERS N°36
HEALTH OUTCOMES IN OECD COUNTRIES: A FRAMEWORK OF HEALTHINDICATORS FOR OUTCOME-ORIENTED POLICYMAKING
Melissa Jee and Zeynep Or
73724
Document complet disponible sur OLIS dans son format d’origine
Complete document available on OLIS in its original format
Unclassified
DE
EL
SA/E
LSA
/WD
(98)7 E
nglish text only
DEELSA/ELSA/WD(98)7
2
DIRECTORATE FOR EDUCATION,EMPLOYMENT, LABOUR AND SOCIAL AFFAIRS
OCCASIONAL PAPERS
This series is designed to make available to a wider readership selected labour market and social policystudies prepared for use within the OECD. Authorship is usually collective, but principal writers arenamed. The papers are generally available only in their original language -- English or French -- with asummary in the other.
Comment on the series is welcome, and should be sent to the Directorate for Education, Employment,Labour and Social Affairs, 2, rue André-Pascal, 75775 PARIS CEDEX 16, France. Additional, limitedcopies are available on request.
The opinions expressed and arguments employed here are the responsibilityof the author(s) and do not necessarily reflect those of the OECD
Applications for permission to reproduce or translateall or part of this material should be made to:
Head of Publications ServiceOECD
2, rue André-Pascal75775 Paris, CEDEX 16
France
Copyright OECD 1998
DEELSA/ELSA/WD(98)7
3
ACKNOWLEDGEMENTS
The paper was prepared collaboratively by Melissa Jee of the Health Policy Unit and Zeynep Or,acting as consultant to OECD. Acknowledgements should also be given to our network of contributersfrom national governments and other institutions who assisted us in the development of the conceptualframework and collection of original data.
DEELSA/ELSA/WD(98)7
4
SUMMARY
OECD health-care systems confront the dual challenge of containing costs and maximising thehealth of their populations. The effectiveness of health-care provision in fostering longer and healthierlives is therefore of fundamental importance. In order to respond to these challenges, policy makers aredemanding more and better information on health outcomes.
Therefore, this paper presents a summary of the current state-of-the-art in health outcomeindicators for monitoring population health status and for evaluating the performance and effectiveness ofvarious health policies and medical-care interventions. The paper begins by developing a framework forclassifying the range of indicators that have been put forward to measure health outcomes. It thenillustrates the potential value of different indicators for policy making within this framework anddescribes some recent trends in health status in OECD countries.
RESUME
Les systèmes de santé des pays de l’OCDE sont confrontés à un double défi, à savoir maîtriserles coûts et améliorer l’état de santé de la population. La question de l’efficacité des dépenses de santé etdes interventions médicales destinées à permettre aux gens de vivre plus longtemps et en meilleure santéest donc fondamentale. Afin de répondre à ce double défi, les responsables politiques souhaitent disposerdavantage d’informations pertinentes sur l’état de santé de la population.
Dans cette optique, le présent rapport fait le point des indicateurs de santé auxquels on se réfèreà la fois pour suivre l’évolution de l’état de santé de la population et pour évaluer la performance etl’efficacité des diverses politiques de santé et des interventions médicales. Cette étude commence parl’élaboration d’un cadre afin de distinguer les principaux indicateurs de l’état de santé qui ont étéproposés. Le rapport montre également dans ce cadre, l’intérêt potentiel de différents indicateurs pour laformulation de politiques de santé, et décrit les tendances récentes de l’état de santé dans les pays del’OCDE.
ADDENDUM 1. ADL INSTRUMENTS FOR THE MEASUREMENT OF GENERAL HEALTHSTATUS AND DISABILITY...................................................................................................................... 78
ADDENDUM 2. SOURCES FOR TABLE 14: PREVALENCE OF HOSPITAL-ACQUIREDINFECTIONS IN SELECTED COUNTRIES ............................................................................................. 81
DEELSA/ELSA/WD(98)7
6
INTRODUCTION
1. OECD health-care systems face the twin challenges of containing costs and maximising thehealth of their populations. The effectiveness of health-care spending and related policies in fosteringlonger and healthier lives in the population is therefore a fundamental issue. In order to respond to thesechallenges, policy makers are demanding more and better information on health outcomes of thepopulation. To consider these issues, national experts on health statistics attended a meeting in December1997 to discuss future work on health outcome indicators. This paper has been built on the conclusionsreached at that meeting.
2. Relevant and comparable information on health outcomes would serve two primary purposes:
• first, to monitor current trends and forecast future needs in population health, both withinand across Member countries; and,
• second, to measure and evaluate the performance and effectiveness of various health policiesand medical-care interventions.
3. With such information on outcomes available, policy makers would be able to take a moreevidence-based approach in identifying priorities and allocating resources among competing and emerginghealth needs, programmes, regions, and social groups.
4. The objectives of this paper are threefold:
• to summarise the current state-of-the-art in health outcome measurement being used both formonitoring population health status and for measuring and evaluating the performance andeffectiveness of health policies and medical-care interventions;
• to contribute to the future development of a common set of international health indicators foroutcome-oriented policy making;
• to illustrate the potential value of different health outcome indicators in policy making,while also taking the opportunity to describe some current trends in health status in OECDcountries based on available indicators.
5. Health outcomes has become a widely-used term in health care policy over the past ten years;however, the meaning behind the term differs greatly depending on the user and the context. A traditionaldefinition of health outcomes is a “change in a patient’s current and future health status that can beattributed to antecedent health care” (Donabedian, 1980).
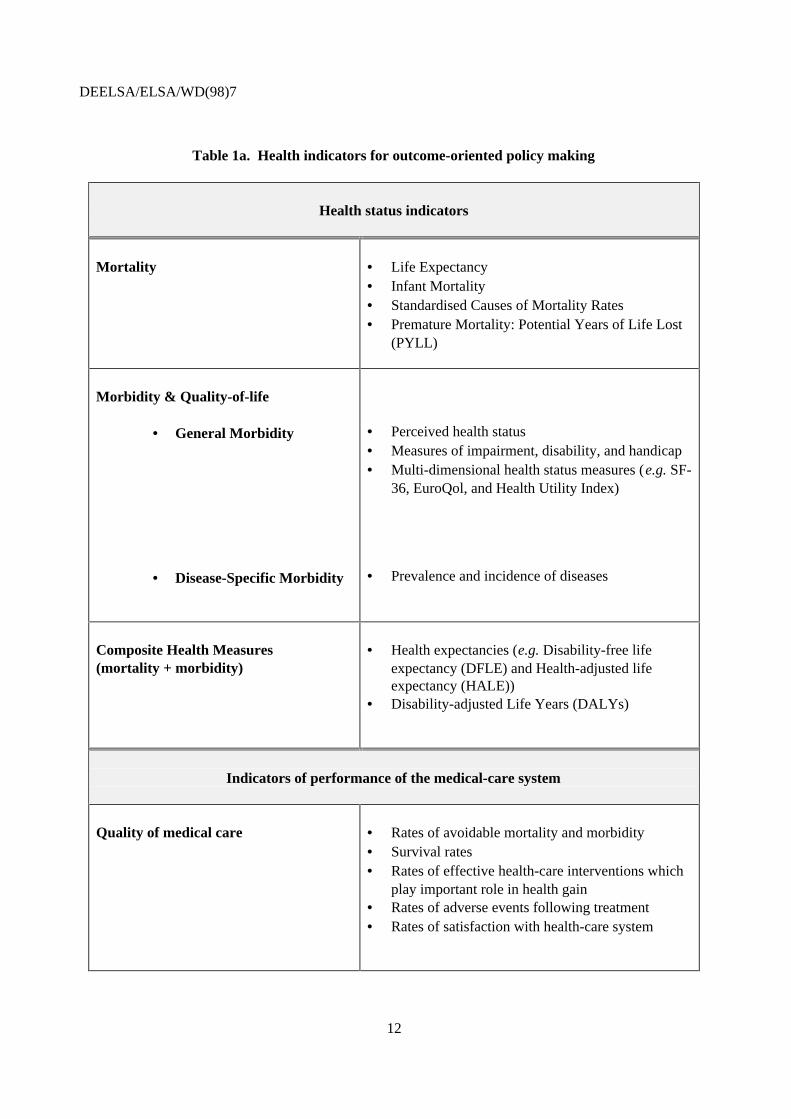
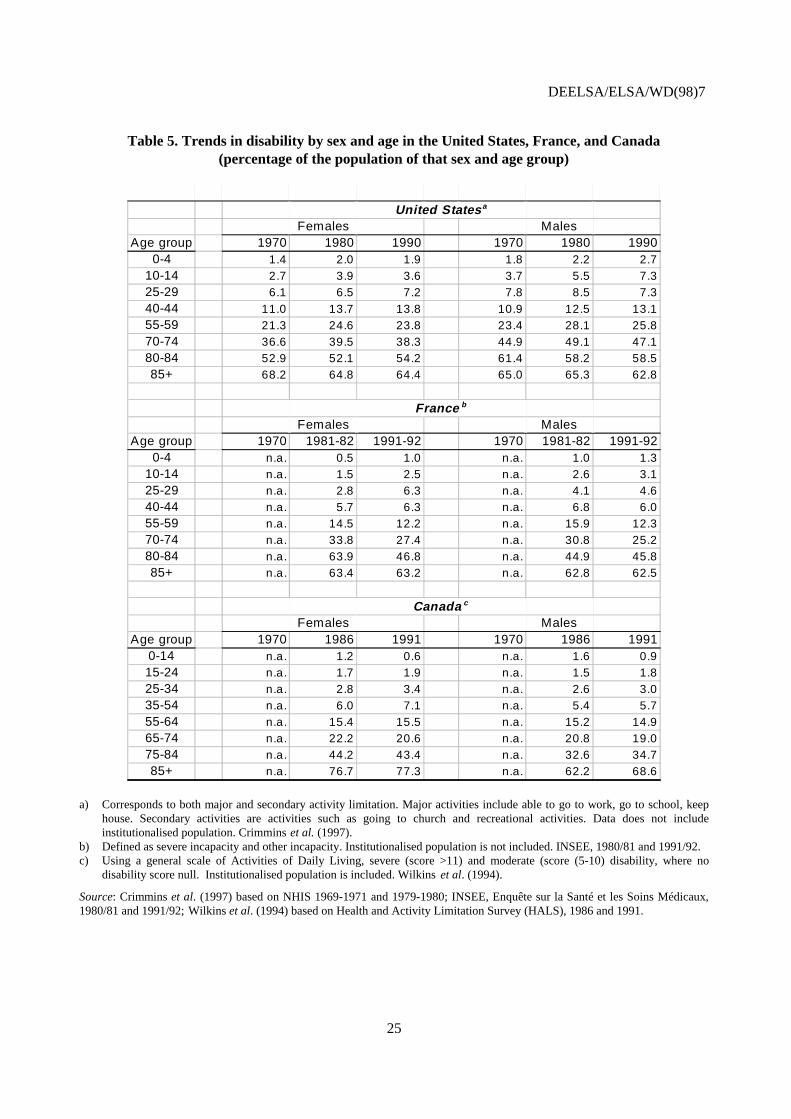
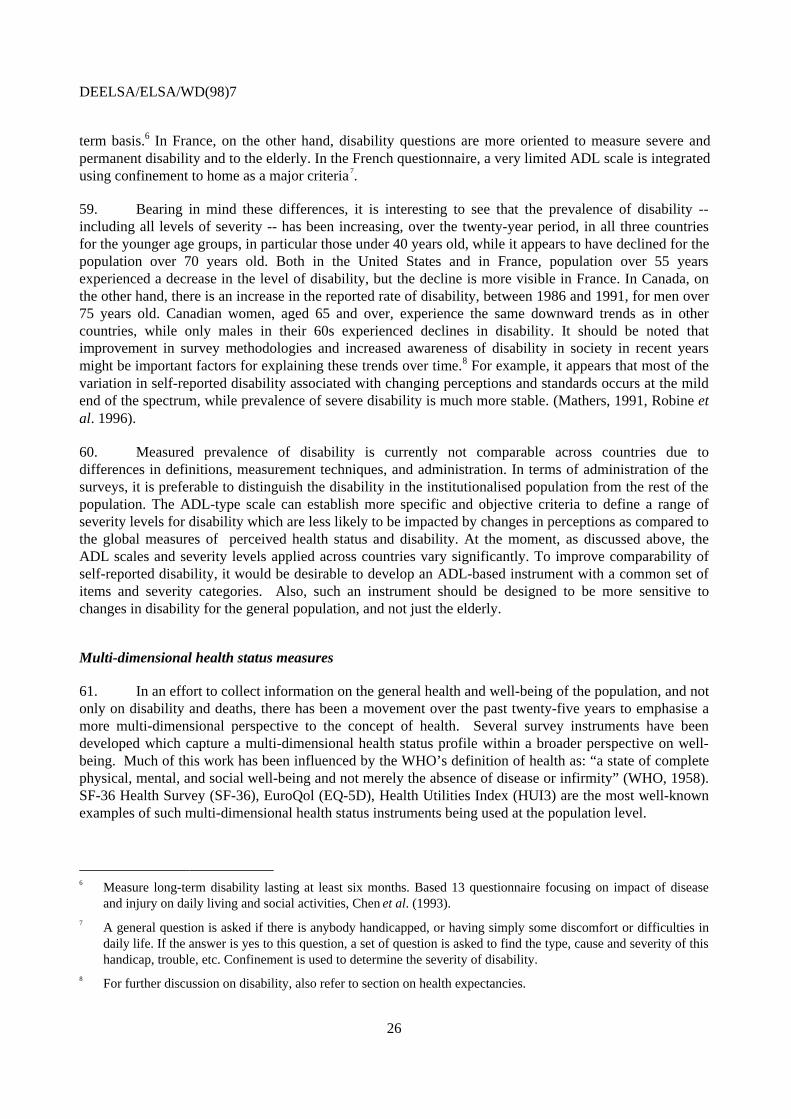
6. However, a broader definition of health outcomes is adapted in the framework of healthindicators for outcome-oriented policy making (Table 1.a) where health outcomes since they are neededare seen as more than a research tool. Given that the primary objective of health policy is to improve thehealth status in a population, health status indicators are included under the umbrella of health outcomes
DEELSA/ELSA/WD(98)7
7
to describe the level of health and the variations across countries and over time. While it is widelyunderstood today that health status of a population depends on a number of factors beyond the medical-care system such as social and economic environment, it is extremely difficult to identify the directcontribution of medical-care system to changes in health status. To address this issue, the proposedframework also comprises indicators which reflect more closely the performance and quality of health-care system in maintaining or improving health outcomes.
Health outcomes for monitoring population health status
7. Health outcome indicators can be used for monitoring population health status. In this context,they reflect the contribution of a wide range of factors -- including social, environmental, and lifestylefactors -- going far beyond the medical-care system. Traditionally, these indicators have been based solelyon mortality data such as life expectancy, standardised mortality rates, infant mortality, and potentialyears of life lost. These mortality indicators have provided useful information for describing the mortalitypatterns of the population. However, it is clear, that even among OECD countries, continuedimprovement of ascertainment and classification of specific causes of death is needed for accurateestimates of mortality.
8. As life expectancy continues to increase and chronic diseases are on the rise, policy makers inOECD countries also need more information on the non-fatal consequences of diseases for health andquality of life. Increased emphasis has been placed on health goals, such as preventing disability,improving physical and mental functioning, and reducing the pain and distress caused by disease. In turn,these emerging concerns have created a demand for better data on the nature, causes, and distribution ofdiseases in the population and their impact on the well-being and quality of life. Here, a priority fromOECD’s perspective should be to encourage the development of relevant and comparable morbiditystatistics by collaborating with existing international projects.
9. Self-reported data on general morbidity is being collected increasingly by national healthsurveys to measure the changes in health status among individuals and populations; examples of such datainclude perceived health status, disability, physical and mental functioning, and multi-dimensionalconcepts of health. However, there is a significant lack of international consensus on the concepts ofhealth and morbidity to measure, as well as the methodology and administration of these surveys, makinginternational comparisons next to impossible.
10. In particular, measured prevalence of disability is currently not comparable across countries dueto differences in definitions, measurement techniques, and administration. To improve comparability ofself-reported disability, it would be desirable to develop an activities of daily living (ADL)-basedinstrument with a common set of items and severity categories. Also, such an instrument should bedesigned to be more sensitive to changes in disability for the general population and not just the olderpopulations.
11. As OECD countries proceed to implement multi-dimensional health status instruments (e.g. SF-36, Health Utility Index and EuroQol) in their national health surveys, more comparative analyses of theresults of the application of these different instruments to the same population, as well as across differentpopulations and over time, are needed. This would help to clarify the merits and disadvantages of eachmeasure in satisfying decisionmaking and monitoring needs.
DEELSA/ELSA/WD(98)7
8
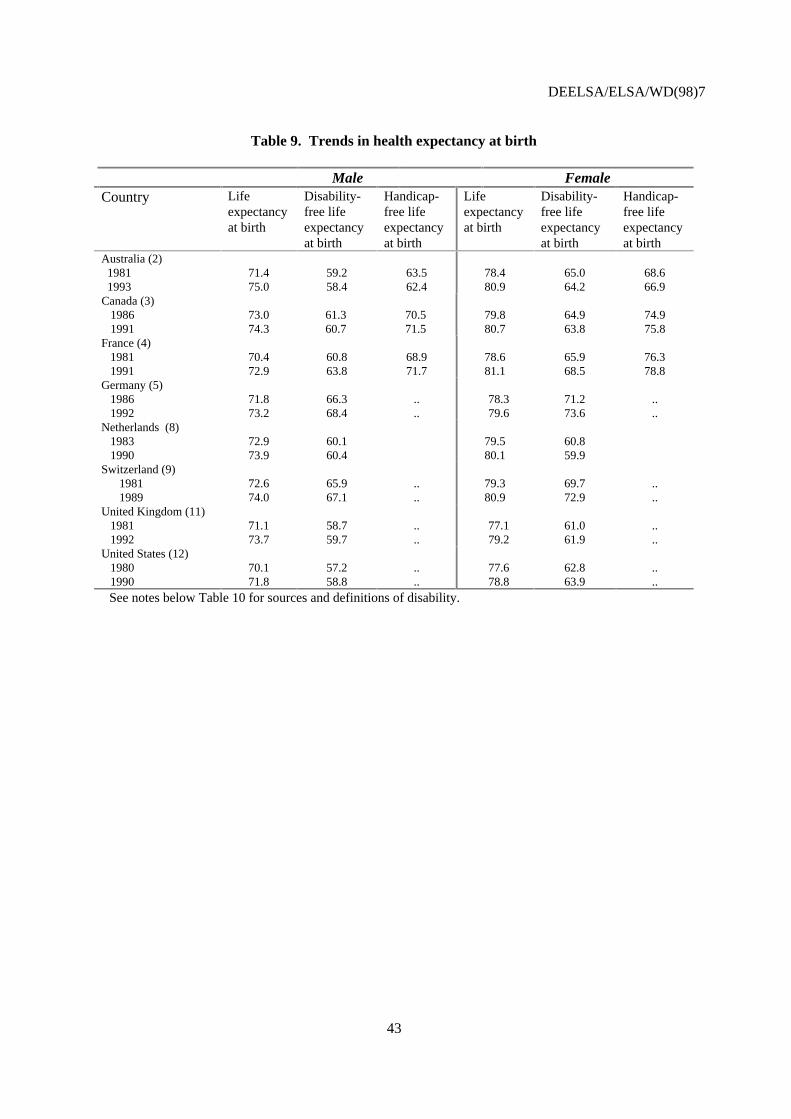
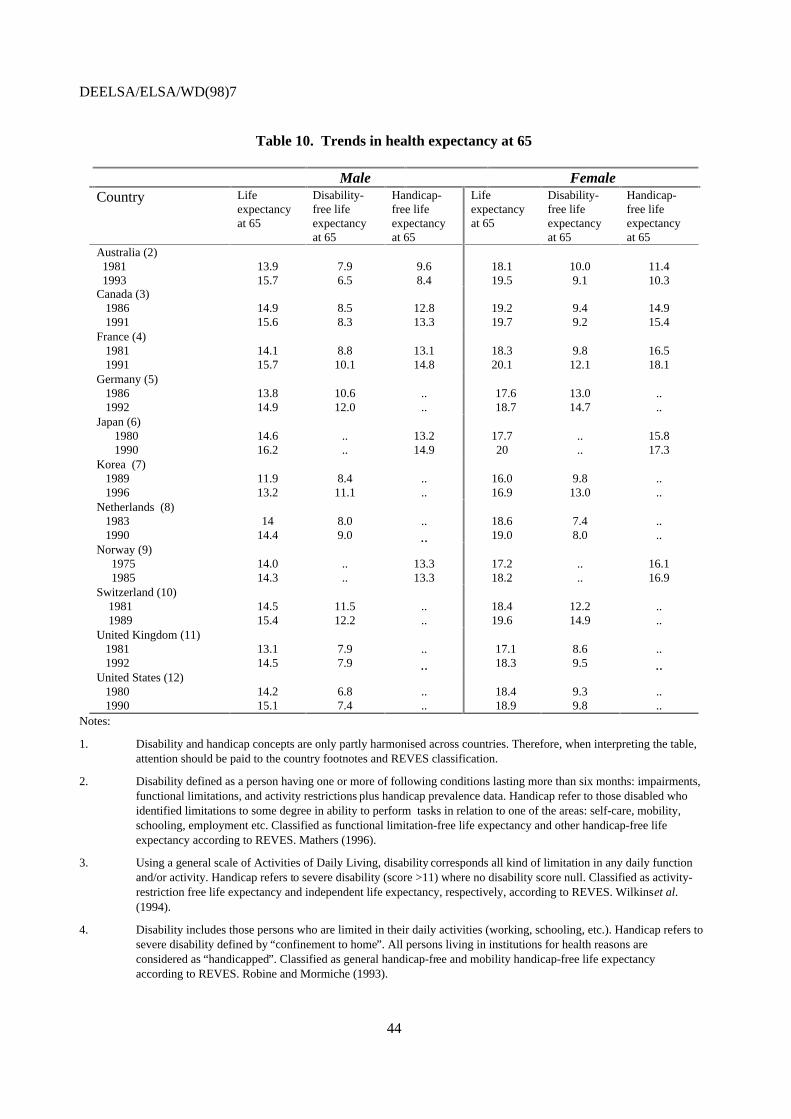
12. Reliable and consistent information on disease incidence and prevalence statistics are alsoessential for identifying the causes of morbidity in the population. Surprisingly, there are few comparabledata on the national level in OECD countries to identify which diseases are imposing the heaviest burdenon society. Development of disease-specific data are needed to measure the changes in health status andemerging health needs in the OECD populations.13. Recently, there has been growing interest in developing composite measures of health whichintegrate both mortality and morbidity in a single index, not only to better describe the level of populationhealth status, but also to use in effectiveness analysis. The best-known composite health measures areHealth Expectancies (HE), Health-adjusted Life Expectancy (HALE) and Disability-adjusted Life Years(DALYs).
14. At this moment, the most feasible of these composite health measures is the health expectancymeasure and some illustrative calculations of this measure are presented in this report. But internationalcomparisons of health expectancy measures are still limited, primarily due to the lack of standardisation ofthe basic data on disability. Much work needs to be conducted with the measurement of disability dataacross OECD, so countries will be better able to monitor and compare population health trends in terms ofthe number of years spent in good health and free of disability.
15. As for other well-known composite measures, the information bases used to calculate HALEsand DALYs are lacking in availability and comparability. In addition, for both measures, there is not yetsufficient consensus on the most appropriate method for the weighting system needed to derive acomposite index.
16. The national experts in health statistics agreed to encourage experimentation across OECDcountries with these measures. However, they also advised that higher priority should be placed on firstbuilding the basic information base of mortality and morbidity data.
Health outcomes for measuring performance of the medical-care system
17. Rapid increases in health expenditures have prompted concerns about the effectiveness ofhealth-care spending, policies, programmes, and medical-care interventions in terms of population healthgain. Comparisons of health outcomes flowing from different interventions and programmes on a nationaland international level could furnish important information to policy makers about how health-careresources should be allocated.
18. In effectiveness analysis, health outcomes have traditionally been measured by years of lifegained, mortality, and survival. However, medical interventions often also may relieve pain and improvefunctioning. Parallel to the trend in monitoring population health status, there is a demand for integratinginformation on morbidity in effectiveness analysis.
19. The composite measures of health --in particular, the health-adjusted life expectancy (HALE) --have also been used in micro-level effectiveness analysis. The development of these indicators onpopulation level could make it possible to encompass the diverse effects of a single intervention and tocompare interventions with quite different outcomes, thus expanding significantly the applicability andusefulness of these analyses (Gold, 1996). Nevertheless, there is still a lack of consensus concerning themeasurement and the construction of these indices of how best to represent the values society places ondifferent health states, interventions, and situations.
DEELSA/ELSA/WD(98)7
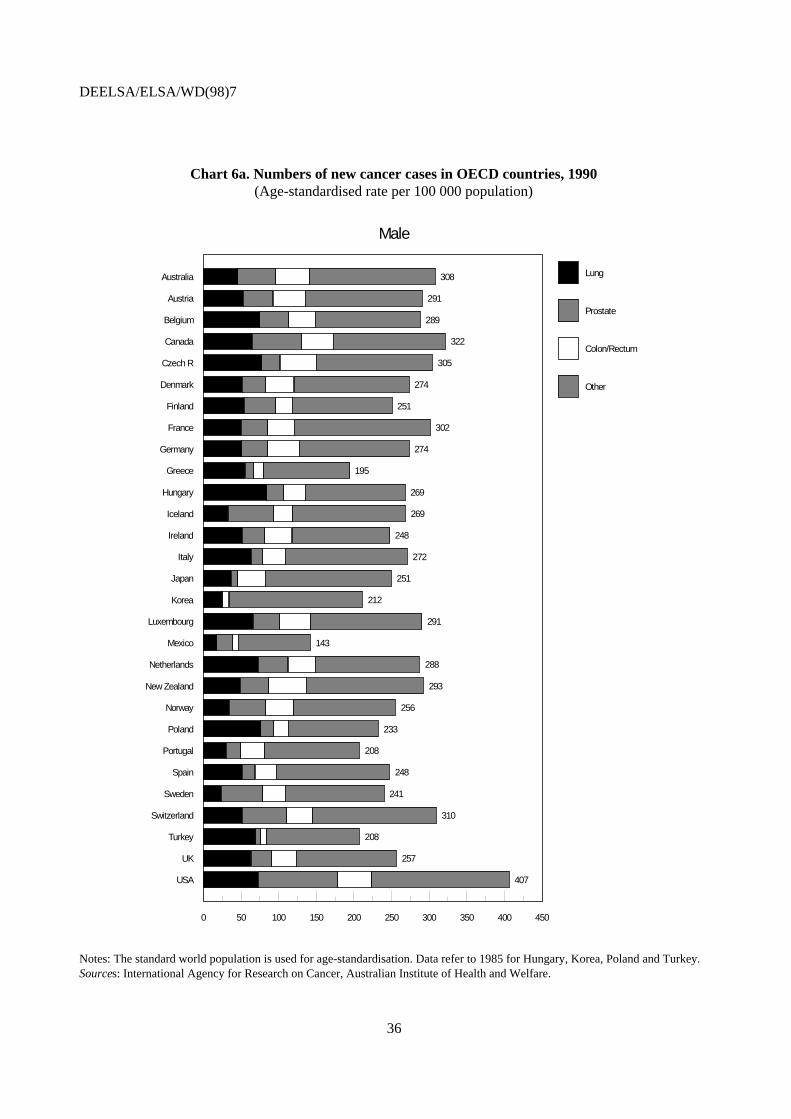
9
20. At the same time, it is extremely difficult to assess the role of medical care in determining healthoutcomes since there are many other factors outside the medical-care system having significant impact onhealth status. Without conducting multi-variable modelling or randomised controlled trials, it is difficultto establish clear and robust links between health status and a specific medical-care intervention.
21. Given the problems of establishing robust links between health outcomes and health care, someparallel work has been undertaken to develop a group of indicators where the links between medical-careinterventions and health are better established. The national experts agreed that these measures wouldprove valuable for monitoring what is being achieved in the medical-care system and health-care policiesacross OECD. Examples of commonly-used performance indicators are listed below:
• rates of avoidable mortality and morbidity, where there is clear evidence that timely andappropriate medical interventions would either prevent the condition or treat the disease atan early stage.
• rates of effective health-care interventions which have been proven to have an undisputedand important role in health gain, such as immunisation or breast cancer screening. In thesecases, measurement of process --intervention or uptake rates -- could be used as a proxy foroutcomes.
• survival rates at a given point in time after an intervention or treatment.
• rates of adverse health events which can only be a result of health-care interventions, such ashospital-acquired infections or complications in routine surgery.
• rates of satisfaction with health-care systems.
22. To proceed with the development of these indicators, national experts agreed upon a set of fourcriteria to use in the selection of a core set of performance indicators:
1. Indicators would reflect health problems that are a major concern in most Member countries;
2. There would be a clear understanding of the relationship between medical care interventionand health status;
3. Indicators would clearly relate to areas involving substantial resources or burden of disease;
4. Indicators should be sensitive to quality of care differences.
23. Applying these criteria, the OECD countries could move toward a core set of performanceindicators for the areas representing the most burden in terms of costs and disease, disability or quality oflife. After a critical review of the status of knowledge and experience in the OECD countries, a family ofperformance indicators related to selected conditions, for example, cancer, cardiovascular disease, andrespiratory diseases -- the three top diseases causing high premature mortality-- could be collected andmonitored consistently across countries with the support of a network of experts in interested countries.
DEELSA/ELSA/WD(98)7
10
Conclusions
24. Development of comparable indicators of health outcomes on the international level is in itsinfancy. However, there is broad agreement across OECD countries on the necessity for a key set ofrelevant and coherent international health outcome indicators to assess and compare country performancesand establish sustainable targets for health policy. Many countries have already begun developing a rangeof health outcome measures and indicators. It would be unfortunate if each country develops their ownindicators and were unable to make international comparisons due to the lack of standardisation. TheOECD could play a useful role in stimulating the development of a basic information base of mortalityand morbidity data to develop indicators to monitor health status and to better identify the effectiveness ofhealth policies and programmes.
25. While a universal composite health measure is an attractive goal for many, an indicator whichcan address all types of health problems for any population group is not feasible. The national expertsagreed that an integrated set of international health indicators should be developed to move towardoutcome-oriented policy making, as presented in Table 1a. Each type --generic and disease specificmortality and morbidity measures, composite health measures, and subjective and objective measures --serves its own purpose and together, they provide a more comprehensive picture of health status in thepopulation than relying on one summary measure.
26. Having reviewed OECD Secretariat’s reports on health outcomes1 in December 1997, thenational experts in health statistics agreed that:
• Development of a set of international health outcome indicators is needed to monitor howwell countries are progressing in population health status and how effective health systemsare in addressing the health needs of their populations.
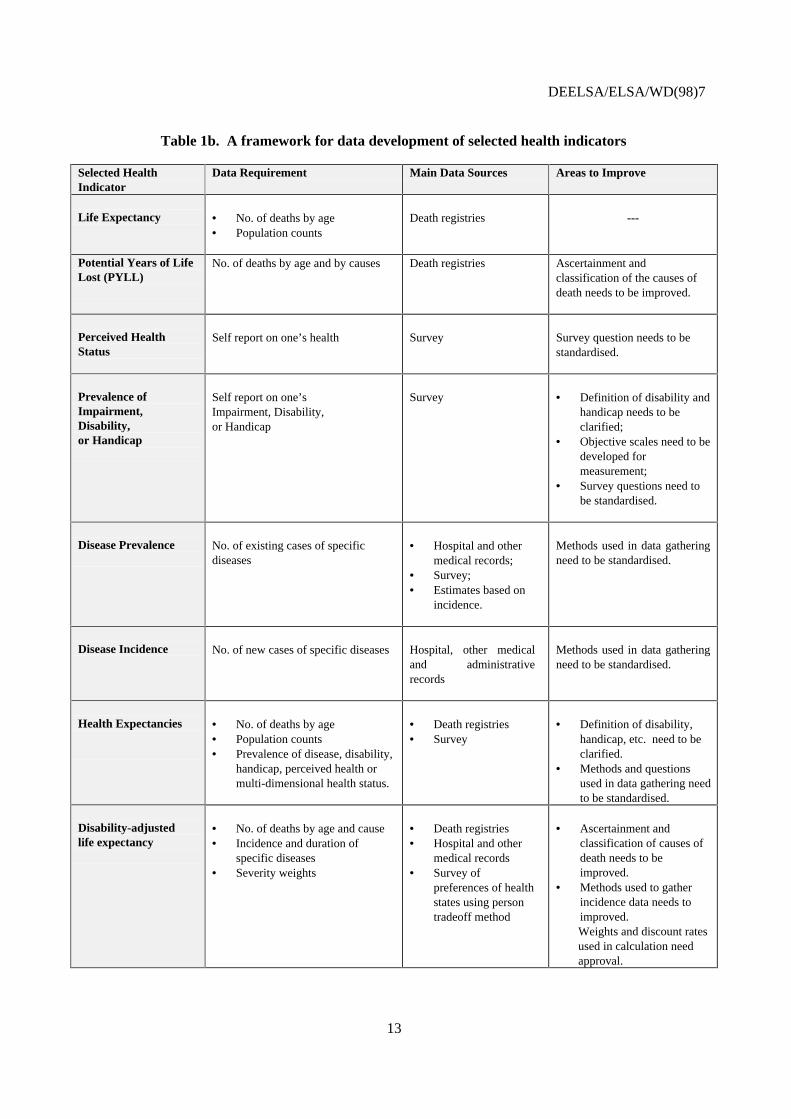
• In order to construct relevant and internationally comparable indicators of health,development of a common and standardised information base of mortality and morbiditydata is essential as outlined in Table 1b.2 Improvement of this core information is the firststep to move towards more outcome-oriented policy making.
• More specifically, assuring the comparability of health data across OECD area wouldrequire:
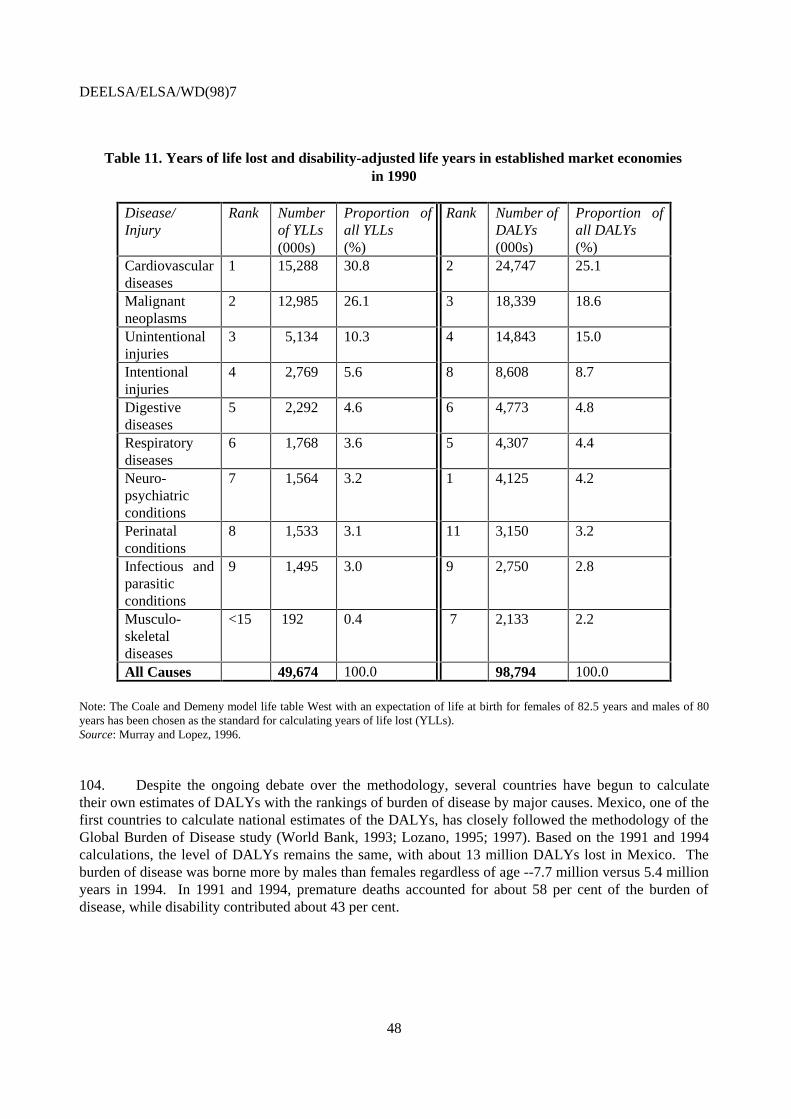
• Standardising the concepts and definitions of health and disability to measurecomprehensively the general population in national health surveys.
• Conducting national health surveys that are broadly similar in design (wording ofquestions and response categories) and administration.
1 OECD, Current Work in the Development of a Composite Health Measure, Working Party on Social Party, Ad
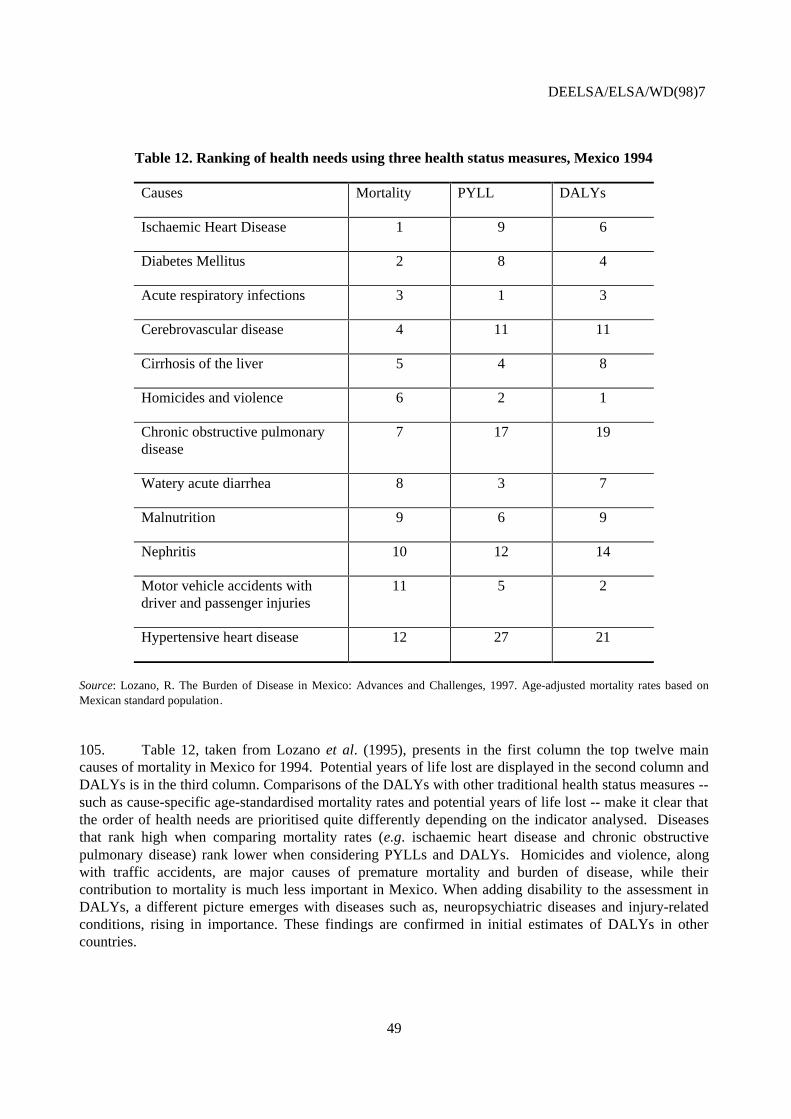
Hoc Meeting of Experts in Health Statistics, DEELSA/ELSA/HP(97)1; OECD, Member Countries’ Experience:Results of the Second Questionnaire on Health Outcomes, Working Party on Social Policy, Ad Hoc Meeting ofExperts in Health Statistics, DEELSA/ELSA/HP(97)2.
2 Please note Table 1.b has recently been developed and has not been reviewed by the national experts in healthstatistics in the December 1997 meeting.
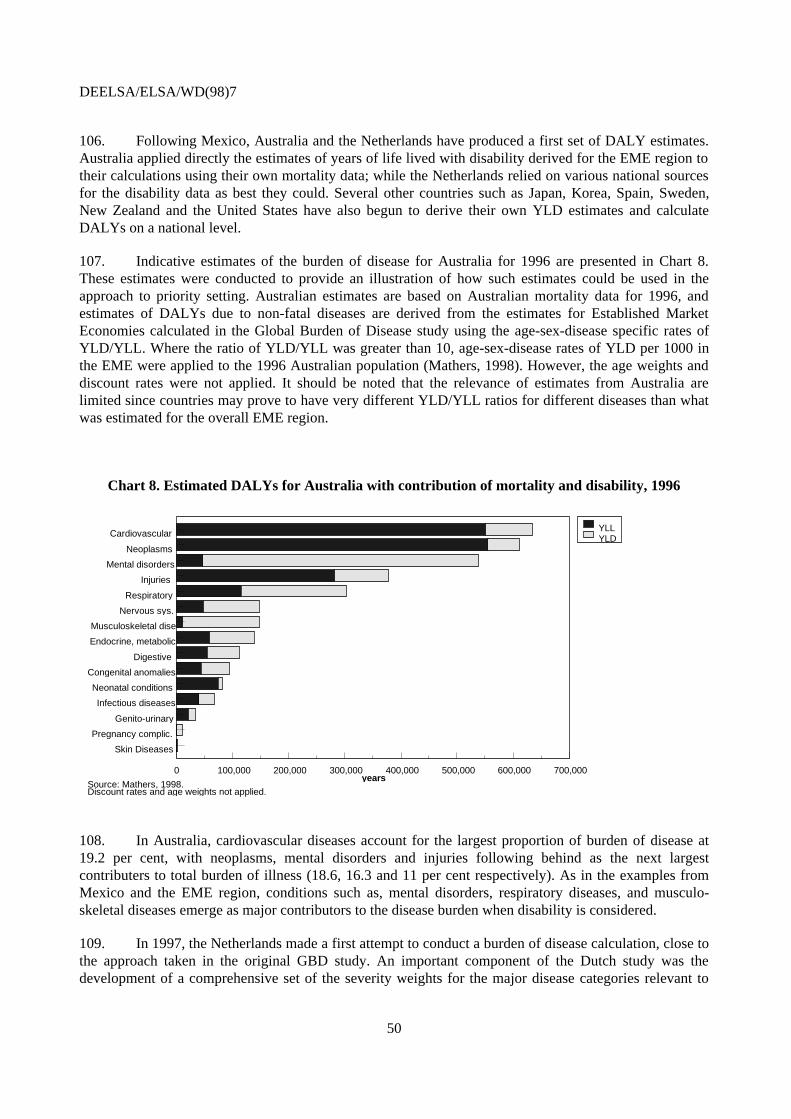
DEELSA/ELSA/WD(98)7
11
• Continuing analyses of the feasibility, practicality, and reliability of the multi-dimensional health status instruments on the population level to identify the relativemerits and disadvantages of each instrument.
• There is also a need to collect information on the quality of medical care and the impact ofcare on health of individuals and population. Based on a set of common criteria, OECDcountries could move toward identification of a core set of relevant performance indicatorsfor areas representing the most burden in terms of cost, disease and disability.
What is the role of OECD in this process?
27. To achieve the recommendations outlined above and subject to sufficient resources being madeavailable to undertake the work, the OECD Secretariat could engage in the following tasks:
• Create an international network with the goal of identifying a common set of health outcomeindicators to assist in monitoring trends in population health status and in evaluating theperformance of medical-care system.
• Contribute to the standardisation of concepts and definitions of a basic information base, inparticular morbidity data.
• Contribute to the standardisation of concepts and definitions of a core set of performanceindicators.
• Encourage application of these standards in national data collections.
• Encourage analytical work based on the common set of international health outcomeindicators, in particular for understanding the determinants of health status, measuringeffectiveness, allocating resources, and identifying health priorities.
• Collaborate with the parallel international processes being undertaken by WHO andEurostat.
DEELSA/ELSA/WD(98)7
12
Table 1a. Health indicators for outcome-oriented policy making
Health status indicators
Mortality • Life Expectancy• Infant Mortality• Standardised Causes of Mortality Rates• Premature Mortality: Potential Years of Life Lost
(PYLL)
Morbidity & Quality-of-life
• General Morbidity
• Disease-Specific Morbidity
• Perceived health status• Measures of impairment, disability, and handicap• Multi-dimensional health status measures (e.g. SF-
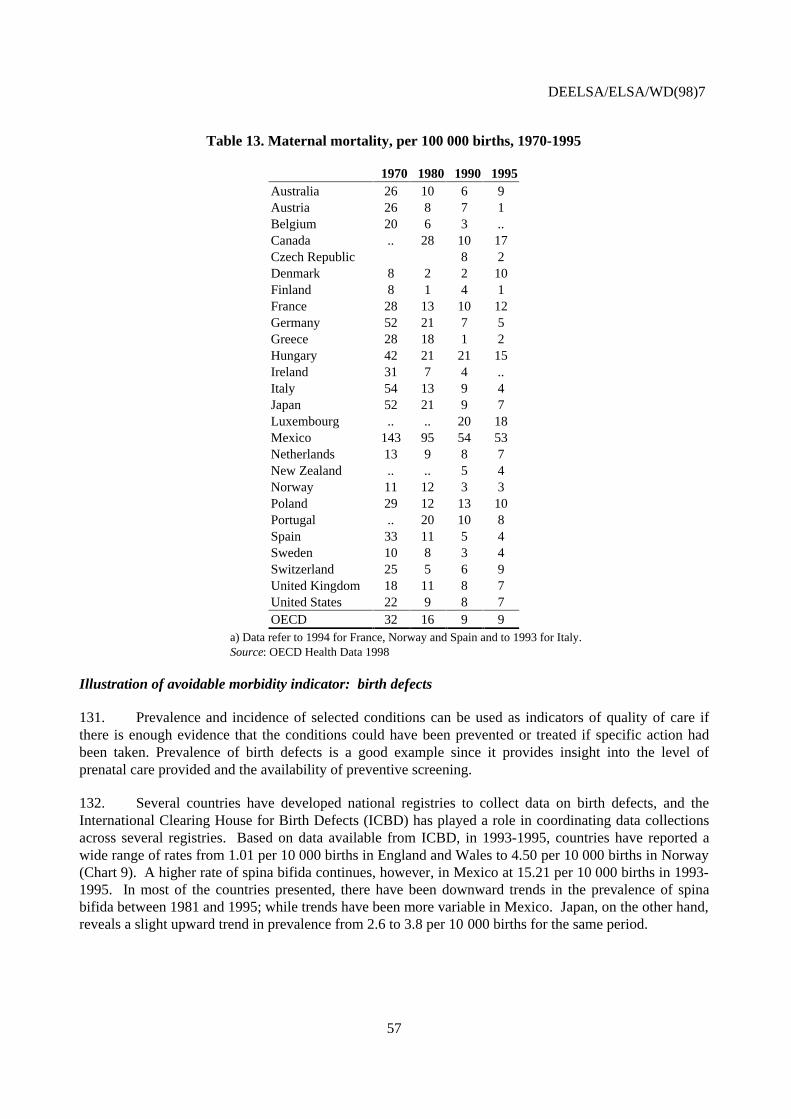
36, EuroQol, and Health Utility Index)
• Prevalence and incidence of diseases
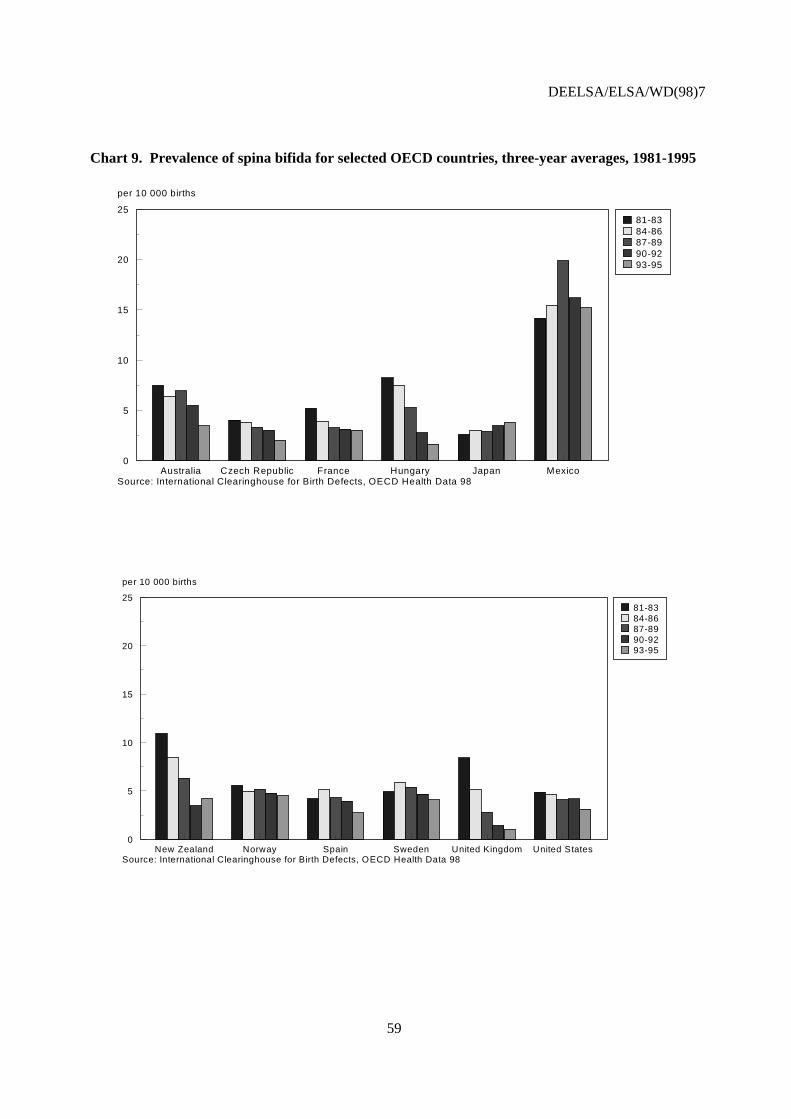
•
Composite Health Measures(mortality + morbidity)
• Health expectancies (e.g. Disability-free lifeexpectancy (DFLE) and Health-adjusted lifeexpectancy (HALE))
• Disability-adjusted Life Years (DALYs)
Indicators of performance of the medical-care system
Quality of medical care • Rates of avoidable mortality and morbidity• Survival rates• Rates of effective health-care interventions which
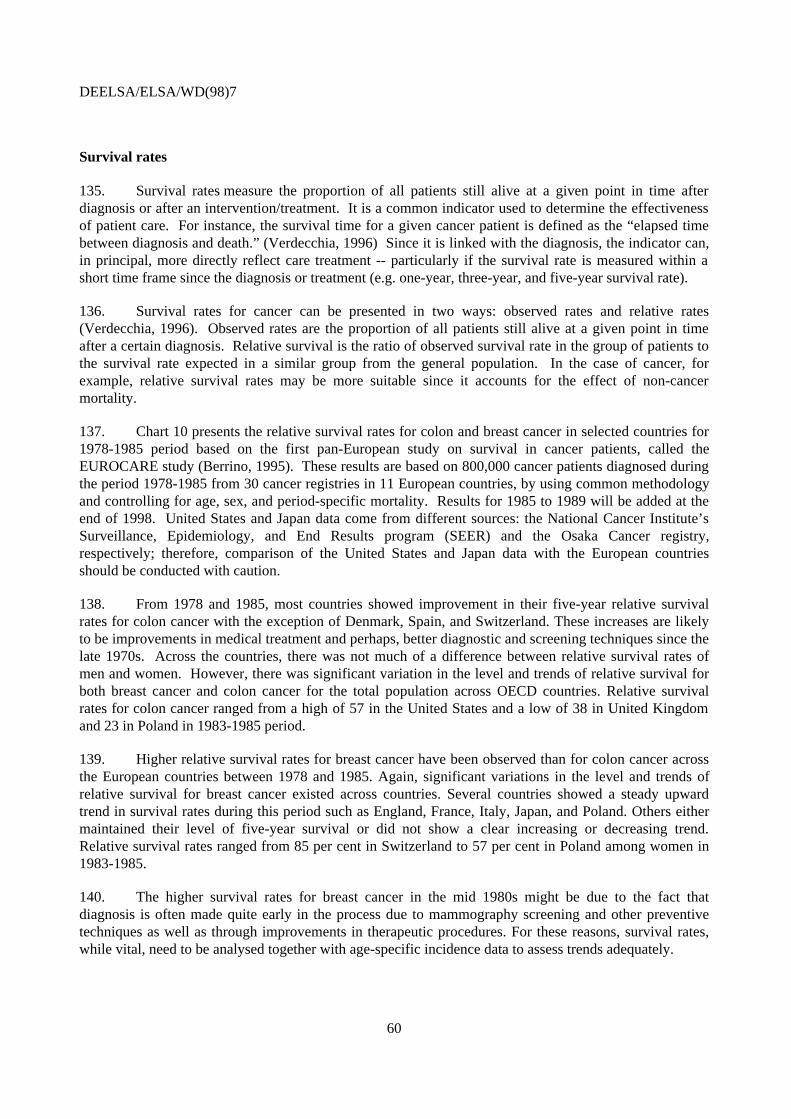
play important role in health gain• Rates of adverse events following treatment• Rates of satisfaction with health-care system
DEELSA/ELSA/WD(98)7
13
Table 1b. A framework for data development of selected health indicators
Selected HealthIndicator
Data Requirement Main Data Sources Areas to Improve
Life Expectancy • No. of deaths by age• Population counts
Death registries ---
Potential Years of LifeLost (PYLL)
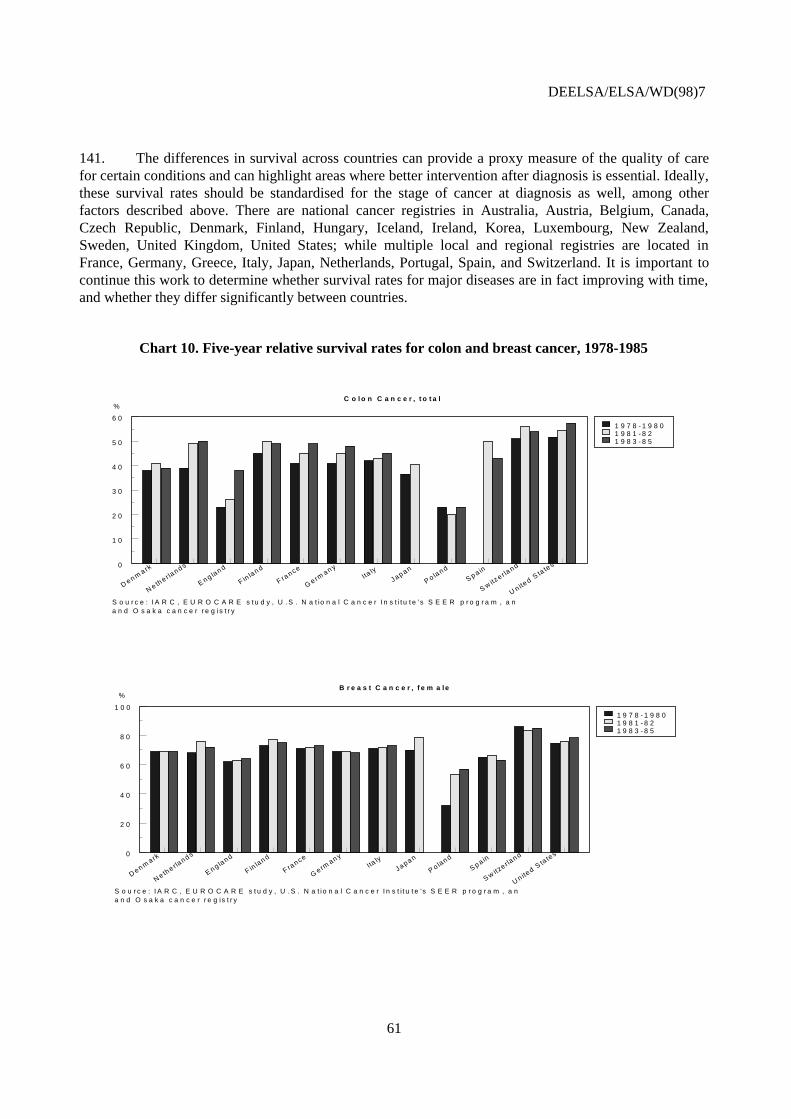
No. of deaths by age and by causes Death registries Ascertainment andclassification of the causes ofdeath needs to be improved.
Perceived HealthStatus
Self report on one’s health Survey Survey question needs to bestandardised.
Prevalence ofImpairment,Disability,or Handicap
Self report on one’sImpairment, Disability,or Handicap
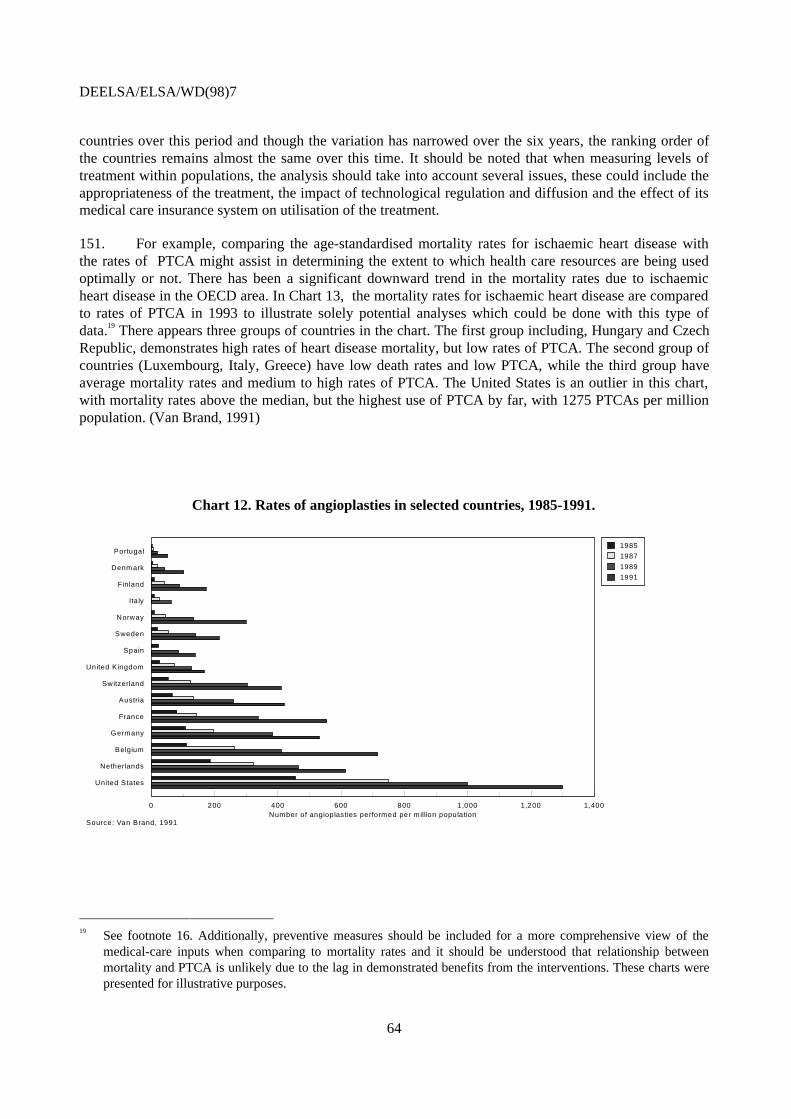
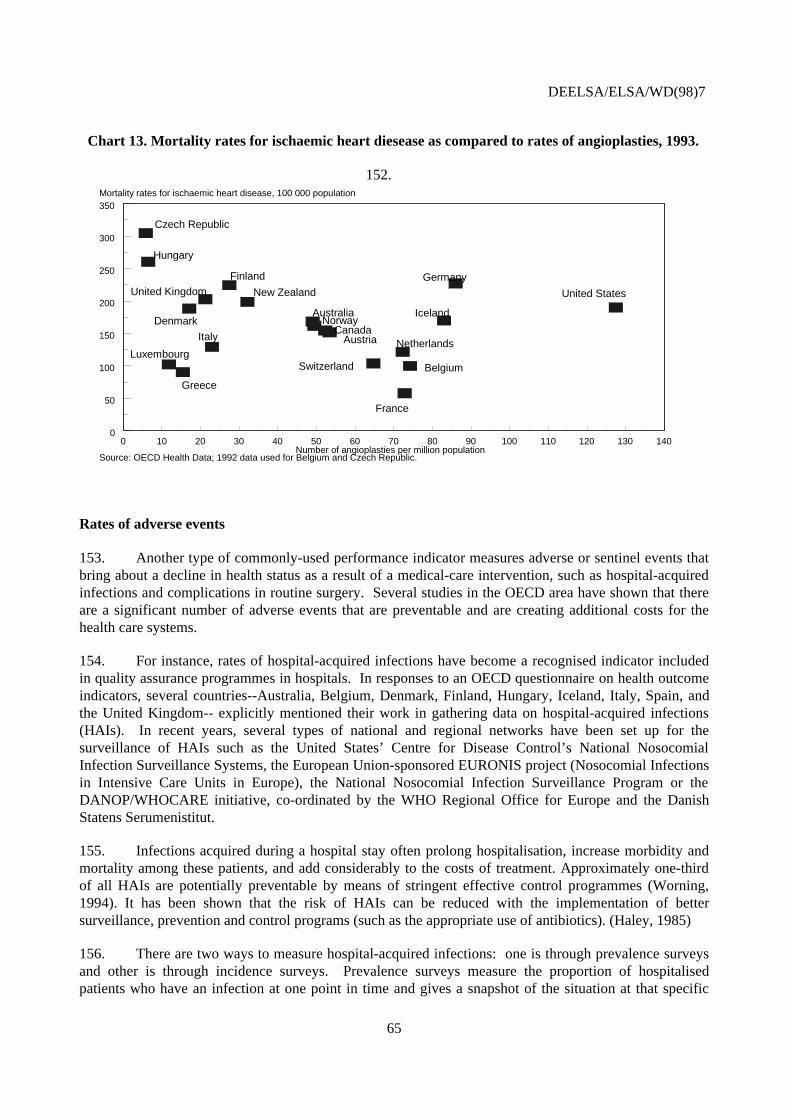
Survey • Definition of disability andhandicap needs to beclarified;
• Objective scales need to bedeveloped formeasurement;
• Survey questions need tobe standardised.
Disease Prevalence No. of existing cases of specificdiseases
• Hospital and othermedical records;
• Survey;• Estimates based on
incidence.
Methods used in data gatheringneed to be standardised.
Disease Incidence No. of new cases of specific diseases Hospital, other medicaland administrativerecords
Methods used in data gatheringneed to be standardised.
Health Expectancies • No. of deaths by age• Population counts• Prevalence of disease, disability,
handicap, perceived health ormulti-dimensional health status.
• Death registries• Survey
• Definition of disability, handicap, etc. need to be
clarified.• Methods and questions
used in data gathering needto be standardised.
Disability-adjustedlife expectancy
• No. of deaths by age and cause• Incidence and duration of
specific diseases• Severity weights
• Death registries• Hospital and other
medical records• Survey of
preferences of healthstates using persontradeoff method
• Ascertainment andclassification of causes ofdeath needs to beimproved.
• Methods used to gatherincidence data needs toimproved.Weights and discount ratesused in calculation needapproval.
DEELSA/ELSA/WD(98)7
14
MORTALITY INDICATORS
28. Currently, most indicators of health outcomes at the national level are based on mortality datawhich are relatively precise and readily available. Most of these indicators are presented in the OECDHealth Data such as life expectancy, standardised mortality rates, infant mortality, perinatal mortality, andpotential years of life lost.
29. Life expectancy, which represents the average length of life for a fictive generation, is one of theoldest and most widely available measures of health status. There has been a substantial increase in theaverage life expectancy in all OECD countries since the beginning of the century (Table 1). From 1900until today, life expectancy at birth has increased from an average of about 47 years for males and 50 forfemales to more than 73 and 80 years, respectively. Since the beginning of the century, OECD countrieshave witnessed a decline in infectious and parasitic causes of death, due primarily to medicaladvancements and availability of effective medical care as well as increased standards of living. By the1950s, it was evident that industrialised countries were undergoing an “epidemiological transition” inwhich infectious diseases became less of a problem, and chronic diseases emerged as the most prevalentcauses of death (OECD, 1987). In the past 30 years, more than 80 per cent of all deaths have beenattributed to chronic illness and some researchers have argued that individuals live now their fullbiological lives and there is little left to do to extend these biologically defined limits on life (Vallin 1981,Fournier 1994).
30. The most recent trends reveal, however, no sign of an upper limit in the growth of lifeexpectancy in OECD countries. Both for males and females, life expectancy at birth has been increasingat a steady rate over the past 20 years. Between 1960 and 1970, the average life expectancy of malesdeclined in many countries such as Australia, Denmark, the Czech Republic and the Netherlands, whilefor females, there was a slowdown in the progression of life expectancy. Although there has been no clearexplanation to this phenomenon, there is some evidence that lifestyle factors such as high incidence ofcigarette smoking and introduction of new technologies such as “faster” cars without enough securitymeasures might have been the predominant causes of the mortality increase for this period.
31. There are significant differences between countries as to the departing level and total progressachieved during the past century. For example, the average increase in life expectancy in the UnitedStates, which passed from 70 years (67 for men and 73 for women) in 1960 to 76 in 1996 (73 for men and79 for women) corresponds only to the half of the progress made in Japan where it passed from 67.5 years(65 for men and 70 for women) to 80.5 years (77 for men, 84 for women). While there has been asignificant convergence over time, important differences in life expectancy remain across OECDcountries.
DEELSA/ELSA/WD(98)7
15
Table 1. Life expectancy at birth, 1900-1996(Years)
* Unweighted averages, excludes Turkey.Source: United Nations, OECD Health Data 1998.
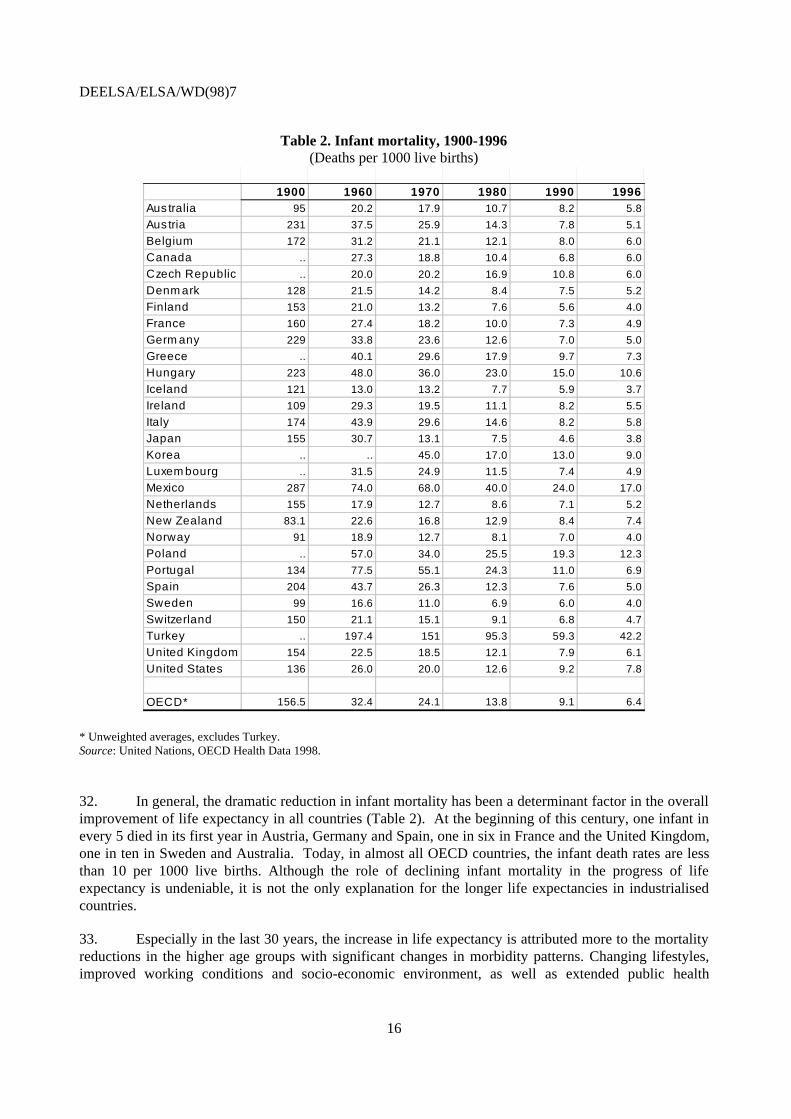
32. In general, the dramatic reduction in infant mortality has been a determinant factor in the overallimprovement of life expectancy in all countries (Table 2). At the beginning of this century, one infant inevery 5 died in its first year in Austria, Germany and Spain, one in six in France and the United Kingdom,one in ten in Sweden and Australia. Today, in almost all OECD countries, the infant death rates are lessthan 10 per 1000 live births. Although the role of declining infant mortality in the progress of lifeexpectancy is undeniable, it is not the only explanation for the longer life expectancies in industrialisedcountries.
33. Especially in the last 30 years, the increase in life expectancy is attributed more to the mortalityreductions in the higher age groups with significant changes in morbidity patterns. Changing lifestyles,improved working conditions and socio-economic environment, as well as extended public health
DEELSA/ELSA/WD(98)7
17
measures and therapeutic technologies are among the factors accounting for the evolution of lifeexpectancy. During the second half of this century, there has been a substantial change in the major causesof death in the OECD area. Although overall trends and causes of mortality are similar across OECDcountries, the timing of these declines and the current causes of death might differ significantly.
34. While measures of life expectancy are useful aggregate indicators of health status, they do notprovide information on the specific causes of death for a given period. The measure of Potential Years ofLife Lost (PYLL) provides an indicator of “premature mortality” according to cause of death. Technically,in the calculation of premature mortality, a minimum limit to life is chosen arbitrarily and PYLL arecalculated by adding the differences between the potential limit and actual age at death for all deaths. ThePYLL calculated for OECD Health Data uses 70 years as the minimum limit to life. Consideration ofpremature mortality, instead of standardised death rates, distinguishes deaths which could be “potentiallyavoided” and might give some new insights for developing priorities for preventive programs andassessing effectiveness across different health care systems, especially in the OECD area where deathrates are already low.
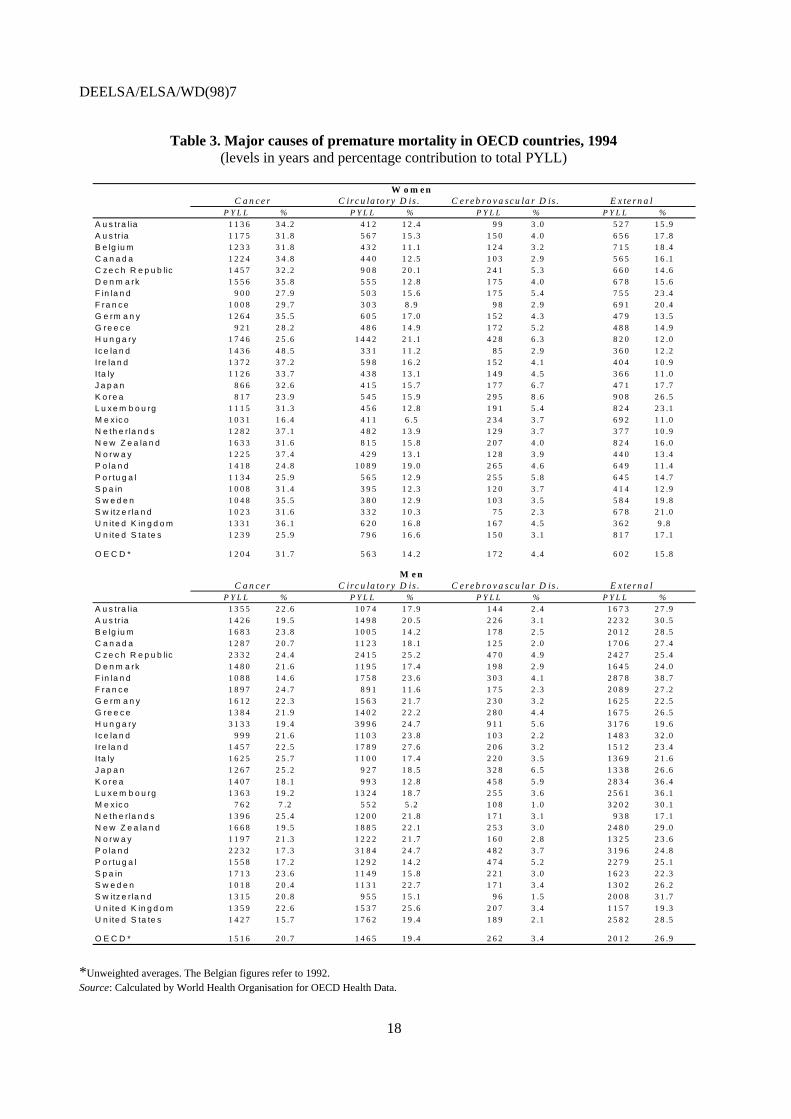
35. In most OECD countries, four major causes of death account for around 70 per cent ofpremature mortality (Table 3). In 1994, malignant neoplasms and external causes (including caraccidents) accounted for almost half of all premature deaths, followed by circulatory and respiratorydiseases. However, there are significant differences as to the relative importance of these causes for malesand females. For females, neoplasms are the most significant cause of premature death -- 32 per cent ofthe total PYLL for the OECD average -- while for males, it is external factors such as, car accidents andviolence that represent the most important burden -- 27 per cent of the OECD average. For males, theproportion of premature mortality due to cancer is almost equal to that of circulatory diseases (21 and 19per cent). Cerebrovascular diseases are the fourth major cause of premature death both for males andfemales -- 3 and 4 per cent of the total, respectively.
36. There are some notable disparities between countries in terms of different causes of prematuremortality. For example, cancer mortality for females appears to be the most important cause of prematuremortality in Hungary, Denmark and New Zealand -- 1746, 1633 and 1556 years lost per 100 000population, respectively -- while in Japan and Korea, premature mortality by cancer is half the rateobserved in those countries -- 865 and 817 years per 100 000 population. For males, the highest rates ofpremature cancer mortality appear in Eastern European countries: Hungary, the Czech Republic andPoland followed by Mediterranean countries such as France, Italy, and Spain. In 1994, malignantneoplasms gave rise to more than 3 000 years lost per 100 000 population in Hungary, which is four timesthe rate in Mexico, and three times the rates in Sweden and Norway. The disparities between countriesare equally visible for the external causes. For males, the PYLL for external causes ranges from 938 yearsper 100 000 population in the Netherlands to more than 3200 in Mexico, with the OECD average beingaround 2000 years.
37. The indicators based on mortality data are a reliable and extensive source of information fordescribing health status of populations, although continued improvement of the ascertainment andclassification of specific causes of death is needed, even among OECD countries. Nevertheless, mortalitydata provides no information on the non-fatal consequences of disease incidence or quality of life of thepopulations who now live longer. Chronic conditions such as hypertension, asthma, diabetes, mentalillness and other conditions of the musculoskeletal system are growing more prevalent in OECD countriesand tend to have a major impact on the quality of life. In order to better describe health status and identifypriority areas for actions in OECD countries, it is important to complement mortality data withinformation on non-fatal conditions and their effects on quality of life.
DEELSA/ELSA/WD(98)7
18
Table 3. Major causes of premature mortality in OECD countries, 1994(levels in years and percentage contribution to total PYLL)
W o m e nC a n c e r C ir c u la to r y D is . C e r e b r o v a s c u la r D is . E x te r n a l
P Y L L % P Y L L % P Y L L % P Y L L %
A u s tra lia 1 1 3 6 3 4 .2 4 1 2 1 2 .4 9 9 3 .0 5 2 7 1 5 .9A u s tr ia 1 1 7 5 3 1 .8 5 6 7 1 5 .3 1 5 0 4 .0 6 5 6 1 7 .8B e lg iu m 1 2 3 3 3 1 .8 4 3 2 1 1 .1 1 2 4 3 .2 7 1 5 1 8 .4C a n a d a 1 2 2 4 3 4 .8 4 4 0 1 2 .5 1 0 3 2 .9 5 6 5 1 6 .1C z e c h R e p u b lic 1 4 5 7 3 2 .2 9 0 8 2 0 .1 2 4 1 5 .3 6 6 0 1 4 .6D e n m a rk 1 5 5 6 3 5 .8 5 5 5 1 2 .8 1 7 5 4 .0 6 7 8 1 5 .6F in la n d 9 0 0 2 7 .9 5 0 3 1 5 .6 1 7 5 5 .4 7 5 5 2 3 .4F ra n c e 1 0 0 8 2 9 .7 3 0 3 8 .9 9 8 2 .9 6 9 1 2 0 .4G e rm a n y 1 2 6 4 3 5 .5 6 0 5 1 7 .0 1 5 2 4 .3 4 7 9 1 3 .5G re e c e 9 2 1 2 8 .2 4 8 6 1 4 .9 1 7 2 5 .2 4 8 8 1 4 .9H u n g a ry 1 7 4 6 2 5 .6 1 4 4 2 2 1 .1 4 2 8 6 .3 8 2 0 1 2 .0
Ic e la n d 1 4 3 6 4 8 .5 3 3 1 1 1 .2 8 5 2 .9 3 6 0 1 2 .2I re la n d 1 3 7 2 3 7 .2 5 9 8 1 6 .2 1 5 2 4 .1 4 0 4 1 0 .9I ta ly 1 1 2 6 3 3 .7 4 3 8 1 3 .1 1 4 9 4 .5 3 6 6 1 1 .0J a p a n 8 6 6 3 2 .6 4 1 5 1 5 .7 1 7 7 6 .7 4 7 1 1 7 .7K o re a 8 1 7 2 3 .9 5 4 5 1 5 .9 2 9 5 8 .6 9 0 8 2 6 .5L u x e m b o u rg 1 1 1 5 3 1 .3 4 5 6 1 2 .8 1 9 1 5 .4 8 2 4 2 3 .1M e x ic o 1 0 3 1 1 6 .4 4 1 1 6 .5 2 3 4 3 .7 6 9 2 1 1 .0N e th e r la n d s 1 2 8 2 3 7 .1 4 8 2 1 3 .9 1 2 9 3 .7 3 7 7 1 0 .9N e w Z e a la n d 1 6 3 3 3 1 .6 8 1 5 1 5 .8 2 0 7 4 .0 8 2 4 1 6 .0N o rw a y 1 2 2 5 3 7 .4 4 2 9 1 3 .1 1 2 8 3 .9 4 4 0 1 3 .4P o la n d 1 4 1 8 2 4 .8 1 0 8 9 1 9 .0 2 6 5 4 .6 6 4 9 1 1 .4
P o r tu g a l 1 1 3 4 2 5 .9 5 6 5 1 2 .9 2 5 5 5 .8 6 4 5 1 4 .7S p a in 1 0 0 8 3 1 .4 3 9 5 1 2 .3 1 2 0 3 .7 4 1 4 1 2 .9S w e d e n 1 0 4 8 3 5 .5 3 8 0 1 2 .9 1 0 3 3 .5 5 8 4 1 9 .8S w itz e r la n d 1 0 2 3 3 1 .6 3 3 2 1 0 .3 7 5 2 .3 6 7 8 2 1 .0U n ite d K in g d o m 1 3 3 1 3 6 .1 6 2 0 1 6 .8 1 6 7 4 .5 3 6 2 9 .8U n ite d S ta te s 1 2 3 9 2 5 .9 7 9 6 1 6 .6 1 5 0 3 .1 8 1 7 1 7 .1
O E C D * 1 2 0 4 3 1 .7 5 6 3 1 4 .2 1 7 2 4 .4 6 0 2 1 5 .8
M e nC a n c e r C ir c u la to r y D is . C e r e b r o v a s c u la r D is . E x te r n a l
P Y L L % P Y L L % P Y L L % P Y L L %
A u s tra lia 1 3 5 5 2 2 .6 1 0 7 4 1 7 .9 1 4 4 2 .4 1 6 7 3 2 7 .9A u s tr ia 1 4 2 6 1 9 .5 1 4 9 8 2 0 .5 2 2 6 3 .1 2 2 3 2 3 0 .5B e lg iu m 1 6 8 3 2 3 .8 1 0 0 5 1 4 .2 1 7 8 2 .5 2 0 1 2 2 8 .5C a n a d a 1 2 8 7 2 0 .7 1 1 2 3 1 8 .1 1 2 5 2 .0 1 7 0 6 2 7 .4C z e c h R e p u b lic 2 3 3 2 2 4 .4 2 4 1 5 2 5 .2 4 7 0 4 .9 2 4 2 7 2 5 .4
D e n m a rk 1 4 8 0 2 1 .6 1 1 9 5 1 7 .4 1 9 8 2 .9 1 6 4 5 2 4 .0F in la n d 1 0 8 8 1 4 .6 1 7 5 8 2 3 .6 3 0 3 4 .1 2 8 7 8 3 8 .7F ra n c e 1 8 9 7 2 4 .7 8 9 1 1 1 .6 1 7 5 2 .3 2 0 8 9 2 7 .2G e rm a n y 1 6 1 2 2 2 .3 1 5 6 3 2 1 .7 2 3 0 3 .2 1 6 2 5 2 2 .5G re e c e 1 3 8 4 2 1 .9 1 4 0 2 2 2 .2 2 8 0 4 .4 1 6 7 5 2 6 .5H u n g a ry 3 1 3 3 1 9 .4 3 9 9 6 2 4 .7 9 1 1 5 .6 3 1 7 6 1 9 .6Ic e la n d 9 9 9 2 1 .6 1 1 0 3 2 3 .8 1 0 3 2 .2 1 4 8 3 3 2 .0I re la n d 1 4 5 7 2 2 .5 1 7 8 9 2 7 .6 2 0 6 3 .2 1 5 1 2 2 3 .4I ta ly 1 6 2 5 2 5 .7 1 1 0 0 1 7 .4 2 2 0 3 .5 1 3 6 9 2 1 .6J a p a n 1 2 6 7 2 5 .2 9 2 7 1 8 .5 3 2 8 6 .5 1 3 3 8 2 6 .6
K o re a 1 4 0 7 1 8 .1 9 9 3 1 2 .8 4 5 8 5 .9 2 8 3 4 3 6 .4L u x e m b o u rg 1 3 6 3 1 9 .2 1 3 2 4 1 8 .7 2 5 5 3 .6 2 5 6 1 3 6 .1M e x ic o 7 6 2 7 .2 5 5 2 5 .2 1 0 8 1 .0 3 2 0 2 3 0 .1N e th e r la n d s 1 3 9 6 2 5 .4 1 2 0 0 2 1 .8 1 7 1 3 .1 9 3 8 1 7 .1N e w Z e a la n d 1 6 6 8 1 9 .5 1 8 8 5 2 2 .1 2 5 3 3 .0 2 4 8 0 2 9 .0N o rw a y 1 1 9 7 2 1 .3 1 2 2 2 2 1 .7 1 6 0 2 .8 1 3 2 5 2 3 .6P o la n d 2 2 3 2 1 7 .3 3 1 8 4 2 4 .7 4 8 2 3 .7 3 1 9 6 2 4 .8P o r tu g a l 1 5 5 8 1 7 .2 1 2 9 2 1 4 .2 4 7 4 5 .2 2 2 7 9 2 5 .1S p a in 1 7 1 3 2 3 .6 1 1 4 9 1 5 .8 2 2 1 3 .0 1 6 2 3 2 2 .3S w e d e n 1 0 1 8 2 0 .4 1 1 3 1 2 2 .7 1 7 1 3 .4 1 3 0 2 2 6 .2S w itz e r la n d 1 3 1 5 2 0 .8 9 5 5 1 5 .1 9 6 1 .5 2 0 0 8 3 1 .7
U n ite d K in g d o m 1 3 5 9 2 2 .6 1 5 3 7 2 5 .6 2 0 7 3 .4 1 1 5 7 1 9 .3U n ite d S ta te s 1 4 2 7 1 5 .7 1 7 6 2 1 9 .4 1 8 9 2 .1 2 5 8 2 2 8 .5
O E C D * 1 5 1 6 2 0 .7 1 4 6 5 1 9 .4 2 6 2 3 .4 2 0 1 2 2 6 .9
*Unweighted averages. The Belgian figures refer to 1992.Source: Calculated by World Health Organisation for OECD Health Data.
DEELSA/ELSA/WD(98)7
19
MORBIDITY AND QUALITY-OF-LIFE INDICATORS
38. As people live longer, the challenges facing health policy change. In recent years, the focus ofhealth policy goals has shifted to include preventing disability, improving physical and mentalfunctioning, and reducing the pain and distress caused by disease. Increasingly, health policy makersrequire reliable data on the nature, causes, and distribution of diseases in the population as well as onfactors impacting quality of life. Therefore, inclusion of morbidity and quality-of-life data in routine datacollection is essential to assess the burden created by different diseases and identify interventions that willnot only extend life, but also reduce the burden of disability before death.
39. Reliable national data on morbidity are still scarce across the OECD area. Current sources ofmorbidity data include the data collected via administrative and medical records, disease-specific registersand health interview surveys. Unfortunately, there are significant differences across OECD countries as tothe availability and quality of these sources. This section examines currently available indicators ofmorbidity in order to assess their potential use as indicators of population health status across OECD.
General morbidity measures
40. In order to develop more information about the status of general morbidity, many countries havefocused in recent years on using and enhancing their national health interview surveys. Data on self-reported health status and disability are a primary source of information describing general morbidity inthe population. Most OECD countries currently have a question in their national health surveys onperceived health status as well as prevalence of disability.
Perceived health status
41. A measure of perceived health status represents the general public’s subjective impression abouttheir state of health. A single question asking “How do you consider your health status in general or howis your state of health?” is routinely included in most national health surveys. Despite its subjectivenature, this measure appears to be a useful indicator of health status. It has been found to be associatedwith a number of other measures of health status and the use of health services, and to be an independentpredictor of future health problems as well as mortality in the population. (Van Sonsbeek, 1991; StatisticsNetherlands, 1992). It has also been used to calculate health expectancies, which are classified under theterm, ‘healthy life expectancy.’ ‘Healthy life expectancy’ is technically defined as the average expectationof life in good, very good, or excellent health based on a perceived health measure. (Robine, 1994).
42. The primary source of information on perceived health status is the countries’ national healthsurveys. However, international comparisons are difficult due to the different methods and instrumentsused -- such as the questions and response categories-- across OECD countries. The measures of perceivedhealth status in selected OECD countries in the 1994-1996 period presented below are from two sources:national health interview survey estimates as adjusted by the WHO European Region Health InterviewSurvey Project (EUROHIS), and Eurostat’s European Community Household Panel survey.
DEELSA/ELSA/WD(98)7
20
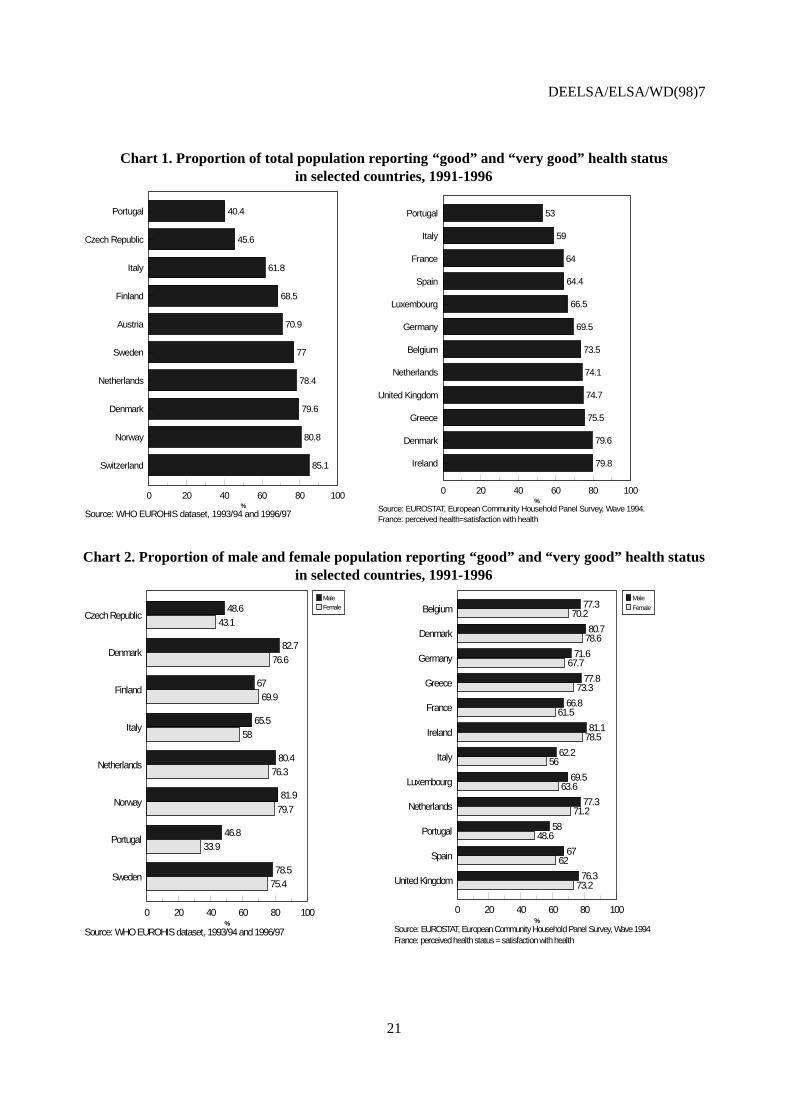
43. The WHO EUROHIS project has recommended a common instrument to measure perceivedhealth status.3 Awaiting dissemination and adoption of the recommendations across European region, theproject also is collaborating with each country in the European region to standardise existing results of thenational health surveys (WHO, 1996). The first results presented below are the national estimates adjustedby the WHO EUROHIS project. The second source is Eurostat and its European Community HouseholdPanel (ECHP) survey which has a common question on perceived health status. The ECHP survey hasbeen conducted since 1994 and there are plans to administer it every year until 1999. In 1994, the firstECHP surveyed 126,000 persons across the European region.
44. Based on the adjusted estimates from ten European countries in the EUROHIS harmoniseddataset (Chart 1), the proportion of total population aged 15 and over with “good” to “very good” healthstate ranged from a low of 40 per cent in Portugal to a high of 85 in Switzerland. According to theEurostat data, in the twelve EU countries shown in Chart 1b, the proportion of the total population aged 15and over who reported that their health state is “good” and “very good” ranged from a low of 53 per centin Portugal to a high of almost 80 per cent in Denmark and Ireland. For the four countries, having resultsfrom both sources, the results are fairly similar in Denmark, Italy, and Netherlands; while Portugal had aten-percentage point difference for both males and females reporting “good and very good” healthbetween the two sources. Cultural factors and perceptions of what good health means across countries aswell as variations in wording of the questionnaires and response categories might be the possible reasons,other than variations in health status, for the differences in results between countries and sources.
45. It is suggested that perceived health question discriminates well within culturally homogenouspopulations and therefore, it is useful in identifying differentials in health status according to educationlevel, family income, and other measures of socio-economic disadvantage (Mathers, 1994). However, itmay not highlight substantial health differences between populations which do not share commonstandards and perceptions of good health. For instance, Mathers (1996) has found that Australianindigenous people report better health than other Australians, although their average life expectancy isaround 20 years lower. This same phenomenon is reflected when comparing genders.
46. In most countries, independent from the data source, males tend to report “very good to good”health status more often than females, despite the fact that females live longer (Chart 2). The morbiditygap between sexes has been noted in the past. There have been some studies concluding that highermorbidity among females was due primarily to their social roles and related stress (Verbugge, 1989).Interestingly, after controlling for lifestyle factors, the gap between sexes narrowed considerably.Differences in morbidity may also be due to differences in the concept of “good” health between malesand females. For these reasons, some researchers have argued that the measure of perceived health statusshould not be used in construction of ‘healthy life expectancy”, particularly in routine reporting andmonitoring (see for e.g. Mathers, 1997a).
3 The recommended instrument by WHO for perceived health status is as follows: “How is your health in general?”
and response categories are : “very good, good, fair, bad, and very bad.” (WHO, 1996).
DEELSA/ELSA/WD(98)7
21
Chart 1. Proportion of total population reporting “good” and “very good” health statusin selected countries, 1991-1996
Source: EUROSTAT, European Community Household Panel Survey, Wave 1994.France: perceived health=satisfaction with health
Portugal
Italy
France
Spain
Luxembourg
Germany
Belgium
Netherlands
United Kingdom
Greece
Denmark
Ireland
0 20 40 60 80 100
53
59
64
64.4
66.5
69.5
73.5
74.1
74.7
75.5
79.6
79.8
%
Source: WHO EUROHIS dataset, 1993/94 and 1996/97
Portugal
Czech Republic
Italy
Finland
Austria
Sweden
Netherlands
Denmark
Norway
Switzerland
0 20 40 60 80 100
40.4
45.6
61.8
68.5
70.9
77
78.4
79.6
80.8
85.1
%
Chart 2. Proportion of male and female population reporting “good” and “very good” health statusin selected countries, 1991-1996
Source: WHO EUROHIS dataset, 1993/94 and 1996/97
Czech Republic
Denmark
Finland
Italy
Netherlands
Norway
Portugal
Sweden
0 20 40 60 80 100
48.6
82.7
67
65.5
80.4
81.9
46.8
78.5
43.1
76.6
69.9
58
76.3
79.7
33.9
75.4
%
MaleFemale
Source: EUROSTAT, European Community Household Panel Survey, Wave 1994France: perceived health status = satisfaction with health
Belgium
Denmark
Germany
Greece
France
Ireland
Italy
Luxembourg
Netherlands
Portugal
Spain
United Kingdom
0 20 40 60 80 100
77.3
80.7
71.6
77.8
66.8
81.1
62.2
69.5
77.3
58
67
76.3
70.2
78.6
67.7
73.3
61.5
78.5
56
63.6
71.2
48.6
62
73.2
%
Male
Female
DEELSA/ELSA/WD(98)7
22
47. It is not clear whether self-perceived health status has been improving or not over the years,from available data. For example, data from WHO EUROHIS project demonstrate no significantimprovement or decline in perceived health status over time. Among those countries with two years ofdata in the harmonised data set, there was a slight increase for total population’s perceived health status inCzech Republic (1993 to 1996), Finland (1987 to 1995), and Norway (1993 to 1995); while theNetherlands remained stable at 78.4 per cent from 1992 to 1995, and Denmark declined slightly from 80.8per cent in 1991 to 79.6 per cent in 1994. But these slight differences between years might be due to thedifferences in the surveys in terms of sample size, response rates, and wording.
Measures of disability
48. Policy makers have also realised the importance of monitoring disability in the face of ageingpopulations and the rise in chronic diseases. Levels of self-reported disability in the population providesome indication of needs for medical and welfare services and reflects the long-term and non-fatalconsequences of disease and impairment. Measures of the prevalence of disability are being collectedacross the OECD area; however, comparable national data are still scarce.
49. Lack of a universal concept and definition of disability is the principal obstacle to thedevelopment of comparable disability statistics. In general, disability is defined in terms of behaviouralconsequences of a health problem (McWhinnie, 1982). In an effort to provide a conceptual scheme toclassify the consequences of diseases and disablement, the WHO introduced the InternationalClassification of Impairments, Disabilities, and Handicaps (ICIDH) manual in 1980 (WHO, 1980). In theICIDH classification system, three principal concepts are used to describe the consequences of disease atthe level of its impact on the body and on the person as a social being:
• impairments which are losses or disturbances at the level of an organ;
• disability which are physical problems generating functional limitations such as, climbingstairs and more complex activity restrictions such as bathing and cooking;
• handicap are results from impairments or disability that limit the fulfilment of a role whichis normal for that individual.
50. Within this framework, disability can express the consequences of impairment in everyday lifein terms of changes in overall activities without registering the value attached to the results of thesechanges, while handicap represents the more social consequences which can arise as a result ofimpairment and disability. There is much debate concerning the ICIDH model as well as the conceptsused to explain and classify dimensions of ill-health and its consequences, and application of ICIDHconcepts in national health surveys vary significantly. Recently, the ICIDH model was re-examined by anetwork of research across the world and WHO has proposed a new classification system, ICIDH-2.ICIDH-2 modifies the terminology by substituting the term “activity” for “disability” and the term“participation” for “handicap”. At this time, WHO supports application of both versions; however, thismight create confusion in an area where standardisation of concepts and creating a common terminologyare crucial for any progress in data development.
51. Development of the disability data will also be limited, without a common set of relevantinstruments to accompany the conceptual scheme. Over the last two decades, several instruments focusedon measuring disability and handicap have been proposed by specific researchers and internationalorganisations, such as OECD and WHO. There are two major approaches to the measurement of
DEELSA/ELSA/WD(98)7
23
disability: 1) global questions that ask about activity limitations in general, and 2) instruments that askabout limitations in relation to specific activities of daily living (ADL), such as the OECD instrumentproposed in 1976 (Mathers, 1997).
52. The global disability measurement instruments aim to measure the magnitude of any illness,disability or infirmity in the population which cause trouble on people over a period of time. Generally,the respondent is asked whether he or she has any health problems, pain, illness, or disability that troubledhim/her over a period of time and whether they have limited his/her normal or usual activities; however,application of this question has been highly variable across countries. These instruments are highly subjectto changes in the perception of the individual.
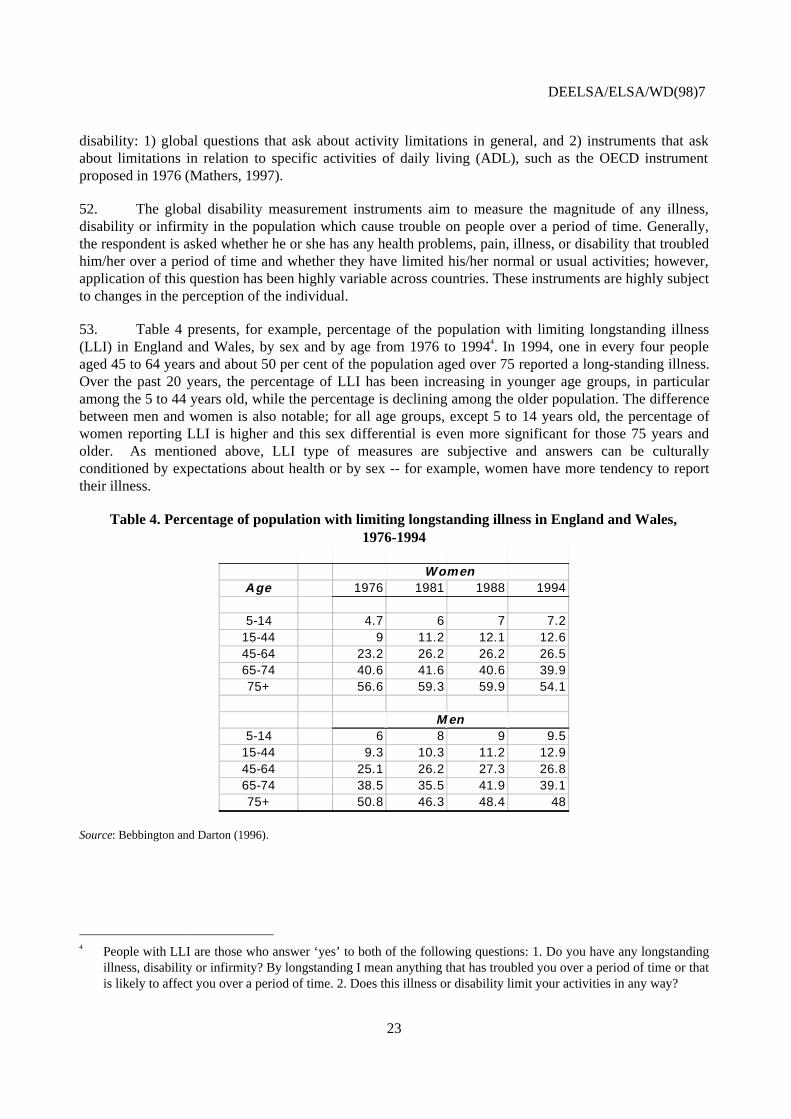
53. Table 4 presents, for example, percentage of the population with limiting longstanding illness(LLI) in England and Wales, by sex and by age from 1976 to 19944. In 1994, one in every four peopleaged 45 to 64 years and about 50 per cent of the population aged over 75 reported a long-standing illness.Over the past 20 years, the percentage of LLI has been increasing in younger age groups, in particularamong the 5 to 44 years old, while the percentage is declining among the older population. The differencebetween men and women is also notable; for all age groups, except 5 to 14 years old, the percentage ofwomen reporting LLI is higher and this sex differential is even more significant for those 75 years andolder. As mentioned above, LLI type of measures are subjective and answers can be culturallyconditioned by expectations about health or by sex -- for example, women have more tendency to reporttheir illness.
Table 4. Percentage of population with limiting longstanding illness in England and Wales,1976-1994
4 People with LLI are those who answer ‘yes’ to both of the following questions: 1. Do you have any longstanding
illness, disability or infirmity? By longstanding I mean anything that has troubled you over a period of time or thatis likely to affect you over a period of time. 2. Does this illness or disability limit your activities in any way?
DEELSA/ELSA/WD(98)7
24
54. On the other hand, the instruments that measure functional limitations based on an individual’sabilities to perform detailed activities of daily living (ADL) might provide, many argue, a more objectiveway of assessing disability. Most ADLs have identified a set of functioning areas such as bathing,dressing, toileting, transfer, continence, and feeding which are used to assess the ability to perform theseactivities independently or with assistance.
55. Application of the specific-ADL instruments have also been variable across the national surveysin terms of concept, wording, and administration. There are more than 50 types of ADL scales used todaywith different sets of activities covered in the instruments (McDowell, 1996). In 1976, the OECDdeveloped a standardised instrument to measure disability in relation to specific functions or activities ofdaily living (ADL) for the general population to be comparable over time and across countries.Participating countries in this effort included Canada, Finland, France, West Germany, the Netherlands,Switzerland, the United Kingdom, and the United States. In the OECD questionnaire, disability ismeasured based on ten questions related to the activities essential to daily living with six optionalquestions, defined as: self-care (dressing, bathing, eating), mobility (indoor and outdoor) andcommunication (hearing, vision, speaking).
56. In the late 1980s, the WHO and the Netherlands Central Bureau of Statistics (CBS) developed acommon instrument for health interview surveys based on the OECD questionnaire. They have created anew scale of performance by selecting items from OECD questionnaire, and including a handicap item(confinement to bed, chair with help to get up/walk, and confined to house, flat, and garden). Theseinstruments are presented in detail in Addendum 1.
57. The advantage of the ADL-type, function-based measures which relates an individual’s abilitiesto expected standards is that they reflect those aspects of health that can be compared more objectivelyamong individuals. Initial use of these instruments were more oriented to the elderly and theinstitutionalised population by distinguishing severe levels of disability. Today there is a general demandto use these ADL-based instruments to assess disability in general population. However, the ADL scalesin use, including OECD and WHO-CBS questionnaires, are not really sensitive to variations in thefunctioning of the younger populations. To ensure efficiency and comparability of these instruments indisability measurement, it is important to adopt a common set of ADLs which can describe the functionalcapacity of not only the elderly, but the entire population.
58. Table 5 compares the prevalence of disability in three OECD countries: the United States,France and Canada, by age group and sex. As mentioned above, the concepts are not the same across thesecountries. In the United States, disability data are based on the concepts of limitations in performingsocially defined roles and usual activities due to a health condition with a global disability measurementinstrument5, while Canada follows more closely the ADL approach where specific questions are asked onwhether or not people were limited in certain activities, such as walking, reading, cutting food, on a long
5 Two questions addressing limitation of activity because of health status elicits information on whether
respondents are unable to perform a major activity; are limited in the amount or kind of major activity but stillable to perform it to some extent ; or are limited only in secondary or nonmajor activities. Disability must havelasted three months or be due to a set of specified chronic conditions. Crimmins et al. (1997).
DEELSA/ELSA/WD(98)7
25
Table 5. Trends in disability by sex and age in the United States, France, and Canada(percentage of the population of that sex and age group)
United Statesa
Females MalesAge group 1970 1980 1990 1970 1980 1990
a) Corresponds to both major and secondary activity limitation. Major activities include able to go to work, go to school, keephouse. Secondary activities are activities such as going to church and recreational activities. Data does not includeinstitutionalised population. Crimmins et al. (1997).
b) Defined as severe incapacity and other incapacity. Institutionalised population is not included. INSEE, 1980/81 and 1991/92.c) Using a general scale of Activities of Daily Living, severe (score >11) and moderate (score (5-10) disability, where no
disability score null. Institutionalised population is included. Wilkins et al. (1994).
Source: Crimmins et al. (1997) based on NHIS 1969-1971 and 1979-1980; INSEE, Enquête sur la Santé et les Soins Médicaux,1980/81 and 1991/92; Wilkins et al. (1994) based on Health and Activity Limitation Survey (HALS), 1986 and 1991.
DEELSA/ELSA/WD(98)7
26
term basis.6 In France, on the other hand, disability questions are more oriented to measure severe andpermanent disability and to the elderly. In the French questionnaire, a very limited ADL scale is integratedusing confinement to home as a major criteria7.
59. Bearing in mind these differences, it is interesting to see that the prevalence of disability --including all levels of severity -- has been increasing, over the twenty-year period, in all three countriesfor the younger age groups, in particular those under 40 years old, while it appears to have declined for thepopulation over 70 years old. Both in the United States and in France, population over 55 yearsexperienced a decrease in the level of disability, but the decline is more visible in France. In Canada, onthe other hand, there is an increase in the reported rate of disability, between 1986 and 1991, for men over75 years old. Canadian women, aged 65 and over, experience the same downward trends as in othercountries, while only males in their 60s experienced declines in disability. It should be noted thatimprovement in survey methodologies and increased awareness of disability in society in recent yearsmight be important factors for explaining these trends over time.8 For example, it appears that most of thevariation in self-reported disability associated with changing perceptions and standards occurs at the mildend of the spectrum, while prevalence of severe disability is much more stable. (Mathers, 1991, Robine etal. 1996).
60. Measured prevalence of disability is currently not comparable across countries due todifferences in definitions, measurement techniques, and administration. In terms of administration of thesurveys, it is preferable to distinguish the disability in the institutionalised population from the rest of thepopulation. The ADL-type scale can establish more specific and objective criteria to define a range ofseverity levels for disability which are less likely to be impacted by changes in perceptions as compared tothe global measures of perceived health status and disability. At the moment, as discussed above, theADL scales and severity levels applied across countries vary significantly. To improve comparability ofself-reported disability, it would be desirable to develop an ADL-based instrument with a common set ofitems and severity categories. Also, such an instrument should be designed to be more sensitive tochanges in disability for the general population, and not just the elderly.
Multi-dimensional health status measures
61. In an effort to collect information on the general health and well-being of the population, and notonly on disability and deaths, there has been a movement over the past twenty-five years to emphasise amore multi-dimensional perspective to the concept of health. Several survey instruments have beendeveloped which capture a multi-dimensional health status profile within a broader perspective on well-being. Much of this work has been influenced by the WHO’s definition of health as: “a state of completephysical, mental, and social well-being and not merely the absence of disease or infirmity” (WHO, 1958).SF-36 Health Survey (SF-36), EuroQol (EQ-5D), Health Utilities Index (HUI3) are the most well-knownexamples of such multi-dimensional health status instruments being used at the population level.
6 Measure long-term disability lasting at least six months. Based 13 questionnaire focusing on impact of disease
and injury on daily living and social activities, Chen et al. (1993).7 A general question is asked if there is anybody handicapped, or having simply some discomfort or difficulties in
daily life. If the answer is yes to this question, a set of question is asked to find the type, cause and severity of thishandicap, trouble, etc. Confinement is used to determine the severity of disability.
8 For further discussion on disability, also refer to section on health expectancies.
DEELSA/ELSA/WD(98)7
27
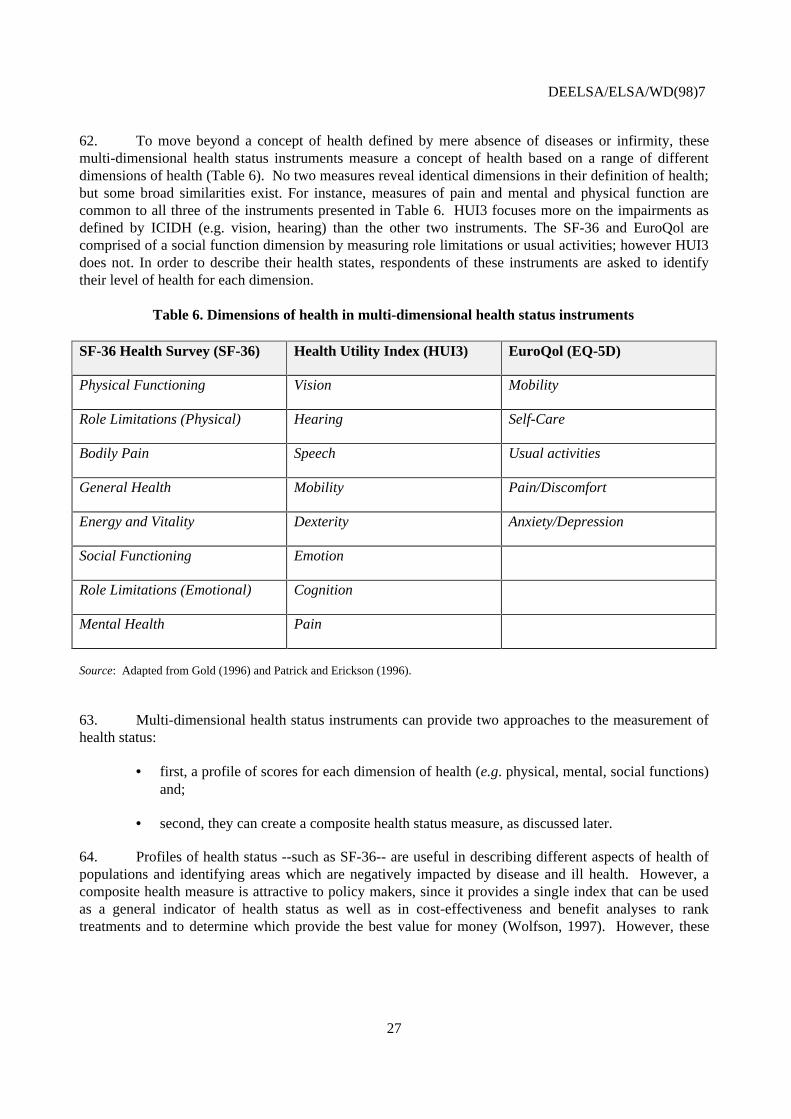
62. To move beyond a concept of health defined by mere absence of diseases or infirmity, thesemulti-dimensional health status instruments measure a concept of health based on a range of differentdimensions of health (Table 6). No two measures reveal identical dimensions in their definition of health;but some broad similarities exist. For instance, measures of pain and mental and physical function arecommon to all three of the instruments presented in Table 6. HUI3 focuses more on the impairments asdefined by ICIDH (e.g. vision, hearing) than the other two instruments. The SF-36 and EuroQol arecomprised of a social function dimension by measuring role limitations or usual activities; however HUI3does not. In order to describe their health states, respondents of these instruments are asked to identifytheir level of health for each dimension.
Table 6. Dimensions of health in multi-dimensional health status instruments
SF-36 Health Survey (SF-36) Health Utility Index (HUI3) EuroQol (EQ-5D)
Physical Functioning Vision Mobility
Role Limitations (Physical) Hearing Self-Care
Bodily Pain Speech Usual activities
General Health Mobility Pain/Discomfort
Energy and Vitality Dexterity Anxiety/Depression
Social Functioning Emotion
Role Limitations (Emotional) Cognition
Mental Health Pain
Source: Adapted from Gold (1996) and Patrick and Erickson (1996).
63. Multi-dimensional health status instruments can provide two approaches to the measurement ofhealth status:
• first, a profile of scores for each dimension of health (e.g. physical, mental, social functions)and;
• second, they can create a composite health status measure, as discussed later.
64. Profiles of health status --such as SF-36-- are useful in describing different aspects of health ofpopulations and identifying areas which are negatively impacted by disease and ill health. However, acomposite health measure is attractive to policy makers, since it provides a single index that can be usedas a general indicator of health status as well as in cost-effectiveness and benefit analyses to ranktreatments and to determine which provide the best value for money (Wolfson, 1997). However, these
DEELSA/ELSA/WD(98)7
28
indices are based on a crucial component: the measurement of the preferences of health states.9 Basically,respondents are asked to value a set of health states using different elicitation techniques; however, debatepersists as to which elicitation methods are the best to derive these values, taking into considerationmethodological, ethical, and political challenges (Nord, 1997).
65. These multi-dimensional health status instruments have been widely used in clinical studies andcost-effectiveness analyses in order to assess the relative impact of an intervention or treatment on thedifferent dimensions of health. More recently, these instruments are being applied for monitoringpopulation health status at the national level. Countries have begun to integrate the different multi-dimensional health status instruments in their national health surveys in order to better assess the healthstatus of their populations, in particular New Zealand (SF-36), Australia (SF-36), England (EuroQol andSF-36), Germany (EuroQol), Spain (EuroQol), the United States’ Health of Senior Survey (SF-36), andCanada (Health Utility Index and EuroQol) where they have used the Health Utility Index to calculate ahealth-adjusted life expectancy to monitor health status of its population.
SF-36 Health Survey
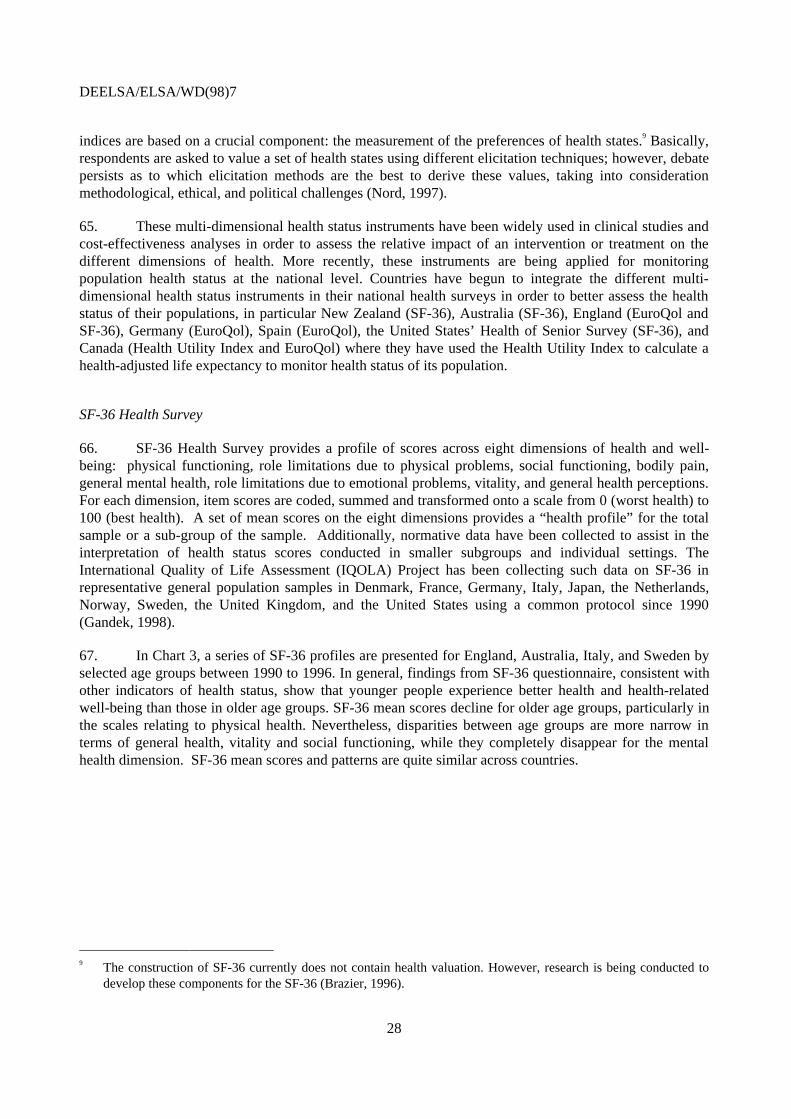
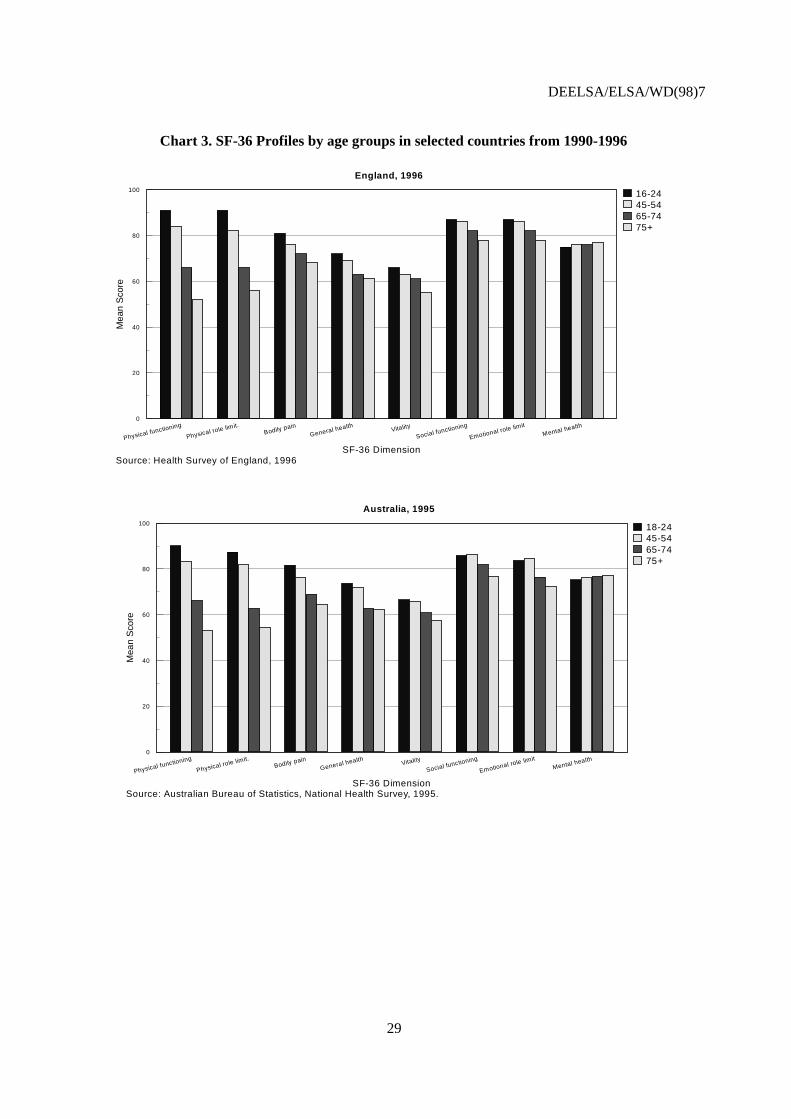
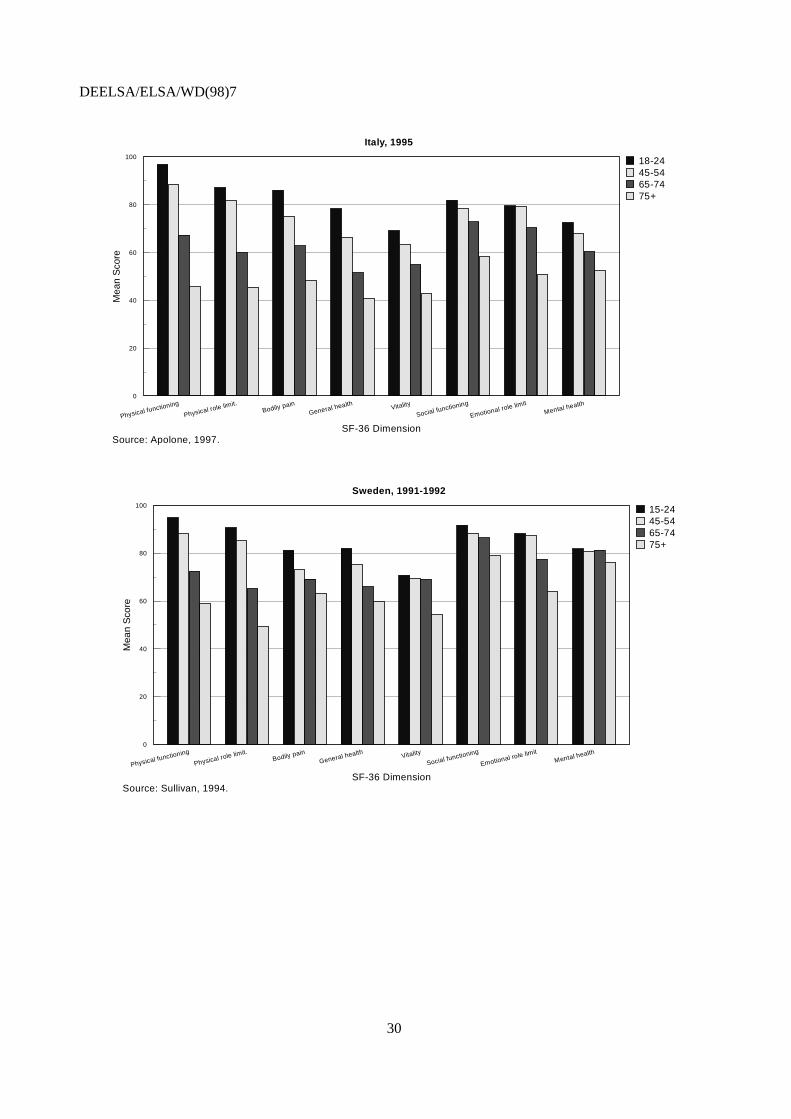
66. SF-36 Health Survey provides a profile of scores across eight dimensions of health and well-being: physical functioning, role limitations due to physical problems, social functioning, bodily pain,general mental health, role limitations due to emotional problems, vitality, and general health perceptions.For each dimension, item scores are coded, summed and transformed onto a scale from 0 (worst health) to100 (best health). A set of mean scores on the eight dimensions provides a “health profile” for the totalsample or a sub-group of the sample. Additionally, normative data have been collected to assist in theinterpretation of health status scores conducted in smaller subgroups and individual settings. TheInternational Quality of Life Assessment (IQOLA) Project has been collecting such data on SF-36 inrepresentative general population samples in Denmark, France, Germany, Italy, Japan, the Netherlands,Norway, Sweden, the United Kingdom, and the United States using a common protocol since 1990(Gandek, 1998).
67. In Chart 3, a series of SF-36 profiles are presented for England, Australia, Italy, and Sweden byselected age groups between 1990 to 1996. In general, findings from SF-36 questionnaire, consistent withother indicators of health status, show that younger people experience better health and health-relatedwell-being than those in older age groups. SF-36 mean scores decline for older age groups, particularly inthe scales relating to physical health. Nevertheless, disparities between age groups are more narrow interms of general health, vitality and social functioning, while they completely disappear for the mentalhealth dimension. SF-36 mean scores and patterns are quite similar across countries.
9 The construction of SF-36 currently does not contain health valuation. However, research is being conducted to
develop these components for the SF-36 (Brazier, 1996).
DEELSA/ELSA/WD(98)7
29
Chart 3. SF-36 Profiles by age groups in selected countries from 1990-1996
England, 1996
Source: Health Survey of England, 1996
Physical functioning
Physical role limit.Bodily pain
General health Vitality
Social functioning
Emotional role limit
Mental health0
20
40
60
80
100
SF-36 Dimension
Mea
n S
core
16-2445-5465-7475+
Australia, 1995
Source: Australian Bureau of Statistics, National Health Survey, 1995.
Physical functioning
Physical role limit.Bodily pain
General health Vitality
Social functioning
Emotional role limit
Mental health0
20
40
60
80
100
SF-36 Dimension
Mea
n S
core
18-2445-5465-7475+
DEELSA/ELSA/WD(98)7
30
Italy, 1995
Source: Apolone, 1997.
Physical functioning
Physical role limit.Bodily pain
General health Vitality
Social functioning
Emotional role limitMental health
0
20
40
60
80
100
SF-36 Dimension
Mea
n S
core
18-2445-5465-7475+
Sweden, 1991-1992
Source: Sullivan, 1994.
Physical functioning
Physical role limit.Bodily pain
General health Vitality
Social functioning
Emotional role limitMental health
0
20
40
60
80
100
SF-36 Dimension
Mea
n S
core
15-2445-5465-7475+
DEELSA/ELSA/WD(98)7
31
Health Utility Index
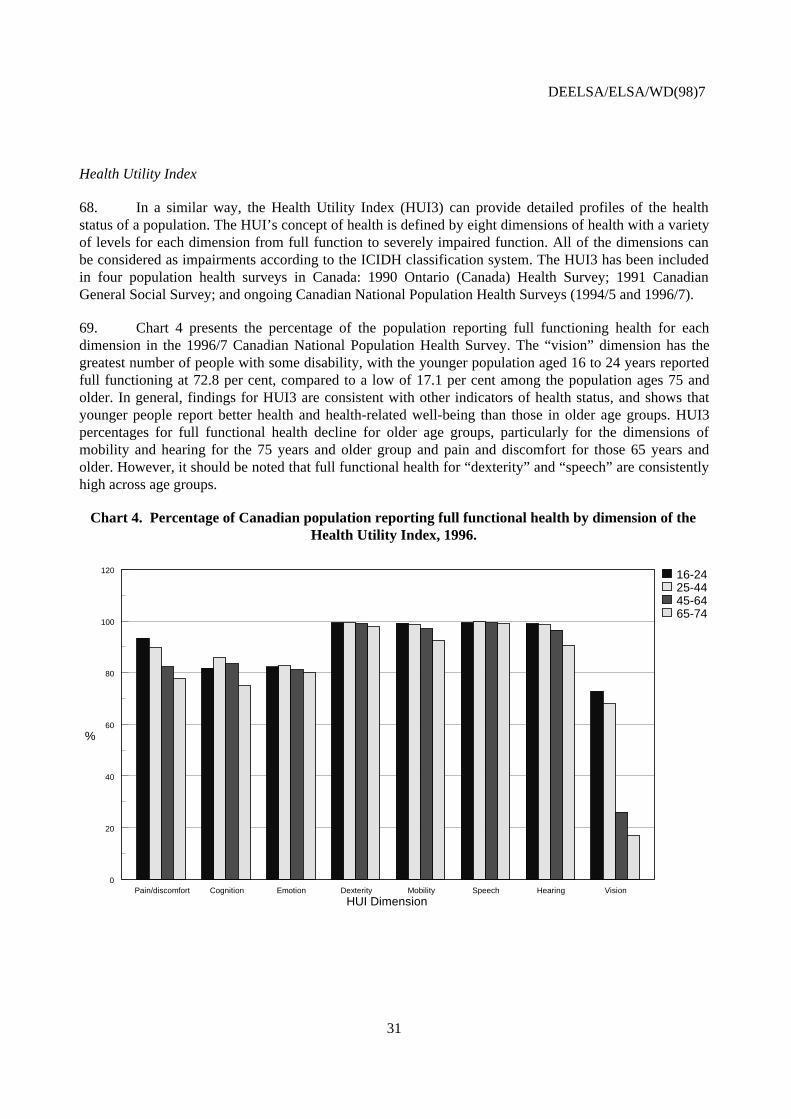
68. In a similar way, the Health Utility Index (HUI3) can provide detailed profiles of the healthstatus of a population. The HUI’s concept of health is defined by eight dimensions of health with a varietyof levels for each dimension from full function to severely impaired function. All of the dimensions canbe considered as impairments according to the ICIDH classification system. The HUI3 has been includedin four population health surveys in Canada: 1990 Ontario (Canada) Health Survey; 1991 CanadianGeneral Social Survey; and ongoing Canadian National Population Health Surveys (1994/5 and 1996/7).
69. Chart 4 presents the percentage of the population reporting full functioning health for eachdimension in the 1996/7 Canadian National Population Health Survey. The “vision” dimension has thegreatest number of people with some disability, with the younger population aged 16 to 24 years reportedfull functioning at 72.8 per cent, compared to a low of 17.1 per cent among the population ages 75 andolder. In general, findings for HUI3 are consistent with other indicators of health status, and shows thatyounger people report better health and health-related well-being than those in older age groups. HUI3percentages for full functional health decline for older age groups, particularly for the dimensions ofmobility and hearing for the 75 years and older group and pain and discomfort for those 65 years andolder. However, it should be noted that full functional health for “dexterity” and “speech” are consistentlyhigh across age groups.
Chart 4. Percentage of Canadian population reporting full functional health by dimension of theHealth Utility Index, 1996.
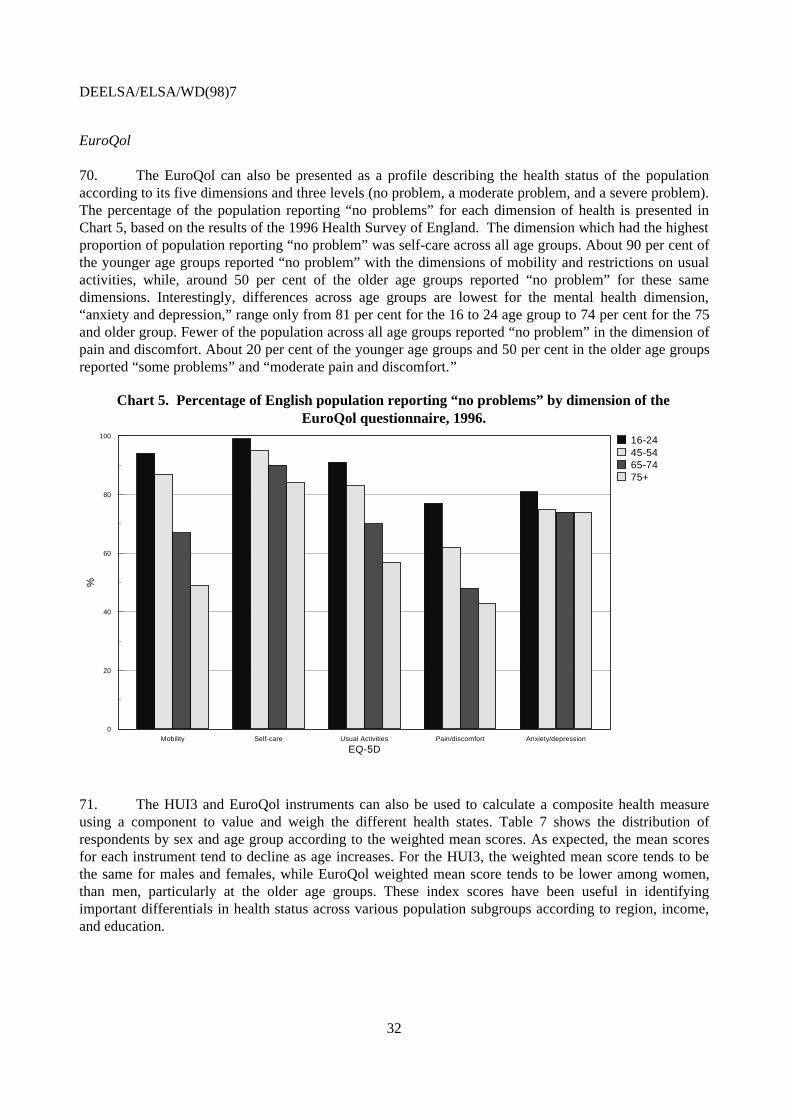
70. The EuroQol can also be presented as a profile describing the health status of the populationaccording to its five dimensions and three levels (no problem, a moderate problem, and a severe problem).The percentage of the population reporting “no problems” for each dimension of health is presented inChart 5, based on the results of the 1996 Health Survey of England. The dimension which had the highestproportion of population reporting “no problem” was self-care across all age groups. About 90 per cent ofthe younger age groups reported “no problem” with the dimensions of mobility and restrictions on usualactivities, while, around 50 per cent of the older age groups reported “no problem” for these samedimensions. Interestingly, differences across age groups are lowest for the mental health dimension,“anxiety and depression,” range only from 81 per cent for the 16 to 24 age group to 74 per cent for the 75and older group. Fewer of the population across all age groups reported “no problem” in the dimension ofpain and discomfort. About 20 per cent of the younger age groups and 50 per cent in the older age groupsreported “some problems” and “moderate pain and discomfort.”
Chart 5. Percentage of English population reporting “no problems” by dimension of theEuroQol questionnaire, 1996.
71. The HUI3 and EuroQol instruments can also be used to calculate a composite health measureusing a component to value and weigh the different health states. Table 7 shows the distribution ofrespondents by sex and age group according to the weighted mean scores. As expected, the mean scoresfor each instrument tend to decline as age increases. For the HUI3, the weighted mean score tends to bethe same for males and females, while EuroQol weighted mean score tends to be lower among women,than men, particularly at the older age groups. These index scores have been useful in identifyingimportant differentials in health status across various population subgroups according to region, income,and education.
DEELSA/ELSA/WD(98)7
33
Table 7. Weighted mean scores for HUI3 in Canada (1996) and EuroQol in England (1996)for sex and age groups
16-24 25-44 45-64 65-74 75+Health Utility Index Men .96 .94 .91 .87 .80 Women .94 .94 .89 .87 .80
16-24 25-34 45-64 65-74 75+EuroQol Men .91 .92 .85 .80 .76 Women .90 .90 .84 .76 .71
72. There is a lack of consensus about how to conceptualise of health and valuation of health statesin these existing multi-dimensional health status instruments. Each instrument captures slightly differentconcepts of health with various combinations of the dimensions of health and well-being. Much debateoccurs among researchers as to whether some of these definitions including aspects of “quality of life”which are too broad and impractical for operationalisation and on whether these measures rely too heavilyon subjective value judgements. At present, applying these composite measures for cross-nationalevaluations of levels of health status would be difficult, mainly due to their subjective valuations of healthand the preferences of health states. However, examination of the health profiles by dimension may bemeaningful to describe the different aspects of health of a population and to better identify areas which arenegatively impacted by disease and ill health.
Disease-specific morbidity measures
73. While assessing rates of disability in the general population is important, reliable disease-specific data is necessary to better understand the factors behind disability and poor health. Disease-specific morbidity measures would assist policy makers and health managers to identify and monitor themajor health problems contributing to disability and for planning health care services. In terms of healthpolicy development, it is important to understand what are the key diseases imposing the heaviest burdenon society, not only in terms of mortality, but now in terms of disability and quality of life.
Prevalence and incidence of diseases
74. In general, there are two basic types of disease statistics: incidence and prevalence measuresoften based on either registers, surveys, or general practitioner records (Mason, 1997). Incidence is thenumber of new cases arising for a given disease in a specified period and population, while prevalenceindicates the total number of existing cases in a given population at a specified point in time. Prevalencedepends on the incidence and on the duration of the disease. For some diseases, either prevalence orincidence statistics might be the most useful. For instance, prevalence statistics may be more meaningfulfor diseases or disorders which are neither curable nor likely to be fatal such as diabetes, mental health,respiratory or musculoskeletal problems; while incidence statistics may be the priority for diseases withhigh fatality rates such as cancer and AIDS. However, both measures might be needed to understand indepth the evolution and trend of a disease.
DEELSA/ELSA/WD(98)7
34
75. With data on incidence and prevalence for various diseases, policy makers can better understandthe distribution of new cases and the burden of disease among different population groups. Severalcountries are using these measures to monitor progress toward identified targets, to evaluate programmes,such as preventive screening, and to estimate the need for and use of health and social services. Forexample, in the United States where cardiovascular disease mortality has been falling by 3 per centannually for the past 25 years, severe cardiovascular incidence has fallen by only 1 per cent annually(Cutler, 1997). Thus, the prevalence of cardiovascular diseases is increasing, highlighting a larger numberof survivors who will likely increase demand on health care services. Incidence data on specific diseasesare also a key component for developing estimates of disability in the calculation of the disability-adjustedlife years (DALYs).
76. Surprisingly, there are few comparable data on the incidence and prevalence of differentdiseases across OECD countries. Differences in the way each country gathers morbidity information is amajor cause of the variation in data, making international comparisons very difficult. The most commonsources of disease-specific morbidity data are health interview surveys, administrative and medicalrecords, and disease-specific registers such as those for cancer and congenital anomalies. Severalcountries are collecting prevalence data on chronic conditions such as cardiovascular disorders, diabetes,asthma, and hypertension through their national health surveys. Other countries calculate prevalenceestimates based on general practitioner records (see for e.g. Mason, 1997). However, as with other itemsin the national health surveys, these survey questions on the prevalence of specific diseases are highlyvariable across OECD countries.
77. Most countries rely on the administrative data from hospitals or other administrative sourcessuch as hospital admissions or discharge records to estimate disease-specific morbidity. This type of datahave the advantage of being relatively objective, since they are based on medical diagnosis, and coherentover time. However, indicators based on administrative data are subject to some assumptions concerningthe available health care processes across countries. For example, discharge rates capture only hospitalisedcases which might cause some under-estimation for those diseases where hospitalisation is likely not tooccur. Also, differences in the organisation of medical systems and cultural factors might lead tovariations in hospitalisation rates among countries who have similar disease patterns. Therefore, althoughbeneficial, this type of registered data need to be considered along with other sources of morbidity data inorder to provide a more reliable picture of health status.
78. Disease-specific registers have been developed in OECD countries, for a limited number ofdiseases associated with high rates of premature mortality, such as cancer (Mason, 1997). Currently,because of the creation of national registries and international programmes, the best internationallyavailable disease-specific morbidity data is on cancer. The International Agency for Research on Cancer(IARC), established in 1965 by the World Health Organisation, co-ordinates work among various nationaldata registries and conducts research on the size, nature, and causes of human cancer. These cancerregistries are an important resource for assessing the burden of specific cancer problems in populations,and are used to examine the effects of changes in exposure to possible carcinogens, as well as the effectsof screening and treatment programs.
79. Charts 6a and 6b present the numbers of new cancer cases in 1990 by leading cancer sites formales and females, respectively. Care should be taken in the interpretation of these tables, since datainclude estimated numbers for certain countries.10 In general, cancer occurs more commonly in males thanfemales. The OECD average age-standardised incidence rate in 1990 for all cancers (excluding skin
10 See sources & methods in OECD Health Data and the IARC website for more information on this data.
DEELSA/ELSA/WD(98)7
35
cancer) was 267 new cases per 100,000 for males and 208 per 100,000 females, resulting in a ratio of 1.3males cases for every female cancer case.
80. Cancer incidence varies widely between OECD countries. The United States reports the highestincidence rates for all cancers among males (407 per 100,000) and females (290 per 100,000). The lowestlevels of cancer incidence are reported in countries like Greece, Mexico, Portugal and Turkey. Thisvariation might be explained by a number of factors, such as differences in lifestyles and otherenvironmental factors, differences in the diagnostic techniques as well as the methodology used to collectcancer data via the registries rather than actual variations in cancer risk.
DEELSA/ELSA/WD(98)7
36
Chart 6a. Numbers of new cancer cases in OECD countries, 1990(Age-standardised rate per 100 000 population)
Male
Australia
Austria
Belgium
Canada
Czech R
Denmark
Finland
France
Germany
Greece
Hungary
Iceland
Ireland
Italy
Japan
Korea
Luxembourg
Mexico
Netherlands
New Zealand
Norway
Poland
Portugal
Spain
Sweden
Switzerland
Turkey
UK
USA
0 50 100 150 200 250 300 350 400 450
308
291
289
322
305
274
251
302
274
195
269
269
248
272
251
212
291
143
288
293
256
233
208
248
241
310
208
257
407
Lung
Prostate
Colon/Rectum
Other
Notes: The standard world population is used for age-standardisation. Data refer to 1985 for Hungary, Korea, Poland and Turkey.Sources: International Agency for Research on Cancer, Australian Institute of Health and Welfare.
DEELSA/ELSA/WD(98)7
37
Chart 6b. Numbers of new cancer cases in OECD countries, 1990(Age-standardised rate per 100000 population)
Female
Australia
Austria
Belgium
Canada
Czech R
Denmark
Finland
France
Germany
Greece
Hungary
Iceland
Ireland
Italy
Japan
Korea
Luxembourg
Mexico
Netherlands
New Zealand
Norway
Poland
Portugal
Spain
Sweden
Switzerland
Turkey
UK
USA
0 50 100 150 200 250 300 350
237
222
211
253
212
262
204
172
209
139
198
245
226
187
155
149
217
172
225
278
217
172
164
157
230
218
184
225
290
Lung
Breast
Colon/Rectum
Other
Notes: The standard world population is used for age-standardisation. Data refer to 1985 for Hungary, Korea, Poland and Turkey.Sources: International Agency for Research on Cancer, Australian Institute of Health and Welfare.
DEELSA/ELSA/WD(98)7
38
81. In females, breast cancer is the most commonly registered cancer in all countries, followed bycolorectal and lung cancer. These three categories account, on average for almost 50 per cent of all newcancer cases in females in the OECD area. For males, on the other hand, lung cancer is the mostcommonly diagnosed cancer followed by prostate or colon, depending on the country. On average, lungcancer accounts for about 20 per cent of all cancers in males compared with only 6 per cent amongfemales. This large difference is attributable to the higher rates of smoking among men in the past 30years as compared with a more recent increase in smoking rates in women (IARC, 1993).
82. Chart 7 presents the incidence rates for the most common cancer types in seven countries wheredata are available for the 1970-1995 period. The trends in incidence data vary significantly by cancer typeand by country. When all cancer types are combined (excluding skin cancer), incidence for malesincreased by 15 per cent in Denmark and Sweden, about 30 per cent in Norway and Sweden and morethan 35 per cent in Canada and the Czech Republic between 1970 and 1990. For females, a differentpicture emerges. In Canada, Norway, and Sweden, the annual increase in cancer incidence among femalesis almost the same as the rate observed for males. In the Czech Republic and New Zealand, the annualincrease for females was even higher, with a total increase of 45 per cent.
83. While in the past 10 years, lung cancer has shown decreasing incidence rates for males, there hasbeen a net increase for females in all countries. On the other hand, for males, the increase in prostatecancer has been quite significant since 1985, and national projections in most countries indicate upwardtrends for the near future. Improvements in detection of this cancer and a greater life expectancy for menmight lead to a large number of new cases being diagnosed which may not have been detected previously(Australian Institute of Health and Welfare, 1996). Similarly, for females, breast cancer has shown anincreasing incidence rate through the 1980s, and in the few countries where data are available for the1990s, the rates have not begun to stabilise. Increased diagnosis and therefore, increased numbers of newcases, are likely to occur with the growing awareness of preventive measures and broader use ofmammography screening, particularly among females aged 50 to 69 years.
84. Recently, there has been much activity in OECD countries to improve the disease-specificmorbidity statistics. The World Health Organisation’s Health for All project has identified targets ondisease-specific morbidity, as well as other countries in their own programmes. There are also plans todevelop specific morbidity indicators under the European Union’s proposed Action programme on ‘HealthMonitoring in the Field of Public Health’ (DG V and Eurostat, 1993; 1996). Methodological issues arecurrently being examined in the task force on ‘health and health-related survey data’ under the WorkingGroup on Public Health Statistics. Based on preliminary research by the Eurostat Working Group onPublic Health Statistics, there is a need to identify the key diseases and disorders to focus, the concepts tobe measured, and then to develop standard definitions (Mason, 1997). It would be preferable for OECD tocollaborate with these existing international projects to move towards more comparable morbiditystatistics across OECD countries.
DEELSA/ELSA/WD(98)7
39
Chart 7. Trends in cancer incidence rates in selected OECD countries, 1970-1995
All sites - Male
1970 1975 1980 1985 1990 1995150
200
250
300
350
400
450
500
All sites - Female
1970 1975 1980 1985 1990 1995150
200
250
300
350
400
450
500
Lung Cancer - Male
1970 1975 1980 1985 1990 19950
20
40
60
80
100
120
Lung Cancer - Female
1970 1975 1980 1985 1990 19950
10
20
30
40
Prostate Cancer
1970 1975 1980 1985 1990 1995
20
40
60
80
100
Breast Cancer
1970 1975 1980 1985 1990 1995
20
40
60
80
100
Czech R.
Canada Australia
N.ZealandDenmark
Norway
Sweden
Czech R.
N. ZealandDenmark Canada
AustraliaNorway Sweden
CanadaDenmark
Czech R.N.Zealand
AustraliaSweden
Norway
Canada
Czech R.
Denmark
Australia
N.Zealand
Norway
Sweden
Sweden
Canada
Australia
Czech R.Denmark
Sweden
Czech R.Canada
N.Zealand
Norway
Australia
Sweden
Denmark
Sources: IARC, OECD Health Data 1998.
DEELSA/ELSA/WD(98)7
40
COMPOSITE HEALTH MEASURES
85. There is an increasing interest in developing composite health measures, which integrate thebasic information on mortality with information on morbidity or quality of life, to monitor populationhealth status. A number of composite health measures, reflecting the average expectation of years ofequivalent good health in a population, are currently being calculated in the OECD, such as healthexpectancies in various forms and the disability-adjusted life years (DALYs). Each are based on differentmorbidity data (Table 8).
Table 8. Examples of morbidity measures used in the calculation of composite health measures
Composite Health Measure Morbidity Measure used in its calculation(combined with mortality)
Health expectancies
− Healthy life expectancy (HLE)
− Disability-free life expectancy (DFLE)
− Health-adjusted life expectancy (HALE)
Perceived health status
Prevalence of disability
Multi-dimensional health status measure (e.g.Health Utility Index, EuroQol) + weightsreflecting preferences for different health states.
Disability-adjusted life years (DALYs) Disease incidence and prevalence rates;
Estimated duration, remission, and severityweights for each disease category
Health expectancies
86. Health expectancy is the generic term referring to all indicators expressed in terms of theaverage time (in years) that a person could expect to live in a defined state of health (Mathers, 1996).Sullivan (1971) proposed a simple health indicator which combines mortality data, in the form of the lifetable, with the prevalence of disability. As interest emerges as to whether people are living not onlylonger, but also healthier lives, these types of calculations based on Sullivan’s method have been repeatedin many countries. Some countries have used disability data similar to those used by Sullivan, while othersconsidered different concepts of health such as impairment, handicap, perceived health status, multi-dimensional concept of health, and specific diseases.
DEELSA/ELSA/WD(98)7
41
87. In 1989, an informal international network on health expectancy, REVES (Réseau Espérance deVie en Santé) was formed in order to promote harmonisation of disability data, concepts and calculationprocedures across countries and over time. In order to encourage more standardisation and uniformity inthe calculations of health expectancies, the REVES network has proposed a conceptual framework formeasuring the impact and consequences of diseases on health using the International Classification ofDiseases (ICD) and the International Classification of Impairment, Disability and Handicap (ICIDH).
88. The definition system and terminology proposed by REVES is slowly being implemented;however, as discussed above, there are considerable variations in the disability concepts measured in eachcountry. Addressing the issues related to the measurement of disability as outlined above is a fundamentalrequirement for establishing the reliability of health expectancies as composite measures of health status.
89. The estimates of health expectancies presented in Tables 9 and 10 below are not exempt fromthe measurement problems. Therefore, more emphasis should be placed on changes over time for eachcountry11 than on comparisons of absolute levels across countries. In order to facilitate the interpretationof the results, most of the DFLE estimates comprise all levels of disability; while the HFLE estimates tendto comprise the more severe levels of disability.
90. Tables 9 and 10 give an overview of disability and handicap-free life expectancies at birth and65, presented similarly to the REVES classification. The differences in survey questions andmeasurement systems are mentioned in the country notes. Although total life expectancy is increasingsignificantly in all countries, disability-free life expectancy at birth slightly declines in Australia andCanada for both sexes and in Netherlands for females only. Other countries demonstrate increases indisability-free life expectancy at birth. In the United Kingdom and United States, the increase indisability-free years (in the past 10 years) is relatively small, while in France and Germany, the number ofdisability-free years is increasing faster than the growth in life expectancy.
91. Possible reasons for variations in reported disability prevalence and difficulties in differentiatingchange over time in countries have been discussed by several authors (Mathers, 1996; Crimmins, 1989;Wilkins, 1994). Changing attitudes and community perception of disability and handicap may result inpeople being more aware of their need for assistance and more willing to report disabling conditions.They may also have an effect on how people interpret the ‘need’ and ‘difficulty’ concepts often used todetermine presence and severity of disability and handicap. Growing availability and generosity ofdisability programs in some countries might also increase disability prevalence in the absence of anychange in actual health. Another explanation for the increasing number of self-reported disability mightbe improving diagnostic techniques for a number of chronic conditions and expanding use of the medicalcare system.
92. In terms of handicap-free life expectancy at birth, there are improvements in terms of healthyyears gained which are quite parallel to the gains in life expectancy both for men and women. For theFrench, the increase in handicap-free life expectancy at birth has been much faster than the increase in lifeexpectancy. Australia is the only country where handicap-free life expectancy shows a decline over thepast 10 years, perhaps due to the wider definition used.12
11 Even within a country, there can be changes in definitions and methodology which make it difficult, if not
impossible, to carry out meaningful comparisons over time.12 However, there appears to be a net decline both in the prevalence of longstanding illness and handicap in
Australia since the beginning of 1990s, see ABS, National Health Survey, 1995.
DEELSA/ELSA/WD(98)7
42
93. Trends in health expectancies at age 65 are quite similar to that of health expectancies at birth(Table 10). Slight increases in disability-free life expectancy at this age are evident across most countriesexcept Australia, Canada, and United Kingdom for men. Australia and Canada, once again, demonstratedeclines and disability-free life expectancy for males in the United Kingdom is stagnating. Improvementin handicap-free life expectancy for elderly, on the other hand, appears to be as significant as the life-expectancy gains at 65 in most countries.
94. The degree of disability is an important variable. Robine et al. (1991) concluded that disability-free life expectancy across countries had not increased relative to total life expectancy when the measureincluded moderate or light disability; however, when the measure only included severe disability (asdefined by institutionalisation, confinement to house or bed, personal help or supervision required orimpossibility to perform basic tasks in relation to self-care, mobility etc.), disability-free life expectancyincreased along with, and relative to, total life expectancy. Robine et al. (1997) suggests that currentestimates indicate at worst “a pandemic of light and moderate, but not of the severe handicaps ordisabilities.” Some researchers have extrapolated that it may appear that the most severe levels ofdisability are being contained; and if trends continue, the health systems will need to be prepared toaddress the emergence of more minor disabilities (Bebbington, 1997).
95. Finally, another type of health expectancy mentioned in Table 8, is a “health-adjusted” lifeexpectancy, which is a generic term for a weighted expectation of life summed over a complete set ofhealth states. For such indicators, weights have to be derived for each health state. Canada has developeda health-adjusted life expectancy (HALE) using as its concept of health, the multi-dimensional healthstatus instrument, the Health Utility Index. 13
13 Wolfson, MC, Roberge, R, Berthelot, JM (1997) “Health-Adjusted Life Expectancy: A Comprehensive Indicator for
Measuring Health Outcomes in National Population,” Room document No. 5, OECD, December 1997
DEELSA/ELSA/WD(98)7
43
Table 9. Trends in health expectancy at birth
Male FemaleCountry Life
expectancyat birth
Disability-free lifeexpectancyat birth
Handicap-free lifeexpectancyat birth
Lifeexpectancyat birth
Disability-free lifeexpectancyat birth
Handicap-free lifeexpectancyat birth
Australia (2) 1981 1993
71.475.0
59.258.4
63.562.4
78.480.9
65.064.2
68.666.9
Canada (3) 1986 1991
73.074.3
61.360.7
70.571.5
79.880.7
64.963.8
74.975.8
France (4) 1981 1991
70.472.9
60.863.8
68.971.7
78.681.1
65.968.5
76.378.8
Germany (5) 1986 1992
71.873.2
66.368.4
..
..78.379.6
71.273.6
..
..Netherlands (8) 1983 1990
72.973.9
60.160.4
79.580.1
60.859.9
Switzerland (9) 1981 1989
72.674.0
65.967.1
..
..79.380.9
69.772.9
..
..United Kingdom (11) 1981 1992
71.173.7
58.759.7
..
..77.179.2
61.061.9
..
..United States (12) 1980 1990
70.171.8
57.258.8
..
..77.678.8
62.863.9
..
..See notes below Table 10 for sources and definitions of disability.
DEELSA/ELSA/WD(98)7
44
Table 10. Trends in health expectancy at 65
Male FemaleCountry Life
expectancyat 65
Disability-free lifeexpectancyat 65
Handicap-free lifeexpectancyat 65
Lifeexpectancyat 65
Disability-free lifeexpectancyat 65
Handicap-free lifeexpectancyat 65
Australia (2) 1981 1993
13.915.7
7.96.5
9.68.4
18.119.5
10.09.1
11.410.3
Canada (3) 1986 1991
14.915.6
8.58.3
12.813.3
19.219.7
9.49.2
14.915.4
France (4) 1981 1991
14.115.7
8.810.1
13.114.8
18.320.1
9.812.1
16.518.1
Germany (5) 1986 1992
13.814.9
10.612.0
..
..17.618.7
13.014.7
..
..Japan (6) 1980 1990
14.616.2
..
..13.214.9
17.720
..
..15.817.3
Korea (7) 1989 1996
11.913.2
8.411.1
..
..16.016.9
9.813.0
..
..Netherlands (8) 1983 1990
1414.4
8.09.0
..
..18.619.0
7.48.0
..
..Norway (9) 1975 1985
14.014.3
..
..13.313.3
17.218.2
..
..16.116.9
Switzerland (10) 1981 1989
14.515.4
11.512.2
..
..18.419.6
12.214.9
..
..United Kingdom (11) 1981 1992
13.114.5
7.97.9
..
..17.118.3
8.69.5
..
..United States (12) 1980 1990
14.215.1
6.87.4
..
..18.418.9
9.39.8
..
..Notes:
1. Disability and handicap concepts are only partly harmonised across countries. Therefore, when interpreting the table, attention should be paid to the country footnotes and REVES classification.
2. Disability defined as a person having one or more of following conditions lasting more than six months: impairments, functional limitations, and activity restrictions plus handicap prevalence data. Handicap refer to those disabled who identified limitations to some degree in ability to perform tasks in relation to one of the areas: self-care, mobility, schooling, employment etc. Classified as functional limitation-free life expectancy and other handicap-free life expectancy according to REVES. Mathers (1996).
3. Using a general scale of Activities of Daily Living, disability corresponds all kind of limitation in any daily function and/or activity. Handicap refers to severe disability (score >11) where no disability score null. Classified as activity-restriction free life expectancy and independent life expectancy, respectively, according to REVES. Wilkins et al. (1994).
4. Disability includes those persons who are limited in their daily activities (working, schooling, etc.). Handicap refers to severe disability defined by “confinement to home”. All persons living in institutions for health reasons are considered as “handicapped”. Classified as general handicap-free and mobility handicap-free life expectancy according to REVES. Robine and Mormiche (1993).
DEELSA/ELSA/WD(98)7
45
5. Disability based on reported days unable to fulfill their usual tasks or perform their usual activities due to ill-health or injury. Classified as occupational handicap-free life expectancy. Data refer to West Germany (Old Länder),Brückner G. (1997).
6. Corresponds to bed free (including institution free) life expectancy. Classified as mobility handicap-free life expectancy according to REVES. Inoue, Shigematsu and Nanjo (1997).
7. Disability is defined as the condition in which one is not able to perform usual activities which are divided in 1989 into “daily activity restriction”, “bed-ridden condition”, “unable to perform daily activities”. In 1996 a more detailed ADL scale is used covering 9 dimensions using Barthel index. Classified as activity-restriction free life expectancy according to REVES. Lee (1997).
8. Corresponds to long term disability calculated with respect to 10 items from OECD indicator and short term activities (inactivity due to illness). Classified as activity-restriction free life expectancy according to REVES. Perenboom et al. (1993).
9. Corresponds to restrictions in ability to perform activities of daily living. Classified as activity-restriction free life expectancy according to REVES. TNO (1994).
10. Based on questions asking ability to dress/undress etc. Considered severe handicapped. Classified as independent life expectancy according to REVES. Institutionalised population is not included. Grotvedt and Viksand (1994).
11. Based on any long-standing illness, disability, or infirmity which limits activity in any way. Bebbington et al. (1996).
12. Corresponds to both major and secondary activity limitation. Major activities include able to go to work, go to school, keep house. Secondary activities are activities such as going to church and recreational activities. Named disability-free life expectancy by Crimmins et al. (1997, 1989).
DEELSA/ELSA/WD(98)7
46
Disability-adjusted life years
96. The other type of composite health measure is the Disability-Adjusted Life Years (DALYs)which combines premature mortality and disability in an aggregate index and provides a distribution ofmain causes of disability (World Bank, 1993; Murray and Lopez, 1996). The DALY measure wasdeveloped under the auspices of World Bank to assess the global burden of disease in the world byextending the concept of potential years of life lost due to premature death (PYLL) --discussed in sectionon mortality-- to include equivalent years of “healthy” life lost.
97. Technically, DALYs are the combination of Years of Life Lost due to premature mortality(YLL) and Years of Life lived with Disability (YLD) adjusted for the severity of disability.
• Years of life lost due to premature mortality is calculated at each age with standard deathstatistics and an arbitrary age limit for life.
• Years lived with disability are the time lived in ill-health states. This is estimated from theincidence of a health condition in a specific time period ; for each new case, the number ofyears of healthy life lost is obtained by multiplying average duration of the condition by aseverity weight that measures the loss of healthy life compared with total loss of life --derived by person trade-off method.14 (Mathers, 1997)
98. In the Global Burden of Disease study, the incidence and duration of disability for each specificdisease were estimated by a group of experts on the basis of some epidemiological data and routine healthfacilities information where no data were available. To calculate total DALYs for a population, YLL andYLD components are added, and then two sets of weights are applied: discounting and age weights.
99. Several unresolved issues remain in terms of the DALY methodology and related data outlinedin the Global Burden of Disease (GBD) Study. The main problem is the lack of availability and quality ofepidemiological data to calculate DALYs. In order to measure YLD or the loss of healthy life, it isnecessary to assess the incidence, duration and severity of different health conditions (disease or injury)by age group and sex. Because of the lack of data available, the GBD study had to rely on estimates madeby experts and extrapolations made from the literature and routine health facilities information. But, topursue further calculations of DALYs, the basic data on incidence of different health conditions need to bedeveloped first.
100. The second problem which exists is that explicit assumptions and value judgements have beenincorporated into these calculations with the weighting techniques such as, the severity weights for healthstates, age weighting and discount rates. These explicit choices, advocates of DALYs argue, more stronglyexpose the implicit choices often made in prioritising health problems in policymaking. However, thisapproach is generating considerable debate among researchers and policy makers alike as to theirtheoretical and technical justification.
101. Estimates for DALYs have been calculated for six demographic regions in the 1990 GlobalBurden of Disease study. The established market economies (EME) region mainly represents OECD
14 A type of elicitation method used to value health states. The person trade-off method allows comparisons of the
numbers of people helped in different health states. For instance, how many persons in state B must be helped toprovide a benefit equivalent to helping one person in state A. Many experts believe that this method elicitsinformation useful in making a policy decision.
DEELSA/ELSA/WD(98)7
47
countries15. The burden of disease for the EME region is equally attributed between premature mortality(50.3 per cent) and disability (49.7 per cent) compared to the developing countries where up to 75 per centof the total loss of health is due to mortality. This finding highlights the inadequacy of monitoring onlymortality-based indicators and underscores the necessity of developing measures integrating both fatal andnon-fatal consequences of disease and infirmity on health in the OECD area.
102. The population aged 60 and over bears close to one-third of the total burden of disease for theEME region (33 per cent), while only 6 per cent of burden of disease in industrialised countries falls onchildren 0 to 4 years. In 1990, years of life lost with disability (YLD) rate is just about the same for men(50.7 per cent) and women (49.3 per cent); while in terms of years of life lost due to mortality, a muchlarger differential across sex emerges 40 per cent for females and 60 per cent for males.
103. The significance of major disease categories for the EME region are ranked in Table 11 both interms of years of life lost (YLL) and DALYs for 1990. These comparative rankings illustrate the differentorder of health priorities when the disability component is added. In particular, neuro-psychiatricconditions--including alcohol use, dementia, and suicide-- represent the most important category in termsof the burden of disease, comprising 25 per cent of DALYs. These conditions made a large contribution toyears lived in disability (47 per cent), but a small one to years of life lost, (3 per cent) for the EME region.This was also the case with musculoskeletal diseases. Other major categories of burden of disease includecardiovascular disease, malignant neoplasms, and injury-related conditions. These conditions tended torank high due to their large contribution in both premature mortality and disability.
15 The Czech Republic, Hungary, Korea, Mexico, Poland and Turkey are excluded from the established market
economies region, while Andorra, Bermuda, Channel and Faeroe Islands, Gibraltar, Greenland, Holy See, Isle ofMan and San Marino are included, along with the other 23 OECD countries.
DEELSA/ELSA/WD(98)7
48
Table 11. Years of life lost and disability-adjusted life years in established market economiesin 1990
Disease/Injury
Rank Numberof YLLs(000s)
Proportion ofall YLLs(%)
Rank Number ofDALYs(000s)
Proportion ofall DALYs(%)
Cardiovasculardiseases
1 15,288 30.8 2 24,747 25.1
Malignantneoplasms
2 12,985 26.1 3 18,339 18.6
Unintentionalinjuries
3 5,134 10.3 4 14,843 15.0
Intentionalinjuries
4 2,769 5.6 8 8,608 8.7
Digestivediseases
5 2,292 4.6 6 4,773 4.8
Respiratorydiseases
6 1,768 3.6 5 4,307 4.4
Neuro-psychiatricconditions
7 1,564 3.2 1 4,125 4.2
Perinatalconditions
8 1,533 3.1 11 3,150 3.2
Infectious andparasiticconditions
9 1,495 3.0 9 2,750 2.8
Musculo-skeletaldiseases
<15 192 0.4 7 2,133 2.2
All Causes 49,674 100.0 98,794 100.0
Note: The Coale and Demeny model life table West with an expectation of life at birth for females of 82.5 years and males of 80years has been chosen as the standard for calculating years of life lost (YLLs).Source: Murray and Lopez, 1996.
104. Despite the ongoing debate over the methodology, several countries have begun to calculatetheir own estimates of DALYs with the rankings of burden of disease by major causes. Mexico, one of thefirst countries to calculate national estimates of the DALYs, has closely followed the methodology of theGlobal Burden of Disease study (World Bank, 1993; Lozano, 1995; 1997). Based on the 1991 and 1994calculations, the level of DALYs remains the same, with about 13 million DALYs lost in Mexico. Theburden of disease was borne more by males than females regardless of age --7.7 million versus 5.4 millionyears in 1994. In 1991 and 1994, premature deaths accounted for about 58 per cent of the burden ofdisease, while disability contributed about 43 per cent.
DEELSA/ELSA/WD(98)7
49
Table 12. Ranking of health needs using three health status measures, Mexico 1994
Causes Mortality PYLL DALYs
Ischaemic Heart Disease 1 9 6
Diabetes Mellitus 2 8 4
Acute respiratory infections 3 1 3
Cerebrovascular disease 4 11 11
Cirrhosis of the liver 5 4 8
Homicides and violence 6 2 1
Chronic obstructive pulmonarydisease
7 17 19
Watery acute diarrhea 8 3 7
Malnutrition 9 6 9
Nephritis 10 12 14
Motor vehicle accidents withdriver and passenger injuries
11 5 2
Hypertensive heart disease 12 27 21
Source: Lozano, R. The Burden of Disease in Mexico: Advances and Challenges, 1997. Age-adjusted mortality rates based onMexican standard population.
105. Table 12, taken from Lozano et al. (1995), presents in the first column the top twelve maincauses of mortality in Mexico for 1994. Potential years of life lost are displayed in the second column andDALYs is in the third column. Comparisons of the DALYs with other traditional health status measures --such as cause-specific age-standardised mortality rates and potential years of life lost -- make it clear thatthe order of health needs are prioritised quite differently depending on the indicator analysed. Diseasesthat rank high when comparing mortality rates (e.g. ischaemic heart disease and chronic obstructivepulmonary disease) rank lower when considering PYLLs and DALYs. Homicides and violence, alongwith traffic accidents, are major causes of premature mortality and burden of disease, while theircontribution to mortality is much less important in Mexico. When adding disability to the assessment inDALYs, a different picture emerges with diseases such as, neuropsychiatric diseases and injury-relatedconditions, rising in importance. These findings are confirmed in initial estimates of DALYs in othercountries.
DEELSA/ELSA/WD(98)7
50
106. Following Mexico, Australia and the Netherlands have produced a first set of DALY estimates.Australia applied directly the estimates of years of life lived with disability derived for the EME region totheir calculations using their own mortality data; while the Netherlands relied on various national sourcesfor the disability data as best they could. Several other countries such as Japan, Korea, Spain, Sweden,New Zealand and the United States have also begun to derive their own YLD estimates and calculateDALYs on a national level.
107. Indicative estimates of the burden of disease for Australia for 1996 are presented in Chart 8.These estimates were conducted to provide an illustration of how such estimates could be used in theapproach to priority setting. Australian estimates are based on Australian mortality data for 1996, andestimates of DALYs due to non-fatal diseases are derived from the estimates for Established MarketEconomies calculated in the Global Burden of Disease study using the age-sex-disease specific rates ofYLD/YLL. Where the ratio of YLD/YLL was greater than 10, age-sex-disease rates of YLD per 1000 inthe EME were applied to the 1996 Australian population (Mathers, 1998). However, the age weights anddiscount rates were not applied. It should be noted that the relevance of estimates from Australia arelimited since countries may prove to have very different YLD/YLL ratios for different diseases than whatwas estimated for the overall EME region.
Chart 8. Estimated DALYs for Australia with contribution of mortality and disability, 1996
Source: Mathers, 1998.Discount rates and age weights not applied.
108. In Australia, cardiovascular diseases account for the largest proportion of burden of disease at19.2 per cent, with neoplasms, mental disorders and injuries following behind as the next largestcontributers to total burden of illness (18.6, 16.3 and 11 per cent respectively). As in the examples fromMexico and the EME region, conditions such as, mental disorders, respiratory diseases, and musculo-skeletal diseases emerge as major contributors to the disease burden when disability is considered.
109. In 1997, the Netherlands made a first attempt to conduct a burden of disease calculation, close tothe approach taken in the original GBD study. An important component of the Dutch study was thedevelopment of a comprehensive set of the severity weights for the major disease categories relevant to
DEELSA/ELSA/WD(98)7
51
the Dutch population. Using available national data on point prevalences and incidences for differentconditions and the severity weighting factors which were developed specifically for their own population,the Dutch were able to calculate years lived with disability. Similar to the DALYs estimates for the EMEregion and Australia, the disease categories with a significant impact on health in the Dutch population,such as mental disorders, heart disease, and cancer are very similar to the EME region and Australia. Thetotal of years lost due to disability was 1.5 times that of the total number of potential years of life lost forthe Dutch population (Netherlands RIVM, 1997).
110. A project has also been undertaken to examine more closely the disability weighting componentof the DALYs. Seven countries are participating in the project: Netherlands, Sweden, France, Spain,Norway, United Kingdom, and Denmark. The aim of the project is threefold: first, to establish acomprehensive list of disability weights associated with the various diseases that constitute the major partof the burden of disease in Europe; second, to improve, refine and validate the methodology to estimatethe disability weights; and third, to examine the cross-national stability of the disability weights. Ifsuccessful this will enable more reliable estimates of the burden of disease to be calculated provideddisease incidence and mortality data are available for these countries.
111. At present, experimentation continues in several OECD countries and considerable uncertaintiesin the calculation of DALYs remain. Within the next five years, more national estimates are likely to beavailable for analyses. However, international collaboration will be essential if these estimates are to becomparable.
DEELSA/ELSA/WD(98)7
52
CONCLUSIONS: HEALTH OUTCOMES FOR MONITORING POPULATION HEALTHSTATUS
112. Traditionally, mortality indicators have provided useful information for describing the level ofhealth status in the population. With the consistent gains in life expectancies and emergence of chronicconditions, it has become important to complement mortality data with information on non-fatalconditions and their effects on quality of life to describe a more comprehensive picture of health of thepopulations. But, at present, there is a significant lack of comparable morbidity and quality-of-life dataavailable on a national level in OECD countries.
113. Development of a basic information base of mortality and morbidity is the first step to movetowards more outcome-oriented policy making, not only at international level, but also for national studiessince they provide the fundamental data to calculate any of the presented health indicators (Table 1b). It isclear that even among OECD countries, continued improvement of ascertainment and classification ofspecific causes of death is needed for accurate estimates of mortality. Here, support for WHO’s continuedwork on this topic is essential. But, the priority, from OECD’s perspective, should be to encourage thedevelopment of relevant and comparable morbidity statistics by collaborating with existing internationalprojects.
114. The first step would be to standardise the morbidity-related items on the national health surveysacross OECD countries. Each country’s survey should include: a measure of perceived health status andmeasures of impairment, disability and handicap with common concepts, definitions, design, andadministration. To improve comparability of self-reported disability, it would be desirable to develop anADL-based instrument with a common set of items and severity categories. Also, such an instrumentshould be designed to be more sensitive to changes in disability for the general population, and not just theelderly.
115. As OECD countries proceed to implement multi-dimensional health status instruments, morecomparative analyses of the results of the application of these different instruments to the samepopulation, as well as across different populations and over time, are needed. This would help to clarifythe merits and disadvantages of each measure in satisfying decisionmaking and monitoring needs.
116. While disability measurement will assist in monitoring the consequences associated with healthconditions, prevalence and incidence of disease data is an important complement, providing a morecomprehensive picture of the burden of disease in the population. However, comparable disease-specificmorbidity data are scarce across OECD area, and it is clear that more work is needed to improve thequality and the comparability of this data by collaborating with existing international projects.
117. Availability and quality of general morbidity data along with disease-specific data is primordialfor the calculation of the composite indicators such as health expectancies and disability-adjusted lifeyears (DALYs). At this moment, the most feasible of these composite measures is the health expectancymeasure. Health expectancy indicators are potentially useful for measuring health gains within and incomparison between the populations, however at present, there are considerable variations in the
DEELSA/ELSA/WD(98)7
53
definition of “disability” and “handicap” across countries. Standardisation of concepts used, as well asdata in the basic information base described above, is a fundamental requirement for ensuring reliabilityof health expectancies as a measure of health status.
118. Regarding DALYs, the principal problem is the lack of availability and quality ofepidemiological data. The basic data on the incidence, duration and severity of different diseases need tobe developed first in order to produce burden of disease estimates across OECD area. At the same time,there are several methodological issues to be resolved. The value judgments which have been incorporatedinto calculations with weighting techniques need to be clarified. More objective and transparent weightingsystems seem essential for the development of this instrument as a policy making tool. The nationalexperts agreed to encourage the experimentation being undertaken in Member countries and continue tomonitor and analyse the final results in the countries.
119. While a universal composite health measure is an attractive goal for many, an indicator whichcan address all types of health problems for any population group is not feasible. Only an integrated set ofinternational health indicators will serve to underpin outcome-oriented policy making, as presented inTable 1a. Each type -- generic and disease specific mortality and morbidity measures, composite healthmeasures, and subjective and objective measures -- serves its own purpose. Together, they provide a morecomprehensive picture of health status in the population than relying on one summary measure.
DEELSA/ELSA/WD(98)7
54
INDICATORS OF PERFORMANCE OF THE MEDICAL-CARE SYSTEM
120. In recent years, several factors in the medical-care sector have created a demand for informationon the effectiveness of medical care, such as extensive variations in health-care utilisation, increasingcompetition in health-care delivery, and rising medical-care costs. Unfortunately, measures of outcomeswhich are directly attributable to a service, programme, or intervention are difficult to obtain, since thereare too many other factors affecting health beyond the medical-care system. Without conducting multi-variable modelling or randomised controlled trials to control for non-medical factors, it is difficult toestablish a robust link between medical care and changes in health status. In order to respond to thedemand of information on the contribution of medical care to the health status of the population, OECDcountries have proceeded to develop ‘proxy’ indicators, primarily in the form of performance of themedical-care system and quality-of-care indicators, where health care has a predominant role, but notnecessarily an exclusive role.
121. Several countries such as Australia, United States, and the United Kingdom, as well as variousinternational networks have already created sets of indicators to monitor the performance and quality ofhealth interventions, services, and/or system.16 For instance, under Australia’s National Health PriorityAreas, several proxy measures are being developed for routine reporting such as prevalence rates fordiabetic complications (e.g., end-stage renal disease, eye complications, foot problems, and coronary heartdisease) or proportion of patients who die, suffer myocardial infarction or undergo furtherrevascularisation procedures within 12 months of angioplasty treatment for coronary heart disease. In theUnited Kingdom, sets of 50 population health outcome indicators have been developed based on thejudgement that health care had a substantial role in change in health status such as a set of avoidablemortality indicators and other such as acceptance rate for renal replacement therapy and incidence ofadmissions and deaths from hip fractures. In the United States, the Health Plan Employer Data andInformation Set (HEDIS) has been developed to monitor performance of health plans across similarindicators using administrative data and medical records. Currently, there are fourteen indicators in theUnited States focused solely on quality of care in HEDIS such as rates of various preventive screenings;number of low-birthweight infants; and childhood immunisation status.
122. These measures are being used in many OECD countries to assess quality of care andperformance at all levels of the medical-care system, from providers of care to the government formonitoring overall performance of the medical-care system. In large part, these programs share similarconceptual approach in that they attempt to draw a link more closely coupled to medical care. Most arebased on evidence from the literature or general consensus in the medical field that a medical-careintervention play an important role in the improvement of the health state. However, operationaldefinitions of the indicators vary according to each program.
16 For more information, see “Member Countries’ Experiences: Results of the Second Questionnaire on Health
Outcomes,” Working Party on Social Policy, Ad Hoc Meeting of Experts in Health Statistics,DEELSA/ELSA/HP(97)2.
DEELSA/ELSA/WD(98)7
55
123. Based on research from different countries, there are several commonly-used performanceindicators, such as rates of avoidable mortality and rates of effective health-care interventions. Thesetypes of indicators are based on evidence of effectiveness of medical care in the scientific literature.Other examples of performance indicators widely used in OECD countries are survival rates, rates ofadverse events which can only be a result of a medical-care intervention, and rates of satisfaction with thehealth care system.
124. In the OECD area, there is an increasing demand to establish a common set of performanceindicators to better understand the effectiveness of medical care services provided and to direct relatedpolicies in the Member countries. Based on examples of existing country efforts across OECD, someillustrations of selected performance indicators are presented below using data from OECD Health Dataand other international sources. It is important to understand that the indicators presented are not a“recommended” indicator set, but illustrate a range of performance indicators currently being used inMember countries.
Rates of avoidable mortality and morbidity
125. Existing mortality data can be used to evaluate the performance and quality of the medical caresystem. Rutstein et al.(1976) proposed the use of mortality rates for certain conditions and incidence ofspecific diseases as potential indicators of quality of care where there is clear evidence that timely andappropriate medical intervention would either prevent the condition or treat the disease at an early stage.
126. Since then, work has been conducted in the European Community where three editions of theatlas of “avoidable deaths” have been published (Holland, 1997). One has also been published for EasternEurope (Jozan, 1997). Similar work has also been conducted at the Manitoba Centre for Health Policyand Evaluation with the development of “the health care system sensitive indicators” using existingadministrative data reflecting hospitalisations and mortality (Cohen, 1994). These inspect a selection of“unnecessary-untimely” deaths and assess geographical differences in mortality rates for selected diseaseswithin and across countries. In the compilation of the atlas of “avoidable deaths” in the EuropeanCommunity, a number of conditions were agreed upon for which, given modern medical care, deathsought not to occur -- such as tuberculosis, cervical cancer, asthma, appendicitis, and perinatal andmaternal complications. To enhance the validity of mortality as an indicator of health outcomes, strict agelimits were identified in the EC atlas for each condition
127. The concept of avoidable mortality has also been extended to monitoring avoidable morbiditywhere effectiveness evidence demonstrates that the disease condition or hospitalisation could have beenpreventable if appropriate care was given. Many of these examples tend to be highly relevant tomonitoring the adequacy of primary and preventive care in a medical-care system.
128. The commonly-used examples of avoidable morbidity in OECD countries are:
• low birthweight infants under 2500 g, which provides oversight of the adequacy of maternitycare and management of antenatal care on a population level;
• incidence of cervical cancer, which is largely preventable if consistent screening is provided;
DEELSA/ELSA/WD(98)7
56
• hospitalisations or emergency admissions for conditions such as diabetes, hip fractures, andasthma, which are potentially avoidable through appropriate early intervention before crisisoccurs.
• incidence of amputations among diabetic patients. Here, there is evidence that specialisedtreatment for diabetic foot problems reduces significantly the need for major amputations.
Illustration of avoidable mortality indicator: maternal mortality
129. Maternal mortality has long been accepted as an indicator of the quality of obstetric and infantcare. The indicator measures the number of deaths among women during pregnancy and during or afterchildbirth. In most OECD countries, maternal mortality has declined significantly since the 1970s, froman average of 32 to 9 maternal deaths per 100,000 births -- a fourfold reduction in twenty-five years. In1970, maternal mortality ranged from 8 deaths per 100 000 births in Denmark and Finland to 143 deathsper 100 000 births in Mexico. This wide variation has narrowed over the last twenty-five years, to 1 deathper 100 000 births in Finland to 53 deaths per 100 000 births in Mexico, in 1995 (Table 13).
130. The high rates of maternal mortality in the 1970s signalled possible shortcomings in themedical-care system -- in particular, a lack of quality and access in obstetrics care. It is clear that maternalmortality is often caused by substandard care leading to complications during delivery, abortions,Caesarean sections, complications with infections, and problems with anaesthesia. In the 1990s, despitethe significant decline over the last 25 years, there are still a large number of maternal deaths occuring inmost of the OECD countries where many believe are largely preventable.
DEELSA/ELSA/WD(98)7
57
Table 13. Maternal mortality, per 100 000 births, 1970-1995
a) Data refer to 1994 for France, Norway and Spain and to 1993 for Italy.Source: OECD Health Data 1998
Illustration of avoidable morbidity indicator: birth defects
131. Prevalence and incidence of selected conditions can be used as indicators of quality of care ifthere is enough evidence that the conditions could have been prevented or treated if specific action hadbeen taken. Prevalence of birth defects is a good example since it provides insight into the level ofprenatal care provided and the availability of preventive screening.
132. Several countries have developed national registries to collect data on birth defects, and theInternational Clearing House for Birth Defects (ICBD) has played a role in coordinating data collectionsacross several registries. Based on data available from ICBD, in 1993-1995, countries have reported awide range of rates from 1.01 per 10 000 births in England and Wales to 4.50 per 10 000 births in Norway(Chart 9). A higher rate of spina bifida continues, however, in Mexico at 15.21 per 10 000 births in 1993-1995. In most of the countries presented, there have been downward trends in the prevalence of spinabifida between 1981 and 1995; while trends have been more variable in Mexico. Japan, on the other hand,reveals a slight upward trend in prevalence from 2.6 to 3.8 per 10 000 births for the same period.
DEELSA/ELSA/WD(98)7
58
133. Reduction in prevalence of spina bifida and other congenital anomalies is partly attributable tothe improved prenatal diagnosis and wider use of screening techniques over the years. These screeningtechniques have assisted in earlier diagnosis and as a result of the diagnosis, possible termination ofpregnancy as a secondary preventive approach. Variation across countries in prevalence may represent thelack of consensus within and across countries over whether screening is effective in accurate diagnosis ofspina bifida or other anomalies and whether it should be routinely conducted. Additionally, variation maybe due to other factors, such as mothers’ cultural values where some females may find it inappropriate toterminate their pregnancy.
134. It will be important to continue to monitor the prevalence of spina bifida since in recent years,studies have indicated that folic acid deficiency in women may cause spina bifida and other neural tubedefects. Several countries have encouraged the application of these recommendations as a preventativeprogramme; therefore, it would be beneficial to continue collection of data on prevalence of congenitalmalformations so to adequately monitor the effectiveness of these recommendations.
DEELSA/ELSA/WD(98)7
59
Chart 9. Prevalence of spina bifida for selected OECD countries, three-year averages, 1981-1995
Source: International Clearinghouse for Birth Defects, OECD Health Data 98Australia Czech Republic France Hungary Japan Mexico
0
5
10
15
20
25
per 10 000 births
81-8384-8687-8990-9293-95
Source: International Clearinghouse for Birth Defects, OECD Health Data 98New Zealand Norway Spain Sweden United Kingdom United States
0
5
10
15
20
25
per 10 000 births
81-8384-8687-8990-9293-95
DEELSA/ELSA/WD(98)7
60
Survival rates
135. Survival rates measure the proportion of all patients still alive at a given point in time afterdiagnosis or after an intervention/treatment. It is a common indicator used to determine the effectivenessof patient care. For instance, the survival time for a given cancer patient is defined as the “elapsed timebetween diagnosis and death.” (Verdecchia, 1996) Since it is linked with the diagnosis, the indicator can,in principal, more directly reflect care treatment -- particularly if the survival rate is measured within ashort time frame since the diagnosis or treatment (e.g. one-year, three-year, and five-year survival rate).
136. Survival rates for cancer can be presented in two ways: observed rates and relative rates(Verdecchia, 1996). Observed rates are the proportion of all patients still alive at a given point in timeafter a certain diagnosis. Relative survival is the ratio of observed survival rate in the group of patients tothe survival rate expected in a similar group from the general population. In the case of cancer, forexample, relative survival rates may be more suitable since it accounts for the effect of non-cancermortality.
137. Chart 10 presents the relative survival rates for colon and breast cancer in selected countries for1978-1985 period based on the first pan-European study on survival in cancer patients, called theEUROCARE study (Berrino, 1995). These results are based on 800,000 cancer patients diagnosed duringthe period 1978-1985 from 30 cancer registries in 11 European countries, by using common methodologyand controlling for age, sex, and period-specific mortality. Results for 1985 to 1989 will be added at theend of 1998. United States and Japan data come from different sources: the National Cancer Institute’sSurveillance, Epidemiology, and End Results program (SEER) and the Osaka Cancer registry,respectively; therefore, comparison of the United States and Japan data with the European countriesshould be conducted with caution.
138. From 1978 and 1985, most countries showed improvement in their five-year relative survivalrates for colon cancer with the exception of Denmark, Spain, and Switzerland. These increases are likelyto be improvements in medical treatment and perhaps, better diagnostic and screening techniques since thelate 1970s. Across the countries, there was not much of a difference between relative survival rates ofmen and women. However, there was significant variation in the level and trends of relative survival forboth breast cancer and colon cancer for the total population across OECD countries. Relative survivalrates for colon cancer ranged from a high of 57 in the United States and a low of 38 in United Kingdomand 23 in Poland in 1983-1985 period.
139. Higher relative survival rates for breast cancer have been observed than for colon cancer acrossthe European countries between 1978 and 1985. Again, significant variations in the level and trends ofrelative survival for breast cancer existed across countries. Several countries showed a steady upwardtrend in survival rates during this period such as England, France, Italy, Japan, and Poland. Others eithermaintained their level of five-year survival or did not show a clear increasing or decreasing trend.Relative survival rates ranged from 85 per cent in Switzerland to 57 per cent in Poland among women in1983-1985.
140. The higher survival rates for breast cancer in the mid 1980s might be due to the fact thatdiagnosis is often made quite early in the process due to mammography screening and other preventivetechniques as well as through improvements in therapeutic procedures. For these reasons, survival rates,while vital, need to be analysed together with age-specific incidence data to assess trends adequately.
DEELSA/ELSA/WD(98)7
61
141. The differences in survival across countries can provide a proxy measure of the quality of carefor certain conditions and can highlight areas where better intervention after diagnosis is essential. Ideally,these survival rates should be standardised for the stage of cancer at diagnosis as well, among otherfactors described above. There are national cancer registries in Australia, Austria, Belgium, Canada,Czech Republic, Denmark, Finland, Hungary, Iceland, Ireland, Korea, Luxembourg, New Zealand,Sweden, United Kingdom, United States; while multiple local and regional registries are located inFrance, Germany, Greece, Italy, Japan, Netherlands, Portugal, Spain, and Switzerland. It is important tocontinue this work to determine whether survival rates for major diseases are in fact improving with time,and whether they differ significantly between countries.
Chart 10. Five-year relative survival rates for colon and breast cancer, 1978-1985
C o l o n C a n c e r , t o t a l
S o u r c e : I A R C , E U R O C A R E s t u d y , U .S . N a t io n a l C a n c e r I n s t i t u t e ’s S E E R p r o g r a m , a na n d O s a k a c a n c e r r e g is t r y
D e n ma rk
N e the r la
nd s
E n g lan d
F in lan d
F rance
G e rman y
Italy
Jap an
P o la n d
S p a in
S w itze rla
nd
U n ited S
tate
s0
1 0
2 0
3 0
4 0
5 0
6 0
%
1 9 7 8 - 1 9 8 01 9 8 1 - 8 21 9 8 3 - 8 5
B r e a s t C a n c e r , f e m a le
S o u r c e : I A R C , E U R O C A R E s t u d y , U .S . N a t io n a l C a n c e r I n s t i t u t e ’s S E E R p r o g r a m , a na n d O s a k a c a n c e r r e g is t r y
D en ma rk
N e the rla
nds
E ng land
F in land
F rance
G e rmany
Italy
Japan
P o land
S pa in
S w itze rla
nd
U n ited S
tate
s0
2 0
4 0
6 0
8 0
1 0 0
%
1 9 7 8 - 1 9 8 01 9 8 1 - 8 21 9 8 3 - 8 5
DEELSA/ELSA/WD(98)7
62
Rates of effective health-care interventions
142. Rates of effective health-care interventions can also be used as an indicator of performance ofthe medical-care system where there is evidence in the research literature that the level of benefitimproves as a result of the specific intervention. Examples of this indicator include rates of immunisation,rates of preventive screening for blood pressure, cholesterol and cancer; percentage of pregnant womenreceiving prenatal care in the first trimester; and beta blocker treatment after a heart attack. These process-based indicators analyse the medical practice variations and inferences can be made based on thevariations regarding differences in health outcomes in the population.
Illustration: uptake rates of breast cancer screening
143. For example, with breast cancer, there is clear evidence in the medical literature thatdemonstrates significant benefits from mammography screening in women between ages of 50 and 69.Studies have shown that screening programmes, with participation rates around 70 per cent, for women50-69 years of age, can reduce the risk of dying by one-third. (Nystrom, 1993). However, the evidence isless clear in terms of benefits and cost-effectiveness of mammography screening for women under age 50.
144. A meaningful performance indicator could be the participation or uptake rates of breast cancerscreening and how well the targeted female group in the population is accessing the mammographyscreening. High and low values of this indicator will shed light on the accessibility of these servicesthrough the national programme and on any unforeseen barriers to services for the targeted group ofwomen.
145. National breast cancer screening programmes have been organised in several OECD countriesincluding: Australia, Netherlands, the United Kingdom, Finland, Luxembourg, and Sweden -- mainly inthe late 1980s and early 1990s. Australia has collected information via its National Health Survey whichindicated in 1988-1990 that only 22 per cent of women aged 40 to 64 had had a mammography screeningin the previous three years, with the highest proportion (25 per cent) in the 45 to 49 year age group.(AIHW, 1992). In the United States, the percentage of women having a mammogram within the past twoyears over the age of 40 has climbed significantly from 28.7 per cent in 1987 to 60.9 per cent in 199417
(U.S. Dept. of HHS, 1994). In 1995, 62 per cent of those women over 40 years old in the Netherlandswho have ever had a mammography had their latest screening in the last two years. (StatisticsNetherlands, 1996). Also, in the United Kingdom, uptake rates for breast cancer screening have beenincorporated as indicator used in their performance framework of their different regions. Poor awareness,lower education levels, income, and language barriers have been common reasons for the low proportionof uptakes among women.
146. The Eurobarometer survey has included a question in its 1995 survey to monitor mammographyscreening. Rates of participation as displayed in Chart 11 might highlight the differences between thenational screening programs.
17 It should be noted that questions concerning use of mammography differed slightly on the National Health
Interview Survey across the years for which data are shown for the United States.
DEELSA/ELSA/WD(98)7
63
147. It is clear that the rates of health care interventions, such as breast cancer screening, should beexamined in the context of the levels of breast cancer in the population, using either incidence or mortalitydata as described above. With both types of performance data in hand, it would be possible to assesswhether variation in practice has led to any significant health outcome differentials.
Chart 11. Percentage of women 50-69 years reporting a mammography in the past year forEuropean Union in 1996
Source: Eurobarom eter 44.3/1996
Swed
enDen
mar
kNet
herla
nds
Luxe
mbo
urg
Finla
ndAus
tria
Unite
d Kin
gdom
Franc
eG
erm
any
W.
Portu
gal
Spain
Ger
man
y E.
Italy
Belgi
umG
reec
eIre
land
0
20
40
60
80
%
50-59 yrs.60-69 yrs.
Illustration: rates of heart disease treatment
148. The example of monitoring cancer screening rates takes a preventive perspective. It would alsobe beneficial to extend this analysis to “effective” therapeutic interventions which reduce morbidity,improve survival, and increase quality of life among patients suffering from a certain condition.
149. Cardiovascular diseases tend to be one of the major causes of mortality and morbidity acrossOECD countries. It might be useful to analyse the level of the use of different treatments, proveneffective, as a potential indicator of performance to determine whether the medical care system isadequately addressing the health needs of the populations.
150. In the medical literature over the years, two types of heart disease operations --coronary arterybypass grafting (CABG) and percutaneous transluminal coronary angioplasty (PTCA)-- have beenidentified as effective treatments in relieving pain, preventing heart attacks and prolonging life. Rates ofPTCA (often referred to as “angioplasty”) -- a therapy which inserts a balloon to widen a narrowed bloodvessel -- have consistently increased over the period of 1985 to 1991 in several OECD countries. (Chart12).18 There is, however, considerable variation in terms of the number of PTCAs performed across these
18 Ideally, in this analysis, CABG data would have provided a more comprehensive picture of overall heart disease
curative treatment. However, availability of data was limited for the number of years and countries covered.
DEELSA/ELSA/WD(98)7
64
countries over this period and though the variation has narrowed over the six years, the ranking order ofthe countries remains almost the same over this time. It should be noted that when measuring levels oftreatment within populations, the analysis should take into account several issues, these could include theappropriateness of the treatment, the impact of technological regulation and diffusion and the effect of itsmedical care insurance system on utilisation of the treatment.
151. For example, comparing the age-standardised mortality rates for ischaemic heart disease withthe rates of PTCA might assist in determining the extent to which health care resources are being usedoptimally or not. There has been a significant downward trend in the mortality rates due to ischaemicheart disease in the OECD area. In Chart 13, the mortality rates for ischaemic heart disease are comparedto rates of PTCA in 1993 to illustrate solely potential analyses which could be done with this type ofdata.19 There appears three groups of countries in the chart. The first group including, Hungary and CzechRepublic, demonstrates high rates of heart disease mortality, but low rates of PTCA. The second group ofcountries (Luxembourg, Italy, Greece) have low death rates and low PTCA, while the third group haveaverage mortality rates and medium to high rates of PTCA. The United States is an outlier in this chart,with mortality rates above the median, but the highest use of PTCA by far, with 1275 PTCAs per millionpopulation. (Van Brand, 1991)
Chart 12. Rates of angioplasties in selected countries, 1985-1991.
Source: Van Brand, 1991
Portugal
Denmark
Finland
Italy
Norway
Sweden
Spain
United Kingdom
Switzerland
Austria
France
Germany
Belgium
Netherlands
United States
0 200 400 600 800 1,000 1,200 1,400Number of angioplasties performed per million population
1985
1987
1989
1991
19 See footnote 16. Additionally, preventive measures should be included for a more comprehensive view of the
medical-care inputs when comparing to mortality rates and it should be understood that relationship betweenmortality and PTCA is unlikely due to the lag in demonstrated benefits from the interventions. These charts werepresented for illustrative purposes.
DEELSA/ELSA/WD(98)7
65
Chart 13. Mortality rates for ischaemic heart diesease as compared to rates of angioplasties, 1993.
152.
Source: OECD Health Data; 1992 data used for Belgium and Czech Republic.
0 10 20 30 40 50 60 70 80 90 100 110 120 130 1400
50
100
150
200
250
300
350
Number of angioplasties per million population
Mortality rates for ischaemic heart disease, 100 000 population
Czech Republic
Hungary
Finland
New Zealand Germany
United Kingdom
Denmark
Italy
Greece
Luxembourg
United States
France
Belgium
Netherlands
Switzerland
Australia Norway Canada Austria
Iceland
Rates of adverse events
153. Another type of commonly-used performance indicator measures adverse or sentinel events thatbring about a decline in health status as a result of a medical-care intervention, such as hospital-acquiredinfections and complications in routine surgery. Several studies in the OECD area have shown that thereare a significant number of adverse events that are preventable and are creating additional costs for thehealth care systems.
154. For instance, rates of hospital-acquired infections have become a recognised indicator includedin quality assurance programmes in hospitals. In responses to an OECD questionnaire on health outcomeindicators, several countries--Australia, Belgium, Denmark, Finland, Hungary, Iceland, Italy, Spain, andthe United Kingdom-- explicitly mentioned their work in gathering data on hospital-acquired infections(HAIs). In recent years, several types of national and regional networks have been set up for thesurveillance of HAIs such as the United States’ Centre for Disease Control’s National NosocomialInfection Surveillance Systems, the European Union-sponsored EURONIS project (Nosocomial Infectionsin Intensive Care Units in Europe), the National Nosocomial Infection Surveillance Program or theDANOP/WHOCARE initiative, co-ordinated by the WHO Regional Office for Europe and the DanishStatens Serumenistitut.
155. Infections acquired during a hospital stay often prolong hospitalisation, increase morbidity andmortality among these patients, and add considerably to the costs of treatment. Approximately one-thirdof all HAIs are potentially preventable by means of stringent effective control programmes (Worning,1994). It has been shown that the risk of HAIs can be reduced with the implementation of bettersurveillance, prevention and control programs (such as the appropriate use of antibiotics). (Haley, 1985)
156. There are two ways to measure hospital-acquired infections: one is through prevalence surveysand other is through incidence surveys. Prevalence surveys measure the proportion of hospitalisedpatients who have an infection at one point in time and gives a snapshot of the situation at that specific
DEELSA/ELSA/WD(98)7
66
moment in time; while incidence surveys indicate the occurrence of new cases for a defined period oftime either retrospectively or prospectively. Prevalence surveys tend to be easier to perform, less timeconsuming and less expensive, and provide a descriptive picture of the level of hospital-acquiredinfections in the population. However, prevalence studies have several limitations, in particular in theirability to establish cause and effect relationship and their bias to sample patients who stay in the hospitallonger and therefore, are more ill. Though prevalence surveys lack the completeness of incidence surveys,these studies can still be a reliable and practical tool to assess the evolution of nosocomial infections andto evaluate the efficacy of preventive measures over time.
157. Another limitation of this indicator, whether it is incidence-based or prevalence-based, is that theinfection -- particularly surgical wound infection -- often is detected after patients’ discharge fromhospital, particularly with the growing trend to decrease length of stay and the rise of the use ofambulatory surgery. Byrne et al. (1994) found that with careful post-discharge surveillance of patientsand better definition of infections, about 60 per cent more post-operative wound infections could bedetected after discharge.
158. Lack of uniformity and agreed upon standards in measuring hospital-acquired infections make itdifficult to compare across centres and hospitals within a country as well as across countries. There areonly a few countries where prevalence-based data is available on national basis (Table 14). However, thedifferences in methodology such as selecting samples (voluntary or random selection), types and size ofhospitals, length of hospital stay, and timing of studies as well as the differences in medical practices, callfor caution in analysis of these rates and comparisons across countries and even across years for the samecountry.
159. Across the countries presented in Table 14, between 1978 and 1996, the prevalence of hospital-acquired infections varies from 6 to 12 per cent of all hospitalised patients. In Norway and Spain, thereseems to be a significant decline in the prevalence rate of HAIs. In the United Kingdom on the otherhand, the rate of infection remains at about the same level over a span of 15 years20. The prevalencesurveys can also help to identify the problem areas in the hospital setting and could be an important toolfor developing a prevention and control strategy.
20 It should be noted that the improvement in the survey methodology, particularly the sample size, might have a
significant impact on the results.
DEELSA/ELSA/WD(98)7
67
Table 14. Prevalence of hospital-acquired infections in selected countries, 1978-1996
n.a. means not availableSources: See Addendum 2 * Germany recorded only certain nosocomial infections rather than differentiating between certain,probable, and possible infections. So for instance, if British national prevalence studies only documented “certain”nosocomialinfections, there prevalence rate would have been 4.2%. See Ruden, H, et al. in Addendum 2.
160. For instance, in the prevalence surveys conducted in the 1980s and 1990s, in most OECDcountries, three major sites of infections have been identified: urinary tract, lower respiratory tract, andsurgical wound accounting for about 30 %, 20 % and 20 % respectively of all HAIs. Much focus has beenconcentrated on the reduction of surgical wound infections since it is believed that they account for themost added bed days and cost of all HAIs. In addition, it seems that HAIs are greatly concentrated inintensive care units and larger hospitals, often with teaching facilities and in public hospitals -- perhapsdue to the fact that more complex and aggressive therapies are given in these types of hospitals.
161. There have been efforts to standardise the monitoring of hospital-acquired infections from alongitudinal perspective. For example, research in this area was further developed in the Hospitals inEurope Link for Infection Control through Surveillance (HELICs) in 1994-1995, by creating aninternational partnership of national and regional networks to standardise methodology in order tocompare outcomes of health care practices across Europe. This partnership was not intended to replacelocal and national initiatives. It has four main objectives: to standardise surveillance methods so tocompare the outcomes of health care practices in Member states; to promote and assist the developmentof new networks; to improve the way results are used in feedback, prevention, and cost containment; andto promote the integration of surveillance of hospital-acquired infections with routine data collection. Asa result, protocols for the surveillance of surgical-wound infections and infections in intensive-care units
DEELSA/ELSA/WD(98)7
68
were produced to provide a tool for gathering information on infection rates in the workplace as well ascollecting rates observed in their countries.
162. By the end of 1995, all infection-surveillance networks active in Europe were participating inHELICS (Austria, Belgium, Denmark, France, Germany, Great Britain, Greece, Hungary, Italy, TheNetherlands, Portugal, Sweden, and Spain). During the second half of 1995, the Statens Seruminstitut inCopenhagen began to assemble an international pilot database on surgical wound infection. Fivecountries (Belgium, Denmark, Finland, Netherlands, and Sweden) contributed test data to this database.Initial analyses showed regional variations in health care processes and outcomes.
Rates of satisfaction with health care system
163. With the shift towards more patient and consumer-centered care in the health sector, healthpolicymakers increasingly have wanted to know what the public/patients think, and use this information toimprove the quality of the health care system. There has been a movement to understand the public’ssatisfaction with the overall health care system which could be considered a type of indicator ofperformance. Collection of indicators of this type on a consistent basis would assist in evaluating changesover a period of time which may be associated with the introduction of specific measures or reforms.
164. An example of this type of data is available from the Eurobarometer survey conducted in the 15European Union Member states in 1996 (Mossialos, 1997). One question was asked: “In general, wouldyou say you are very satisfied, fairly satisfied, neither satisfied nor dissatisfied, fairly dissatisfied or verydissatisfied with the way health care runs in (our country)?” Based on this survey, Greece, Italy, Spain,and Portugal demonstrate low levels of satisfaction (18, 16, 35, 19 per cent reporting either very satisfiedor fairly satisfied), contrasting with Denmark and Finland’s high level of satisfaction (90 % and 86 %respectively) (Table 15). Disparities in satisfaction levels between the Northern and Southern Europeancountries are evident, with the United Kingdom and Ireland falling in the middle.
165. Additionally, policy-makers would like to know if those countries with higher per capita healthexpenditure also have higher levels of public satisfaction with their health care system. Mossialos arguesthat the increase in satisfaction is linked with increasing per capita health care expenditure (Chart 14).Those with lower per capita health expenditure such as Greece, Spain, and Portugal also have greaterdissatisfaction. But it should also be noted that there are some variations in levels of satisfaction exist forthe same level of health expenditure in the countries presented. For instance, Finland and United Kingdomboth have almost the same level of per capita health expenditures, 1380 and 1317 in US$ PPP, however,86.4 per cent of the public were either very satisfied and fairly satisfied in Finland as compared to 48.1 percent in the United Kingdom.
DEELSA/ELSA/WD(98)7
69
Table 15. Satisfaction with health care system in 1996.
Chart 14. Per capita expenditure on health in US$PPP as compared to satisfaction with health system, 1996.
Source: Mossialos, 1997 and OECD Health Data 1998
0 50 100 150 200 2500
20
40
60
80
100
Per capita health expenditure $US PPP
Percent
PortugalPortugal
Spain
Greece Italy
IrelandUnitedKingdom
Sweden
FinlandFinland Denmark
Netherlands
Austria
BelgiumFrance
Luxembourg
Germany
DEELSA/ELSA/WD(98)7
70
166. In the late 1980s and 1990s, data from Blendon et al. (1990, 1991) presented information onpublic’s view on the performance of their health care systems and the need for reform. In 1988 and 1990,public opinion surveys were conducted in eleven countries -- Australia, Canada, France, Germany (West),Japan, Italy, Netherlands, Sweden, Spain, United Kingdom, United States -- to learn of the public’ssatisfaction with the financing and organisation of their health care systems. It is interesting to note thatmany of the countries were in the midst of health care reform efforts at this time and it might be importantto continue to assess in the future whether the needs of the citizens have been met.
167. The results show that eight of the eleven countries surveyed have more than half of theirpopulations wanting to “completely rebuild their system” or “fundamental changes needed” in the late1980s (Table 16). The United States were substantially more dissatisfied with their mixed private andpublic health care system than the other countries (89%), followed by Italy (86%) and Spain (77%) wherethere are very different health systems, modeled after a NHS type system. Sixty-nine per cent of thepopulation in United Kingdom--with the National Health Service--think their system needs to be changed.This is perhaps a result of the wide perception of financial problems in the NHS at that time. Countrieswhich have the highest percentage of their population reporting that “only minor changes areneeded” included Canada, Netherlands, West Germany and France (56, 47, 41, and 41 per cent). Fromthese 1988 to 1990 results, this survey shows that “having a national program does not in itself guaranteehigh levels of satisfaction with a nation’s health care system” since Australia, Sweden, Japan, UnitedKingdom, and Italy all have national health plans.
168. However, public opinion seems to vary considerably over time. In 1994, there were significantdeclines in the number of Canadians in particular nearly 50 per cent, and Germans who reported theirhealth care system as “working well”; while the Americans appeared a bit more satisfied. Thedissatisfaction gap narrowed quite a bit between the United States and the other two countries since thelate 1980s results.
Table 16. Synopsis of public’s viewpoint of the need for reform in their health care system,1988-1990
169. Blendon states that this measure may reflect the level of availability of more sophisticated andadvanced medical technologies, more or less physician choice, more or less waiting times for electiveprocedures, inadequate insurance protection, level of out-of-pocket spending etc. Many questions,however, emerge based on the findings of these kinds of satisfaction surveys. Findings could bemisleading because often, surveys were conducted prior to cost containment efforts. Many criticise thatthat these findings are not replicable across multiple surveys and time periods. Researchers have surmisedthat favorable attitudes may reflect optimistic views toward economy, or regarding their nationalinstitutions in general than an “actual measure” of their universal health program. Also, similar to othersubjective measures, such measure cannot easily be adjusted for cultural differences in expectations formedical care that exist among the countries. However, these measures are clearly an important tool formonitoring the change in public view as health care becomes more managed in the OECD area.
DEELSA/ELSA/WD(98)7
72
CONCLUSIONS: INDICATORS OF PERFORMANCE OF THE MEDICAL-CARE SYSTEM
170. Several illustrations of performance indicators are provided above to demonstrate the potentialvalue of this type of information. It is clear that an agreed-upon set of performance indicators would assistgovernments, funders, and health management in health care management and policy development. Basedon this rationale, the national experts in December 1997 agreed that highest priority in collection andmonitoring on an international level should be given to those indicators which are the most directly linkedto health policies or interventions.
171. To proceed with the development of these indicators, national experts agreed upon a set of fourcriteria to use in the selection of a core set of performance indicators:
1. Indicators would reflect health problems that are a major concern in most Member countries;
2. There would be a clear understanding of the relationship between medical care interventionand health status;
3. Indicators would clearly relate to areas involving substantial resources or burden of disease;
4. Indicators should be sensitive to quality of care differences.
172. Applying these criteria, the OECD countries could move toward a core set of performanceindicators for the areas representing the most burden in terms of costs and disease, disability or quality oflife. A family of performance indicators related to selected conditions, for example, cancer, cardiovasculardisease, and respiratory diseases -- the three top diseases causing high premature mortality-- could also becollected and monitored consistently across countries. Subject to sufficient resources being made availableto undertake this work, the following tasks could be undertaken:
• organise a network of experts in interested countries to oversee this work.
• undertake a critical review of the status of knowledge and experience regarding thedevelopment and use of performance and quality of care indicators for the selectedconditions in OECD, with a specific focus on examining reliability of indicators anddefinitions; and availability of data related to these indicators;
• derive a framework for the development of an international set of performance of medicalcare and quality of care indicators for the selected conditions.
DEELSA/ELSA/WD(98)7
73
REFERENCES
Apolone, G., Mosconi, P., Ware, JE. (1997), “Questionario sullo stato di salute SF-36: Manuale d’uso eguida allínterpretazione del risultati”, Istituto di Richere Farmacologiche “Mario Negri,” Milan.
Australian Institute of Health and Welfare (1996), Cancer in Australia 1989-1990, Cancer series, no.5,Canberra.
Bebbington A.C., Darton R.A. (1996), “Healthy Life Expectancy in England and Wales: RecentEvidence”, Discussion Paper, 1205, HSMO, London.
Bone M.R., Bebbington A.C., Jagger C., Morgan K. and Nicolaas G. (1995) Health Expectancy and ItsUses, HMSO, London.
Brazier, J., Usherwood, T., Harper, R., Thomas, K., Deriving a Single Index Value for Health from theUK SF-36 Health Survey, forthcoming.
Bruckner, G. (1997), “Health Expectancy in Germany: What do we learn from the ReunificationProcess?” Paper presented at the REVES 10 Meeting of the Network on Health Expectancy,October 1997.
Byrne, DJ., Lynch, W., Napier A et al. (1994), “Wound infection rates: the importance of definition andpost-discharge wound surveillance.” J. Hospital Infection; 26: 37-43.
Cambois, E. and Robine, J-M. (1997), “What do we know about available surveys to adjust tem forharmonisation”, Room Document No. 1, OECD Working Party on Social Policy, Ad Hoc Meetingof Experts in Health Statistics, December, 1997.
Centraal Bureau voor de Statistiek (1996), Vandemecum gezondheidsstatistiek Nederland,Voorburg/Heerlen/Rijswijk.
Chen J., Verma, R., George, M.V. (1993), “Projections of Persons with Disabilities at Work, Canada,Provinces and Territories, 1991-2016”, report, Statistics Canada.
Crimmins E.M., Saito, Y., Ingegneri D. (1997), “Trends in Disability-Free Life Expectancy in the UnitedStates, 1970-90”, Population and Development Review, 23(3): 555-72.
Crimmins E.M., Saito, Y., Ingegneri D. (1989), “Chances in life expectancy and disability-free lifeexpectancy in the United States”, Population and Development Review, 15: 235-67.
Cutler D.M. and Richardson E. (1997), “Measuring the Health of the U.S. Population”, Brookings Paperson Economic Activity, Brookings Institution.
DEELSA/ELSA/WD(98)7
74
Directorate General V (1993), Framework for Action in the Field of Public Health. EuropeanCommission: COM 93 559.
Directorate General V and Eurostat. (1996), Minutes of Working Group on Public Health Statisticsmeeting on 9.2.96.
Donabedian, A. (1980), The Definition of Quality and Approaches to its Assessment, HealthAdministration Press, Ann Arbor, Michigan.
Gandek, B. Ware, J., (1998), “Methods of Validating and Norming Translations of Health StatusQuestionnaires: The IQOLA Project Approach.” Journal of Clinical Epidemiology, 51(11) in press.
Gold, M., Siegel, J., Russell, L., Weinstein, M. (1996), Cost-effectiveness in Health and Medicine, OxfordUniversity Press, New York.
Grotvedt, L. and Viksand G. (1994), “Life Expectancy without disease and disability in Norway”, inMathers CD, McCallum J, Robine JM, (eds), Advances in Health Expectancies, Canberra:Australian Institute of Health and Welfare, AGPS: 224-235.
Haber, L.D., Dowd, J.E., (1994), “A Human Development Agenda for Disability: StatisticalConsiderations,” prepared for the United Nations Statistical Division (UNSTAT) of the Departmentfor Economic and Social Information and Policy Analysis (DESIPA).
Haley, R., Culyer, D.H. and White J.W., (1985), “The efficacy of infection surveillance and controlprogrammes in preventing nosocomial infections in US hospitals,” American Journal ofEpidemiology, 121: 182-305.
Holland, W.W. (1988), European Community Atlas of “Avoidable Death, Oxford University Press,Oxford.
IARC (1993), Facts and Figures of Cancer in the European Community, WHO, Commission of theEuropean Community, International Agency for Research on Cancer, Lyon, France.
Inoue, T, Shigematsu T., and Nanjo, Z. (1997), “Health life tables in Japan, 1990: a quality of longest lifeexpectancy in the world”, Minzoku Eisei, 63(4): 226-240.
Lee S-K. (1997), “A Study on Disability-free Life Expectancy of Elderly in Korea”, REVES paper 308,presented in 10th Workgroup meeting REVES, Tokyo, October 1997.
Lozano, R., Murray C., Frenk J., Bobadilla J-L. (1995), “Burden of Disease Assessment and HealthSystem Reform: Results of A Study in Mexico”, Journal of International Development, vol. 7, no.3,555-63.
Mason, V. Bridgwood, A., (1997) “Methods of Collecting Morbidity Statistics,” prepared for the EurostatWorking Group on Public Health Statistics, Luxembourg.
Mathers, C. (1991), Disability-free and handicap-free life expectancy in Australia, 1981 and 1988, AGPS:Australian Institute of Health, Health Differentials Series No. 1, Canberra.
DEELSA/ELSA/WD(98)7
75
Mathers, C. (1994), Health differentials among adult Australians aged 25-64 years. Health MonitoringSeries No. 1, Australian Institute of Health and Welfare, Canberra.
Mathers, C. (1996), Issues in the measurement of health status, 9th Meeting of the International Networkon Health Expectancy (REVES), Rome, December 11-13, 1996.
Mathers C. (1996), “Trends in health expectancies in Australia, 1981-1993”, Journal of the AustralianPopulation Association, vol.13, no.1, 1-15.
Mathers, C. (1997a), “Developments in the use of health expectancy indicators for monitoring andcomparing the health of populations,”report prepared for the OECD Directorate for Education,Employment, Labour, and Social Affairs, June 1997, Paris.
Mathers, C. (1997), “Health expectancies and DALYS: Towards consistency of measures”, OECDWorking Party on Social Policy, room document no.4, December 1997, Paris.
Mathers, C. (1998), Burden of Disease and Health System Costs of Heart Disease, Mental HealthProblems, and Musculoskeletal Disorders in Australia, Paper presented at the NHMRC NationalHealth Forum, Canberra.
McDowell, I., Newell, C. (1996), Measuring Health: A Guide to Rating Scales and Questionnaires,Oxford University Press, New York.
McWhinnie, J.R. (1982), “Measuring Disability,” OECD Social Indicator Development Programme, no.5.
Mossey, JM, Shapiro ES. (1982), “Self-rated health: a predictor of mortality among the elderly.” Am JPublic Health, 1982; 72: 800-8.
Mossialos, E. (1997) Citizens’ Views on Health Care Systems in the 15 Member States of the EuropeanUnion. Health Economics, Vol. 6: 109-116.
Murray C., Lopez A. (1996), Global Burden of Diseases, Harvard University Press, Boston,Massachusetts.
Nord, E. (1997), “Multi-Attribute Health Status Instruments and Calculation of Health Status Indices,”OECD Working Party on Social Policy, room document no. 3, December 1997, Paris.
OECD (1987), Financing and Delivering Health Care: A Comparative Analysis of OECD Countries,OECD Social Policy Studies, no.4, Paris.
Patrick, D.L., Erickson, P., (1993), “Applications of health status assessment to health policy.” In Qualityof Life and Pharmacoeconomics, Lippincott-Raven, Philadelphia.
Perenboom RJM, Boshuzien, H.C. Van de Water HPA. (1993), “Trends in health expectancies in theNetherlands, 1981 to 1990” In: Robine, JM, Mathers, CD, Bone MR, Romieu, I. Eds. Calculation ofhealth expectancies: harmonisation, consensus achieved and future perspectives. Montrouge: JohnLibbey Eurotext: 309-320.
Robine, JM., Mormiche P. (1993), “L’esperance de vie sans incapacite augmente”, INSEE Premiere, 281.
DEELSA/ELSA/WD(98)7
76
Robine, JM., Romieu, I., Cambois, E., van den Water, HPA., Boshuizen, HC, Jagger, C. (1994), GlobalAssessment in Positive Health: Contribution of the Network on Health Expectancy and theDisability Process to the World Health Report 1995 ‘Bridging Gaps.’ Montpellier: Laboratoired’Epidemiologie et d’Economie de la Sante.
Robine, JM., Mathers C., Brouard, N. (1996), “Trends and differentials in disability-free life expectancy:concepts, methods, and findings.” In: Caselli G., Lopez, A. (eds). (1996) Health and Mortalityamong Elderly Populations, Clarendon Press, Oxford, p. 182-201.
Rutstein, D., Berenberg, W., Chalmers, T.C., Child, C., Fishman, A., Perrin, E. (1976), “Measuring thequality of medical care: clinical method.” New England Journal of Medicine, 294: 582-9.
Rutstein, D.D., Berenberg, W., Chalmers, T.C., Child, C.G., Fishman, A.P., Perrin, E.B., Zuidema, G.D.,(1980), “Measuring the quality of medical care: second revision of table of indexes” New EnglandJournal of Medicine, 302: 1146.
Statistics Netherlands and Ministry of Welfare, Health and Cultural Affairs. (1992), Vademecum of healthstatistics of the Netherlands 1992. The Hague, SDU.
Sullivan D.F. (1971), “A single index of mortality and morbidity”, HSMHA Health reports, vol.86, no.4,347-354.
Sullivan, M., Karlsson, J., Ware, JE. (1994), SF-36 Halsoenkat: Svensk manual och tolkningsguide,Goteborg: Goteborgs Universitet och Sahlgrenska Sjukhuset.
TNO (1994), An International Comparison of Health Expectancies, report for Institute of PreventiveHealth Care, Netherlands.
United States Department of Health and Human Services (1996), Health in United States, Hyattsville,Maryland.
Van den Berg, J. (1997), Harmonisation of Health Indicators in European Union: Perceived HealthStatus, Prevalence of Disability and Specific Conditions, Room Document No. 7, OECD, December1997.
Van Sonsbeek, J.L.A. (1991), “Self-rated health: methodological effects with self-rated health in healthinterview surveys”, Maandbericht gezondheidsstatistiek, 10(9): 15-23.
Verbrugge, L.M. (1989), “The twain meet: empirical explanations of sex differences in health andmortality”, J Health Soc. Behav. 30: 282-304.
Ware, JE. et al. (1993), SF-36 Health Survey Manual and Interpretation Guide. Health Assessment Lab:Boston.
Weinberger, M, Darnell, JC, Tierney, WM, Martz, BL, Hiner, SL, Barker, J, Neill, PJ. (1986), “Self-ratedhealth as a predictor of hospital admission and nursing home placement in elderly public housetenants”, Am J Public Health, 76: 457-9.
DEELSA/ELSA/WD(98)7
77
Wilkins, R., J. Chen, and E. Ng (1994), “Changes in health expectancy in Canada from 1986 to 1991”, inAdvances in Health Expectancies: Proceedings of the 7th meeting of the International Network onHealth Expectancy (REVES), Canberra, February 1994.
World Bank (1993), Investing in Health: World Development Indicators, World Development Report,Oxford University Press, New York.
WHO (1958), The First Ten Years. The Health Organisation. World Health Organisation, Geneva.
WHO (1980), International Classification of Impairments, Disabilities and Handicaps , Geneva.
WHO, European Region & Central Bureau of Statistics in the Netherlands (1996), Health interviewsurveys: towards international harmonisation of methods and instruments. Copenhagen: WHORegional Publication European Series no. 58.
Worning, Anne-Marie, (1994) “Strategies for Reduction of Hospital-Acquired Infections: A Model forQuality Development,” Health: Quality and Choice, OECD Health Policy Studies No. 4.
DEELSA/ELSA/WD(98)7
78
ADDENDUM 1. ADL INSTRUMENTS FOR THE MEASUREMENT OF GENERAL HEALTHSTATUS AND DISABILITY
OECD Instrument, 1976 (Mc Whinnie, 1982)
Short-term disability:
During the past two weeks, did you have to cut down on any of the things you normally do (about thehouse, at work or in your free time), because of illness or injury
Long-term disability items:
* Is your eyesight good enough to read ordinary newspaper print (with glasses if usuallyworn)
Is your eyesight good enough to see the face of someone from 4 meters
Can you hear what is said in a normal conversation with 3 or 4 persons (with hearing aid if usually worn)
* Can you hear what is said in a normal conversation with another person (with hearing aid ifusually worn)
* Can you speak without difficulty
* Can you carry an object of 5 kilos for 10 meters
Could you run 100 meters
* Can you walk 400 meters without resting
* Can you move between rooms
* Can you get in and out of bed
* Can you dress and undress
Can you cut your toenails
* Can you (when standing) bend down and pick up a shoe from the floor
Can you cut your own food (meat, fruits)
Can you both bite and chew on hard foods
* Included in 10 item minimum core set
Response categories:
Yes, without difficulties; yes with minor difficulties; yes, with major difficulties; no, not able
DEELSA/ELSA/WD(98)7
79
WHO-CBS instrument, 1990 (WHO-CBS, 1996)
Self-perceived health:
How is your health in general Very good, good, fair, bad, very bad
Activity Restriction:
Think about the two weeks ending yesterday, have you cut down on any of the things you usually do(about the house, at work or in your free time), because of illness or injury.
How many days
On how many of these days were you in bed for all or most of the day.
Think about the two weeks ending yesterday, have you cut down on any of the things you usually do(about the house, at work or in your free time), because an emotional or mental health problem.
How many days
On how many of these days were you in bed for all or most of the day.
Handicap:
Mobility Permanently confined to bed even with help to get up Yes/no
Sit in a chair all day even with help to walk Yes/no
Confined to house, flat and garden Yes/no
Disability:
Locomotion Furthest you can walk without resting
or stopping or severe discomfort few steps<200 meters<more
Transfer Can you get in and out of bed on your own
Can you get in and out of a chair
Dressing Can you dress and undress
Washing Can you wash hands and face
Feeding Can you feed yourself including cutting up food
Toilet Can you get to and use toilet
Answer modalities Without difficulty, with some difficulties, with someone to help me
Continence Do you ever lose control of your bladder
at least once a week; less than once a week; less than a month
Hearing Is your hearing good enough to follow TV program (with hearing aid if necessary) with acceptable volume for others; with volume turned up; no
Seeing Can you see well enough to recognise the face of a friend at distance (with glasses or contact lenses if necessary) at a distance of 4 meters; of 1 meters; no
DEELSA/ELSA/WD(98)7
80
Optional Items
Stairs Can you walk up and down a flight of 12 stairswithout resting
yes, if hold on and takerest/no
Retrieval Can you (when standing) bend to pick up a shoefrom the floor
yes/no
Speaking Can you speak without difficulty yes/no
DEELSA/ELSA/WD(98)7
81
ADDENDUM 2. SOURCES FOR TABLE 14: PREVALENCE OF HOSPITAL-ACQUIREDINFECTIONS IN SELECTED COUNTRIES
Australia McLaws, Mary-Louise, Gold, J., King, K., Irwig, L., Berry, G., The prevalence ofnosocomial and community-acquired infections in Australian hospitals, The MedicalJournal of Australia, 149, December 1988. All hospitals with 50 or more acute carebeds -- excluding psychiatric and rehabilitation beds -- were invited to participate inJuly 1984 -- 269 out of 459 hospitals participated. Classification of infections wereadapted from those of SENIC and NSIH studies in US and UK, respectively (seefootnotes 24 and 36).
Belgium Mertens, R. et al. The national prevalence survey of nosocomial infections inBelgium, 1994. Journal of Hospital Infection, 9, 219-229, 1987. A prevalencesurvey was conducted among hospitals (acute care with either a surgical or intensivecare department ranging from less than 100 beds to over 600) willing to participate atthe end of March 1984. Classification of infections were based from CDC guidelinesand those used in SENIC project (see footnote 26 and Centers for Disease Control,Outline for Surveillance and Control of Nosocomial Infections, US Department ofHealth and Human Services--Public Health Service. Appendix I, 1972).
Czechoslovakia Sramova, H. et al. National prevalence survey of hospital-acquired infections inCzechoslovakia, Journal of Hospital Infections, 11, 328-334, 1988. A one dayprevalence survey was conducted in seven regions of the Czech Socialist Republicinvolving 12, 260 patients in 23 hospitals including two teaching hospitals, threeregional hospitals, and 18 district hospitals ranging in size from 213 to 1183 beds.Performed the first two weeks in October 1984, using classifications developed byWHO requirements (WHO, Surveillance,control, and prevention of hospital-acquirednosocomial infections. Report of an Advisory Group. Geneva, World HealthOrganisation, 1981).
Denmark Jepsen, O. and Mortensen, N. Prevalence of nosocomial infection and infectioncontrol in Denmark, Journal of Hospital Infection (1980) 1, 237-244. Twoprevalence surveys were conducted in 1978 and 1979 (eight months apart). Thesecovered 25 hospitals, 20 of which participated in both surveys. Guidelines forclassification were based on the Centers for Disease Control definitions (CDC,1972).
DEELSA/ELSA/WD(98)7
82
France Report of the Enquete Nationale de Prevalence des Infections Nosocomiales, June1997 -- Secretariat d’Etat a la santé et a la securite sociale and Comite Techniquenational des Infections Nosocomiales. A one day prevalence survey in all of thepublic and private institutions that were willing to participate was conducted in May-June 1996. All activities of hospitalisation were considered in the survey: short-term, medium-, long-term stays and psychiatric services. Classification were basedon number of sources including issues du Conseil superieur d’hygiene publique deFrance parues dans le Bulletin epidemiloque hebdomadaire (BEH) en juin 1992;CDC 1988 definitions; au guides des definitions du CCLIN Paris-Nord.
Germany Ruden, H, et al. Nosocomial and Community-Acquired Infections in Germany.Summary of the Results of the First National Prevalence Study (NIDEP), Infection25 (1997). Strict CDC definition was used, only counting the “certain”nosocomialinfections and not the probable ones as other prevalence studies did. Kampf, G. et al.Analysis of risk factors for nosocomial infections--results from the first nationalprevalence survey in Germany (NIDEP study, part 1), Journal of Hospital Infection(1997) 37, 103-112. Known as the NIDEP study (Nosocomial Infections inGermany -- Surveillance and Prevention), which was 10 month study in 1994.Hospitals were randomly selected from the 1992 National Hospital Registeraccording to size and location.
Italy Moro, M.L. Stazi, M.A., Marasca, G., Greco, D. and Zampieri, A., NationalPrevalence survey of hospital-acquired infections in Italy, 1983. Journal of HospitalInfection, 8, 72-85, 1986. A one-day prevalence survey was conducted amonghospitals willing to participate. Classification of hospital infections were based onCDC guidelines 1972.
Norway Hovig, B., Lystad, A., and Opsjon, H. A Prevalence Survey of Infections amongHospitalised Patients in Norway, NIPH Annals, Vol. 4, No. 2, December, 1981.Aavitsland, P., Stormark, M., and Lystad, A. Hospital-acquired infections inNorway: A National Prevalence Survey in 1991. Scand J Infect Dis 24: 477-483,1992. The 1991 study performed in one day on April 25, 1991. All Norwegiansomatic acute care hospitals and speciality hospitals for orthopaedics, rheumatology,oncology, and lung diseases were included; 76 out of 84 fully participating with atotal of 14,977 patients. Used CDC guidelines for classifying infections. Thenumber of patients surveyed in each hospital ranged from 0 to 1245 patients.Prevalence rate is not a true rate as it is measured by infections in numerator andpatients in denominator.
Spain Vaque, J. et al. Nosocomial infections in Spain: Results of Five Nationwide SerialPrevalence Surveys (EPINE Project, 1990 to 1994), Infection Control and HospitalEpidemiology, Vol. 17, No. 5, 1996. Known as the EPINE Project, five nationwideserial prevalence survey from 1990-1994. A convenience sample of acute carehospitals where they voluntarily participated -- a core sample of 74 hospitals, whichparticipated in all five surveys included a mean of 23,871 patients per year. Surveywas conducted every year during a 2-week period in May. Guidelines were thosedefined by CDC. Prevalence rate of patients with nosocomial patients (number ofpatients with nosocomial infections*100/all patients surveyed).
DEELSA/ELSA/WD(98)7
83
England andWales/UnitedKingdom
Meers, P.D., Ayliffe, G.A.J, Emmerson, A.M., Leigh, D.A., Mayon-White, R.T.,Mackintosh, C.A., Stronge J.L., Report on the National Survey of Infection inHospitals 1980. J Hospital Infection 1981; 2: Suppl 1-51. Emmerson, A.M. et al.The Second National Prevalence Survey of Infection in Hospital, Journal of HospitalInfection, Vol. 32, 175-90, 1996. The 1980 study included only England and Walessurveying 43 teaching or district hospitals with more than 500 beds. The 1993-1994study, including Republic of Ireland, performed over a 15-month period betweenMay 1993 to July 1994 in a two-month study period. Study examined 157 hospitalsand 37,111 patients. The number of patients surveyed in each hospital ranged from11 and 781. All hospitals interested in participating in the survey were encouraged.Larger hospitals were only asked to sample a per centage. It should be noted that 30per cent of patients examined were over 75 years of age.
DEELSA/ELSA/WD(98)7
84
LABOUR MARKET AND SOCIAL POLICY OCCASIONAL PAPERS
Most recent releases are:
No. 35 WHAT WORKS AMONG ACTIVE LABOUR MARKET POLICIES: EVIDENCE FROM OECDCOUNTRIES’ EXPERIENCES (1998) John Martin
No. 34 MEASURES OF JOB SATISFACTION - WHAT MAKES A GOOD JOB? EVIDENCE FROM OECDCOUNTRIES (1998) Andrew E. Clark (available in French)
No. 33 SOCIAL AND HEALTH POLICIES IN OECD COUNTRIES: A SURVEY OF CURRENT PROGRAMMESAND RECENT DEVELOPMENTS [Text and Annex] (1998) D.W. Kalisch, T. Aman and L. A. Buchele
No. 32 THE GROWING ROLE OF PRIVATE SOCIAL BENEFITS (1998) Willem Adema and Marcel Einerhand
No. 31 KEY EMPLOYMENT POLICY CHALLENGES FACED BY OECD COUNTRIES (1998) OECDSUBMISSION TO THE G8 GROWTH, EMPLOYABILITY AND INCLUSION CONFERENCE - London, 21-22 February 1998
No. 30 PRIVATE PENSIONS IN OECD COUNTRIES - FRANCE (1997) Emmanuel Reynaud (available in French)
No. 29 OECD SUBMISSION TO THE UK LOW PAY MISSION (1997)
No. 28 OECD SUBMISSION TO THE IRISH NATIONAL MINIMUM WAGE COMMISSION (1997)
No. 27 CHILDCARE AND ELDERLY CARE: WHAT OCCUPATIONAL OPPORTUNITIES FOR WOMEN? (1997)Susan Christopherson
No. 26 THE CONCENTRATION OF WOMEN’S EMPLOYMENT AND RELATIVE OCCUPATIONAL PAY: ASTATISTICAL FRAMEWORK FOR COMPARATIVE ANALYSIS (1997) Damian Grimshaw and Jill Rubery
No. 24 TRENDS IN SECRETARIAL OCCUPATIONS IN SELECTED COUNTRIES (1980-95) (H. Steedman) (1997)
No. 23 PRIVATE PENSIONS IN OECD COUNTRIES - AUSTRALIA (1997) Hazel Bateman and John Piggott
No. 22 THE DEFINITION OF PART-TIME WORK FOR THE PURPOSE OF INTERNATIONAL COMPARISONS(1997) Alois van Bastelaer, Eurostat; Georges Lemaître, OECD; Pascal Marianna, OECD (available inFrench)
No. 20 OCCUPATIONAL CLASSIFICATION (ISCO-88): CONCEPTS, METHODS, RELIABILITY, VALIDITYAND CROSS-NATIONAL COMPARABILITY (1997) Peter Elias
No. 19 NET PUBLIC SOCIAL EXPENDITURE (1996) Willem Adema, Marcel Einerhand, Bengt Eklind, JórgenLotz and Mark Pearson
A complete list of available papers can be found on the internet site: http://www.oecd.org/els/papers/papers.htm, through whichrecent papers can be accessed directly. To receive a paper copy of this list or any particular papers, please send your name,organisation and full address to:
Labour Market and Social Policy Occasional PapersDirectorate for Education, Employment, Labour and Social AffairsOECD, 2, rue André-Pascal, 75775 PARIS CEDEX 16, FRANCE
Mailing List for free of charge Labour Market and Social Policy Occasional PapersPlease include the following name on the mailing list:
(write in capitals)
Name -------------------------------------------------------------------------------------------