1 Who is more naïve? High or low trustors? Huojun Sun·Yefeng Chen Abstract Past studies find that individuals with a high degree of generalized trust think others are like them (i.e. false consensus) and easily tend to trust others too much, causing them to be cheated too often and thereby underperform. However, a series of experiments implemented by Yamaigishi and his co-authors suggest that high-trustors “rationally” collect more experience through trusting more. As a result, they are better at predicting others’ trustworthiness compared to low-trustors. Using the experiment of repeated trust game, this paper aims at investigating whether high-trustors actually predict their partner’s trustworthiness more correctly than do low-trustors and also plans to identify which factor exactly drives this difference. Our study reveals that both high- and low-trustors could correctly learn whom to trust over time, as indicated by their differential trusting behavior according to their partner’s trustworthiness. Moreover, compared to their low counterparts, high-trustors are better at predicting others’ trustworthiness only because they are less betrayal averse and thereby more keen to acquire information about others’ actions. Key words False consensus effect·Repeated trust game·Predicting trustworthiness·Betrayal aversion JEL Classification C72·C91·D03 “One has to venture into a tiger’s cave to steal a baby tiger.” —A Chinese Proverb _________________________ We thank Professor Maria Bigoni, Marco Casari, and other participants of the 2013 ESA World Meeting in Zurich, the 2013 IACM in Tacoma, the 2013 Workshop on Behavioral and Experimental Economics in Florence, the 2013 IMEBE in Madrid, and the 2013 EDLE seminar in Rotterdam. We are grateful to Haoli Zheng, Daqiang Huang and Shu Chen for assistance in conducting the experiments. Financial support from the National Social Science Foundation of China(13AZD061) and the Fundamental Research Funds for the Central Universities(SSEYI201201) is gratefully acknowledged. _________________________ Huojun Sun Department of Economics, University of Bologna, Piazza Scaravilli 2, 40126, Bologna, Italy; Institute of Law & Economics, University of Hamburg, Hamburg, Germany, and Rotterdam Institute of Law & Economics, Erasmus University Rotterdam, The Netherlands. Yefeng Chen College of Economics and Interdisciplinary Center for Social Sciences, Zhejiang University, 38 Zheda Rd., Hangzhou 310027, China
Transcript
1
Who is more naïve? High or low trustors?
Huojun Sun·Yefeng Chen
Abstract Past studies find that individuals with a high degree of generalized trust think others are like them (i.e. false consensus) and easily tend to trust others too much, causing them to be cheated too often and thereby underperform. However, a series of experiments implemented by Yamaigishi and his co-authors suggest that high-trustors “rationally” collect more experience through trusting more. As a result, they are better at predicting others’ trustworthiness compared to low-trustors. Using the experiment of repeated trust game, this paper aims at investigating whether high-trustors actually predict their partner’s trustworthiness more correctly than do low-trustors and also plans to identify which factor exactly drives this difference. Our study reveals that both high- and low-trustors could correctly learn whom to trust over time, as indicated by their differential trusting behavior according to their partner’s trustworthiness. Moreover, compared to their low counterparts, high-trustors are better at predicting others’ trustworthiness only because they are less betrayal averse and thereby more keen to acquire information about others’ actions. Key words False consensus effect·Repeated trust game·Predicting trustworthiness·Betrayal aversion JEL Classification C72·C91·D03 “One has to venture into a tiger’s cave to steal a baby tiger.”
—A Chinese Proverb _________________________ We thank Professor Maria Bigoni, Marco Casari, and other participants of the 2013 ESA World Meeting in Zurich, the 2013 IACM in Tacoma, the 2013 Workshop on Behavioral and Experimental Economics in Florence, the 2013 IMEBE in Madrid, and the 2013 EDLE seminar in Rotterdam. We are grateful to Haoli Zheng, Daqiang Huang and Shu Chen for assistance in conducting the experiments. Financial support from the National Social Science Foundation of China(13AZD061) and the Fundamental Research Funds for the Central Universities(SSEYI201201) is gratefully acknowledged. _________________________ Huojun Sun Department of Economics, University of Bologna, Piazza Scaravilli 2, 40126, Bologna, Italy; Institute of Law & Economics, University of Hamburg, Hamburg, Germany, and Rotterdam Institute of Law & Economics, Erasmus University Rotterdam, The Netherlands.
Yefeng Chen College of Economics and Interdisciplinary Center for Social Sciences, Zhejiang University, 38 Zheda Rd., Hangzhou 310027, China
2
1. Introduction
In the past decades, a number of studies have shown that trust is essential to the effective functioning of social, financial, and political systems. It is crucial for the health, harmony and growth of any organization (Kramer, 1998), the ability of firms to grow larger (La Porta, et al. 1997), the size of a country's stock market (Guiso, et al. 2008), as well as maintaining low levels of political corruption (La Porta, et al. 1999) and a fully functioning democracy (Fukuyama, 1995; Sullivan and Transue, 1999). A remarkable positive and monotonic relationship at the aggregate level between trust and economic performances of nations has also been documented and gained wider acceptance in economics (Knack and Keefer, 1997; Putnam, 1993). However, although trust in general is beneficial to the society at large, it may be relatively costly at the individual level. Investigating the correlation between individual degrees of generalized trust - the default assessments of the likely trustworthiness of others - and individual economic performances using data from the European Social Survey, Butler et al. (2012a) find a remarkable hump-shaped relationship: people with both low and high levels of trust have significantly lower incomes than those with intermediate levels of trust - the “right amount of trust” that maximizes an individual’s income. In addition, it also reports that the great heterogeneity in trust beliefs across individuals, coupled with the tendency of individuals to form beliefs about others based on their own level of trustworthiness (i.e. false consensus effect1), generates the non-monotonic relationship between trust and income. In particular, highly trustworthy individuals think others are like them and easily tend to form beliefs that are too optimistic, consequently causing them to be cheated more often and ultimately perform less well than those who hold the intermediate level of trustworthiness; on the other hand, individuals with low level of trustworthiness form beliefs that are too conservative, thereby giving up profitable trade opportunities too often and, consequently, depressing their economic performances. To complement the survey evidence, Butler et al. (2012b) conducted a repeated version of the standard trust game experiment of Berg et al. (1995) in the laboratory. In their experiment, since subjects’ roles, acting as investors or trustees, are randomly reassigned in each round, a measure of subjects’ own initial trustworthiness when acting as the role of trustee could be defined for a large majority of subjects, nearly 75%. In the meantime, within each round every subject’s belief about other people’s trustworthiness is elicited using the strategy method2, regardless of the role they have been assigned. Interestingly, a strikingly high correlation between subjects’ trust beliefs and their own trustworthiness is reported, suggesting that trust beliefs are 1 Starting from the seminal paper by Ross, et al. (1977), a vast social psychological literature has reported the false consensus effect. Usually, it is defined that people, when forming expectation concerning other people’s decision, weigh their own decision more heavily than that of a randomly selected persons from the same population. For a detailed discuss, see Engelmann and Strobel (2000). 2 In experimental studies, there are two different methods of eliciting decisions: one is the direct-response method, in which subjects make decisions whenever it is their time to do so; the other is the strategy method, in which subjects make contingent decisions for all nodes at which they may have to play. For a survey of these two experimental methods, see Brandts and Charness (2011).
3
formed by extrapolating from one’s own type.3 Moreover, this correlation is highly persistent even after several rounds of game play. This false consensus makes most (least) trustworthy subjects tend to form overly-optimistic (overly-pessimistic) trust beliefs and, consequently, both extreme types earn 18% less than subjects with properly-calibrated beliefs on average. The findings reported above are contradictory, however, with recent studies on the trust development revealing that high-trustors may be able to take more social risks early in their relationship than can low-trustors because such social risks are frequently adaptive and tend to yield more fruitful results for high-trustors (Pillutla, et al. 2003; Weber, et al. 2005; Weber and Murnighan, 2008). Normally, high-trustors are more likely to engage in market interaction, where they may be vulnerable to opportunistic behavior by dishonest individuals, and are therefore cheated more often, however, these individuals could also gradually predict their partner’s types more correctly through more trusting 4 and take fuller advantage of profitable trade opportunities, consequently, the material rewards from greater market participation may compensate for the material disadvantages from foregoing lucrative expropriation opportunities in the long-term perspective (Adriani and Sonderegger, 2013). These sights have been powerfully supported by a series of experiments implemented by Yamagishi and his co-authors (Yamagishi, et al. 1999; Yamagishi and Kakiuchi, 2000; Yamagishi, 2011). In Yamagishi and Kakiuchi’s (2000) experiment, two conditions are used: one condition is a standard iterated prisoner’s dilemma (PD) game in which each participant anonymously plays a PD game with the same partner for 48 rounds; the second condition is what they call the “tiger’s cave game” where the two participants have an additional choice, in addition to the ordinary behavior choice between cooperation and defection, of enlarging or reducing their own payoffs in the payoff matrix. If participants expect their partner to cooperate, it is better to enlarge their own payoff. Otherwise, it is better to reduce it. The choice of payoff size is thus used to measure the development of the participants’ trust in their partner. The results of their experiment show that, compared to high-trustors, the trustors with a low degree of generalized trust initially are highly insentive to information revealing lack of trustworthiness of the interaction partner (i.e. the defection choice), but after incurring a painful loss they become oversensitive and hesitate to increase the payoff size even after the partner’s cooperation. Consequently, low-trustors earn significantly less than do high-trustors, the evidence that is at odds with Butler et al.’s findings showing that high-trustors also fail to predict the trustworthiness of their partners correctly and then underperform, together with their low counterparts. How can one reconcile these contradictory findings? We argue that although both 3 Since the strategy method is used by the authors to elicit both the subjects’ trust beliefs about others and their own trustworthiness for each of ten possible transferred amounts, it is more likely that this method itself may drive the subjects to form their trust beliefs based on their own trustworthiness level. 4 Most economic models assume that the distribution of traders’ types within a population is common knowledge. This implies that it is not necessary for trustors to learn their partner’s types through trials and errors. However, the assumption that trustors are able to observe the distribution of trustees’ types within the population is clearly artificial and leaves no space for Bayesian learning, which does not truly reflect reality.
4
studies reveal important insights into the study of trust learning or predicting trustworthiness, these two paradigms have their weaknesses. In the Butler, et al. (2012b) paradigm, subjects’ roles for each period are randomly reassigned, which hinders the subjects to estimate the stable distribution of their partner’s types, as a result, the false consensus effect is naturally and repeatedly observed in their study, whereas in the Yamagishi and Kakiuchi (2000) study, since subjects play the tiger’s cave game with the same partner for many periods, high-trustors may predict their partner’s trustworthiness better due to their more trusting experience relative to the low-trustors, however, the complex strategic scenario easily produces other confounding factors (such as subjects’ reputation considerations and high-order belief inferences), which prevents the researchers from obtaining a precise prediction. To address the methodological limitations in the previous studies, our paper employs a modified repeated binary-choice trust game (Camerer and Weigelt, 1988; Bohnet, et al. 2010). In our multiple trust game setting, for each session, initially, all of 20 subjects are asked to play the role of trustee and their decisions are elicited using the strategy method. Inspired by Fetchenhauer and Dunning (2012), we let a computer randomly divide these trustees into two groups, specifically, in one of the groups at least 50% of subjects choose to reciprocate if trusted by their partners while in the other group the percentage of trustworthy trustees is less than 50%. Then, all of 20 subjects are asked to play the trust game in the role of trustor for 20 periods and for each period, each trustor is randomly matched with one trustee picked up from the above groups. Contrary to Butler et al. (2012b), the distribution of trustworthy trustees in our setting, especially in a given trustee group, is fixed but unknown to the trustors. And it is very important to note that in some of our treatments, the trustors now have an incentive to trust their partners to identify which group is the high trustworthiness group. Although the false consensus effect among the trustors is still observed in the first period of the repeated trust game, which is the main contribution reported in Butler, et al. (2012b), it disappears quickly over time in our paper. Our experimental design also allows us to avoid the strategic manipulations between subjects and to minimize the role of high order inference, while these factors may affect the experimental results in Yamagishi and Kakiuchi (2000). This paper complements the literatures on trust learning or predicting trustworthiness and aims at investigating whether the high-trustors are better at predicting others’ trustworthiness. If the high-trustors actually estimate their partner’s types more accurately than the low-trustors, our study also investigates the reason why this happens, and considers the alternative possibilities: (i) high-trustors are better than low-trustors at processing the statistical information in general (i.e. Bayesian learning ability); (ii) high-trustors are better at processing information on the reliability of their potential partner in a specific task (i.e. repeated trust games); (iii) high-trustors are better at detecting reliable partners because they trust more and thus collect more experience (i.e. the rational trusting model suggested by Yamagishi and his coauthors5); (iv) high-trustors are better at detecting reliable partners because 5 Yamagishi (2001; 2011) has theorized that high-trustors, who assume more social risks and are,
5
they are less betrayal or regret averse and have a higher willingness to acquire more information about their partner’s types. Our main contribution, therefore, is to identify the exact reason why the high-trustors predict their partner’s trustworthiness more correctly than the low-trustors do. Here we report our main results: first, although the false consensus effect is observed in the first period, it disappears very quickly because subjects learn whom to trust; second, both low- and high-trustors correctly decode each partner’s inclination to reciprocate over time, as indicated by their differential trusting behavior according to their partner’s trustworthiness; finally, compared to their low counterparts, high-trustors are better at predicting others’ trustworthiness only because they are less betrayal averse and thereby more keen to acquire information about others’ actions. The remainder of this paper is organized as follows: Section 2 lays out the closely related literatures that discuss the theories of “green beard effect”, and the studies of trust learning in repeated trust games; Section 3 describes our experimental design; Section 4 reports the experimental results; Section 5 concludes with legal policy implications.
2. Closely related literature
Economic relationships cannot be governed entirely by formal contracts or institutions, leaving space for opportunistic behavior. This highlights the importance of trust and trustworthiness in sustaining efficient economic transactions. As Rousseau et al. (1998) suggested trust is best defined as “a psychological state comprising the intention to accept vulnerability based upon positive expectations of the intentions or the behavior of another” (p. 395). According to this widely shared definition, if A trusts B, she must have good reasons supporting her to hold right positive beliefs about others. One possible reason is that trustors can read their partner’s (non)verbal cues of reciprocating intentions. And it is highly related to the literature on “green beard effect” (Dawkins, 1976; Frank, 1988, 2005; West and Gardner, 2010). According to the perspective of “green beard effect”, altruists typically have observable characteristics (e.g., a green beard) that distinguish them from non-altruists, and other altruists, who also have this unique feature, can recognize them and treat them preferentially. In the recent behavioral studies, target subjects are usually allowed to play a computer-mediated one-shot Prisoner’s Dilemma game for real money, and their pictures are taken at the very moment of decision-making. Among these pictures, the “standard” pictures that are equated for background, brilliance and luminance, and more or less equal in size are randomly selected and presented to observers (Yamagishi, et al. 2003; Verplaetse, et al. 2007). These studies reveal that the therefore, more vulnerable to exploitation, collect more differentiating social data and learn more. In contrast, by defending themselves from possible exploitation, low-trustors seem to be cynical to other people: they severely underestimate their fellow participants’ trustworthiness, in that it leads them to refrain from trusting, and pass up likely monetary gains, therefore, in the absence of differentiating social data, they learn less about distinguishing trustworthy from untrustworthy partners.
6
observers can accurately discriminate non-cooperative pictures from cooperative ones based on the quick nonverbal impressions. Frank, et al. (1993) and Brosig (2002) give subjects the opportunities to communicate with their partners in a separate room for a certain time period ranging from 10 to 30 minutes before playing a one-shot two-person prisoner’s dilemma game and ask them to predict the decision of their opponents. As a result, they find that subjects are able to predict their partner’s play with an accuracy rate above chance. Stated differentially, Frank, et al. (1993) find an accuracy of 11 percentage points above chance and Brosig (2002) 8 percentage points above chance. Moreover, a similar study has also revealed that, after watching a TV show on prisoner’s dilemma games, female perceivers who are substantially more cooperative are also better at identifying cooperators in the real games (Belot, et al. 2012). The most common paradigm to test the readability of (non)verbal cues on trustworthiness is the standard trust game (Berg, et al. 1995). Using the trust game experiments, several studies have demonstrated a causal effect of facial cues (male facial width, for instance) on trusting behavior, with subjects investing significantly more real money in partners with trustworthy-looking faces who, normally, are more likely to reciprocate their counterpart (van’t Wout and Sanfey, 2008; Stirrat and Perrett, 2010). In the real world, in order to correctly predict trustworthiness, people are engaging not only in acquiring the physical cues of their partners, but also in utilizing their past experience of social interactions, including the positive or negative experience (i.e. reciprocated or betrayed experience). The previous studies have shown that information about an interaction partner’s moral character (Delgado, et al. 2005a; Mikolajczak, et al. 2010), the specific direct feedback from partner (Chang, et al. 2010), the experienced social information (Fareri, et al. 2012), and the behavioral histories of partners (Rezlescu, et al. 2012), coupled with facial cues could influence the subjects’ capability of predicting trustworthiness. To avoid confounding effects of physical cues and quantitative information (the direct feedback or statistical information from partners, for instance) on evaluating trustworthiness, our study exclusively focuses on the role of the quantitative information in generating the behavioral differences between high- and low-trustors. Specifically, our paper complements the studies of “green beard effect” that mainly concentrate on the effect of (non)verbal cues on identifying trustworthy trustees. The second literature branch to which this study contributes is the theories of reinforcement or associative learning in repeated trust games. Typically, these theories claim that, to learn accurate reinforcement rate, people normally track associability that reflects the extent to which each cue has previously been accompanied by surprise, and this associability manipulates learning rates dynamically, accelerating learning to cues whose predictions are poor and decelerating it when predictions become reliable (i.e. error-driven learning, see Camerer and Ho, 1999; Erev and Roth, 1998; Sutton and Barto, 1998). 6
6 An alternative to reinforcement learning is belief-based learning, positing that players believe that their opponent’s action is drawn from a fixed but unknown distribution and then form and update
7
Neuroimaging studies (O’Doherty, et al. 2004; Tricomi, et al. 2004) have shown that the striatum, a part of a neural circuit, is critically involved in learning from prediction errors for reinforcement. Moreover, a study of reward-related probability learning has revealed that, as cues learned through trial and error begin to be predictable, the activation in the striatum in response to the reward feedback diminishes (Delgado, et al. 2005b). A similar finding has been obtained in a repeated-interaction trust game where subjects face the same partner and gradually learn whether their partner is trustworthy through experience. Over time, as the prediction of their partner’s action becomes more reliable, the activation in the striatum decreases (King-Casas, et al. 2005). As Camerer, Ho, and Chong (2002) argue, the simple trial and error learning models miss important features when dealing with repeated strategic games, because there may coexist adaptive learners and sophisticated learners: the adaptive learners adjust their behavior in a trial and error way while sophisticated learners could detect the regularity in the adaptive learners’ choices to predict what action the adaptive learner is going to choose next and exploit that knowledge by choosing the best-reply response. Moreover, an even more cognitively sophisticated player could not only track the opponent’s actions, but also incorporate knowledge of how one’s own actions influence the opponent’s strategy, thereby manipulating their counterpart’s belief by choosing a strategic scenario that gives them the highest discounted net present value (Hampton, et al. 2008; Coricelli and Nagel, 2009; Yoshida, Dziobek, et al. 2010; Yoshida, Seymour, et al. 2010). However, there is still a hot debate whether the sophisticated learners actually outguess their opponents using the recursive belief inferences, and more clean and consistent evidence is highly needed (Krol and Krol, 2010). To reduce the degree of strategic interaction and minimize the role of higher-order belief inference, subjects in Phan, et al. (2010) are randomly matched with three types of opponents (20 trials with each type) to play multiple periods trust games. Specifically, all of active subjects in the lab are assigned to play the role of trustor, and told that they will be playing with other players who have previously participated in the same game as counterparts (i.e. trustees) and whose responses were previously recorded and now serve as counterparts’ “reactions” to their decisions - this particular setting leaves no space for trustors to manipulate the beliefs of their partner by strategic actions. In addition, subjects are also told that they will play with three types of counterparts who were classified based on their previously recorded actions as: (1) type 1: “tend to split the money more than 50% of the time”; (2) type 2: “tend to split the money about 50%”; and (3) type 3: “tend to split the money less than 50% of the time”. Unbeknown to the subjects, however, they actually play with the computer-simulated agent with different preprogrammed strategies. Once subjects
first-order beliefs regarding the likelihood of future actions of opponents (Fudenberg and Levine, 1998). Recently, using a specific strategic game structure, Zhu et al. (2012) have successfully separated the relative contributions of belief and reinforcement inputs in strategic learning. However, Camerer et al. (2002) argue that belief learning and reinforcement learning, essentially, are not different especially when the difference in using the information about “foregone payoffs” of strategies that are not chosen is not so large between these two learning models.
8
choose their decision, regardless of their choosing to invest or keep the money, feedback about their partner’s previously recorded choice is provided immediately to the subjects. Using functional MRI (fMRI), it finds that the activation in the striatum of the subjects appears selectively in response to partners who have consistently returned the investment (i.e. high type partners) and is absent for partners who lack a reputation for reciprocity (i.e. low type ones); meanwhile, subjects correctly decode each partner type’s inclination to reciprocate, as indicated by subjects’ differential investment behavior according to their partner’s type. And learning occurs rapidly, with differential investing based on partner type observed on average by the fifth trial, and stabilizing thereafter. Naturally, it is very necessary to examine who are the subjects who are able to learn the reinforcement rate of the corresponding partner type more accurately and rapidly. Van den Bos, et al. (2011) employ the similar structure of experimental design used by Phan, et al. (2010),7 where three age groups, namely late childhood, mid-adolescence and young adulthood, are recruited to play the multiple trust games with predetermined three-type trustees. As a result, it reveals that subjects of all age groups perceive the three type partners differing significantly in their trustworthiness, and increasingly trust the most trustworthy partner the most and the least trustworthy the least, suggesting that subjects of all ages are able to learn to trust and distrust their partner based on their past experience. To further investigate the age differences, it finds that the children do no change their strategies significantly over time, while adults and adolescents manage to trust the high type partners more, and the low type ones less, over time. In fact, Phan and his colleagues (Sripada, et al. 2009) have examined the behavioral differences in response to the actions made by three different fictional partner types between the generalized social anxiety patients and matched healthy control subjects, finding that subjects in both groups choose to invest rather than keep more frequently when playing with the high trustworthy partners. However, although they do not examine the group differences in the time trend of subjects’ behavior, using fMRI, they find that relative to healthy controls, the medial prefrontal cortex, a key brain region involving in sensing others’ mental states (i.e. “theory of mind”, see McCabe, et al. 2001; Frith and Frith, 2006), exhibits less engagement during mentalizing in individual with social anxiety. This finding is in agreement with other studies revealing that psychotic patients fail to utilize quantization information from their partners in the standard trust game (Fett, et al. 2012) and that borderline personality disorders and autism spectrum disorders are insensitive to the social reputation and 7 There are two main differences in experimental design between these two studies: contrary to Phan, et al. (2010), the subjects in van den Bos, et al. (2011) are told that the other player makes his or her decision through an Internet connection in real time but in reality the choice is made by the computer program and is displayed after a variable delay 2-4 seconds; secondly, the photographs of partners of the same age and gender are presented to the subjects. However, as been argued above, sensing the possibility of repeated strategic interactions, the subjects may apply the recursive belief inferences to outguess their partners, making the experimental environment more complex. In addition, the previous studies have shown that the partners’ facial features influence economic choices even when people have access to the information about the general trustworthiness of their interaction partner (Rezlescu, et al. 2012), or to their partners’ specific direct behavioral feedback (Chang, et al. 2010).
9
fail to repair the cooperation in the repeated trust game (King-Casas, et al. 2008; Izuma, et al. 2011; for a review, see Kishida, et al. 2012).8 Our paper complements these studies of dynamic trust learning and mainly examines the capability differences in predicting trustworthiness between high- and low-trustors. However, in contrast to the previous studies, particularly to the studies based on the framework of Phan, et al. (2010), our experimental design allows us to achieve progress in two methodological issues. First, in the previous studies, in order to obtain three different types of trustees - a particular situation that may not arise naturally with high probability, researchers deliberately deceive the participant with regards to the partner with whom he or she is matched. Although some kinds of deception are very necessary for psychologists especially when the experiment itself really requires that subjects’ behavior in the lab situation resembles the behavior they might display in the real-world situation, normally, there is no need for deception in economic experiments because the strategic game context is highly abstract and well-constructed (Ariely and Norton, 2007). Moreover, the deception in experiments could evoke suspicion and mistrust in participants, which may dramatically change participants’ behavior in experiments, and even in future experiments (Hertwig and Ortmann, 2001; Jamison, et al. 2008; for a thorough review, see Ortmann and Hertwig, 2002). 9 Instead, in our multiple trust game setting described above, we successfully create two types of trustees (i.e. high and low trustworthiness groups) without deceiving the subjects. Second, in the framework of Phan, et al. (2010), trustors are always informed about the decision of their partner immediately after they decided whether or not to trust that person. Based on this artificial non-contingent feedback, all types of trustors (different age groups, for example) are able to learn quickly about their partner’s trustworthiness, and adapt their behavior accordingly. We extend the previous setting to cover another situation where trustors receive their partner’s feedback only when they decide to trust their partners, a more realistic phenomenon that exactly exists in the real world (Fetchenhauer and Dunning, 2010), and examine whether this new condition exhibits more significant behavioral differences in trust learning between high- and low-trustors.10 Since the informative feedback facilitates trustors to adapt their behavior, it is important to note that trustors have an incentive to make more trusting decisions in the first several periods of the game to maximize the informativeness of the feedback. Recently, a neuroimaging study (Krueger, et al. 2007) has revealed that a high activation in the paracingulate cortex(PcC), a brain region frequently implicated in conflict monitoring and cognitive control in social interactions (Baumgartner, et al. 2008), is observed among the sophisticated trustors 8 Recent psychological studies (Harbaugh, et al. 2002; Kishida, et al. 2012; Sutter & Kocher, 2007) have shown that adults (or healthy people) have higher levels of general trust compared to children (or disorders). 9 In fact, several subjects are always unavoidably removed for further analysis in the previous studies, although no detailed reasons are specified, for example, 3 out of 64 subjects in Chang, et al. (2010), 2 out of 60 in van’t Wout and Sanfey (2008), 2 out of 18 in Rezlescu, et al. (2012), and 1 out of 14 in Delgado, et al. (2005a) are removed. 10 In fact, in order to identify which factor actually drives the behavioral differences in trust learning between high- and low-trustors, we also introduce two other conditions, see Section 3.
10
when exploiting trusting strategies more often in the early stage of the trust game, then it gradually diminishes across stage, reflecting behaviorally that the sophisticated trustors stabilize their trusting strategies in the following stage while the opposite pattern is observed among the unsophisticated trustors. Therefore, high-trustors are expected to trust more in the first several periods than do low-trustors in this contingent feedback condition and to behave better in predicting trustworthiness.
3. Experimental design
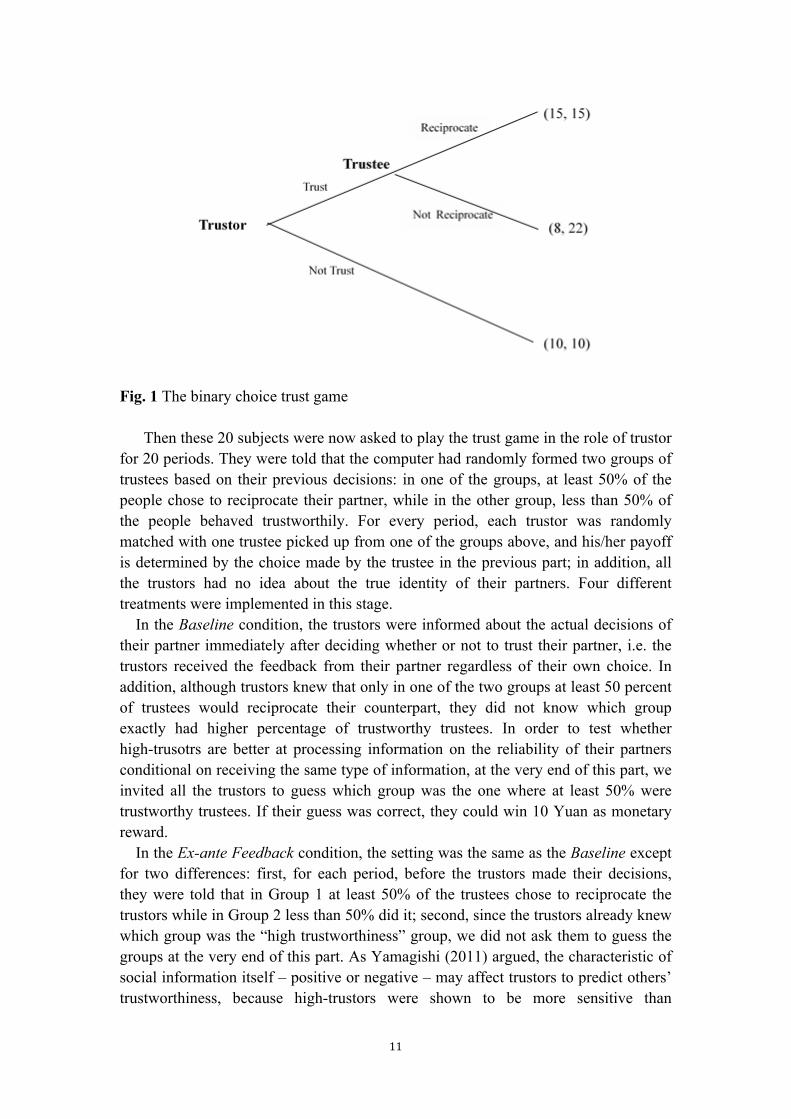
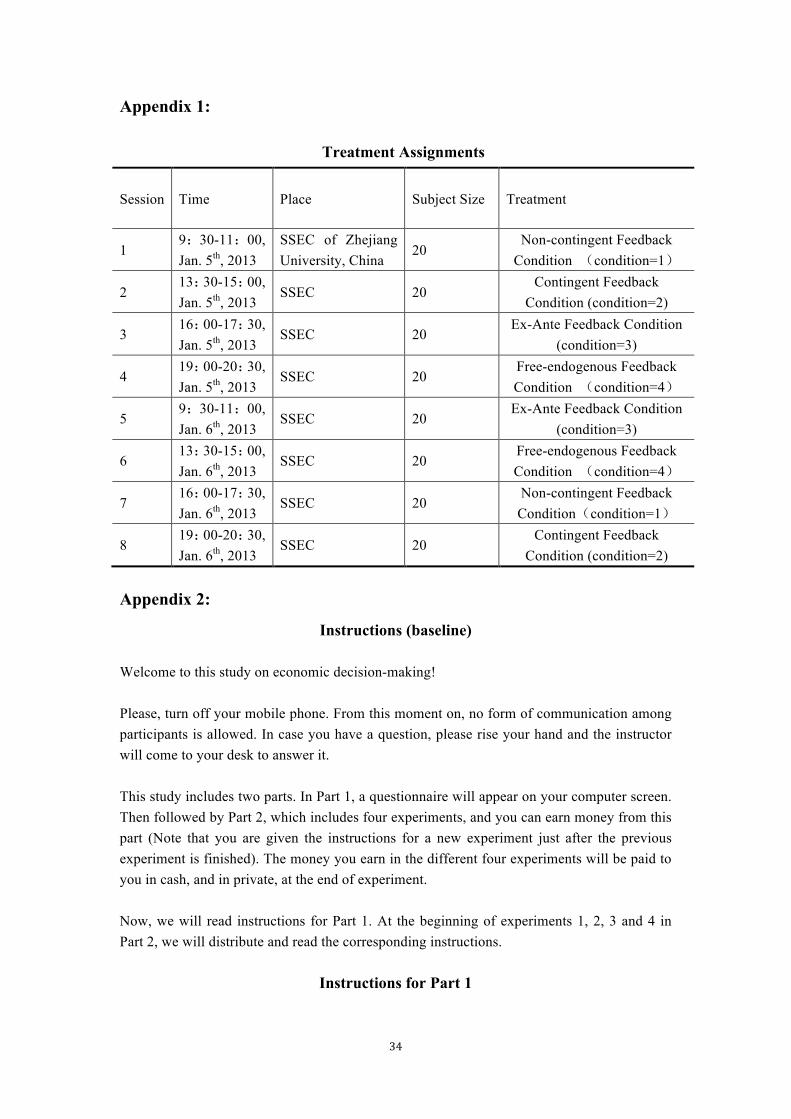
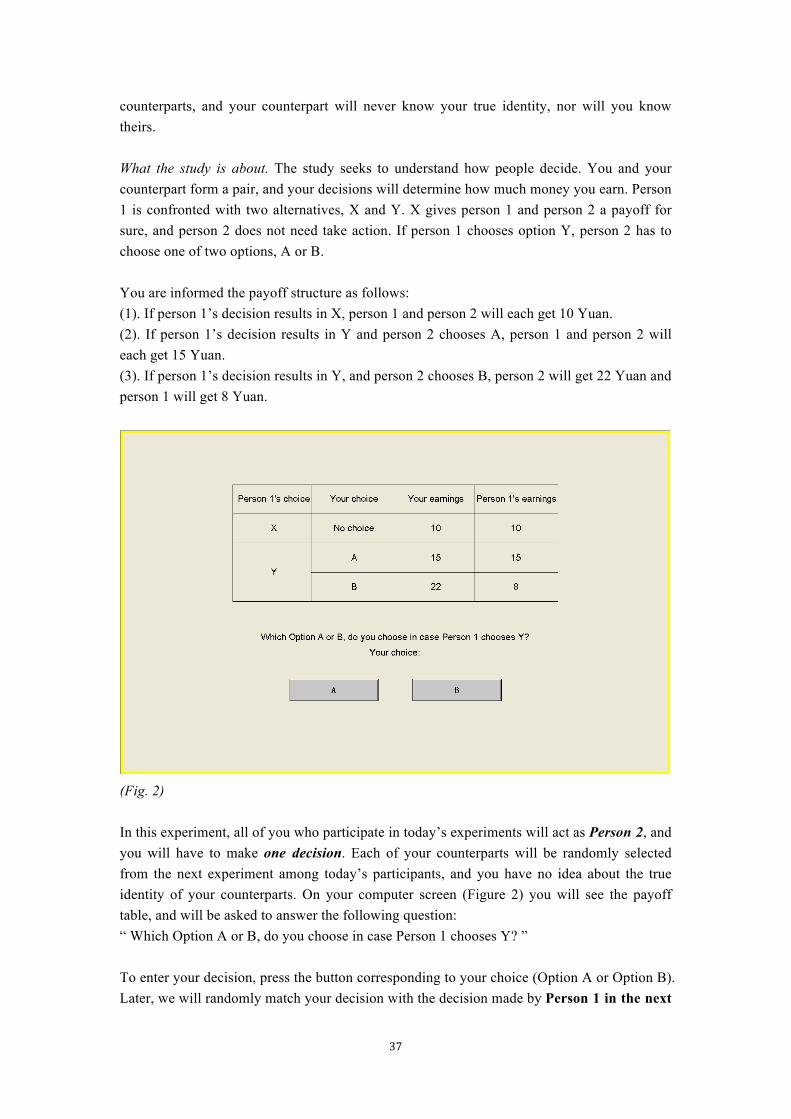
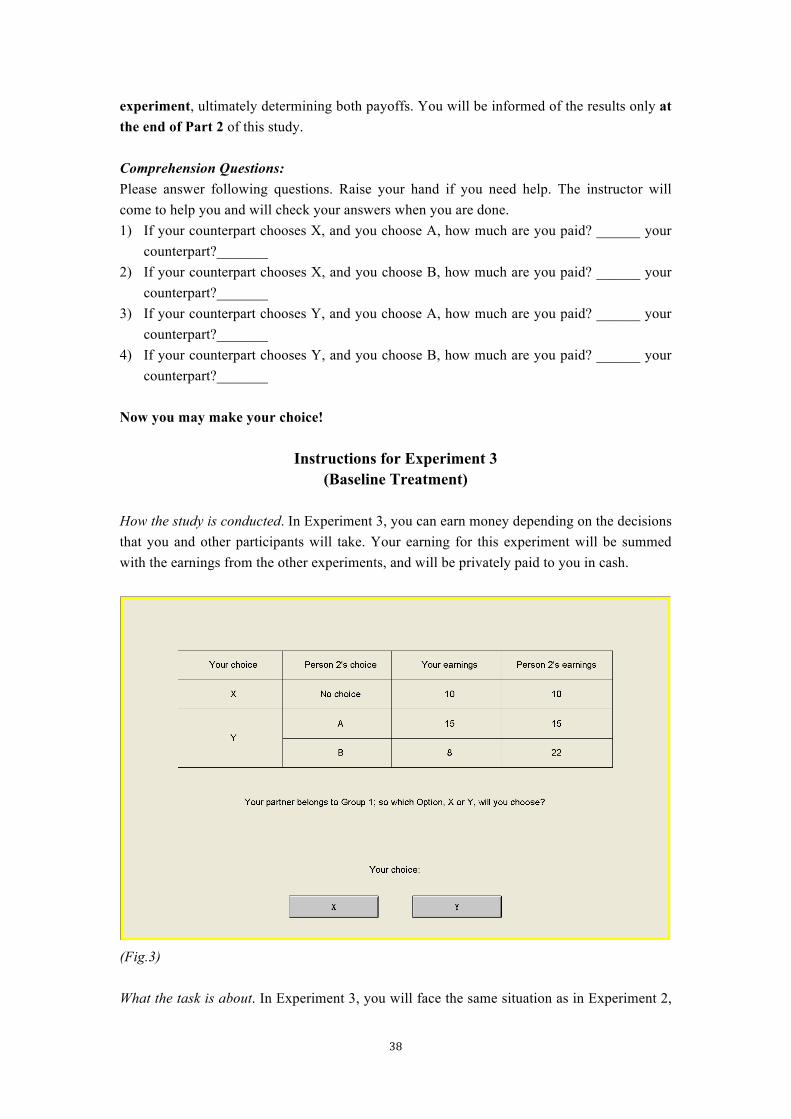
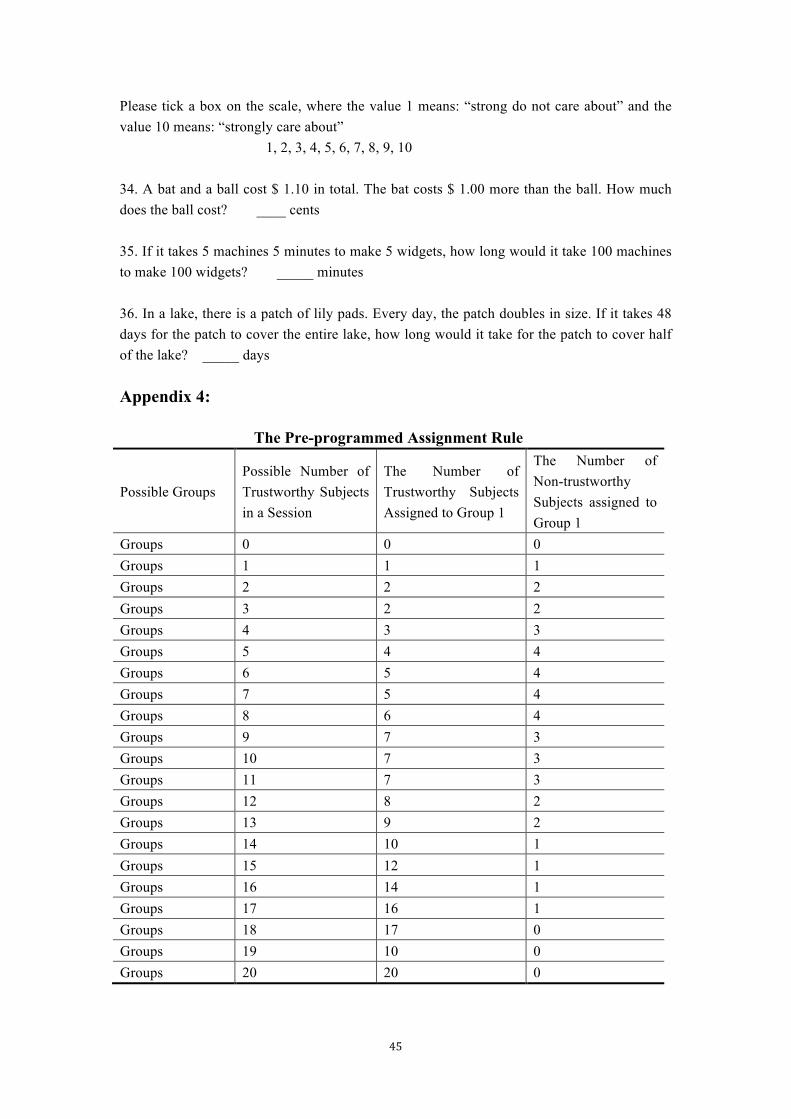
Since a series of experiments implemented by Yamagishi and his co-authors (Yamagishi, et al. 1999; Yamagishi and Kakiuchi, 2000; Yamagishi, 2011) have revealed that high-trustors are better at predicting others’ trustworthiness relative to low-trustors, our paper aims at identifying which factor exactly makes high-trustors detect their partner’s types more accurately than low-trustors do. Therefore, in our experiment we introduced four treatments and 8 sessions, two for each treatment (see Appendix 1). For each session, all 20 subjects were introduced a binary-choice trust game. The trust game involved a trustor who decided whether to trust the trustee. If the trustor chose not to trust the trustee, both of them would get 10 Yuan. If the trustor chose to trust, the trustee had to make a decision whether to reciprocate the trustor. When the trustee reciprocated his/her partner, both of them could get 15 Yuan; otherwise, the trustor got 8 Yuan while the trustee got 22 Yuan (see Figure 1). 11 Subjects were next told that they would be taking part in an actual trust game in which they played as the role of trustee in one-shot time. Their responses were elicited using the strategy method, in other words, they were asked which decisions they would choose if trusted by their partners.1213 After all the trustees made their decisions, unbeknownst to them, the computer randomly formed two groups, according to the pre-programmed assignment rule (see Appendix 4). In the “High-trustworthiness” group, more than 50% of subjects chose to reciprocate, while in the “Low-trustworthiness” group strictly less than 50% chose to reciprocate.14
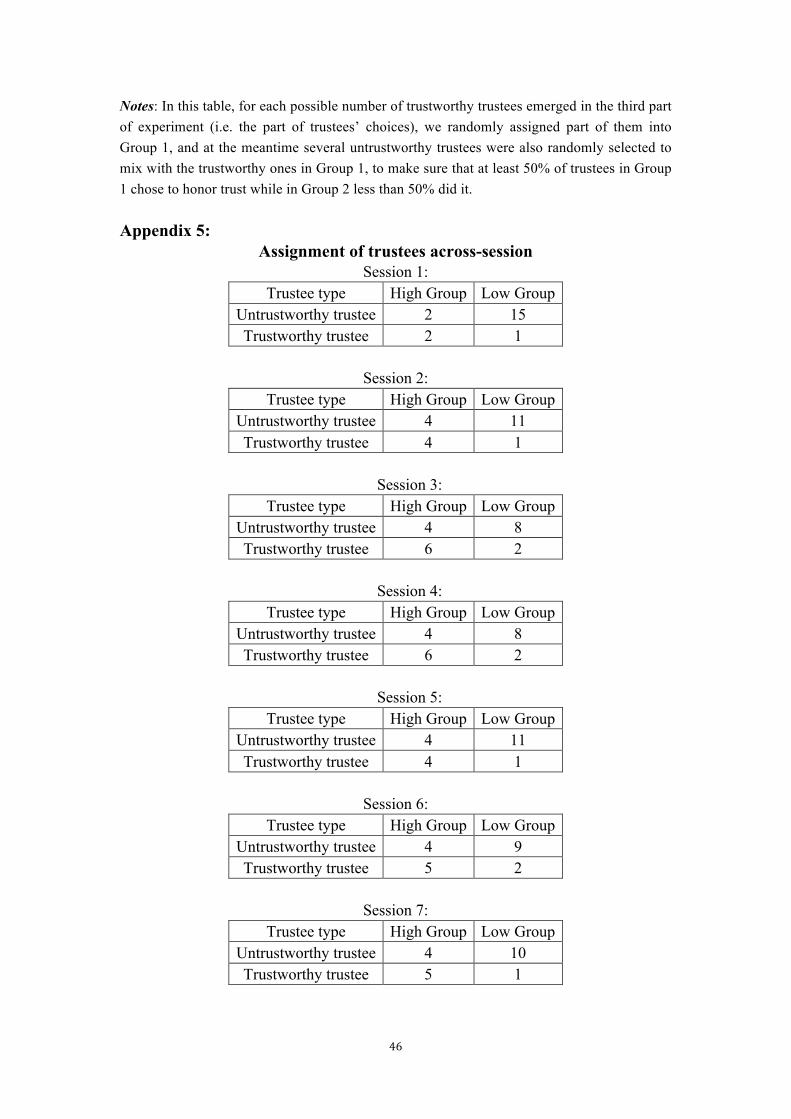
11 The payoff structure of our binary-choice trust game is replicated from Bohnet and Zeckhauser (2004) and Bohnet et al. (2008, 2010). And the instructions only contain neutral framing. 12 Although the strategy method has been shown to significantly decrease the trustees’ trustworthiness in trust game, it yields the similar percentage of trusting behavior compared with the direct-response method (Casari and Cason, 2009). Therefore, fortunately, using the strategy method will not weaken our results because we mainly focus on the trustors’ behavior in this paper. 13 Similarly to Guillen and Ji (2011), subjects in our non-standard ordering setting are neither given information on their partners nor told that all subjects will play as trustor in the next Part of the experiment. And our results on trustees’ trustworthiness levels do not qualitatively differ from previous studies using the strategy method in a standard ordering. 14 Here notice that it would have been impossible to form two groups of equal size. The final allocations of trustworthy and untrustworthy subjects between two groups can be found in Appendix 5.
11
Fig. 1 The binary choice trust game
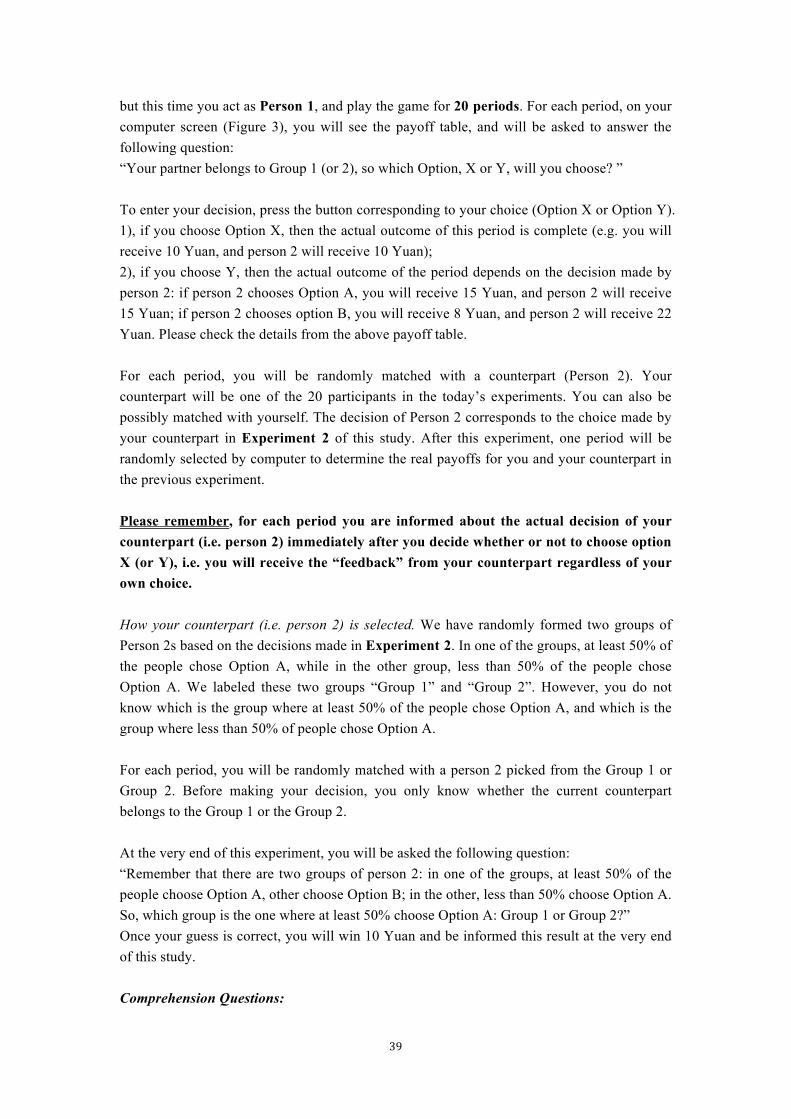
Then these 20 subjects were now asked to play the trust game in the role of trustor for 20 periods. They were told that the computer had randomly formed two groups of trustees based on their previous decisions: in one of the groups, at least 50% of the people chose to reciprocate their partner, while in the other group, less than 50% of the people behaved trustworthily. For every period, each trustor was randomly matched with one trustee picked up from one of the groups above, and his/her payoff is determined by the choice made by the trustee in the previous part; in addition, all the trustors had no idea about the true identity of their partners. Four different treatments were implemented in this stage. In the Baseline condition, the trustors were informed about the actual decisions of their partner immediately after deciding whether or not to trust their partner, i.e. the trustors received the feedback from their partner regardless of their own choice. In addition, although trustors knew that only in one of the two groups at least 50 percent of trustees would reciprocate their counterpart, they did not know which group exactly had higher percentage of trustworthy trustees. In order to test whether high-trusotrs are better at processing information on the reliability of their partners conditional on receiving the same type of information, at the very end of this part, we invited all the trustors to guess which group was the one where at least 50% were trustworthy trustees. If their guess was correct, they could win 10 Yuan as monetary reward. In the Ex-ante Feedback condition, the setting was the same as the Baseline except for two differences: first, for each period, before the trustors made their decisions, they were told that in Group 1 at least 50% of the trustees chose to reciprocate the trustors while in Group 2 less than 50% did it; second, since the trustors already knew which group was the “high trustworthiness” group, we did not ask them to guess the groups at the very end of this part. As Yamagishi (2011) argued, the characteristic of social information itself – positive or negative – may affect trustors to predict others’ trustworthiness, because high-trustors were shown to be more sensitive than
12
low-trustors to information which may potentially reveal their partner’s trustworthiness. Compared to the Baseline condition, therefore, this condition allowed us to examine the heterogeneity in sensitivity to social information between high- and low-trustors and its role on their ultimate performance given the prior knowledge about their partner groups. In the Contingent Feedback condition, the setting was the same as the Baseline except that the trustors were now informed of the choice made by their partner only when they decided to trust that person. This condition allowed us to test the Yamagishi’s rational trusting model, i.e. high-trustors were better at detecting reliable partners because they “rationally” trusted more in the first several periods to collect more information about the others. And if no behavioral difference in the guessing task between high- and low-trustors emerged in the Baseline condition but a difference did emerge here, we could conclude that high-trustors were better at predicting trustworthiness because they acquired more information through more trusting, but not because they were better at processing this information. In the Free Endogenous Feedback treatment, the setting was the same as the Baseline except that, for each period, the trustors could always get feedback on their partner’s choice regardless of their own decision, but the information acquisition must be intentional. The design of this condition was motivated by a series of recent behavioral studies suggesting that the subtle psychological factors, such as betrayal or regret aversion, may modulate people’s trusting behavior (Bohnet and Zeckhauser, 2004, Behnet et al. 2008; Aimone and Houser, 2012)15. Moreover, in order to elicit the maximal possibility of betrayal or regret aversion, we adopted the “opt-in” rather than “opt-out” as a default option (Dana et al. 2007; Larson and Capra, 2009; Grossman, 2010). This condition allowed us to examine whether high-trustors were better at detecting reliable partners because they were keener than low-trustors to acquire information about others’ behavior. Each session, in addition to the repeated dyadic trust game, included a questionnaire, choices over lotteries, and a Bayesian updating experiment (the reasons to include these additional games will be explained later). The instructions were distributed before each part separately and were read out loud by the experimenter. Subjects’ questions, if any, were answered by the experimenter in private. To make sure that all subjects understood the rules of the experiments correctly, they had to complete a comprehension quiz with calculations and questions before making decisions in each part (a copy of the instructions is in the Appendix 2). To start with, all subjects were kindly asked to fill in a questionnaire including individual characteristics (gender, age, personality, background, etc.) and several questions measuring individual risk attitudes, time preferences, social preferences, and generalized trust (see Appendix 3). To avoid any demand effects and obtain the true generalized trust, we introduced several questions into the questionnaire to 15 Normally, when people trust another person and that person betrays their trust, they become painfully aware of that betrayal, and this “betrayal aversion” leads many trustors to avoid risk more when a person, rather than nature, determines the outcome of uncertainty; and at the same time, if people distrust another person and that person is actually a trustworthy person, trustors expect to feel regret and engage in avoiding to know that person’s choice.
13
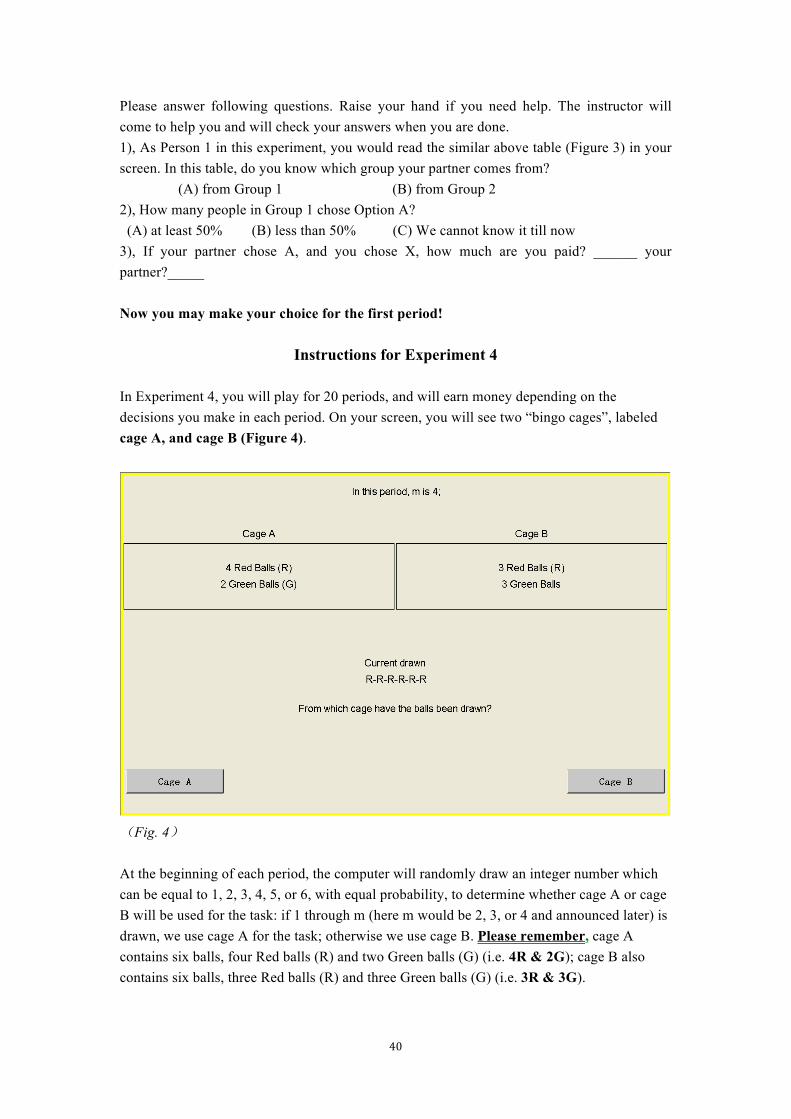
deemphasize the questions on trust. The most frequently used measure of generalized trust is taken from the General Social Survey (GSS) and the World Values Survey (WVS). Both surveys capture trust using the following question: Generally speaking, would you say that most people can be trusted or that you can’t be too careful in dealing with people? The survey respondents can answer in a binary way to this question by agreeing either with “Most people can be trusted” or with “Can’t be too careful.” This trust measure has been widely criticized by many social science scholars pointing out that a risk-averse or cautious person may share the view that “Most people can be trusted”, while at the same time prudence or risk aversion may induce the person to say “Can’t be too careful” because the person engages in avoiding small probability risks that have large payoff consequences (Miller and Mitamura, 2003; Fehr, 2009). In our study, we adopted “one-dimensional” questions (i.e. from question 25 to question 30 in the questionnaire) on trust developed by Yamagishi and his colleagues (Yamagishi et al. 1998; Yamagishi and Kosugi, 1999; Yamagishi and Yamagishi, 1994) 16 , because this new questionnaire has been demonstrated as a more reliable instrument for the measurement of generalized trust and has achieved highly predictive validity in several contexts (Carter and Weber, 2010). Based on the collected survey data, we built a trust belief index by taking the average answer to the set of Yamagishi’s trust questions, and split the subject pool into two categories: depending on the value of this index, subjects whose index is equal or above the median are labeled “high trustors” while the remaining subjects are labeled “low-trustors”. After finishing the questionnaire, subjects had to choose their most preferred options from the list of ten decisions in Figure 1 of the Appendix 2 (Holt and Laury, 2002). Each decision involved an option of a constant payoff outcome (i.e. 10 Yuan) and a lottery option having a higher payoff outcome (i.e. 25 Yuan) with probabilities ranging from 10% to 100%. For each subject, only one of the decisions was randomly selected and implemented for the real cash payment. Since the subjects’ risk attitudes may highly correlate with their generalized trust levels, it is very necessary to consider the effect of the subjects’ risk attitudes on trusting behavior when analyzing the capability differences in predicting trustworthiness between high- and low-trustors. After this lottery task, subjects participated in the trust game, and one of the four treatments discussed above was introduced in this part. At the end of the repeated trust game, all subjects were asked to play a Bayesian updating game (El-Gamal and Grether, 1995) for 20 periods. In this game, each subject saw two “bingo cages”, labeled cage A and cage B. Subjects were informed that cage A contained six balls, four Red balls (R) and two Green balls (G) (i.e. 4R & 2G) and cage B also contained six balls, three Red balls (R) and three Green balls (G) (i.e. 3R & 3G). At the beginning of each period, the computer randomly drew an integer number which could be equal to 1, 2, 3, 4, 5, or 6, with equal probability, to determine
16 The 6-item questionnaire with general statements to measure subjects’ beliefs about honesty and trustworthiness of others (see Appendix 3) is the English translation of Yamagishi and Kosugi’s (1999) Generalized Trust Scale, which we copy from Carter and Weber (2010).
14
whether cage A or cage B would be used for the task: if 1 through m (here m would be 2, 3, or 4 and announced later) was drawn, the computer used cage A for the task, otherwise it used cage B. The result of this draw was not revealed to the subjects. Then a specific value of m (m=2, 3, or 4) was randomly selected and announced, determining which cage was actually used for the following task. If cage A (or cage B) had been selected, six draws (with replacement) from this cage were performed, and the results (GGRRGG, for instance) were displayed on the subjects’ screens. Observing the results, subjects were asked to guess which cage was used to generate the observations on their screens. They did not receive any feedback about the correctness of each guess until the end of the last period. The participant with the highest score would be awarded 200 Yuan at the end of this study (if there were more than one participants who got the same highest score, the 200 Yuan prize would be shared equally among the winners). This Bayesian updating game facilitated us to examine the question whether high-trustors performed better in the repeated trust game than did low-trustors only because they were better at processing the statistical information in general (i.e. higher Bayesian learning abilities). The experiment involved 160 subjects, divided in 8 sessions (Appendix 1) and was conducted at Social Science Experimental Center (SSEC) of Zhejiang University, China. Subjects are mostly the undergraduate students at the Zhejiang University, and were recruited using poster pasted up on to university campus noticeboards. In addition to any amount earned in the experiment, each subject received 10 Yuan as a show up fee. About 48 percent of the subjects were male; nobody took part in more than one session. The experiment was programmed and implemented using the software z-Tree (Fischbacher, 2007). For each session, after showing up to the lab at the pre-scheduled session time, 20 qualified subjects17 were randomly assigned to a cubicle to avoid eye contact, and no communication was allowed during the experiment. The average session lasted about 1.5 hours. Subjects were paid privately in cash at the end of the session and earned on average 60 Yuan (i.e. nearly 7 Euros).
4. Experimental results
The results from this experiment suggest that, compared to their low counterparts, high-trustors are better at predicting others’ trustworthiness not because they are better at processing the general statistical information or information on the reliability of their partners or they “rationally” collect more information about others by trusting more, but because they are less betrayal averse and thereby more keen to acquire information about others’ actions. This section reports the main results. In Section 4.1 we present aggregate data across the treatments, which help us have a general description about the experiment. In Section 4.2 we focus on our main hypotheses and report the results for the last but the most important two parts (i.e. the trustors’ choices and the Bayesian updating task): first, we examine whether there exists a false
17 For each session, considering any unexpected absence of our subjects, more than 20 students were recruited, but only 20 students were randomly selected to participate in the experiments and other students were given the double show up fees (i.e. 20 Yuan) and left.
15
consensus effect in the first period and how it disappears; then we identify which factors induce the different ability in predicting trustworthiness between high- and low-trustors. In Section 4.3 we give an overview of the findings for the first two parts (i.e. the questionnaire and the Holt-Laury lottery task): we first show the distributions of high-trustors across the treatments, and then study the correlation between generalized trust and individual characteristics, which facilitates us to check whether there is a difference between high- and low-trustors in terms of the specific individual characteristics. In Section 4.4 we give an overview of the findings for the third part (i.e. the trustees’ choices), where we investigate which factors significantly affect the trustees’ decisions.
4.1 Aggregate data
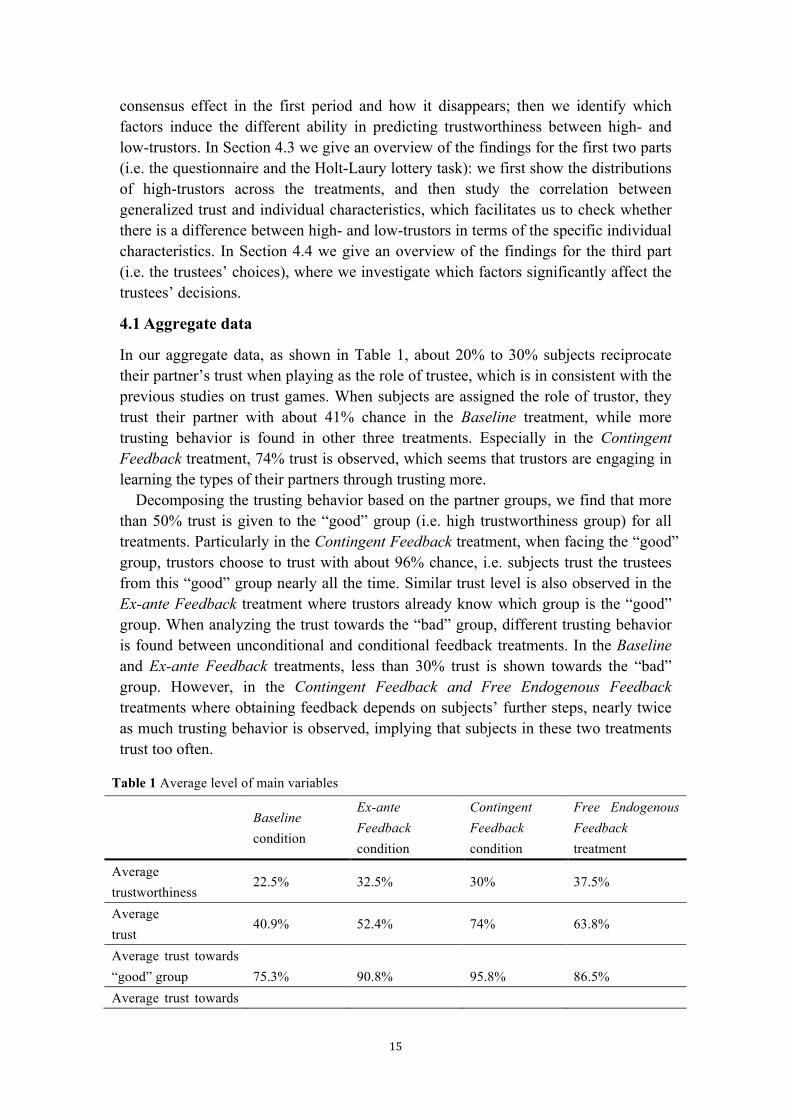
In our aggregate data, as shown in Table 1, about 20% to 30% subjects reciprocate their partner’s trust when playing as the role of trustee, which is in consistent with the previous studies on trust games. When subjects are assigned the role of trustor, they trust their partner with about 41% chance in the Baseline treatment, while more trusting behavior is found in other three treatments. Especially in the Contingent Feedback treatment, 74% trust is observed, which seems that trustors are engaging in learning the types of their partners through trusting more. Decomposing the trusting behavior based on the partner groups, we find that more than 50% trust is given to the “good” group (i.e. high trustworthiness group) for all treatments. Particularly in the Contingent Feedback treatment, when facing the “good” group, trustors choose to trust with about 96% chance, i.e. subjects trust the trustees from this “good” group nearly all the time. Similar trust level is also observed in the Ex-ante Feedback treatment where trustors already know which group is the “good” group. When analyzing the trust towards the “bad” group, different trusting behavior is found between unconditional and conditional feedback treatments. In the Baseline and Ex-ante Feedback treatments, less than 30% trust is shown towards the “bad” group. However, in the Contingent Feedback and Free Endogenous Feedback treatments where obtaining feedback depends on subjects’ further steps, nearly twice as much trusting behavior is observed, implying that subjects in these two treatments trust too often.
Table 1 Average level of main variables
Baseline condition
Ex-ante Feedback condition
Contingent Feedback condition
Free Endogenous Feedback treatment
Average trustworthiness
22.5% 32.5% 30% 37.5%
Average trust
40.9% 52.4% 74% 63.8%
Average trust towards “good” group
75.3%
90.8%
95.8%
86.5%
Average trust towards
16
“bad” group 26.5% 22.6% 58% 43.3% Notes: The average trustworthiness is calculated by the data from the third part of experiment (i.e. the trustees’ decisions) while average values of other three variables are calculated by the data from the forth part (i.e. the trustors’ decisions).
4.2 The last two parts: testing the alternative hypotheses
4.2.1 Information exchange
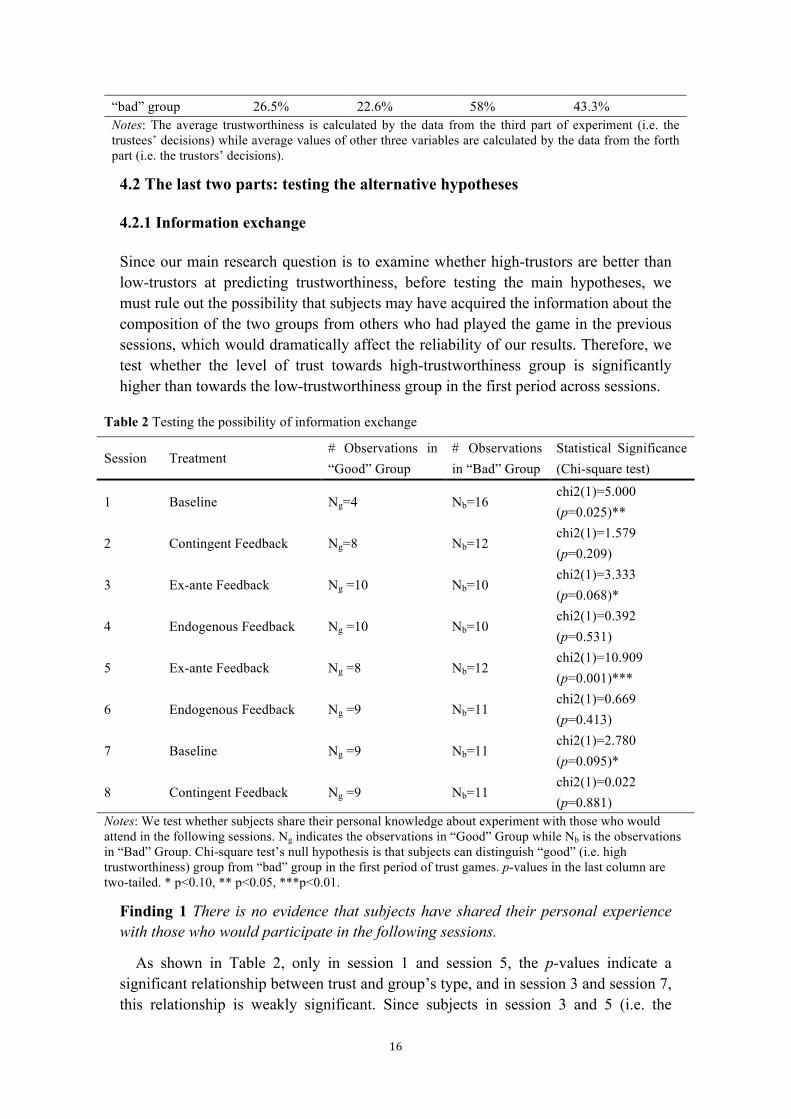
Since our main research question is to examine whether high-trustors are better than low-trustors at predicting trustworthiness, before testing the main hypotheses, we must rule out the possibility that subjects may have acquired the information about the composition of the two groups from others who had played the game in the previous sessions, which would dramatically affect the reliability of our results. Therefore, we test whether the level of trust towards high-trustworthiness group is significantly higher than towards the low-trustworthiness group in the first period across sessions.
Table 2 Testing the possibility of information exchange
3 Ex-ante Feedback Ng =10 Nb=10 chi2(1)=3.333 (p=0.068)*
4 Endogenous Feedback Ng =10 Nb=10 chi2(1)=0.392 (p=0.531)
5 Ex-ante Feedback Ng =8 Nb=12 chi2(1)=10.909 (p=0.001)***
6 Endogenous Feedback Ng =9 Nb=11 chi2(1)=0.669 (p=0.413)
7 Baseline Ng =9 Nb=11 chi2(1)=2.780 (p=0.095)*
8 Contingent Feedback Ng =9 Nb=11 chi2(1)=0.022 (p=0.881)
Notes: We test whether subjects share their personal knowledge about experiment with those who would attend in the following sessions. Ng indicates the observations in “Good” Group while Nb is the observations in “Bad” Group. Chi-square test’s null hypothesis is that subjects can distinguish “good” (i.e. high trustworthiness) group from “bad” group in the first period of trust games. p-values in the last column are two-tailed. * p<0.10, ** p<0.05, ***p<0.01.
Finding 1 There is no evidence that subjects have shared their personal experience with those who would participate in the following sessions.
As shown in Table 2, only in session 1 and session 5, the p-values indicate a significant relationship between trust and group’s type, and in session 3 and session 7, this relationship is weakly significant. Since subjects in session 3 and 5 (i.e. the
17
Ex-ante Feedback treatment ) have been told that in Group 1 at least 50% of the trustees chose to reciprocate the trust while in Group 2 less than 50% did it, it is not surprising to find that trustors can distinguish high trustworthiness group from low one even in the first period. We can also rule out that trustors in session 1 had any information about the composition of the two groups because they are the first participants who attend this experiment. Although a weakly significant difference in the levels of trust towards the two groups in the first period is observed in session 7, it vanishes dramatically in the next period (p=0.888, chi-square test with one degree of freedom), suggesting that the significant difference must have emerged by chance.
4.2.2 Trust learning
When there is no statistical information about trustees’ types available to trustors, as discussed above, trusting behavior in the first period is unselectively distributed in either high or low trustworthiness group. Is the subjects’ trusting behavior in the first period related with their own trustworthiness level in the previous part of the experiment (i.e. false consensus effect)?
Finding 2 In all treatments except the Ex-ante Feedback treatment, subjects are more likely to trust their partner in the first period if they behaved trustworthily in the previous part, and this effect is mainly contributed by low-trustors.
In order to examine the existence of the false consensus effect, researchers normally elicit subjects’ trust beliefs about their partners before playing the first period of trust game. However, many economists criticize the reliability of this elicitation method with or without monetary incentives. Avoiding the bias produced by this elicitation method, we focus on the relationship between subjects’ trusting behavior in the first period and their own trustworthiness level, finding that this relationship is significant (p=0.027, chi-square test with one degree of freedom). When separating high-trustors from low-trustors, we find that low-trustors are more likely to trust in the first period if they previously rewarded the trust in the role of trustee (p=0.03, chi-square test with one degree of freedom) while high-trustors’ behavior in the first period is not significantly correlated with their previous trustworthiness level (p=0.27, chi-square test with one degree of freedom), suggesting that the false consensus effect in the first period only happens among the low-trustors.18 Although trustors make their decisions based on their own trustworthiness levels in the first period, this phenomenon disappears very quickly. Naturally, it is very important to examine whether trustors could correctly decode each partner type’s inclination to reciprocate over time (i.e. trust learning), thereby hindering the effect of false consensus.
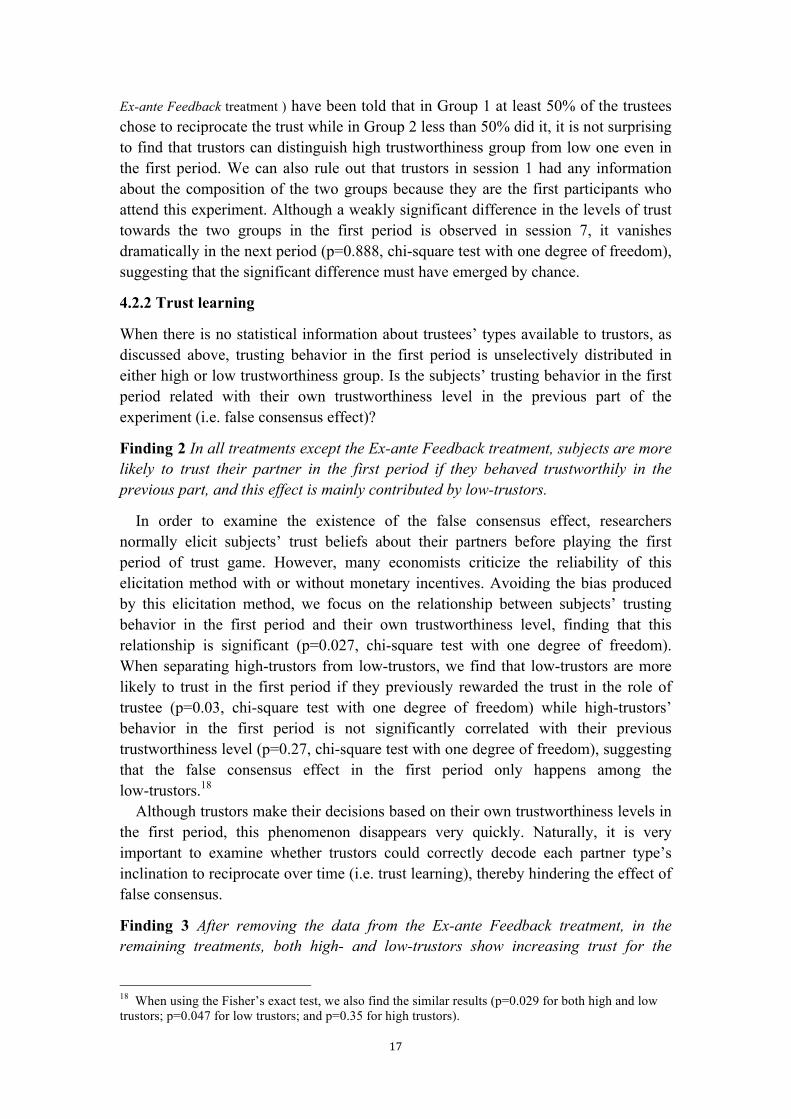
Finding 3 After removing the data from the Ex-ante Feedback treatment, in the remaining treatments, both high- and low-trustors show increasing trust for the
18 When using the Fisher’s exact test, we also find the similar results (p=0.029 for both high and low trustors; p=0.047 for low trustors; and p=0.35 for high trustors).
18
trustworthy type partners and decreasing trust for the untrustworthy type partners over time.
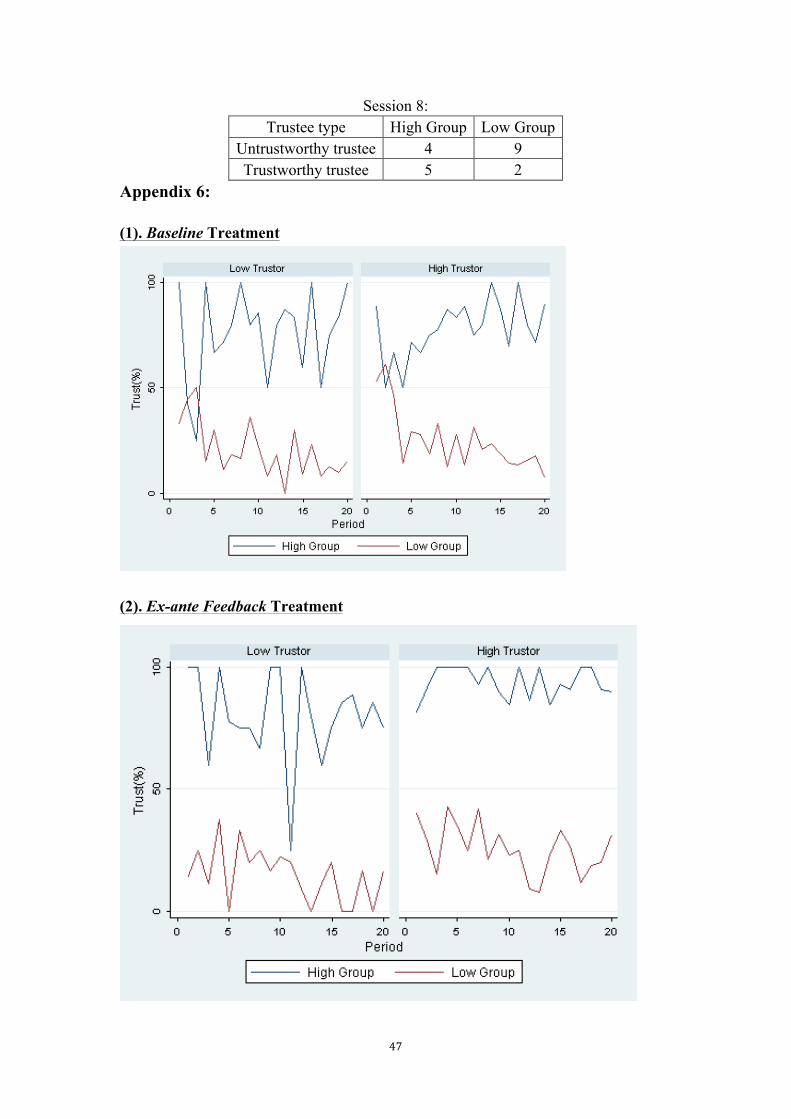
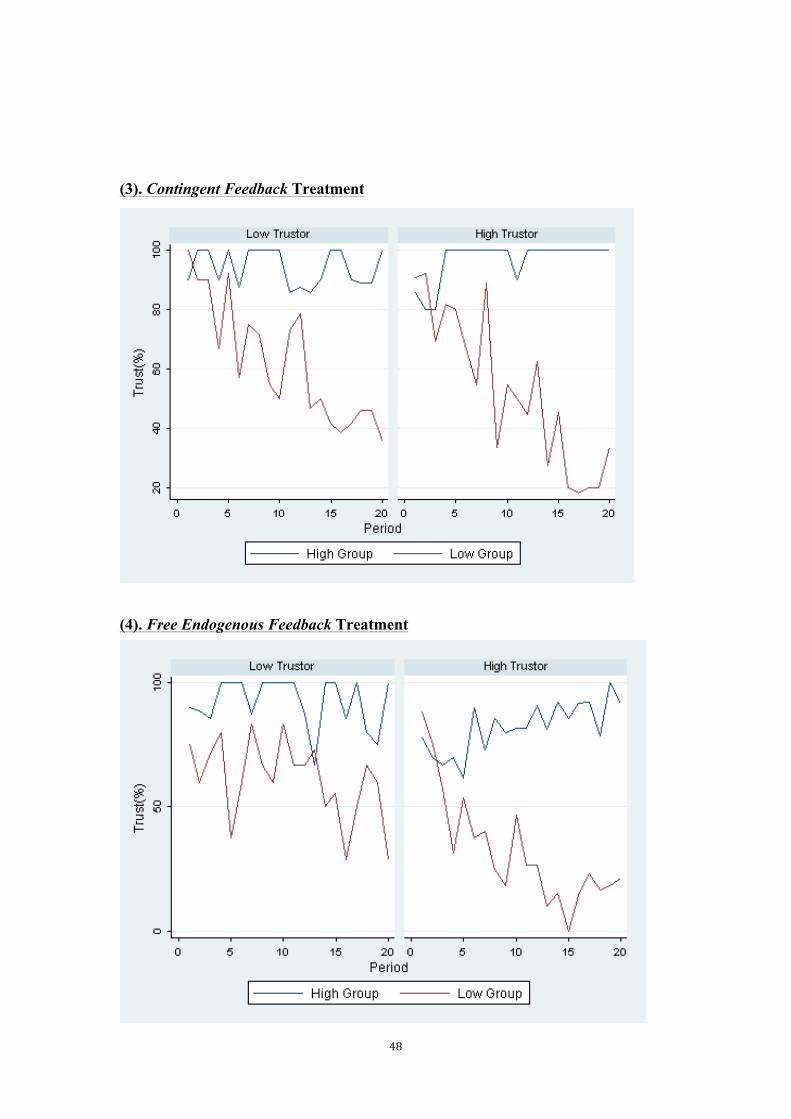
Fig. 2 Trust learning As shown in Figure 2, we find that both high- and low-trustors gradually distinguish the high trustworthiness group from the low one successfully after obtaining more experience, and this finding is also supported by the result of the non-parametric test (p=0, Wilcoxon signed-rank test19). And when we focus on subjects’ behavior in each treatment separately, this significant evidence reappears, suggesting that subjects in each treatment quickly achieve trust learning and then correctly recognize the high trustworthiness group (see the Figures in Appendix 6).
4.2.3 Testing main hypotheses
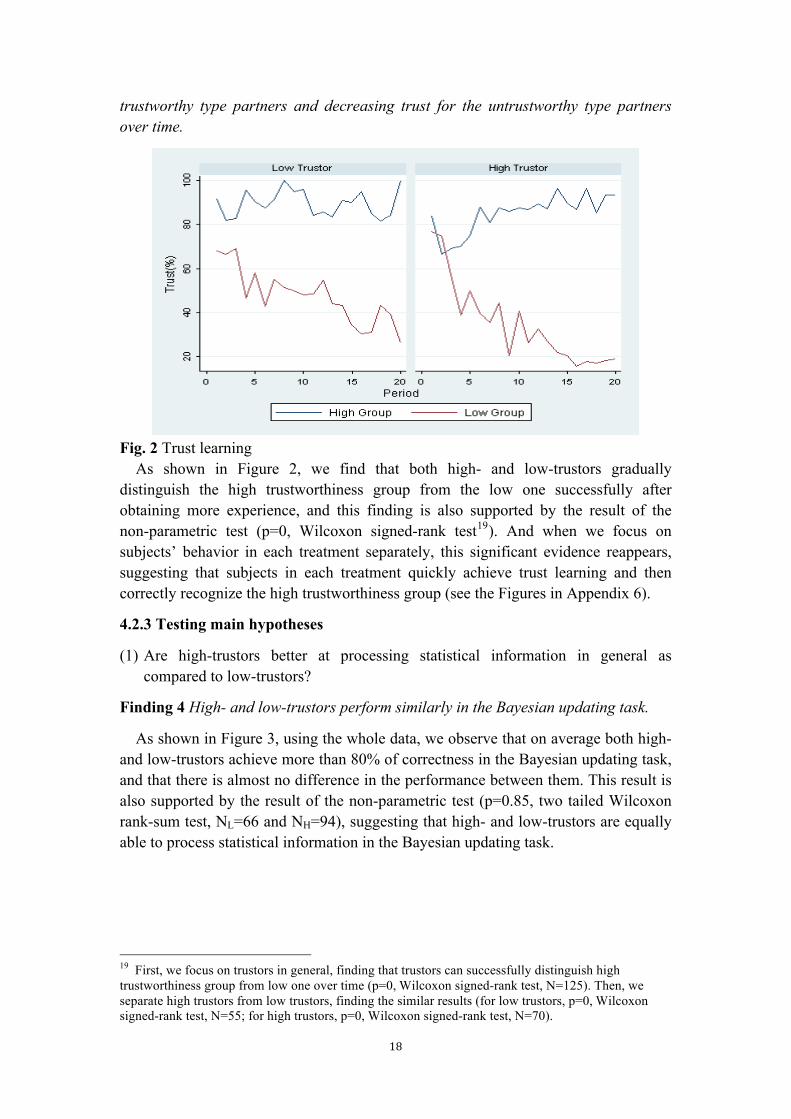
(1) Are high-trustors better at processing statistical information in general as compared to low-trustors?
Finding 4 High- and low-trustors perform similarly in the Bayesian updating task.
As shown in Figure 3, using the whole data, we observe that on average both high- and low-trustors achieve more than 80% of correctness in the Bayesian updating task, and that there is almost no difference in the performance between them. This result is also supported by the result of the non-parametric test (p=0.85, two tailed Wilcoxon rank-sum test, NL=66 and NH=94), suggesting that high- and low-trustors are equally able to process statistical information in the Bayesian updating task.
19 First, we focus on trustors in general, finding that trustors can successfully distinguish high trustworthiness group from low one over time (p=0, Wilcoxon signed-rank test, N=125). Then, we separate high trustors from low trustors, finding the similar results (for low trustors, p=0, Wilcoxon signed-rank test, N=55; for high trustors, p=0, Wilcoxon signed-rank test, N=70).
19
Fig.3 Bayesian learning
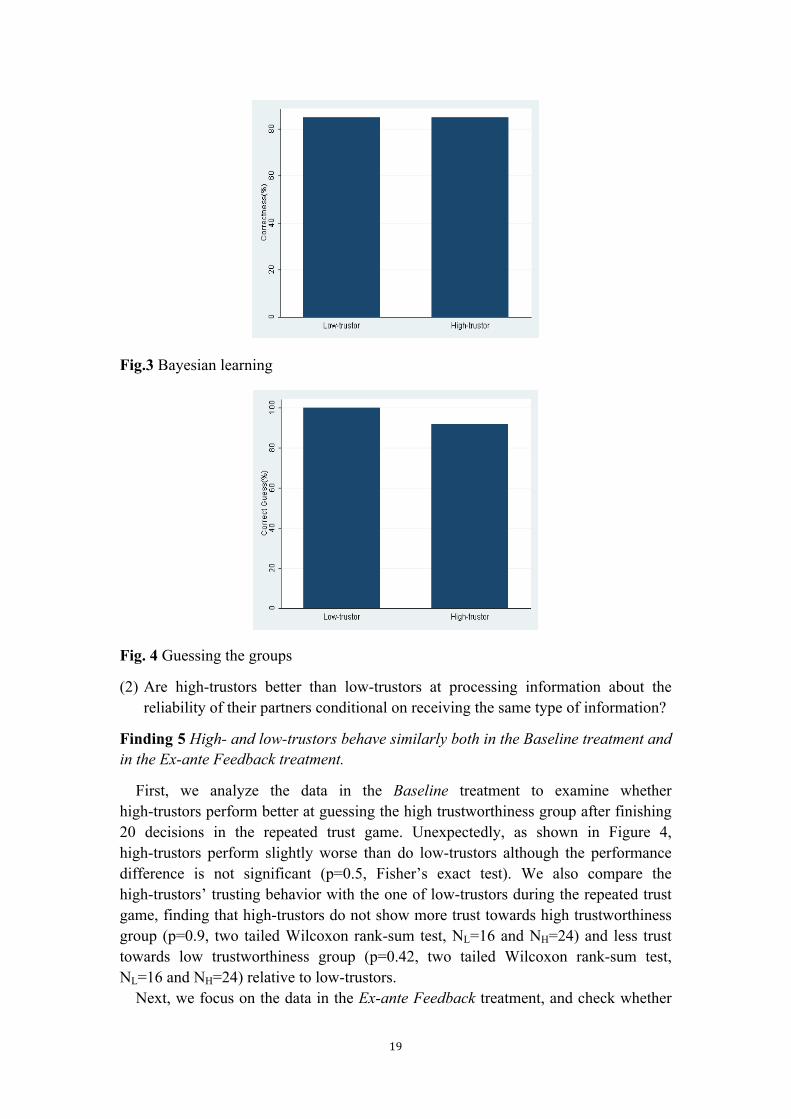
Fig. 4 Guessing the groups
(2) Are high-trustors better than low-trustors at processing information about the reliability of their partners conditional on receiving the same type of information?
Finding 5 High- and low-trustors behave similarly both in the Baseline treatment and in the Ex-ante Feedback treatment.
First, we analyze the data in the Baseline treatment to examine whether high-trustors perform better at guessing the high trustworthiness group after finishing 20 decisions in the repeated trust game. Unexpectedly, as shown in Figure 4, high-trustors perform slightly worse than do low-trustors although the performance difference is not significant (p=0.5, Fisher’s exact test). We also compare the high-trustors’ trusting behavior with the one of low-trustors during the repeated trust game, finding that high-trustors do not show more trust towards high trustworthiness group (p=0.9, two tailed Wilcoxon rank-sum test, NL=16 and NH=24) and less trust towards low trustworthiness group (p=0.42, two tailed Wilcoxon rank-sum test, NL=16 and NH=24) relative to low-trustors. Next, we focus on the data in the Ex-ante Feedback treatment, and check whether
20
high-trustors are more adaptive than low-trustors to this specific game task when informed of the general distribution information about the trustworthy players in each partner group at the very beginning of the trust game. We could still not see that high-trustors trust more the “good” partner group (p=0.32, two tailed Wilcoxon rank-sum test, NL=14 and NH=26) and less the “bad” one (p=0.47, two tailed Wilcoxon rank-sum test, NL=14 and NH=26).
(3) Are high-trustors better at detecting reliable partners because they trust their partner more and thus collect more experience (i.e. the rational trusting model)?
Finding 6 Contrary to Yamagishi’s argument, high- and low-trustors achieve similar performances in detecting reliable partners through trusting others in the Contingent Feedback treatment.
According to Yamagishi’s rational trusting model, we expect to see that high-trustors are more likely to “rationally” collect information about their partners’ actions by trusting more in the first several periods relative to low-trustors, however, as shown in Appendix 6, high- and low-trustors behave similarly in the conditional feedback treatment, which is also supported by the result of non-parametric test revealing that high-trustors do not trust the high trustworthiness group more (p=0.83, two tailed Wilcoxon rank-sum test, NL=22 and NH=18) and trust the low trustworthiness group less (p=0.28, two tailed Wilcoxon rank-sum test, NL=22 and NH=18).
(4) Are high-trustors better at detecting reliable partners because they are less betrayal or regret averse and have a higher willingness to acquire more information about their partner’s types?
Finding 7 In the Free Endogenous Feedback treatment, high-trustors show more trust towards the high trustworthiness group and less trust towards the low trustworthiness group, and this main effect is qualified by a significant time trend.
As shown in Appendix 6, when information acquisition is intentional in the Free Endogenous Feedback treatment, high-trustors are better than low-trustors at predicting others’ trustworthiness. Particularly, they recognize the low trustworthy type partners more accurately (i.e. trust towards the low trustworthiness group: p=0.01, two tailed Wilcoxon rank-sum test, NL=17 and NH=31), while trust towards the high trustworthiness group is not significantly different (p=0.21, two tailed Wilcoxon rank-sum test, NL=19 and NH=29). In order to study whether the time trend emerging in the Free Endogenous Feedback treatment is statistically significant, here we introduce OLS regression and Logistic regression to examine whether high-trustors are more likely to change their strategies towards different partner groups over time. First, we focus on the subjects’ trusting behavior towards the high trustworthiness group. As shown in Table 3, the interaction effect of trustor type and periods is significantly positive in OLS regression (two tailed t-test: without characteristics, p=0.025; with characteristics, p=0.015), while this interaction effect is weakly significant in Logistic regression.
21
This result implies that high-trustors show more trust towards high trustworthiness group over time. Interestingly, a strongly significant interaction effect of trustor type and cognitive ability is found in OLS regression (two tailed t-test: p=0)20, suggesting that high-trustors with high cognitive ability21 trust the “good” partner group more often. Next, we shift our attention to focus on the subjects’ trusting behavior towards the low trustworthiness group. In Table 4, we can find that high-trustors show less trust towards the low trustworthiness group over time, which is verified by tests using OLS regression and Logistic regression. In addition, we find that the joint effect of cognitive ability and trustor type is still significantly positive both in OLS and Logistic regressions, however, the F (p=0.668) or Wald (p=0.790) test shows that the sum of coefficients of cognitive ability and interaction term is not significantly larger than zero, suggesting that high cognitive ability could not help high-trustors predict others’ trustworthiness more correctly.
Table 3 Trust towards high trustworthiness group
Variable
OLS Regression Logistic Regression Without Characteristics
With Characteristics
Without Characteristics
With Characteristics
Period -0.001 (0.005)
-0.001 (0.005)
-0.017 (0.059)
-0.016 (0.059)
High-trustor -0.261 (0.073)***
-0.650 (0.376)*
-2.176 (0.761)***
-20.340 (1217.432)
High-trustor × Period 0.014 (0.006)**
0.015 (0.006)**
0.109 (0.066)*
0.123 (0.068)*
Social preference -0.011 (0.430)
-0.207 (0.578)
High-trustor × Social preference
0.016 (0.047)
0.266 (0.604)
Risk attitude -0.012 (0.011)
-0.104 (0.101)
Cognitive ability -0.073 (0.070)
-15.138 (1217.422)
High-trustor × Cognitive ability
0.331 (0.089)***
16.710 (1217.422)
Constant 0.943 1.145 2.795 19.860
20 We also perform a test to examine whether the sum of coefficients of cognitive ability and the interaction term (of cognitive ability and trustor type) is larger than zero, showing that this sum is significantly larger than zero (F (1,371) = 24.84, p=0 based on OLS; chi2 (1) = 15.18, p=0 based on Logistic regression). 21 To measure cognitive ability, we use the three-item cognitive reflection test (CRT) that was introduced by Frederick (2005). Following Oechssler et al. (2009) and Hoppe and Kusterer (2011), we divide the subjects in two groups based on their CRT score: individuals who answered zero or one of the questions correctly are assigned into the “low” group while people who remained are assigned into the “high” group.
22
(0.056)*** (0.356)*** (0.684)*** (1217.431) Observations 380 380 380 380 Notes: Standard deviations reported in parenthesis. The dependent variable is a dummy indicating trust. × denotes interaction terms. The dummy ‘High-trustor’ denotes whether the subject is a high-trustor. The dummy ‘Cognitive ability’ denotes whether the subject is highly cognitive able. The dummy “Social preference” denotes the subject’ answer to the question 33 in the Appendix 3. * p < 0.1, ** p < 0.05, *** p < 0.01.
Table 4Trust towards low trustworthiness group
Variable OLS Regression Logistic Regression Without Characteristics
With Characteristics
Without Characteristics
With Characteristics
Period -0.011 (0.007)
-0.011 (0.007)*
-0.047 (0.031)
-0.056 (0.034)
High-trustor -0.076 (0.102)
-1.564 (0.493)***
-0.178 (0.478)
-9.275 (2.853)***
High-trustor × Period
-0.020 (0.008)**
-0.200 (0.008)**
-0.108 (0.041)***
-0.106 (0.043)**
Social preference -0.095 (0.055)*
-0.552 (0.299)*
High-trustor × Social preference
0.145 (0.060)**
0.837 (0.328)**
Risk attitude -0.021 (0.015)
-0.117 (0.076)
Cognitive ability -0.421 (0.093)***
-2.763 (0.788)***
High-trustor × Cognitive ability
0.450 (0.118)***
2.860 (0.872)***
Constant 0.728 (0.086)***
1.913 (0.468)***
0.956 (0.401)**
8.385 (2.751)***
Observations 420 420 420 420 Notes: Standard deviations reported in parenthesis. The dependent variable is a dummy indicating trust. × denotes interaction terms. The dummy ‘High-trustor’ denotes whether the subject is a high-trustor. The dummy ‘Cognitive ability’ denotes whether the subject is highly cognitive able. The dummy “Social preference” denotes the subject’ answer to the question 33 in the Appendix 3. * p < 0.1, ** p < 0.05, *** p < 0.01.
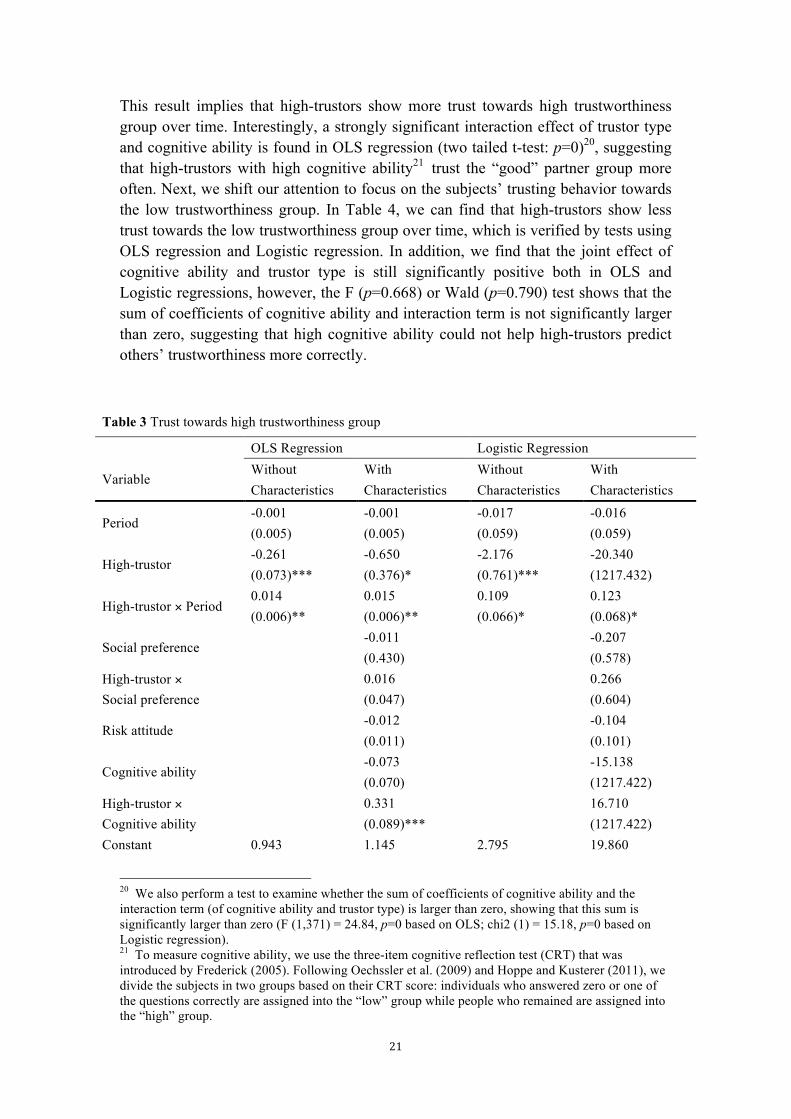
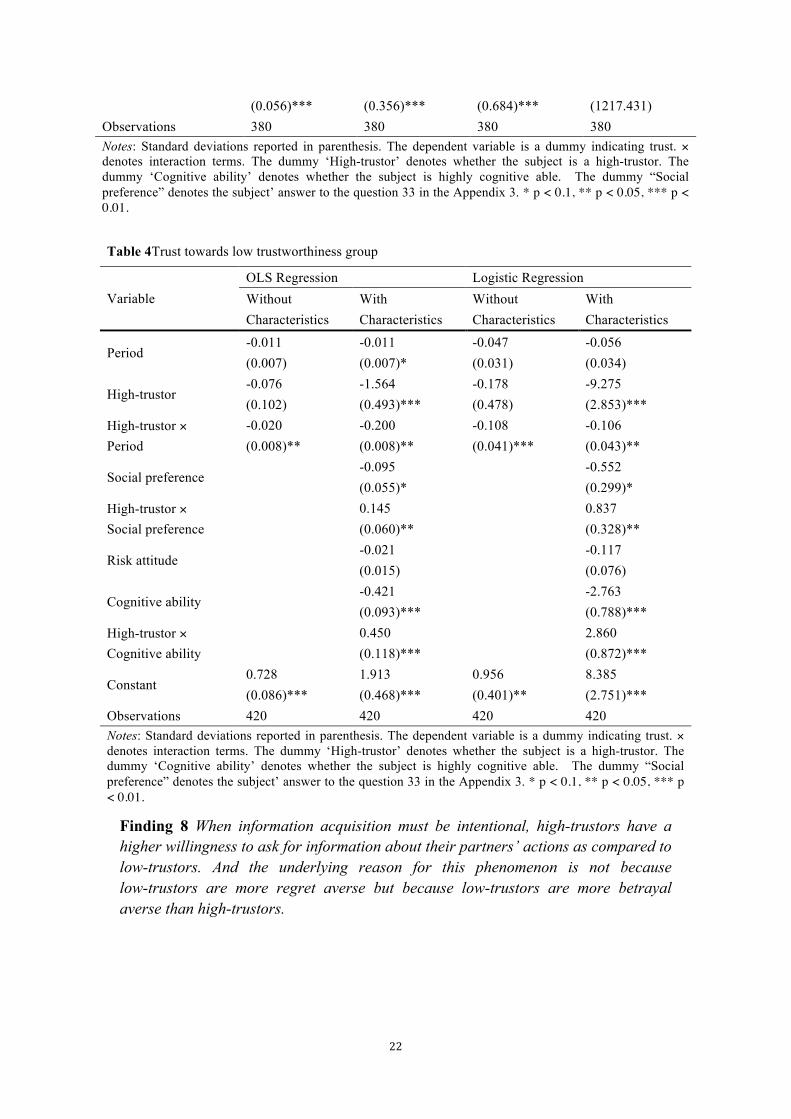
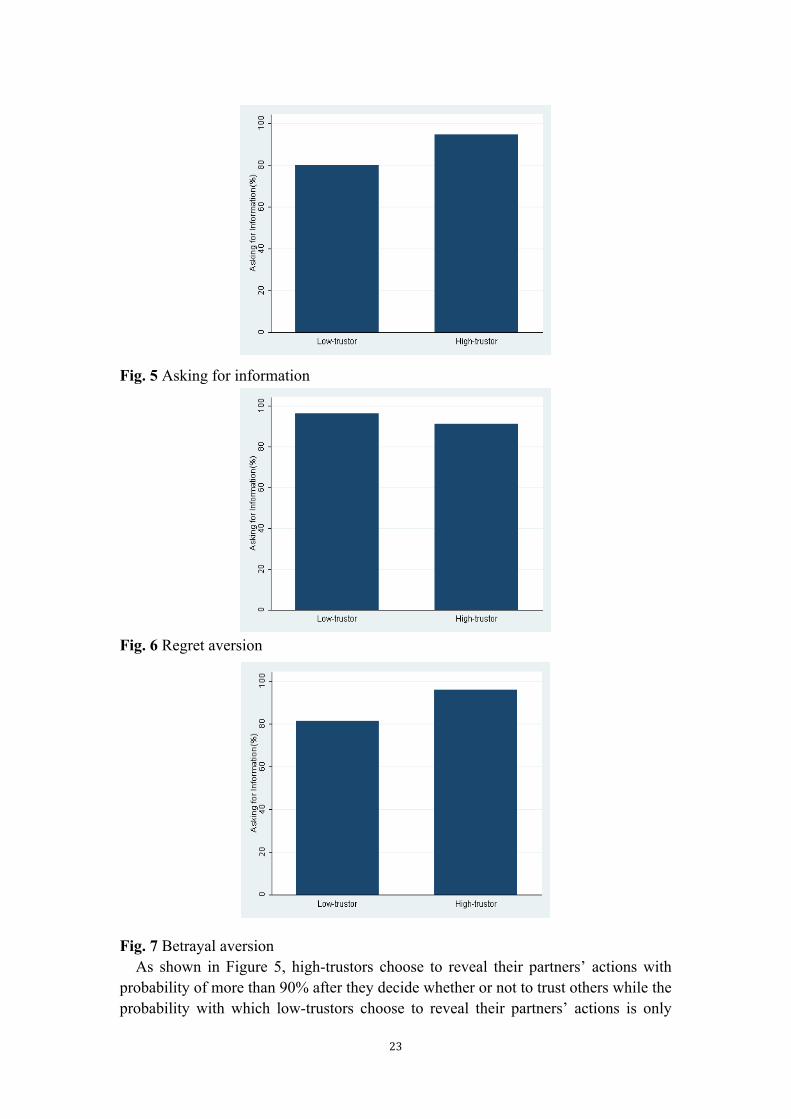
Finding 8 When information acquisition must be intentional, high-trustors have a higher willingness to ask for information about their partners’ actions as compared to low-trustors. And the underlying reason for this phenomenon is not because low-trustors are more regret averse but because low-trustors are more betrayal averse than high-trustors.
23
Fig. 5 Asking for information
Fig. 6 Regret aversion
Fig. 7 Betrayal aversion As shown in Figure 5, high-trustors choose to reveal their partners’ actions with
probability of more than 90% after they decide whether or not to trust others while the probability with which low-trustors choose to reveal their partners’ actions is only
24
80%, and this difference is weakly significant (p=0.06, two tailed Wilcoxon rank-sum test, NL=14 and NH=26), suggesting that high-trustors are more likely to ask for information about their partners’ actions, which may help them predict others’ trustworthiness more correctly than do low-trustors. Naturally, it is very important to examine which psychological factors actually drive this interesting phenomenon. One possibility is that when subjects choose not to trust their partner but their partner may actually behave trustworthily, they expect to feel regret and engage in avoiding to know their partner’s choice (i.e. regret aversion); another possibility is that when subjects choose to trust their partner but their partner may abuse the trust, they choose to keep unknown about their partner’s action and reduce this potential painful psychological cost (i.e. betrayal aversion). As revealed in Figure 6, when choosing not to trust their partner, low-trustors ask for feedback slightly more frequently than high-trustors but this difference is not significant (p=0.53, two tailed Wilcoxon rank-sum test, NL=10 and NH=26). However, when subjects choose to trust their partner, as shown in Figure 7, high-trustors have a higher willingness to ask for the feedback and this difference is significant (p=0.03, two tailed Wilcoxon rank-sum test, NL=14 and NH=25), suggesting that high-trustors are less betrayal averse than low-trustors and thereby more keen to acquire the useful information about their partner’s actions, consequently, they are better at predicting others’ trustworthiness.
4.3 First two parts: overview of results
Below are the key results from the first two parts of the experiment. As discussed in the part of Experimental design, we divide subjects into two categories, i.e. high- and low-trustors. The percentage of high-trustors ranges between 45% (in the Contingent Feedback treatment) and 65% (in the Ex-ante or Free-endogenous Feedback treatment), and no significant differences emerge across treatments (p=0.22, chi-square test with three degrees of freedom). On average 58.8% of subjects are categorized as high-trustors in our whole data.
Finding 9 High-trustors are more likely to be student leaders and obtain the financial aids from university.
Analyzing the data from the questionnaire, we find that there is no strongly significant difference between high- and low-trustors in terms of the general individual characteristics except the individual’s social status (i.e. student leaders) and experience on obtaining financial aids.22 High-trustors are more likely to be the student leaders, suggesting that high-trustors may more care about others’ feelings and welfare23 and engage in social activities. Another possibility is that high-trustors may have a strong concern for power because student leaders are more likely to enter the bureaucracy system when graduating from the colleges in China. In addition, we 22 When conducting chi-square test, we find a significant difference in social status (p=0.042) and in getting financial aids (p=0.040) between high- and low-trustors. 23 In Ashraf et al. (2006), when decomposing trust, the authors find that it is highly related with individuals’ unconditional kindness. In our questionnaire data, generalized trust is weakly related with altruism or generosity (p=0.06, two tailed Wilcoxon rank-sum test, NL=66 and NH=94).
25
also find that high-trustors are more likely to get financial aids from university, suggesting that those who are kindly treated by the university may be more likely to trust strangers in general.
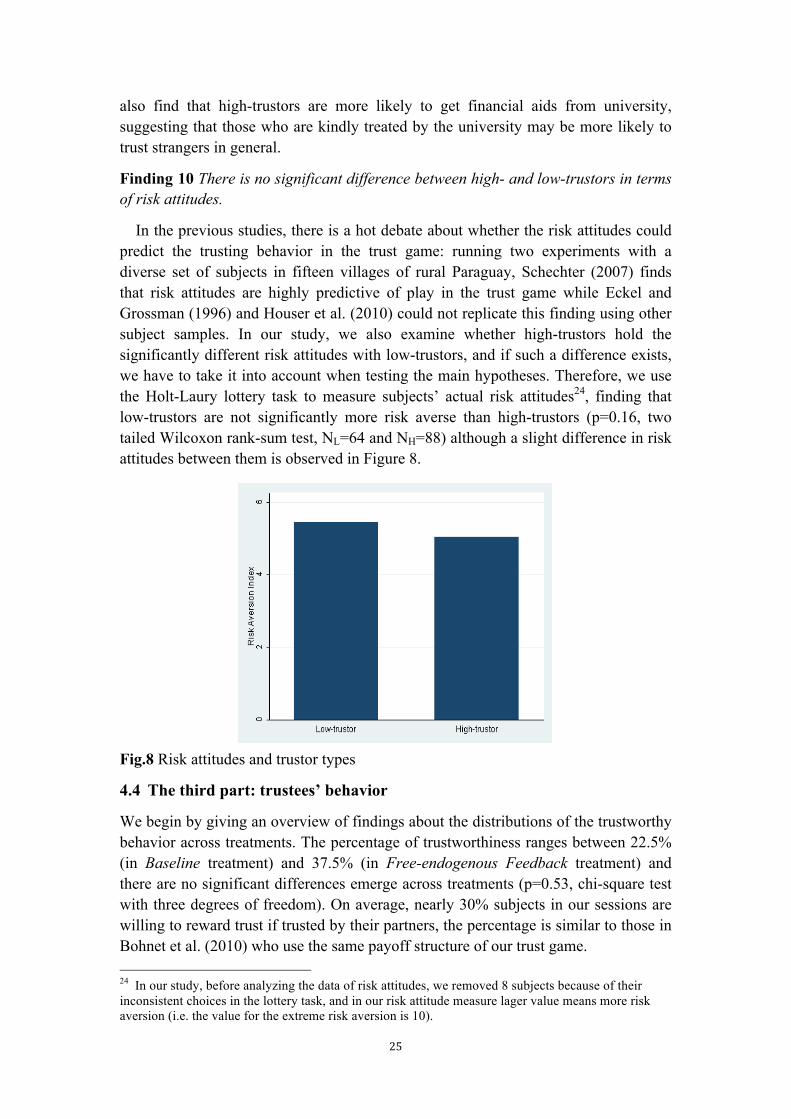
Finding 10 There is no significant difference between high- and low-trustors in terms of risk attitudes.
In the previous studies, there is a hot debate about whether the risk attitudes could predict the trusting behavior in the trust game: running two experiments with a diverse set of subjects in fifteen villages of rural Paraguay, Schechter (2007) finds that risk attitudes are highly predictive of play in the trust game while Eckel and Grossman (1996) and Houser et al. (2010) could not replicate this finding using other subject samples. In our study, we also examine whether high-trustors hold the significantly different risk attitudes with low-trustors, and if such a difference exists, we have to take it into account when testing the main hypotheses. Therefore, we use the Holt-Laury lottery task to measure subjects’ actual risk attitudes24, finding that low-trustors are not significantly more risk averse than high-trustors (p=0.16, two tailed Wilcoxon rank-sum test, NL=64 and NH=88) although a slight difference in risk attitudes between them is observed in Figure 8.
Fig.8 Risk attitudes and trustor types
4.4 The third part: trustees’ behavior
We begin by giving an overview of findings about the distributions of the trustworthy behavior across treatments. The percentage of trustworthiness ranges between 22.5% (in Baseline treatment) and 37.5% (in Free-endogenous Feedback treatment) and there are no significant differences emerge across treatments (p=0.53, chi-square test with three degrees of freedom). On average, nearly 30% subjects in our sessions are willing to reward trust if trusted by their partners, the percentage is similar to those in Bohnet et al. (2010) who use the same payoff structure of our trust game. 24 In our study, before analyzing the data of risk attitudes, we removed 8 subjects because of their inconsistent choices in the lottery task, and in our risk attitude measure lager value means more risk aversion (i.e. the value for the extreme risk aversion is 10).
26
Finding 11 There is no significant difference in willingness to reward trust between high- and low-trustors, while subjects from the Chinese urban areas significantly behave more trustworthily.
Using the survey data, Butler et al. (2012a) reveal that people form their beliefs about others’ trustworthiness based on their own level of trustworthiness (i.e. false consensus effect).25 Therefore, high-trustors are expected to be more trustworthy relative to low-trustors. However, measuring the generalized trust by similar questionnaire, we could not find the evidence that high-trustors are significantly different from low-trustors in terms of trustworthiness (p=0.14, chi-square test with one degree of freedom). In addition, we find that urban subjects who properly live in a relatively competitive market environment are more likely to reciprocate their partner’s trust (p=0.003, chi-square test with one degree of freedom). Although many previous experimental studies have argued that the exposure to market triggers a “market instinct”, which encourages subjects’ opportunistic behavior and decreases their other-regardingness (Belot and Fafchamps, 2012; Bowles, 1998; Reeson and Tisdell, 2010), our finding is in agreement with Henrich et al.’s (2001, 2005, 2010) study of small-scale societies revealing that exposure to market increases the strength of subjects’ other-regarding preferences.
5 Conclusion
People seem to believe that high-trustors are gullible and tend to trust others indiscriminately, thereby performing worse relative to low-trustors. However, many experimental studies reveal that the reverse is true: compared to low-trustors, high-trustors are better at lie detection (Carter and Weber, 2010), and are significantly more accurate in their predictions of others’ trustworthiness (Yamagishi, 2001; 2011). In this paper we take a further step to identify which factors exactly make high-trustors more correctly recognize the trustworthy type partners. Our main findings are that both high- and low-trustors can learn whom to trust over time, and that high-trustors are better than low-trustors at predicting others’ trustworthiness not because they are better at processing the statistical information or direct feedback from their partners, or they “rationally” collect useful information by trusting more, but only because they are less betrayal averse and have a higher willingness to acquire this valuable information. These findings have important implications for empirical research and legal policy. First, in Butler et al. (2012b), subjects are shown to form their trust beliefs based on their own trustworthiness and this false consensus effect has a strong impact on trusting behavior even after several periods for learning about the population. Consequently, both high- and low-trustors have to afford the substantial cost of
25 In fact, in order to test the existence of false consensus effect, Butler and his coauthors use two methods to elicit individuals’ trust beliefs: in Butler et al. (2012a), they measure individuals’ beliefs about others’ trustworthiness in general based on the questionnaire while in Butler et al. (2012b), they elicit subjects’ beliefs about the average trustworthy actions in a specific game environment, i.e. playing the standard trust game.
27
forming wrong trust beliefs (Butler et al. 2012a). Contrary to their studies, our experiment allows subjects to learn their partner types under a stable distribution of trustworthy trustees, facilitating them to accumulate past useful experience. As a result, for all treatments both high- and low-trustors could correctly learn whom to trust over time. It implies that when investors are involved in a stable commercial environment, they could correctly recognize their partners’ types by learning. When this environment becomes highly undetermined, they may have much difficulty to evaluate their partners’ types and tend to make their decisions largely based on their own types, leading them to underperform. Therefore, in the future work it is appropriate to manipulate the degree of uncertainty in the experimental environment to investigate whether the effectiveness of trust learning depends on it. Second, in all treatments trustors could correctly trust trustworthy type partners more and trust untrustworthy type partners less over time, however, different trusting behavior between unconditional and conditional feedback treatments is still observed. When trusting towards the low trustworthiness group, much more trust appears in the Contingent Feedback and Free Endogenous Feedback treatments relative to other two treatments. It implies that if necessary information about their potential partners is unconditionally provided, much unprofitable trusting behavior can be avoided. Therefore, in order to enhance individuals’ welfare, appropriate legal policy disclosing the necessary information about market traders and making commercial environment transparent is highly demanded.
Third, in terms of other legal policy implications, the results raise important questions for interventions designed to improve market efficiency, which typically focus on the incentive mechanisms, such as pricing or monetary rewarding systems. Our study provides the experimental evidence, suggesting that with a high level of the default expectation of the likely trustworthiness of others, high-trustors have a higher willingness to be involved in market participation and are less anxious to know their partner’s actual action, therefore, they learn more about distinguishing trustworthy from untrustworthy partners. Hence, public education on the possibly detrimental effect of betrayal aversion is highly demanded to reduce the impact of the subtle psychological factors, and to encourage people to be involved in market transactions more often. As a result, market participation endogenously expands, where more investors are engaging in participating into the market transactions and predict trustworthiness more accurately, thereby sustaining a higher level of market efficiency.
References
Adriani, F., & Sonderegger, S. (2011). Trust, trustworthiness and the consensus effect: an evolutionary approach. Working paper. Aimone, J., & Houser, D. (2012). What you don’t know won’t hurt you: a laboratory analysis of betrayal aversion. Experimental Economics, 15(4), 571-588. Ariely, D., & Norton, M. I. (2007). Psychology and experimental economics: a gap in abstraction. Current Directions in Psychological Science, 16(6), 336-339.
28
Ashraf, N., Bohnet, I., & Piankov, N. (2006). Decomposing trust and trustworthiness. Experimental Economics, 9, 193-208. Baumgartner, T., Heinrichs, M., Vonlanthen, A., Fischbacher, U., & Fehr, E. (2008). Oxytocin shapes the neural circuitry of trust and trust adaption in humans. Neuron, 58, 639-650. Belot, M., Bhaskar V., & van de Ven, J. (2012). Can observers predict trustworthiness. The Review of Economics and Statistics, 94(1), 264-259. Belot, M.,& Fafchamps, M. (2012). Good samaritans and the market: experimental evidence on other-regarding preferences. mimeo. Berg, J., Dickhaut J., & McCabe K. (1995). Trust, reciprocity and social history. Games and Economic Behavior, 10, 122-142. Bohnet, I., Grieg, F., Herrmann, B., & Zeckhauser, R. (2008). Betrayal aversion: evidence from Brazil, China, Oman, Switzerland, Turkey, and the United States. American Economic Review, 98(1), 294– 310. Bohnet, I., Hermann, B., & Zeckhauser, R. (2010). Trust and the reference points for trustworthiness in Gulf and Western countries. Quarterly Journal of Economics, 125(2), 811–828. Bohnet, I., & Zeckhauser, R. (2004). Trust, risk and betrayal. Journal of Economic Behavior and Organization, 55, 467–484. Bowles, S. (1998). Endogenous preferences: the culture consequences of markets and other economic institutions. Journal of Economic Literature, March, 75-111. Brandts, J., & Charness, G. (2011). The strategy versus the direct-response method: a first survey of experimental comparisons. Experimental Economics, 21, 1-24. Brosig, J. (2002). Identifying cooperative behavior: some experimental results in a prisoner’s dilemma game. Journal of Economic Behavior and Organization, 47, 275-290. Butler, J., Giuliano, P., & Guiso L. (2012a). The right amount of trust. EIEF Working Paper. Butler, J., Giuliano, P., & Guiso L. (2012b). Trust, values and false consensus. EIEF Working Paper. Camerer, C. F., & Ho, T. (1999). Experience-weighted attraction in games. Econometrica, 64, 827–874. Camerer, C. F., & Ho, T., Chong, J. (2002). Sophesticated experience-weighted attraction learning and strategic teaching in repeated games. Journal of Economic Theory, 104(1), 137-188. Camerer, C. F., & Weigelt, K. (1988). Experimental tests of a sequential equilibrium reputation model. Econometrica, LVI, 1-36. Carter N., & Weber, M. (2010). Not Pollyannas: higher generalized trust predicts lie detection ability. Social Psychological and Personality Science, I(3), 274-279. Casari, M., & Cason, T. (2009). The strategy method lowers measured trustworthy behavior. Economics Letters, 103, 157-159. Chang, L. J., Doll, B. B., van’t Wout, M., Frank, M. J., & Sanfey, A. G. (2010). Seeing is believing: trustworthiness as a dynamic belief. Cognitive Psychology, 61, 87-105. Coricelli, G., & Nagel, R. (2009). Neural correlates of depth of strategic reasoning in media prefrontal cortex. Proceedings of the National Academy of Sciences of the United States of America, 106(23), 9163-9168.
29
Dana, J., R. A. Weber, & Kuang, J. X. (2007). Exploiting moral wiggle room: experiments demonstrating an illusory preference for fairness. Economic Theory, 33, 67–80. Dawkins, R., 1976, The Selfish Gene. Oxford: Oxford University Press. Delgado, M. R., Frank, R. H., & Phelps, E. A. (2005a). Perceptions of moral character modulate the neural systems of reward during the trust game. Nature Neuroscience, 8, 1611–1618. Delgado, M. R., Miller, M. M., Inati, S., & Phelps, E. A. (2005b). An fMRI study of reward-related probability learning. Neuroimage, 24, 862–873. Eckel, C., & Grossman, P. (1996). Altruism in anonymous dictator games. Games and Economic Behavior, 16, 181-191. El-Gamal M., & Grether D. (1995). Are people bayesian? Uncovering behavioral strategies. Journal of the American Statistical Association, Vol. 90(432). Engelmann, D., & Strobel, M. (2000). The false consensus effect disappears if representative information and monetary incentives are given. Experimental Economics, 3, 241-260. Erev, I., & Roth, A. E. (1998). Predicting how people play games: reinforcement learning in games with unique strategy equilibrium. American Economic Review, 88, 848–881. Fareri, D. S., Chang, L. J., & Delgado, M. R. (2012). Effects of direct social experience on trust decisions and neural reward circuitry. Frontiers in Neuroscience, 6(148), 1-17. Fehr, E. (2009). On the economics and biology of trust. Journal of the European Economic Association, 7, 235-266. Fetchenhauer, D., & Dunning, D. (2010). Why so cynical? Asymmetric feedback underlies misguided skepticism regarding the trustworthiness of others. Psychological Science, 21(2), 189-193. Fetchenhauer, D., & Dunning, D. (2012). Betrayal aversion versus principled trustfulness-how to explain risk avoidance and risky choices in trust games. Journal of Economic Behavior and Organization, 81, 534-541. Fett, A. J., Shergill, S. S., Joyce, D. W., Riedl, A., Strobel, M., Gromann, P. M., & Krabbendam, L. (2012). To trust or not to trust: the dynamics of social interaction in psychosis. Brain, 135, 976-984. Fischbacher, U. (2007). z-Tree: Zurich toolbox for ready-made economic experiments. Experimental Economics, 10, 171-178. Frank, R. H. (1988). Passions Within Reason: The Strategic Role of the Emotion, W.W. Norton & Co., New York. Frank, R. H. (2005). Altruists with green beards: still kicking?” Analyse & Kritik, 27, 85-96. Frank, R. H., Gilovich, T., & Regan, D. T. (1993). The evolution of one-shot cooperation: an experiment. Ethology and Sociobiology, 14, 247-256. Frederick, S. (2005). Cognitive reflection and decision making. Journal of Economic Perspective, 19(4), 25-42. Frith, C. D., & Frith, U. (2006). The neural basis of mentalizing. Neuron, 50, 531-534. Fudenberg, D., & Levine, D. K. (1998). The Theory of Learning in Games, MIT Press, Cambridge, MA. Fukuyama, F. (1995). Trust: The Social Virtues and the Creation of Prosperity, New York: Free Press. Grossman, Z. (2010). Strategic ignorance and the robustness of social preferences. UC Santa
30
Barbara working paper. Guillen, P., & Ji, D. (2011). Trust, discrimination and acculturation: experimental evidence on Asian international and Australian domestic university students. Journal of Socio-Economics, 40, 594-608. Guiso, L., Sapienza P., & Zingales, L. (2008). Trusting the stock market. Journal of Finance, 63(6): 2557-2600. Hampton, A. H., Bossaerts, P., O’Doherty, J. P. (2008). Neural correlates of mentalizing-related computations during strategic interactions in humans. Proceedings of the National Academy of Sciences of the United States of America, 105, 6741-6746. Harbaugh, W., Krause, K., Liday. S., & Vesterlund, L. (2002). Trust in children. in E. Ostrom and J. Walker (Ed.), Trust, Reciprocity and Gains from Association: Interdisciplinary Lessons from Experimental Research(pp. 302–332). New York, NY: Sage. Henrich, J., Boyd, R., Bowles, S., Camerer, C., Fehr, E., Gintis, H., & McElreath, R. (2001). In search of Homo-economicus: behavioral experiments in 15 small-scale societies. American Economic Review, 91, 73-78. Henrich, J., Ensminger, J., McElreath, R., & Barr, A., Barrett, C., Bolyantz, A., Cardenas, J., Gurven, M., Gwako, E., Henrich, N., Lesorogol, C., Marlowe, F., Tracer, D., & Ziker, J. (2010). Markets, religion, community size, and the evolution of fairness and punishment. Science, 327, 1480-1484. Henrich, J., Boyd, R., Bowles, S., Camerer, C., Fehr, E., Gintis, H., McElreath, R., Alvard, M., Barr, A., Ensminger, J., Henrich, N., Hill, K., Gil-White, F., Gurven, M., Marlowe, F., Patton, J., & Tracer, D. (2005). Economic man in cross-culture perspective: behavioral experiments in 15 small-scale societies. Behavioral and Brain Sciences, 28, 795-855. Hertwig, R., & Ortmann, A. (2001). Experimental practices in economics: a methodological challenge for psychologists?” Behavioral and Brain Science, 24, 383-451. Holt, C., & Laury, S. (2002). Risk aversion and incentive effects in lottery choices. American Economic Review, 92, 1644-1655. Hoppe, E., & Kusterer, D. (2011). Behavioral biases and cognitive reflection. Economics Letters, 10, 97-100. Houser, D., Schunk, D., & Winter, J. (2010). Distinguishing trust from risk: an anatomy of the investment game. Journal of Economic Behavior and Organization, 74(1), 72-81. Izuma, K., Matsumoto, K., Camerer, C. F., & Adolphs, R. (2011). Insensitivity to social reputation in autism. Proceedings of the National Academy of Sciences of the United States of America, 108(42), 17302-17307. Jamison, J., Karlan, D., & Schechter, L. (2008). To deceive or not to deceive: the effect of deception on behavior in future laboratory experiments. Journal of Economic Behavior and Organization, 68, 477-488. King-Casas, B., Tomlin, D., Anen, C., Camerer, C. F., Quartz, S. R., & Montague, P. R. (2005). Getting to know you: reputation and trust in a two-person economic exchange. Science, 308, 78–83. King-Casas, B., Sharp, C., Lomax-Bream, L., Lohrenz, T., Fonagy, P., & Montague, P. R. (2008). The rupture and repair of cooperation in borderline personality disorder. Science, 321, 806-810. Kishida, K. T., Li, J., Schwind, J., & Montague, P. R. (2012). New approaches to
31
investigating social gestures in autism spectrum disorder. Journal of Neurodevelopmental Disorders, 4, 14-25. Knack, S., & Keefer, P. (1997). Does social capital have an economic payoff? A cross-country investigation. The Quarterly Journal of Economics, 112(4), 1251-1288. Kramer, R. M. (1998). Paranoid cognitive in social systems: thinking and acting in the shadow of doubt. Personality and Social Psychology Review, 2, 251-275. Krol, M., & Krol, M. (2010). Is recursive belief inference the engine of mentalizing?” The Journal of Neuroscience, 30(47), 15711-15712. Krueger, F., McCabe, K., Moll, J., Kriegeskorte, N., Zahn, R., Strenziok, M., Heinecke, A., & Grafman, J. (2007). Neural correlates of trust. Proceedings of the National Academy of Sciences of the United States of America, 104(50), 20084-20089. La Porta, R., Lopez de Silanes F., Shleifer A., & Vishny R. (1997). Trust in large organizations. American Economic Review, 87(2), 333-338. La Porta, R., Lopez de Silanes F., Shleifer A., & Vishny R. (1999). The quality of government. Journal of Law, Economics and Organization, 1, 222-279. Larson, T., & Capra, C. M. (2009). Exploiting moral wiggle room: illusory preference for fairness? A comment. Judgment Decision Making, 4, 467–474. McCabe, K., Houser, D., Ryan, L., Smith, V., & Trouard, T. (2001). A functional imaging study of cooperation in two-person reciprocal exchange. Proceedings of the National Academy of Sciences of the United States of America, 98, 11832-11835. Mikolajczak, M., Gross, J. J., Lane, A., Corneille, O., de Timary, P., & Luminet, O. (2010). Oxytocin makes people trusting, not gullible. Psychological Science, 21(8), 1072-1074. Miller, A. S., & Mitamura, T. (2003). Are surveys on trust trustworthy?” Social Psychology Quarterly, 66, 62-70. O’Doherty, J., Dayan, P., Schultz, J., Deichmann, R., Friston, K., & Dolan, R. J. (2004). Dissociable roles of ventral and dorsal striatum in instrumental conditioning. Science, 304, 452–454. Oechssler, J., Roider, A., & Schmitz, P. (2009). Cognitive abilities and behavioral biases. Journal of Economic Behavior & Organization, 72, 147-152. Ortmann, A., & Hertwig, R. (2002). The costs of deception: evidence from psychology. Experimental Economics, 5(2), 111-131. Phan, K. L., Sripada, C. S., Angstadt, M., & McCabe, K. (2010). Reputation for reciprocity engages the brain reward center. Proceedings of the National Academy of Sciences of the United States of America, 107, 13099-13104. Pillutla, M., Malhotra, D., & Murnighan, J. K. (2003). Attributions of trust and the calculus of reciprocity. Journal of Experimental Social Psychology, 39, 448-455. Putnam, R. (1993). Making Democracy Work: Civic Traditions in Modern Italy, Priceton, NJ: University Press. Rilling, J. K., Sanfey, A. G., Aronson, J. A., Nystrom, L. E., & Cohen, J. D. (2004). The neural correlates of theory of mind within interpersonal interactions. Neuroimage, 22, 1694-1703. Reeson, A., & Tisdell, J. (2010). The market instinct: the demise of social preferences for self-interest. Environmental and Resource Economics, 47, 439-453. Ross, L., Greene, D., & House, P. (1997). The false consensus effect: an egocentric bias in
32
social perception and attribution processes. Journal of Experimental Social Psychology, 13, 279-301. Rousseau, D., Sitkin, S., Burt, R., & Camerer, C. (1998). Not so different after all: a cross-discipline view of trust. Academy of Management Review, 23, 393-404. Schechter, L. (2007). Traditional trust measurement and the risk confound: an experiment in rural Paraguay. Journal of Economic Behavior and Organization, 62, 272-292. Sripada, C. S., Angstadt, M., Banks, S., Nathan, P. J., Liberzon, I., & Phan, K. L. (2009). Functional neuroimaging of mentalizing during the trust game in social anxiety disorder. Neuroreport, 20(11), 984-989. Stirrat, M., & Perrett, D. I. (2010). Valid facial cues to cooperation and trust: male facial width and trustworthiness. Psychological Science, 21, 349-354. Sullivan, J. L., & Transue J. E. (1999). The psychological underpinnings of democracy: a selective review of research on political tolerance, interpersonal trust, and social capital. Annual Review of Psychology, 50, 625-650. Sutter, M., & Kocher, M. (2007). Trust and trustworthiness across different age groups. Games and Economic Behavior, 59(2), 364-382. Sutton, R. S., & Barto, A. G. (1998). Reinforcement Learning: An Introduction, Cambridge, MA: MIT. Tricomi, E. M., Delgado, M. R., & Fiez, J. A. (2004). Modulation of caudate activity by action contingency. Neuron, 41, 281–292. van den Bos, W., van Dijk, E., & Crone, E. A. (2011). Learning whom to trust in repeated social interactions: a developmental perspective. Group Processes and Intergroup Relations, 15(2), 243-256. van’t Wout, M., & Sanfey, A. G. (2008). Friend or foe: the effect of implicit trustworthiness judgments in social decision-making. Cognition, 108, 796-803. Verplaetse, J., Vanneste, S., & Braeckman, J. (2007). You can judge a book by its cover: the sequel a kernel of truth in predictive cheating detection. Evolution and Human Behavior, 28, 260-271. Weber, J. M., Malhotra, D., & Murnighan, J. K. (2005). Normal acts of irrational trust: motivated attributions and the trust development Process. in R. M. Kramer and B. M. Staw (Ed.), Research in Organizational Behavior(pp. 77-103), Greenwich, CT: JAI. Weber, J. M., & Murnighan, J. K. (2008). Suckers or saviors? Consistent contributors in social dilemmas. Journal of Personality and Social Psychology, 95, 1340-1353. West, S.A., & Gardner, A. (2010). Altruism, spite, and greenbeards. Science, 327(5971), 1341-1344. Yamagishi, T. (2001). Trust as a form of social intelligence. In K.S. Cook (Ed.), Trust in Society, New York: Russell Sage. Yamagishi, T. (2011). Trust: The Evolutionary Game of Mind and Society, Springer. Yamagishi, T., Cook, K. S., & Watabe, M. (1998). Uncertainty, trust, and commitment formation in the United States and Japan. The American Journal of Sociology, 104(1), 165-194. Yamagishi, T., & Kakiuchi, R. (2000). It takes venturing into a tiger's cave to steal a baby tiger: experiments on the development of trust relationships. in Werner Raub & Jeroen Weesie (Ed.), The Management of Durable Relations (pp.121-123), Thela Thesis Publishers.
33
Yamagishi, T., & Kosugi, M. (1999). Cheater detection in social exchange. Cognitive Studies, 6(2), 179-190. Yamagishi, T., Kikuchi M., & Kosugi M. (1999). Trust, gullibility, and social intelligence. Asian Journal of Social Psychology, 2, 145-161. Yamagishi, T., Tanida, S., Mashima, R., Shimoma, E., & Kanazawa, S. (2003). You can judge a book by its cover: evidence that cheaters may look different from cooperators. Evolution and Human Behavior, 24, 290-301. Yamagishi, T., & Yamagishi, M. (1994). Trust and commitment in the United States and Japan. Motivation and Emotion, 18(2), 129-166. Yoshida, W., Dziobek, I., Kliemann, D., Heekeren, H. R., Friston, K. J., & Dolan, R. J. (2010). Cooperation and heterogeneity of the autistic mind. The Journal of Neuroscience, 30(26), 8815-8818. Yoshida, W., Seymour, B., Friston, K. J., & Dolan, R. J. (2010). Neural mechanisms of belief inference during cooperative games. The Journal of Neuroscience, 30(32), 10744-10751. Zhu, L., Mathewson, K. E., & Hsu, M. (2012). Dissociable neural representations of reinforcement and belief prediction errors underlie strategic learning. Proceedings of the National Academy of Sciences of the United States of America, 109(5), 1419-1424.
Instructions (baseline) Welcome to this study on economic decision-making! Please, turn off your mobile phone. From this moment on, no form of communication among participants is allowed. In case you have a question, please rise your hand and the instructor will come to your desk to answer it. This study includes two parts. In Part 1, a questionnaire will appear on your computer screen. Then followed by Part 2, which includes four experiments, and you can earn money from this part (Note that you are given the instructions for a new experiment just after the previous experiment is finished). The money you earn in the different four experiments will be paid to you in cash, and in private, at the end of experiment. Now, we will read instructions for Part 1. At the beginning of experiments 1, 2, 3 and 4 in Part 2, we will distribute and read the corresponding instructions.
Instructions for Part 1
35
We now kindly ask you to fill in a questionnaire that will appear soon on your computer screen. Some of the questions concern personal information that will help us for our study. Your identity will never be revealed when results are presented. Please, answer carefully: you will not be able to change your answer, once you confirm it.
Instructions for Experiment 1 In Experiment 1, you can earn up to 25 Yuan, depending on the decisions you make and on the outcome of two random draws. Your computer screen (Figure 1) will show ten decisions listed on the left. Each decision is a paired choice between "Option A" and "Option B." You will make ten choices and record these in the final column, but only one of them will be used in the end to determine your earnings.
(Fig. 1) Before you start making your ten choices, please let us explain how these choices will affect your earnings for this experiment. After you have made all of your choices, the computer will randomly draw a number between 1 and 10, to determine which of your decisions will be actually used. Another random draw will determine what your payoff is for the option you chose, A or B, for the particular decision selected. Even though you will make ten decisions, only one of these will end up affecting your earnings, but you will not know in advance which decision will be used. Obviously, each decision has an equal chance of being used in the end. Now, please look at Decision 1 at the top. Option A pays 10 Yuan, no matter what the outcome of the second draw is. Option B yields 25 Yuan if the outcome of the second draw is
36
1, and it pays 0 Yuan if the throw is 2-10. The other Decisions are similar, except that as you move down the table, the chances of the higher payoff for option B increase. In fact, for Decision 10 in the bottom row, the die will not be needed since option B pays the highest payoff for sure, so your choice here is between 10 Yuan or 25 Yuan. To summarize, you will make ten choices: for each decision row you will have to choose between Option A and Option B. You may choose A for some decision rows and B for other rows, and you may change your decisions and make them in any order. When you are finished, please click the “Confirm” button at the bottom right of the screen. Earnings for this experiment will be added to your earnings for the next three experiments of the study, and you will be paid all earnings in cash when we finish. So now please look at the empty boxes on the right side of the record sheet. You will have to select an option, A or B in each of these boxes, and then the random draw will determine which one is going to count. We will look at the decision that you made for the choice that counts, before throwing the die again to determine your earnings for this experiment. You will be informed about the outcome of these draws only at the end of Part 2 of this study. Comprehension Questions: Please answer following questions. Raise your hand if you need help. The instructor will come to help you and will check your answers when you are done. 1), Please read carefully the above table (Figure 1) which will appear on your screen. What is the probability of each decision (from Decision 1 to 10) that will be selected by computer? (A) 1/2 (B) 1/10 (C) We cannot know it 2), Do you think that, for each decision (from Decision 1 to 10), you will always earn more money from option A than from option B? (A) Yes (B) No, we cannot know it before the selection made by computer Now you may begin making your choices!
Instructions for Experiment 2
In Experiment 2, you can earn money depending on the decisions that you and other participants will take. At the end of this study, your earnings for this experiment will be summed with the earnings from other experiments, and you will be privately paid in cash. Please, follow the instructions carefully. How the study is conducted. The study is conducted anonymously. Participants will be unidentified by other participants and experimenter, and no one will be able to associate any decisions with specific people. Participants will be randomly matched into pairs consisting of two roles: person “1” and person “2”. There is no communication between you and your
37
counterparts, and your counterpart will never know your true identity, nor will you know theirs. What the study is about. The study seeks to understand how people decide. You and your counterpart form a pair, and your decisions will determine how much money you earn. Person 1 is confronted with two alternatives, X and Y. X gives person 1 and person 2 a payoff for sure, and person 2 does not need take action. If person 1 chooses option Y, person 2 has to choose one of two options, A or B. You are informed the payoff structure as follows: (1). If person 1’s decision results in X, person 1 and person 2 will each get 10 Yuan. (2). If person 1’s decision results in Y and person 2 chooses A, person 1 and person 2 will each get 15 Yuan. (3). If person 1’s decision results in Y, and person 2 chooses B, person 2 will get 22 Yuan and person 1 will get 8 Yuan.
(Fig. 2) In this experiment, all of you who participate in today’s experiments will act as Person 2, and you will have to make one decision. Each of your counterparts will be randomly selected from the next experiment among today’s participants, and you have no idea about the true identity of your counterparts. On your computer screen (Figure 2) you will see the payoff table, and will be asked to answer the following question: “ Which Option A or B, do you choose in case Person 1 chooses Y? ” To enter your decision, press the button corresponding to your choice (Option A or Option B). Later, we will randomly match your decision with the decision made by Person 1 in the next
38
experiment, ultimately determining both payoffs. You will be informed of the results only at the end of Part 2 of this study. Comprehension Questions: Please answer following questions. Raise your hand if you need help. The instructor will come to help you and will check your answers when you are done. 1) If your counterpart chooses X, and you choose A, how much are you paid? ______ your
counterpart?_______ 2) If your counterpart chooses X, and you choose B, how much are you paid? ______ your
counterpart?_______ 3) If your counterpart chooses Y, and you choose A, how much are you paid? ______ your
counterpart?_______ 4) If your counterpart chooses Y, and you choose B, how much are you paid? ______ your
counterpart?_______
Now you may make your choice!
Instructions for Experiment 3 (Baseline Treatment)
How the study is conducted. In Experiment 3, you can earn money depending on the decisions that you and other participants will take. Your earning for this experiment will be summed with the earnings from the other experiments, and will be privately paid to you in cash.
(Fig.3) What the task is about. In Experiment 3, you will face the same situation as in Experiment 2,
39
but this time you act as Person 1, and play the game for 20 periods. For each period, on your computer screen (Figure 3), you will see the payoff table, and will be asked to answer the following question: “Your partner belongs to Group 1 (or 2), so which Option, X or Y, will you choose? ” To enter your decision, press the button corresponding to your choice (Option X or Option Y). 1), if you choose Option X, then the actual outcome of this period is complete (e.g. you will receive 10 Yuan, and person 2 will receive 10 Yuan); 2), if you choose Y, then the actual outcome of the period depends on the decision made by person 2: if person 2 chooses Option A, you will receive 15 Yuan, and person 2 will receive 15 Yuan; if person 2 chooses option B, you will receive 8 Yuan, and person 2 will receive 22 Yuan. Please check the details from the above payoff table. For each period, you will be randomly matched with a counterpart (Person 2). Your counterpart will be one of the 20 participants in the today’s experiments. You can also be possibly matched with yourself. The decision of Person 2 corresponds to the choice made by your counterpart in Experiment 2 of this study. After this experiment, one period will be randomly selected by computer to determine the real payoffs for you and your counterpart in the previous experiment. Please remember, for each period you are informed about the actual decision of your counterpart (i.e. person 2) immediately after you decide whether or not to choose option X (or Y), i.e. you will receive the “feedback” from your counterpart regardless of your own choice.
How your counterpart (i.e. person 2) is selected. We have randomly formed two groups of Person 2s based on the decisions made in Experiment 2. In one of the groups, at least 50% of the people chose Option A, while in the other group, less than 50% of the people chose Option A. We labeled these two groups “Group 1” and “Group 2”. However, you do not know which is the group where at least 50% of the people chose Option A, and which is the group where less than 50% of people chose Option A. For each period, you will be randomly matched with a person 2 picked from the Group 1 or Group 2. Before making your decision, you only know whether the current counterpart belongs to the Group 1 or the Group 2. At the very end of this experiment, you will be asked the following question: “Remember that there are two groups of person 2: in one of the groups, at least 50% of the people choose Option A, other choose Option B; in the other, less than 50% choose Option A. So, which group is the one where at least 50% choose Option A: Group 1 or Group 2?” Once your guess is correct, you will win 10 Yuan and be informed this result at the very end of this study. Comprehension Questions:
40
Please answer following questions. Raise your hand if you need help. The instructor will come to help you and will check your answers when you are done. 1), As Person 1 in this experiment, you would read the similar above table (Figure 3) in your screen. In this table, do you know which group your partner comes from? (A) from Group 1 (B) from Group 2 2), How many people in Group 1 chose Option A? (A) at least 50% (B) less than 50% (C) We cannot know it till now 3), If your partner chose A, and you chose X, how much are you paid? ______ your partner?_____ Now you may make your choice for the first period!
Instructions for Experiment 4 In Experiment 4, you will play for 20 periods, and will earn money depending on the decisions you make in each period. On your screen, you will see two “bingo cages”, labeled cage A, and cage B (Figure 4).
(Fig. 4) At the beginning of each period, the computer will randomly draw an integer number which can be equal to 1, 2, 3, 4, 5, or 6, with equal probability, to determine whether cage A or cage B will be used for the task: if 1 through m (here m would be 2, 3, or 4 and announced later) is drawn, we use cage A for the task; otherwise we use cage B. Please remember, cage A contains six balls, four Red balls (R) and two Green balls (G) (i.e. 4R & 2G); cage B also contains six balls, three Red balls (R) and three Green balls (G) (i.e. 3R & 3G).
41
What the task is about. For each period, the computer first randomly selects an integer number (from 1 to 6), and then a specific value of m (m=2, 3, or 4) is randomly selected and announced, thus determining which cage (A or B) will be used. The result of this draw is not revealed to you. If cage A (or B) is selected, six draws (with replacement) from this cage are performed, and the results (e.g. GGRRGG) are displayed on your screen. You can record the outcomes of the draws on your record sheet if you wish. Your decision for each period: which is the cage (A or B) that you believe used to generate the observations on your screen? You will not receive any feedback about the correctness of your responses until the end of the last period. What the payment is about. After Experiment 4, we will count the number of periods in which your guess is right, and then rank the participants based on their scores. The participant with the highest score will be awarded 200 Yuan at the end of this study (if there are more than one participants who get the same highest score, the 200 Yuan prize will be shared equally among the winners.) Comprehension Questions: Please answer following questions. Raise your hand if you need help. The instructor will come to help you and will check your answers when you are done. 1), Please read carefully the above table (Figure 4) which may appear on your screen. Suppose m=4, what is the probability that cage A is selected? (A) 2/6 (B) 3/6 (C) 4/6 2), If cage A is selected, what is the probability that a Red is drawn? (A) 3/6 (B) 4/6 3), If cage B is selected, what is the probability that a Red ball is drawn? (A) 3/6 (B) 4/6 Please make your decision seriously for each period, thank you! END! Appendix 3: Questionnaire 1. Gender (1) Female (2) Male 2. How old are you? ___ years 3. Race
42
(1) Minority ethnic group (2) Han 4. Citizen (1) Rural (2) Urban 5. At which year do you live in the campus? (1) 1st year (2) 2nd year (3) 3rd year (4) 4th year (5) 5th year (6) others 6. Field of studies (1) Economics-related (2) Noneconomics-related 7. Your highest degree goal (1) Bachelor (2) Master (3) Ph.D. 8. Are you a member of Communist Party of China (CPC)? (1) No (2) Yes 9. Are you a student leader (i.e. Ganbu)? (1) No (2) Yes 10. Your father’s education (1) Primary school (2) Middle school (3) High school (4) Junior college (5) College (6) Graduate school 11. Your Mother’s education (1) Primary school (2) Middle school (3) High school (4) Junior college (5) College (6) Graduate school 12. Mother’s occupation (1) Government employee (2) Company employee (3) Self-employed worker (4) Retired (5) Jobless (6) Others 13. Father’s occupation (1) Government employee (2) Company employee (3) Self-employed worker (4) Retired (5) Jobless (6) Others 14. The size of your family members (including your grandfather/mother, father/mother) _____ persons 15. Do you have siblings? (1) No (2) Yes 16. Do you grow from a single-parent family? (1) No (2) Yes
43
17. Family economics situation (1) Very low (2) Average (4) Above average (5) Well (6) Very well 18. In order to finish your education, did you apply for any financial aid? (1) No (2) Yes 19. Do you have some work experience? (1) No (2) Yes 20. Did you participant the similar economic decision making experiments in the past? (1) No (2) Yes 21. Did you participant the psychological experiments in the past? (1) No (2) Yes 22. Suppose your earning is the only source of your family income, which the following option will you choose: (1) Option A: your earning is constant and is equal to the sum of the current incomes of your parents; Option B: your earning is uncertain, with 50% you earn two times of the sum, with 50% you earn 66.7% of the sum. Which option will you choose? (2) Option A: your earning is constant and is equal to the sum of the current incomes of your parents; Option B: your earning is uncertain, with 50% you earn two times of the sum, with 50% you earn 50% of the sum. Which option will you choose? (3) Option A: your earning is constant and is equal to the sum of the current incomes of your parents; Option B: your earning is uncertain, with 50% you earn two times of the sum, with 50% you earn 80% of the sum. Which option will you choose? (4) Option A: your earning is constant and is equal to the sum of the current incomes of your parents; Option B: your earning is uncertain, with 50% you earn two times of the sum, with 50% you earn 90% of the sum. Which option will you choose? 23. Are you generally a person who is fully prepared to take risks or do you try to avoid taking risk? Please tick a box on the scale, where the value 1 means: “unwilling to take risks” and the value 10 means: “fully prepared to take risk”
1, 2, 3, 4, 5, 6, 7, 8, 9, 10
44
24. Suppose you face 7 following options in the real world, which option will you choose? (1) with 0.1% you could obtain 100,000 Yuan otherwise obtain zero Yuan (2) with 1% you could obtain 10,000 Yuan otherwise obtain zero Yuan (3) with 10% you could obtain 1,000 Yuan otherwise obtain zero Yuan (4) with 25% you could obtain 400 Yuan otherwise obtain zero Yuan (5) with 50% you could obtain 300 Yuan otherwise obtain zero Yuan (6) with 75% you could obtain 133 Yuan otherwise obtain zero Yuan (7) you could certainly obtain 100 Yuan 25. Do you agree that “most people are basically honest”? (1) Strongly disagree (2) Disagree (3) Neutral (4) Agree (5) Strongly Agree 26. Do you agree that “most people are trustworthy”? (1) Strongly disagree (2) Disagree (3) Neutral (4) Agree (5) Strongly Agree 27. Do you agree that “most people trust a person if the person trusts them”? (1) Strongly disagree (2) Disagree (3) Neutral (4) Agree (5) Strongly Agree 28. Do you agree that “most people are basically good-natured and kind”? (1) Strongly disagree (2) Disagree (3) Neutral (4) Agree (5) Strongly Agree 29. Do you agree that “most people are trustful of others”? (1) Strongly disagree (2) Disagree (3) Neutral (4) Agree (5) Strongly Agree 30. Do you agree that “generally, I am trustful”? (1) Strongly disagree (2) Disagree (3) Neutral (4) Agree (5) Strongly Agree 31. Do you agree that “If I suffer a serious wrong, I will take revenge as soon as possible, no matter what the costs”? Please tick a box on the scale, where the value 1 means: “strongly disagree” and the value 7 means: “strongly agree”
1, 2, 3, 4, 5, 6, 7 32. Do you agree that “If someone offends me, I will also offend him/her”? Please tick a box on the scale, where the value 1 means: “strongly disagree” and the value 7 means: “strongly agree”
1, 2, 3, 4, 5, 6, 7 32. Are you generally a person who fully controls herself for temptation issues, e.g. quitting smoking, finishing homework in time, keeping fit, saving money for long-term plan, etc.? Please tick a box on the scale, where the value 1 means: “very poor in self-control” and the value 10 means: “very good at self-control”
1, 2, 3, 4, 5, 6, 7, 8, 9, 10 33. Are you generally a person who cares about others’ feelings and benefits?
45
Please tick a box on the scale, where the value 1 means: “strong do not care about” and the value 10 means: “strongly care about”
1, 2, 3, 4, 5, 6, 7, 8, 9, 10 34. A bat and a ball cost $ 1.10 in total. The bat costs $ 1.00 more than the ball. How much does the ball cost? ____ cents 35. If it takes 5 machines 5 minutes to make 5 widgets, how long would it take 100 machines to make 100 widgets? _____ minutes 36. In a lake, there is a patch of lily pads. Every day, the patch doubles in size. If it takes 48 days for the patch to cover the entire lake, how long would it take for the patch to cover half of the lake? _____ days Appendix 4:
The Pre-programmed Assignment Rule
Possible Groups Possible Number of Trustworthy Subjects in a Session
The Number of Trustworthy Subjects Assigned to Group 1
The Number of Non-trustworthy Subjects assigned to Group 1
Groups 0 0 0 Groups 1 1 1 Groups 2 2 2 Groups 3 2 2 Groups 4 3 3 Groups 5 4 4 Groups 6 5 4 Groups 7 5 4 Groups 8 6 4 Groups 9 7 3 Groups 10 7 3 Groups 11 7 3 Groups 12 8 2 Groups 13 9 2 Groups 14 10 1 Groups 15 12 1 Groups 16 14 1 Groups 17 16 1 Groups 18 17 0 Groups 19 10 0 Groups 20 20 0
46
Notes: In this table, for each possible number of trustworthy trustees emerged in the third part of experiment (i.e. the part of trustees’ choices), we randomly assigned part of them into Group 1, and at the meantime several untrustworthy trustees were also randomly selected to mix with the trustworthy ones in Group 1, to make sure that at least 50% of trustees in Group 1 chose to honor trust while in Group 2 less than 50% did it. Appendix 5:
Assignment of trustees across-session Session 1:
Trustee type High Group Low Group Untrustworthy trustee 2 15 Trustworthy trustee 2 1
Session 2:
Trustee type High Group Low Group Untrustworthy trustee 4 11 Trustworthy trustee 4 1
Session 3:
Trustee type High Group Low Group Untrustworthy trustee 4 8 Trustworthy trustee 6 2
Session 4:
Trustee type High Group Low Group Untrustworthy trustee 4 8 Trustworthy trustee 6 2
Session 5:
Trustee type High Group Low Group Untrustworthy trustee 4 11 Trustworthy trustee 4 1
Session 6:
Trustee type High Group Low Group Untrustworthy trustee 4 9 Trustworthy trustee 5 2
Session 7:
Trustee type High Group Low Group Untrustworthy trustee 4 10 Trustworthy trustee 5 1