

1
Emission Control Impact on Ozone Levelsfrom mobile and point sources in southern China
Ying Li, Alexis Lau, Jimmy Fung
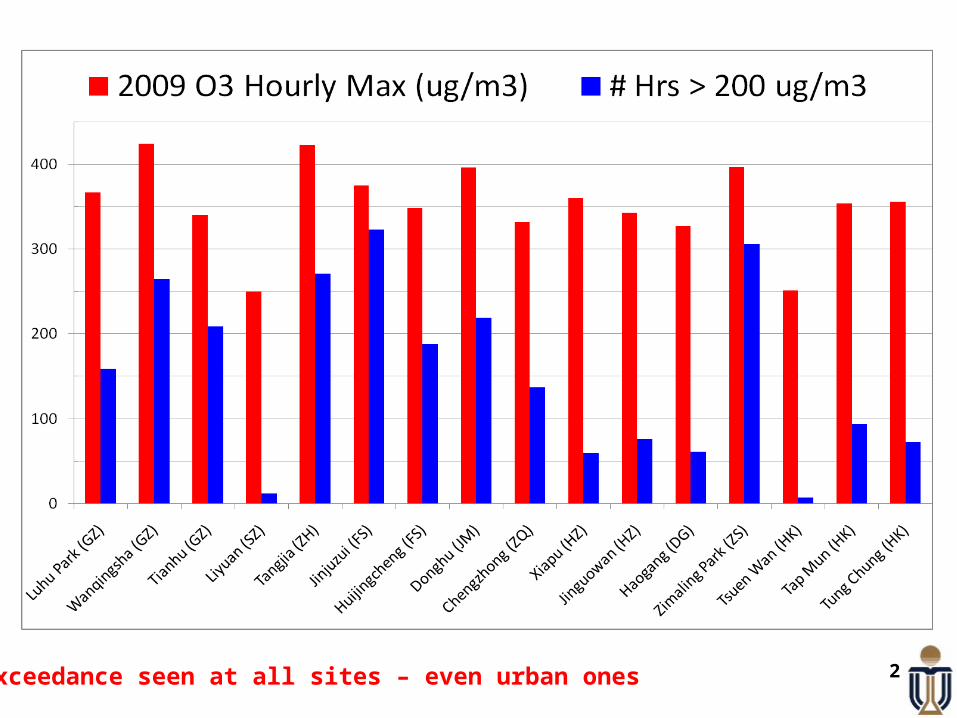
2Exceedance seen at all sites – even urban ones
3
Emission updateEmission update
andand
Model verificationModel verification

4
MODELING SYSTEM (recently update)
Meteorological
MM5v3.6.3
Emission Processor
SMOKE 2.4
+Gridded Emission
INTEX-B
Air Quality Model
CMAQ 4.6
Air Quality Model
CAMx 5.10

5-522 -468 -414 -360 -306 -252 -198 -144 -90 -36 18 72 126 180 234 288 342
-967.5
-913.5
-859.5
-805.5
-751.5
-697.5
-643.5
-589.5
-535.5
-481.5
-427.5
-373.5
-319.5
-2403 -1971 -1539 -1107 -675 -243 189 621 1053 1485 1917 2349-1876.5
-1660.5
-1444.5
-1228.5
-1012.5
-796.5
-580.5
-364.5
-148.5
67.5
283.5
499.5
715.5
931.5
1147.5
1363.5
1579.5
1795.5
-291 -264 -237 -210 -183 -156 -129 -102 -75 -48 -21 6 33 60 87 114 141-754.5
-727.5
-700.5
-673.5
-646.5
-619.5
-592.5
-565.5
-538.5
-511.5
-484.5
-457.5
-430.5
27km
9km
3km
Parameter Value
Projection Lambert-Conformal
Alpha 15 degrees North Latitude
Beta 40 degrees North Latitude
x center 114 degrees East Longitude
y center 28.5 degrees North Latitude
Coordinate system projection parameters for the PATH Modelling system.
6
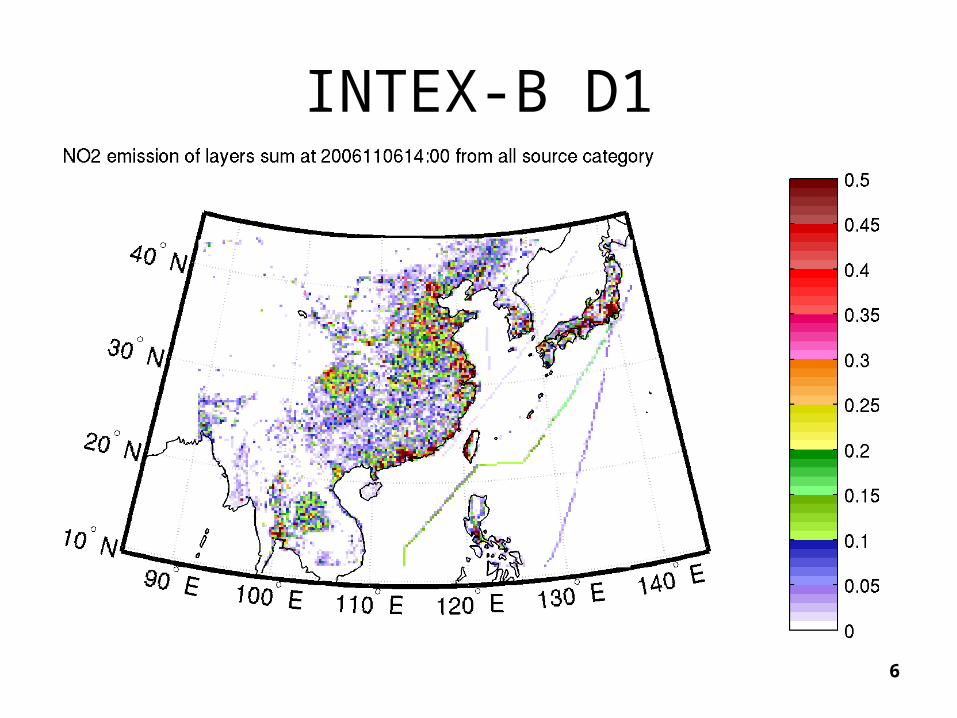
INTEX-B D1
7
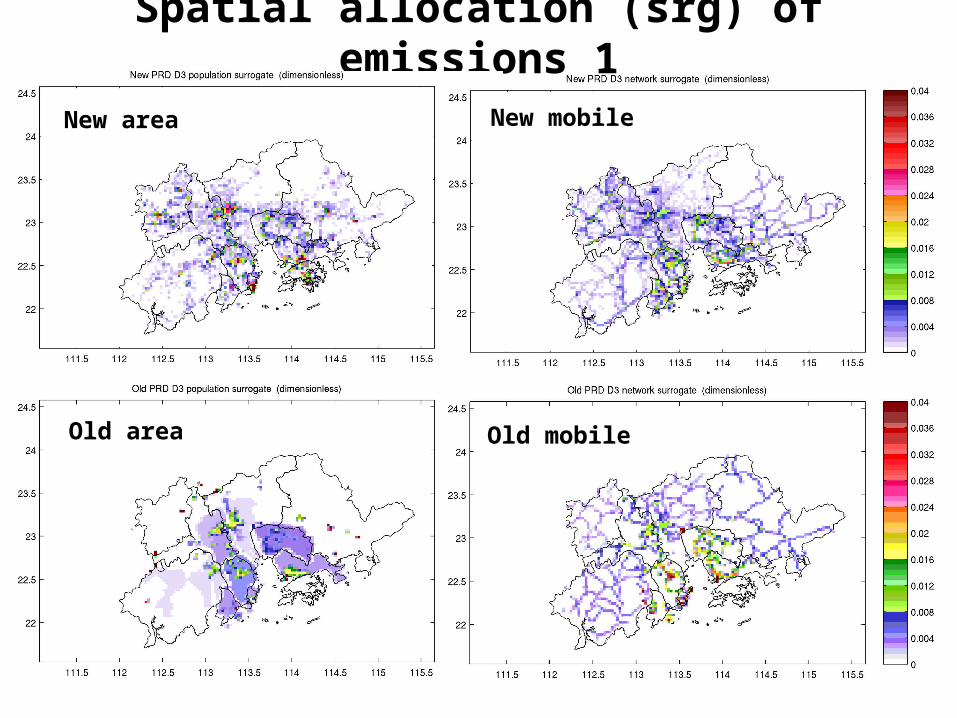
Spatial allocation (srg) of emissions 1
New area
Old area
New mobile
Old mobile
8
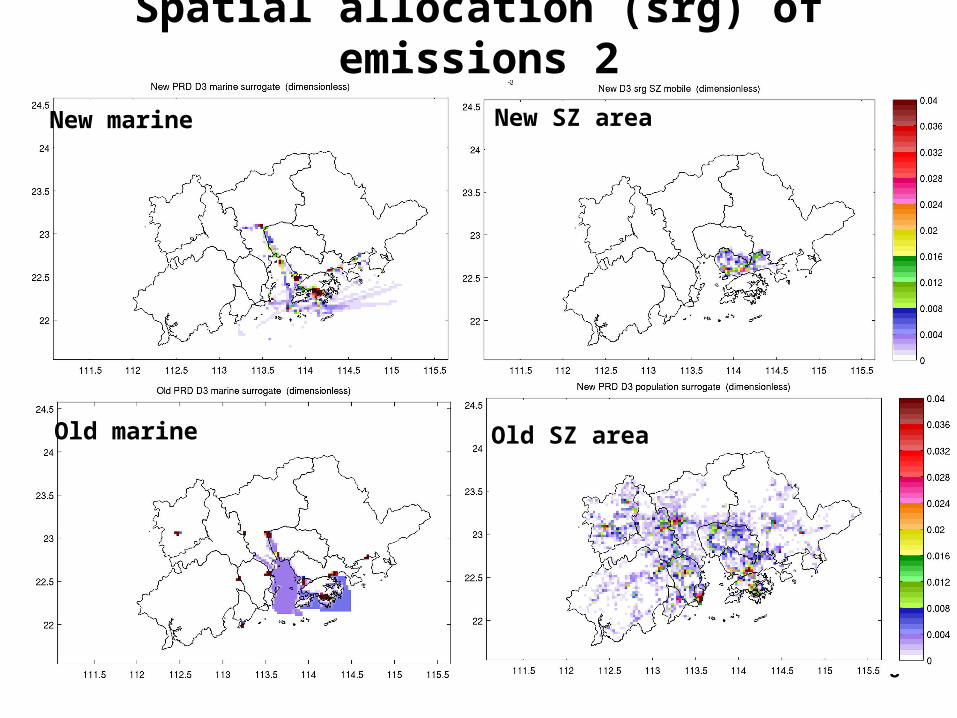
Spatial allocation (srg) of emissions 2
New marine
Old marine
New SZ area
Old SZ area
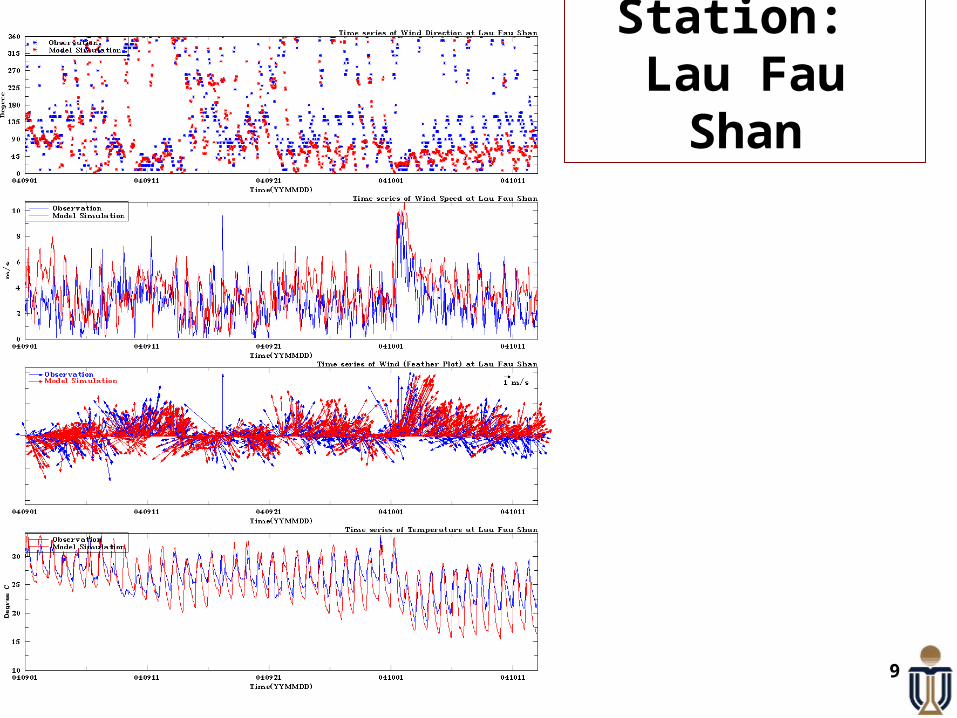
9
Station: Lau Fau Shan

10
Simulation of ozone maxima
is improved
Luhu site of GZ
Donghu site of Jiangmen
Simulation of ozone maxima
is improved

11
Temporal trend of Ozone-NOx-VOC sensitivity
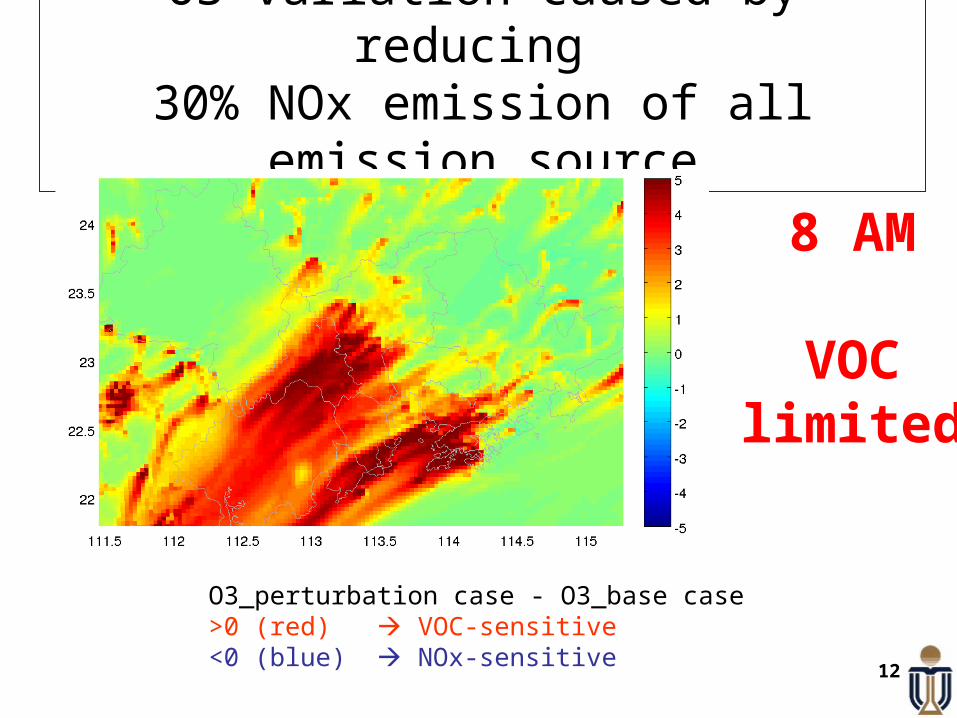
12
O3 variation caused by reducing 30% NOx emission of all emission source
O3_perturbation case - O3_base case>0 (red) VOC-sensitive<0 (blue) NOx-sensitive
8 AM
VOClimited
13
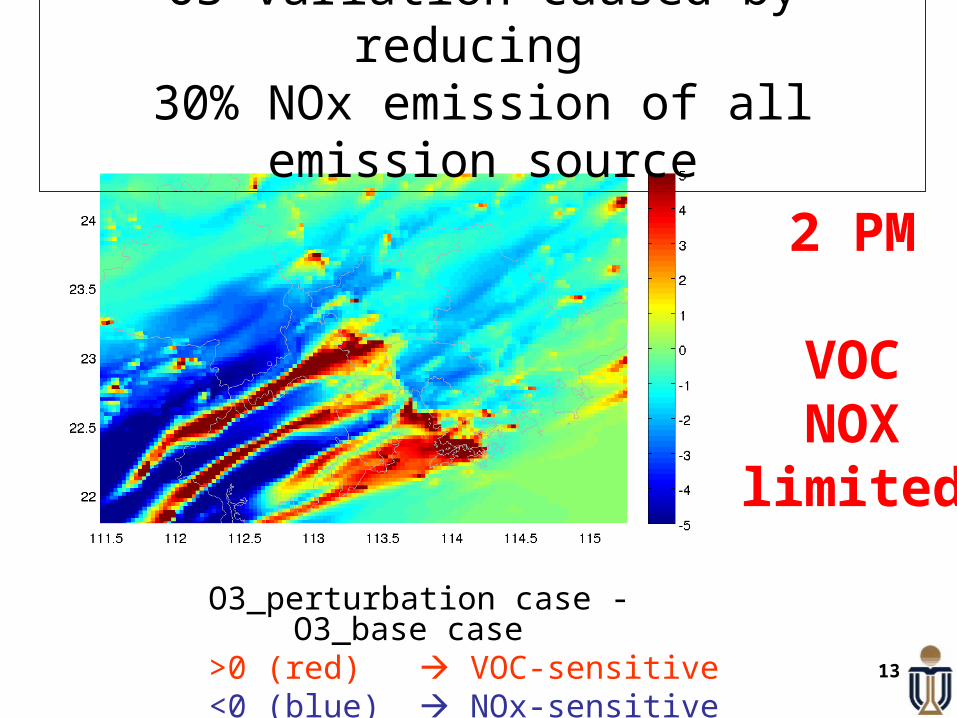
O3 variation caused by reducing 30% NOx emission of all emission source
O3_perturbation case - O3_base case>0 (red) VOC-sensitive<0 (blue) NOx-sensitive
2 PM
VOCNOX
limited

14
Base case: O3 concentration at 2PM

15
Feasible ozone control strategies, and evaluation
Mobile : NOx & VOCPoint : NOxArea : VOC
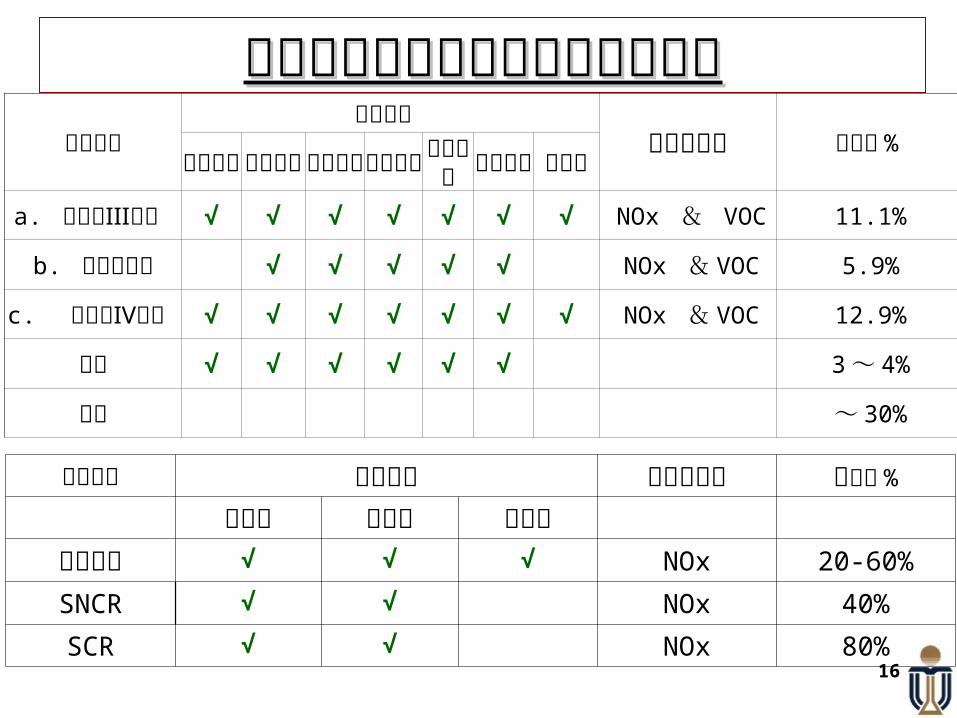
16
减排措施适合范围
目标污染物 可削减 %汽油小客
汽油小货
汽油大客
柴油小货
柴油大客
柴油大货
摩托车
a. 推行国Ⅲ标准 √ √ √ √ √ √ √ NOx & VOC 11.1%
b. 机动车限行 √ √ √ √ √ NOx & VOC 5.9%
c. 推行国Ⅳ标准 √ √ √ √ √ √ √ NOx & VOC 12.9%
其它 √ √ √ √ √ √ 3 ~ 4%
总合 ~ 30%
交通源及点源控制措施及减排效率交通源及点源控制措施及减排效率
减排措施 适用范围 目标污染物 可削减 %
大电厂 小电厂 工业源低氮燃烧 √ √ √ NOx 20-60%
SNCR √ √ NOx 40%
SCR √ √ NOx 80%
17
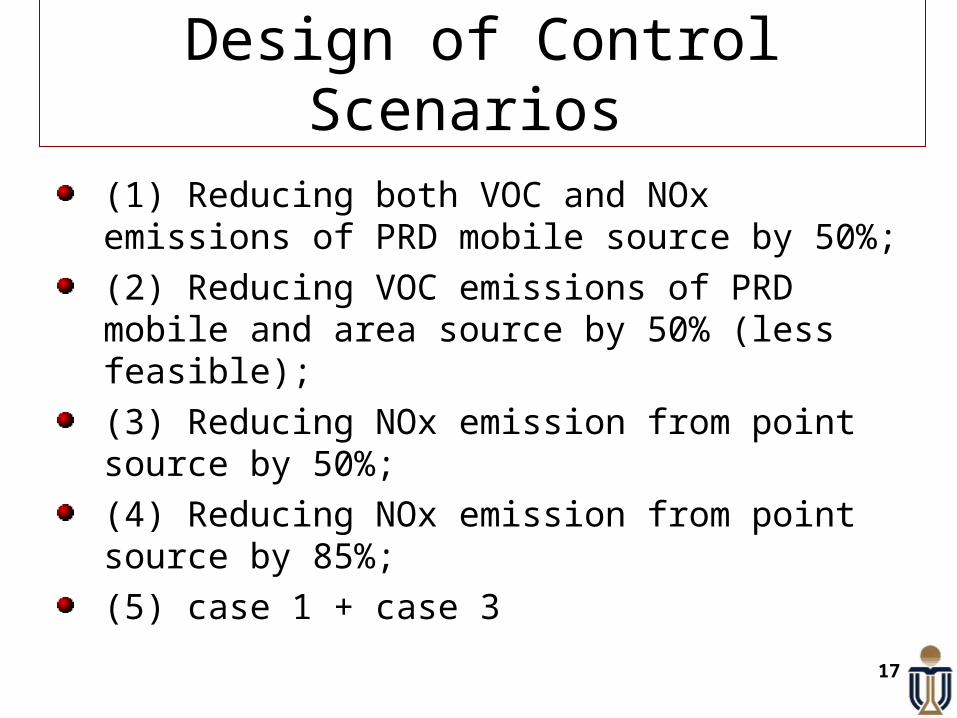
Design of Control Scenarios
(1) Reducing both VOC and NOx emissions of PRD mobile source by 50%;
(2) Reducing VOC emissions of PRD mobile and area source by 50% (less feasible);
(3) Reducing NOx emission from point source by 50%;
(4) Reducing NOx emission from point source by 85%;
(5) case 1 + case 3
18
What’s the mobile control impact on ozone concentration?
19
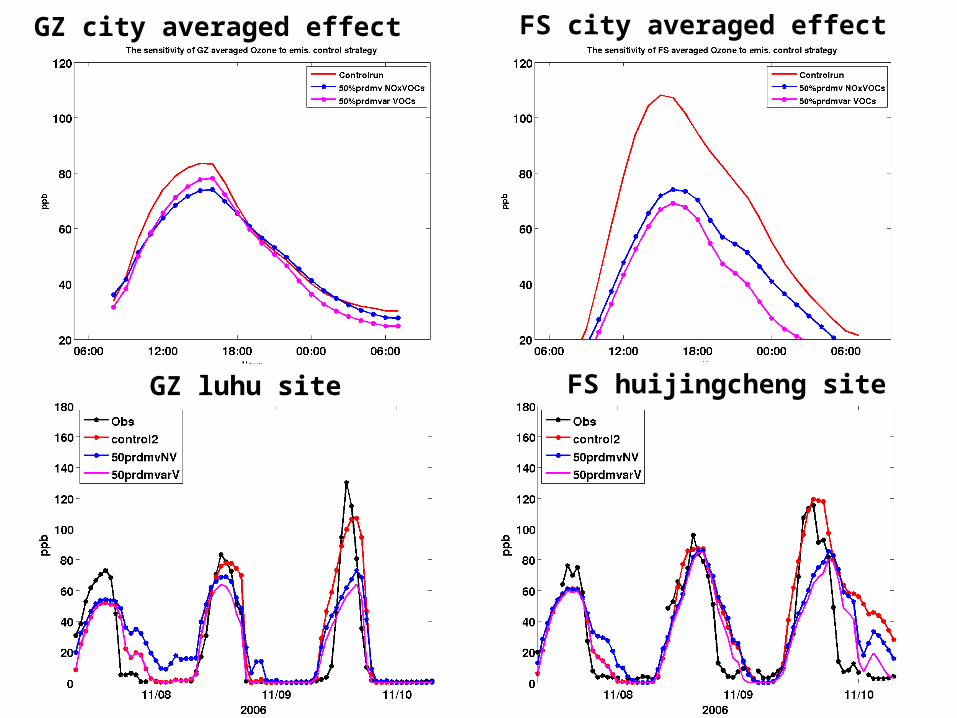
GZ city averaged effect FS city averaged effect
GZ luhu site FS huijingcheng site

20
What’s the point source control impact on ozone
concentration?

21
The O3 time series of NOx/VOCs zero impact of GZ city average

22
Autumn case :O3 and O3 variation by reducing 50% NOx from point source
Color: Base case
Contour:black: O3 decr.white: O3 incr
Color: with NOX control
Contour:black: O3 decr.white: O3 incr
23
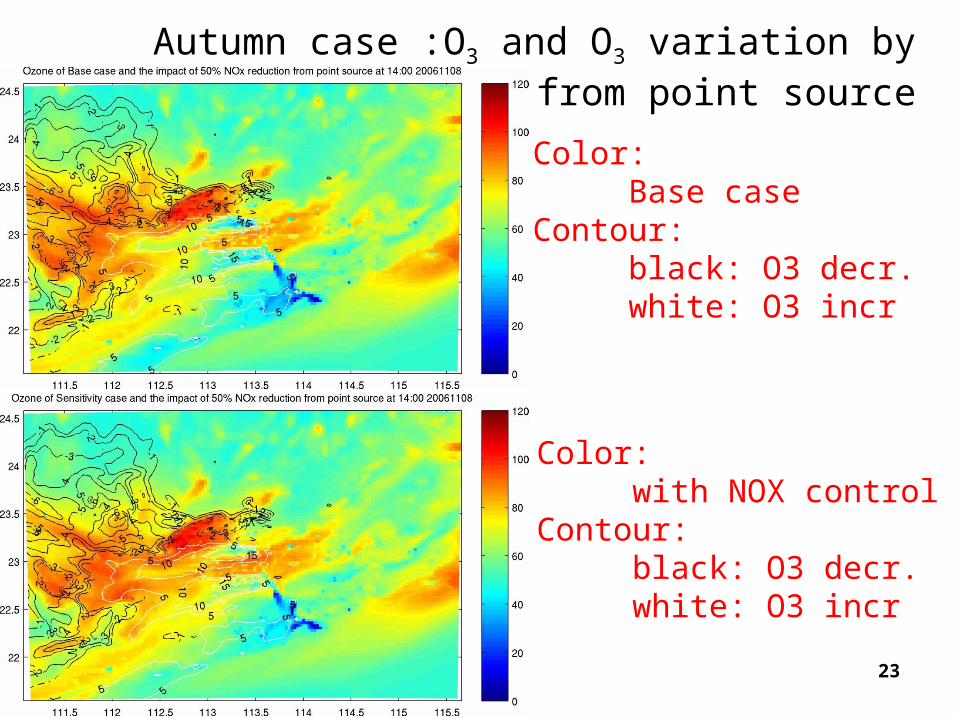
Autumn case :O3 and O3 variation by reducing 50% NOx from point source
Color: Base case
Contour:black: O3 decr.white: O3 incr
Color: with NOX control
Contour:black: O3 decr.white: O3 incr
24
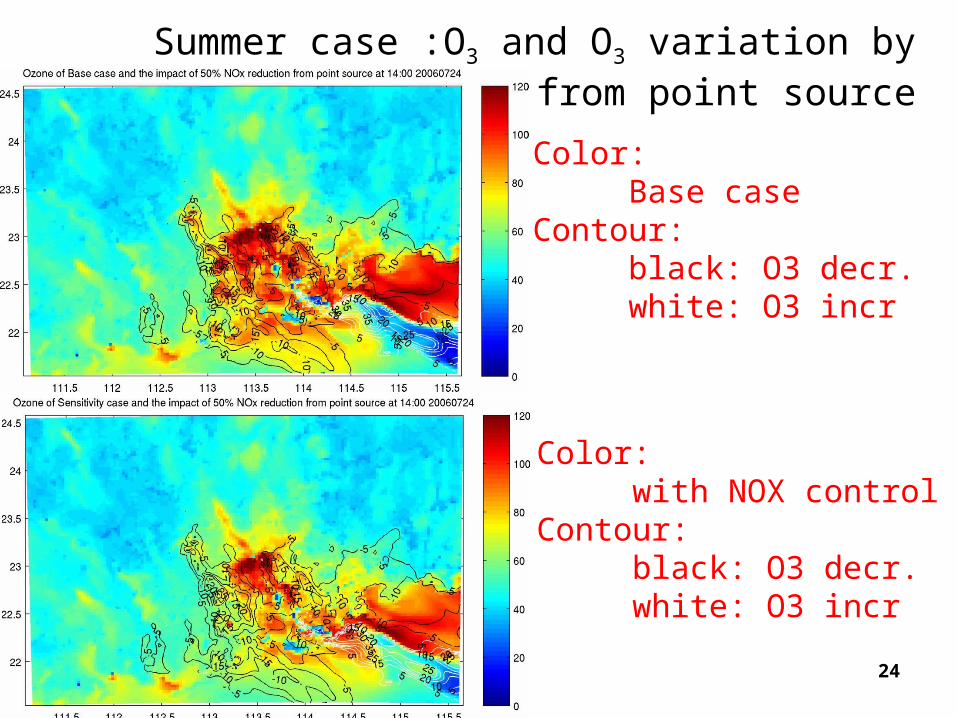
Summer case :O3 and O3 variation by reducing 50% NOx from point source
Color: Base case
Contour:black: O3 decr.white: O3 incr
Color: with NOX control
Contour:black: O3 decr.white: O3 incr
25
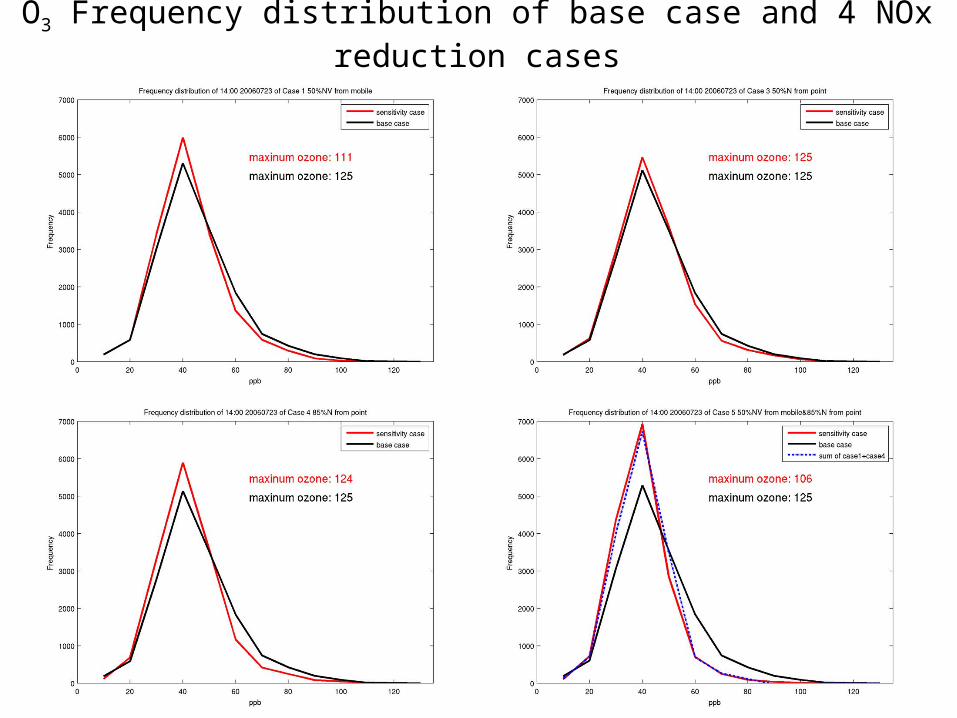
O3 Frequency distribution of base case and 4 NOx reduction cases
26
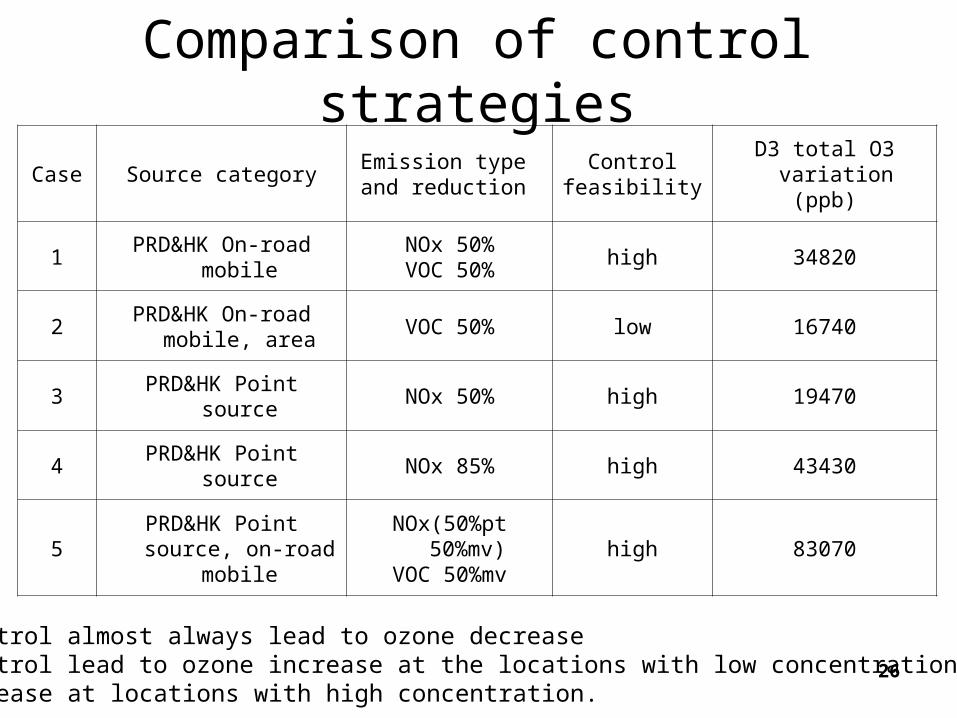
Case Source categoryEmission type and reduction
Controlfeasibility
D3 total O3 variation (ppb)
1 PRD&HK On-road mobileNOx 50%VOC 50%
high 34820
2PRD&HK On-road
mobile, areaVOC 50% low 16740
3 PRD&HK Point source NOx 50% high 19470
4 PRD&HK Point source NOx 85% high 43430
5PRD&HK Point source,
on-road mobileNOx(50%pt 50%mv)
VOC 50%mvhigh 83070
Comparison of control strategies
•VOC control almost always lead to ozone decrease•NOx control lead to ozone increase at the locations with low concentration, and decrease at locations with high concentration.
27
Summary of feasible O3 Control strategy priority of the autumn case
Reduce PRD 50% traffic is the most effective control strategy Reduce PRD 50% VOCs from traffic and area has similar effect in GZThe large point sources are not the major sources for these ozone increased, but lead to NOx-titration effect. The contribution from these large point sources is notable in the areas further downwind. The sources that generate the elevated ozone in the upwind areas to the point sources and the point sources that positively contribute to the ozone formation should be considered as the real contributing sources for the highest ozone concentration.


