
A WILDFIRE THREAT RATING SYSTEM FOR THE BIRKENHEAD AND GATES LANDSCAPE UNITS,
BRITISH COLUMBIA
Bruce A. Blackwell B.A. Blackwell & Associates Ltd., 3087 Hoskins Road, North Vancouver, BC V7J 3B5, Canada
Robert W. Gray R.W. Gray Consulting Ltd., 6311 Silverthorne Road, Chilliwack, BC V2R 2N1, Canada
Fiona M. Steele, Amelia J. Needoba, and Robert N. Green B.A. Blackwell & Associates Ltd., 3087 Hoskins Road, North Vancouver, BC V7J 3B5, Canada
Ken MacKenzie Iverson & MacKenzie Ltd., P.O. Box 511, Lac La Hache, BC V0K 1T0, Canada
ABSTRACT
In 2000 the Squamish Forest District began a pilot project to study the effects of prescribed fire on forest succession, fuel dynamics, regeneration, wildlife habitat, and timber supply within two landscape units encompassing 103,000 ha north of Pemberton, British Columbia. These landscapes have been negatively affected by fire suppression during the previous 100 years. In the absence of fire, the structure and function of many ecosystems within the study area have been altered. This has resulted in deterioration of forest health, increased fuel loadings and resulting fire hazard, and negative impacts on available wildlife habitat. The first objective of the pilot project is to use the Wildfire Threat Rating System (WTRS), a Geographic Information System (GIS)-based model, to spatially identify those areas that 1) pose a significant fire threat, 2) have been significantly impacted by the effects of fire suppression, and 3) have the highest risk of loss or damage from wildfire effects. The second objective of the project is to develop mechanical and prescribed fire treatment strategies designed to restore ecosystem structure and function and to ameliorate suppression impacts on forest succession, forest health, fuels, and wildlife habitat. We document the results of the WTRS and identify candidate treatments and treatment areas where ecosystem restoration can be targeted
keywords: British Columbia, fire, fire management, Geographic Information System, historic fire regime, historic range of variability, Wildfire Threat Rating System.
Citation: Blackwell, B.A., R.W. Gray, F.M. Steele, A.J. Needoba, R.N. Green, and K. MacKenzie. 2004. A Wildfire Threat Rating System for the Birkenhead and Gates landscape units, British Columbia. Pages 163–174 in R.T. Engstrom, K.E.M. Galley, and W.J. de Groot (eds.). Proceedings of the 22nd Tall Timbers Fire Ecology Conference: Fire in Temperate, Boreal, and Montane Ecosystems. Tall Timbers Research Station, Tallahassee, FL.
INTRODUCTION fire suppression have resulted in unstable forest
Historically, the approach to wildfire management in ecosystems that are increasingly susceptible to physi-
British Columbia and throughout North America has cal and biological stresses (e.g., Covington and Moore
involved the suppression of fire to protect forest 1994, Mutch 1994, Weir et al. 1995, Arno 1996, Tiede
ecosystems and other values (Elfring 1989, Romme mann et al. 2000). Conditions such as increased fire
and Despain 1989, Parsons and Botti 1996, Canadian hazard due to the build-up of fuels, and the outbreak of
Forest Service [CFS] 2001). Suppression as a general- forest pests and disease are indicators of ecosystem
ly applied management strategy fails to address the instability (Rapport and Yazvenko 1996, Tiedemann et
role of fire as a reoccurring natural disturbance in al. 2000). Catastrophic wildfires, such as the Yellow-many forest ecosystems. Fire history studies in dry stone National Park fires in 1988, the Washington and forests have shown fire return intervals ranging from 7 Idaho fires in 1994, and the 2000 wildfires in the Bit-to 17 years were naturally occurring in British terroot National Forest in Montana are symptomatic of Columbia prior to European settlement (Gray 2001). the conditions caused by total fire suppression in fire-Numerous studies suggest that widespread policies of adapted ecosystems. Within British Columbia, exam
163
164 BLACKWELL ET AL.
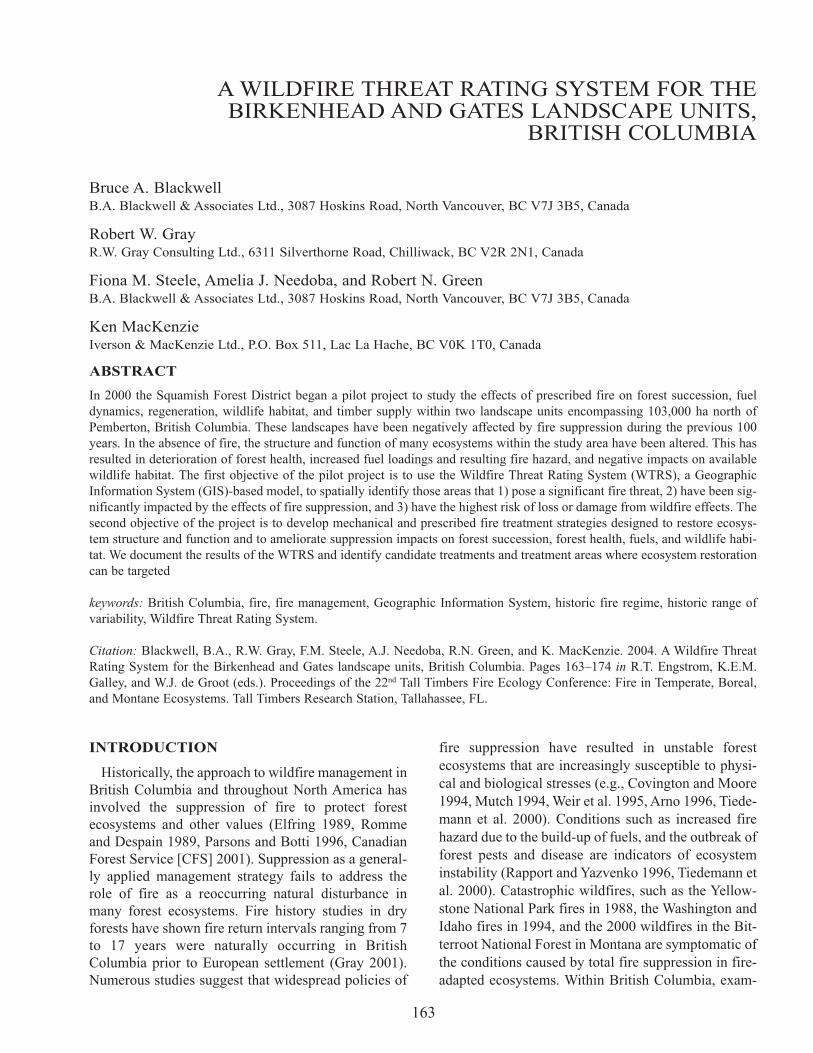
Figure 1. Overview map showing the study area (Birkenhead and Gates landscape units [LU]) and the locations of Mount Robson and E.C. Manning provincial parks where the Wildfire Threat Rating System (WTRS) model has been applied in British Columbia.
ples of catastrophic wildfire include the “Garnet Fire” resources have been put at risk. Paradoxically it is in Penticton in 1994 and the “Silver Fire” near Salmon these instances that have prompted a shift away from Arm in 1998. the view that forest fire is uniformly bad. The failure In cases of catastrophic wildfire, fire suppression of suppression attempts has raised questions about
capabilities have not always been effective. As a how fire could be better managed to reduce risk, and result, human lives, infrastructure, and natural this has led to a greater public awareness of the com-
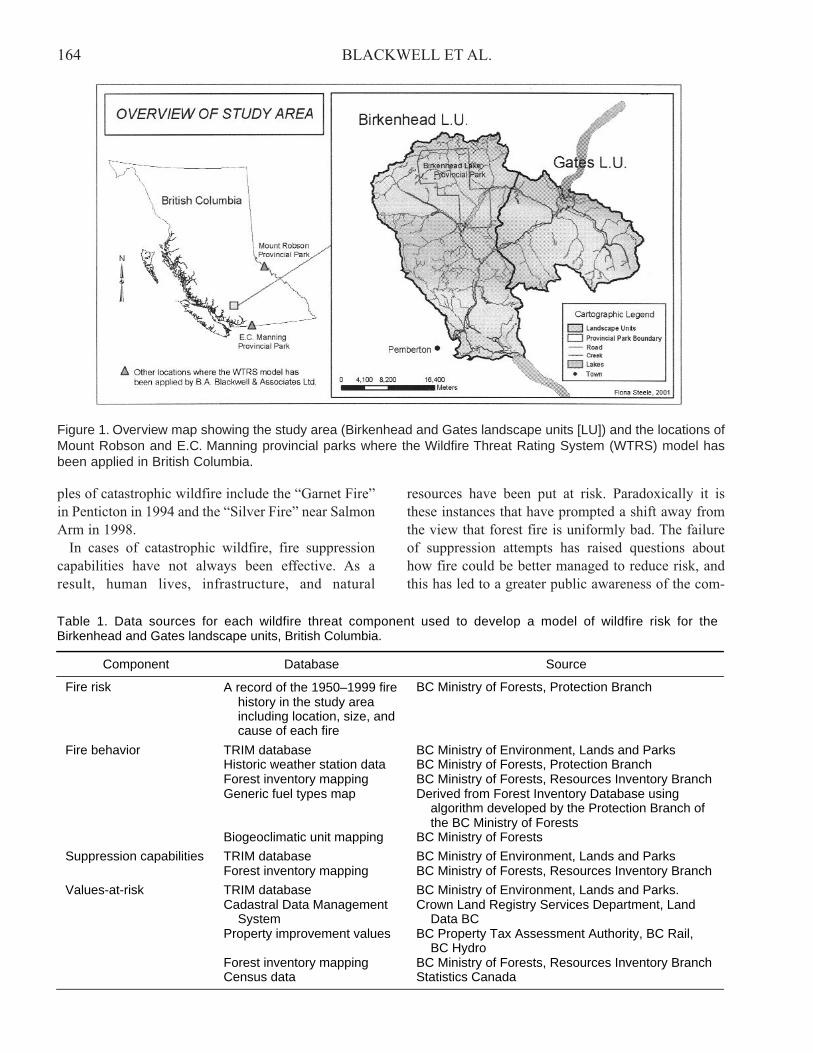
Table 1. Data sources for each wildfire threat component used to develop a model of wildfire risk for the Birkenhead and Gates landscape units, British Columbia.
Component Database Source
Fire risk A record of the 1950–1999 fire BC Ministry of Forests, Protection Branch history in the study area including location, size, and cause of each fire
Fire behavior TRIM database BC Ministry of Environment, Lands and Parks Historic weather station data BC Ministry of Forests, Protection Branch Forest inventory mapping BC Ministry of Forests, Resources Inventory Branch Generic fuel types map Derived from Forest Inventory Database using
algorithm developed by the Protection Branch of the BC Ministry of Forests
Biogeoclimatic unit mapping BC Ministry of Forests
Suppression capabilities TRIM database BC Ministry of Environment, Lands and Parks Forest inventory mapping BC Ministry of Forests, Resources Inventory Branch
Values-at-risk TRIM database BC Ministry of Environment, Lands and Parks. Cadastral Data Management Crown Land Registry Services Department, Land
System Data BC Property improvement values BC Property Tax Assessment Authority, BC Rail,
BC Hydro Forest inventory mapping BC Ministry of Forests, Resources Inventory Branch Census data Statistics Canada
165 WILDFIRE THREAT RATING SYSTEM
plex role of natural fire in ecosystems and the need to manage it accordingly (CFS 2001). Increased understanding and awareness of fire as a natural ecosystem process has prompted efforts to identify and quantify wildfire threat in order to reduce the probability of catastrophic fire events. Assessing wildfire threat has proven to be a difficult task because wildfire occurrence and behavior depend on numerous factors that are often difficult to measure. The development of computerized decision-support
systems that manipulate spatial information on fuels, fire occurrence and behavior, suppression resources, fire weather, and resource values has enhanced fire management in Canada (Hawkes et al. 1997). Such support systems can considerably improve the efficiency and quality of management decisions. Presenting critical information in a spatial format simplifies analysis of the large geographical areas that forest managers generally have to consider. The application of GIS to support fire management planning has facilitated “the integration of large amounts of information about environmental and societal factors, which are spatially and temporally dynamic” (Salazar and Nils-son 1989:311). WTRS is a GIS-based model that spatially quanti
fies and analyses the relationships among the critical factors affecting wildfire risk (Blackwell et al. 2000). The model is designed as a decision-support tool that identifies the severity of wildfire threat within a specified area, to allow managers to analyze and explore the implications of different management activities in relation to wildfire risk. The system is conceptually simple and structured to be dynamic and flexible to the primary concerns of different users. It was originally developed in Australia (Vodopier and Haswell 1995) and then adapted for the McGregor Model Forest (Hawkes et al. 1997). It has since been further enhanced by B.A. Blackwell & Associates Ltd. and applied to a number of British Columbia’s provincial parks and recreation areas including E.C. Manning and Skagit provincial parks, Mount Robson Provincial Park, Cascade Recreation Area, and most recently, the Birkenhead and Gates landscape units (LUs) in the Squamish Forest District (Figure 1).
STUDY AREA
The study area includes two landscape units. A landscape unit (LU) is defined as a large geographical area designated for landscape-level planning for biodiversity conservation, according to British Columbia’s Forest Practices Code (Ministry of Forests and Ministry of Environment, Lands and Parks 1999). The Birken
head and Gates LUs (lat 123°00′00″N, long 50°42′00″W; lat 122°12′00″N, long 50°42′00″W; lat 123°00′00″N, long 50°18′00″W; lat 122°12′ 00″N, long 50°18′00″W) are situated on the leeward side of the Pacific Ranges in the Coast Mountains Region of southwestern British Columbia (Figure 1). The area covers 103,283 ha and contains Birkenhead Lake Provincial Park in the northern portion of the Birkenhead LU. The communities of Mount Currie, Devine, Birken, and D’Arcy fall within the area. The town of Pemberton is approximately 3 km southwest of the Birkenhead LU. The Portage Road and the BC Rail railway line run northeast through the two landscape units. In British Columbia a hierarchical system called
Biogeoclimatic Ecosystem Classification is used to classify ecosystems using a combination of climate, topography, soils, and vegetation (Klinka and Green 1994). The system uses regional climate and associated floristic features to differentiate biogeoclimatic zones, subzones, and variants. Individual ecosystems occurring locally within areas of regional climate are delineated based on topography, moisture, nutrients, and key floristic indicators. In the Birkenhead and Gates LUs, six biogeoclimatic units are represented. The Wet Warm Interior Douglas-fir (Pseudotsuga menziesii) subzone (IDFww) and Southern Dry Sub-maritime Coastal Western Hemlock (Tsuga heterophylla) variant (CWHds1) dominate low to mid-elevations in the main valleys, composing approximately 29% of the study area. Approximately 32% of the area is composed of the Southern Moist Submaritime Coastal Western Hemlock variant (CWHms1) and the Moist Warm Engelmann Spruce (Picea engelmannii) Subalpine Fir (Abies lasiocarpa) subzone (ESSFmw), which occur in mid- to upper-elevation valleys. The Alpine Tundra zone (AT) and Parkland Moist Warm Engelmann Spruce Subalpine Fir subzone (ESSFmwp) occur at high elevations and compose the largest proportion of the study area (39%).
METHODS
Model Structure
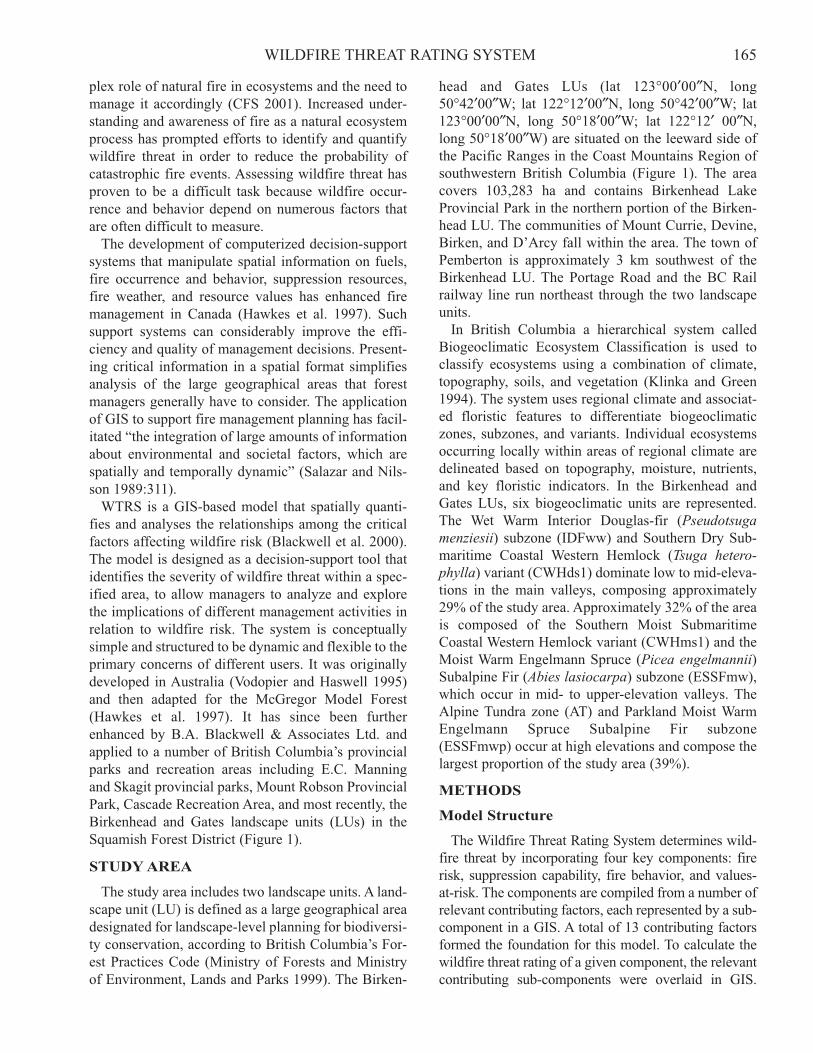
The Wildfire Threat Rating System determines wildfire threat by incorporating four key components: fire risk, suppression capability, fire behavior, and values-at-risk. The components are compiled from a number of relevant contributing factors, each represented by a subcomponent in a GIS. A total of 13 contributing factors formed the foundation for this model. To calculate the wildfire threat rating of a given component, the relevant contributing sub-components were overlaid in GIS.
166 BLACKWELL ET AL.
Figure 2. The structure of the Wildfire Threat Rating System (WTRS).
This process was repeated for each of the four components, which were then in turn, overlaid to produce the final wildfire threat rating theme (Figure 2). Information for each component and sub-component
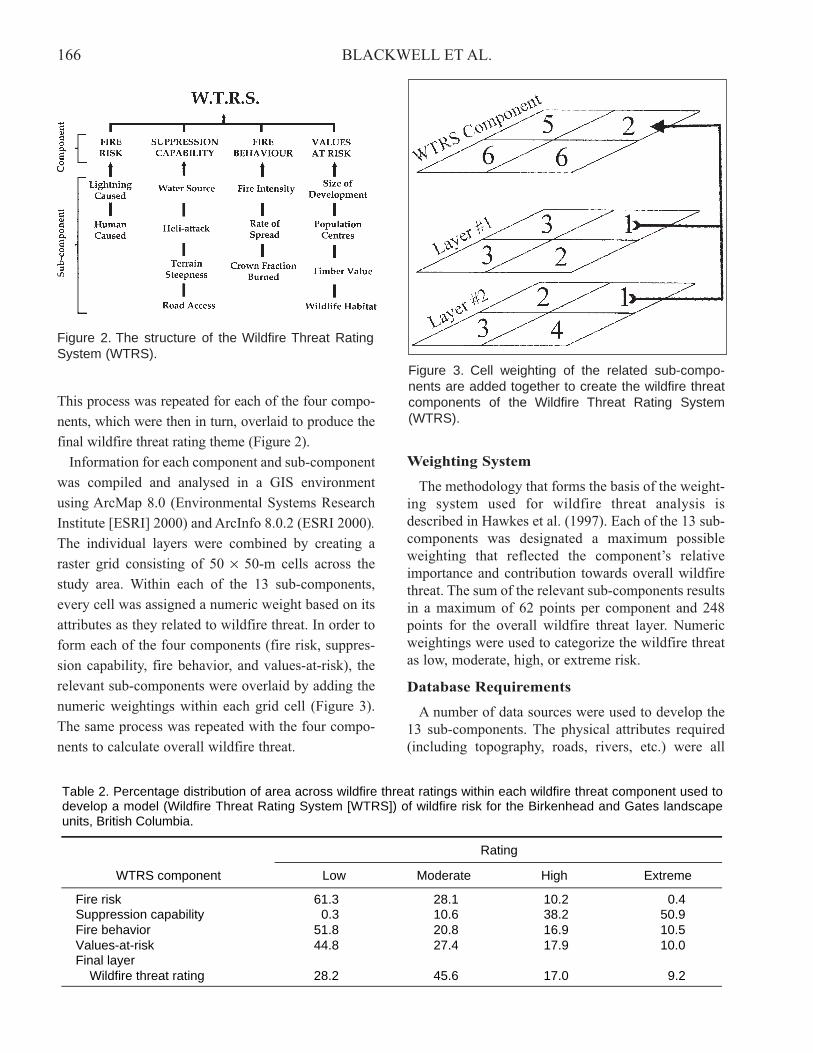
was compiled and analysed in a GIS environment using ArcMap 8.0 (Environmental Systems Research Institute [ESRI] 2000) and ArcInfo 8.0.2 (ESRI 2000). The individual layers were combined by creating a raster grid consisting of 50 × 50-m cells across the study area. Within each of the 13 sub-components, every cell was assigned a numeric weight based on its attributes as they related to wildfire threat. In order to form each of the four components (fire risk, suppression capability, fire behavior, and values-at-risk), the relevant sub-components were overlaid by adding the numeric weightings within each grid cell (Figure 3). The same process was repeated with the four components to calculate overall wildfire threat.
Figure 3. Cell weighting of the related sub-components are added together to create the wildfire threat components of the Wildfire Threat Rating System (WTRS).
Weighting System
The methodology that forms the basis of the weighting system used for wildfire threat analysis is described in Hawkes et al. (1997). Each of the 13 subcomponents was designated a maximum possible weighting that reflected the component’s relative importance and contribution towards overall wildfire threat. The sum of the relevant sub-components results in a maximum of 62 points per component and 248 points for the overall wildfire threat layer. Numeric weightings were used to categorize the wildfire threat as low, moderate, high, or extreme risk.
Database Requirements
A number of data sources were used to develop the 13 sub-components. The physical attributes required (including topography, roads, rivers, etc.) were all
Table 2. Percentage distribution of area across wildfire threat ratings within each wildfire threat component used to develop a model (Wildfire Threat Rating System [WTRS]) of wildfire risk for the Birkenhead and Gates landscape units, British Columbia.
Rating
WTRS component Low Moderate High Extreme
Fire risk 61.3 28.1 10.2 0.4 Suppression capability 0.3 10.6 38.2 50.9 Fire behavior 51.8 20.8 16.9 10.5 Values-at-risk 44.8 27.4 17.9 10.0 Final layer
Wildfire threat rating 28.2 45.6 17.0 9.2
167 WILDFIRE THREAT RATING SYSTEM
derived from provincial forest cover inventory mapping and terrestrial resource inventory mapping (TRIM). The rest of the data were derived from a variety of sources (Table 1).
Development of Components
Fire Risk
This component was a measure of the probability of wildfire occurrence. It was based on historical fire frequency and cause in the study area from 1950 to 1999. The fire history record was translated into spatial points within the GIS framework. The fire risk component was divided into two layers:
fires caused by lightning and those caused by human activity. Each layer was divided into 4-km2 grid cells. Cell weightings were assigned according to the number of historic fires that occurred within each grid cell. Grid cell size was determined based on the low-tomoderate concentration of fires in the area and on data limitations (the fire location data were only accurate to the nearest kilometer and represent fire origin, not fire perimeter).
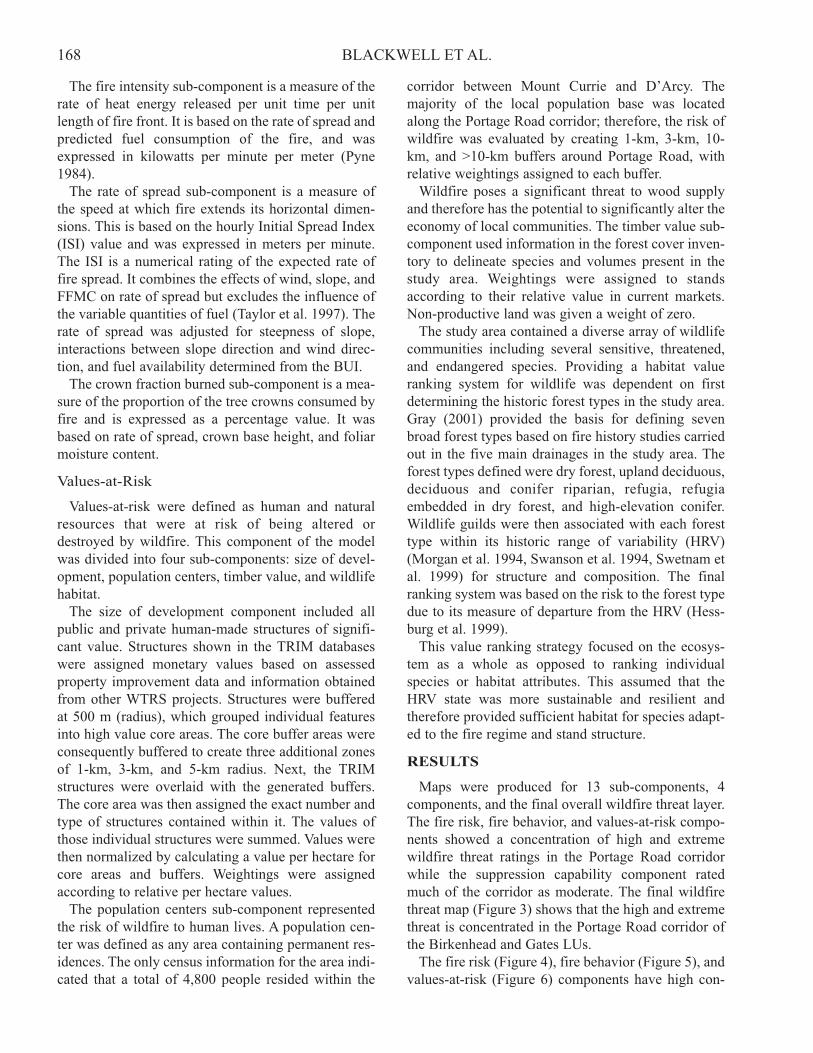
Suppression Capability
The ability to suppress wildfire is dependent on speed of detection, terrain, accessibility, and availability of resources. In British Columbia fires are detected primarily by aircraft or by the public. The unpredictability of flight frequency and public response made it impossible to quantify speed of detection. Four components were used to determine overall suppression capability: proximity to water sources, helicopter attack time, steepness of terrain, and road access. Availability of water sources for fire suppression
was evaluated by creating a 100-m buffer around all rivers, creeks, and lakes classified as determinant (perennial) in the TRIM database. Areas outside the buffer were given twice the threat weighting to those inside the buffer. Initial attack time by helicopter has been demon
strated to have the greatest effect on fire suppression and was therefore given the greatest weighting among the suppression capability components. Threat weightings increased with greater distance from the heliattack base located in Pemberton. Steepness of terrain influences the ability of a ground crew to build fire-guards. This component was therefore given the next highest weighting after helicopter attack time. Average slope class was determined from the TRIM database and weightings were assigned according to slope. The road access theme is used to evaluate the accessibility
of suppression resources reaching areas within a given landscape unit. Road accessibility was rated by creating 100-m, 500-m, 1000-m, and 2000-m buffers around all roads in the study area and assigning weights relative to distance from roads.
Fire Behavior
This component estimated how wildfire would behave under 90th percentile weather conditions (historic fire weather representing 90% of the most extreme conditions recorded). Information was compiled relating to stand-level fuel types, slope, aspect, and fire weather for the study area. The resulting data were subsequently processed through the FBP97 (Fire Behaviour Predictor 97) program. Fire Behaviour Predictor 97 is a Windows™-based version of the Canadian Fire Behaviour Prediction System (Forestry Canada 1992) developed by Remsoft Inc. The fire behavior outputs of FBP97 included fire intensity, rate of spread, and crown fraction burned, which formed the sub-components of the fire behavior component. The Canadian Fire Behaviour Prediction System
uses 16 national benchmark fuel types to predict fire behavior (Taylor et. al. 1997). Fuel types in the study area were derived by running forest cover inventory through an algorithm developed in 1999 by the Protection Branch of the British Columbia Ministry of Forests. Slope and aspect were obtained from the TRIM database where required. Fuel types were derived through a combined GIS overlay of forest cover and TRIM capturing all attributes required to describe individual fuel types. Weather information was derived from historic
records collected from two established weather stations associated with the study area. Both stations were located in the IDFww biogeoclimatic subzone. As a result, the data set obtained could not describe weather conditions for the other biogeoclimatic units that occurred within the study area. Climatic summaries for biogeoclimatic units (Reynolds 1983) were used to determine average values of key parameters for the units in the study area. The relative relationships of these values between the IDFww and remaining units were used to adjust the 90th percentile fire weather values determined from the available climate records. This provided estimates of 90th percentile data for all biogeoclimatic units. The 90th percentile fire weather data were used in FBP97 to calculate Fine Fuel Moisture Code (FFMC) and Build-Up Index (BUI). Fire behavior was subsequently modeled in FBP97 using upslope winds calculated from the relevant aspect.
168 BLACKWELL ET AL.
The fire intensity sub-component is a measure of the rate of heat energy released per unit time per unit length of fire front. It is based on the rate of spread and predicted fuel consumption of the fire, and was expressed in kilowatts per minute per meter (Pyne 1984). The rate of spread sub-component is a measure of
the speed at which fire extends its horizontal dimensions. This is based on the hourly Initial Spread Index (ISI) value and was expressed in meters per minute. The ISI is a numerical rating of the expected rate of fire spread. It combines the effects of wind, slope, and FFMC on rate of spread but excludes the influence of the variable quantities of fuel (Taylor et al. 1997). The rate of spread was adjusted for steepness of slope, interactions between slope direction and wind direction, and fuel availability determined from the BUI. The crown fraction burned sub-component is a mea
sure of the proportion of the tree crowns consumed by fire and is expressed as a percentage value. It was based on rate of spread, crown base height, and foliar moisture content.
Values-at-Risk
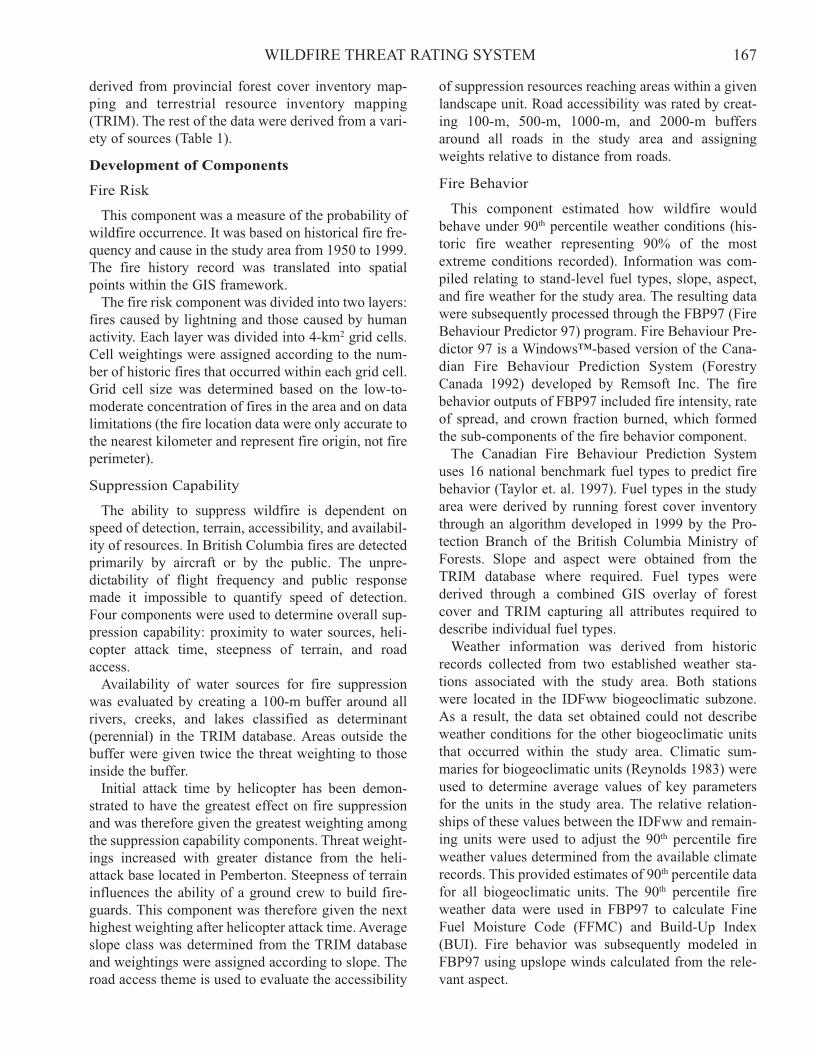
Values-at-risk were defined as human and natural resources that were at risk of being altered or destroyed by wildfire. This component of the model was divided into four sub-components: size of development, population centers, timber value, and wildlife habitat. The size of development component included all
public and private human-made structures of significant value. Structures shown in the TRIM databases were assigned monetary values based on assessed property improvement data and information obtained from other WTRS projects. Structures were buffered at 500 m (radius), which grouped individual features into high value core areas. The core buffer areas were consequently buffered to create three additional zones of 1-km, 3-km, and 5-km radius. Next, the TRIM structures were overlaid with the generated buffers. The core area was then assigned the exact number and type of structures contained within it. The values of those individual structures were summed. Values were then normalized by calculating a value per hectare for core areas and buffers. Weightings were assigned according to relative per hectare values. The population centers sub-component represented
the risk of wildfire to human lives. A population center was defined as any area containing permanent residences. The only census information for the area indicated that a total of 4,800 people resided within the
corridor between Mount Currie and D’Arcy. The majority of the local population base was located along the Portage Road corridor; therefore, the risk of wildfire was evaluated by creating 1-km, 3-km, 10km, and >10-km buffers around Portage Road, with relative weightings assigned to each buffer. Wildfire poses a significant threat to wood supply
and therefore has the potential to significantly alter the economy of local communities. The timber value subcomponent used information in the forest cover inventory to delineate species and volumes present in the study area. Weightings were assigned to stands according to their relative value in current markets. Non-productive land was given a weight of zero. The study area contained a diverse array of wildlife
communities including several sensitive, threatened, and endangered species. Providing a habitat value ranking system for wildlife was dependent on first determining the historic forest types in the study area. Gray (2001) provided the basis for defining seven broad forest types based on fire history studies carried out in the five main drainages in the study area. The forest types defined were dry forest, upland deciduous, deciduous and conifer riparian, refugia, refugia embedded in dry forest, and high-elevation conifer. Wildlife guilds were then associated with each forest type within its historic range of variability (HRV) (Morgan et al. 1994, Swanson et al. 1994, Swetnam et al. 1999) for structure and composition. The final ranking system was based on the risk to the forest type due to its measure of departure from the HRV (Hessburg et al. 1999). This value ranking strategy focused on the ecosys
tem as a whole as opposed to ranking individual species or habitat attributes. This assumed that the HRV state was more sustainable and resilient and therefore provided sufficient habitat for species adapted to the fire regime and stand structure.
RESULTS
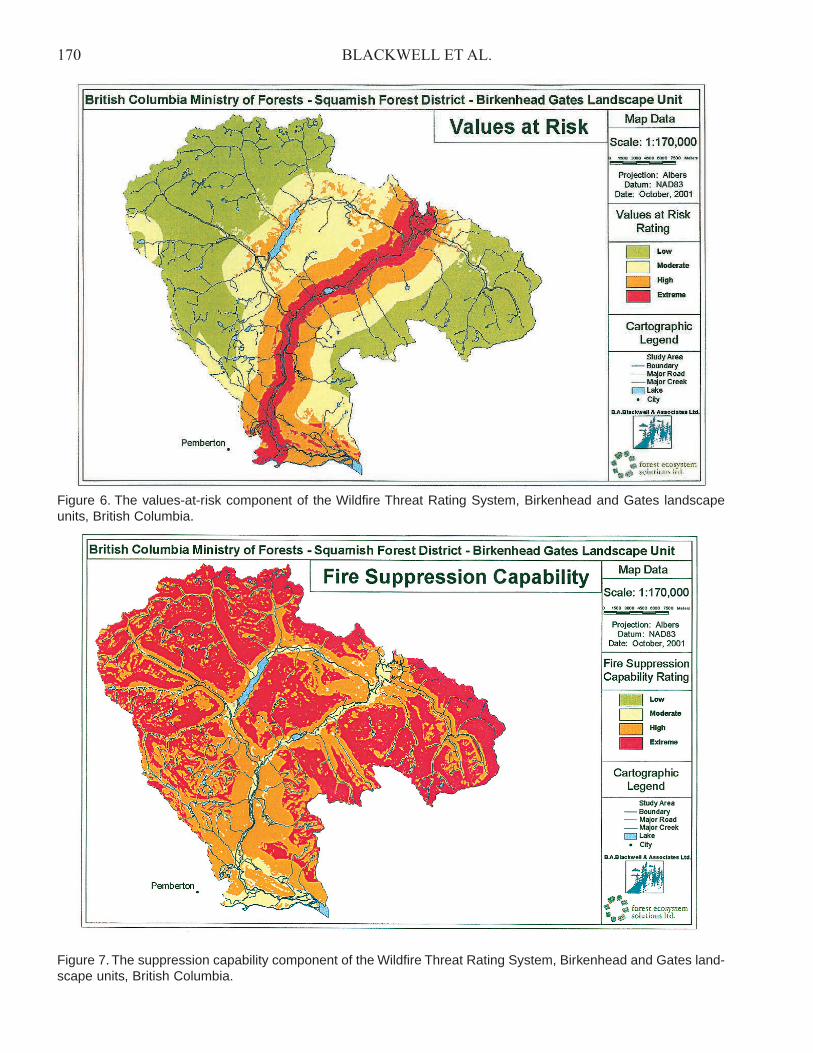
Maps were produced for 13 sub-components, 4 components, and the final overall wildfire threat layer. The fire risk, fire behavior, and values-at-risk components showed a concentration of high and extreme wildfire threat ratings in the Portage Road corridor while the suppression capability component rated much of the corridor as moderate. The final wildfire threat map (Figure 3) shows that the high and extreme threat is concentrated in the Portage Road corridor of the Birkenhead and Gates LUs. The fire risk (Figure 4), fire behavior (Figure 5), and
values-at-risk (Figure 6) components have high con

169 WILDFIRE THREAT RATING SYSTEM
Figure 4. The fire risk component of the Wildfire Threat Rating System, Birkenhead and Gates landscape units, British Columbia.
Figure 5. The fire behavior component of the Wildfire Threat Rating System, Birkenhead and Gates landscape units, British Columbia.
170 BLACKWELL ET AL.
Figure 6. The values-at-risk component of the Wildfire Threat Rating System, Birkenhead and Gates landscape units, British Columbia.
Figure 7. The suppression capability component of the Wildfire Threat Rating System, Birkenhead and Gates landscape units, British Columbia.
171 WILDFIRE THREAT RATING SYSTEM
centrations of area rated as low threat. Suppression capability (Figure 7) has a high concentration of area rated as extreme threat. The final threat layer is dominated by area rated as moderate (45.6%) (Table 2).
DISCUSSION
Fire risk, fire behavior, and values-at-risk (Figures 4–6) components show the largest proportion of area as a low threat rating. Conversely, the suppression capability component (Figure 7) shows the highest proportion of area as an extreme threat rating. This was primarily a function of the steepness of terrain within the study area. Large portions of the area contain slopes in excess of 45%, which limit fire crew access and tend to dominate the suppression capability component. The distribution of low, moderate, high, and extreme threat areas across the different components, which are equally weighted, has resulted in an overall wildfire threat layer (Figure 8). The largest proportion of area is rated as moderate (46%), followed by low (28%), high (17%), and extreme (9%). In order to understand the wildfire threat map it is necessary to examine the four components of threat and the sub-components that contribute to each of them.
The areas rated high and extreme result from the concentration of human activity in the valley bottoms of the study area, relatively higher timber and wildlife values, and the concentration of historic fires within these areas. The sub-components of fire risk are natural ignition and human ignition. Human ignition is a high-to-moderate risk primarily in the populated areas of the landscape unit. The population of the Birkenhead and Gates LUs is concentrated in the Portage Road corridor, a relatively small percentage of the overall area. Risk of natural ignition, based on historic fire records, is low across most of the study area. It should be noted that the fire history record for the two landscape units is short and may not be representative of true fire history for the area. Water source, heli-attack time, terrain steepness, and
road access determine the suppression capability component. The best (because of their low threat rating) suppression capability areas (rated low and moderate) are located in the Portage Road corridor. This area is close to water sources, is easily accessible by road, and terrain is dominated by a predominantly gentle valley bottom. The nearest heli-attack base is located at Pemberton so the corridor is within the area of
Figure 8. Overall wildfire threat layer of the Wildfire Threat Rating System, Birkenhead and Gates landscape units, British Columbia.
172 BLACKWELL ET AL.
fastest heli-attack response time. Much of the area outside of the valley bottoms is rated as high or extreme suppression capability. As noted above, these areas correspond largely with steep mountainous portions of the landscape units and decreased proximity to water sources. Accessibility by road is also diminished in these steeper portions of the study area. Additionally suppression capability is decreased as distance increases between Pemberton and the location of the fire, resulting in an increased heli-attack response time. Fire behavior is determined by fire intensity, rate of
spread, and crown fraction burned. The majority of high and extreme fire behavior ratings are located in the Portage Road corridor. These areas correspond to lower-elevation south-facing slopes of the dry IDFww biogeoclimatic subzone. The IDFww is drier than the other biogeoclimatic units occurring in the Birkenhead and Gates LUs. The majority of the remaining area is rated as low and moderate risk for fire behavior. The Alpine Tundra is non-forested and thus lacks a significant fuel source, while much of the Engelmann spruce–subalpine fir forests are influenced by cooler, moister climates during the fire season and are therefore less susceptible to large-scale stand-replacing fires. There were some difficulties with the method of
predicting fire behavior in the Birkenhead and Gates LUs. The fuel types used to build the fire behavior component are derived from 16 national benchmark fuel types, developed for predominantly boreal fuel types. The algorithm developed by the Protection Branch of the British Columbia Ministry of Forests attempts to equate these fuel types to stand types found in British Columbia. These 16 fuel types do not sufficiently describe all of the stand types found in our study area. Ideally the model would utilize fuel typing that more adequately described fuel conditions present in the coast–interior transition zone of British Columbia. Typically fuel types present in the study area contain high loads of both surface and crown fuels that are more contiguous when compared to boreal fuel types. Values-at-risk are the final component and are deter
mined by four sub-components: size of development, population centers, timber value, and wildlife habitat. The area of extreme risk is concentrated in the Portage Road corridor. This is the area with the largest size of development and is also the location of concentrated population centers. Much of this area is considered a bedroom community to the international ski resort of Whistler and therefore is expected to grow. The area
presents a significant interface hazard that is of concern to the British Columbia Ministry of Forests. The Ministry of Forests, Small Business Forest Enterprise Program is actively seeking to develop fuel treatment strategies to reduce the interface fire hazard through both its commercial harvesting program and non-commercial treatments where feasible. Timber value is also greatest in close proximity to the corridor as these areas of low-elevation forests are the most accessible, economically valuable, and are growing on the most productive sites within the study area. Much of the available high-value wildlife habitat falls within the areas of greatest wildfire threat. Understanding the location and distribution of both habitat and fire threat allows prioritization of fuel reduction treatments that will protect valuable wildlife habitat from fire. The patterns of wildfire threat shown in the final
wildfire threat layer reflect the four components. Extreme threat is concentrated in the Portage Road corridor. This is where wildfire poses the greatest threat to values-at-risk (developments, population, timber, and wildlife) and is most susceptible to extreme fire behavior and at greatest risk of fire from human ignition. The suppression capability rating of low and moderate in the corridor somewhat moderates the high and extreme ratings of the corridor associated with values-at-risk, fire risk, and fire behavior. There are a number of limitations that are inherent in
the WTRS model as it was applied in this project. As discussed previously, FBP fuel types developed in boreal forests poorly describe many of fuel conditions present within the study area. Errors in fuel type classification have been recognised by the project study team and will be a focus of future work in co-operation with both the Ministry of Forests and the Canadian Forest Service. The fire weather data were limited, represented by 2
stations occurring in one biogeoclimatic subzone. Although an attempt was made to adjust the data for other biogeoclimatic units in the area, it remains a source of inaccuracy in determining fire behavior attributes. The WTRS modeled worst-case fire weather conditions represented by 90th percentile values. It would be useful to examine wildfire threat in relation to a range of fire weather conditions experienced in extreme, average, and low fire weather years. The timber value sub-component reflected only
species composition and stand volume as it relates to relative value in current markets. Incorporating timber supply into the analysis of stand value could refine this. Stands would be weighted according to their relative importance to projected timber supply gaps, in
173 WILDFIRE THREAT RATING SYSTEM
addition to their market value. Silvicultural investments could also be incorporated in to timber values so that younger low-volume stands would be assigned higher weightings where significant silvicultural investments have been made. Finally, the planning applications of the model
would be enhanced significantly if it had the capabilities for dynamic adjustments in weightings of all subcomponents and components. This would allow spatial sensitivity analysis of wildfire threat as weightings were adjusted to reflect different management objectives and wildfire threat factors.
MANAGEMENT IMPLICATIONS
The Wildfire Threat Rating System builds a spatial distribution of wildfire threat in a GIS environment. Since information covering a large geographical area can be spatially arranged in a user-friendly format, the system is particularly valuable to managers when developing fuel management plans, suppression strategies (including resource budgeting), and making decisions related to suppression resource allocation. The final wildfire threat theme identifies areas with a high or extreme threat that can be quickly and efficiently prioritized for fuel reduction treatments. The four components provide a second level of wildfire threat detail, which enables managers to establish the most appropriate treatment direction to protect identified resources such as wildlife and commercial forests. The sub-components represent the most detailed form of the WTRS. These supporting levels of detail allow managers to focus on specific aspects of wildfire threat in order to meet management objectives. In British Columbia the WTRS model has been applied in park planning to identify areas that should be managed with prescribed natural fire, could benefit from prescribed fire or which require some form of fuel manipulation and/or removal. In the Birkenhead and Gates LUs the output from
the wildfire threat model will be incorporated into a new forest development plan aimed at supporting local resource management goals. The system will be used as a decision-support tool to prioritize candidate areas for inclusion in a fuel management treatment program. The model output will provide important information for consideration in harvest planning decisions and development of harvest objectives for silviculture prescriptions. It provides a basis for determining the location of fire sustainable reserves to meet riparian and wildlife–biodiversity objectives. Significant reserve areas have been designated in British Columbia that often do not consider the threat of fire and may in fact
not be sustainable under extreme wildfire conditions. In Washington State the sustainability of specific land allocations to wildfire have been put into question (Camp 1999). In the Birkenhead and Gates LUs the WTRS will act as a framework for evaluating protection of values-at-risk on both public and private lands.
ACKNOWLEDGMENTS
Franz Feigl and Sandrine Goble (Forest Ecosystem Solutions Ltd.), Glen Bailey (Chartwell Consultants Ltd.), Julian Grzybowski (Squamish Forest District), and Ben Andrew (B.A. Blackwell & Associates Ltd.) have all contributed greatly to the success and completion of this project. We acknowledge the support of these individuals.
LITERATURE CITED
Arno, S.F. 1996. The concept: restoring ecological structure and process in ponderosa pine forests. Pages 37–38 in C.C. Hardy and S.F. Arno (eds.). The use of fire in forest restoration. General Technical Report INT-GTR-341, U.S. Department of Agriculture, Forest Service, Intermountain Research Station, Ogden, UT.
Blackwell, B.A., M. Coulthard, and D. Catamaran. 2000. Wildfire Threat Rating System for Mount Robson Provincial Park. Prepared for British Columbia Ministry of Environment, Lands and Parks, Prince George.
Camp, A. 1999. Age structure and species composition changes resulting from altered disturbance regimes on the eastern slopes of the Cascades Range, Washington. Journal of Sustainable Forestry 9(3/4):39–67.
Canadian Forest Service. 2001. Forest fire: context for the Canadian Forest Service’s Science Program. Science Branch, Canadian Forest Service, Natural Resources Canada, Ottawa, ON.
Covington, W.W., and M.M. Moore. 1994. Southwestern ponderosa forest structure. Journal of Forestry 92:39–47
Elfring, C.E. 1989. Yellowstone: fire storm over fire management. BioScience 39:667–672.
Environmental Systems Research Institute [ESRI]. 2000. ArcMap 8.0 and ArcInfo 8.02 software. ESRI, Redlands, CA.
Forestry Canada. 1992. Development and structure of the Canadian Forest Fire Behaviour Prediction System. Information Report ST-X-3, Forestry Canada Fire Danger Group, Ottawa, ON.
Gray, R.W. 2001. Historic vs. contemporary Interior Douglas-fir structure and processes: managing risks in overly-allocated ecosystems. Pages 40–46 in Proceedings of the fire maintained ecosystems workshop. British Columbia Ministry of Forests, Squamish Forest District, and Forestry Continuing Studies Network, Vancouver.
Hawkes, B.C., J. Beck, and W. Sahle. 1997. A wildfire threat rating system for the McGregor Model Forest. Final report submitted to the McGregor Model Forest
174 BLACKWELL ET AL.
Association, Canadian Forest Services, Project 3015, Victoria, BC.
Hessburg, P.F., B.G. Smith, and R.B. Salter. 1999. Using estimates of natural variation to detect ecologically important change in forest spatial patterns: a case study, Cascade Range, eastern Washington. Research Paper PNW-RP-514, U.S. Department of Agriculture, Forest Service, Pacific Northwest Research Station, Portland, OR.
Klinka, K., and R.N. Green. 1994. A field guide to site identification and interpretation for the Vancouver Forest Region. British Columbia Ministry of Forests, Victoria.
Ministry of Forests and Ministry of Environment, Lands and Parks. 1999. Landscape unit planning guide. Province of British Columbia, Victoria.
Morgan, P., G.H. Aplet, J.B. Haufler, H.C. Humphries, M.M. Moore, and W.D. Wilson. 1994. Historical range of variability: a useful tool for evaluating ecosystem change. Journal of Sustainable Forestry 2:87–111.
Mutch, R.W. 1994. Fighting fire with prescribed fire: a return to ecosystem health. Journal of Forestry 92:31–33
Parsons, D.J., and S.J. Botti. 1996. Restoration of fire in national parks. Pages 29–32 in C.C. Hardy and S.F. Arno (eds.). The use of fire in forest restoration. General Technical Report INT-GTR-341, U.S. Department of Agriculture, Forest Service, Intermountain Research Station, Ogden, UT.
Pyne, S.J. 1984. Introduction to wildland fire: fire management in the United States. John Wiley & Sons, New York.
Rapport, D.J., and S.B. Yazvenko. 1996. Ecosystem distress syndrome in ponderosa pine forest. Pages 3–9 in W.W. Covington and P.K. Wagner (technical coordinators). Conference on adaptive ecosystem restoration and management: restoration of cordilleran conifer landscapes of North America. General Technical Report RM-GTR-278, U.S. Department of Agriculture, Forest Service, Rocky Mountain Research Station, Fort Collins, CO.
Reynolds, G.D. 1983. Climatic summaries for the biogeoclimatic zones of British Columbia. Contract report, British Columbia Ministry of Forests, Victoria.
Romme, W.H., and D.G. Despain. 1989. Historical perspective on the Yellowstone fires of 1988. BioScience 39:695–699.
Salazar, L.A., and C.V. Nilsson. 1989. Integrating geographic information systems into fire management. Proceedings of the Conference on Fire and Forest Meteorology 10:311–316.
Swanson, F.J., J.A. Jones, D.O. Wallin, and J.H. Cissel. 1994. Natural variability—implications for ecosystem management. Pages 80–94 in M.E. Jensen and P.S. Bourgeron (eds.). Volume II: Ecosystem management: principles and applications. General Technical Report PNW-GTR-318, U.S. Department of Agriculture, Forest Service, Pacific Northwest Research Station, Portland, OR.
Swetnam, T.W., C.D. Allen, and J.L. Betancourt. 1999. Applied historical ecology: using the past to manage for the future. Ecological Applications 9:1189–1206.
Taylor, S.W., R.G. Pike, and M.E. Alexander. 1997. Field guide to the Canadian Forest Fire Behavior Prediction (FPB) System. Special Report 11, Fire Management Network, Canadian Forest Service, Northern Forestry Centre, Edmonton, AB.
Tiedemann, R.A., J.O. Klemmedson, and E.L. Bull. 2000. Solution of forest health problems with prescribed fire: Are forest productivity and wildlife at risk? Forest Ecology and Management 127:1–8.
Vodopier, J., and D. Haswell. 1995. The application of wildfire threat analysis in forests of southwestern Australia. In BUSHFIRE ’95, Australian Bushfire Conference, 27–30 September 1995, Hobart, Tasmania.
Weir, J.M., K.J. Chapman, and E.A. Johnson. 1995. Wildland fire management and the fire regime in the southern Canadian Rockies. Pages 270–280 in J.K. Brown, R.W. Mutch, C.W. Spoon, and R.H. Wakimoto (technical coordinators). Proceedings: symposium on fire in wilderness and park management. General Technical Report INTGTR-320, U.S. Department of Agriculture, Forest Service, Intermountain Research Station, Missoula, MT.


